
Submitted:
02 May 2024
Posted:
03 May 2024
You are already at the latest version
Abstract
This study aimed to investigates obesity-related glomerulopathy (ORG) at cellular, structural, and transcriptomic levels. Thirty Wistar rats were randomized into two groups: control (n=15) and study groups (n=15) that were fed a standard (SD) and high-fat diet (HFD), respectively. After 10 weeks, the weight, kidney function, histological features, and transcriptomic changes were assessed. HFD group exhibited increased weight gain (55.8% vs 29.2%; P< 0.001) and albuminuria (10384.04 ng/ml vs 5845.45 ng/ml; P<0.001) compared to controls. The HFD group exhibited early stages of ORG lesions, with a predominance of mesangial matrix increase and podocyte hypertrophy (PH). These lesions correlated with differentially expressed (DE) genes and miRNAs. Functional analysis showed that four DE miRNAs in the kidneys of the HFD group negatively regulated the PTEN gene, which promotes podocyte endocytosis of lipids in ORG. Among these four miRNAs, miR-205 was upregulated in the urine of the HFD group. HFD-fed Wistar rats developed early stages of ORG, with a specific targetome of miRNAs and gene expression. The upregulation of miR-205 in the kidney and its isolation in urine are associated with lipid endocytosis in podocytes, which could become a plausible biomarker of the early stages of ORG and lead to future therapeutic research.
Keywords:
microRNA
; biomarker
; targetome
; obesity-related glomerulopathy
; mesangial matrix increase
; podocyte hypertrophy
; Wistar rats
1. Introduction
Obesity is a modifiable risk factor for the development and progression of chronic kidney disease (CKD) [1,2]. The risk of new-onset albuminuria, one of the two criteria documented for CKD diagnosis, increases by 51% in individuals with obesity [1]. In 2017, 697.5 million cases of all-stage CKD were recorded [3], an increase that was partially explained by the growing prevalence of obesity worldwide. Regrettably, 2.6 million deaths in 2017 were attributable to impaired kidney function, indicating that all-age CKD mortality increased by 41.5% between 1990 and 2017 [3]. The spread of obesity and its associated comorbidities has led to global health crises.
The pathogenesis of obesity-related glomerulopathy (ORG) is unclear, as not all individuals with obesity develop CKD. Clinical manifestations of ORG include glomerular hyperfiltration, proteinuria, and renal impairment, making it a secondary form of focal segmental glomerulosclerosis (FSGS) [4]. Interestingly, before secondary FSGS is established, drastic weight loss through bariatric surgery reverses the initial clinical alterations in ORG [5]. Therefore, an early diagnosis should be mandatory to prevent the development and progression of CKD.
In a previous study, we first described the presence of early-stage ORG in patients with severe obesity without overt clinical renal manifestations [6]. Moreover, renal biopsy in the early stages of ORG is not acceptable in clinical practice or investigations for ethical reasons. Undoubtedly, the discovery of non-invasive ORG biomarkers would facilitate early diagnosis without exposing patients to unnecessary risks.
To deepen our knowledge of the preliminary phase of ORG, further preclinical research into the cellular and molecular changes is of special interest. At the molecular level, these processes are regulated by the integrated action of various damaging and protective/regenerative biological pathways. Small RNAs, including microRNAs (miRNAs), inhibit or increase the expression of target genes via RNA activation [7]. Thus, they may directly regulate >30% of the genes in a cell, including those involved in cell differentiation, growth/proliferation, migration, apoptosis/death, metabolism, and defense.
Overall, understanding the initial changes in obesity-related renal disease at the cellular, structural, and transcriptomic levels will help recognize the pathogenic phenomena that occur in this disease. To enhance our knowledge of ORG and identify potential biomarkers, this study aimed to establish the first interactome of miRNAs, their targetome, and the presence of kidney lesions in obesity.
2. Results
2.1. Weight Gain in Rats with Diet-Induced Obesity
The SD-fed rats reached a median weight of 461.33 ± 37.36 g (29.20% gain) after 10 weeks, whereas the HFD-fed rats gained 55.83% (544.06 ± 43.66 g), P<0. 001 (Figure 1). Although all 30 rats developed obesity, significant differences in absolute weight were observed between the two groups (P<0.001, Student’s t-test). The HFD-fed rats developed obesity between weeks 2 and 6, whereas half of the SD-fed rats developed obesity by week 10. The rate of weight gain in the HFD group was 2.3 times higher than that in the SD group.
2.2. Renal Function
Albuminuria levels were measured in 24 h-urine samples collected and correlated with body weight increase (r=0.702; P<0.001). The HFD-fed rats exhibited higher albuminuria levels than the SD-fed rats (10384.04 ± 1167.96 ng/ml vs. 5845.45 ± 2616.79 ng/ml; P<0.001, respectively). Renal function assessed by iohexol plasma clearance technique was not significantly different between the two groups (67.8 ± 11.6 ml/min in the SD-fed rats vs. 71.67 ± 10.8 ml/min in the HFD-fed rats).
2.3. Study of Renal Morphological Changes
The rat kidneys of both the SD and HFD groups were surrounded by adipose tissue, with the kidneys of the HFD-fed rats appearing larger than those of the SD-fed rats. All the HFD-fed rats exhibited early ORG lesions observed in humans (mesangial matrix increase [MMI], podocyte hypertrophy (PH), mesangial cell proliferation [MCP], and glomerulomegaly), whereas the SD-fed rats only exhibited MMI and PH (Figure 2a–f). Morphometric analysis revealed a higher MMI in the HFD group than in the SD group (a mean of 93% of the glomeruli analyzed vs. 53%; P<0.001). Glomerular area was significantly larger in the HFD group than in the SD group (10640.92 ± 1220.62 μm2 vs. 8562.28 ± 838.10 μm2, P=0.003). Enlarged and vacuolated proximal tubular cells with signs of protein reabsorption were also observed (Figure 2g). No focal or segmental glomerulosclerosis, interstitial fibrosis, or tubular atrophy was observed. TEM revealed swollen podocytes with an increased number of cytoplasmic organelles, especially mitochondria and lipid vacuoles (Figure 2h–j). The HFD group had a lower podocyte density (18.09%) than the SD group (23.65%) (Figure 3).
2.4. Diet-Induced Transcriptomic Changes and Validation of DE RNAs in Rat Kidneys
To profile diet-related gene changes in the kidneys, RNA-Seq experiments were performed to compare gene expression levels in the SD (n=9) and HFD (n=8) groups, detecting 14,700 sequences. Hierarchical clustering and principal component analysis revealed similarities between the samples from the SD and HFD groups, although they were not entirely distinct (Figure 4a). Genes were considered DE if the adjusted P-value was <0.05 and the absolute log2FoldChange was >1, yielding four clearly DE genes (Epha3 and Atp12a were upregulated; Robo3 and Sult4a1 were downregulated in the HFD group). Additionally, 11 genes showed a tendency toward DE, including Htr5b, Ccl20, and Pros1 (Figure 4b). A biological significance analysis identified overrepresented pathways, including those related to renal injury prevention (Epha3 and Pros1), inflammation (CCL20), and nervous system function (Sult4a1, Robo3, and Htr5b). qPCR confirmed that ATP12a, along with Epha3 (P=0.00278) and Pros1 (P=0.00831), was five times upregulated in the HFD group (P=0.00130). Conversely, Sult4a1 and Htr5b were downregulated in the HFD group (P=0.00230 and P=0.01924, respectively), whereas Robo3 showed no significant difference (P=0.43209) owing to high variability (Figure 4c).
2.5. Lesion-Related Transcriptomic Changes and DE RNAs in Rat Kidneys
MMI and PH were the most common histological lesions observed in the rat model. To understand the role of gene expression in lesion types, we analyzed transcriptomic data based on the presence of MMI and PH, regardless of diet. Only glutathione S-transferase alpha 3 (Gsta3) is downregulated in rats with PH, increasing their vulnerability to oxidative stress and contributing to renal interstitial fibrosis [8]. Gsta3 regulates the epithelial–mesenchymal transition and is crucial for renal fibrosis. Conversely, X Kell blood group precursor-related family member 4 was upregulated in the same group and implicated in apoptotic process engulfment [9]. Conserved oligomeric Golgi complex subunit 4 (Cog4) and phytoplankton are upregulated in rats with MMI. Cog4 [10] is expressed in tubules and is linked to kidney clear cell carcinoma, whereas PHYHIPL [11] is enriched after ischemic brain injury (Figure 4d,e).
2.6. Small RNA Profile Changes According to Diet and Weight
Unsupervised hierarchical clustering and principal component analysis identified potential groups based on molecular expression profiles, showing a slight but not substantial distinction between the HFD and SD control rats. A total of 812 sequences were detected, including Mt tRNA (n=22), rRNA (n=36), scaRNA (n=14), snoRNA (n=312), snRNA(n=90), and miRNA (n=338), with 15 meeting the condition of an adjusted P-value of <0.05 and log2FoldChange of >1, mostly downregulated in HFD-fed animals (Figure 5a). Thirteen miRNAs were identified using miRTarBase and TargetScan, with nine DE genes (miR-205, miR-140-5p, miR-185-5p, miR-128-3p, miR-28-5p, miR-340-3p, miR-6329, miR-674-3p, and miR-148b-5p) (Figure 5b,c). GO analysis revealed targets associated with inflammatory responses; tissue injury and repair; and nervous tissue, fat, and mitochondrial functions. These miRNAs were quantified via qPCR in 30 rats, confirming miR-205 upregulation as well as miR-6329 and miR-340-3p downregulation in HFD-fed rats (Student’s t-test, P=0.0170, P=0.0490, and P=0.0453, respectively). Other miRNAs showed a tendency owing to inter-sample variability (Figure 5d).
2.7. Functional Analysis of Pathways and Leading-Edge Genes Targeted by DE miRNAs
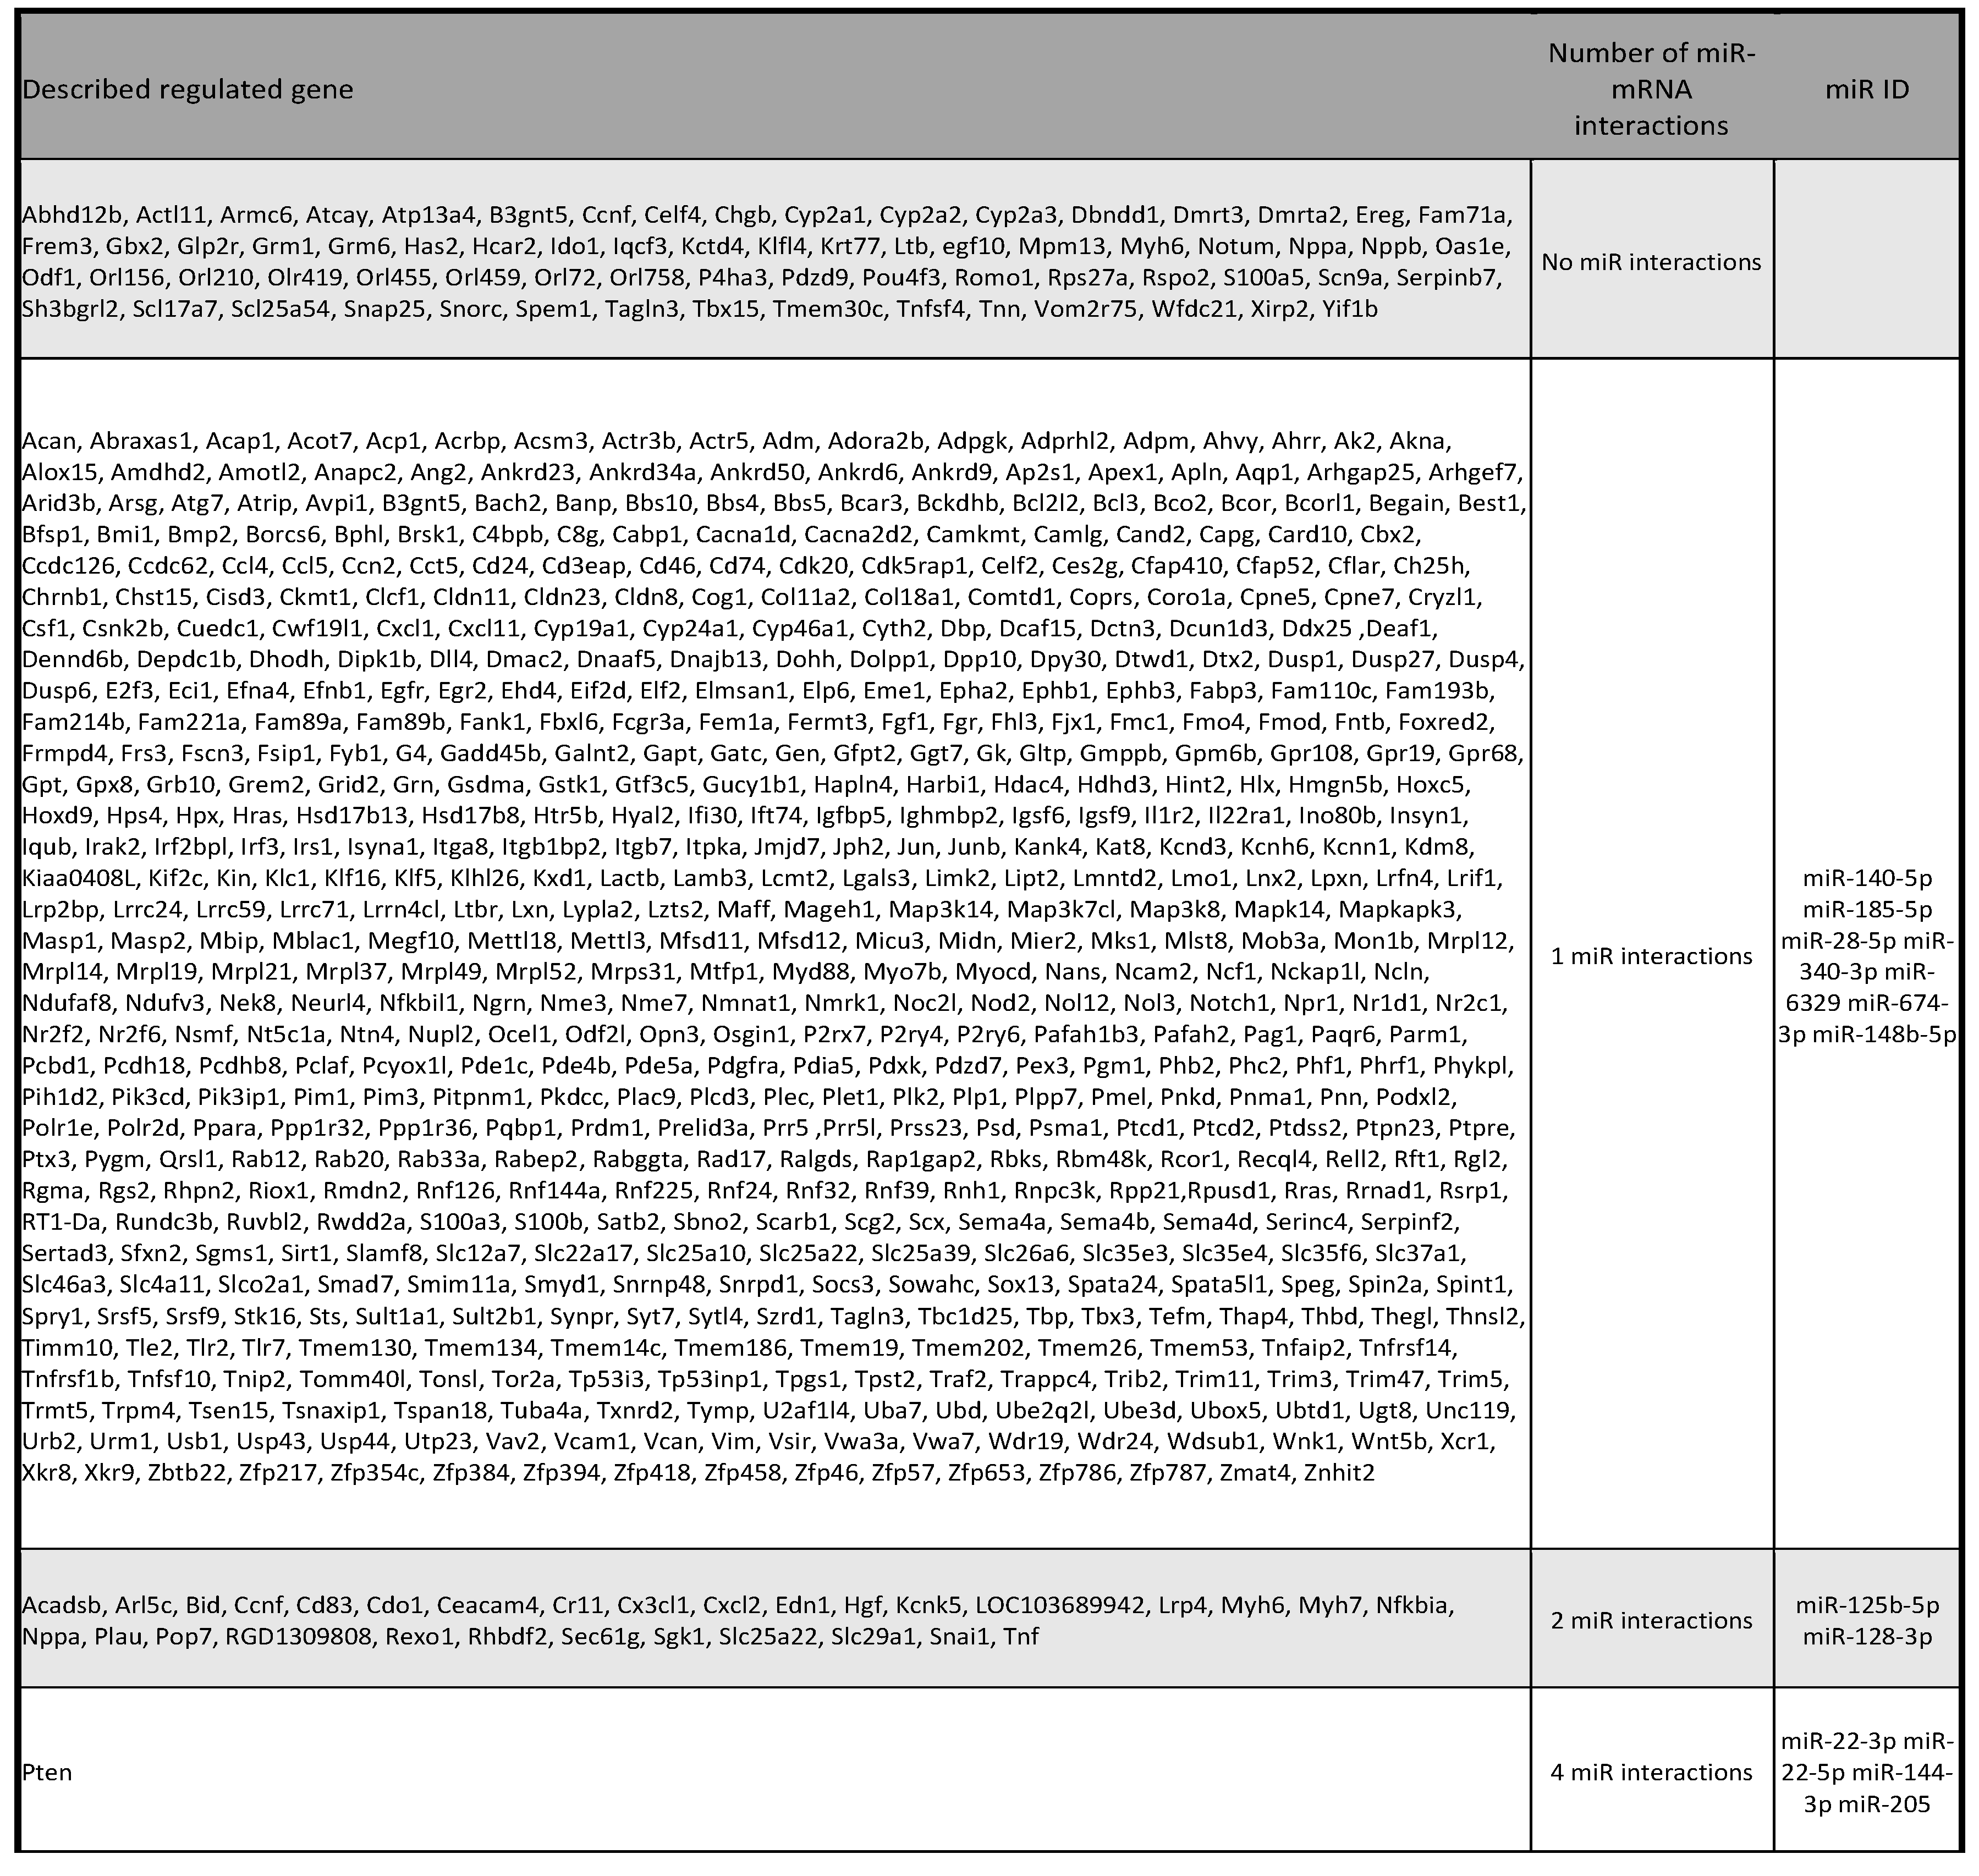
To identify DE miRNAs’ targetome, we intersected, predicted, and validated miRNA targets with mRNAs showing negative correlations (Spearman’s correlation coefficients < −0.5) with the miRNAs. We identified 712 putative gene targets for the 11 DE miRNAs: 601 genes related to one miRNA, 30 genes related to two miRNAs, and 1 gene (PTEN) related to 4 DE miRNAs (miR-22-3p, miR-22-5p, miR-144-3p, and miR-205) (Figure 5e). Additionally, 79 genes were not expressed in the rat kidneys. Given the complex relationships between miRNAs and their targets, we focused on the combined upregulation of miR-22-3p, miR-22-5p, miR-144-3p, and miR-205, which negatively regulate PTEN gene function (Table 1). To confirm the transcriptomic data, immunofluorescence staining was performed on the kidneys of the SD- and HFD-fed rats. These data revealed that the SD-fed rats had a higher PTEN–nephrin ratio than the HFD-fed rats, confirming the downregulation of PTEN in the HFD-fed rats (Figure 6).

Table 1.
List of genes having one interaction with miRNAs found to be DE in rat kidneys.
2.8. Lesion-Related Transcriptomic Changes in Rat Kidneys (Small RNA)
To understand the relationship between mRNA expression in rat kidneys, detected miRNAs (n=11), and histological lesions, we conducted in silico miRNA functional analyses using DIANA-miRPath v3.0. Lesion-related results had a P-value of <0.05 and log2FoldChange of >1.
Regarding MMI, 75 genes, including Nr2f6, Dtx2, Ptpn23, Paqr6, Fam193b, Potpnm1, Mier2, Phf1, Slc22a17, Nfkbil1, Ankrd9, and Rexo1, met both criteria. Similarly, 54 genes, including Adm, Ugt8, Cd24, Tsnaxip1, Thegl, Pdxk, Hsp4, Socs3, Ptpn23, Junb, Mfsd12, and Slc22a17, met the criteria for PH (Figure 7).
To address chance correlations, gene expression across all rats was analyzed (n=16). In total, 100,000 random datasets were generated and compared. The average expression of each gene, with or without lesions, was calculated relative to the overall expression. On average, all DE genes met both conditions.
To assess the presence and distribution of markers related to the transcriptomic data, immunofluorescence staining of the kidneys of the SD and HFD groups was performed. These data revealed that T-cells were mainly present in the interstitial zone. Scattered CD3+ cells were observed in the peritubular capillaries and some glomeruli of the HFD group, with no T cells observed in the rat kidneys of the SD group. No CD20+ B cells were detected, regardless of the diet.
Immunofluorescence labeling of M1–M2 identified only CD86+ cells in HFD-fed rats, corresponding to M1 macrophages.
2.9. Diet-Dependent Expression of Identified Small RNAs in Rat Urine Samples
We analyzed urinary miRNAs to analyze kidney pathology and injury sites, mirroring small RNA analysis in rat kidneys. Mapping the Rnor6.0 genome detected 471 sequences (240 Mt_tRNA, 46 rRNA, 2 scaRNA, 32 snoRNA, 45 snRNA, and 106 miRNA sequences). Among them, 53 were DEs (adjusted P-value<0.1, log2FoldChange>1) in SD-fed vs. HFD-fed rats; 18 were downregulated in HFD-fed rats and 35 were downregulated in SD-fed rats (Figure 8). Interestingly, miR-205 was the only overlap between the kidney and urine samples. All DE miRNAs were upregulated in the HFD-fed rats. Twelve miRNAs that correlated with urine weight, including miR-101b-3p, miR-30a-5p, and miR-205, were significantly upregulated in HFD-fed rats. Other miRNAs showed trends but lacked statistical significance owing to their high variability (Figure 9).
2.10. Lesion-Related Transcriptomic Changes in Urine
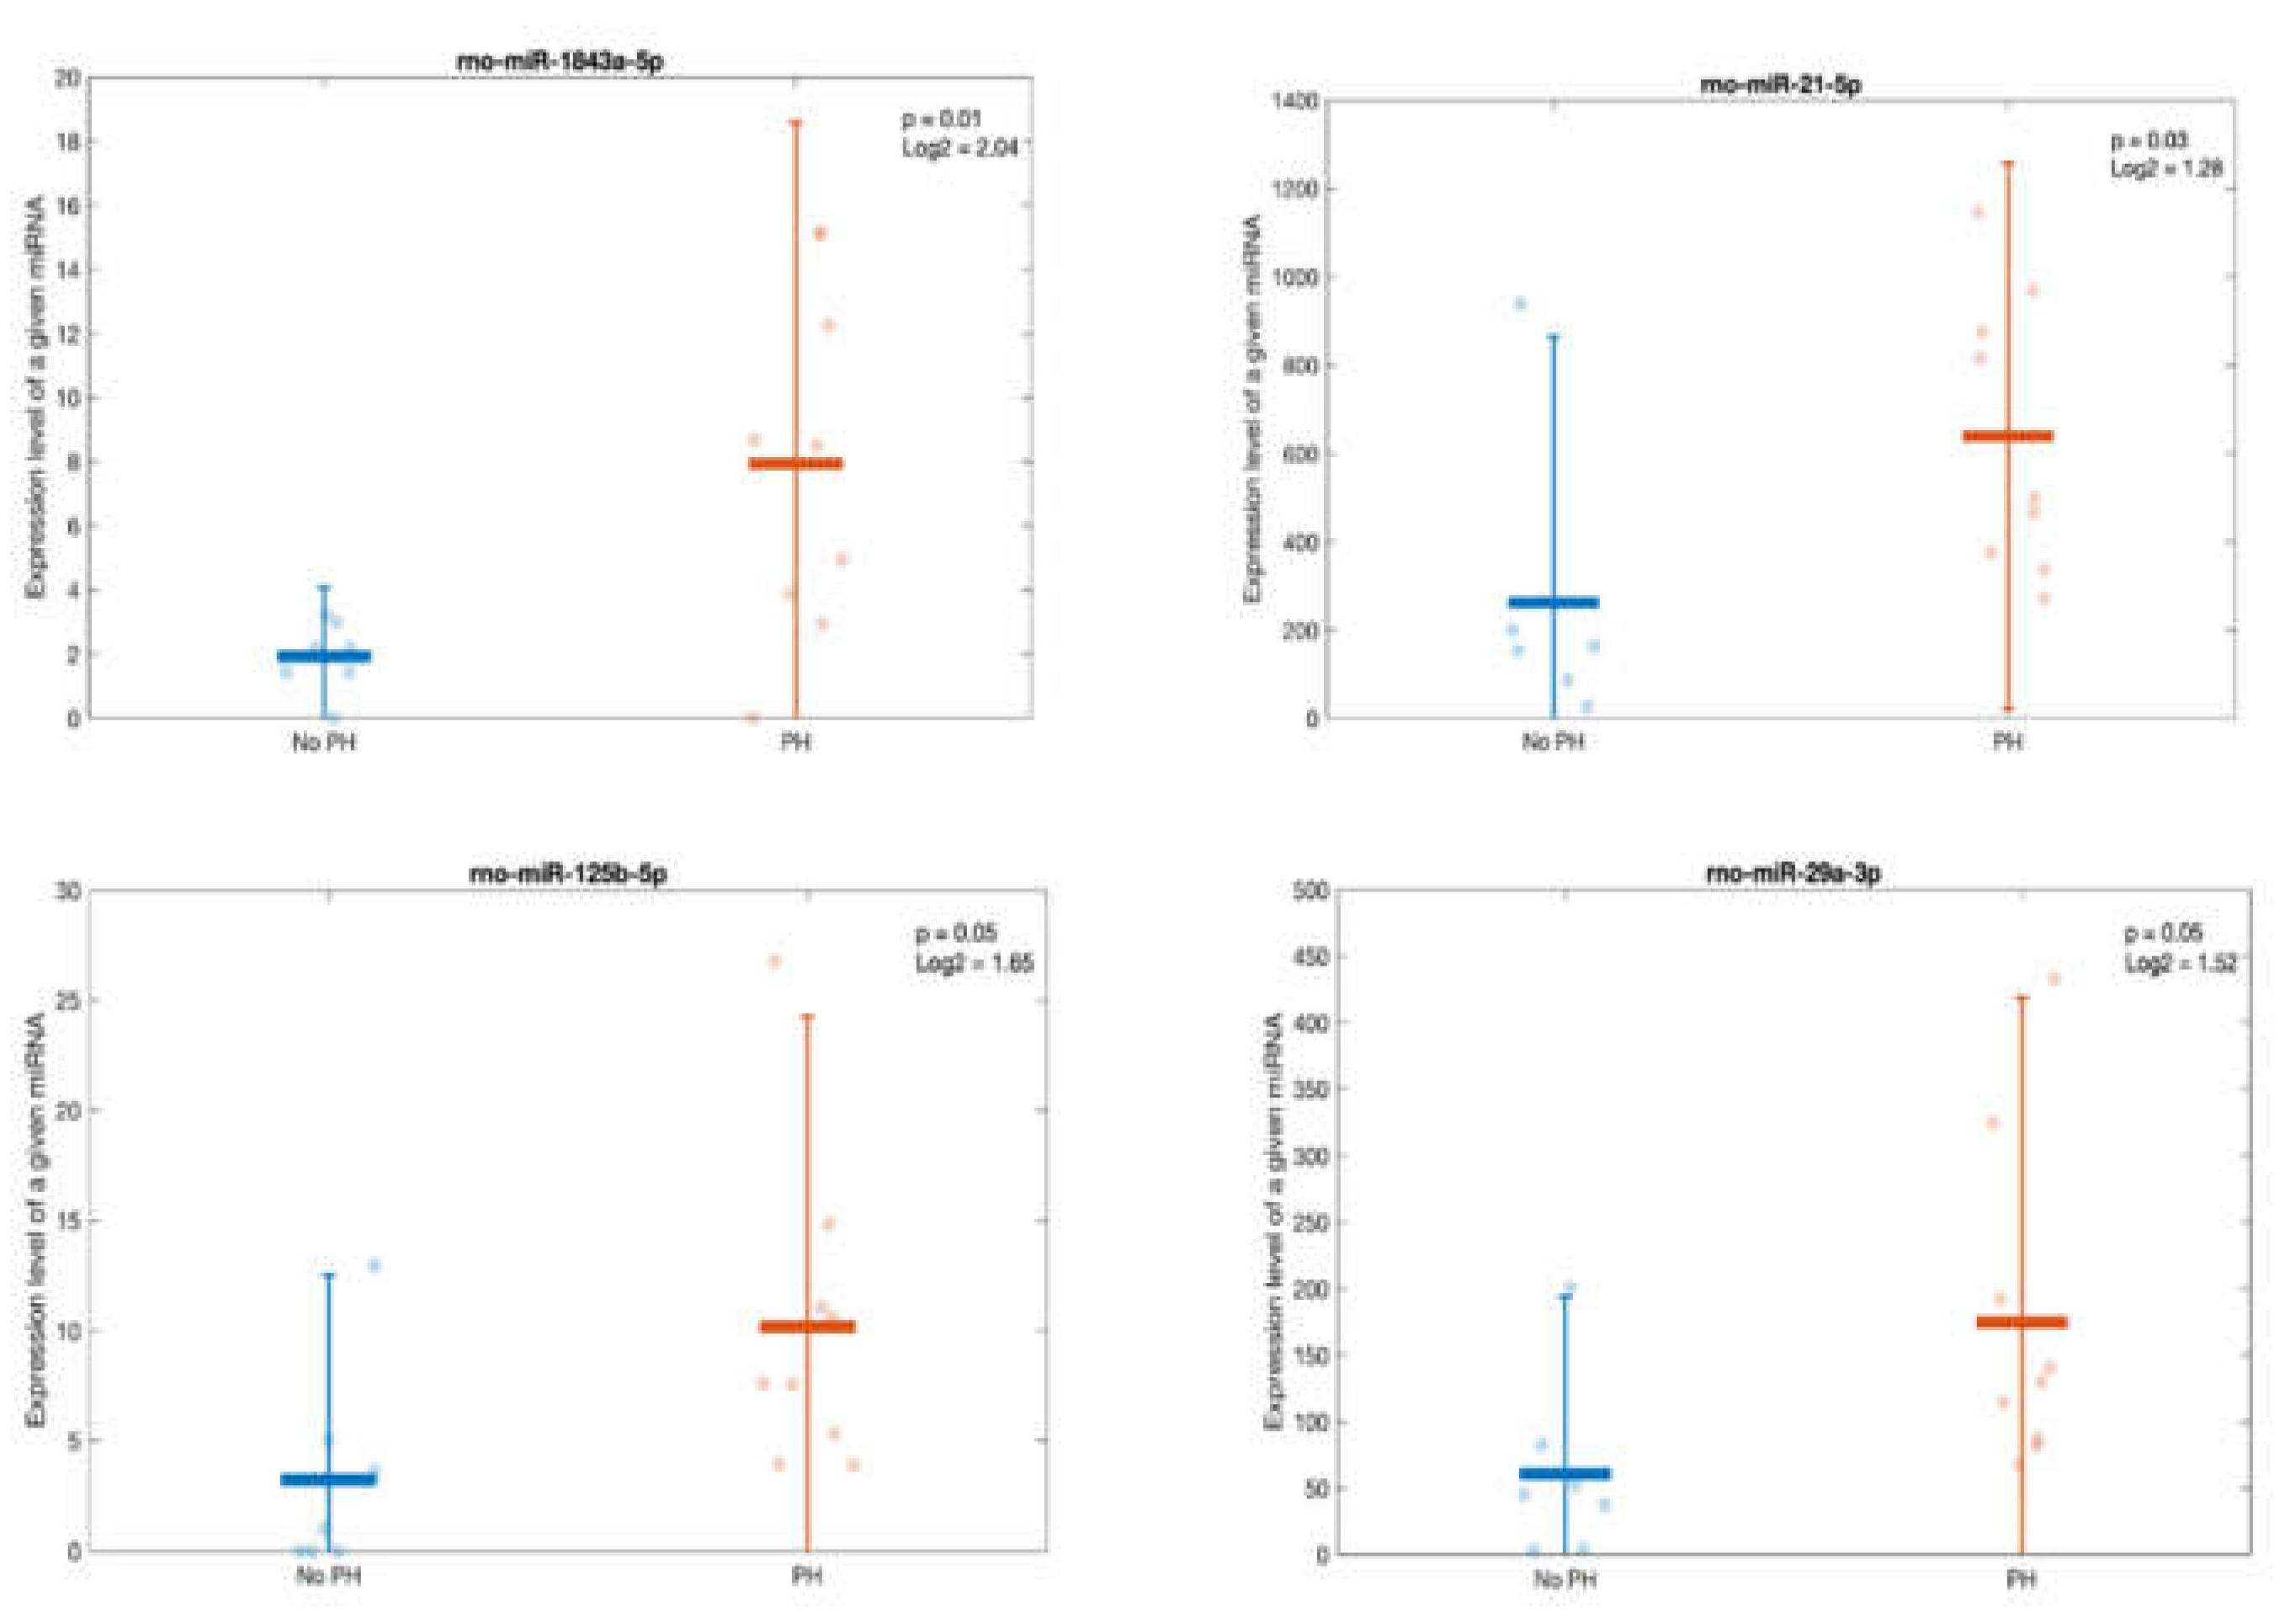
Urinary data, such as those from the kidney, were analyzed based on the presence of MMI or PH. Lesion-related results had a P-value of <0.05 and log2FoldChange of >1. No miRNA-tissue injury association was observed with MMI, although four miRNAs (miR-1843a-5p, miR-21-5p, miR-125b-5p, and miR-29a-3p) distinguished rats with PH (Figure 10).
3. Discussion
This study established a rat model of diet-induced obesity with early-stage ORG. The paired mRNAs and miRNAs were sequenced. Wistar rats with diet-induced obesity developed glomerulomegaly, MMI, PH, MCP, and intracytoplasmic lipid deposits in podocytes. Our findings describe the immunological, regeneration, and injury processes that occur in this disease when the damage is reversed by treatment. We also identified a robust signature of miRNAs in the urine that could be explored as a non-invasive biomarker and potential therapeutic target for ORG.
HFD-fed rats gained more weight, showing greater MMI and larger glomeruli, than SD-fed rats. The most frequently encountered lesion was MMI, whereas MCP and podocyte intracytoplasmic lipid deposits were observed only in the HFD group. The role of lipid accumulation in non-adipose tissue in the development of ORG has attracted increasing interest [12]. Podocytes also slightly increased in cytoplasmic organelles, especially mitochondria. Abnormal mitochondrial structures in the obesity milieu cause downregulation of key fatty acid oxidative enzymes and upregulation of enzymes involved in lipogenesis [13,14]. HFD-fed rats experienced greater podocyte depletion and albuminuria, which were almost twice greater than those experienced by SD-fed rats, indicating early ORG progression [15,16]. The GFR measurements showed no significant intergroup differences, suggesting similar hyperfiltration levels despite weight gain [17]. Adiporenal crosstalk suggests chronic subclinical inflammation in the adipose tissue [18,19]. Alterations in lipid metabolism trigger macrophage migration, inhibitory factor expression, and release of inflammatory activators, such as CD40 and interleukin-6 [12]. M1-type macrophages promote proinflammatory cytokine production, whereas M2-type macrophages synthesize anti-inflammatory cytokines and aid tissue repair. Obesity prompts a shift from M2 to M1 macrophages in the adipose tissue, exacerbating inflammation [18]. Experimental approaches suggest that inhibition of M1 macrophages may reduce kidney injury [20]. Accordingly, we identified CD86-marked cells indicating the presence of pro-inflammatory M1 macrophages in HFD-fed rats.
A comparison of gene expression profiles in HFD- and SD-fed rats revealed four gene groups with differential expression as follows: ATP12a, related to potassium–proton exchange ATPase activity; Epha3 and Pros1, involved in renal injury prevention and tissue protection; CCL20 linked to inflammation and T-cell recruitment [21]; and Sult4a1, Robo3, and Htr5b, associated with the nervous system [22,23,24]. CCL20 hyper-expression in the proximal tubular epithelial cells of HFD-fed rats likely recruits immune cells, particularly M1 macrophages, thereby intensifying inflammation. To counteract this, M2 macrophages, Pros1, and Epha3 aid tissue regeneration to maintain kidney function. Pros1 mediates cytoprotection in diabetic kidneys by inhibiting glomerular endothelial cell and podocyte apoptosis [25].
miRNAs are small noncoding RNA molecules that play a critical role in regulating gene expression. They are involved in various biological processes and are essential for normal organ development and homeostasis, including kidney development and function. Its dysregulation has been implicated in the development and progression of ORG [26]. Of special interest was miR-205, the only miRNA that was upregulated in the HFD-fed rats. miR-205 is involved in the epithelial-to-mesenchymal transition when podocytes lose the expression of highly specialized protein markers and acquire mesenchymal markers. miR-205 has been described as a prognostic marker for tubulointerstitial damage in patients with IgA nephropathy [27]. Concerning miRNAs downregulated in the HFD-fed rats, miR-140-5p affects adipocyte differentiation [28] and mediates renal fibrosis [29]; miR-185-5p ameliorates endoplasmic reticulum stress and renal fibrosis by downregulating ATF6 [30]; miR-128-3p regulates adipogenesis and lipolysis [31] and promotes acute kidney injury process by activating the JAK2/STAT1 pathway [32]; miR-28 is a negative regulator of the germinal center reaction and regulates B cell receptor signaling, proliferation, and apoptosis [33]; and miR-340-3p is downregulated in the skeletal muscle of mice after HFD feeding [34]. Interestingly, miR-6329 is associated with hypertension in rats [35], and miR-674-3p is associated with acute kidney injury [36].
The relationship between the DE miRNAs and their target genes was also analyzed. Approximately 700 genes were associated with these miRNAs. Interestingly, these four miRNA interactions exclusively regulated a single gene, PTEN. In podocytes, PTEN protects the kidneys by enhancing autophagy, preventing cell death, and maintaining podocyte integrity. In a diet-induced obesity model using C57BL/6J mice, Ji et al. explored miR-141-3p’s role in mitochondrial dysfunction in hepatic cells by inhibiting PTEN [37]. Other authors have suggested that PTEN downregulation increases endoplasmic reticulum stress in a study conducted with podocyte cell cultures [38]. A previous study on mice with a podocyte-specific PTEN knockout showed the typical features of ORG when fed a high-fat diet [39]. This suggests that loss of PTEN function contributes to ORG development. PTEN downregulation is associated with increased lipid endocytosis in podocytes, leading to lipid accumulation and aggravation of ORG [39]. Accordingly, the present study demonstrated that the upregulation of miR-205 and its interaction with miR-22-3p, miR-22-5p, and miR-144-3p inhibited the PTEN gene, contributing to podocyte lipid endocytosis. To the best of our knowledge, this study is the first to describe PTEN downregulation in a model of diet-induced obesity-related ORG in non-genetically modified rodents. Insights into PTEN’s role in podocyte lipid endocytosis and glomerulopathy may offer novel therapeutic approaches for kidney diseases characterized by lipid accumulation and metabolic disturbances, such as obesity.
In kidney diseases, urine may offer a significant advantage over tissue as a non-invasive biomarker owing to its direct access to damaged tissue, particularly in the early stages of the disease. In the present animal model, we observed a differential gene expression in both tissues and urine depending on whether the rats had developed PH, as analyzed using small RNAs. Strikingly, urine analysis revealed the same upregulated miRNA in the HFD group (miR 205) that negatively regulated PTEN. These findings could contribute to the detection of urinary biomarkers for PH or podocyte injury in patients with obesity, aiming to prevent ORG progression to albuminuria and GFR decline.
This study has limitations. The limited sample size may have compromised the generalizability of the findings. Moreover, translating the results from animal models to humans requires caution and validation in clinical studies. Nevertheless, this was the first exploratory project, and further studies will be conducted in the future experimental and clinical studies. The main strength of this study is that, by integrating innovative techniques, molecular biology, histopathology, and clinical data analysis, it bridges the field of research and offers a multidimensional understanding of ORG.
In conclusion, miRNAs may play a role in ORG. Specifically, the upregulation of miR-205 in the kidneys and its detection in urine are associated with podocyte lipid endocytosis, which occurs in the early stages of ORG through the inhibition of the PTEN gene. miR-205 could serve as a plausible biomarker for early stage ORG and pave the way for future therapeutic studies. Moreover, the analysis of urinary small RNAs identified DE genes depending on whether the rats developed PH. Future studies are needed to confirm the involvement of these miRNAs in human ORG.
4. Materials and Methods
4.1. Establishment of the Obesity-Induced Animal Model
A total of 30 male Wistar Han rats (300–350 g; Charles River Laboratories España S.A.), aged 7 weeks and not genetically modified, were housed and fed under standard laboratory conditions. They were randomized into two groups: control rats (n=15) fed a standard diet (SD) (TEKLAD 2014; % by weight: 14.3% protein, 4% fat, 18.0% neutral detergent fiber, 2.9 Kcal/g) and rats (n=15) fed a high-fat diet (HFD) (TEKLAD 06414; % by weight: 23.5% protein, 34.4% fat, 27.3% carbohydrate, 5.1 Kcal/g) (Harlan Laboratories, Indianapolis, IN, USA) for 10 weeks. Weight and food intake were measured weekly. The rats were considered obese if their weight gain was >25% of their initial baseline weight. They were housed in metabolic cages for 24 h before organ collection to prevent urine from being contaminated with feces or feed.
4.2. Organ and Urine Harvesting
The kidneys were harvested from each animal and stored in a saline solution at 4 °C to remove excess adipose tissue. A quarter of each renal tissue was fixed in formaldehyde and embedded in paraffin for immunochemistry and histological studies; another quarter was frozen in an isopentane bath and preserved at −80 °C. The remaining tissue was saturated in an RNA-later stabilization solution (Thermo Fisher Scientific Inc., Massachusetts, USA) and stored at 4 °C for gene expression determination (16 of 30 biopsies for transcriptomic and morphological studies, 14 for quantitative polymerase chain reaction experiments). Urine from 16 rats was centrifuged at 2,000 g for 10 min, and aliquots were stored at −80 °C.
4.3. Measurement of Renal Function: Albuminuria and Iohexol Clearance
Albuminuria was assessed via colorimetric enzyme-linked immunoassay (Abcam, Cambridge, UK) with a sensitivity of 0.44 ng/ml and a concentration of 0.195 ng/ml–50 ng/ml. A total of 10 µl of urine diluted 1:100 with the appropriate dilution buffer (including standards) was added to the wells and precoated and blocked with rat albumin- specific antibody. Subsequently, an anti-albumin biotinylated detection antibody and streptavidin–peroxidase conjugate were added, followed by visualization using 3,3′,5,5′-tetramethylbenzidine. The samples were processed in triplicates.
Glomerular filtration rate (GFR) was measured through the plasma clearance of iohexol [40]. After slight sedation with isoflurane (2.5%), 200 μl of Omnipaque 300 solution (GE Healthcare, Milan, Italy) containing 129.4 mg of iohexol was injected intravenously into one lateral tail vein of conscious rats that were placed in a plexiglass rat restrainer. Blood samples (approximately 15 μl) were collected before and 20, 40, 80, 120, 140 min after injection. Samples were mixed by gentle vertexing for 7 min, collected again using heparinized capillary tubes (10 μl), deposited on filter paper (Whatman 903, GE Healthcare, Cardiff, UK), and allowed to dry at least 24 h. Then, iohexol plasma concentrations in the total blood samples were measured by high performance liquid chromatography-ultraviolet using a C18 reverse- phase column (Advanced Chromatography Technologies LTD, Scotland) in a high-performance liquid chromatography system (Agilent Series 1260, Santa Clara, CA) equipped with a diode array detector set at 254 nm. Plasma concentrations of iohexol were recalculated from blood levels using the formula: Cplasma¼ Cblood/1 – hematocrit. The hematocrit was determined using the formula hematocrit ¼ (H1 / H2) 100, where H1 is the height of the red blood cell column, and H2 is the height of the red blood cell plus the height of the plasma column after centrifuging a heparinized capillary tube filled with blood for 10 min at 6,000 rpm. The reproducibility of the plasma clearance of iohexol in rats using the method described was <10%.
4.4. Morphometry, Histology, Immunohistochemistry, Immunofluorescence, and Transmission Electron Microscopy (TEM)
Standard histopathology techniques were applied for 3-µm-thick rat kidney sections. The glomeruli, particularly those sectioned through the hilium, were morphometrically analyzed for area and mesangial expansion. Thirty glomeruli per sample were assessed in the periodic acid–Schiff- and hematoxylin and eosin-stained sections. Slides were scanned at 40 µm resolution using the PANNORAMIC® 1000 Flash DX scanner and analyzed using QuPath (v0.4.4) [41]. Mesangial matrix increase was defined as increased mesangial extracellular material with an interspace width of >2 mesangial cell nuclei in one or more peripheral mesangial areas. Mesangial cell proliferation was defined as the presence of more than three mesangial cells surrounded by mesangial matrix in an intact glomerular segment in 3-µm-thick sections. Podocyte hypertrophy was defined as podocyte enlargement with large nuclei and prominent nucleoli, with or without intracytoplasmic protein resorption droplets.
Immunohistochemical staining (BenchMark ULTRA automated IHC/ISH slide staining system; Roche Ventana) was performed using antibodies against WT1 (clone 6F-H2, mouse monoclonal antibody; Ventana) and Ki67 (clone 30-9, rabbit monoclonal antibody; Ventana).
The immunohistochemical slides were scanned and assessed similarly with histochemical techniques.
Immunocytochemistry involved blocking peroxidase activity with 3% H2O2 in methanol for 5–15 min (Thermo Fisher Scientific). Anti-CD3 and anti-CD19 antibodies (Thermo Fisher Scientific) were used to distinguish between T and B cells, with goat anti-mouse F(ab)2 used as the secondary antibody. Sections were stained with alkaline phosphatase (Abcam, Cambridge, UK), counterstained with hematoxylin, and observed under a Zeiss Axioskop-2 microscope.
Double immunofluorescence was performed for PTEN–nephrin and macrophage M1–M2 staining using two combinations of rabbit anti-PTEN (Abcam), mouse anti-nephrin (Santa Cruz, California, USA), mouse anti-CD86 for M1 macrophages (Abcam), and rabbit anti-CD206 for M2 type macrophages (Thermo Fisher). Goat anti-mouse A488 and anti-rabbit Cy3 secondary antibodies were used as received. The nuclei were stained with 4′,6-diamidino-2-phenylindole (Thermo Fisher Scientific). Slides were viewed using an Abberior STEDYCON confocal microscope, and the ImageJ software was used to analyze the mean fluorescence of all markers.
TEM was used to analyze six rat samples (three in the SD group and three in the HFD group) per the standard protocol. Tissues from the paraffin blocks were dewaxed, hydrated, post-fixed, dehydrated, and embedded in epoxy resin. Ultrathin sections were cut using a Leica Ultracut microtome and stained with uranyl acetate and lead citrate using a Leica EM Stainer. Samples were examined using a JEM 1010 TEM (JEOL USA, Inc.) at 80 kV, and digital images were captured using an Orius CCD camera (Gatan Inc.).
4.5. Total RNA Isolation and miRNA Enrichment
RNA from 30 rat kidneys (15 SD- and 15 HFD-fed rats) was extracted using Trizol Reagent (Invitrogen, Thermo Fisher). DNase I treatment (Invitrogen) and quality control (QC) analysis were performed using a TapeStation 2200 (Agilent). Half of the RNA was subjected to RNA-Seq, and the remainder was used for quantitative polymerase chain reaction (qPCR).
Small RNAs from 30 rat kidneys were purified using 1 μg of total RNA with SPRIselect beads (Bee Na Lee, Beckman Coulter). Sixteen kidneys were used for small RNA-Seq and 14 for qPCR validation. Sixteen rat urine samples were collected, and 500 μl of the samples were used for small RNA isolation with the ZR Urine RNA Isolation Kit (Zymo Research Corp). QC was assessed using a bioanalyzer with a high-sensitivity chip(Agilent).
4.6. Library Preparation, RNA Sequencing, and Data Analysis
Sixteen RNA-Seq libraries were prepared from 1 μg of total RNA using NEBNext® Ultra™ II Directional RNA Library Prep Kit for Illumina® (New England Biolabs, NEB, Massachusetts, USA). The HighSeq 2500 System generated 40–50 M reads/sample. FastQC assessed the read quality, and Cutadapt was used to remove adapters. The Salmon tool was used to map and quantify transcripts to Rnor6.0 genome. DESeq2 v1.24.0 was used for differential expression analysis. Gene set enrichment analysis was performed using gene ontology (GO) and the Reactome Pathway Knowledgebase for biological significance analysis.
4.7. Library Preparation, smallRNA Sequencing, and Data Analysis
Sixteen small RNA libraries were prepared using the NebNext Small RNA Library Prep Set (Illumina). Fragments were size-selected on a 6% polyacrylamide gel (Invitrogen), and library Quality control (QC) was conducted with a TapeStation 2200 using HighSens D1000 screen tape (Agilent). HighSeq 2500 System (Illumina) generated 12–15 M reads/sample. FastQC was used to assess read quality, and Cutadapt was used to remove adapters. The Subread/Rsubread package was used to map and quantify transcripts in the Rnor6.0 genome. Annotations were sourced from different databases based on small RNA class (http://www.mirbase.org/ftp.shtml; https: //www.ensembl.org/info/data/ftp/index.html). QCs included a multidimensional scaling plot analysis and Euclidean distances between samples to ensure the suitability of the normalized data. DESeq2 v1.24.0 Bioconductor’s package was used for differential expression testing. The miRNA target sites were cataloged based on experimental validation and computational prediction using the multiMiR Bioconductor package (http://multimir.ucdenver.edu). miRNAs with an adjusted p-value of ≤0.05 and Log2Foldchange of >1 were deemed upregulated; a Log2FC of <−1 indicated downregulation.
4.8. Predicted and Validated Targetome for miRNAs
In this study, the multiMiR Bioconductor package [42] was used to identify miRNA target sites across various databases, including miRecords, miRTarBase, and TarBase for validated targets, and DIANA-microT, ElMMo, MicroCosm, miRanda, miRDB, PicTar, PITA, and TargetScan for predicted targets. To categorize the validated gene targets, keywords were grouped into five categories as follows: inflammatory response (including adhesion, leukocytes, chemokines, and adipokines); kidney damage (extracellular matrix, renal injury molecules); mitochondria (metabolism, respiratory chain); adipose tissue; and nerve-related tissue. A computer algorithm searched the Entrez summary of each gene for these keywords and classified genes accordingly.
4.9. Gene Ontology and Pathway Analysis
miRNA gene ontology (GO) and pathway analyses utilized DIANA-miRPath v3.0 [42], examining 14 differentially expressed (DE) miRNAs with validated target genes across the groups. DIANA-TarBase v7.0 [43] investigates enriched pathways using Fisher’s exact test meta-analysis with Benjamini–Hochberg’s false discovery rate (FDR) correction (q-value <0.05). REVIGO [44,45] summarizes significant biological processes by eliminating redundancies and illustrating the relationships between GO terms. Functional enrichment analysis employs pathways from the Kyoto Encyclopedia of Genes and Genomes (KEGG) database after statistical analysis to identify pathways significantly targeted by the selected miRNAs. Heat maps facilitate the identification of miRNA subclasses or defining pathways.
4.10. Reverse Transcription and Quantitative Reverse Transcription Polymerase Chain Reaction Validation
Total RNA extracted from rat kidneys underwent retrotranscription using GoScript™ Reverse Transcriptase (Promega Corporation, Madison, WI, USA). The product was diluted 3–5 times in TE (10 mM TRIS/1 mM EDTA, pH 8) for subsequent experiments. cDNA triplicates were amplified via real-time polymerase chain reaction (PCR) in a LightCycler®-480 (Roche, Mannheim, Germany) using TaqMan® Fast Advanced Master Mix (Integrated DNA Technologies, IDT, Iowa, USA) and pre-designed TaqMan®-probes (IDT, see table primers used for qPCR, A). Actb and Hmbs were tested as housekeeping genes, with Hmbs chosen because of their expression level similarity with target genes. All analyzed mRNAs exhibited a Ct value of <25. Relative abundance was corrected by the selected housekeeping gene using the 2−ΔCT algorithm and expressed as arbitrary units.
miRNAs: Isolated miRNA (4 μL) from kidney and urine samples underwent reverse transcription using the Universal cDNA Synthesis Kit II (Exiqon, Vedbaek, Denmark). Synthetic UniSp6 served as the spike-in control. Incubation was performed at 42 °C for 60 min, followed by heat inactivation at 95 °C for 5 min. cDNA samples were diluted 60-fold, and 4 μL was used in individual 10 μL PCR reactions with ExiLENT SYBR Green master mix and LNA-enhanced miRNA primer assays alongside UniSp6. Real-time quantitative PCR of circulating miRNAs was conducted as triplicates with conditions: 95 °C for 10 min, 40 cycles of denaturation (95 °C, 10 s) and annealing (60 °C, 60 s), and melting curve analysis.
Sets of 10 (kidney) and 12 (urine) circulating miRNAs were selected based on the miR-Seq results, including DE genes among the groups. Data normalization against UniSp6 reduced technical variation, calculated as normalized Ct = Ct UniSp6 – Ct measured miRNA. NormFinder identified stable miRNAs within normalized small-RNA seq data for endogenous controls, selecting miR-181b-5p and miR-411-5p (kidney), and miR-204-5p and miR-181b-5p (urine). The Ct values were calculated using the second-derivative method and reported as arbitrary units.
4.11. Statistical Analysis
Descriptive analyses summarized qualitative and quantitative characteristics as percentages and mean values plus standard errors (or median values and interquartile ranges), respectively. Main characteristics between the study and control groups were compared using an unpaired t-test or χ2 test, as appropriate. The t-test was applied to nonparametric data after log transformation. A principal component analysis was performed using multivariate statistics. Fisher’s exact test for meta-analysis with Benjamini–Hochberg’s FDR correction was used to calculate the significant targeted biological processes and KEGG pathways. The complete linkage clustering method was used for hierarchical clustering of pathways and miRNAs, with squared Euclidean distances as distance measures. Absolute P-values were used in all calculations, considering the significance levels of the interaction. A two-tailed P-value of ≤0.05 denoted statistical significance. Statistical analyses were performed using SPSS (version 15.0; SPSS, Chicago, IL).
4.12. Study Approval
This study strictly adhered to the Guide for the Care and Use of Laboratory Animals of the Generalitat de Catalunya, Catalan Government. Animal procedures were approved by the Animal Experimentation Ethics Committee of the Centre de Medicina Comparativa i Bioimatge de Catalunya and Germans Trias i Pujol’s Research Institute and Generalitat de Catalunya (CEA-OH/10528/2), following the principles of the Declaration of Helsinki for animal experimental investigations. All protocols followed the 3R principles and prioritized animal welfare.
Author Contributions
Conceptualization, Marina López-Martínez and Maruja Navarro-Díaz; Data curation, Maria Pilar Armengol, Mieria Ferrer and Maruja Navarro-Díaz; Formal analysis, Maria Pilar Armengol, Mieria Ferrer and Maruja Navarro-Díaz; Funding acquisition, Maruja Navarro-Díaz; Investigation, Marina López-Martínez and Maruja Navarro-Díaz; Methodology, Maria Pilar Armengol, Irina Pey, Xavi Farré, Paula Rodríguez-Martínez, Esteban Porrini, Sergio Luis-Lima, Laura Diaz-Martin, Ana Elena Rodríguez-Rodríguez and Coriolano Cruz-Perera; Project administration, Maruja Navarro-Díaz; Resources, Maria Pilar Armengol and Maruja Navarro-Díaz; Software, Maria Pilar Armengol, Mieria Ferrer and Marta Alcalde; Supervision, Maruja Navarro-Díaz; Validation, Maria Pilar Armengol, Paula Rodríguez-Martínez, Mieria Ferrer and Esteban Porrini; Visualization, Marina López-Martínez and Maruja Navarro-Díaz; Writing – original draft, Marina López-Martínez and Maruja Navarro-Díaz; Writing – review & editing, Marina López-Martínez and Maruja Navarro-Díaz.
Funding
This research was funded by Instituto de Salud Carlos III, grant number PI18-01951.
Data Availability Statement
Transcriptomic data supporting the findings of this study are available in the repository Gene Expression Omnibus (GEO) at https://www.ncbi.nlm.nih.gov/geo/ (accession number: GSE262503).
Acknowledgments
Marina López-Martínez conducted this study based on her thesis at the Departamento de Medicina de la Universidad Autónoma de Barcelona. We thank Rosa Ampúdia and Sara Capdevila from the Comparative Medicine and Bioimage Centre of Catalunya for their collaboration with the animal model.
Conflicts of Interest
The authors declare no conflicts of interest. The funders had no role in the design of the study; in the collection, analyses, or interpretation of data; in the writing of the manuscript; or in the decision to publish the results.
References
- C. Hsu, C. E. McCulloch, C. Iribarren, J. Darbinian, and A. S. Go, “Body Mass Index and Risk for End-Stage Renal Disease,” Ann Intern Med, vol. 144, no. 1, p. 21, Jan. 2006. [CrossRef]
- C. Garofalo, S. Borrelli, R. Minutolo, P. Chiodini, L. De Nicola, and G. Conte, “A systematic review and meta-analysis suggests obesity predicts onset of chronic kidney disease in the general population,” Kidney Int, vol. 91, no. 5, pp. 1224–1235, May 2017. [CrossRef]
- B. Bikbov et al., “Global, regional, and national burden of chronic kidney disease, 1990–2017: a systematic analysis for the Global Burden of Disease Study 2017,” The Lancet, vol. 395, no. 10225, pp. 709–733, Feb. 2020. [CrossRef]
- V. D. D’Agati et al., “Obesity-related glomerulopathy: Clinical and pathologic characteristics and pathogenesis,” Nature Reviews Nephrology, vol. 12, no. 8. Nature Publishing Group, pp. 453–471, Aug. 01, 2016. [CrossRef]
- M. Navarro-Díaz et al., “Effect of Drastic Weight Loss after Bariatric Surgery on Renal Parameters in Extremely Obese Patients,” Journal of the American Society of Nephrology, vol. 17, no. 12_suppl_3, pp. S213–S217, Dec. 2006. [CrossRef]
- A. Serra et al., “Renal injury in the extremely obese patients with normal renal function,” Kidney Int, vol. 73, no. 8, pp. 947–955, 2008. [CrossRef]
- R. W. Carthew and E. J. Sontheimer, “Origins and Mechanisms of miRNAs and siRNAs,” Cell, vol. 136, no. 4, pp. 642–655, Feb. 2009. [CrossRef]
- Y. Xiao et al., “GSTA3 attenuates renal interstitial fibrosis by inhibiting TGF-beta-induced tubular epithelial-mesenchymal transition and fibronectin expression,” PLoS One, vol. 11, no. 9, Sep. 2016. [CrossRef]
- J. Suzuki, E. Imanishi, and S. Nagata, “Exposure of phosphatidylserine by Xkrelated protein family members during apoptosis,” Journal of Biological Chemistry, vol. 289, no. 44, pp. 30257–30267, Oct. 2014. [CrossRef]
- Y. Zhang, H. Lai, and B. Tang, “Abnormal Expression and Prognosis Value of COG Complex Members in Kidney Renal Clear Cell Carcinoma (KIRC),” Dis Markers, vol. 2021, 20211. [CrossRef]
- R. James et al., “Proteomic analysis of mitochondria in APOE transgenic mice and in response to an ischemic challenge,” Journal of Cerebral Blood Flow and Metabolism, vol. 32, no. 1, pp. 164–176, 2012. [CrossRef]
- A. P. J. De Vries et al., “Fatty kidney: Emerging role of ectopic lipid in obesity-related renal disease,” The Lancet Diabetes and Endocrinology, vol. 2, no. 5. Elsevier Limited, pp. 417–426, 2014. [CrossRef]
- Tang, J. Cai, and Z. Dong, “Mitochondrial dysfunction in obesity-related kidney disease: a novel therapeutic target,” Kidney International, vol. 90, no. 5. Elsevier B.V., pp. 930–933, Nov. 01, 2016. [CrossRef]
- H. H. Szeto, S. Liu, Y. Soong, N. Alam, G. T. Prusky, and S. V. Seshan, “Protection of mitochondria prevents high-fat diet–induced glomerulopathy and proximal tubular injury,” Kidney Int, vol. 90, no. 5, pp. 997–1011, Nov. 2016. [CrossRef]
- K. N. Campbell and J. A. Tumlin, “Protecting Podocytes: A Key Target for Therapy of Focal Segmental Glomerulosclerosis,” American Journal of Nephrology, vol. 47. S. Karger AG, pp. 14–29, Jun. 01, 2018. [CrossRef]
- V. D. D’Agati, “Podocyte injury in focal segmental glomerulosclerosis: Lessons from animal models (a play in five acts),” Kidney International, vol. 73, no. 4. Nature Publishing Group, pp. 399–406, 2008. [CrossRef]
- M. López-Martínez et al., “The estimation of GFR and the adjustment for BSA in overweight and obesity: a dreadful combination of two errors,” Int J Obes, vol. 44, no. 5, pp. 1129–1140, May 2020. [CrossRef]
- Q. Zhu and P. E. Scherer, “Immunologic and endocrine functions of adipose tissue: implications for kidney disease,” Nature Reviews Nephrology, vol. 14, no. 2. Nature Publishing Group, pp. 105–120, Feb. 01, 2018. [CrossRef]
- C. García-Carro, A. Vergara, S. Bermejo, M. A. Azancot, J. Sellarés, and M. J. Soler, “A Nephrologist Perspective on Obesity: From Kidney Injury to Clinical Management,” Frontiers in Medicine, vol. 8. Frontiers Media S.A., Apr. 13, 2021. [CrossRef]
- H. Chen, N. Liu, and S. Zhuang, “Macrophages in Renal Injury, Repair, Fibrosis Following Acute Kidney Injury and Targeted Therapy,” Frontiers in Immunology, vol. 13. Frontiers Media S.A., Jul. 13, 2022. [CrossRef]
- A. M. Woltman et al., “MIP-3α/CCL20 in Renal Transplantation and Its Possible Involvement as Dendritic Cell Chemoattractant in Allograft Rejection,” American Journal of Transplantation, vol. 5, no. 9, pp. 2114–2125, Sep. 2005. [CrossRef]
- S. Chaturvedi and L. A. Robinson, “Slit2-Robo signaling in inflammation and kidney injury,” Pediatric Nephrology, vol. 30, no. 4, pp. 561–566, Apr. 2015. [CrossRef]
- M. I. Hossain et al., “SULT4A1 Protects Against Oxidative-Stress Induced Mitochondrial Dysfunction in Neuronal Cells,” Drug Metabolism and Disposition, vol. 47, no. 9, pp. 949–953, Sep. 2019. [CrossRef]
- A. M. Kinsey, A. Wainwright, R. Heavens, D. J. S. Sirinathsinghji, and K. R. Oliver, “Distribution of 5-ht5A, 5-ht5B, 5-ht6 and 5-HT7 receptor mRNAs in the rat brain,” Molecular Brain Research, vol. 88, no. 1–2, pp. 194–198, Mar. 2001. [CrossRef]
- F. Zhong et al., “Protein S protects against podocyte injury in diabetic nephropathy,” Journal of the American Society of Nephrology, vol. 29, no. 5, pp. 1397–1410, May 2018. [CrossRef]
- M. Caus, À. Eritja, and M. Bozic, “Role of micrornas in obesity-related kidney disease,” Int J Mol Sci, vol. 22, no. 21, Nov. 2021. [CrossRef]
- S. Liang et al., “Urinary sediment miRNAs reflect tubulointerstitial damage and therapeutic response in IgA nephropathy,” BMC Nephrol, vol. 18, no. 1, p. 63, Dec. 2017. [CrossRef]
- M. Zhang et al., “Integrated Analysis of MiRNA and Genes Associated with Meat Quality Reveals that Gga-MiR-140-5p Affects Intramuscular Fat Deposition in Chickens,” Cellular Physiology and Biochemistry, vol. 46, no. 6, pp. 2421–2433, 2018. [CrossRef]
- W. Liao et al., “MicroRNA-140-5p Mediates Renal Fibrosis Through TGF-β1/Smad Signaling Pathway by Directly Targeting TGFBR1,” Front Physiol, vol. 11, Sep. 2020. [CrossRef]
- Q. Yuan et al., “MiR-185-5p ameliorates endoplasmic reticulum stress and renal fibrosis by downregulation of ATF6,” Laboratory Investigation, vol. 100, no. 11, pp. 1436–1446, Nov. 2020. [CrossRef]
- C. Chen et al., “miR-128-3p regulates 3T3-L1 adipogenesis and lipolysis by targeting Pparg and Sertad2,” J Physiol Biochem, vol. 74, no. 3, pp. 381–393, Aug. 2018. [CrossRef]
- L. Xie et al., “LINC00963 targeting miR-128-3p promotes acute kidney injury process by activating JAK2/STAT1 pathway,” J Cell Mol Med, vol. 24, no. 10, pp. 5555–5564, May 2020. [CrossRef]
- C. Wang et al., “miR-28-5p acts as a tumor suppressor in renal cell carcinoma for multiple antitumor effects by targeting RAP1B,” Oncotarget, vol. 7, no. 45, pp. 73888–73902, Nov. 2016. [CrossRef]
- D. C. Mantilla-Escalante et al., “Postprandial Circulating miRNAs in Response to a Dietary Fat Challenge,” Nutrients, vol. 11, no. 6, p. 1326, Jun. 2019. [CrossRef]
- X. Liu, W. Yuan, L. Yang, J. Li, and J. Cai, “miRNA Profiling of Exosomes from Spontaneous Hypertensive Rats Using Next-Generation Sequencing,” J Cardiovasc Transl Res, vol. 12, no. 1, pp. 75–83, Feb. 2019. [CrossRef]
- P.-C. Fan, C.-C. Chen, Y.-C. Chen, Y.-S. Chang, and P.-H. Chu, “MicroRNAs in acute kidney injury,” Hum Genomics, vol. 10, no. 1, p. 29, Dec. 2016. [CrossRef]
- J. Ji et al., “Mitochondria-related miR-141-3p contributes to mitochondrial dysfunction in HFD-induced obesity by inhibiting PTEN,” Sci Rep, vol. 5, Nov. 2015. [CrossRef]
- Q. Ren, S. Yu, H. Zeng, and H. Xia, “The role of PTEN in puromycin aminonucleoside-induced podocyte injury,” Int J Med Sci, vol. 19, no. 9, pp. 1451–1459, 2022. [CrossRef]
- Y. Shi et al., “Downregulation of PTEN promotes podocyte endocytosis of lipids aggravating obesity-related glomerulopathy,” American Journal of Physiology-Renal Physiology, vol. 318, no. 3, pp. F589–F599, Mar. 2020. [CrossRef]
- A. E. Rodríguez-Rodríguez et al., “Iohexol plasma clearance simplified by Dried Blood Spot (DBS) sampling to measure renal function in conscious mice,” Sci Rep, vol. 11, no. 1, p. 4591, Feb. 2021. [CrossRef]
- P. Bankhead et al., “QuPath: Open source software for digital pathology image analysis,” Sci Rep, vol. 7, no. 1, Dec. 2017. [CrossRef]
- I. S. Vlachos et al., “DIANA-miRPath v3.0: Deciphering microRNA function with experimental support,” Nucleic Acids Res, vol. 43, no. W1, pp. W460–W466, 2015. [CrossRef]
- I. S. Vlachos et al., “DIANA-TarBase v7.0: Indexing more than half a million experimentally supported miRNA:mRNA interactions,” Nucleic Acids Res, vol. 43, no. D1, pp. D153–D159, Jan. 2015. [CrossRef]
- F. Supek, M. Bošnjak, N. Škunca, and T. Šmuc, “Revigo summarizes and visualizes long lists of gene ontology terms,” PLoS One, vol. 6, no. 7, 2011. [CrossRef]
- K. J. Livak and T. D. Schmittgen, “Analysis of relative gene expression data using real-time quantitative PCR and the 2-ΔΔCT method,” Methods, vol. 25, no. 4, pp. 402–408, 2001. [CrossRef]
Figure 1.
Comparison of rats’ weight evolution during the 10-week follow-up. The standard-diet group is represented in orange, and the high-fat diet group in green. * p<0.05.
Figure 1.
Comparison of rats’ weight evolution during the 10-week follow-up. The standard-diet group is represented in orange, and the high-fat diet group in green. * p<0.05.
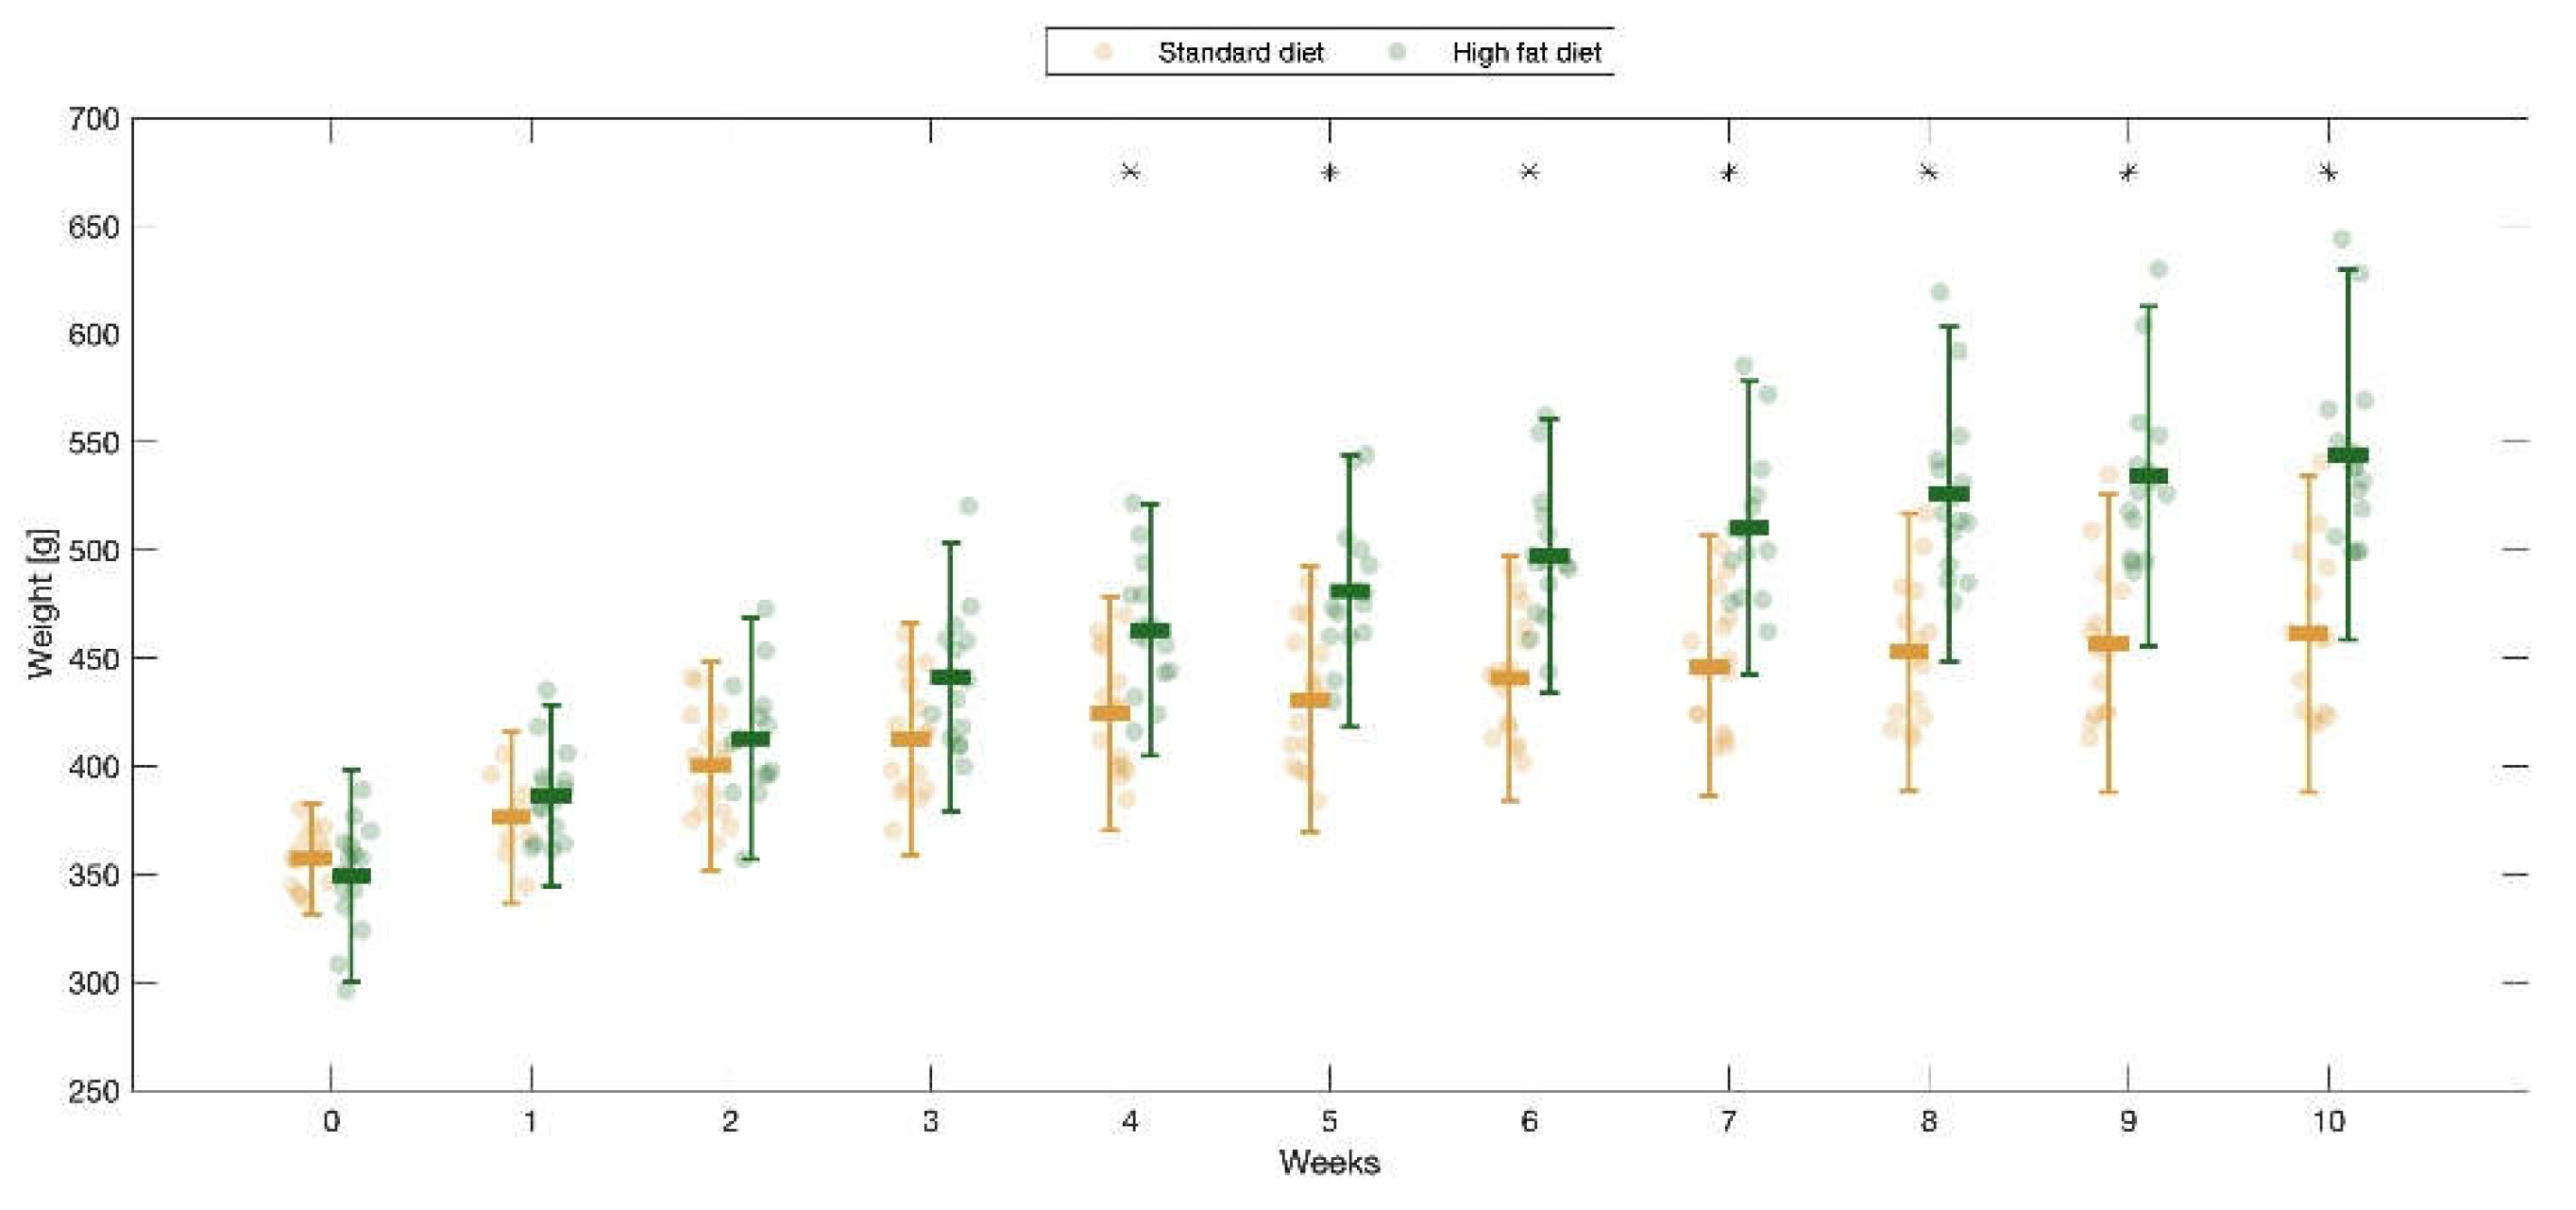
Figure 2.
a) Glomerulus with global mesangial matrix increase (PAS stain, original magnification x400). b) Glomerulus with mesangial cell proliferation (H&E stain, original magnification x400). c) Tuft glomerular area from a rat fed a SD (PAS stain, original magnification x400). d) Enlarged tuft glomerular area from a rat fed a HFD (PAS stain, original magnification x400). e) Podocyte hypertrophy with increased cytoplasm and prominent nucleolus (black arrows) (Masson trichrome stain, original magnification x1000). f) Podocyte hypertrophy with nuclear enlargement (black arrow) (H&E stain, original magnification x1000). g) Increased intracytoplasmic resorption droplets (black arrow) in proximal tubular cells from an obese rat fed a HFD (PAS stain, original magnification x400). h) Transmission electron microscopy showing swelling of the podocytes which are hyperplastic, occupying the urinary space (uranyl acetate and lead citrate stain, original magnification x5000); i) Podocyte cytoplasm showing empty spaces compatible with lipid vacuoles (uranyl acetate and lead citrate stain, original magnification x6000). j) Podocyte showing a slight increase in cytoplasmic organelles, specially megamitochondria (uranyl acetate and lead citrate stain, original magnification x10000). PAS: periodic acid–Schiff; H&E: hematoxylin and eosin; SD: standard diet; HFD: high fat diet.
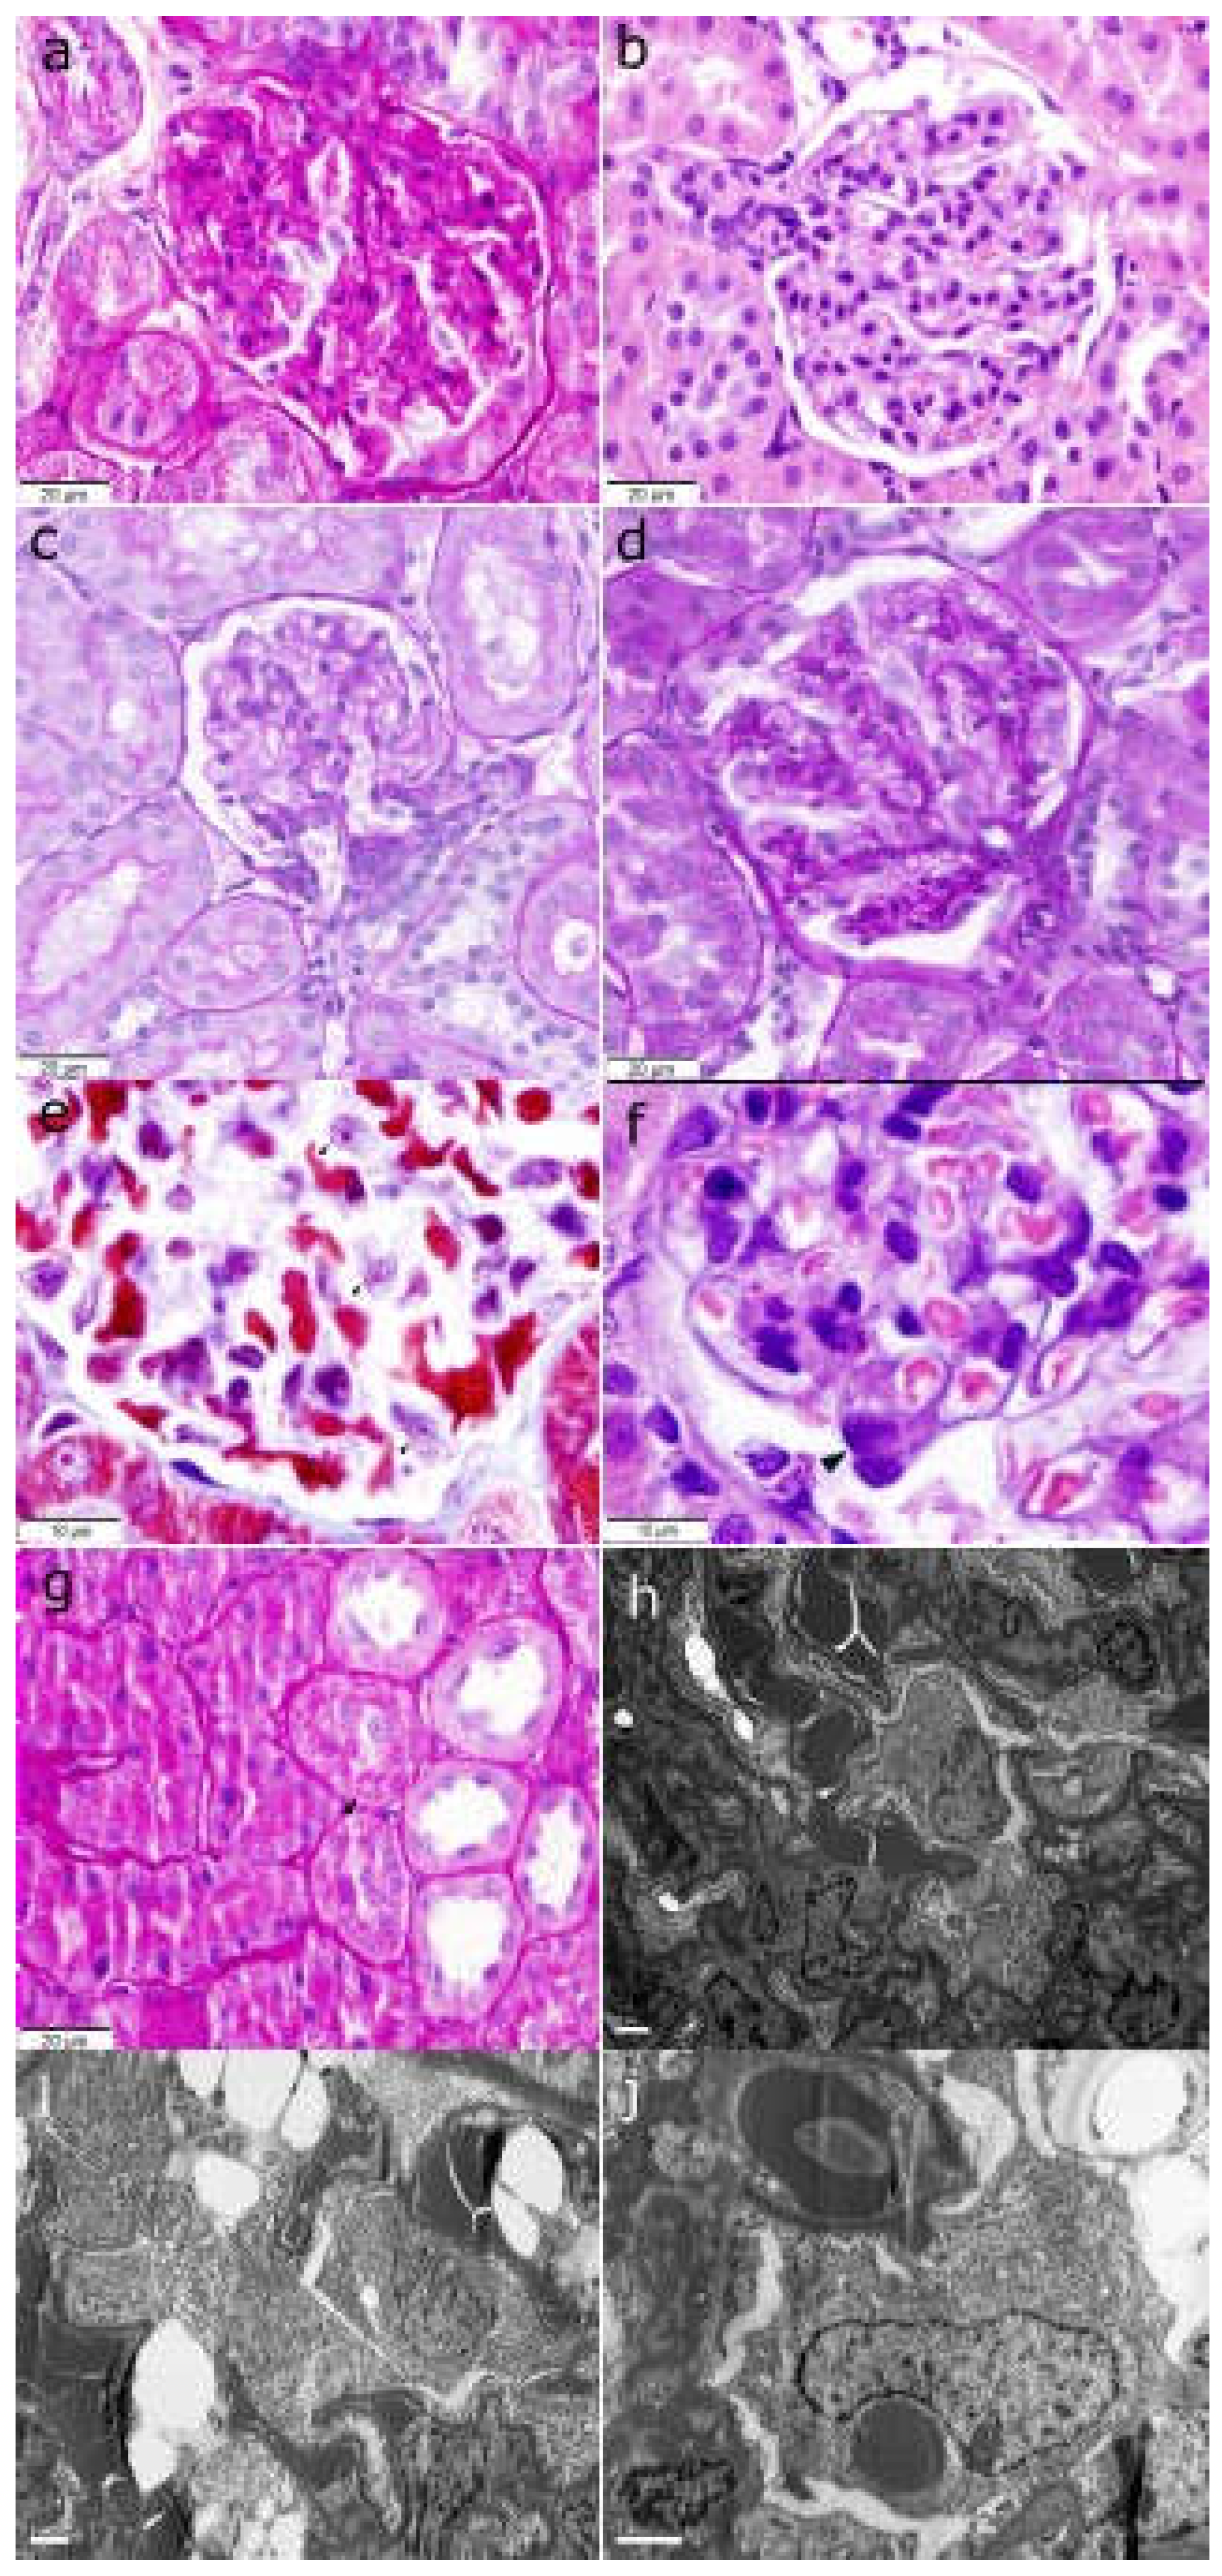
Figure 3.
Podocyte density. This figure shows two distinct examples illustrating low (a) and high (b) podocyte density, assessed through immunohistochemical staining for WT1 and quantified using QuPath. Yellow annotations were used to delineate the glomerular region of interest, where the ‘Positive cell detection’ tool was applied. Blue annotations indicate the count of negative cells, while red annotations highlight positive cells.
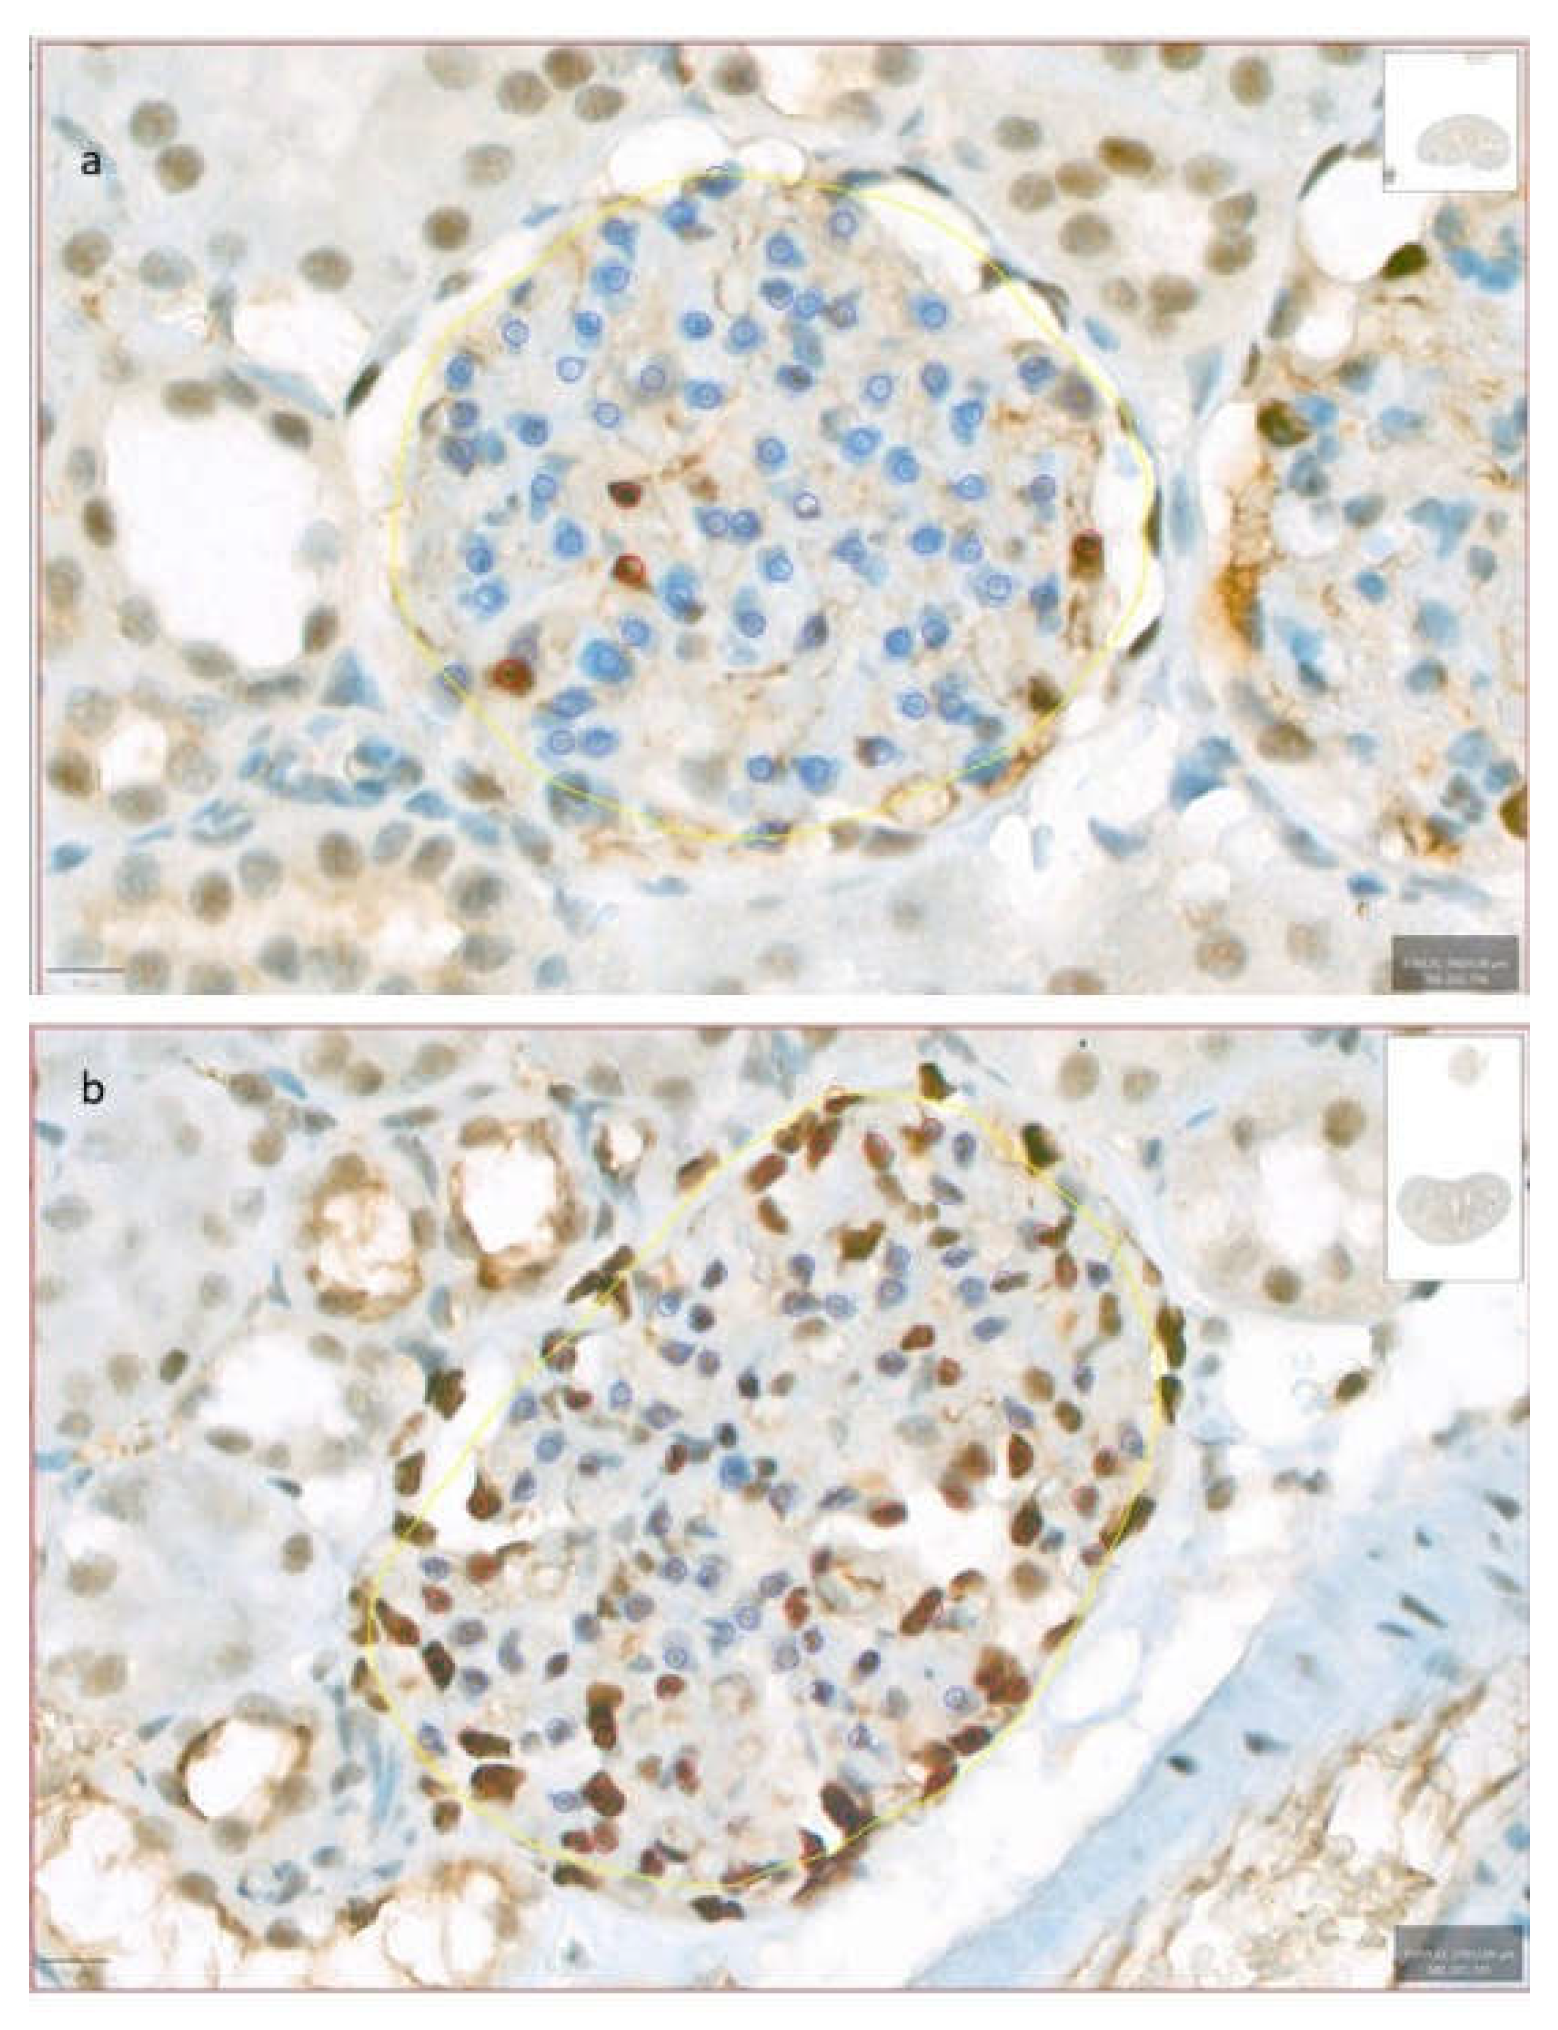
Figure 4.
Transcriptomic changes and validation of differentially expressed RNAs. a-c) Samples were studied sorted by diet. a) Heatmap comparing the expression profiles of all sequenced genes among SD and HFD rats. As can be seen, samples of both groups show a very similar gene expression profile. b) Heatmap of over and underrepresented groups of genes (red and blue respectively) that clearly discriminate samples among groups. Some of these genes were selected for subsequent studies. Results are given as number of reads per gene. c) Validation of the differentially expressed genes in 30 rat kidneys (15 SD vs 15 HFD) by qPCR. Results are calculated as index and given in arbitrary units. HFD rat values are shown in dark grey bars, SD rat values in light grey bars. D) Heatmap of differentially expressed genes based on kidney lesions. * indicates P <0.05; ** P <0.01; *** P <0.001, unpaired Student T-test. PH: podocyte hypertrophy; IMM: increased mesangial matrix; SD: standard diet; HFD: high fat diet.
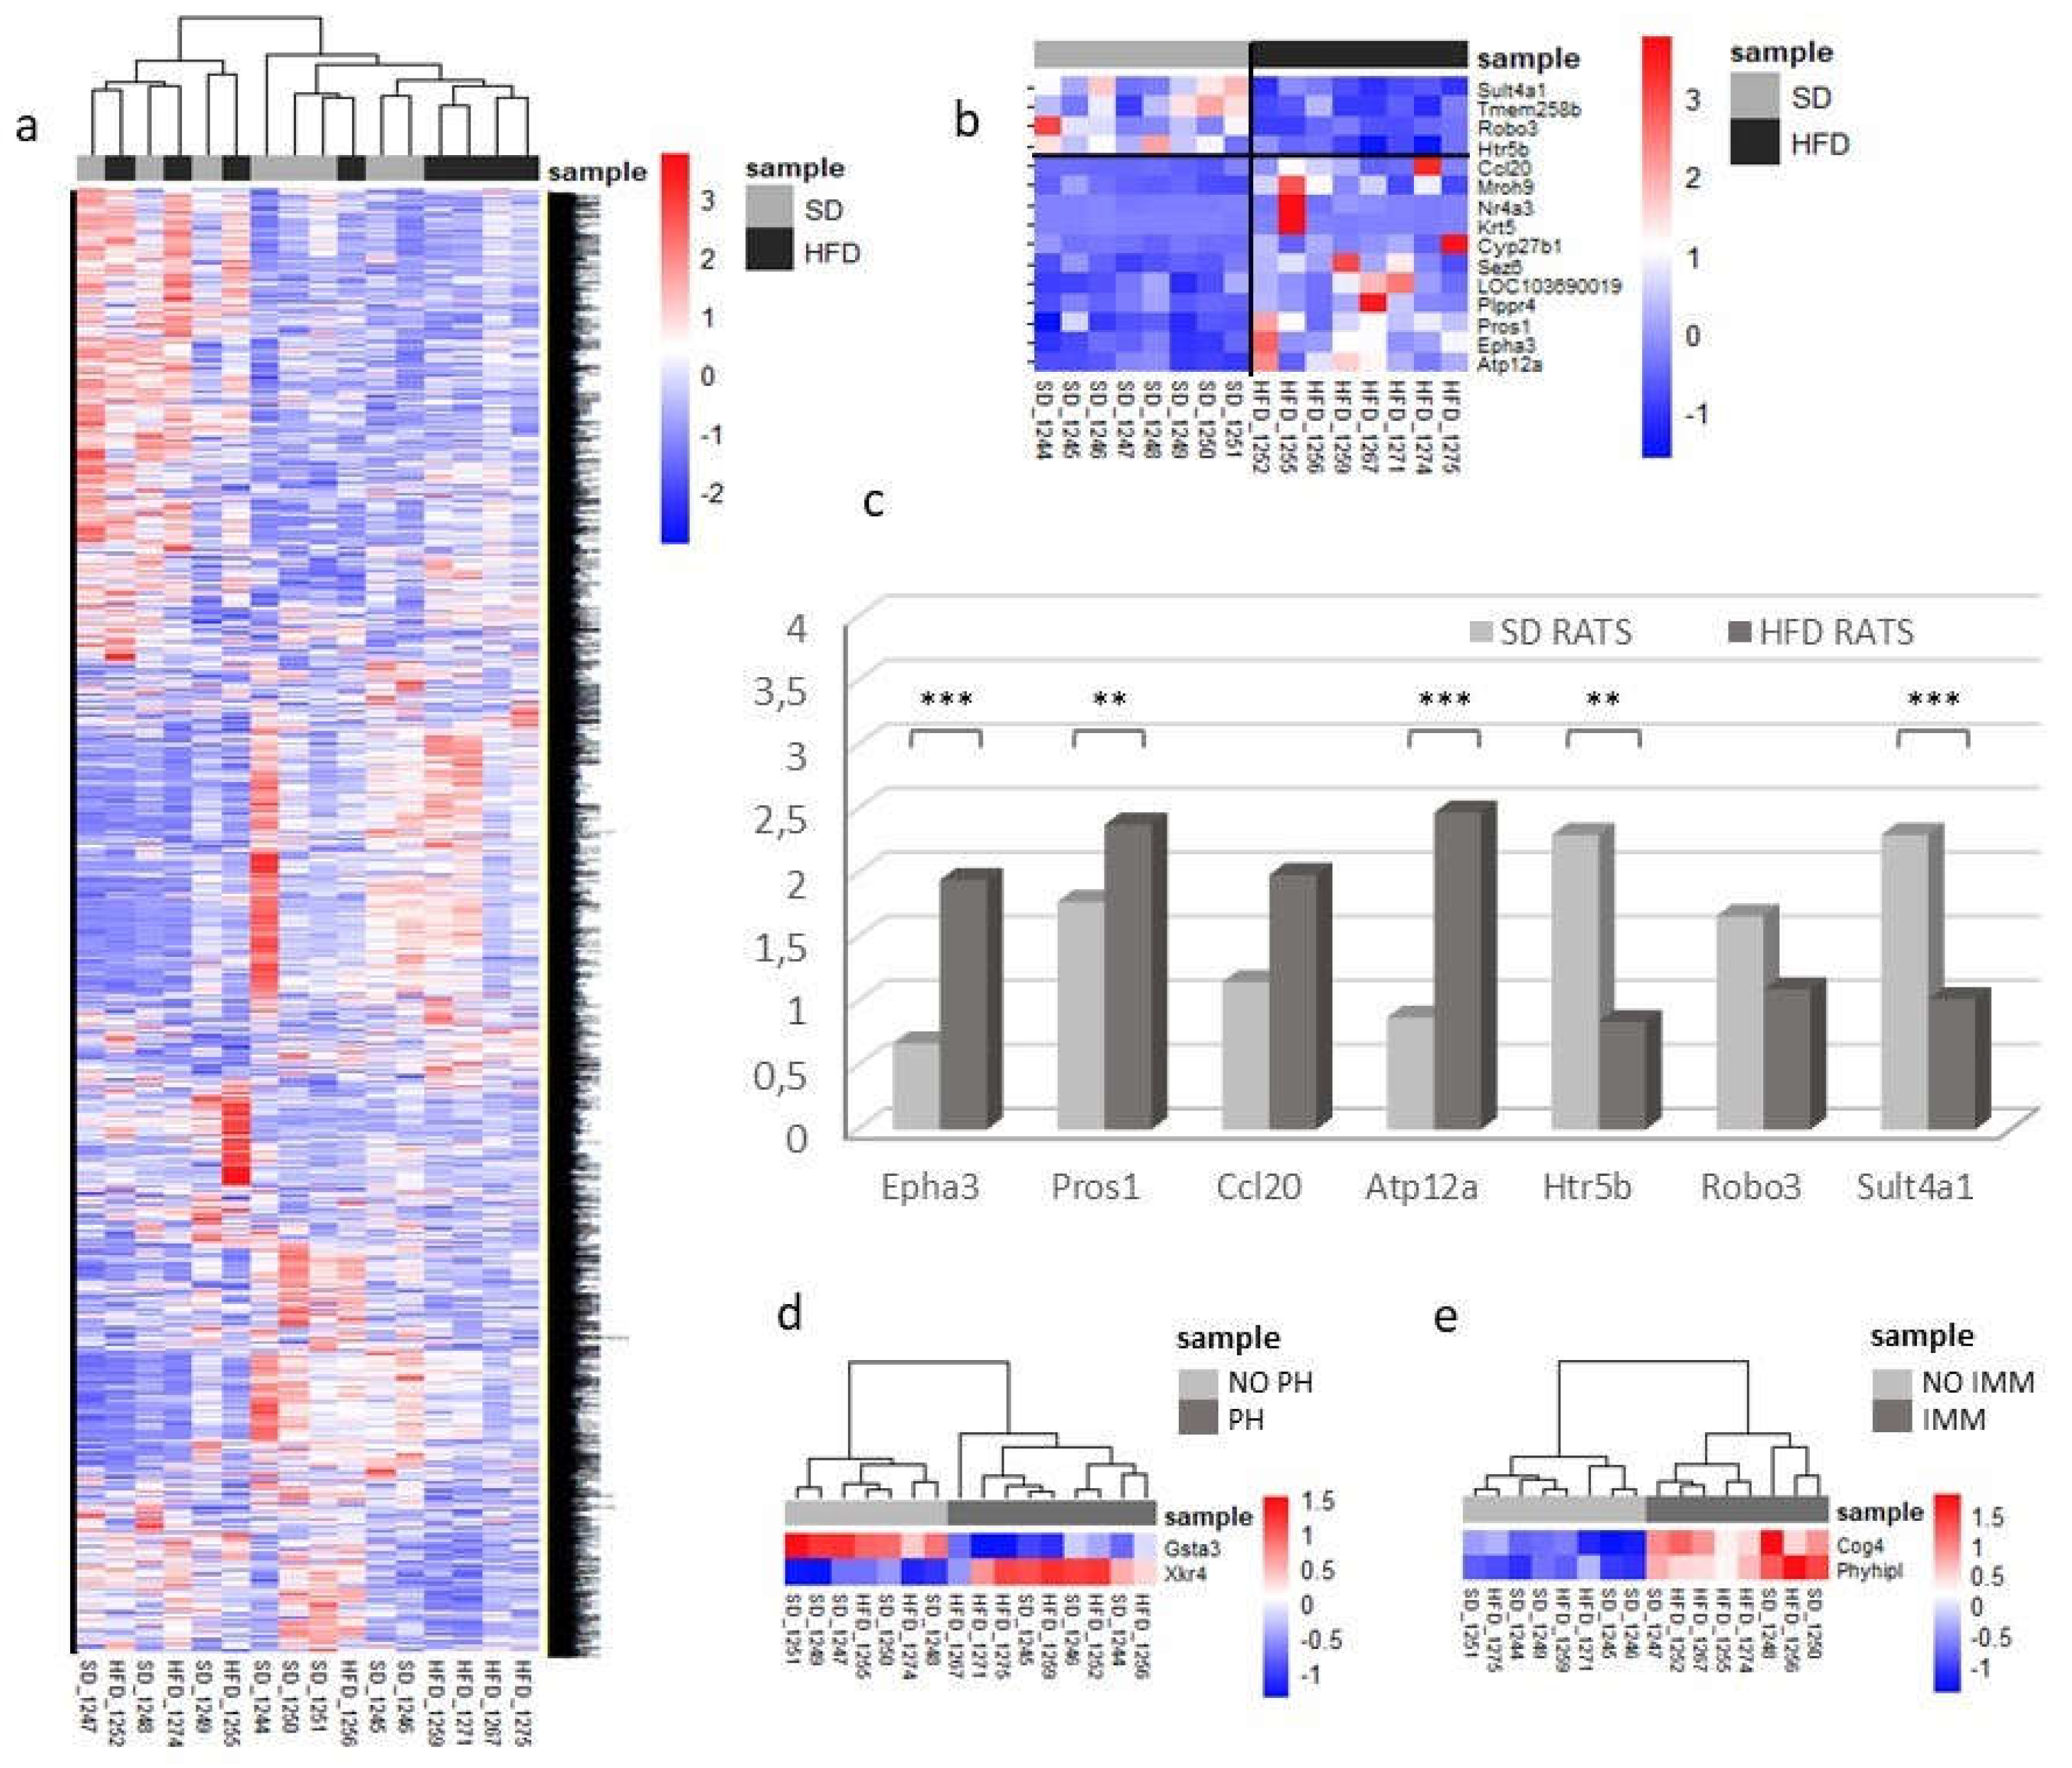
Figure 5.
Transcriptomic changes and validation of differentially expressed miRNAs in kidney tissue. a-d) Samples were studied sorted by diet. a) Heatmap comparing the expression profiles of all sequenced smallRNA genes among SD and HFD rats. b) Volcano plot showing that samples of both groups showed a very similar gene expression profile but some underrepresented smallRNA genes can be observed in the HFD group. c) Heatmap of over- and underrepresented groups of interesting genes. Some miRNA were selected for subsequent studies. d) qPCR validation of miRNAs found to be differentially expressed in miRNA-Seq experiments. miR-411-5p was included as a miRNA that doesn’t change its expression (in red colour). HFD rat values are shown in dark grey bars, SD rat values in light grey bars. * P <0.05 and **P <0.01, unpaired Student T-test. e) Table categorizing validated miRNA-mRNA interactions based on involvement with multiple miRNAs. SD: standard diet; HFD: high fat diet; miRNA: microRNA; qPCR: quantitative polymerase chain reaction.
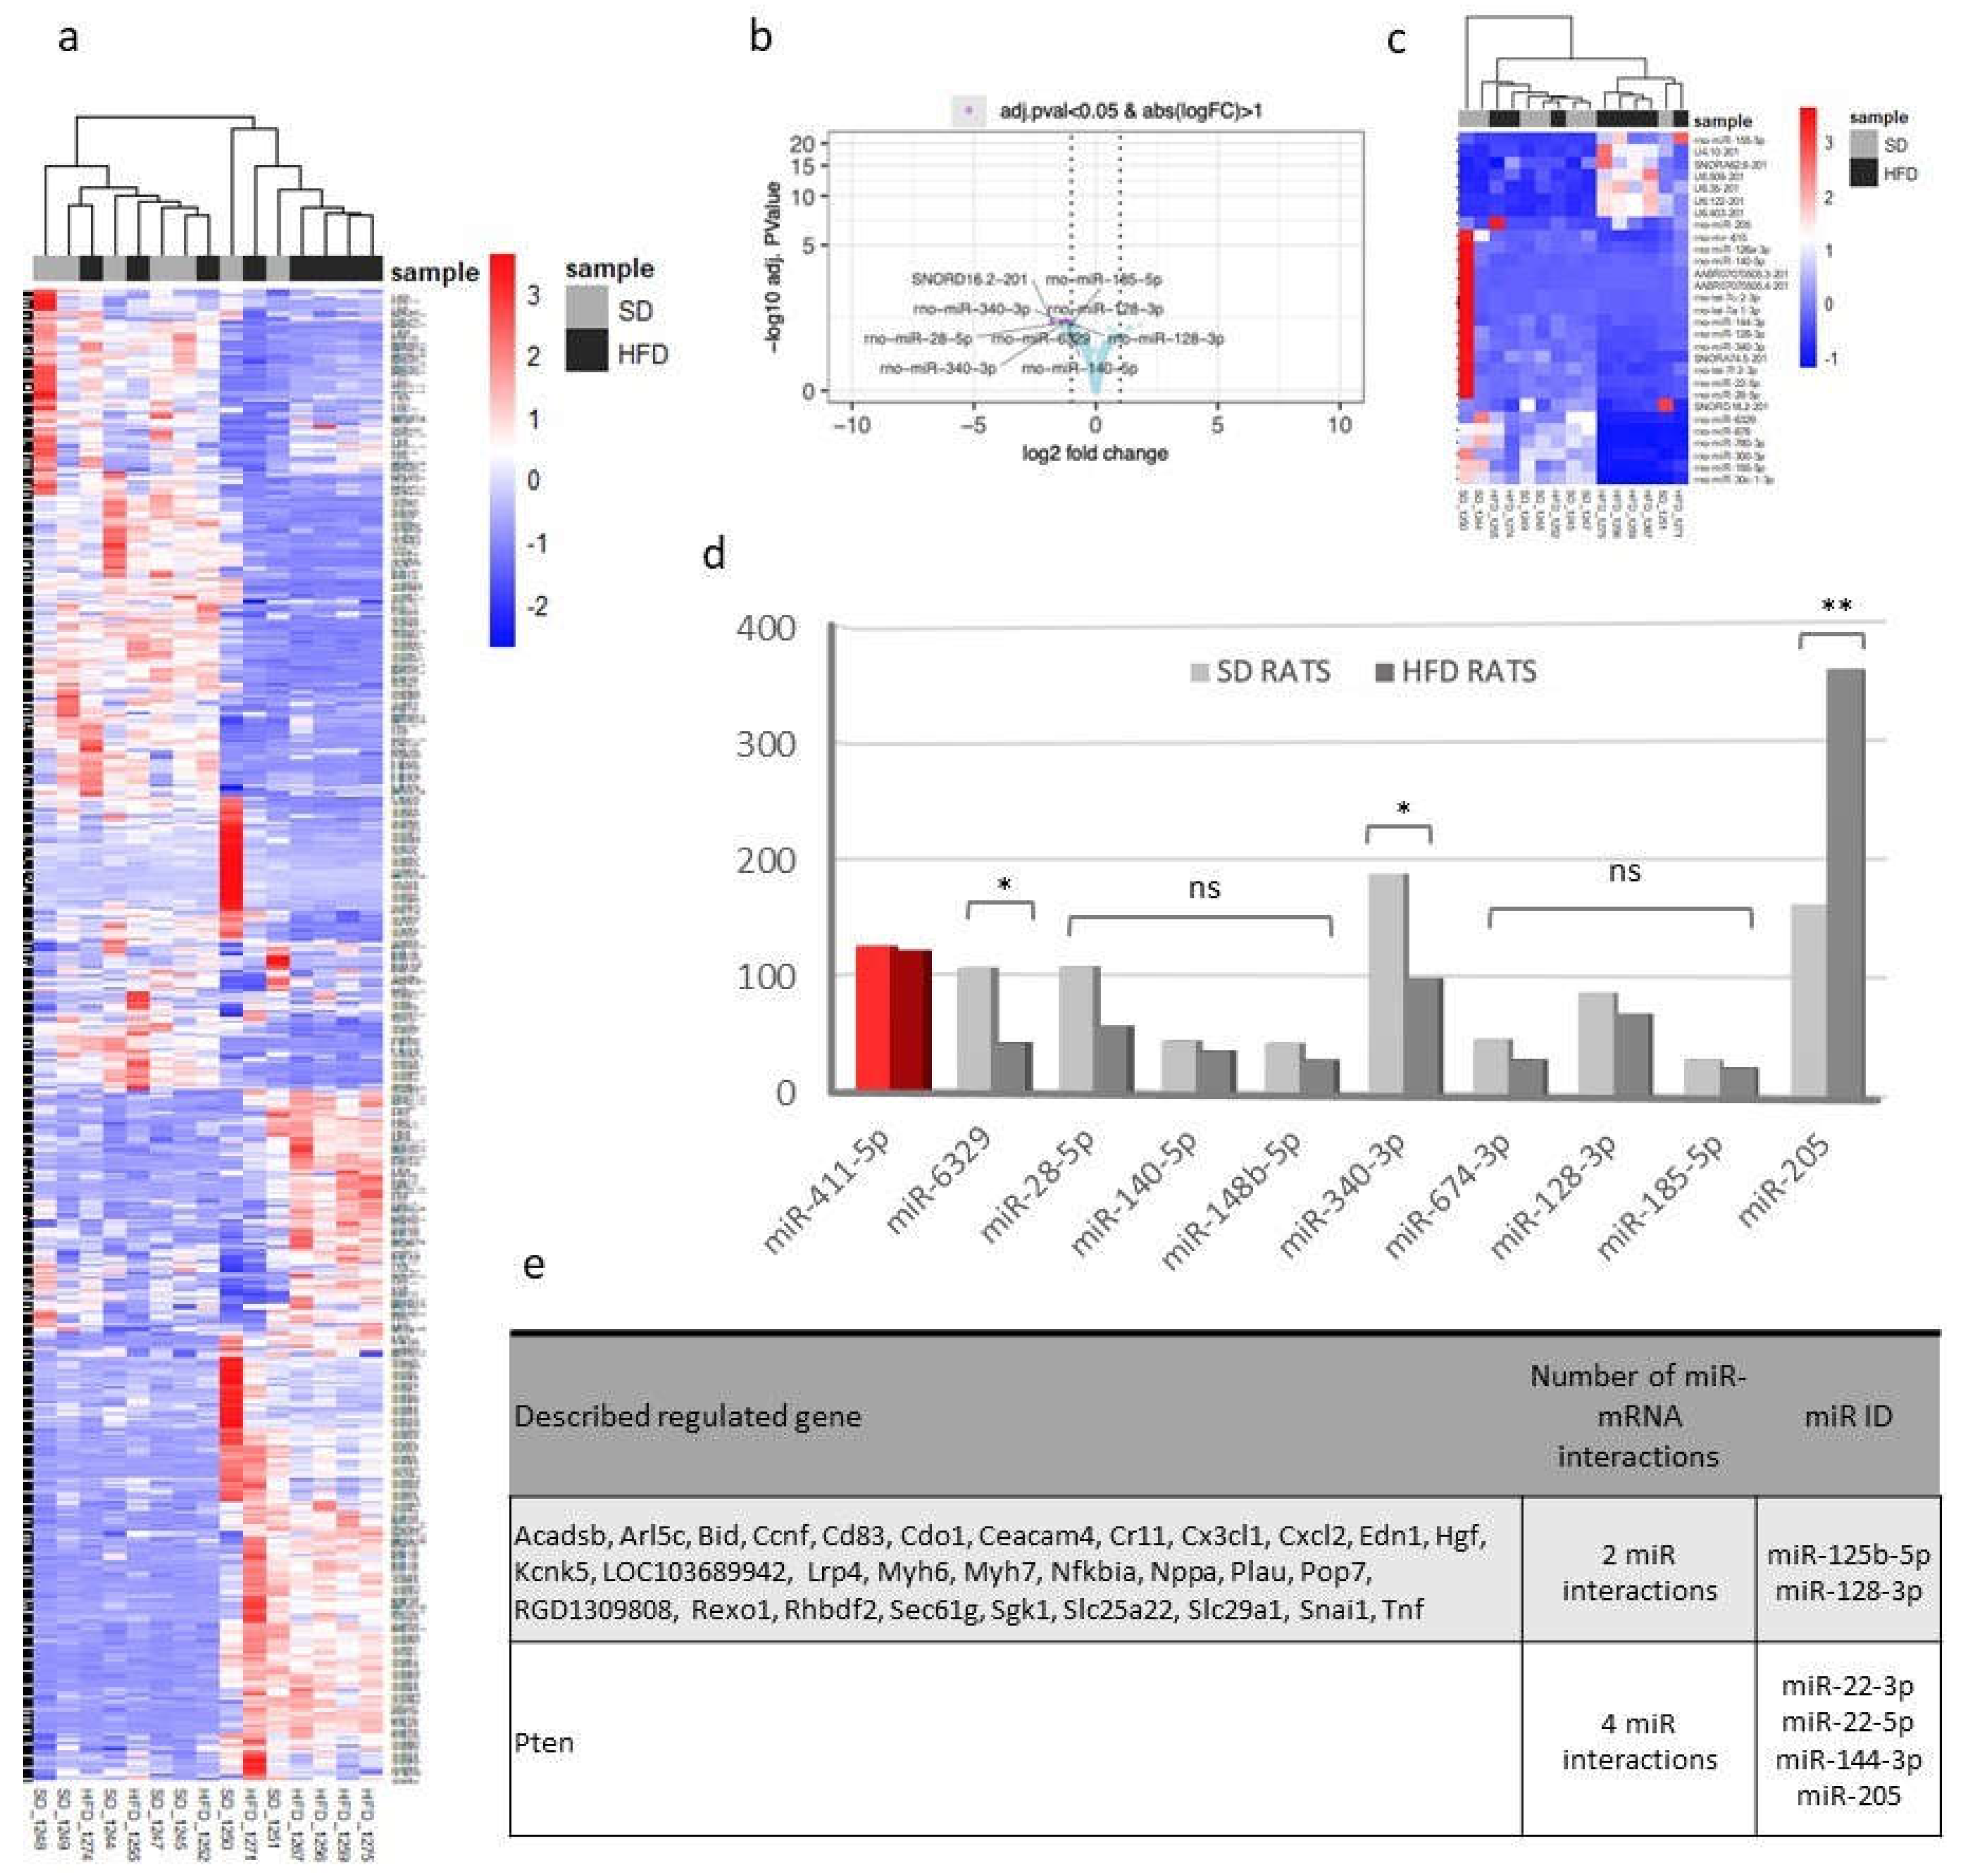
Figure 6.
Double immunofluorescence staining for PTEN (green) and nephrin (red) was performed on kidney tissue from an SD-fed rat (a-b) and an HFD-fed rat (c-d). The images depict a higher PTEN/nephrin ratio in the SD-fed rat.
Figure 6.
Double immunofluorescence staining for PTEN (green) and nephrin (red) was performed on kidney tissue from an SD-fed rat (a-b) and an HFD-fed rat (c-d). The images depict a higher PTEN/nephrin ratio in the SD-fed rat.
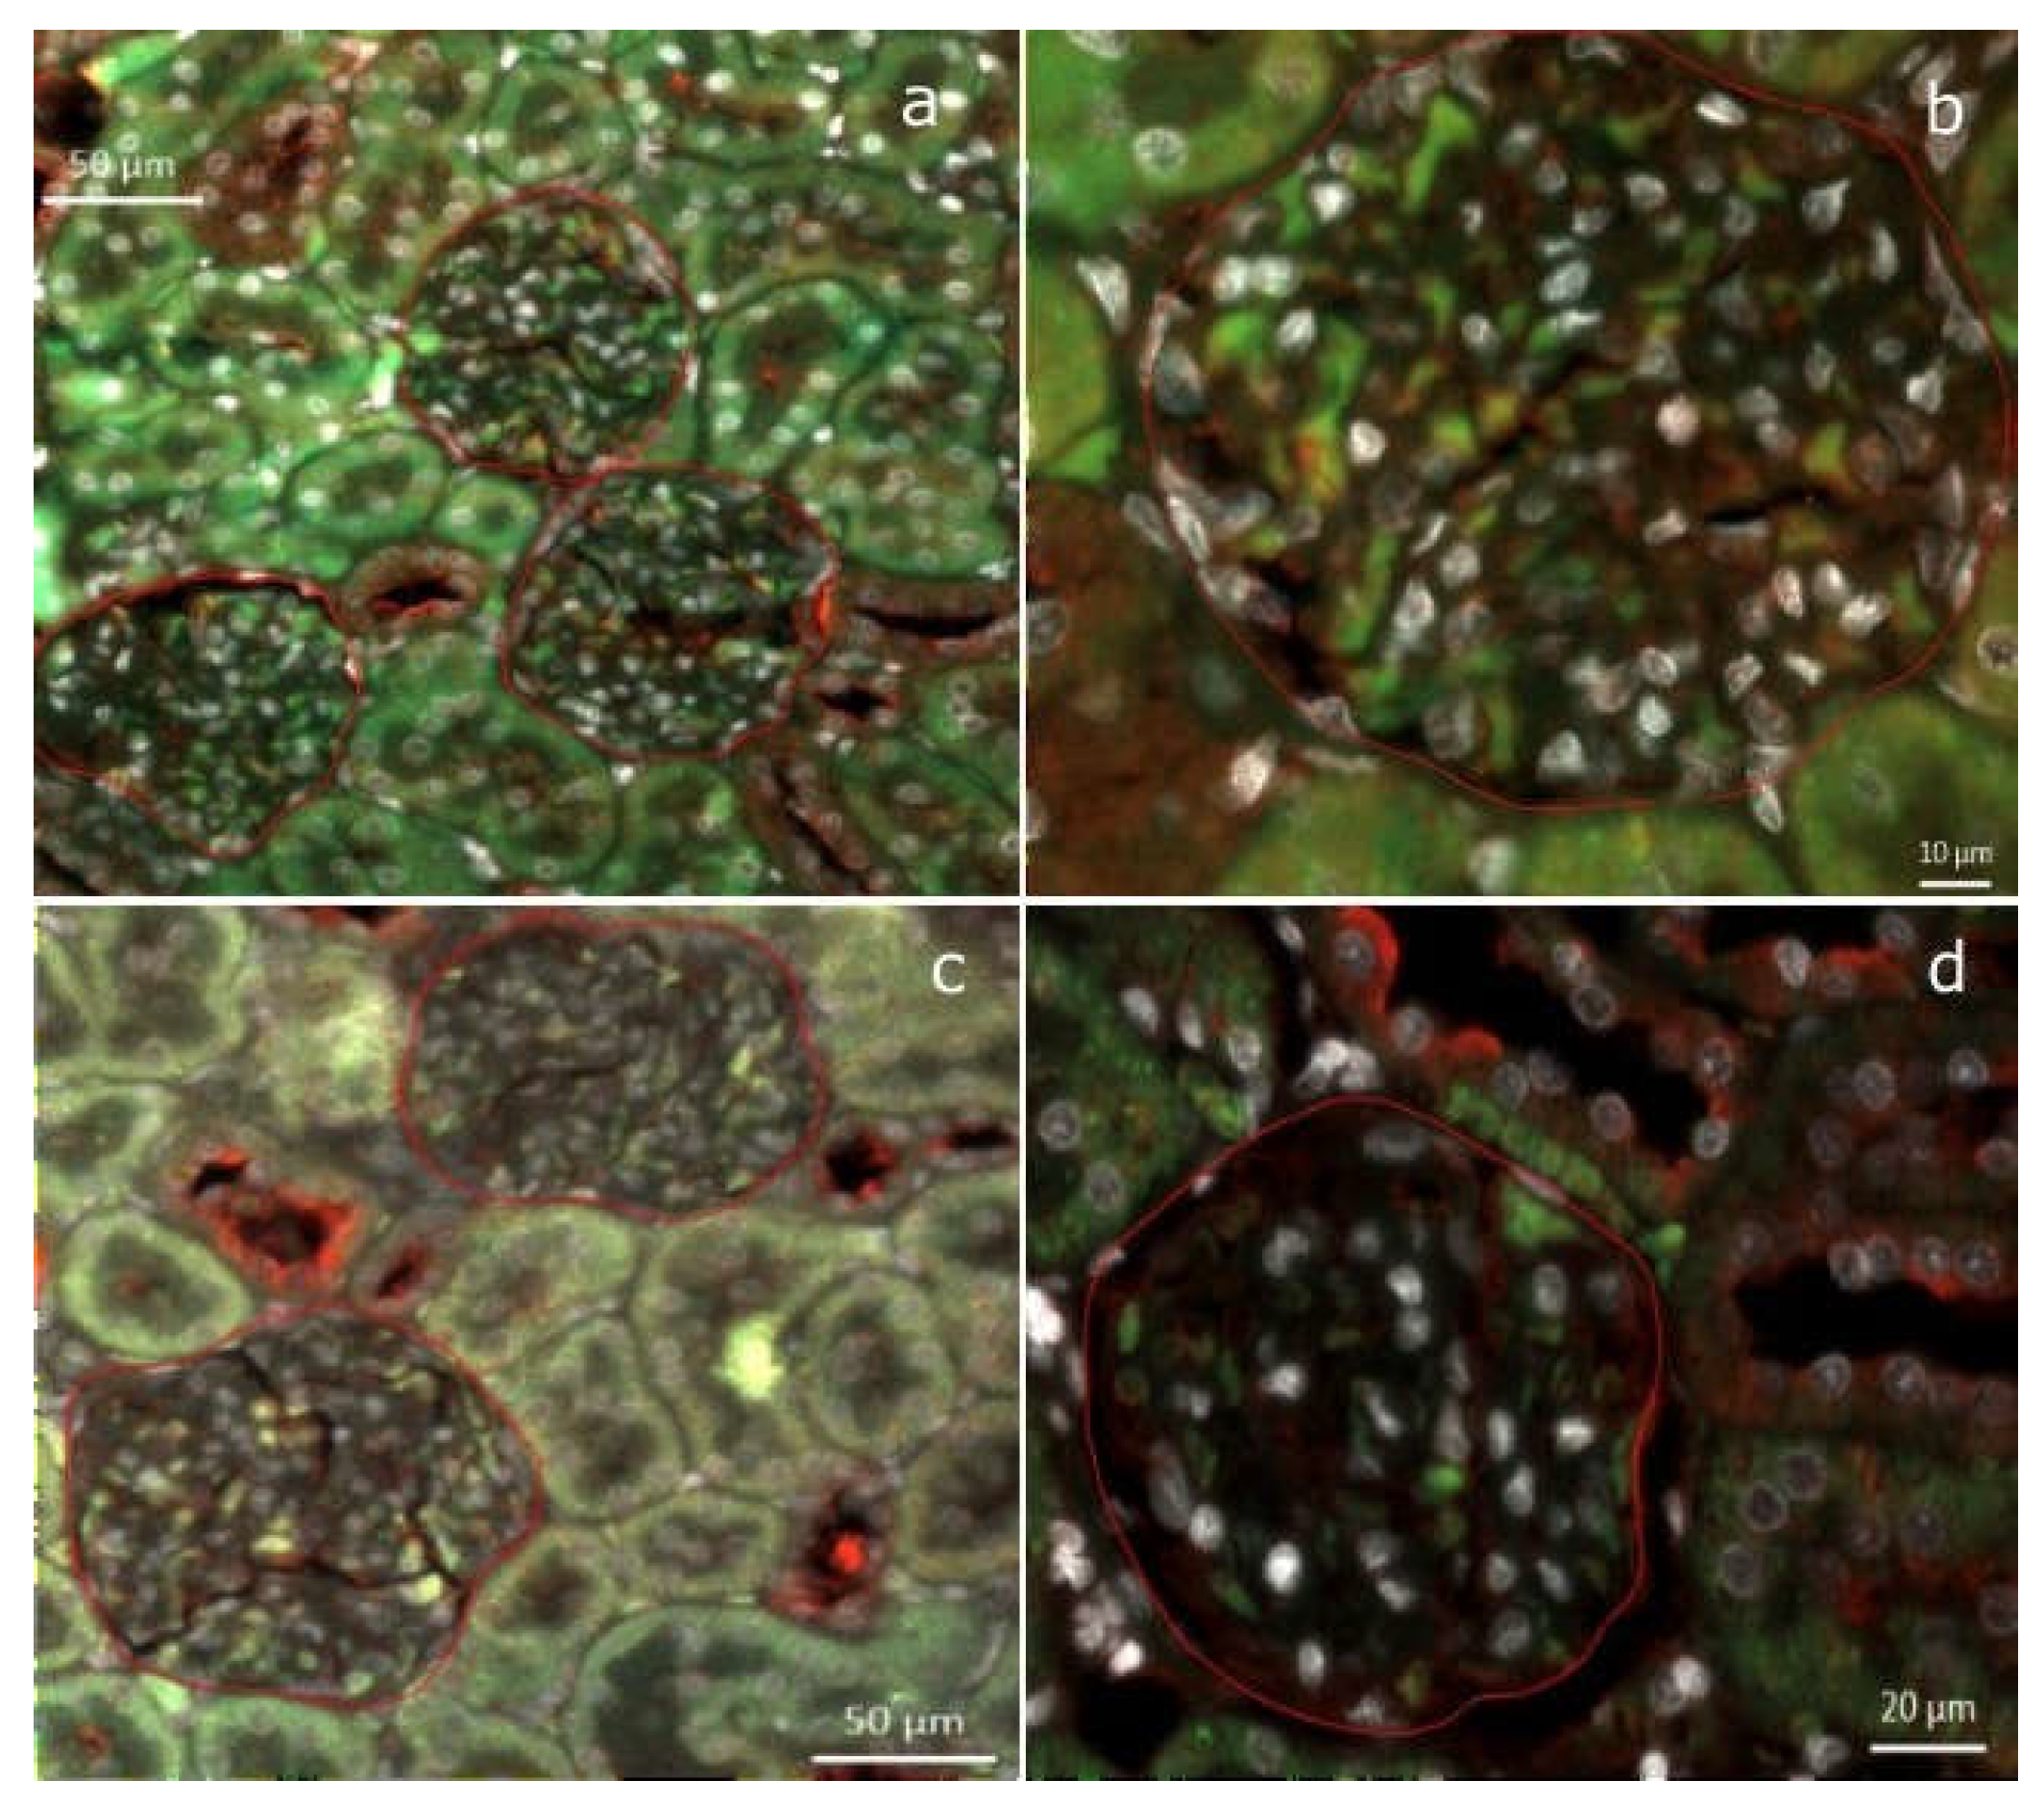
Figure 7.
Transcriptomic changes of lesion-related miRNAs in kidney tissue. Scatter-plots showing expression of the first 6 genes correlating significantly with MMI (left) and PH (right). The figures are classified in ascending order of p_value (the gene on the top left being the gene with the lowest p_value). The points correspond to each individual data. MMI: mesangial matrix increase; PH: podocyte hypertrophy.
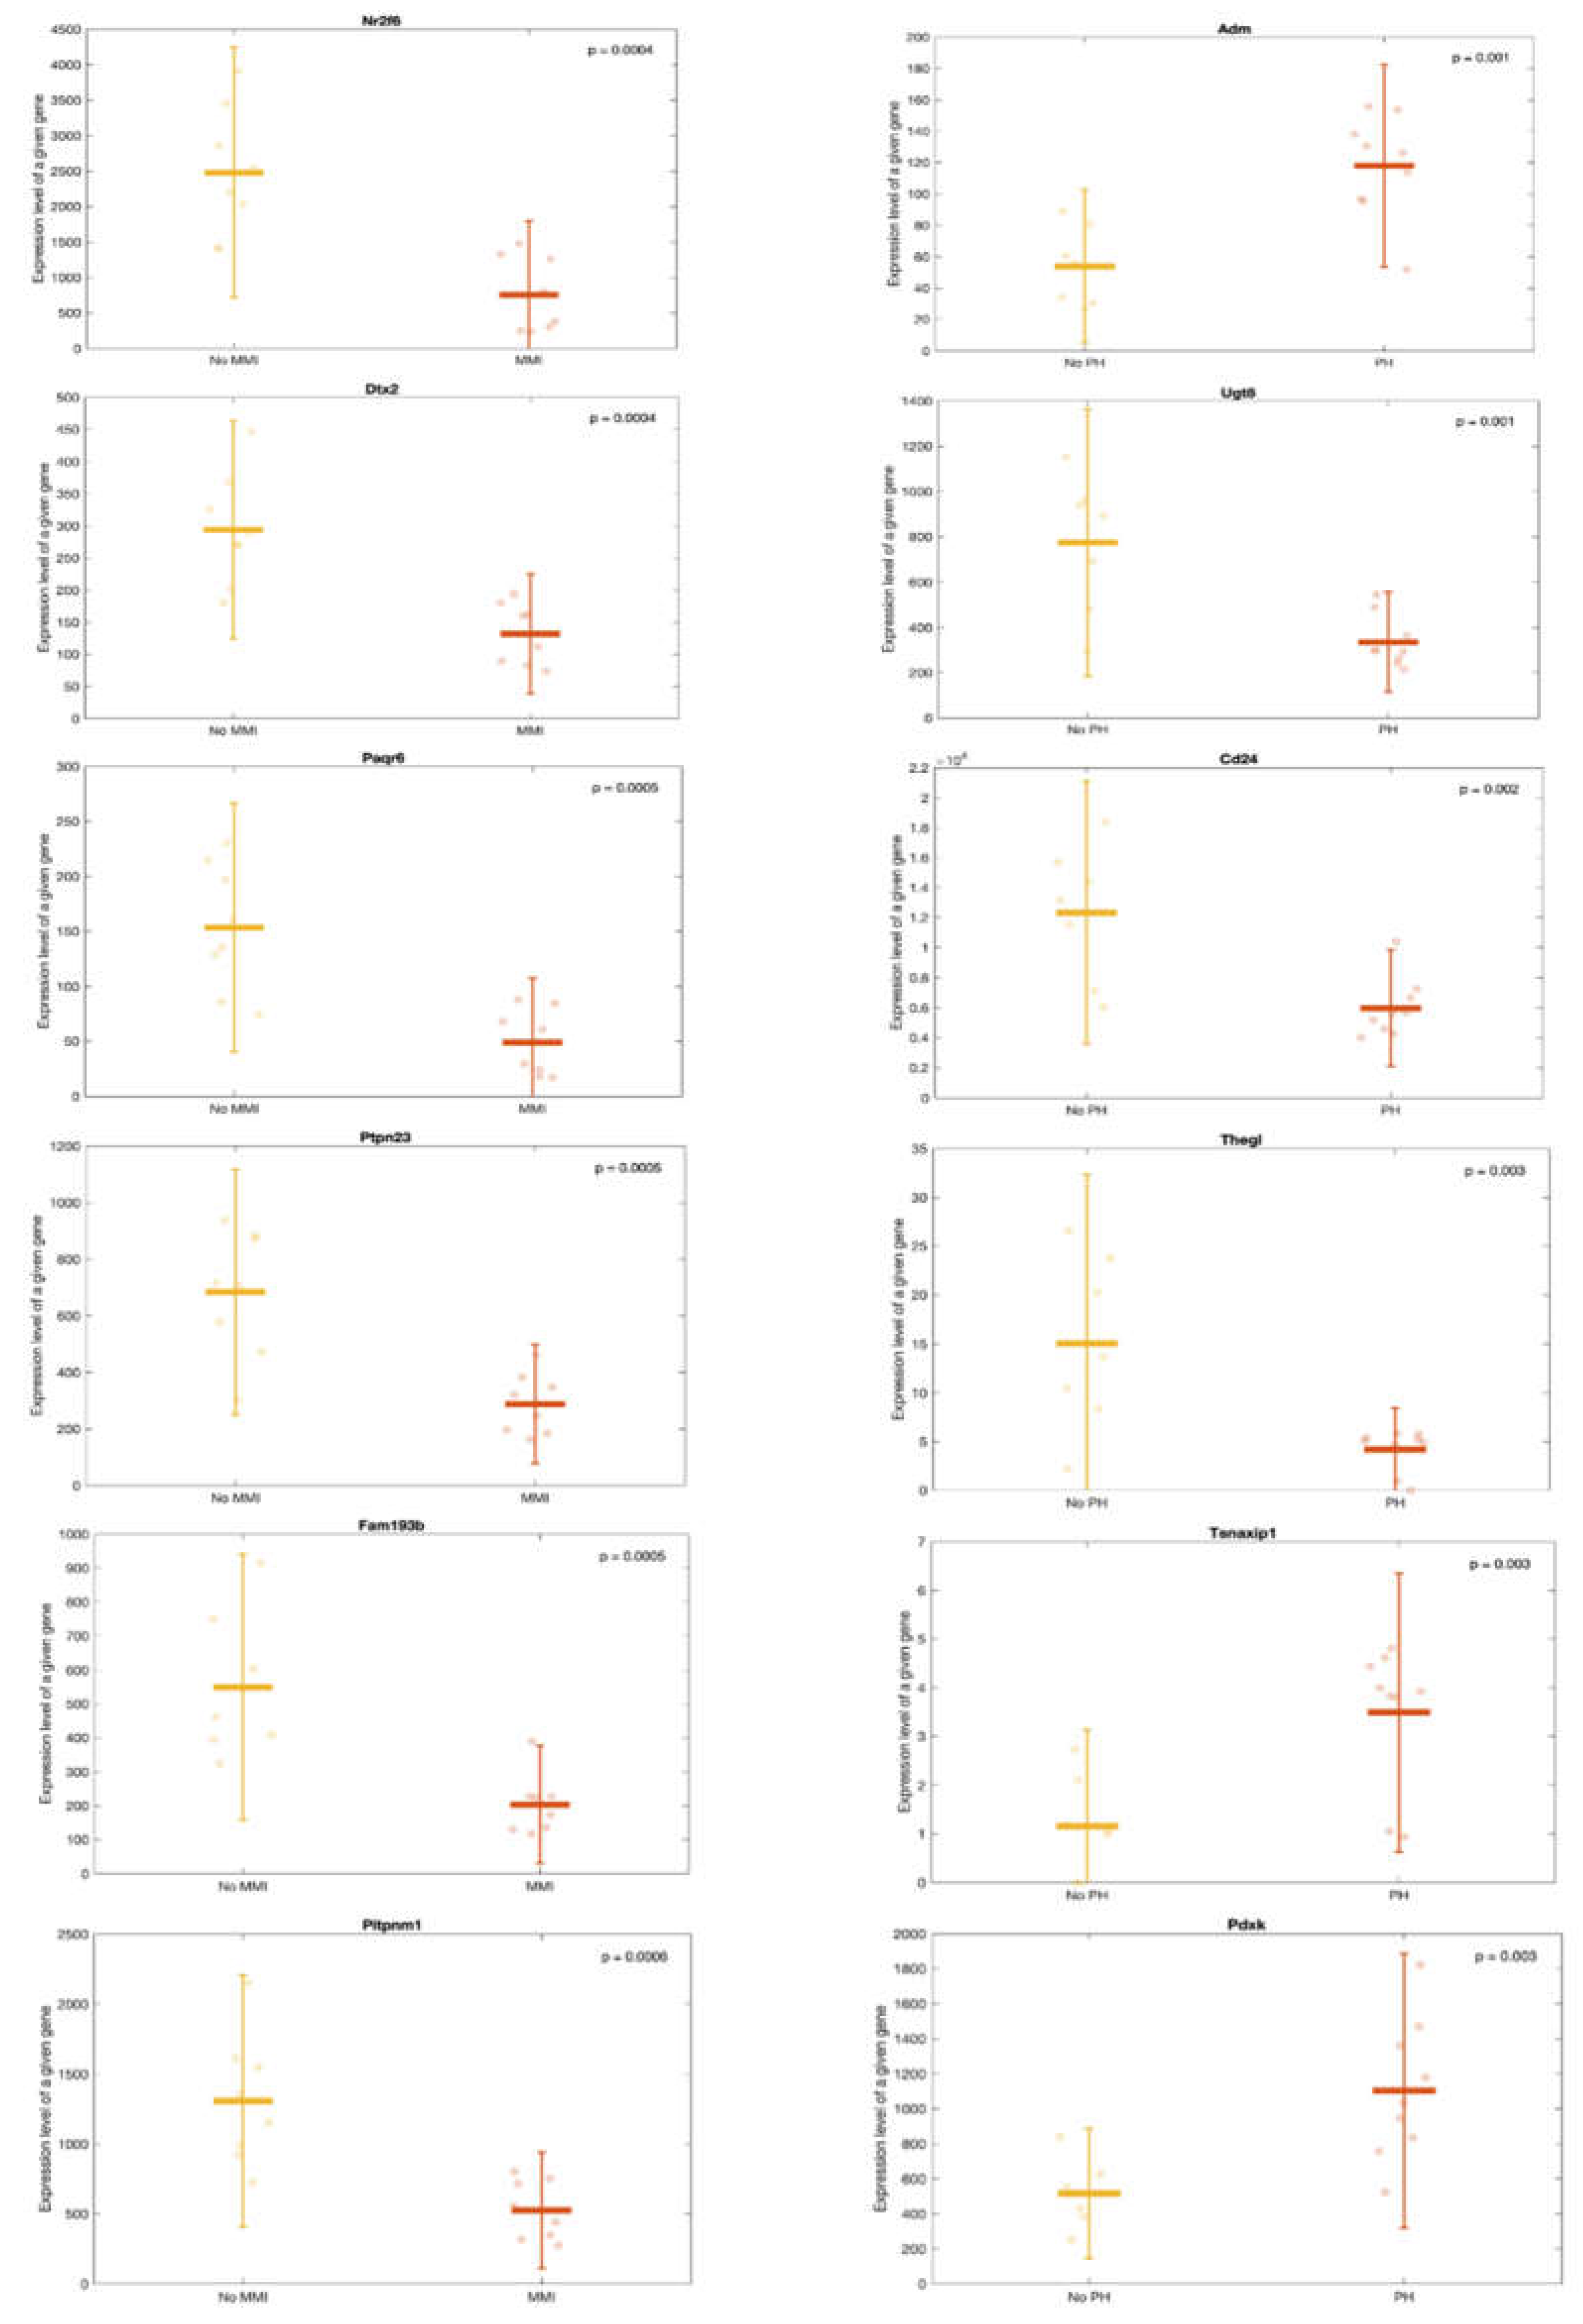
Figure 8.
Heatmap representing transcriptomic changes of differentially expressed miRNAs in urine samples sorted by diet.
Figure 8.
Heatmap representing transcriptomic changes of differentially expressed miRNAs in urine samples sorted by diet.
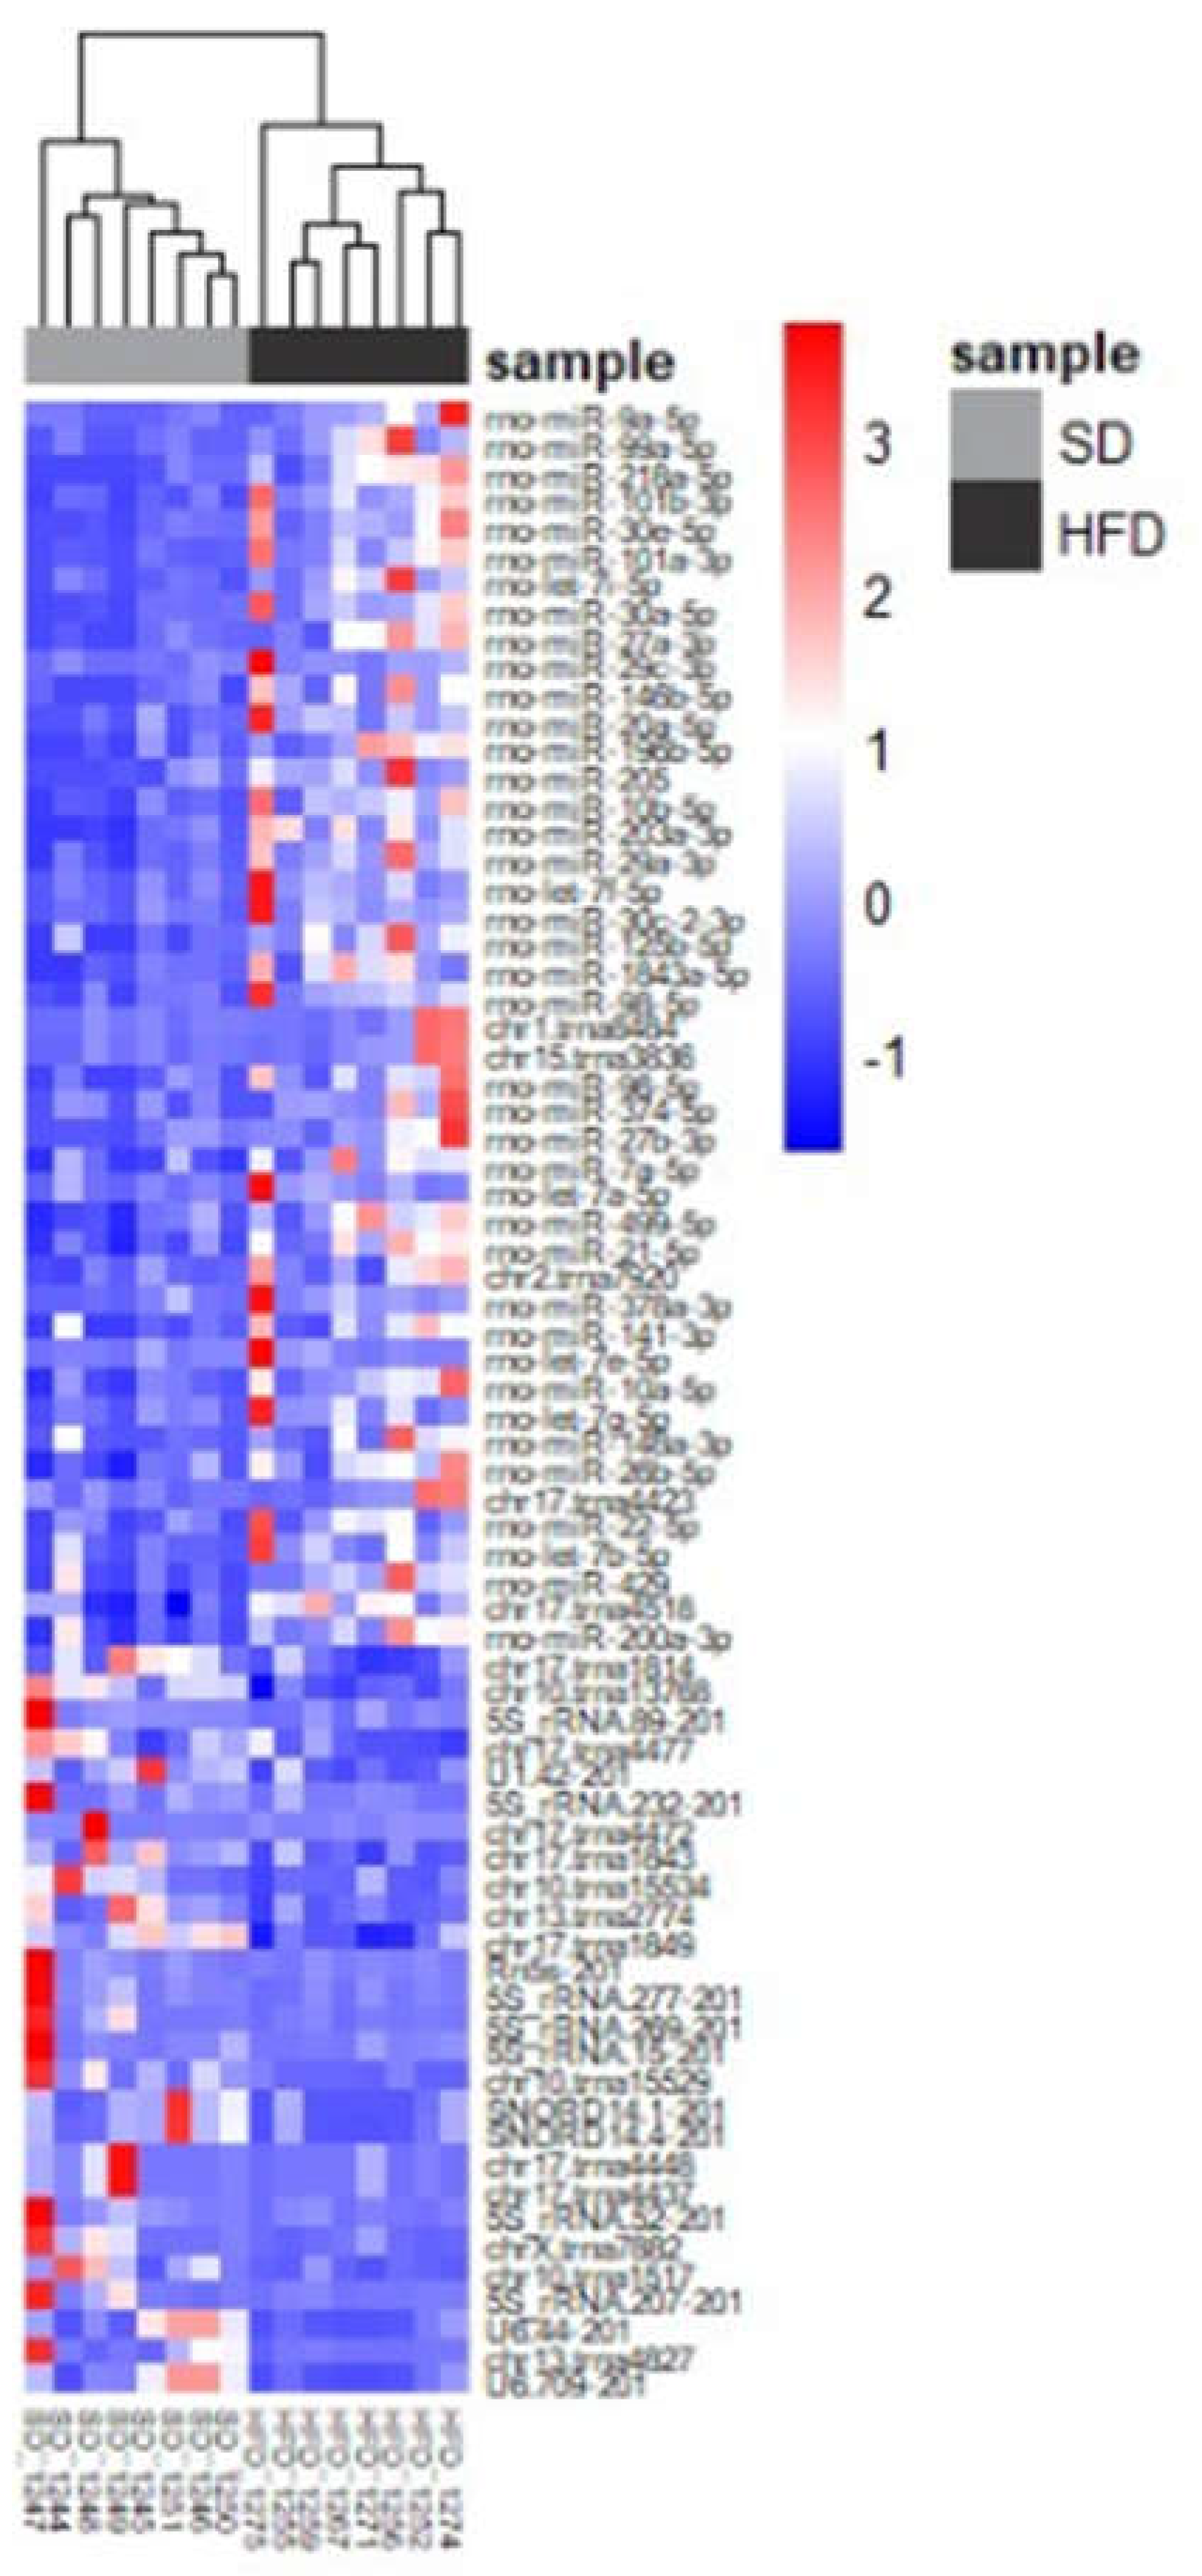
Figure 9.
Transcriptomic changes and validation of differentially expressed miRNAs in urine samples sorted by diet. a) Table of the main validated interactions miRNA-mRNA reported. b) qPCR validation of selected miRNA found to be differentially expressed in miR-Seq experiments. miR-181b-5p was included as a miRNA that doesn’t change its expression (in red colour). HFD rat values are shown in dark grey bars; SD rat values in light grey bars * P <0.05, unpaired Student T-test; “ns” non-significant. SD: standard diet; HFD: high fat diet; qPCR: quantitative polymerase chain reaction.
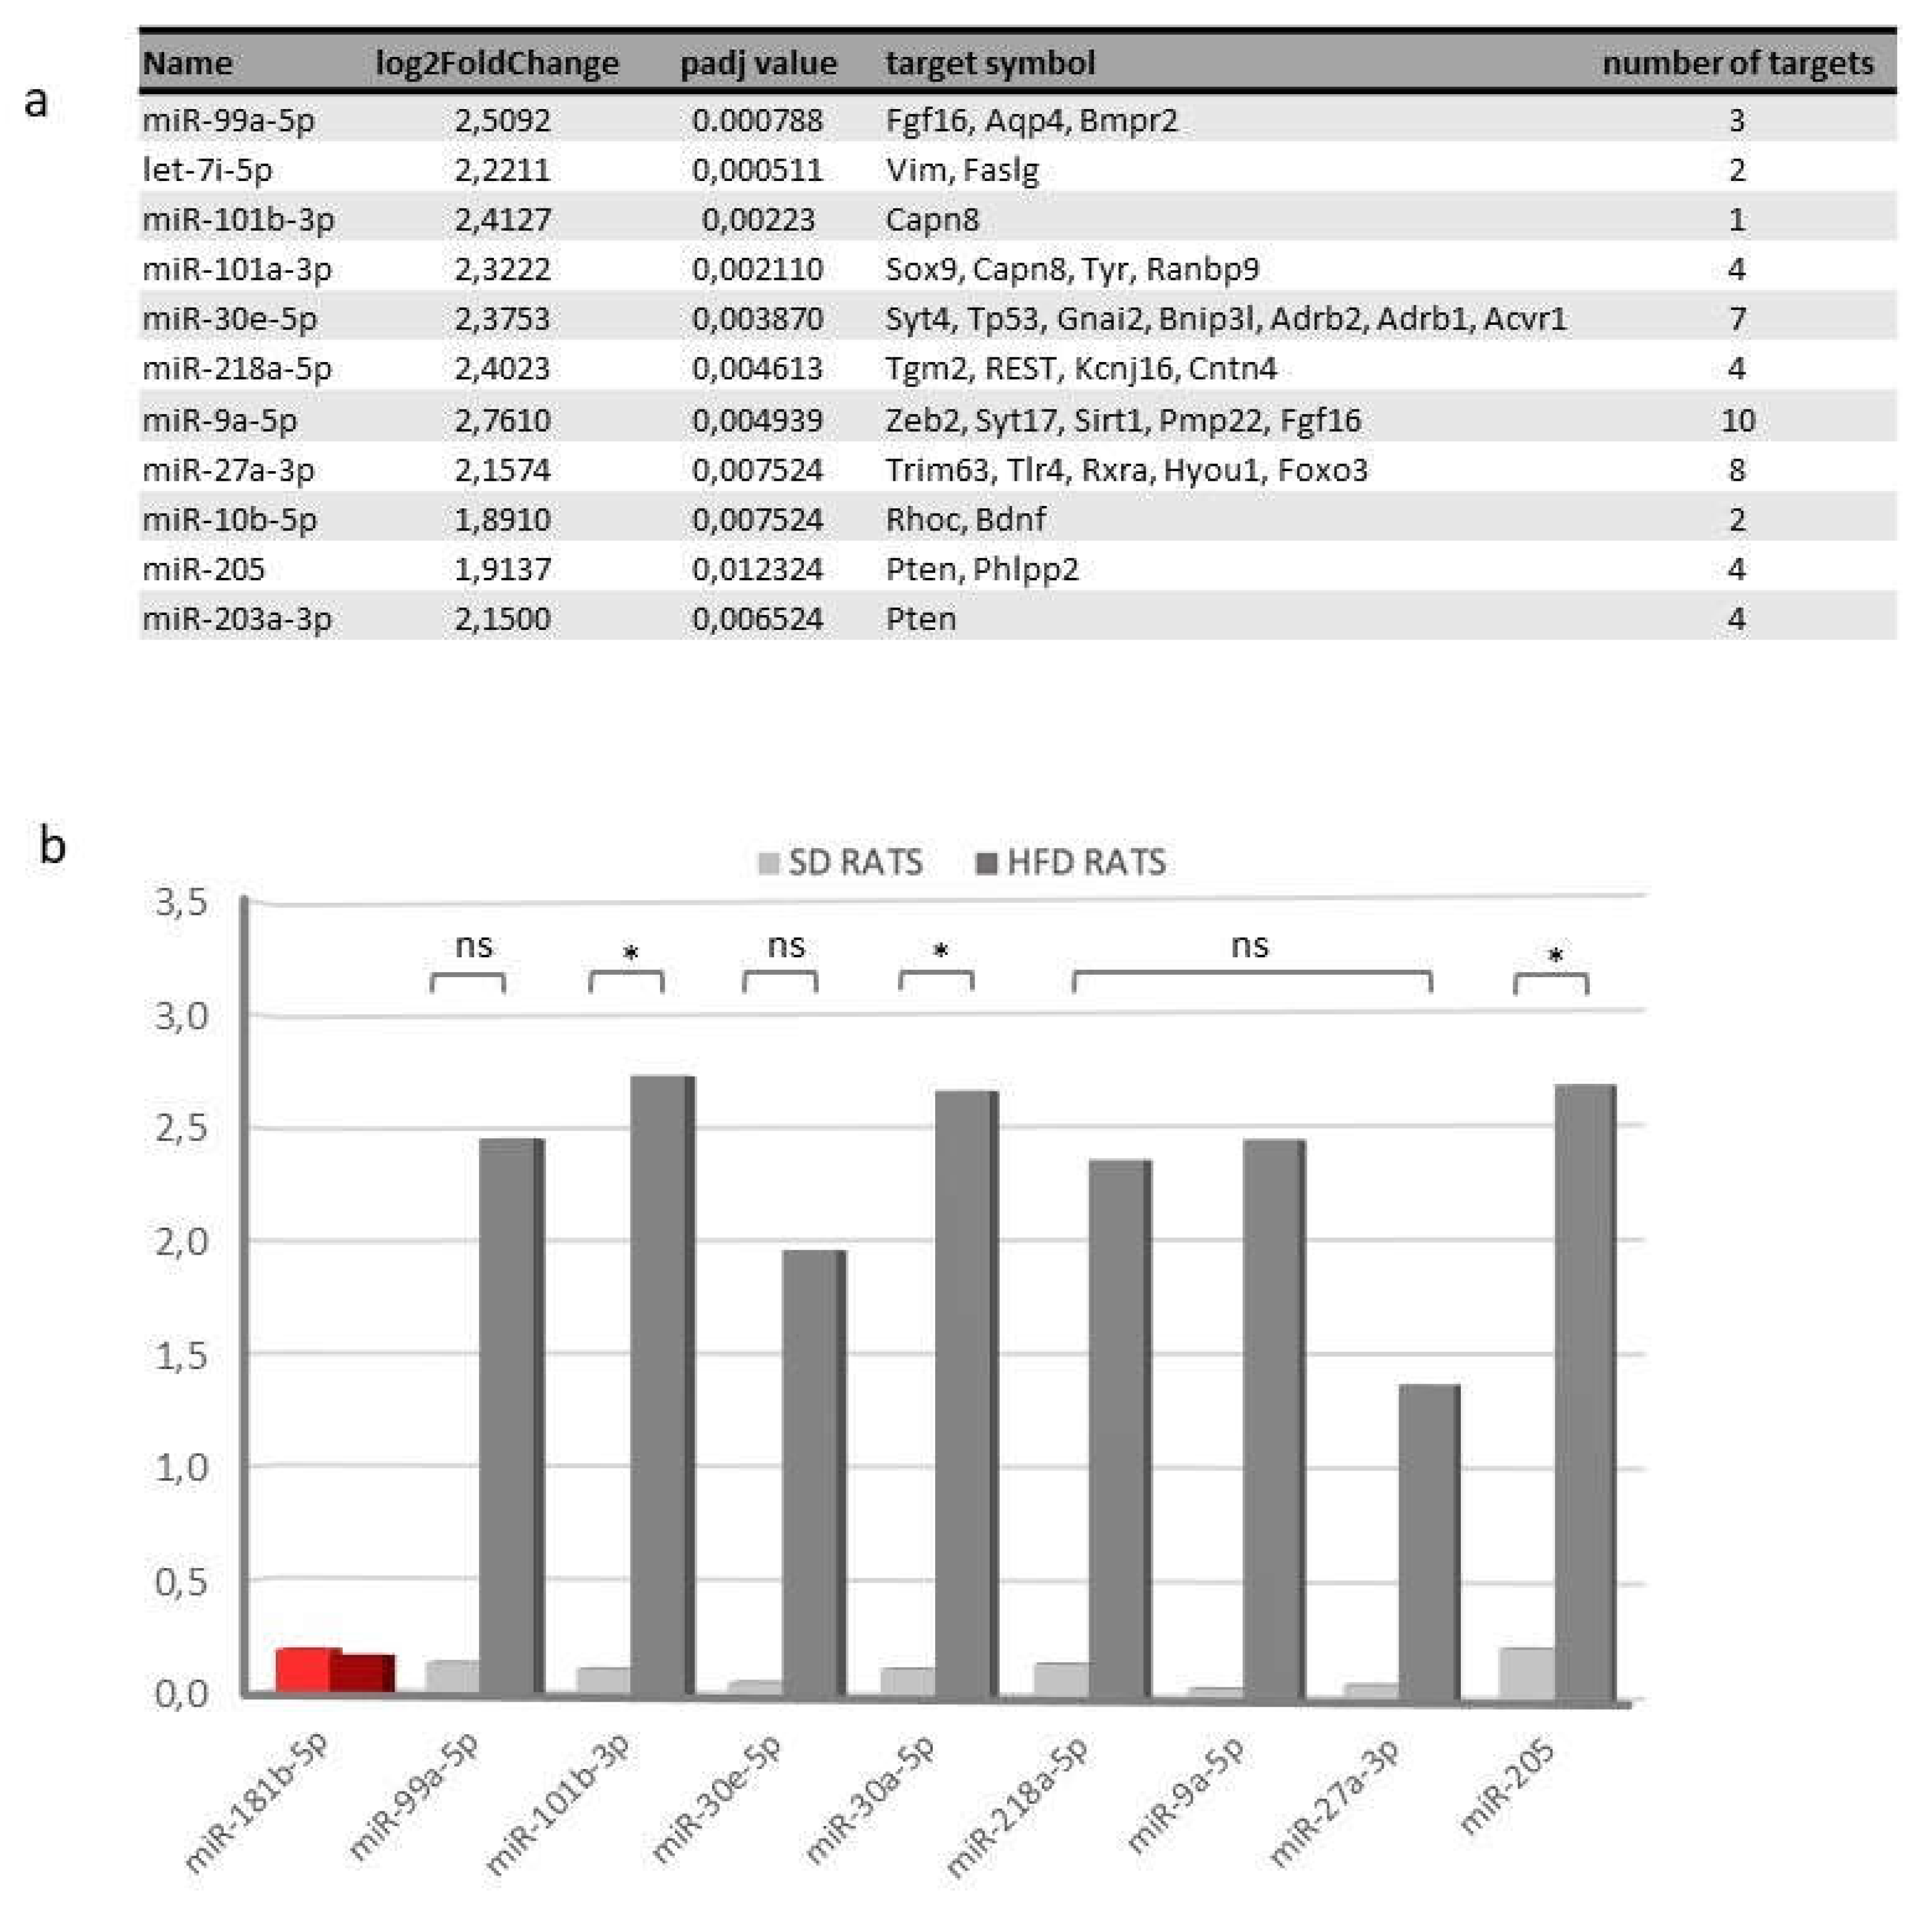
Figure 10.
Scatter- plots comparing the expression of the most differentially expressed miRNAs between rats exhibiting podocyte hypertrophy (PH) and rats without this lesion.
Figure 10.
Scatter- plots comparing the expression of the most differentially expressed miRNAs between rats exhibiting podocyte hypertrophy (PH) and rats without this lesion.
Disclaimer/Publisher’s Note: The statements, opinions and data contained in all publications are solely those of the individual author(s) and contributor(s) and not of MDPI and/or the editor(s). MDPI and/or the editor(s) disclaim responsibility for any injury to people or property resulting from any ideas, methods, instructions or products referred to in the content. |
© 2024 by the authors. Licensee MDPI, Basel, Switzerland. This article is an open access article distributed under the terms and conditions of the Creative Commons Attribution (CC BY) license (http://creativecommons.org/licenses/by/4.0/).
Copyright: This open access article is published under a Creative Commons CC BY 4.0 license, which permit the free download, distribution, and reuse, provided that the author and preprint are cited in any reuse.


