
Submitted:
08 January 2026
Posted:
09 January 2026
You are already at the latest version
Abstract
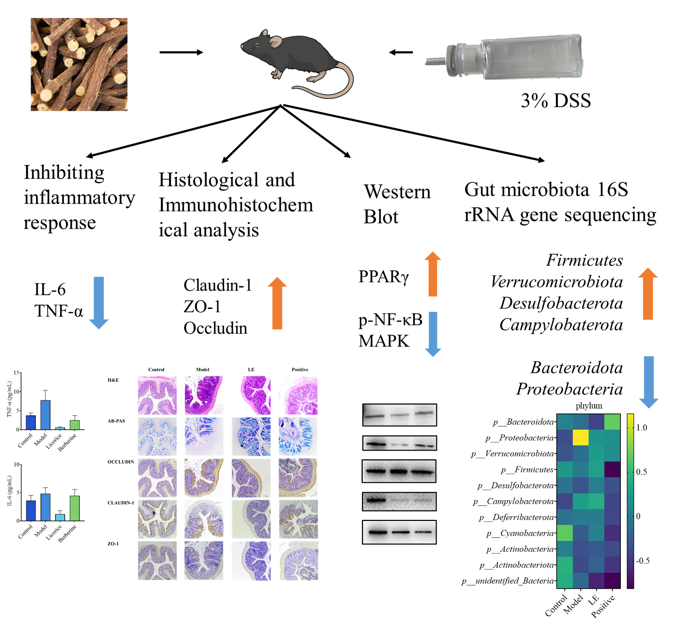
Ulcerative colitis (UC) is a chronic inflammatory bowel disease of unknown etiology, characterized by non-specific colonic inflammation. Licorice (Glycyrrhiza uralensis Fisch.), a food-medicine dual-use botanical, exhibits anti-inflammatory, antioxidant, and immunomodulatory properties, suggesting therapeutic potential for UC. However, the specific bioactive components of licorice and their underlying mechanisms of action require further elucidation. In this study, we investigated the efficacy and mechanisms of licorice flavonoid extract (LF) in a dextran sulfate sodium (DSS)-induced murine model of UC. The results demonstrated that oral administration of LF significantly alleviated disease pathology indices, reduced colon shortening, and improved histopathological colon damage. LF treatment suppressed the production of pro-inflammatory cytokines, likely through inhibiting the phosphorylation of MAPK and NF-κB p65, while upregulating PPARγ expression. Additionally, LF intervention restored gut microbial diversity, increasing the abundance of beneficial taxa such as Bacteroidetes and Firmicutes. The chemical characterization of LF revealed that 15 flavonoid compounds contribute to its therapeutic basis. These findings demonstrate that LF mitigates UC via integrated anti-inflammatory, immunomodulatory, and microbiota-regulating mechanisms, highlighting its potential as a natural therapeutic agent for UC management.
Keywords:
licorice flavonoid extract
; ulcerative colitis
; MAPK
; NF-κB
; Gut microbiota
1. Introduction
Ulcerative colitis (UC), a form of inflammatory bowel disease, is characterized by systemic metabolic alterations, mucosal structures damage, disruption of gut microbiota composition [1,2]. Although the precise etiology of UC remains unclear, a significant association with dysbiosis, oxidative stress, intestinal barrier dysfunction, and immune dysregulation was indicated [3,4] .Current therapeutic approaches primarily rely on medications such as corticosteroids [5], sulfasalazine [6] and immunosuppressants [7]. However, the suboptimal efficacy and severe adverse effects of these drugs highlight the need for improved treatment strategies [8]. In recent years, bioactive compounds derived from natural products, such as polysaccharides [9,10], polyphenols [11] and flavonoids [12,13], have gained increasing attention for their efficacy in alleviating intestinal inflammation. Consequently, dietary intervention incorporating such natural products are viewed as a promising approach for UC prevention and management.
Licorice (Glycyrrhiza uralensis Fisch.) a pharmacologically significant botanical, has been widely used in traditional medicine across Asia and Europe for treating various ailments, including hepatitis [14], and gastric ulcers [15]. In China, it is recognized as a "food-medicine dual-use substance" and is extensively used in the food and beverage processing industries [16,17]. Traditional Chinese Medicine attributes diverse therapeutic properties to licorice, including heat-clearing, detoxification, phlegm elimination, and cough relief [18]. Recent scientific studies have corroborated the anti-inflammatory properties of licorice and its derivatives. It was discovered that glycyrrhizin, the primary active component in licorice, suppresses inflammatory responses by inhibiting MAPK and NF-κB signaling pathways [19]. Similarly, Echinatin, another licorice-derived flavonoid, reduces inflammatory cytokines release and protects against sepsis-induced organ injury via NF-κB pathways suppression [20]. These findings demonstrated the therapeutic potential of licorice flavonoid extract (LF) in modulating inflammatory processes, thereby drawing increasing attention for its application in UC management.
However, the chemical complexity of licorice extracts presents a challenge. Previous studies have predominantly focused on the bioactivities of isolated compounds, such as liquiritigenin, ononin, formononetin, gancaonin M, glycycoumarin, neoglycyrol, licoricone, which may not fully represent the integrative therapeutic effects of the multi-component extract. This compartmentalized approach limits a comprehensive understanding of its active constituents and overall efficacy. To address this gap, we first prepared and chemically characterized of licorice flavonoid extract (LF). Then network pharmacology was employed to predict its potential therapeutic targets. Finally, these predictions were experimentally validated using a DSS-induced murine model of UC to evaluate the therapeutic effects of LF. Our findings are expected to provide a scientific foundation for developing licorice-based functional foods aimed at UC management.
2. Materials and Methods
2.1. Materials
DSS (Dextran sulfate sodium) was purchased from MP Biomedicals. ElaBoX™ Mouse Tumor Necrosis Factor-α Assay Kit (SEKM-0034), ElaBoX™ Mouse Interleukin-6 Assay Kit (SEKM-0007), and total flavonoid content assay kit were purchased from Beijing Solarbio Science & Technology Co., Ltd. The following reagents were procured from Cell Signaling Technology: p38 mitogen-activated protein kinase (p38 MAPK), nuclear factor kappa B (NF-κB), phosphorylated NF-κB (p-NF-κB), glyceraldehyde-3-phosphate dehydrogenase (GAPDH), peroxisome proliferator-activated receptor gamma (PPARγ), and anti-rabbit IgG. BCA assay kit and the 4% paraformaldehyde fixation solution was purchased from Shanghai Macklin Biochemical Co., Ltd. All other analytical-grade and chromatographic-grade reagents not mentioned herein were procured from Merck KGaA, Darmstadt, Germany.
2.2. Preparation of LF
Dry licorice powder was mixed with a 70% methanol solution (1:10 by weight/volume) and then subjected to ultrasonic-assisted extraction at 320 W and 26 °C for 30 minutes[21]. The extract was collected by centrifugation at 10,000 rpm for 10 minutes. The supernatant was combined with an equal volume of anhydrous ethanol, and standing at 4°C overnight to precipitate carbohydrates and proteins. The mixture was centrifuged to remove the precipitated impurities at 10,000 rpm for 10 minutes. Finally, the resulting liquid was freeze-dried to obtain the final LF samples. The total flavonoid content of the LF was quantified utilizing a commercially available assay kit. Subsequently, the LF powder sample was preserved at -80°C for subsequent analyses.
2.3. Identification of Components in LF by LC-MS/MS
LC-MS/MS analysis was performed utilizing an AB SCIEX Triple TOF 5600 system (MA, USA) equipped with an Agilent Poroshell 120 ECC18 column (3 × 100 mm, 2.7 µm particle size) to characterize the chemical composition of the licorice flavonoid extract. Specific operational procedures refer to Hu [22]. Collision energy was set as high. The data acquisition was conducted using the MRM mode. Analyst software (version 1.7.3) was applied to extracted the raw data, and subsequent chromatographic analysis and processing were performed with MasterView software (version 1.1). Qualitative analysis of each mass spectrometry data point was performed by comparing it with the advanced mzCloud mass spectrometry database (https://www.mzcloud.org/) and relevant literature, thereby providing the material basis for identifying the active components responsible for licorice's anti-colitis activity[23]. The total flavonoid content in LF was determined using a kit according to its instructions.
2.4. Target Prediction Based on Network Pharmacology Methods
The initial dataset of LF targets was retrieved from the Traditional Chinese Medicine System Pharmacology (TCMSP, https://www.tcmsp-e.com) database [24]. Targets associated with ulcerative colitis were identified by searching the GeneCards database (https://www.genecards.org/) using “ulcerative colitis” as the keyword. Venny 2.1.0 software was used to visualize the intersection between LF targets and ulcerative colitis-related targets, pinpointing common targets between TCMSP and GeneCards. A protein-protein interaction (PPI) network was constructed using the STRING database (https://cn.string-db.org/). The MCODE algorithm in Cytoscape 3.9.1 was applied to dissect the PPI network, highlighting core LF targets implicated in UC [25]. Finally, Kyoto Encyclopedia of Genes and Genomes (KEGG) enrichment analysis of these core targets was performed using the David database, resulting in the identification of top 22 enriched pathways[26].
2.5. Animal Experiments
Twenty-four C57BL/6 female mice, aged 8-weeks, were maintained under standardized conditions with purified water and regular chow. Housing parameters included a temperature range of 20 - 22 ℃, relative humidity of 40 - 60%, and a 12 -hour light /dark cycle with ambient noise level was ≤ 60 dB. The C57BL/6 mice were randomly assigned to four groups: control, model, positive and LF group. UC was induced in the model, positive, and LF groups by replacing drinking water with a 3% DSS solution for eight days, while the control group received regular water. LF group received 100 mg/kg of LF through oral gavage daily. Positive group received 100 mg/kg of berberine via oral gavage daily. Both control and model groups were given an equivalent volume of normal saline as a control treatment. Treatments were administered continuously for fifteen days. On day 16, all mice were euthanized, and their colons and blood samples were collected. All animal experiments were conducted in accordance with the guidelines approved by the Animal Ethics Committee of Jiangsu Academy of Agricultural Sciences.

Table 1.
Schematic diagram of experimental design using a DSS-induced UC mouse model.
| 3d | 10d | 5d | |
|---|---|---|---|
| Control group | adaptation period | Saline gavage | Saline gavage Saline gavage 100mg/kg safranin |
| Model group | Saline gavage+3%DSS | ||
| Positive group | 100mg/kg safranin+3%DSS | ||
| LF group | 100mg/kg LF gavage+3%DSS | 100mg/kg LF gavage |
Table 2.
Detailed scoring criteria for DAI.
| Score | Weight loss (%) | Stool consistency | Occult/gross bleeding |
|---|---|---|---|
| 0 | none | normal | normal |
| 1 | 1~5 | soft stool (+) | + |
| 2 | 5~10 | soft stool (++) | ++ |
| 3 | 10~15 | loose stool (+) | +++ |
| 4 | >15 | loose stool (++) | Gross bleedings |
+, Represents severity.
2.5.1. Measurement of Serum Inflammatory Cytokines
Serum samples from experimental mice were obtained by centrifuging the blood under 3000 rpm for 5 min following 12-hour stand at 4°C. The supernatant was collected as serum. ELISA kits were employed to quantify the levels of IL-6 and TNF-α in the serum.
2.5.2. Histological and Immunohistochemical Examination
Colon tissue specimens were fixed in 4% paraformaldehyde and subjected to dehydration through alcohol solutions, followed by clearing in xylene. Subsequently, the samples were embedded in paraffin and stained for histological analysis. A histological colitis score, based on earlier research, was used to assess the level of inflammation.
Colon tissue samples were initially dewaxed and rehydrated, followed by antigen retrieval. Subsequently, the tissues were incubated overnight at 4 ℃ with anti-ZO-1, anti-occludin, and anti-claudin-1, each prepared at a dilution of 1:200. The sections were subsequently incubated with anti-rabbit IgG at 37 ℃ for 30 minutes. Following this, the samples underwent incubation with a diaminobenzidine colorimetric detection kit. Subsequently, the tissue samples underwent a sequence of processing steps, which encompassed haematoxylin counterstaining, differentiation with 1% hydrochloric acid, rehydration through graded aqueous alcohol and xylene, sealing with neutral resin, followed by microscopic examination.
2.5.3. Investigation of Biomarkers in the MAPK/PPARγ Signaling Pathway by Western Blot
RIPA lysis buffer was added to the homogeneous mouse colon tissue and incubated for 10 minutes, and the supernatant was collected after 5 minutes of centrifugation (12,000 rpm). Add 40 μL of 4× Protein Sampling Buffer to 120 μL of the supernatant, and then heat them at 95 °C for a duration of 10 minutes. Perform SDS-PAGE using an 12% SDS-PAGE gel. Subsequent to electrophoresis, the proteins were translocated from the gel onto a polyvinylidene difluoride membrane (Millipore, Bedford, MA, USA) utilizing a TransBlot Turbo system (Bio-Rad, Hercules, CA, USA). Add the primary antibody at a dilution of 1:1000 and incubate the membrane at 4 ℃ for 12 hours. Following three washes of the membrane, each lasting five minutes, the secondary antibody was added at a dilution of 1:2500 and incubate at 37 ℃ for 1 hour. Following three washes of five minutes each with the wash buffer, apply enhanced chemiluminescence substrate to the membrane. Subsequently, the membrane was positioned within a Tanon 5200S imaging system (Tanon, China) to perform chemiluminescent detection and analyze the protein bands[22].
2.5.4. Investigation of Diversity and Composition of Gut Microbiota Using 16S rRNA Sequencing
The processes of DNA extraction, amplification of the 16S rRNA, paired-end sequencing were performed by Wuhan Mavis Metabolism Biotechnology Co., Ltd.
2.6. Statistical Analyses
The data was analyzed utilizing SPSS 22.0, and graphical representations were generated by GraphPad Prism 9.0. Results are presented as mean ± standard deviation.
3. Results
3.1. Identification of Flavonoid Composition in LF
In this work, 100 grams of dried licorice root can yield 10.27 grams of crude LF, with a total flavonoid content of 104.88 mg/kg in the LF component. LC-MS/MS analysis identified 29 flavonoid compounds in the crude LF obtained through methanol solution extraction (Table 3) [27]. The major constituents present at higher concentrations were glycyrrhizic acid, kanzonol H, licorisoflavan B, glycycoumarin, liquiritigenin, licorisoflavan A, 1-methoxyficifolinol, glycyrrhetinic acid, isoliquiritin, glycyrrhizin and licoricone (Figure S1).
3.2. Prediction of Targets for LF in UC
Relevant targets of LF active constituents and UC-associated targets were uploaded to the Bioinformatics website (http://www.bioinformatics.com.cn/). This yielded 123 intersecting genes, which were plotted in a Venn diagram (Figure 1A). These 123 intersecting genes were mapped into the String 11.5 database and visualised using Cytoscape 3.9.1 software, resulting in a PPI network diagram (Figure 1B). Based on Degree, Betweenness, and Closeness values, with thresholds above the median, two rounds of screening identified six core proteins: PPARG, NF-κB, ESR1, BCL2, EGFR, and PTGS2. These targets were determined to play a significant role within the entire PPI network. Figure S2 depicts the interaction relationships between the screened active compounds from licorice and 123 intersecting genes associated with UC. This visualization helps to understand how licorice constituents may interact with the molecular targets involved in UC. KEGG pathway enrichment analysis helps identify biological pathways significantly influenced by licorice in treating ulcerative colitis. A total of 152 signaling pathways were screened with a significance level of P < 0.05. Analysis of the top two pathways revealed that target molecules were primarily enriched in multiple biological pathways, including the PI3K-Akt signaling pathway, MAPK signaling pathway, Rap1 signaling pathway, EGFR tyrosine kinase inhibitor resistance, and HIF-1 signaling pathway. These findings suggest that the active components of licorice may regulate UC by acting on these signaling pathways (Figure 1C). MAPK signaling pathway or PI3K-Akt signaling pathway may be the key mechanisms involved in therapeutic effects of licorice on ulcerative colitis. Subsequent studies may focus on identifying targets within these pathways to further elucidate the mechanisms of action of licorice in treating UC.
3.3. Evaluation of the Anti-Inflammatory Effects of LF in a DSS-Induced UC Model
A DSS-induced UC model was employed to investigate the potential anti-inflammatory effects of LF on intestinal inflammation. Prior to DSS modelling,four groups exhibited an overall increasing trend in the body weight. However, following the administration of DSS-containing water on day 6, the reduction in body weight was observed in all groups with the exception of control group (Figure 2A). Model group demonstrated the lowest body weight, indicating the successful induction of enteritis by oral 3% DSS. This was corroborated by the the highest DAI score in model group , reflecting the most severe colitis symptoms (Figure 2B). In contrast, LF group demonstrated a considerably lower DAI score compared to the model group, suggesting a mitigating effect of LF on colitis severity (Figure 2B). In terms of colon length, control group had the longest colon, model group the shortest, and LF group an intermediate length (Figure 2C). Model group displayed a significantly shrunken colon and bloody stools, whereas LF group demonstrated a slight reduction in symptoms and an improvement in stool characteristics (Figure 2D). The concentrations of IL-6 and TNF-α were markedly increased in model group compared to control group (Figure 2E, F). notably, administration of LF resulted in a significant decrease in serum IL-6 and TNF-α levels in mice with UC, thereby providing additional evidence of its anti-inflammatory effects.
3.4. Effects of LF on Histology and Immunohistochemistry in UC Model
To comprehensively evaluate the ameliorative effects of LF on UC in mice, pathological features of the colon tissue were further investigated using histological and immunohistochemical analyses. As demonstrated in Figure 3, Hematoxylin and eosin (H&E) staining of mouse colon sections revealed significant pathological changes in model group compared to control group. These changes included epithelial cell injury, mucosal edema, substantial disruption of crypt architecture, infiltration of inflammatory cells. These findings were consistent with the results of DAI and colon length. Conversely, LF group demonstrated notable improvements, including enhanced crypt structure, preservation of goblet cells, improved mucosal layer integrity, and reduced inflammatory infiltration. Immunohistochemical results presented in Figure 2 demonstrated that the staining levels of tight junction (TJ) key proteins claudin-1, occludin and ZO-1 were diminished within the colonic tissues of DSS-induced UC mice in comparison to health mice. Oral LF led to an enhancement in the TJ proteins relative to model group, suggesting a restoration of intestinal barrier integrity.
3.5. Mechanistic Insights Into the Anti-Inflammatory Effects of LF on the Regulation of MAPK and NF-κB
To elucidate the molecular mechanisms responsible for the anti-inflammatory effects of LF, the protein expression levels of key inflammation-related genes in mouse colons was evaluated by western blotting. The results are illustrated in Figure 4A. The analysis revealed an increase of PPARγ protein expression in LF group relative to model group, suggesting a potential regulatory role of LF on PPARγ for the inflammatory response (Figure 4B). The expression levels of MAPK proteins in the LF group were elevated compared to the model group (Figure 4C), suggesting that LF may exert its anti-inflammatory effects by modulating MAPK protein expression, thereby influencing inflammatory responses. Oral administration of LF significantly inhibited phosphorylation of NF-κB p65 induced by DSS (Figure 4D), highlighting its potential to suppress the activation of NF-κB-mediated inflammatory signaling pathway. These findings indicated that the specific mechanism by which LF modulates DSS-induced UC is significantly associated with the regulation of NF-κB, MAPK and PPARγ pathways. These findings indicate that the specific mechanism by which LF modulates DSS-induced UC may be closely associated with the expression of p38 MAPK, and phosphorylation of NF-κB p65, which is consistent with the outcomes of the network analysis.
3.6. Effects of LF on Diversity and Composition of Gut Microbiota in DSS-Induced UC Mice
Prior research has shown that changes in the diversity and structural organization of gut microbial communities are strongly correlated with colonic inflammation[28]. To investigate the impact of LF on gut microbiota, 16S rRNA gene sequencing was analyzed to assess microbial diversity in both healthy and UC mice. α-diversity was evaluated by the Shannon index, which captures the richness and evenness of microbial communities within each sample. As demonstrated in Figure 5, control group exhibited the highest microbial diversity, comprising 477 unique operational taxonomic units (OTUs). Model group contained 440 OTUs, representing a decrease compared to control group, potentially indicating a decrease in beneficial bacterial genera within the mice. However, compared to model group, LF group contained 418 OTUs, potentially reflecting a decrease in harmful bacterial genera compared to the model group. Model group harbored 18 unique bacterial species, likely representing harmful genera, while control group and LF group shared 35 identical bacterial species, which are likely to be beneficial species.
To gain a comprehensive understanding of the effect of LF on the gut microbiota, the relative abundance of microbial taxa across the order, phylum, and species levels in the mice gut was analyzed. As demonstrated in Figure 6A, The Firmicutes exhibited the highest relative abundance at phylum level, followed by Bacteroidetes, Verrucomicrobiales, and Desulfobacterota in health mice. However, there has been a significant reduction of relative abundance of Firmicutes and an improvement of Proteobacteria in UC mice compared to health mice. The relative abundances of the Verrucomicrobia and Bacteroidetes phyla were elevated in LF group, indicating a partial restoration of microbial balance by oral LF administration. At order level (Figure 6B), Erysipelotrichales and Bacteroidales were the most abundant in health mice. While the Lactobacillales showed higher relative abundance with 3% DSS oral gavage administration. However, oral LF significantly increased the relative abundances of Bacilli, Clostridia, and Verrucomicrobiae, suggesting a shift towards a healthier microbial profile. At the species level (Figure 6C), control group exhibited the highest abundance of Others and Faecalibaculum_rodentium. Compared to health mice, the relative abundances of Faecalibaculum_rodentium were reduced, while other species were significantly increased by DSS-inducecd UC. After oral LF administration, Escherichia coli, Clostridiales bacterium CIEAF_020, and Bacteroides uniformis were reduced, indicating a protective effect of LF against dysbiosis.
To further elucidate the impact of LF on gut microbiota, the relative abundance distribution of microbial taxa was analyzed at class, genus, and family levels, as well as through diversity indices and species abundance clustering. In the control group, Bacilli exhibited the highest abundance, followed by Clostridia, Bacteroidetes, and Verrucomicrobia (Figure 6D). Oral administration of 3% DSS reduced the relative abundances of Bacilli and Bacteroidetes compared to health mice, while Gammaproteobacteria was significantly higher in oral 3% DSS-treated mice than in other groups. However, oral LF treatment increased the relative abundances of Bacilli, Clostridia, and Verrucomicrobia, indicating a restoration of beneficial microbial taxa. At genus level, DSS-induced UC mice showed a significantly higher abundance of Bacteroides compared to other groups. While the relative abundance of Bacteroides decreased in LF group, suggesting a reduction in pathogenic genera (Figure 6E). At family level, in control group, Muribaculaceae was the most abundant family, followed by Erysipelotrichaceae, Akkermansiaceae (Figure 6F). The relative abundance of Erysipelotrichaceae and Muribaculaceae decreased, while Bacteroidaceae and Lactobacillaceae increased in the DSS-induced UC group compared to the control group. Oral LF reduced the relative abundances of Bacteroidaceae and Oscillospiraceae, further supporting the protective effects of LF against dysbiosis. The model group exhibited lower values for the Chao 1, Ace, Shannon and Simpson indexes (Figure 7) compared to control group, indicating reduced microbial diversity and richness.
4. Discussion
In this work, we isolated and characterized the bioactive flavonoid compounds in licorice, and investigated the therapeutic effects and underlying mechanisms of LF in DSS-induced UC mice. Our findings revealed that the primary active components in licorice are glycyrrhizic acid, glycyrrhizin, and their isomers, which was consistent with previous studies [29,30]. Previous researches have indicated that the key component glycyrrhizic acid in licorice possesses potent antioxidant and anti-inflammatory effects, mediated through TNF-α and IL-6 [31]. Additionally, isoliquiritigenin exerts anti-inflammatory effects by modulating the expression of key factors in the NF-κB pathways[32]. The results of our network pharmacology method analysis further confirmed these conclusions. We identified several flavonoid compounds, including glycyrrhetic acid ,Formononetin, Gancaonin M,Glyasperin D,Isoliquiritigenin,Licochalcone D,Liquiritigenin,3-Hydroxyglabrol, that may play a role in improving UC through targets such as MAPK pathway, NF-κB pathway, and PPARG (Figure 1).
The therapeutic efficacy of LF was subsequently evaluated in a mouse model of DSS-induced ulcerative colitis. Oral administration of LF led to marked improvements in disease phenotype, including body weight recovery, attenuated colon shortening, and significant reductions in both DAI and histopathological scores (Figure 2). These results indicate that LF effectively alleviates key symptoms of experimental colitis. Furthermore, the impairment of the intestinal epithelial barrier during UC progression is closely associated with dysregulated mucosal immune responses, which can trigger macrophage activation and subsequent overproduction of pro-inflammatory cytokines, including TNF-α and IL-6 [7,33]. Consistently, we observed a significant elevation of these cytokines in our DSS-induced UC model, indicative of the inflammatory state. Notably, oral administration of LF substantially suppressed serum levels of both TNF-α and IL-6. This anti-cytokine effect aligns with prior findings that licorice extracts can reduce IL-6 [34] and TNF-α [35] in UC models. Collectively, these results suggest that the symptom-relieving effect of LF may be primarily attributed to its suppression of TNF-α and IL-6 secretion. To further elucidate the molecular mechanisms underlying the therapeutic effects of LF, we conducted WB analysis on the targets predicted by network pharmacology and found that LF significantly inhibited the phosphorylation of MAPK and NF-κB in mice while markedly enhancing the expression of PPARγ protein. This demonstrates that licorice primarily modulates ulcerative colitis through the MAPK and NF-κB signaling pathways, consistent with findings from Zang studies [36].
While the precise etiology of UC has yet to be fully elucidated, alterations in the gut microbiota are recognized as a contributing factor in its pathogenesis[37]. A balanced gut microbiota supports host health through diverse physiological functions. In contrast, dysbiosis facilitates the proliferation of harmful bacteria, disrupting metabolic homeostasis, triggering intestinal inflammation, and damaging the mucosal barrier. This initiates a vicious cycle wherein impaired barrier function and microbial imbalance mutually exacerbate inflammation [38]. In this study, DSS-induced colitis mice exhibited a significant reduction in the relative abundances of Bacteroidetes and Firmicutes compared to health mice, consistent with previous findings [36].
Our observation that oral administration of LF significantly increased the abundance of Firmicutes in DSS-induced colitis mice aligns with other studies demonstrating that enrichment of Firmicutes can ameliorate intestinal inflammation [39].it suggests that LF has the capacity to mitigate DSS-induced microbial imbalance, which is a key factor in the pathogenesis of UC. The enrichment of Firmicutes has been shown to ameliorate intestinal inflammation in various models, such as Robinia pseudoacacia seed polysaccharides in Drosophila [40] and certain dietary interventions in mice [41]. Furthermore, LF treatment elevated key alpha-diversity indices (Chao1, Ace, Shannon, and Simpson) compared to the model group. These findings indicate that LF alleviates DSS-induced colitis, at least in part, by restoring a healthier gut microbial community structure and countering inflammation.
5. Conclusions
In summary, our study demonstrated that LF effectively ameliorated DSS-induced ulcerative colitis in mice. Oral administration of LF mitigated disease severity, as evidenced by reduced colon shortening, improved histopathological scores, attenuated mucosal damage, and a reversal of gut microbial dysbiosis. Mechanistically, LF exerted anti-inflammatory effects by suppressing MAPK signaling and NF-κB phosphorylation, while activating the PPARγ pathway. These findings underscore the multifaceted therapeutic effects of LF in modulating UC, not only through its direct anti-inflammatory effects on cytokine secretion but also through the modulation of key signaling pathways that regulate inflammation and immune responses. Concurrently, LF restored intestinal microbial homeostasis, primarily by increasing the abundance of beneficial bacteria and rebalancing community structure. Particularly, the reduction in Bacteroidetes and Firmicutes is significantly associated with the pathogenesis of DSS-induced colitis. While this study demonstrates the therapeutic potential of LF, future work should include systematic dose-response studies to define its optimal therapeutic window, accompanied by comprehensive safety assessments. In conclusion, LF alleviates experimental colitis through integrated anti-inflammatory and microbiota-modulating mechanisms, positioning it as a promising candidate for the prevention and management of UC.
Supplementary Materials
The following supporting information can be downloaded at: Preprints.org, Figure S1. Licorice flavonoid compounds identified in licorice: XLC diagram; Figure S2. PPI analysis of the primary active components and major functional targets of LF. Figure S3. Effects of LF on gut microbiota structure in DSS-induced UC mice investigated using 16S rDNA sequencing. (A) Clustered heatmap of species abundance at the phylum level; (B) PCA analysis at the OTU level; (C) Principal coordinate analysis (PCoA).
Author Contributions
Xiaoai Zhu: Writing – original draft, Methodology, Investigation, Data curation. Binsong Han: Writing – review & editing, Investigation, Formal analysis, Data curation. Anqi Hu: Investigation, Methodology. Jiacen Bi: Investigation. Yuhui Ye: Formal analysis, Data curation. Wenxue Wang: Investigation, Data curation. Cunzheng Zhang: Writing – review and editing, Supervision, Conceptualization, Funding acquisition. Feng Xue: Supervision, Funding acquisition, Project administration.
Funding
This work was supported by the Jiangsu Basic Research Center for Synthetic Biology (BK20233003), Jiangsu Funding Program for Excellent Postdoctoral Talent (2024ZB779), National Natural Science Foundation of China (32402267), Jiangsu Agricultural Science and Technology Innovation Fund (CX (23)1015).
Institutional Review Board Statement
All animal experiments were conducted in accordance with the guidelines approved by the Animal Ethics Committee of Jiangsu Academy of Agricultural Sciences.
Conflicts of Interest
The authors declare no conflicts of interest.
References
- Reenaers, C.; Louis, E. Challenge of treatment de-escalation in inflammatory bowel diseases. Gut 2025, 74(9), 1358–1359. [Google Scholar] [CrossRef]
- Ungaro, R.; Mehandru, S.; Allen, P. B.; Peyrin-Biroulet, L.; Colombel, J.-F. Ulcerative colitis. The Lancet 2017, 389(10080), 1756–1770. [Google Scholar] [CrossRef]
- Sokol, H.; Leducq, V.; Aschard, H.; Pham, H.-P.; Jegou, S.; Landman, C.; Cohen, D.; Liguori, G.; Bourrier, A.; Nion-Larmurier, I.; Cosnes, J.; Seksik, P.; Langella, P.; Skurnik, D.; Richard, M. L.; Beaugerie, L. Fungal microbiota dysbiosis in IBD. Gut 2017, 66(6), 1039–1048. [Google Scholar] [CrossRef]
- Perler, B. K.; Ungaro, R.; Baird, G.; Mallette, M.; Bright, R.; Shah, S.; Shapiro, J.; Sands, B. E. Presenting symptoms in inflammatory bowel disease: descriptive analysis of a community-based inception cohort. BMC Gastroenterology 2019, 19(1). [Google Scholar] [CrossRef]
- Sleutjes, J. A. M.; Roeters van Lennep, J. E.; van der Woude, C. J.; de Vries, A. C. Lipid Changes After Induction Therapy in Patients with Inflammatory Bowel Disease: Effect of Different Drug Classes and Inflammation. Inflammatory Bowel Diseases 2023, 29(4), 531–538. [Google Scholar] [CrossRef] [PubMed]
- Yousefi-Ahmadipour, A.; Ebrahimi-Barough, S.; Niknia, S.; Allahverdi, A.; Mirzahosseini-pourranjbar, A.; Tashakori, M.; Khajouee Ravari, S.; Asadi, F.; Heidari Barchi Nezhad, R.; Lotfibakhshaiesh, N.; Mirzaei, M. R. Therapeutic effects of combination of platelet lysate and sulfasalazine administration in TNBS-induced colitis in rat. Biomedicine & Pharmacotherapy 2020, 125. [Google Scholar] [CrossRef]
- Schwager, S.; Detmar, M. Inflammation and Lymphatic Function. Frontiers in Immunology 2019, 10. [Google Scholar] [CrossRef] [PubMed]
- Moura, F. A.; de Andrade, K. Q.; dos Santos, J. C. F.; Araújo, O. R. P.; Goulart, M. O. F. Antioxidant therapy for treatment of inflammatory bowel disease: Does it work? Redox Biology 2015, 6, 617–639. [Google Scholar] [CrossRef]
- Shao, X.; Sun, C.; Tang, X.; Zhang, X.; Han, D.; Liang, S.; Qu, R.; Hui, X.; Shan, Y.; Hu, L.; Fang, H.; Zhang, H.; Wu, X.; Chen, C. Anti-Inflammatory and Intestinal Microbiota Modulation Properties of Jinxiang Garlic (Allium sativum L.) Polysaccharides toward Dextran Sodium Sulfate-Induced Colitis. Journal of Agricultural and Food Chemistry 2020, 68(44), 12295–12309. [Google Scholar] [CrossRef] [PubMed]
- Li, P.; Xiao, N.; Zeng, L.; Xiao, J.; Huang, J.; Xu, Y.; Chen, Y.; Ren, Y.; Du, B. Structural characteristics of a mannoglucan isolated from Chinese yam and its treatment effects against gut microbiota dysbiosis and DSS-induced colitis in mice. Carbohydrate Polymers 2020, 250. [Google Scholar] [CrossRef]
- Lv, W.; Jin, W.; Lin, J.; Wang, Z.; Ma, Y.; Zhang, W.; Zhu, Y.; Hu, Y.; Qu, Q.; Guo, S. Forsythia suspensa polyphenols regulate macrophage M1 polarization to alleviate intestinal inflammation in mice. Phytomedicine 2024, 125. [Google Scholar] [CrossRef]
- Nong, K.; Qin, X.; Liu, Z.; Wang, Z.; Wu, Y.; Zhang, B.; Chen, W.; Fang, X.; Liu, Y.; Wang, X.; Zhang, H. Potential effects and mechanism of flavonoids extract of Callicarpa nudiflora Hook on DSS-induced colitis in mice. Phytomedicine 2024, 128. [Google Scholar] [CrossRef]
- Chen, B.; Luo, J.; Han, Y.; Du, H.; Liu, J.; He, W.; Zhu, J.; Xiao, J.; Wang, J.; Cao, Y.; Xiao, H.; Song, M. Dietary Tangeretin Alleviated Dextran Sulfate Sodium-Induced Colitis in Mice via Inhibiting Inflammatory Response, Restoring Intestinal Barrier Function, and Modulating Gut Microbiota. Journal of Agricultural and Food Chemistry 2021, 69(27), 7663–7674. [Google Scholar] [CrossRef]
- Feng, C.; Wang, H.; Yao, C.; Zhang, J.; Tian, Z. Diammonium glycyrrhizinate, a component of traditional Chinese medicine Gan-Cao, prevents murine T-cell-mediated fulminant hepatitis in IL-10- and IL-6-dependent manners. International Immunopharmacology 2007, 7(10), 1292–1298. [Google Scholar] [CrossRef]
- Turpie, A. G.; Runcie, J.; Thomson, T. J. Clinical trial of deglydyrrhizinized liquorice in gastric ulcer. Gut 1969, 10(4), 299. [Google Scholar] [CrossRef]
- China, M. o. H. o. t. P. s. R. o. Notice on further regulating the management of raw materials for health food (Document No. 51); 51; 2002.
- Commission., N. P., Pharmacopoeia of the People's Republic of China; China Medical Science Press: Beijing, 2025.
- Jiang, M.; Zhao, S.; Yang, S.; Lin, X.; He, X.; Wei, X.; Song, Q.; Li, R.; Fu, C.; Zhang, J.; Zhang, Z. An “essential herbal medicine”—licorice: A review of phytochemicals and its effects in combination preparations. Journal of Ethnopharmacology 2020, 249. [Google Scholar] [CrossRef]
- Chen, Z.; Liu, Y. j.; Yu, B.; Li, W.; Zhang, M.; Wu, X.; Gui, F.; Peng, H.; Ai, F. Liquiritin inhibits TGF-β1-induced epithelial mesenchymal transition and extracellular matrix deposition in human renal proximal tubular epithelial cells by suppressing the MAPK signaling. Molecular & Cellular Toxicology 2023, 20(3), 641–647. [Google Scholar]
- Duan, M.; Jie, J.; Li, C.; Bai, X.; Hua, S.; Tang, M.; Li, D. Echinatin alleviates sepsis severity through modulation of the NF-κB and MEK/ERK signaling pathways. Biomedicine & Pharmacotherapy 2024, 179. [Google Scholar]
- Jan, R.; Gani, A.; Masarat Dar, M.; Bhat, N. A. Bioactive characterization of ultrasonicated ginger (Zingiber officinale) and licorice (Glycyrrhiza Glabra) freeze dried extracts. Ultrasonics Sonochemistry 2022, 88. [Google Scholar] [CrossRef] [PubMed]
- Hu, A.; Ye, Y.; Han, B.; Zhu, X.; Xue, F.; Yang, L.; Zhang, C. Effect of Perilla frutescens polyphenols against tight junction alterations and intestinal inflammation: A Caco-2/macrophage co-culture model-based study integrated with network pharmacology. Food Bioscience 2024, 62. [Google Scholar] [CrossRef]
- Zhang, Q.; Ye, M. Chemical analysis of the Chinese herbal medicine Gan-Cao (licorice). J Chromatogr A 2009, 1216(11), 1954–69. [Google Scholar] [CrossRef]
- Liu, Z.; Ran, Q.; Luo, J.; Shen, Q.; Zhang, T.; Fang, S.; Pan, K.; Long, L. Correlation analysis of secondary metabolites and disease resistance activity of different varieties of Congou black tea based on LC-MS/MS and TCMSP. Food Chemistry: X 2024, 23, 101331. [Google Scholar] [CrossRef]
- Zhang, F.; Ma, A.; Wang, Z.; Ma, Q.; Liu, B.; Huang, L.; Wang, Y. A Central Edge Selection Based Overlapping Community Detection Algorithm for the Detection of Overlapping Structures in Protein. Protein Interaction Networks Molecules [Online] 2018, 2633. [Google Scholar]
- Kanehisa, M.; Furumichi, M.; Sato, Y.; Kawashima, M.; Ishiguro-Watanabe, M. KEGG for taxonomy-based analysis of pathways and genomes. Nucleic Acids Research 2023, 51(D1), D587–D592. [Google Scholar] [CrossRef] [PubMed]
- Farag, M. A.; Porzel, A.; Wessjohann, L. A. Comparative metabolite profiling and fingerprinting of medicinal licorice roots using a multiplex approach of GC–MS, LC–MS and 1D NMR techniques. Phytochemistry 2012, 76, 60–72. [Google Scholar] [CrossRef] [PubMed]
- Frank, D. N.; St. Amand, A. L.; Feldman, R. A.; Boedeker, E. C.; Harpaz, N.; Pace, N. R. Molecular-phylogenetic characterization of microbial community imbalances in human inflammatory bowel diseases. Proceedings of the National Academy of Sciences 2007, 104(34), 13780–13785. [Google Scholar] [CrossRef] [PubMed]
- Cheng, M.; Zhang, J.; Yang, L.; Shen, S.; Li, P.; Yao, S.; Qu, H.; Li, J.; Yao, C.; Wei, W.; Guo, D.-a. Recent advances in chemical analysis of licorice (Gan-Cao). Fitoterapia 2021, 149. [Google Scholar] [CrossRef]
- Nazari, S.; Rameshrad, M.; Hosseinzadeh, H. Toxicological Effects of Glycyrrhiza glabra (Licorice): A Review. Phytotherapy Research 2017, 31(11), 1635–1650. [Google Scholar] [CrossRef]
- Richard, S. A.; Dias Novaes, R. Exploring the Pivotal Immunomodulatory and Anti-Inflammatory Potentials of Glycyrrhizic and Glycyrrhetinic Acids. Mediators of Inflammation 2021, 2021(1). [Google Scholar] [CrossRef]
- Chen, Z.; Ding, W.; Yang, X.; Lu, T.; Liu, Y. Isoliquiritigenin, a potential therapeutic agent for treatment of inflammation-associated diseases. Journal of Ethnopharmacology 2024, 318. [Google Scholar] [CrossRef]
- Cao, S.-Y.; Ye, S.-J.; Wang, W.-W.; Wang, B.; Zhang, T.; Pu, Y.-Q. Progress in active compounds effective on ulcerative colitis from Chinese medicines. Chinese Journal of Natural Medicines 2019, 17(2), 81–102. [Google Scholar] [CrossRef]
- Kong, J.; Xiang, Q.; Ge, W.; Wang, Y.; Xu, F.; Shi, G. Network pharmacology mechanisms and experimental verification of licorice in the treatment of ulcerative colitis. Journal of Ethnopharmacology 2024, 324. [Google Scholar] [CrossRef]
- Zhang, Y.; Xu, Y.; Zhang, L.; Chen, Y.; Wu, T.; Liu, R.; Sui, W.; Zhu, Q.; Zhang, M. Licorice extract ameliorates hyperglycemia through reshaping gut microbiota structure and inhibiting TLR4/NF-κB signaling pathway in type 2 diabetic mice. Food Research International 2022, 153. [Google Scholar] [CrossRef]
- Zang, R.; Zhou, R.; Li, Y.; Wu, H.; Lu, L.; Xu, H. The probiotic Lactobacillus plantarum alleviates colitis by modulating gut microflora to activate PPARγ and inhibit MAPKs/NF-κB. European Journal of Nutrition 2024, 64(1), 32. [Google Scholar] [CrossRef]
- Li, Q.; Zhou, S.; Wang, Y.; Cong, J. Changes of intestinal microbiota and microbiota-based treatments in IBD. Archives of Microbiology 2022, 204(7). [Google Scholar] [CrossRef]
- Ma, W.-w.; Huang, Z.-Q.; Liu, K.; Li, D.-Z.; Mo, T.-L.; Liu, Q. The role of intestinal microbiota and metabolites in intestinal inflammation. Microbiological Research 2024, 288. [Google Scholar] [CrossRef] [PubMed]
- Feng, J.; Zhang, L.; Tang, X.; Hu, W.; Zhou, P. Major yolk protein from sea cucumber (Stichopus japonicus) attenuates acute colitis via regulation of microbial dysbiosis and inflammatory responses. Food Research International 2022, 151. [Google Scholar] [CrossRef] [PubMed]
- Yuan, L.; Liu, Q.; Liang, Y.; Qiu, J.; Lei, H.; Cai, H.; Wei, X. Physicochemical characterization and enteroprotective activity of triple-helix Gleditsia seed polysaccharides prepared by the probiotic fermentation method. Food Chemistry 2025, 495. [Google Scholar] [CrossRef]
- Natividad, J. M.; Pinto-Sanchez, M. I.; Galipeau, H. J.; Jury, J.; Jordana, M.; Reinisch, W.; Collins, S. M.; Bercik, P.; Surette, M. G.; Allen-Vercoe, E.; Verdu, E. F. Ecobiotherapy Rich in Firmicutes Decreases Susceptibility to Colitis in a Humanized Gnotobiotic Mouse Model. Inflammatory Bowel Diseases 2015, 21(8), 1883–1893. [Google Scholar] [CrossRef] [PubMed]
Figure 1.
Prediction of relevant target molecules for the interaction between active components of licorice and UC using network pharmacology methods (A) Venny analysis, (B) PPI analysis, (C) KEGG analysis.
Figure 1.
Prediction of relevant target molecules for the interaction between active components of licorice and UC using network pharmacology methods (A) Venny analysis, (B) PPI analysis, (C) KEGG analysis.
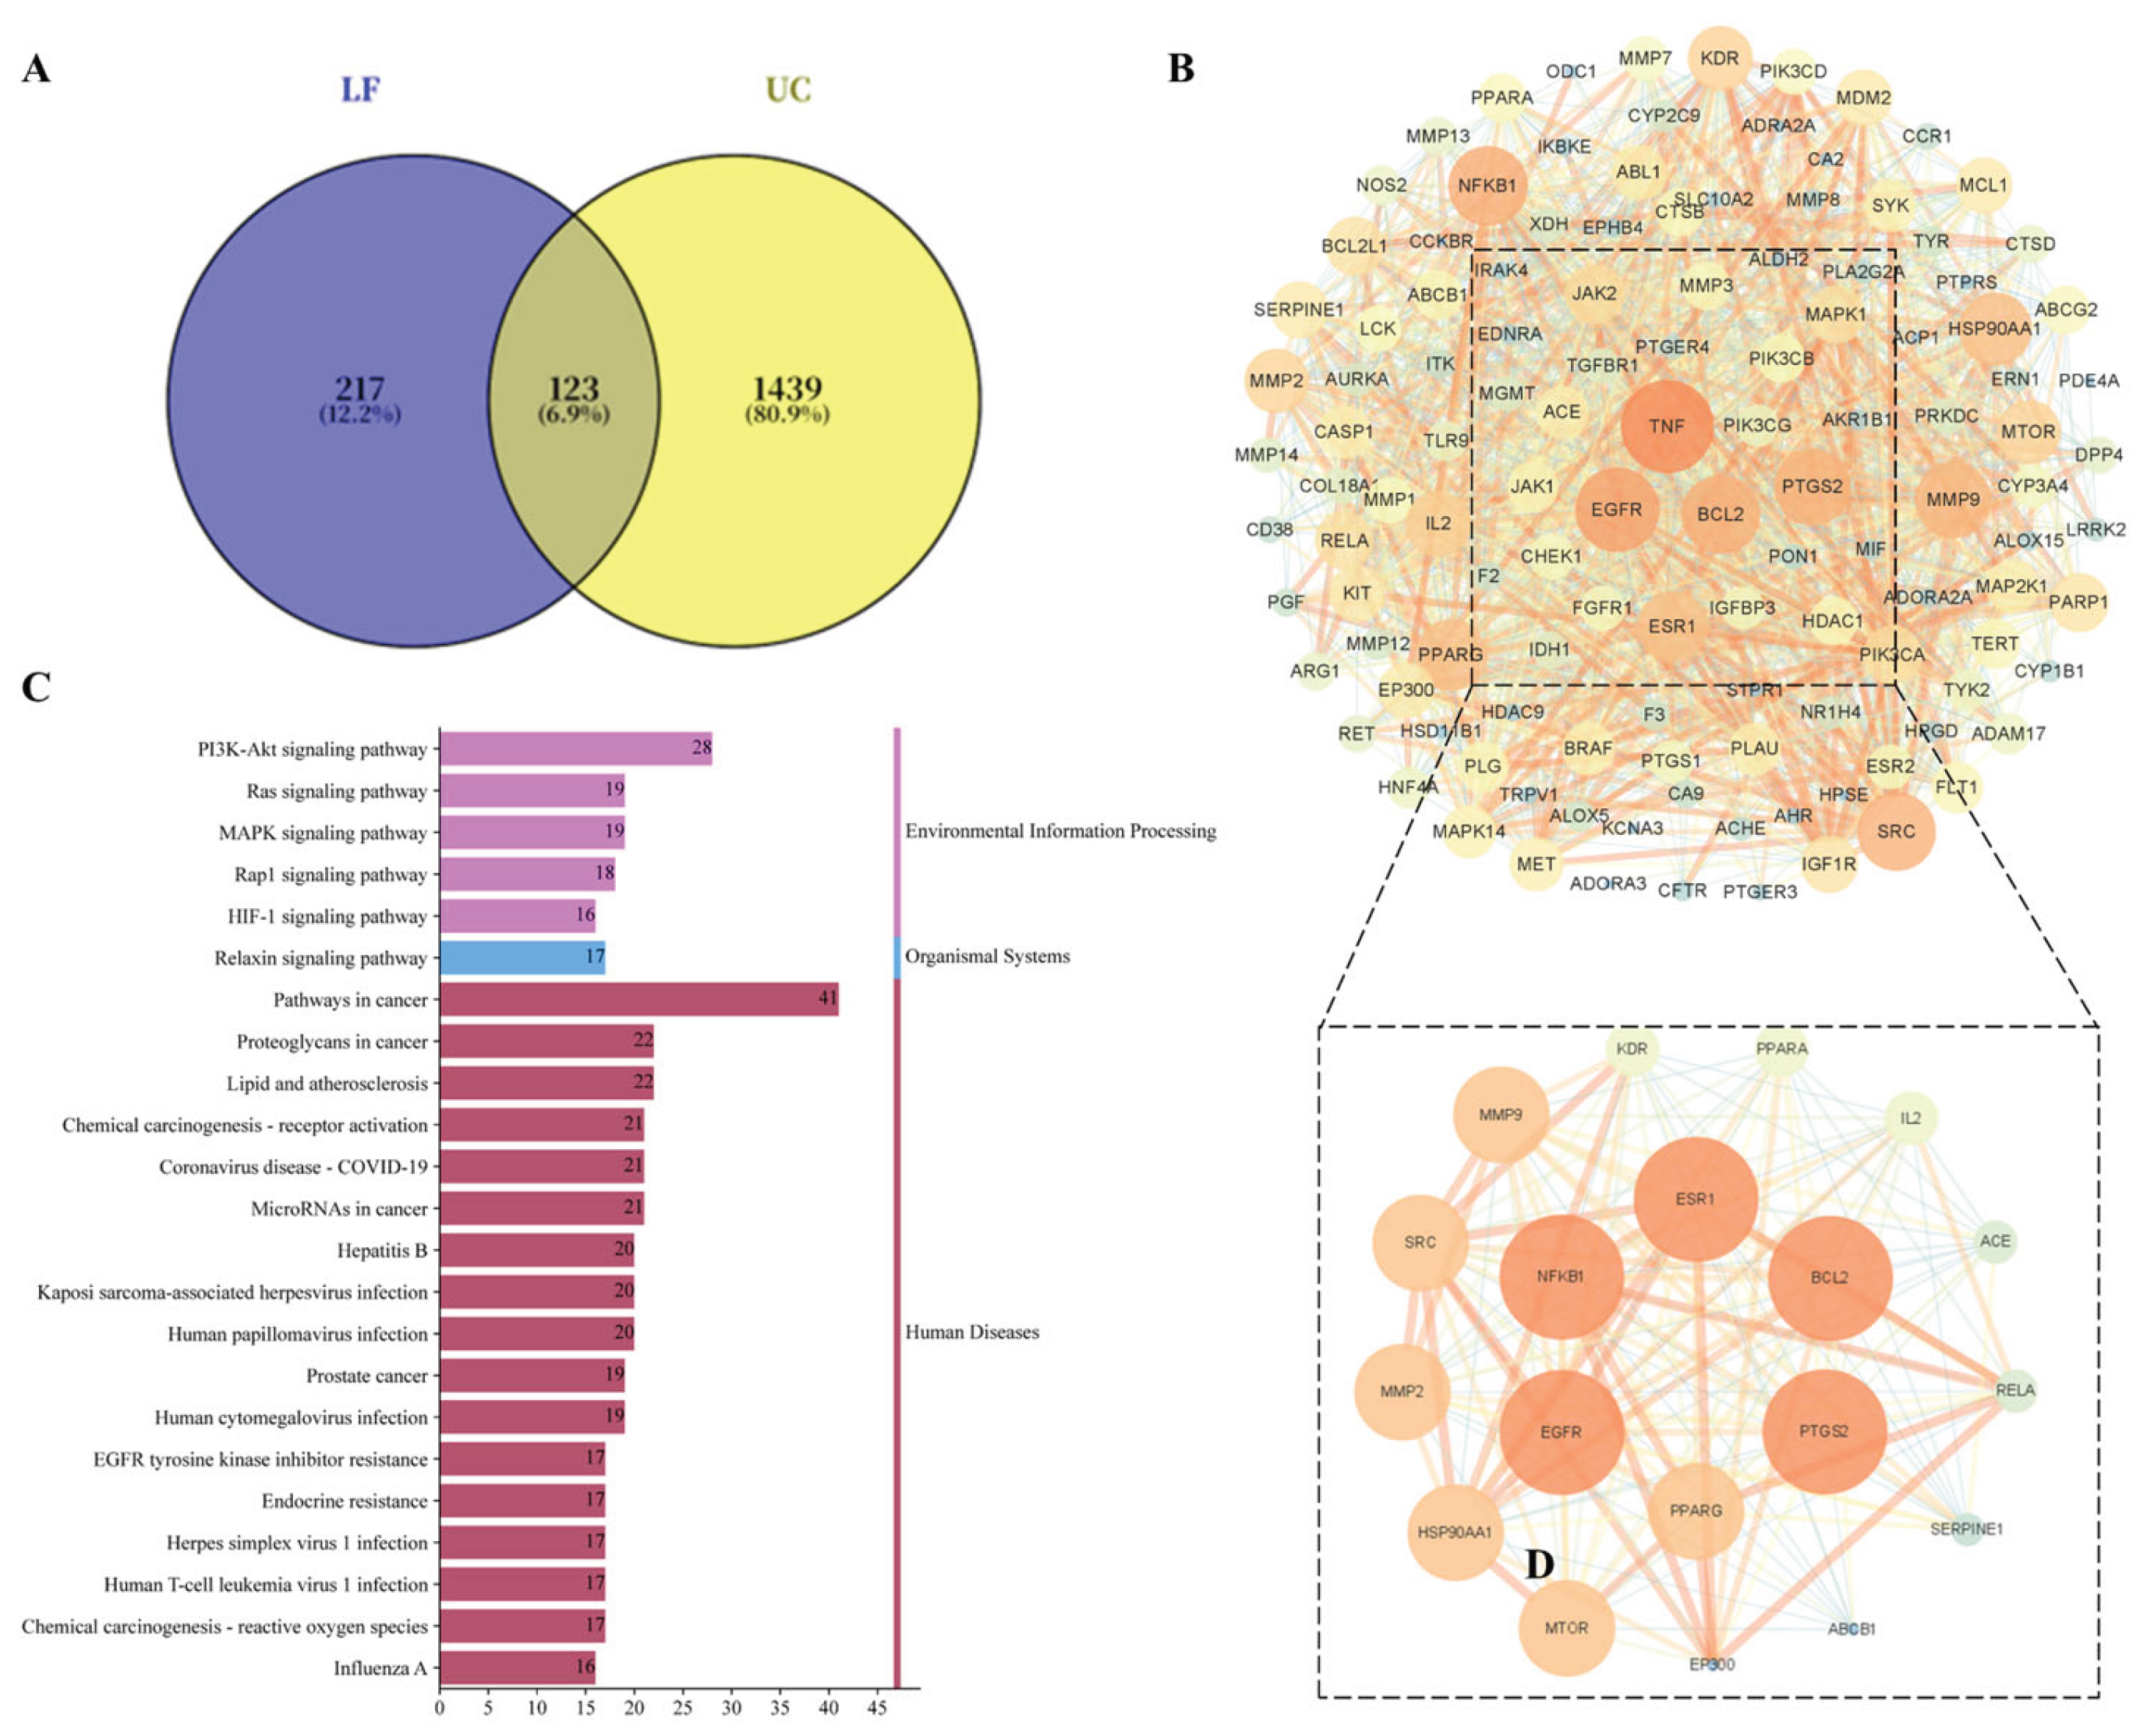
Figure 2.
Effects of HP on DSS-induced UC symptoms in mice. (A) Body weight changes; (B) Disease Activity Index scores; (C) Colon length; (D) Representative images of intestines per group. The levels of and TNF-α (E) and IL-6 (F). Control: Normal control group; Model: Model control group; Licorice: 100 mg/kg/d; Positive control: Berberine 100 mg/kg/d. Data are expressed as mean ± standard deviation (n = 6 mice/group).
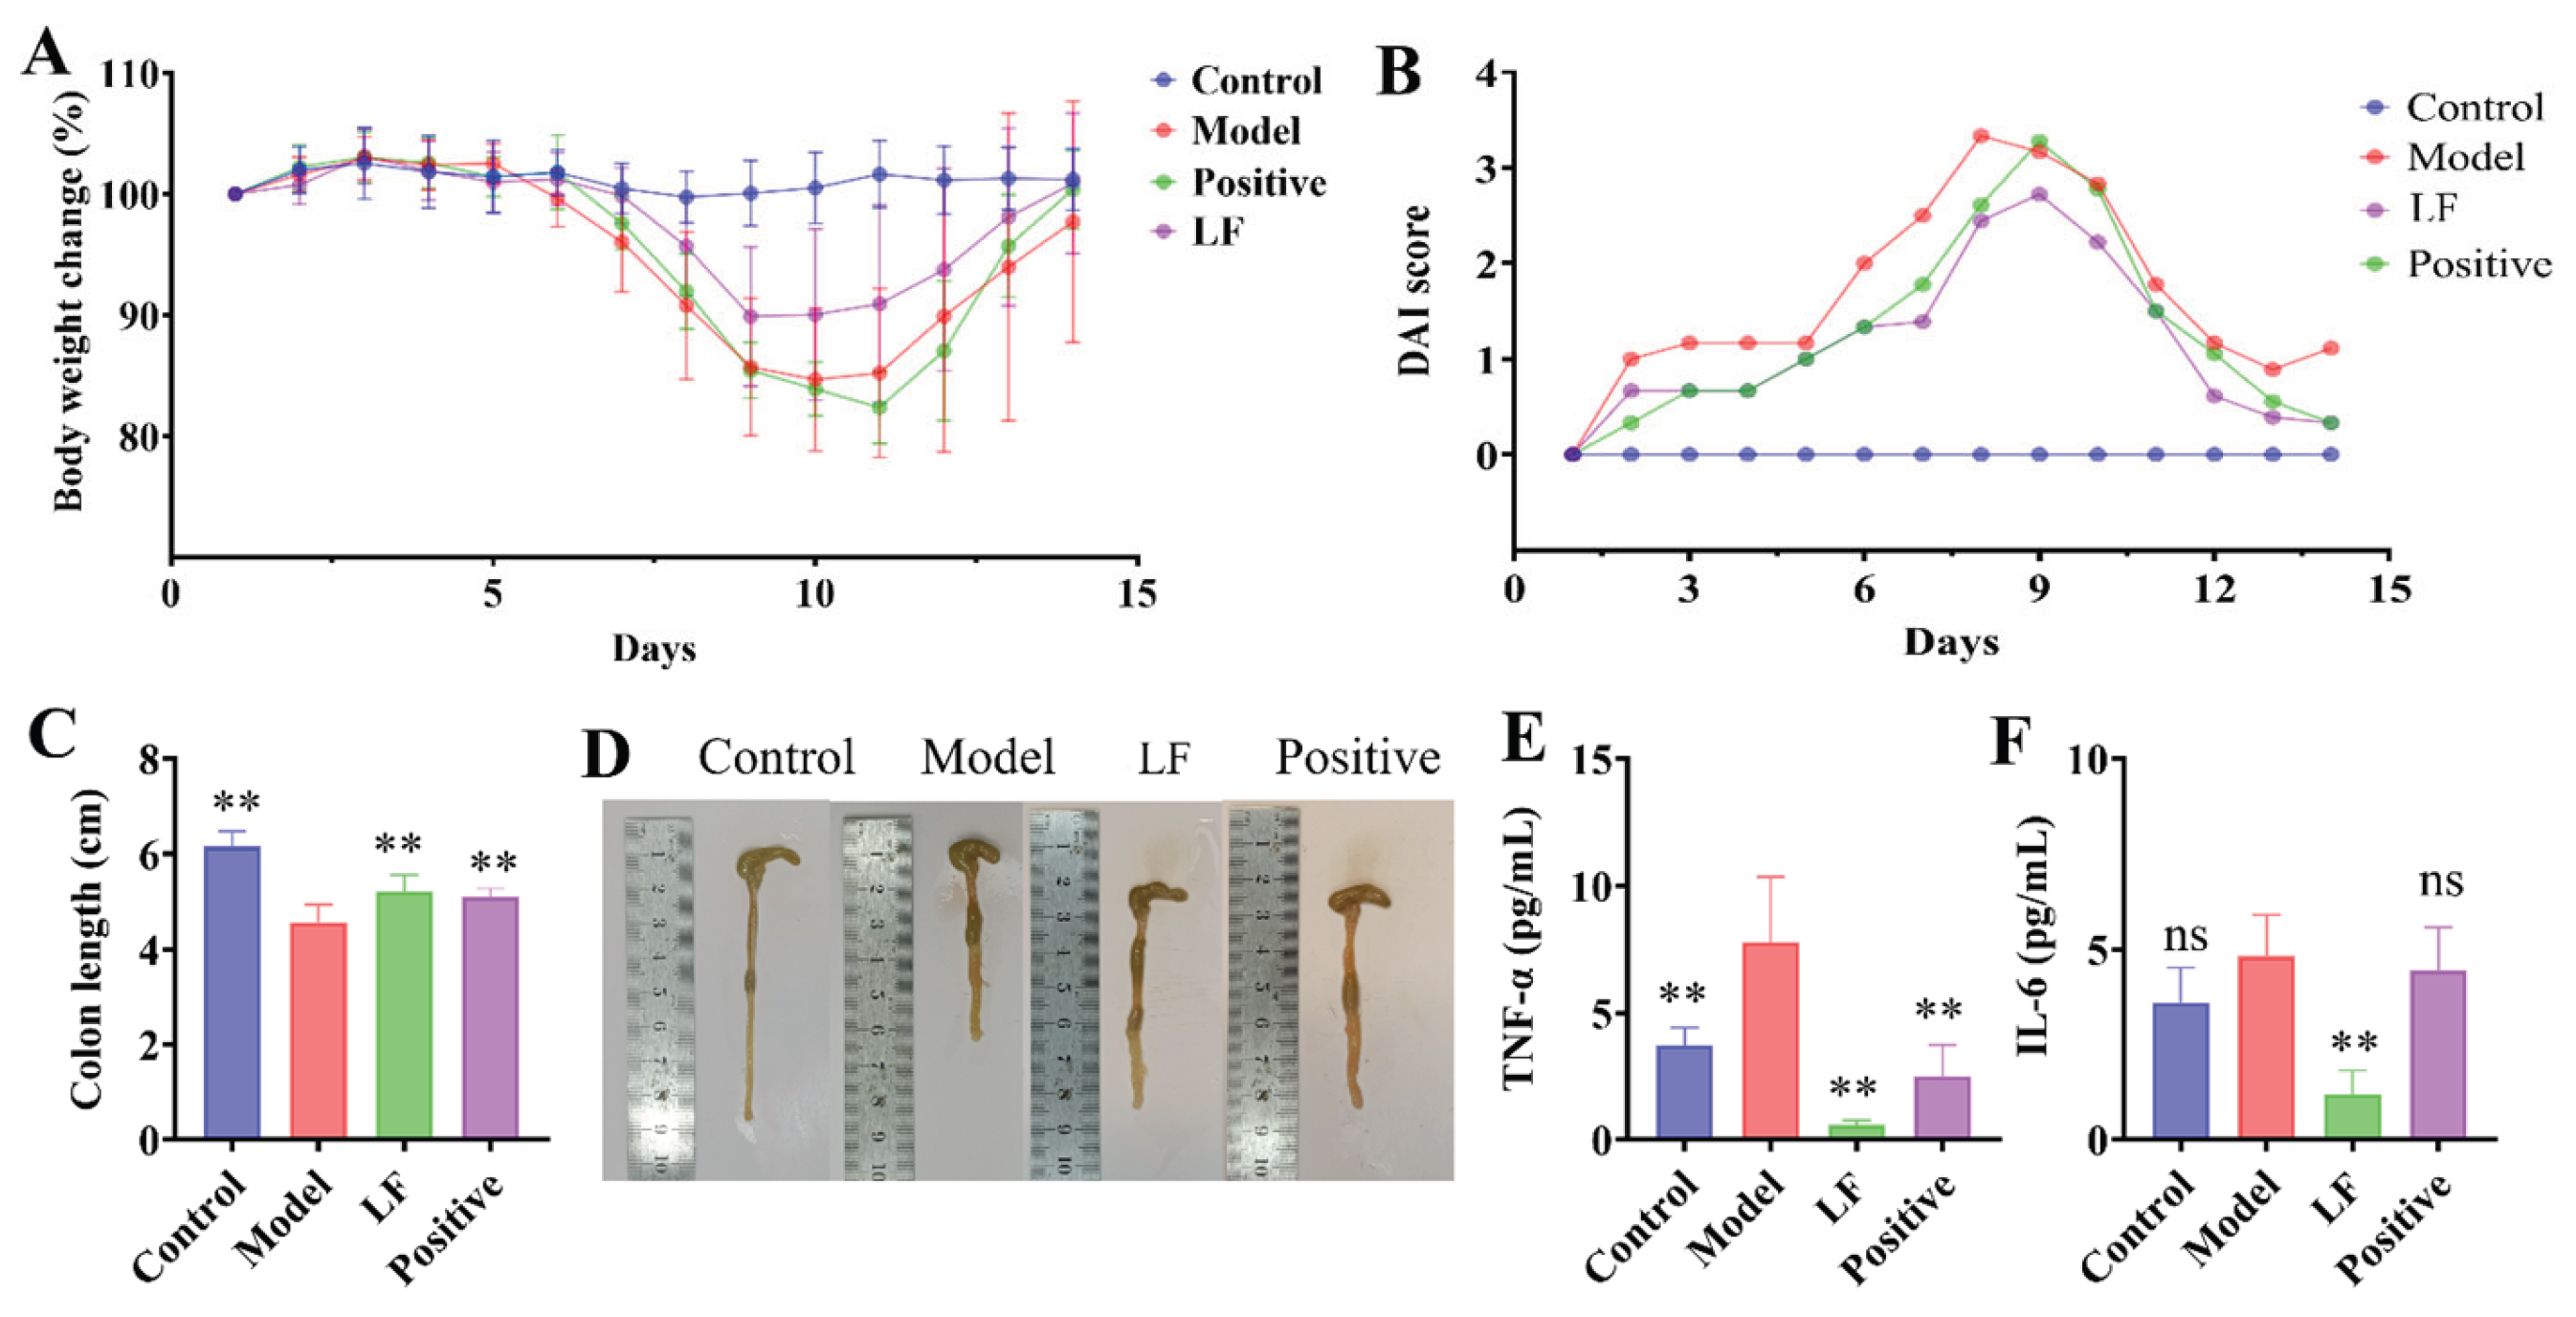
Figure 3.
Representative images of hematoxylin and eosin (H&E), AB-PAS, Occludin, Claudin-1, and ZO-1 staining in colon tissue at 100× magnification.
Figure 3.
Representative images of hematoxylin and eosin (H&E), AB-PAS, Occludin, Claudin-1, and ZO-1 staining in colon tissue at 100× magnification.
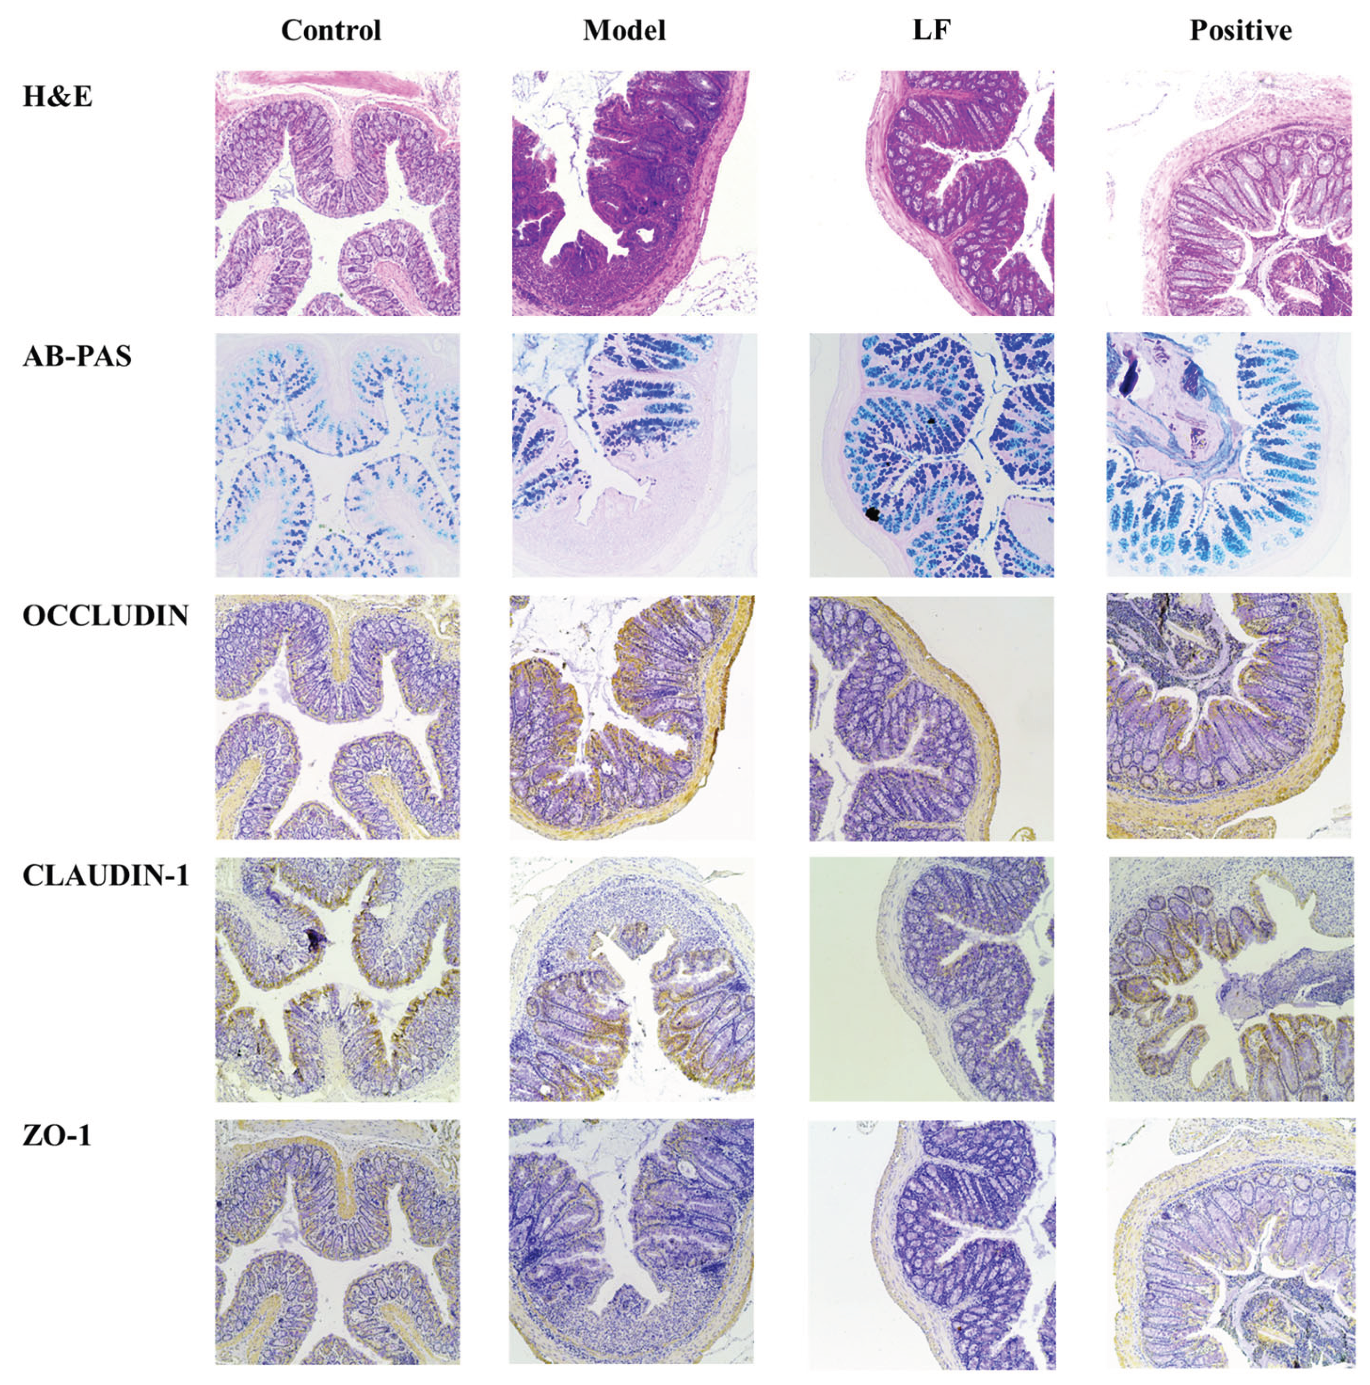
Figure 4.
Effects of LF on key protein expression in MAPK and NF-κB. (A) protein bands labeled with corresponding molecular weights via Western blot analysis. Expression levels are indicated by band intensity; (B) PPARγ expression levels; (C) MAPK expression levels, (D) The ratio of phosphorylated NF-κB p65 to total NF-κB p65.
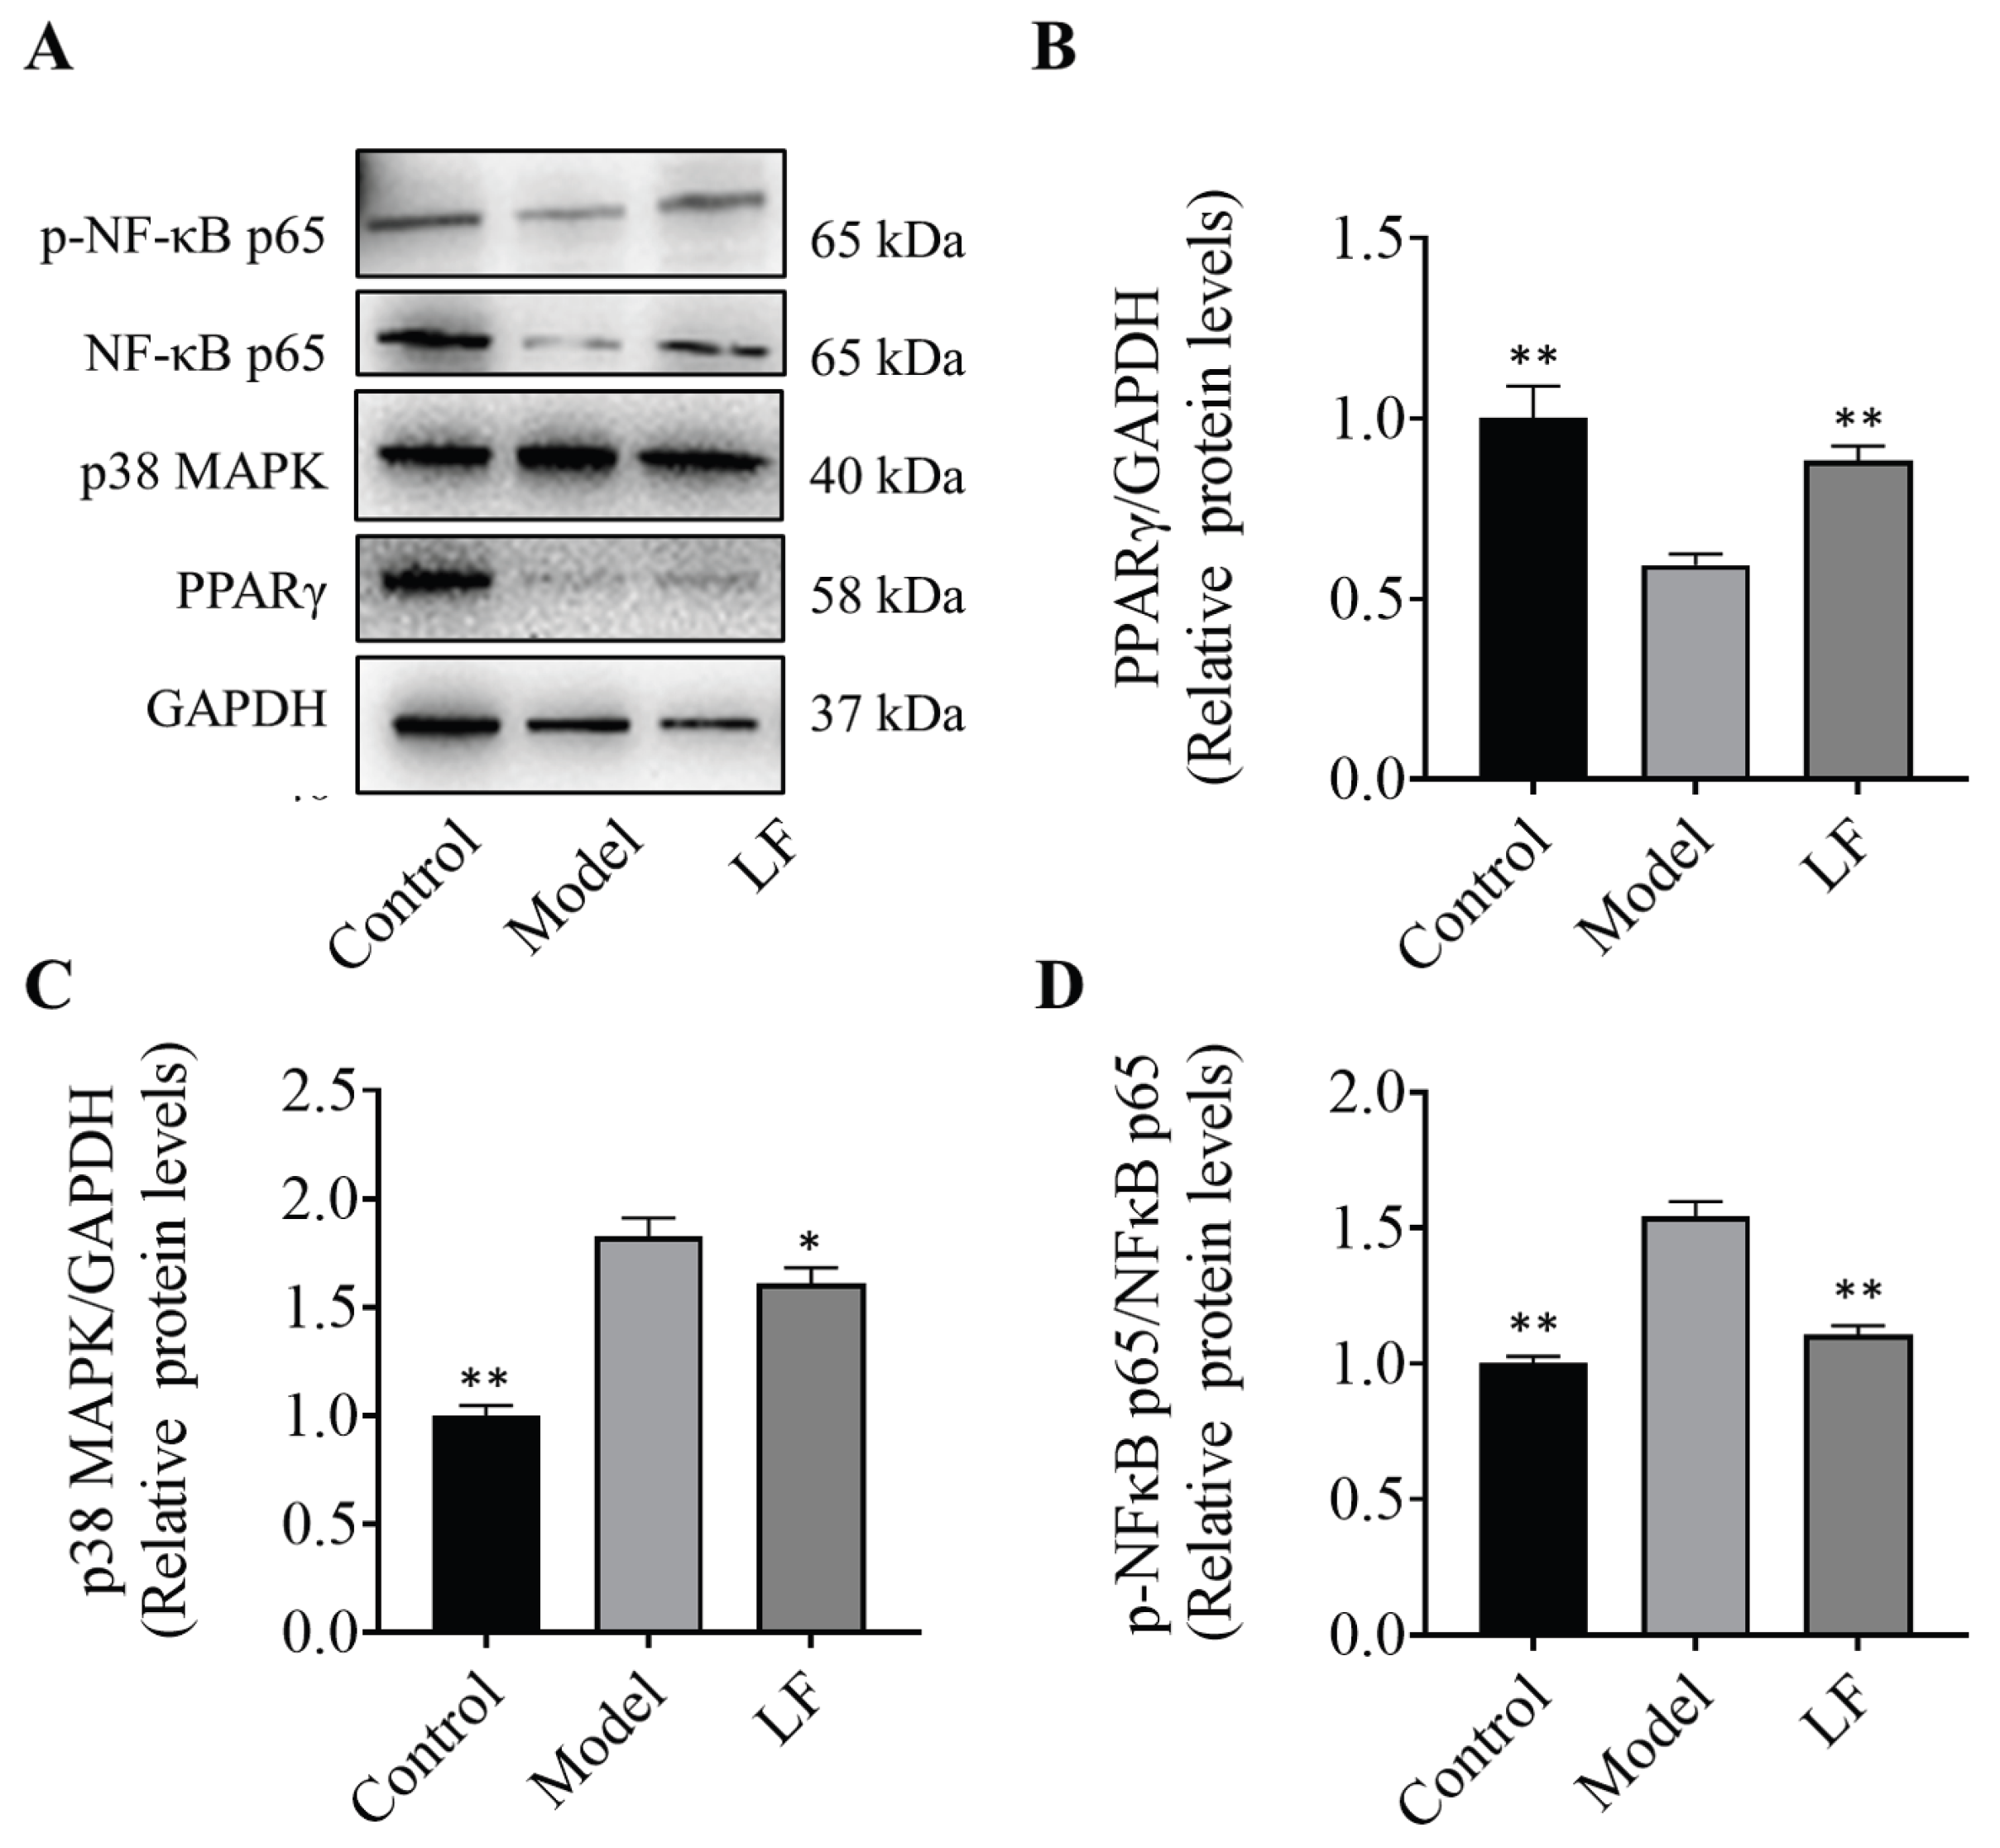
Figure 5.
Effects of LF on gut microbiota structure in DSS-induced UC mice assessed by 16S rDNA sequencing. Common or local OTUs in each group in the Venny diagram.
Figure 5.
Effects of LF on gut microbiota structure in DSS-induced UC mice assessed by 16S rDNA sequencing. Common or local OTUs in each group in the Venny diagram.
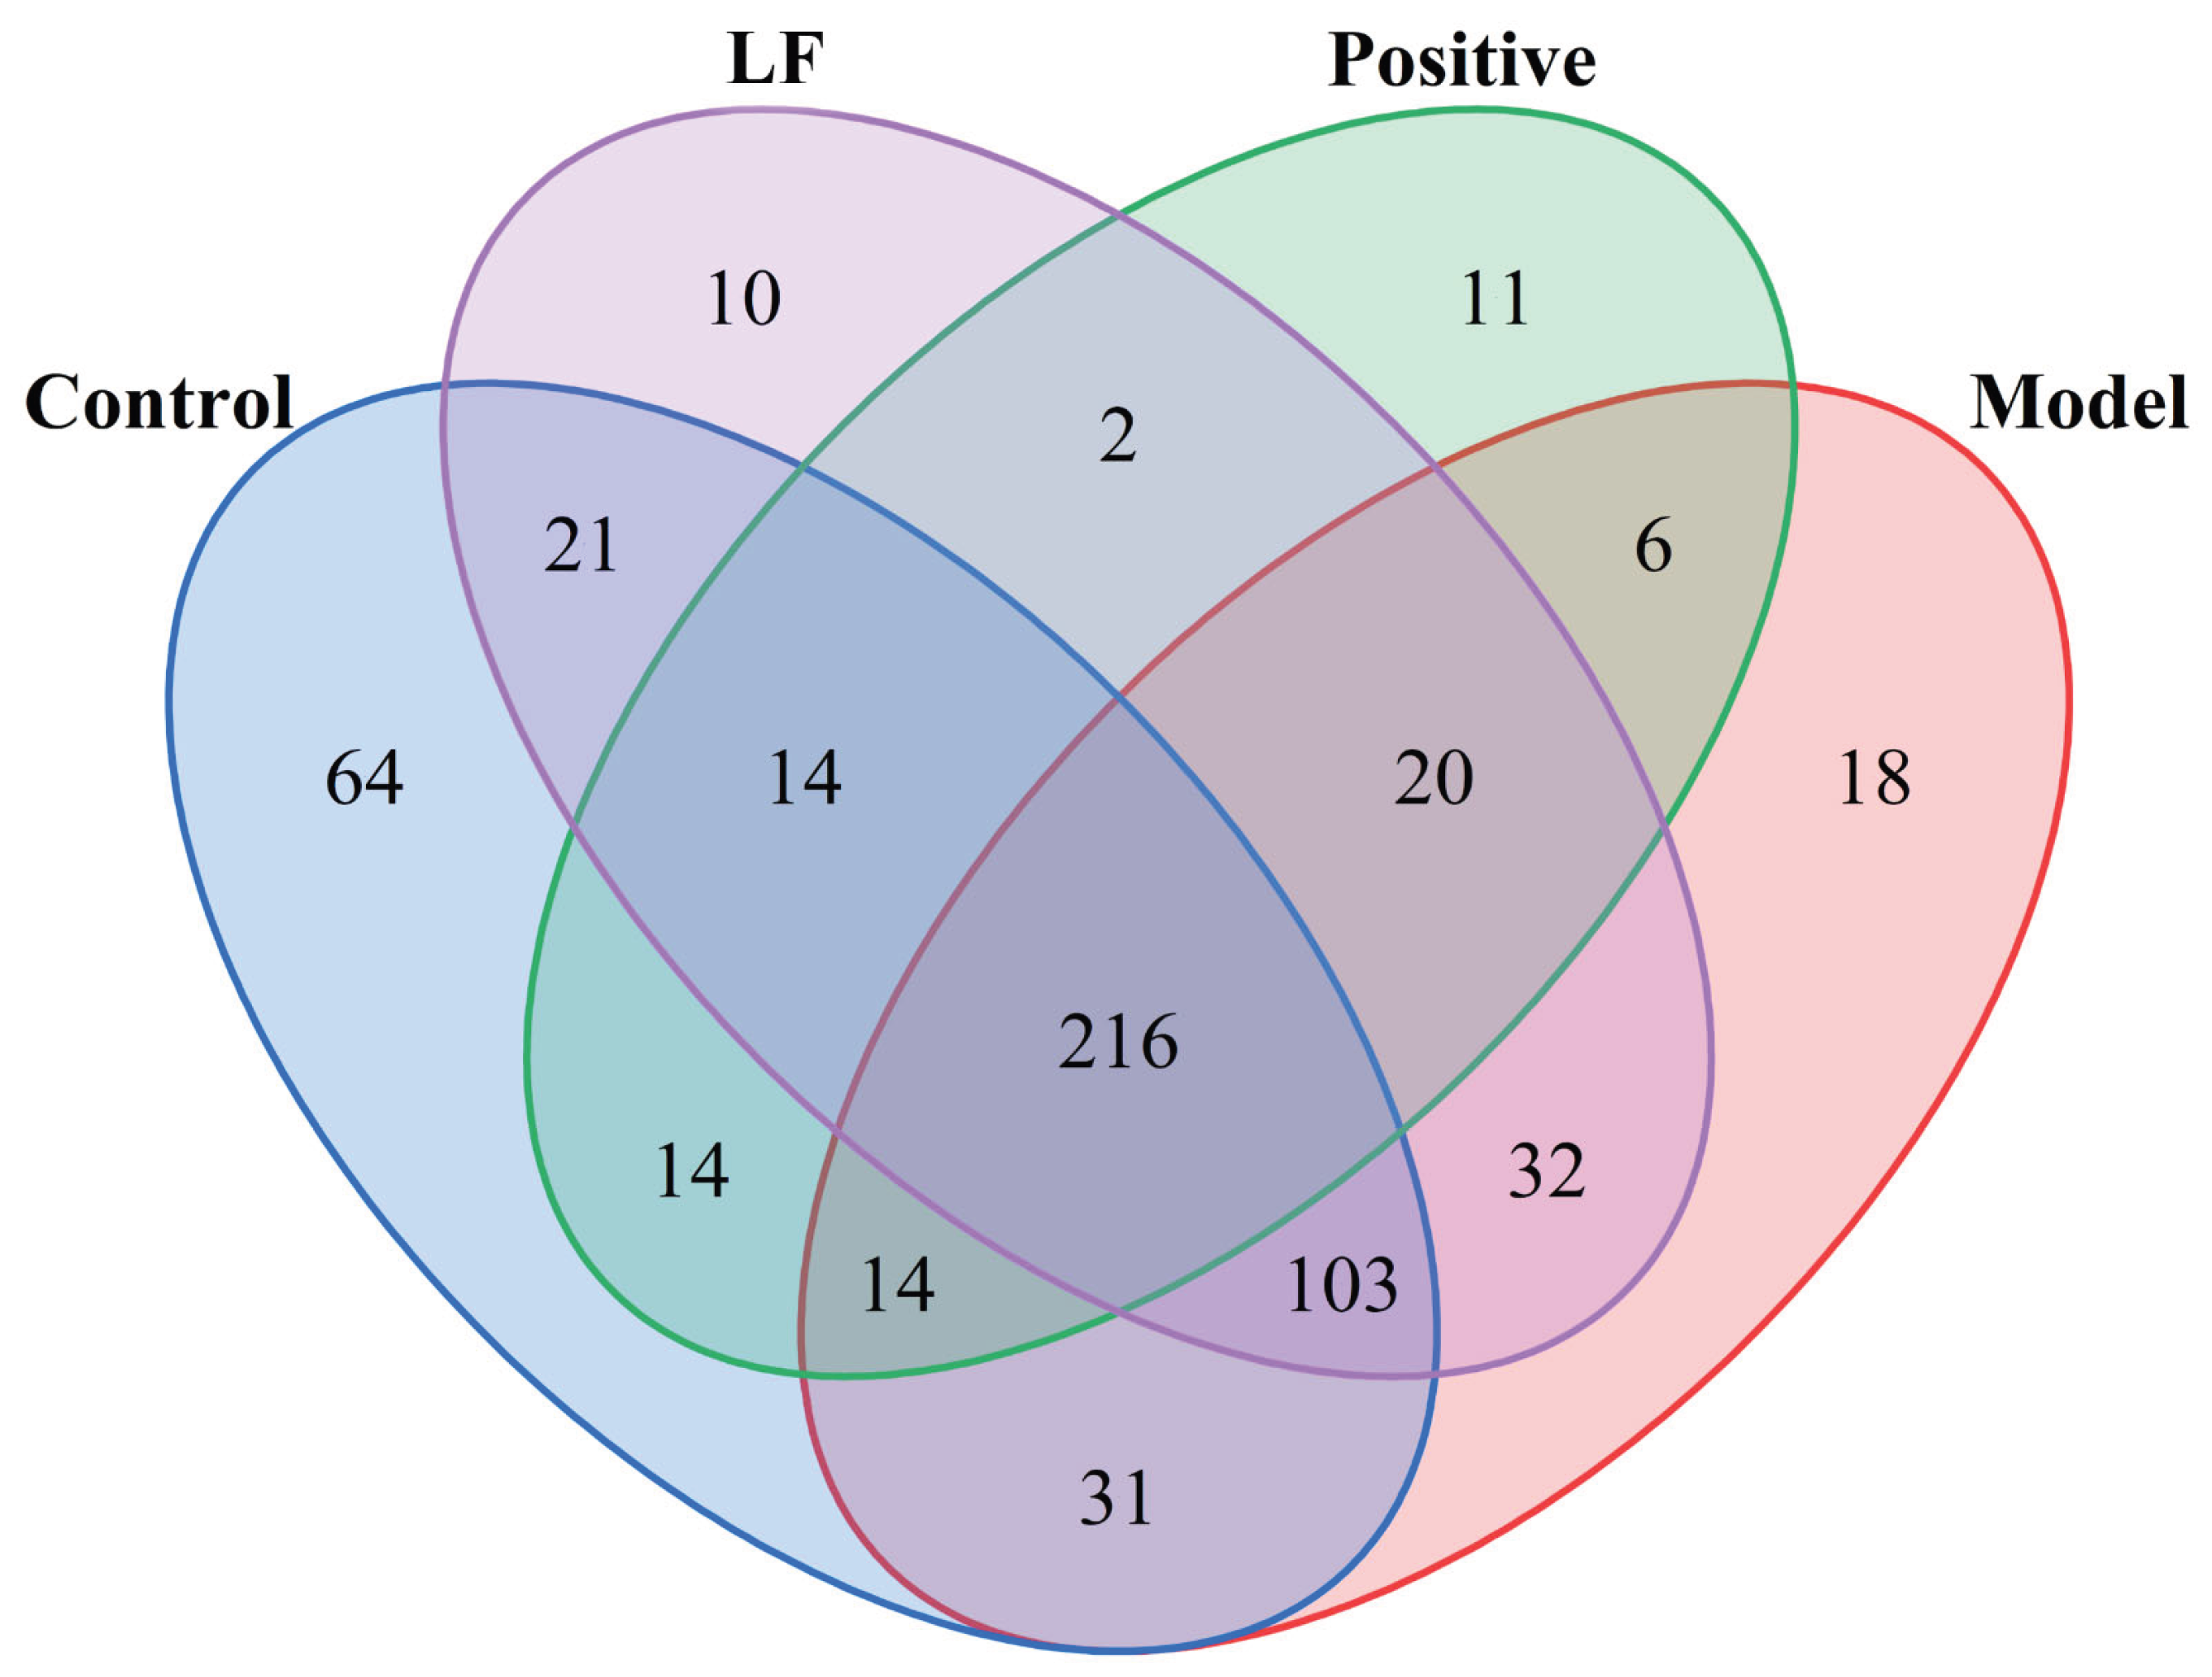
Figure 6.
Effects of LF on gut microbiota structure in DSS-induced UC mice assessed by 16S rDNA sequencing. (A) Microbiota changes at phylum level; (B) Microbial community changes at order level; (C) Microbial community changes at species level; (D) Microbial community changes at the class level; (E) Microbial community changes at genus level; (F) Microbial community changes at family level.
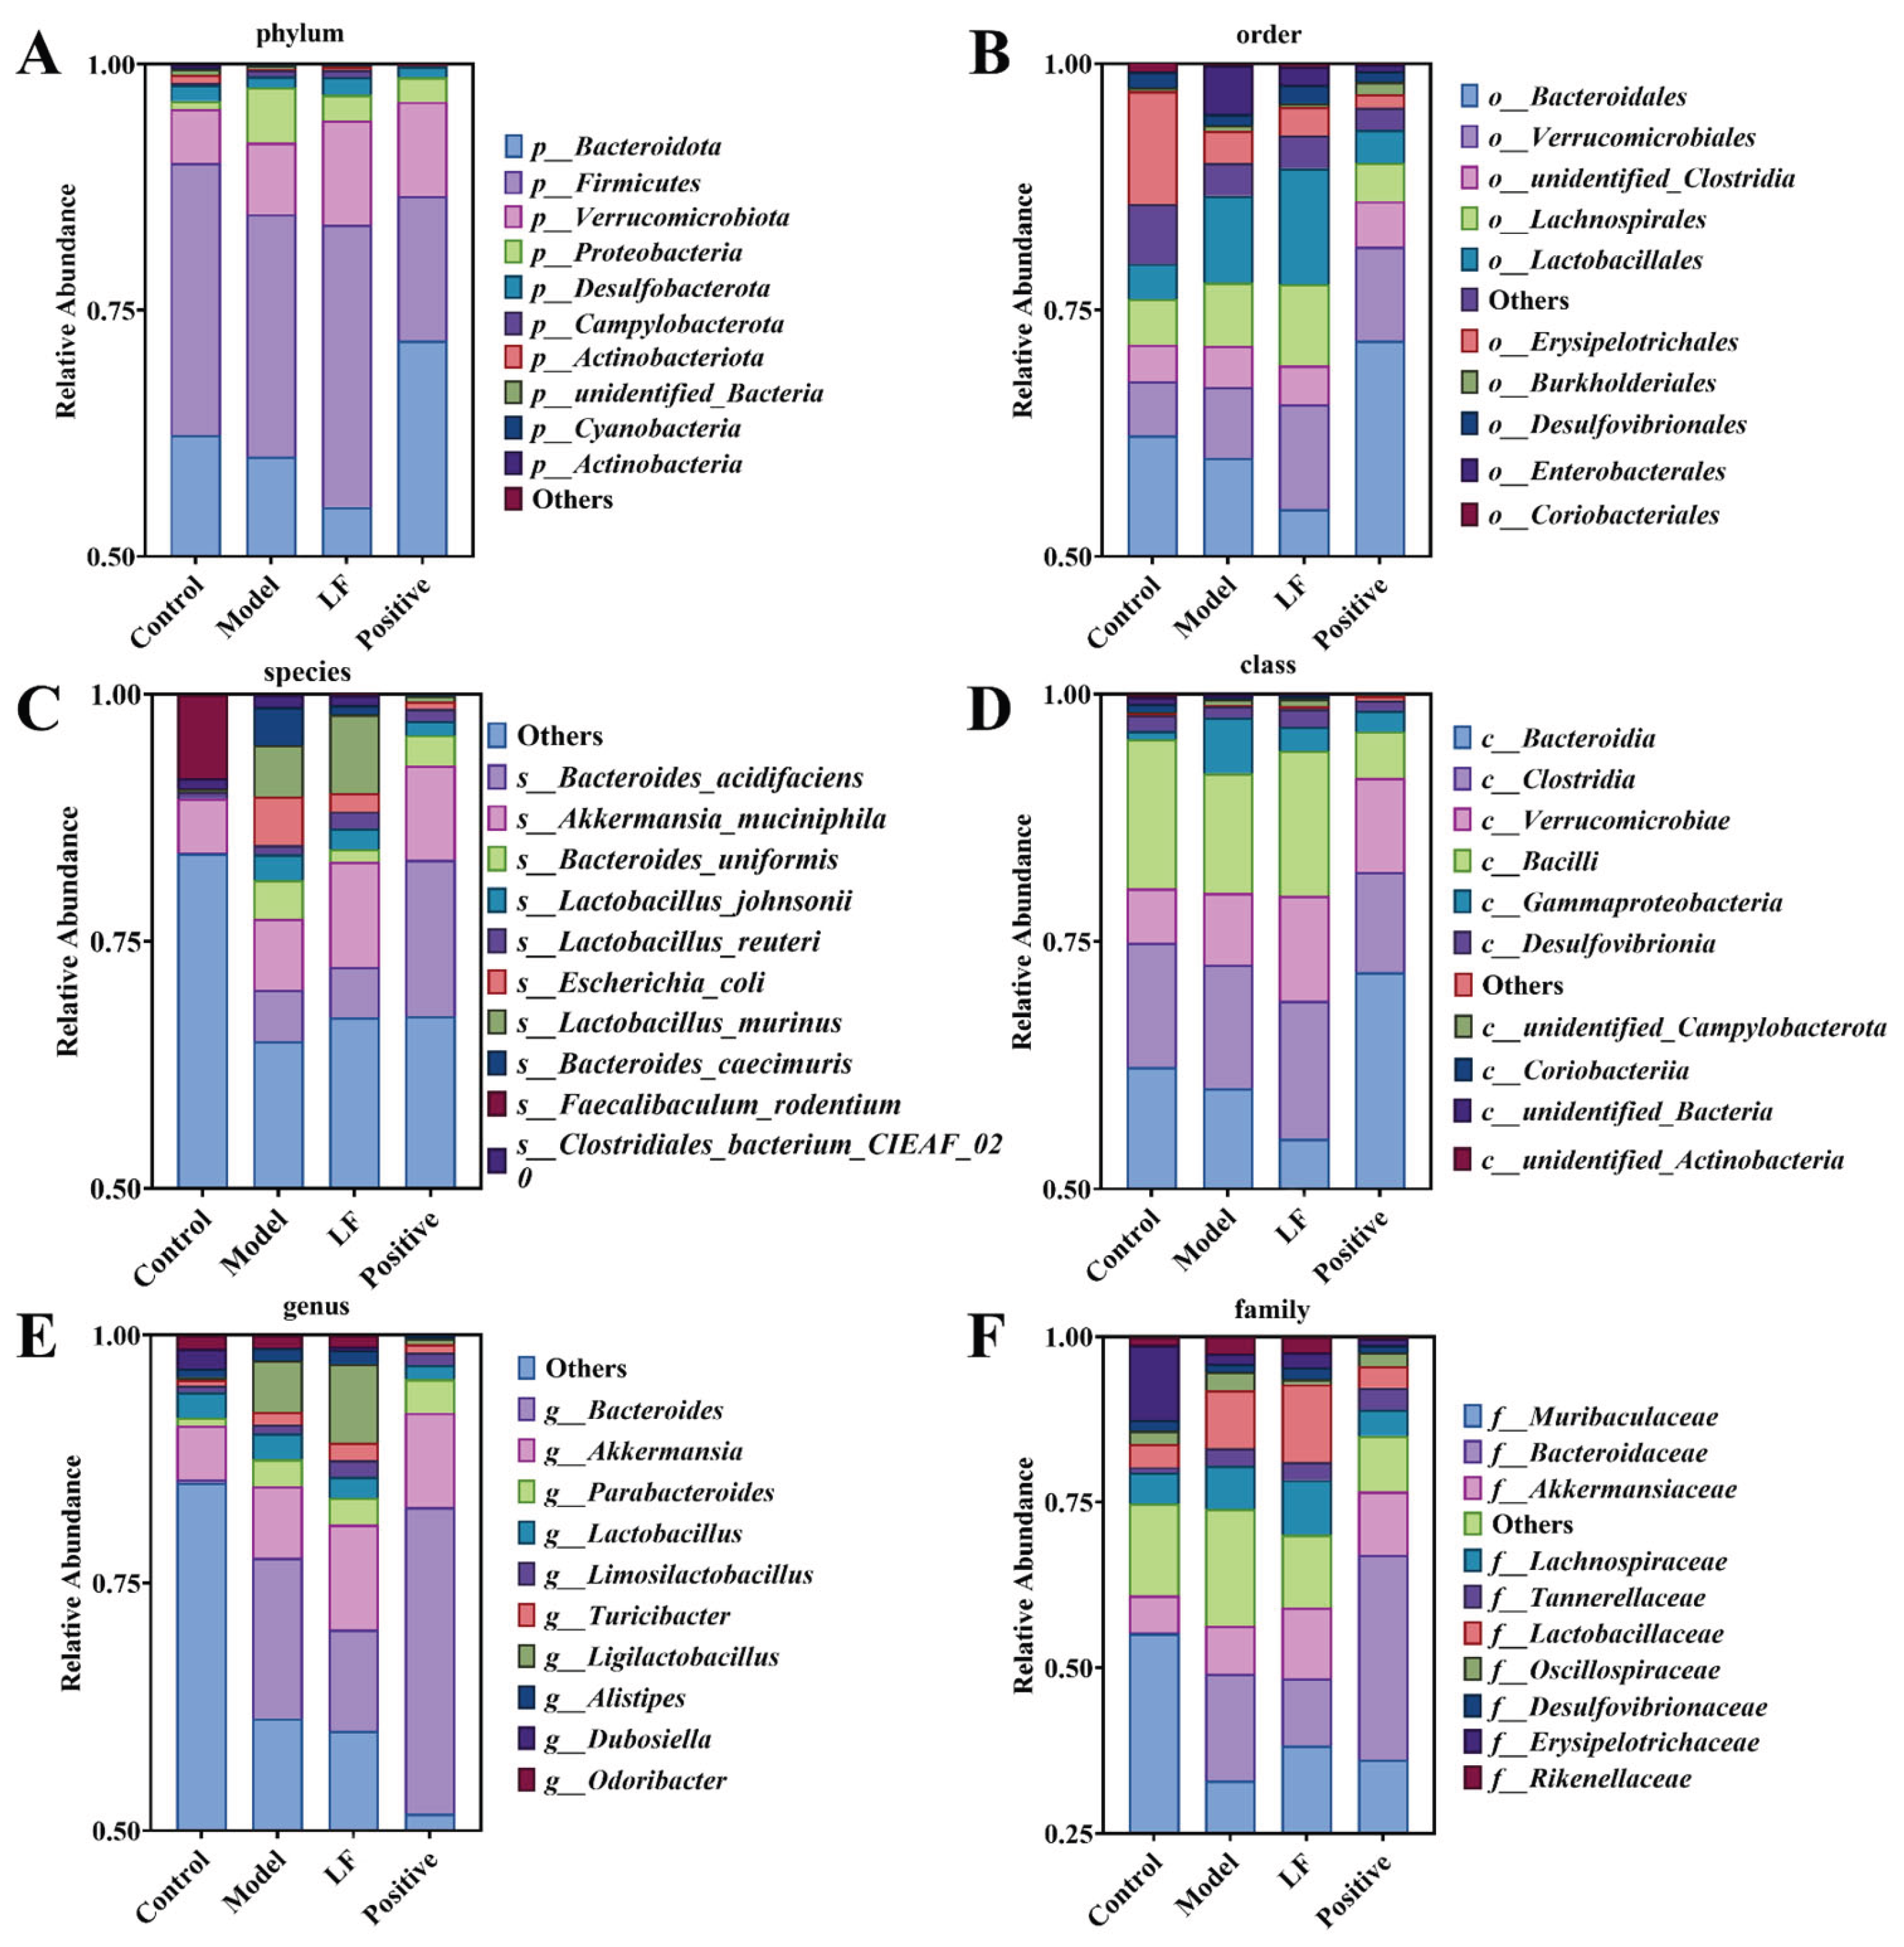
Figure 7.
Effects of LF on gut microbiota structure in DSS-induced UC mice, as analyzed by 16S rDNA sequencing. (A) Chao1 index; (B) Ace index; (C) Shannon index; (D) Simpson index.
Figure 7.
Effects of LF on gut microbiota structure in DSS-induced UC mice, as analyzed by 16S rDNA sequencing. (A) Chao1 index; (B) Ace index; (C) Shannon index; (D) Simpson index.
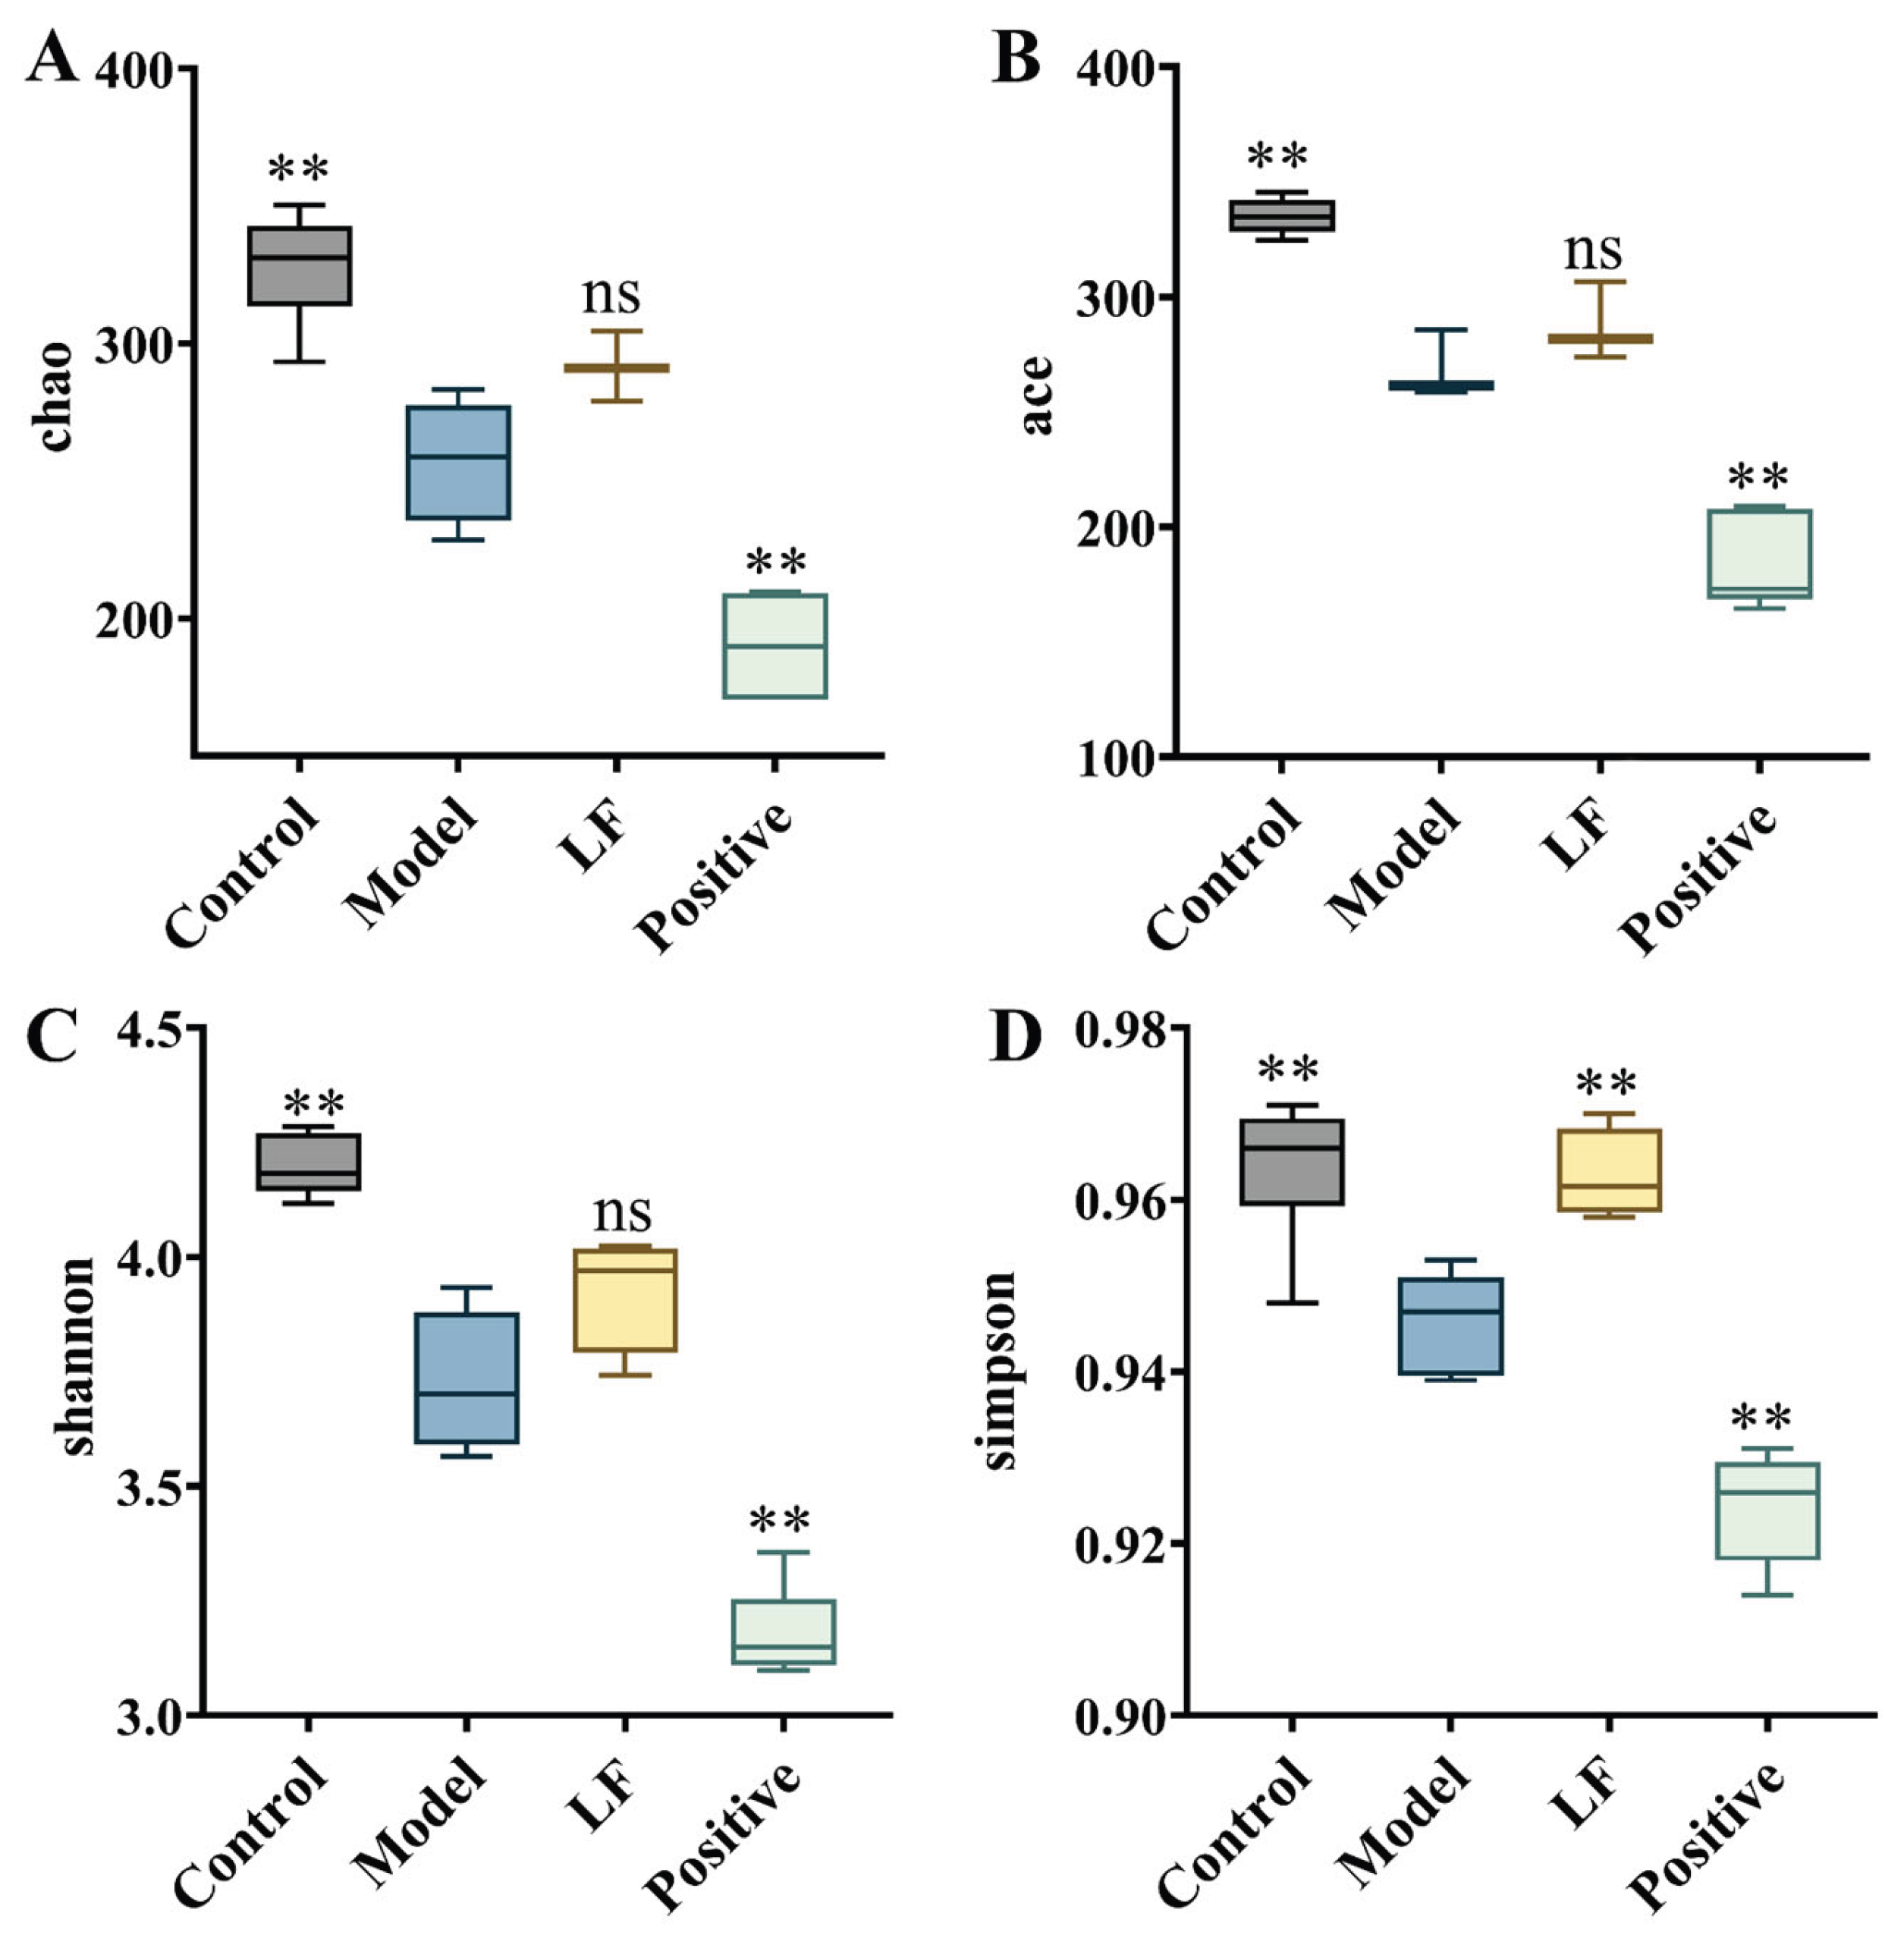
Table 3.
Flavonoids identified in licorice via LC-MS/MS screening analysis.
| No. | Proposed compound | RT (min) | [M+H] + | Molecular Formula | MS/MS | Intensity | Error (ppm) |
|---|---|---|---|---|---|---|---|
| 1 | Vicenin-2 | 9.22 | 595.17 | C27H30O15 | 593.1520, 473.1110, 383.0774, 353.0681 | 63194 | -0.6 |
| 2 | Schaftoside | 9.92 | 565.15 | C26H28O14 | 565.1548, 529.1348, 427.1022, 349.0706, 295.0602 | 51495 | -0.7 |
| 3 | Isoviolanthin | 10.7 | 579.17 | C27H30O14 | 579.1703, 525.1402, 441.1181, 337.0697, 325.0732 | 68588 | -0.9 |
| 4 | liquiritin apioside | 11.1 | 551.18 | C26H30O13 | 257.0799 | 10414 | 0.8 |
| 5 | Liquiritigenin | 11.32 | 257.08 | C15H12O4 | 257.0783, 211.0743, 165.0700, 137.0234, 91.0572 | 497237 | -0.3 |
| 6 | Liquiritin | 11.32 | 419.13 | C21H22O9 | 257.0812, 147.0449, 137.0245 | 68271 | -0.1 |
| 7 | Isoliquiritigenin | 13.32 | 257.08 | C15H12O4 | 135.0086, 119.0498, 91.0199 | 65944 | -0.8 |
| 8 | ononin | 13.8 | 431.13 | C22H22O9 | 269.0797 | 244477 | 0 |
| 9 | Isoliquiritin | 13.82 | 419.13 | C21H22O9 | 257.0798, 147.0442, 137.0237 | 310130 | 0.3 |
| 10 | Licorice saponin A3 | 15.97 | 985.46 | C48H72O21 | 985.4654, 809.4331, 647.3827, 471.3490, 453.3375 | 68805 | -1.4 |
| 11 | Yunganoside K2 | 18.04 | 839.41 | C42H62O17 | 839.4015, 487.3399, 469.3291, 451.3195 | 67260 | -0.9 |
| 12 | Glycyrrhizic acid | 18.99 | 823.41 | C42H62O16 | 647.3790, 471.3515, 453.3381 | 150522 | -1.6 |
| 13 | Formononetin | 19.24 | 269.08 | C16H12O4 | 269.0807, 253.0511, 237.0558, 213.0920, 192.0603 | 67773 | -0.5 |
| 14 | Glycyrrhizin | 20.22 | 823.41 | C42H62O16 | 823.4094, 453.3347, 435.3255, 353.0690, 159.0279 | 10468 | -2.3 |
| 15 | Gancaonin M | 20.64 | 353.14 | C21H20O5 | 353.1381, 297.0756, 267.0653, 184.0521, 69.0016 | 89924 | -0.7 |
| 16 | Glycycoumarin | 21.39 | 369.13 | C21H20O6 | 369.1328, 313.0689, 255.0644, 243.0649, 197.0597 | 514194 | -1.2 |
| 17 | Licoisoflavone B | 21.72 | 353.10 | C20H16O6 | 353.1016, 335.0917, 311.0561, 227.0703, 153.0191 | 214424 | -0.9 |
| 18 | Gancaonin L | 21.85 | 355.12 | C20H18O6 | 355.1208, 287.0561, 271.0614, 229.0865, 69.0750 | 116654 | 1.6 |
| 19 | Licocoumarone | 21.98 | 341.14 | C20H20O5 | 285.0761, 270.0513, 272.0678, 242.0561, 229.0853 | 69908 | -2.8 |
| 20 | neoglycyrol | 22.49 | 367.12 | C21H18O6 | 367.1175, 311.0545, 296.0315, 281.0440, 165.0554 | 101986 | -0.2 |
| 21 | Licoleafol | 22.91 | 373.16 | C21H24O6 | 317.1015, 207.0655, 179.0712, 151.0763, 149.0604 | 22044 | -2 |
| 22 | Licoricone | 23.18 | 383.15 | C22H22O6 | 383.1484, 327.0857, 313.1439, 286.0836, 243.1019 | 271856 | -1.4 |
| 23 | Glyasperin D | 23.6 | 371.18 | C22H26O5 | 371.1880, 303.1242, 235.1333, 181.0863, 69.0753 | 74971 | -1.8 |
| 24 | Licorisoflavan B | 23.72 | 425.23 | C26H32O5 | 425.2247, 313.1020, 295.0957, 189.0904, 135.0441 | 795050 | -2.7 |
| 25 | Licochalcone D | 24.07 | 355.15 | C21H22O5 | 355.1486, 299.0907, 286.0829, 271.0597, 269.0423 | 41272 | -4.4 |
| 26 | Glyasperin A | 24.14 | 423.18 | C25H26O6 | 423.1810, 367.1184, 311.0560, 299.0560 | 115857 | -0.4 |
| 27 | 3-Hydroxyglabrol I | 24.2 | 409.20 | C25H28O5 | 409.2006, 353.1370, 233.0796, 191.0316, 133.0636 | 27409 | -2.4 |
| 28 | 1-Methoxyficifolinol | 24.36 | 423.21 | C26H30O5 | 423.2147, 367.1517, 221.1162, 173.0956, 149.0599 | 426293 | -1.9 |
| 29 | Licorisoflavan A | 25.24 | 439.25 | C27H34O5 | 439.2460, 383.1846, 315.1218, 235.1318, 137.0598 | 464546 | -2.7 |
Disclaimer/Publisher’s Note: The statements, opinions and data contained in all publications are solely those of the individual author(s) and contributor(s) and not of MDPI and/or the editor(s). MDPI and/or the editor(s) disclaim responsibility for any injury to people or property resulting from any ideas, methods, instructions or products referred to in the content. |
© 2026 by the authors. Licensee MDPI, Basel, Switzerland. This article is an open access article distributed under the terms and conditions of the Creative Commons Attribution (CC BY) license (http://creativecommons.org/licenses/by/4.0/).
Copyright: This open access article is published under a Creative Commons CC BY 4.0 license, which permit the free download, distribution, and reuse, provided that the author and preprint are cited in any reuse.


