
Submitted:
07 January 2026
Posted:
08 January 2026
You are already at the latest version
Abstract
The increasing demand for high-quality dragon fruit in the European market requires efficient quality assessment methods. This study explores a non-destructive image analysis approach for classifying ripe dragon fruits based on fruit ripeness and weight. A low-cost system equipped with visible and ultraviolet lighting was employed to capture images of 60 ripe dragon fruits over a storage period, extracting parameters such as visible and ultraviolet perimeter, maximum and minimum diameter and area, and RGB color coordinates. In a first step, the main characterization magnitudes were confirmed. A ripening index was calculated based on soluble solid content and acidity. Then, a cluster analysis was used to segregate the fruits into three quality characteristics based on the ripening index and weight. In a second step, a step-by-step discriminant analysis was conducted to classify the fruits into the three quality categories (based on the laboratory measured weight, soluble solid content and total acidity) using the non-destructive magnitudes extracted from the image analysis. The proposed classification system achieved an accuracy of nearly 85 \% of well classified dragon fruits, effectively segregating dragon fruits into the three established categories. urthermore, the established model could select the very high-quality dragon fruit (riper and larger fruits) with 93 \% of correctly dentified products.Compared to conventional destructive methods, this non-destructive approach offers a promising, cost-effective, and reliable solution for quality assessment. The findings highlight the potential for integrating smart technologies into fruit classification processes, during automatic harvest and postharvest operations, ultimately improving efficiency, reducing labor costs, and enhancing product consistency in the dragon fruit industry.
Keywords:
dragon fruit
; image analysis
; quality
; firmness
1. Introduction
Dragon fruit has recently been introduced to the European market. This herbaceous perennial climbing cactus, scientifically known as Hylocereus spp., is gaining attention for the consumers [1]. This is not only due to its appealing red or pink color, economic significance, and rich content of antioxidants, vitamins, and minerals but also because of its cost-effective maintenance and high profitability. Recently introduced in the Mediterranean regions, the cultivation of dragon fruit has experienced rapid growth in Spain Mediterranean areas [2]. Harvesting robots can mitigate labor shortages while offering a cost-effective solution to increasing labor expenses [3,4].
Image analysis is an important step in robotic fruit harvesting, allowing the autonomous system to identify and efficiently harvest fruits [5]. Fruit characteristics such as size, color, and shape are essential for autonomous harvesting [6]. Advanced computer vision techniques, including image imaging and advanced data analysis techniques, allow robots to detect fruit presence, distinguish between different fruit types, and assess ripeness based on color, texture, and size [7]. Accurate image analysis helps minimize harvesting errors, such as picking unripe or damaged fruits, which can significantly impact crop yield and market value [8]. Furthermore, it enhances efficiency by optimizing robotic arm movements, ensuring precise fruit localization, and reducing time spent on unnecessary actions [9].
Machine learning models trained on large datasets improve fruit classification and defect detection, aiding in quality control during harvesting [10]. Additionally, image analysis assists in identifying occlusions caused by leaves or branches, allowing the robot to navigate complex environments without damaging surrounding vegetation [11]. By integrating multi-spectral imaging and depth perception, robots can evaluate fruit maturity beyond visual inspection, improving decision-making in real-time [12]. The implementation of high-resolution cameras, LiDAR, and thermal imaging further refines fruit detection accuracy, especially in varying lighting conditions [13,14]. Ultimately, image analysis is indispensable for the successful deployment of robotic fruit harvesting systems, leading to higher productivity, reduced labor dependency, and improved agricultural sustainability [15]. Image fruit robot analysis could be used to assess fruit quality before picking based on a decision system to harvest fruit with an optical ripeness stage [16]. Fruit size and color are the most commonly used criteria to distinguish between ripe and unripe produce [17].
Image analysis has proven successful in various fruit classifications. Previous studies achieved a 90.24% overall accuracy rate in categorizing persimmon fruit [18]. In mango classification, a combination of models like RF, LDA, SVM, and KNN, as well as an 8-layer convolutional neural network (CNN), achieved accuracy rates up to 95.67% [19]. In the case of mangosteen, a convolutional neural network model was proposed to detect defects and aid in sorting [20]. For classifying strawberries [21] used an RGB imaging system combined with convolutional neural networks and obtained accuracy higher than 90% Refered to ultraviolet, [22] proved that ultraviolet imaging can be used to identify hidden defects under mango peels, using geometric data extracted from the images to enable computer-based classification of apples between bruised and non-bruised.
An automatic dragon fruit quality classification system was proposed, utilizing image analysis, and demonstrated an impressive accuracy of 98.5%, surpassing manual classification six times [23]. Other previous studies have also utilized a combination of image processing and artificial intelligence to recognize dragon fruit attributes, such as ripeness. Related to dragon fruit firmness [24] used non-destructive firmness parameters to identify two ripeness stages of dragon fruit related to color and other quality parameters. Previous authors defined algorithms based on shape, size, weight, color, and diseases to classify dragon fruits during sorting and grading operations, proposing three machine learning techniques (ANN, SVM, and CNN) [25]. A classifying system was also proposed by [26] using a model combining machine learning and image processing with convolutional neural networks, trained on a dataset of 1287 dragon fruit images. Considering that effective detection by machine learning models necessitates a substantial amount of data, [27] gathered a dataset during four months from three distinct locations in Bangladesh, covering different stages from unripe to ripe and decayed fruits. Despite previous advancements, image analysis has not yet been extensively explored for evaluating dragon fruit quality assessment in harvest and postharvest operations when most of the fruits are ripe. The objective of the present study was to address ripe dragon fruit quality classification using a low-cost image analysis system and identify the very high quality fruits.
2. Materials and Methods
2.1. Vegetal Material
A total of 60 red dragon fruits (Hylocereus costaricensis) were selected, from a local farm in Valencia (Spain). The fruits were selected free of physical damage, and uniform in appearance and size, classified according to the ASEAN Standard for Dragon Fruit as Class I (grade B used in practical market grading systems to denote a standard/medium quality category) with red color for the skin and the flesh, [28]. All samples corresponds to good quality fruits, rather than extremes of the quality spectrum, Figure 1.
The fruits were all collected in a harvesting ripeness stage. The average diameter was 0.08 m and the weight was 0.4 to 0.5 kg. The dragon fruits were transferred directly to the laboratory. After marking the fruits from 1 to 60, labeled on both sides, the fruits were stored in a cool chamber (6 °C, 85% RH) for 4 days. All the 60 fruits were examined using two distinct quality assessment methods, first with the nondestructive method and then with the destructive method. The fruits were stored in the cold chamber and removed every other day for analysis. On every testing day, all the samples were non-destructively tested and 15 were destructively tested.
The average diameter was 0.08 m and the weight was 0.4 to 0.5 kg. The dragon fruits were transferred directly to the laboratory. After marking the fruits from 1 to 60, labeled on both sides, the fruits were stored in a cool chamber (6 °C, 85% RH) for 4 days. All the 60 fruits were examined using two distinct quality assessment methods, first with the nondestructive method and then with the destructive method. The fruits were stored in the cold chamber and removed every other day for analysis. On every testing day, all the samples were non-destructively tested and 15 were destructively tested.
2.2. Non-Destructive Assessment
A low-cost non-destructive image analysis system with two visible and ultraviolet lighting (Greenvision, www.greenvision,com) was used, Figure 2.
The imaging system used in this study is an integrated laboratory platform combining multispectral hardware and dedicated control software. It includes a visible (VIS) camera (400–700 nm) capturing images under visible illumination and UV-induced fluorescence. The camera is mounted on a movable structure, allowing reproducible framing and adjustment of working distance. The system employs multispectral illumination with visible LEDs and UV fluorescent tubes. Image acquisition is performed sequentially, with only one light source active at a time, preventing spectral interference and ensuring each image corresponds to a well-defined spectrum. The optical system uses 6 mm lenses to cover the sampling tray in a single capture while maintaining minimal distortion. Control software synchronizes the camera and illumination, manages automated acquisition sequences, and stores the images in a structured manner. Images are automatically segmented using artificial intelligence algorithms to detect and isolate individual fruits, extract contours, and track their positions, ensuring full traceability. From the segmented regions, geometric and color parameters are extracted and associated with the illumination spectrum, fruit position, and acquisition session. This configuration allows reproducible, traceable, and fruit-specific data acquisition, including RGB images from the VIS camera, while leveraging induced spectral responses (such as visible fluorescence from UV illumination) to enhance the characterization of fruit maturity and quality.
Visible and UV images of dragon fruit on each alternate day of storage, were taken by placing dragon fruit directly into the image chamber. Two images were captured from each side of the fruit and each type of light. The image analysis parameters obtained were visible and ultraviolet perimeter, maximum and minimum diameter, and colour coordinates RGB (Figure 3).
After the non-destructive image analysis was finished, weight loss was measured using a digital balance (Mettler Toledo AL104 electronic balance, Im Langacher 44, Horticulturae 2023, 9, 1286 5 of 11 8606 Greifensee, Switzerland).
2.3. Destructive Quality Assessment
Laboratory reference destructive variables were measured to assess dragon fruit quality using standardized magnitudes. Destructive firmness was measured using a universal stress-strain machine (Ibertest, model IBTH 2730, www.ibertest.es), with a constant speed of 1.67 . The firmness of each fruit was measured at three different points of the equatorial area using a 0.008 m probe. Three repetitions were carried out per fruit. Using a blender, each dragon fruit was juiced separately, and the filtered liquid juice was utilized to calculate the soluble solid content. The digital refractometer was utilized to measure the soluble solid content (Atago model PAL-3; Atago Co., Tokyo, Japan). Results are expressed in °Brix, which indicates the concentration of total soluble solids in the fruit juice, primarily sugars but also other soluble compounds. Tritatable acidity was measured with an automatic titrator (Mettler Toledo AL104 electronic balance, Im Langacher 44, 8606 Greifensee, Switzerland). A known volume of fruit juice was titrated with a standardized sodium hydroxide (NaOH) solution until reaching an endpoint of pH 8.1. The results were expressed as grams of citric acid equivalent per 100 g of sample.
2.4. Data Analysis and Modeling
The statistical analysis was performed by using a commercially available software package (Statgraphics Centurion 18 Software, version 18.1.13 (Statgraphics Technologies, Inc., The Plains, VA, USA)). One-way analysis of variance was used to assess the effect of the treatments on the destructive measured variables. An step-by-step discriminant analysis based on the non-destructive variables (visible and ultraviolet perimeter, maximum and minimum diameter, and area, and color coordinates) extracted from the image analysis system was used for the classification of the fruits into different ripeness categories according to the testing days.
3. Results
In Table 1 the measured variables (average values and standard deviation) are shown, from the destructive and non-destructive characterization analysis and from the image analysis.
One of the main parameters used to evaluate dragon fruit quality is weight. In a first step, the variable weight was analyzed. A partial least square (PLS) model was established to determine weight according to the image analysis variables, Table 2 and Figure 4. Five latent components were extracted, and model stability was assessed through leave-one-out cross-validation. The cross-validation results showed that the model explained 91.53% of the variability in fruit weight, with a predictive R-squared of 90.46 %. These findings confirm that weight, a key quality parameter, can be reliably estimated from image analysis features, supporting the feasibility of non-destructive prediction.
The quality variables measured by destructive test were analyzed. An analysis of variance was developed to study the effect of the factor testing day on the destructive variables. Significant differences were found in the soluble solid content and the total acidity according to the testing day. During the storage period, as expected, sugar content increased, and total acidity decreased. However, no significant differences were found in the mechanical firmness, showing a wide variability between fruits. Following previous studies ([29,30]), a ripening index was established based on the destructive variables (soluble solid content and total acidity), according to Equation (1).
During the storage period, significant differences were found in the ripeness index according to the testing day, Figure 5.
Cluster analysis based on laboratory-measured fruit weight and ripening index (related to soluble solids and total acidity) identified three distinct categories of dragon fruit quality using Ward’s method and squared Euclidean distance after standardization. Category 1: “Unripe” included fruits with a very low ripening index, indicating low sugar content and poor flavor. Category 2: “Large-sized ripe” comprised fruits with an acceptable ripening index and high weight, corresponding to fruits of larger size with good flavor. Category 3: “Small-sized ripe” contained fruits with an acceptable ripening index but low weight, corresponding to fruits of smaller size with good flavor. Operationally, samples were assigned to the category whose centroid (mean ripening index and weight in standardized space) was closest, following the Ward clustering procedure. Fruits with a ripening index of about 0.8 or lower are classified as “Unripe.” Among fruits with a ripening index around 0.8 or higher, those weighing less than approximately 400 grams are categorized as “Small-sized ripe,” while those weighing about 400 grams or more are categorized as “Large-sized ripe.”
Based on the three groups determined using a cluster analysis technique (Ward method and squared Euclidean distance), Figure 6. The category number 1 (shown in blue in Figure 6) had a very low ripening index (low sugar content and high acidity), and was labelled as “unripe”. The category number 3 (shown in purple in Figure 6) had an acceptable ripening index but low weight, and was labelled as “small sized-ripe”. And the category number 2 (shown in orange in Figure 6) had an acceptable ripening index and high weight, and was labelled as “large sized-ripe”.
In a second step, a step by step discriminant analysis was undertaken, utilizing the non-destructive variables obtained by the Image analysis (visible and ultraviolet perimeter, maximum and minimum diameter, and color coordinated RGB) to classify the fruit into the three categories established based on ripening index and weight. A percentage of 70% of the data was used for building the model and 30% for validating the model. The results showed that 84.9% of the fruits were accurately classified into their respective categories by the model (Table 3 and Figure 7). Besides, 74,10% of the fruits from the validating set were correctly classified using the developed model. This shows the discriminant analysis effectively uses non-destructive factors to correctly classify dragon fruits according to their quality based. The results showed that more than 90% of the fruits from “ripe-large sized” were correctly classified, more than 85% from the “ripe-small sized” and nearly 80% of the “unripe” dragon fruits. The variables selected in the step by step analysis to classify the fruits into the quality categories were the ultraviolet extracted variables perimeter, area and minor diagonal and the visible color coordinate G.
4. Discussion
Compared to conventional sensory evaluation methods, mechanical and chemical destructive tests have been proposed as alternative methods for assessing fruit quality attributes. Chemical analysis utilizing destructive laboratory devices is a recognized technique for evaluating the quality attribute of fresh fruits, especially in dragon fruit among other fruits. Determining the soluble solid content of fruit juice is a commonly employed approach to evaluating fruit juice quality, particularly about taste attributes. Soluble solid content indicates the sugar concentration in the juice, which is closely associated with sweetness and overall flavor perception. These chemical tests, while providing valuable insights into fruit quality attributes, typically require the destruction of the fruit sample. Where in-depth analysis is necessary, mechanical and chemical destructive tests remain indispensable tools for fruit quality assessment.
A non-destructive low-cost system that efficiently evaluated quality of dragon fruit has been proposed. This innovative approach aims to provide accurate and efficient quality evaluation without causing damage to the fruit. The validation process of this novel non-destructive device involves segregating fruits into quality categories. This validation is achieved by analyzing data collected from visible and ultraviolet images. In the discriminant analysis, the objective was to identify which image-derived variables best distinguish among the three previously established fruit quality categories based on the destructive variables. A stepwise selection procedure was applied to 16 independent variables derived from visible and UV images. The analysis revealed that four variable (Perimeter ultraviolet, Area ultraviolet, Minor diagonal ultraviolet, and Coordinate G visible) were significant predictors. Among these, Perimeter ultraviolet and Area ultraviolet were the most influential, entering the model first with the highest F-values, indicating that UV-based size measurements play the strongest role in discriminating between the groups. The other two variables, Minor diagonal ultraviolet, and Coordinate G visible, provided additional discriminatory power, reflecting complementary information from UV and visible features. Remarkably, the results indicated that this non-destructive system could achieve a classification accuracy of 84.40% classified fruits into three quality categories (“unripe,” “ripe-small sized,” and “ripe-large sized”, previously established by cluster analysis based ripening index and weight) (Figure 7) based on the image analysis parameters, ultraviolet perimeter, minimum diameter and area and the color green coordinate in the visible range. Besides, 92.30% of the high-quality dragon fruits were correctly identified. This fact is crucial considering the importance of not misclassifying these products that could be sold for a higher added value. Furthermore, the identification of these high-quality dragon fruits, produced in the Mediterranean region could help to encourage consumer loyalty in the purchase of these products. Comparing the obtained results with previous reported studies classifying dragon fruits higher accuracy levels could be found. However, these studies included ripe and also very unripe fruits, as [26] that found 96.38% of well classified fruits in three categories including clearly unripe fruit. In the presented research the fruit classified as “unripe” were already in a harvest ripeness stage. Classification methods play a pivotal role in fruit quality assurance protocols, contributing significantly to the precision and reliability of assessments. The ability to accurately segregate fruits into different quality categories using non-destructive methods enhances efficiency in harvest and postharvest handling processes, especially for high added value tropical fruits produced in Europe and destined to the European market.
This study presents certain limitations that should be considered when interpreting the results. First, the analysis was conducted on a single variety of dragon fruit, which may restrict the applicability of the findings to other varieties with different morphological or color characteristics. Future research should include a broader range of varieties to validate the robustness of the proposed approach. Second, image acquisition was performed under controlled lighting conditions to ensure consistency in color and texture analysis. While this improves accuracy, it may limit the generalization of the method to field environments where lighting is variable. Further work should explore adaptive image processing techniques to address these challenges. Despite these limitations, the proposed methodology has significant potential for practical applications. In particular, the integration of image analysis into robotic harvesting systems could enhance fruit detection and quality assessment, contributing to greater automation and efficiency in precision agriculture.
5. Conclusions
The use of tools to assist fruit production is required to ensure good quality fruit. The present study introduces a non-destructive classification system for ripe dragon fruits using a low-cost system. Utilizing the data obtained from image analysis, the classification process employed step-by-step discriminant analysis. This analytical approach was capable to classify ripe dragon fruits into three quality categories (previously established by cluster analysis based ripening index and weight) with an accuracy of nearly 84.40% of well classified fruits based on the variables extracted from the image analysis (ultraviolet perimeter, minimum diameter and area, and visible green color coordinate). Furthermore, the established model could select the very high-quality dragon fruit (riper and larger fruits) with 92.30% of correctly identified products. In conclusion, the proposed non-destructive dragon fruit classification system, utilizing image-based parameters, presents a promising solution to accurately categorizing ripe dragon fruits based on their visual attributes offering both cost-effectiveness and reliability in fruit classification processes, for automatic harvest and postharvest operations. This advancement has the potential to streamline quality control processes in the dragon fruit industry, leading to improved efficiency and product consistency. Continued research and refinement of this system could further improve its performance and applicability in commercial settings.
Author Contributions
Conceptualization C.O.; methodology, C.O. and V.A.; software, V.A.; validation, C.O. and F.R.-M.; formal analysis, C.O. and N.D.; investigation, C.O., V.A. and N.-D.; resources, C.O. and F.R.-M.; data curation, C.O., N.D.; writing—original draft preparation, C.O.; writing—review and editing, C.O., N.D. and F.R-M.; visualization, C.O.; supervision, C.O. and F.R.-M.; project administration, C.O. and F.R.-M.; funding acquisition, C.O. and F.R.-M. All authors have read and agreed to the published version of the manuscript.
Funding
This research was funded by the Valencia Government (Spain) through the projects “RECOLECCIÓN INTELIGENTE Y AUTOMATIZADA DE CULTIVOS DE ALTO VALOR EN INVERNADEROS SOSTENIBLES (INNEST/2023/106)”. The authors are most grateful to Jose Martínez from Mi Pitaya for providing the fruit samples.
Data Availability Statement
Not applicable.
Conflicts of Interest
The authors declare no conflict of interest.
References
- Jiang, H.; Zhang, W.; Li, X.; Shu, C.; Jiang, W.; Cao, J. Nutrition, phytochemical profile, bioactivities and applications in food industry of pitaya (Hylocereus spp.) peels: A comprehensive review. Trends in Food Science & Technology 2021, 116, 199–217. [Google Scholar] [CrossRef]
- Trivellini, A.; Lucchesini, M.; Ferrante, A.; Massa, D.; Orlando, M.; Incrocci, L.; Mensuali-Sodi, A. Pitaya, an attractive alternative crop for Mediterranean region. Agronomy 2020, 10(8), 1065. [Google Scholar] [CrossRef]
- Sparrow, R.; Howard, M. Robots in agriculture: Prospects, impacts, ethics, and policy. Precision Agriculture 2021, 22, 818–833. [Google Scholar] [CrossRef]
- Starostin, I. A.; Eshchin, A. V.; Davydova, S. A. Global trends in the development of agricultural robotics. In IOP Conference Series: Earth and Environmental Science; IOP Publishing, 2023; Vol. 1138, No. 1, p. 012042. [Google Scholar]
- Hua, X.; Li, H.; Zeng, J.; Han, C.; Chen, T.; Tang, L.; Luo, Y. A review of target recognition technology for fruit picking robots: From digital image processing to deep learning. Applied Sciences 2023, 13(7), 4160. [Google Scholar] [CrossRef]
- Li, Y.; Feng, Q.; Li, T.; Xie, F.; Liu, C.; Xiong, Z. Advance of target visual information acquisition technology for fresh fruit robotic harvesting: A review. Agronomy 2022, 12(6), 1336. [Google Scholar] [CrossRef]
- Thakur, A.; Venu, S.; Gurusamy, M. An extensive review on agricultural robots with a focus on their perception systems. Computers and Electronics in Agriculture 2023, 212, 108146. [Google Scholar] [CrossRef]
- Zhou, H.; Wang, X.; Au, W.; Kang, H.; Chen, C. Intelligent robots for fruit harvesting: Recent developments and future challenges. Precision Agriculture 2022, 23(5), 1856–1907. [Google Scholar] [CrossRef]
- Kaleem, A.; Hussain, S.; Aqib, M.; Cheema, M. J. M.; Saleem, S. R.; Farooq, U. Development challenges of fruit-harvesting robotic arms: A critical review. AgriEngineering 2023, 5(4), 2216–2237. [Google Scholar] [CrossRef]
- Afsharpour, P.; Zoughi, T.; Deypir, M.; Zoqi, M. J. Robust deep learning method for fruit decay detection and plant identification: Enhancing food security and quality control. Frontiers in Plant Science 2024, 15, 1366395. [Google Scholar] [CrossRef]
- Sun, T.; Zhang, W.; Miao, Z.; Zhang, Z.; Li, N. Object localization methodology in occluded agricultural environments through deep learning and active sensing. Computers and Electronics in Agriculture 2023, 212, 108141. [Google Scholar] [CrossRef]
- Sharma, K.; Shivandu, S. K. Integrating artificial intelligence and internet of things (IoT) for enhanced crop monitoring and management in precision agriculture. Sensors International 2024, 100292. [Google Scholar] [CrossRef]
- Miranda, J. C.; Gené-Mola, J.; Zude-Sasse, M.; Tsoulias, N.; Escolà, A.; Arnó, J.; Gregorio, E. Fruit sizing using AI: A review of methods and challenges. Postharvest Biology and Technology 2023, 206, 112587. [Google Scholar] [CrossRef]
- Xiang, L.; Wang, D. A review of three-dimensional vision techniques in food and agriculture applications. Smart Agricultural Technology 2023, 5, 100259. [Google Scholar] [CrossRef]
- Pal, A.; Leite, A. C.; From, P. J. A novel end-to-end vision-based architecture for agricultural human–robot collaboration in fruit picking operations. Robotics and Autonomous Systems 2024, 172, 104567. [Google Scholar] [CrossRef]
- Alaaudeen, K. M.; Selvarajan, S.; Manoharan, H.; Jhaveri, R. H. Intelligent robotics harvesting system process for fruits grasping prediction. Scientific Reports 2024, 14(1), 2820. [Google Scholar] [CrossRef] [PubMed]
- Feng, J.; Yang, Q.; Tian, H.; Wang, Z.; Tian, S.; Xu, H. Promising real-time fruit and vegetable quality detection technologies applicable to manipulator picking process. International Journal of Agricultural and Biological Engineering 2024, 17(2), 14–26. [Google Scholar] [CrossRef]
- Mohammadi, V.; Kheiralipour, K.; Ghasemi-Varnamkhasti, M. Detecting maturity of persimmon fruit based on image processing technique. Scientia Horticulturae 2015, 184, 123–128. [Google Scholar] [CrossRef]
- Long, N. Truong Minh; Thinh, N. Truong. Using machine learning to grade the mango’s quality based on external features captured by vision system. Applied Sciences 2020, 10(17), 5775. [Google Scholar] [CrossRef]
- Azizah, L. M. R.; Umayah, S. F.; Riyadi, S.; Damarjati, C.; Utama, N. A. Deep learning implementation using convolutional neural network in mangosteen surface defect detection. 2017 7th IEEE International Conference on Control System, Computing and Engineering (ICCSCE), 2017; IEEE; pp. 242–246. [Google Scholar]
- Choi, J. Y.; Seo, K.; Cho, J. S.; Moon, K. D. Applying convolutional neural networks to assess the external quality of strawberries. Journal of Food Composition and Analysis 2021, 102, 104071. [Google Scholar] [CrossRef]
- Patel, K. K.; Kar, A.; Khan, M. A. Potential of reflected UV imaging technique for detection of defects on the surface area of mango. Journal of Food Science and Technology 2019, 56, 1295–1301. [Google Scholar] [CrossRef]
- Vijayakumar, T.; Vinothkanna, M. R. Mellowness detection of dragon fruit using deep learning strategy. Journal of Innovative Image Processing (JIIP) 2020, 2(01), 35–43. [Google Scholar]
- Ortiz, C.; Blanes, C.; Gonzalez-Planells, P.; Rovira-Más, F. Non-Destructive Evaluation of White-Flesh Dragon Fruit Decay with a Robot. Horticulturae 2023, 9(12), 1286. [Google Scholar] [CrossRef]
- Patil, P. U.; Lande, S. B.; Nagalkar, V. J.; Nikam, S. B.; Wakchaure, G. C. Grading and sorting technique of dragon fruits using machine learning algorithms. Journal of Agriculture and Food Research 2021, 4, 100118. [Google Scholar] [CrossRef]
- Minh Trieu, N.; Thinh, N. T. Quality classification of dragon fruits based on external performance using a convolutional neural network. Applied Sciences 2021, 11(22), 10558. [Google Scholar] [CrossRef]
- Khatun, T.; Nirob, M. A. S.; Bishshash, P.; Akter, M.; Uddin, M. S. A comprehensive dragon fruit image dataset for detecting the maturity and quality grading of dragon fruit. Data in Brief 2024, 52, 109936. [Google Scholar] [CrossRef]
- ASEAN Standard for Dragon Fruit. ASEAN Standard for Dragon Fruit (ASEAN Stan 42:2015), Technical Report. ASEAN Stan 2015, 42.
- Gupta, A. K.; Pathak, U.; Tongbram, T.; Medhi, M.; Terdwongworakul, A.; Magwaza, L. S. P. Mishra, Emerging approaches to determine maturity of citrus fruit. Critical Reviews in Food Science and Nutrition 2022, 62(19), 5245–5266. [Google Scholar] [CrossRef]
- Xu, J; Shi, T; Wang, Z; He, Y; Liu, Z. Impact of Sugar and Organic Acid Metabolism on Pitaya Flavor and Nutritional Quality. International Journal of Horticulture 2022, 15. [Google Scholar] [CrossRef]
Figure 1.
Example of fruits from two different days.
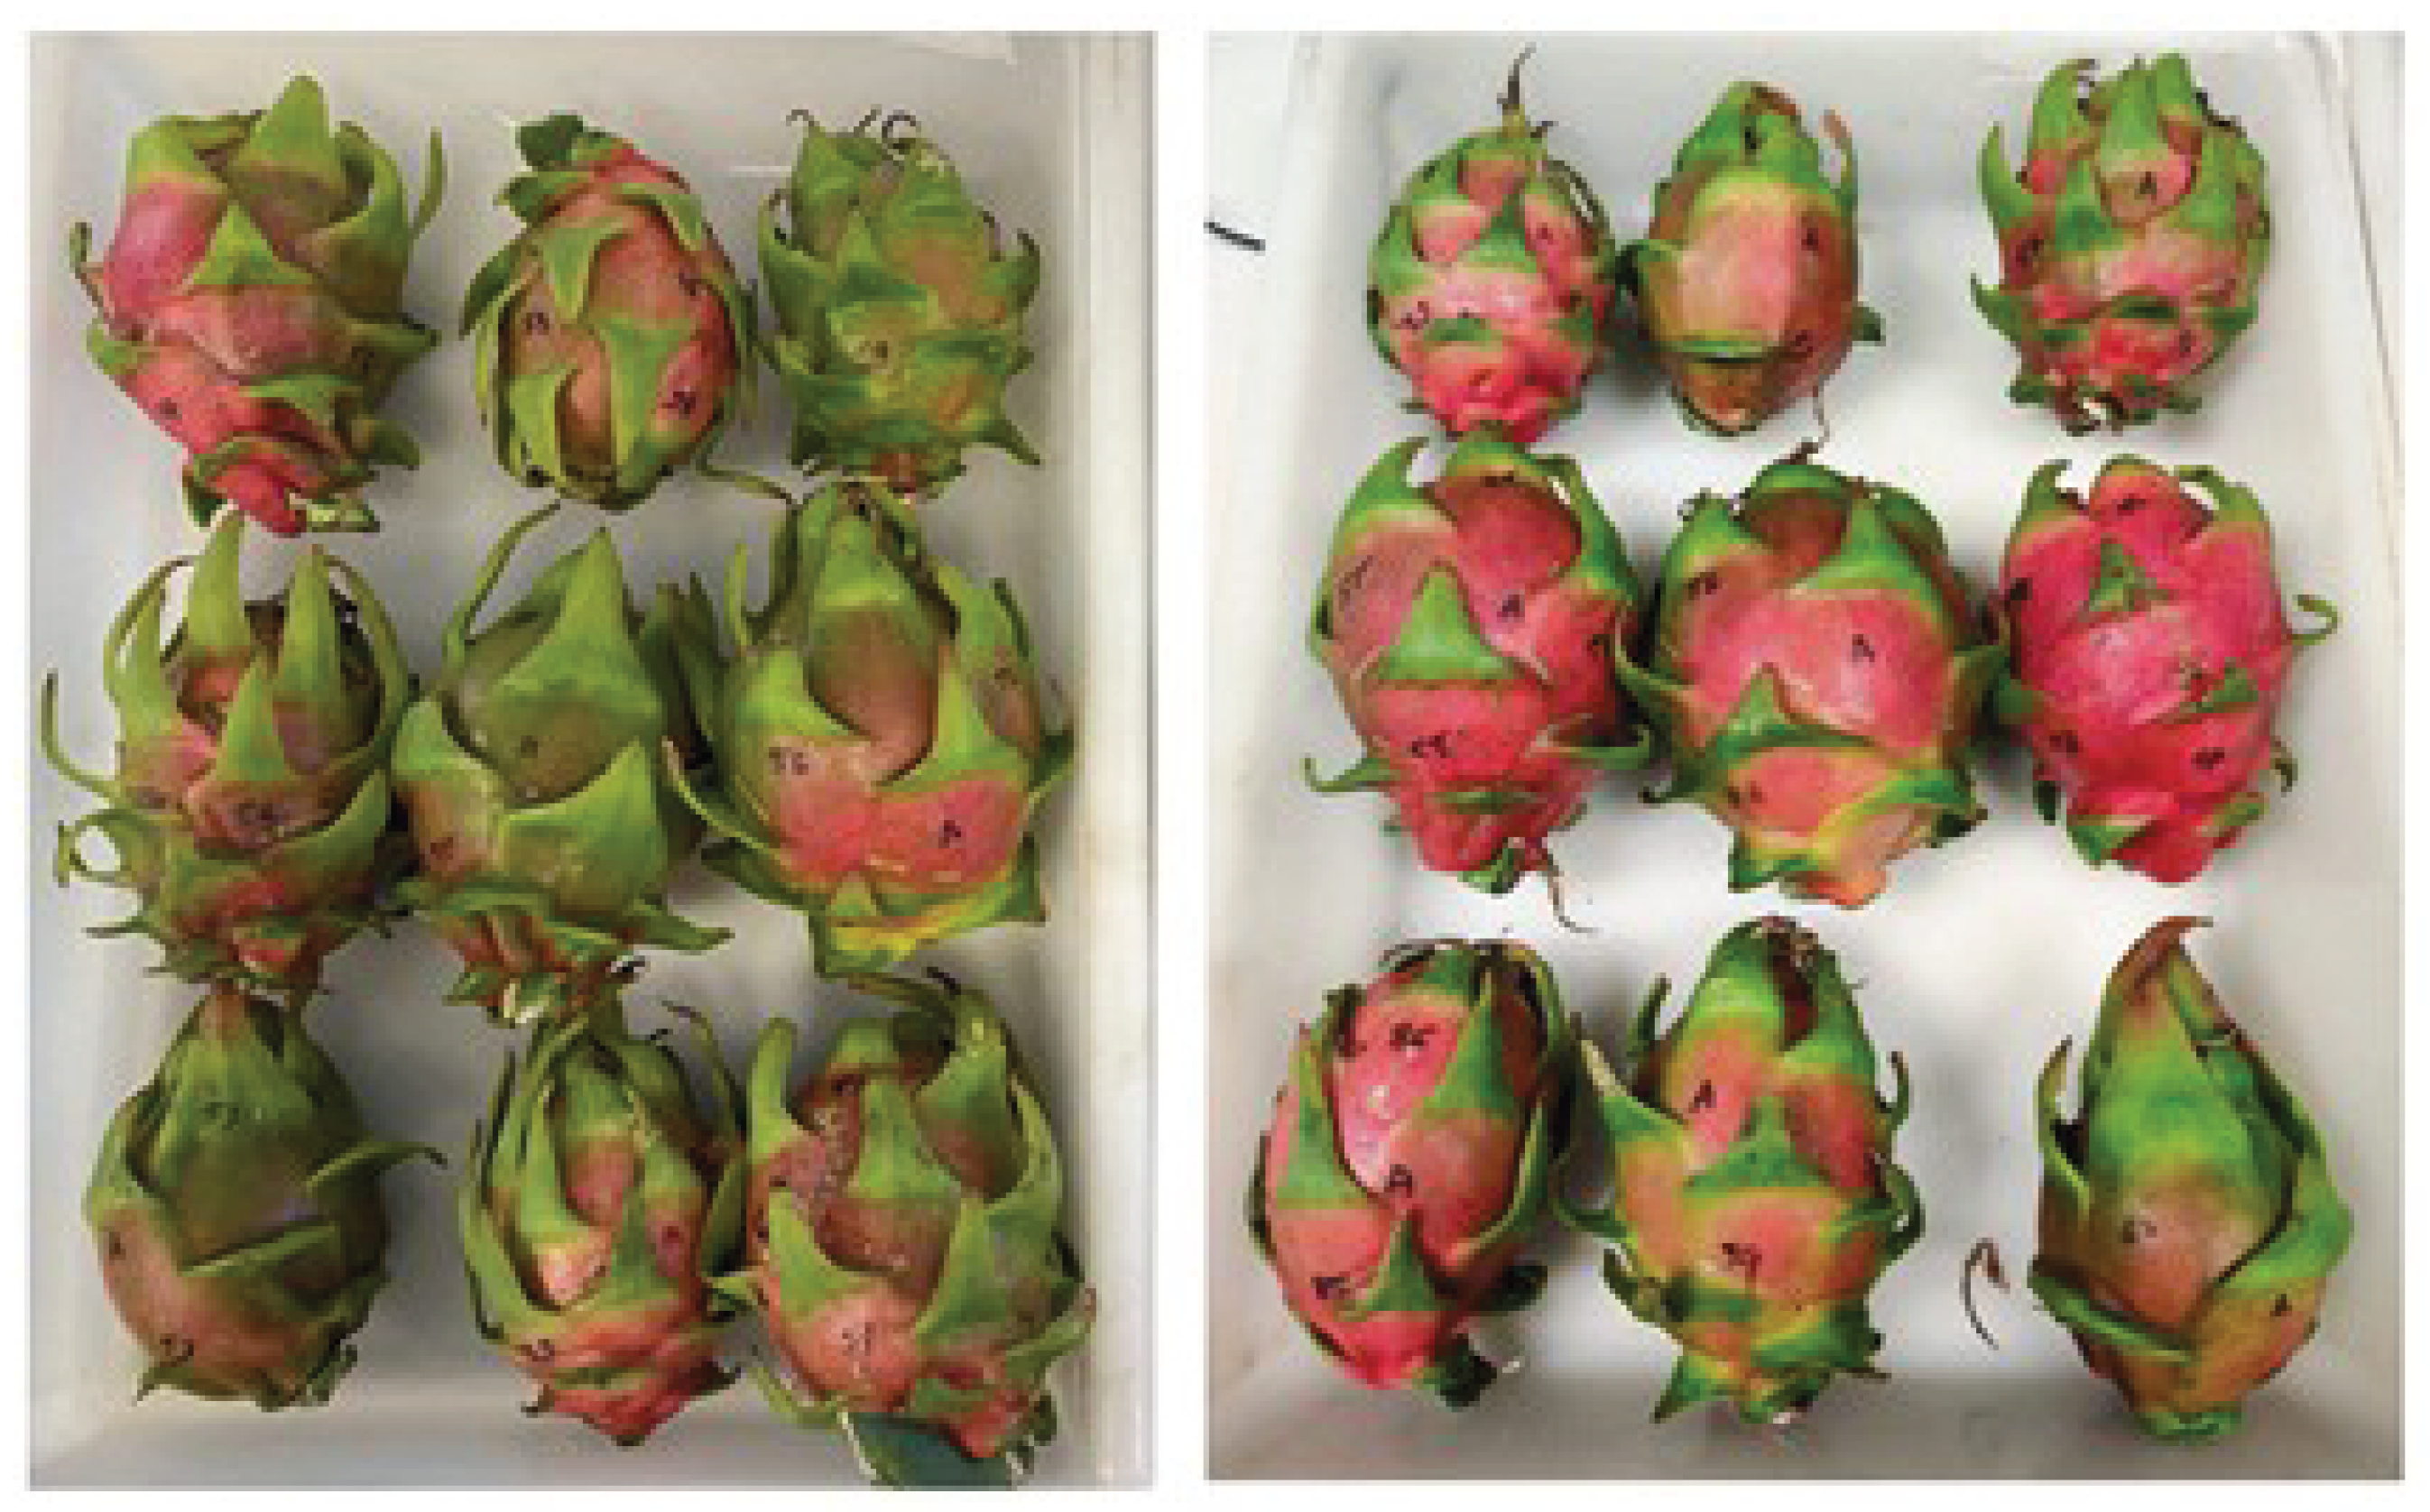
Figure 2.
Imaging analysis system.
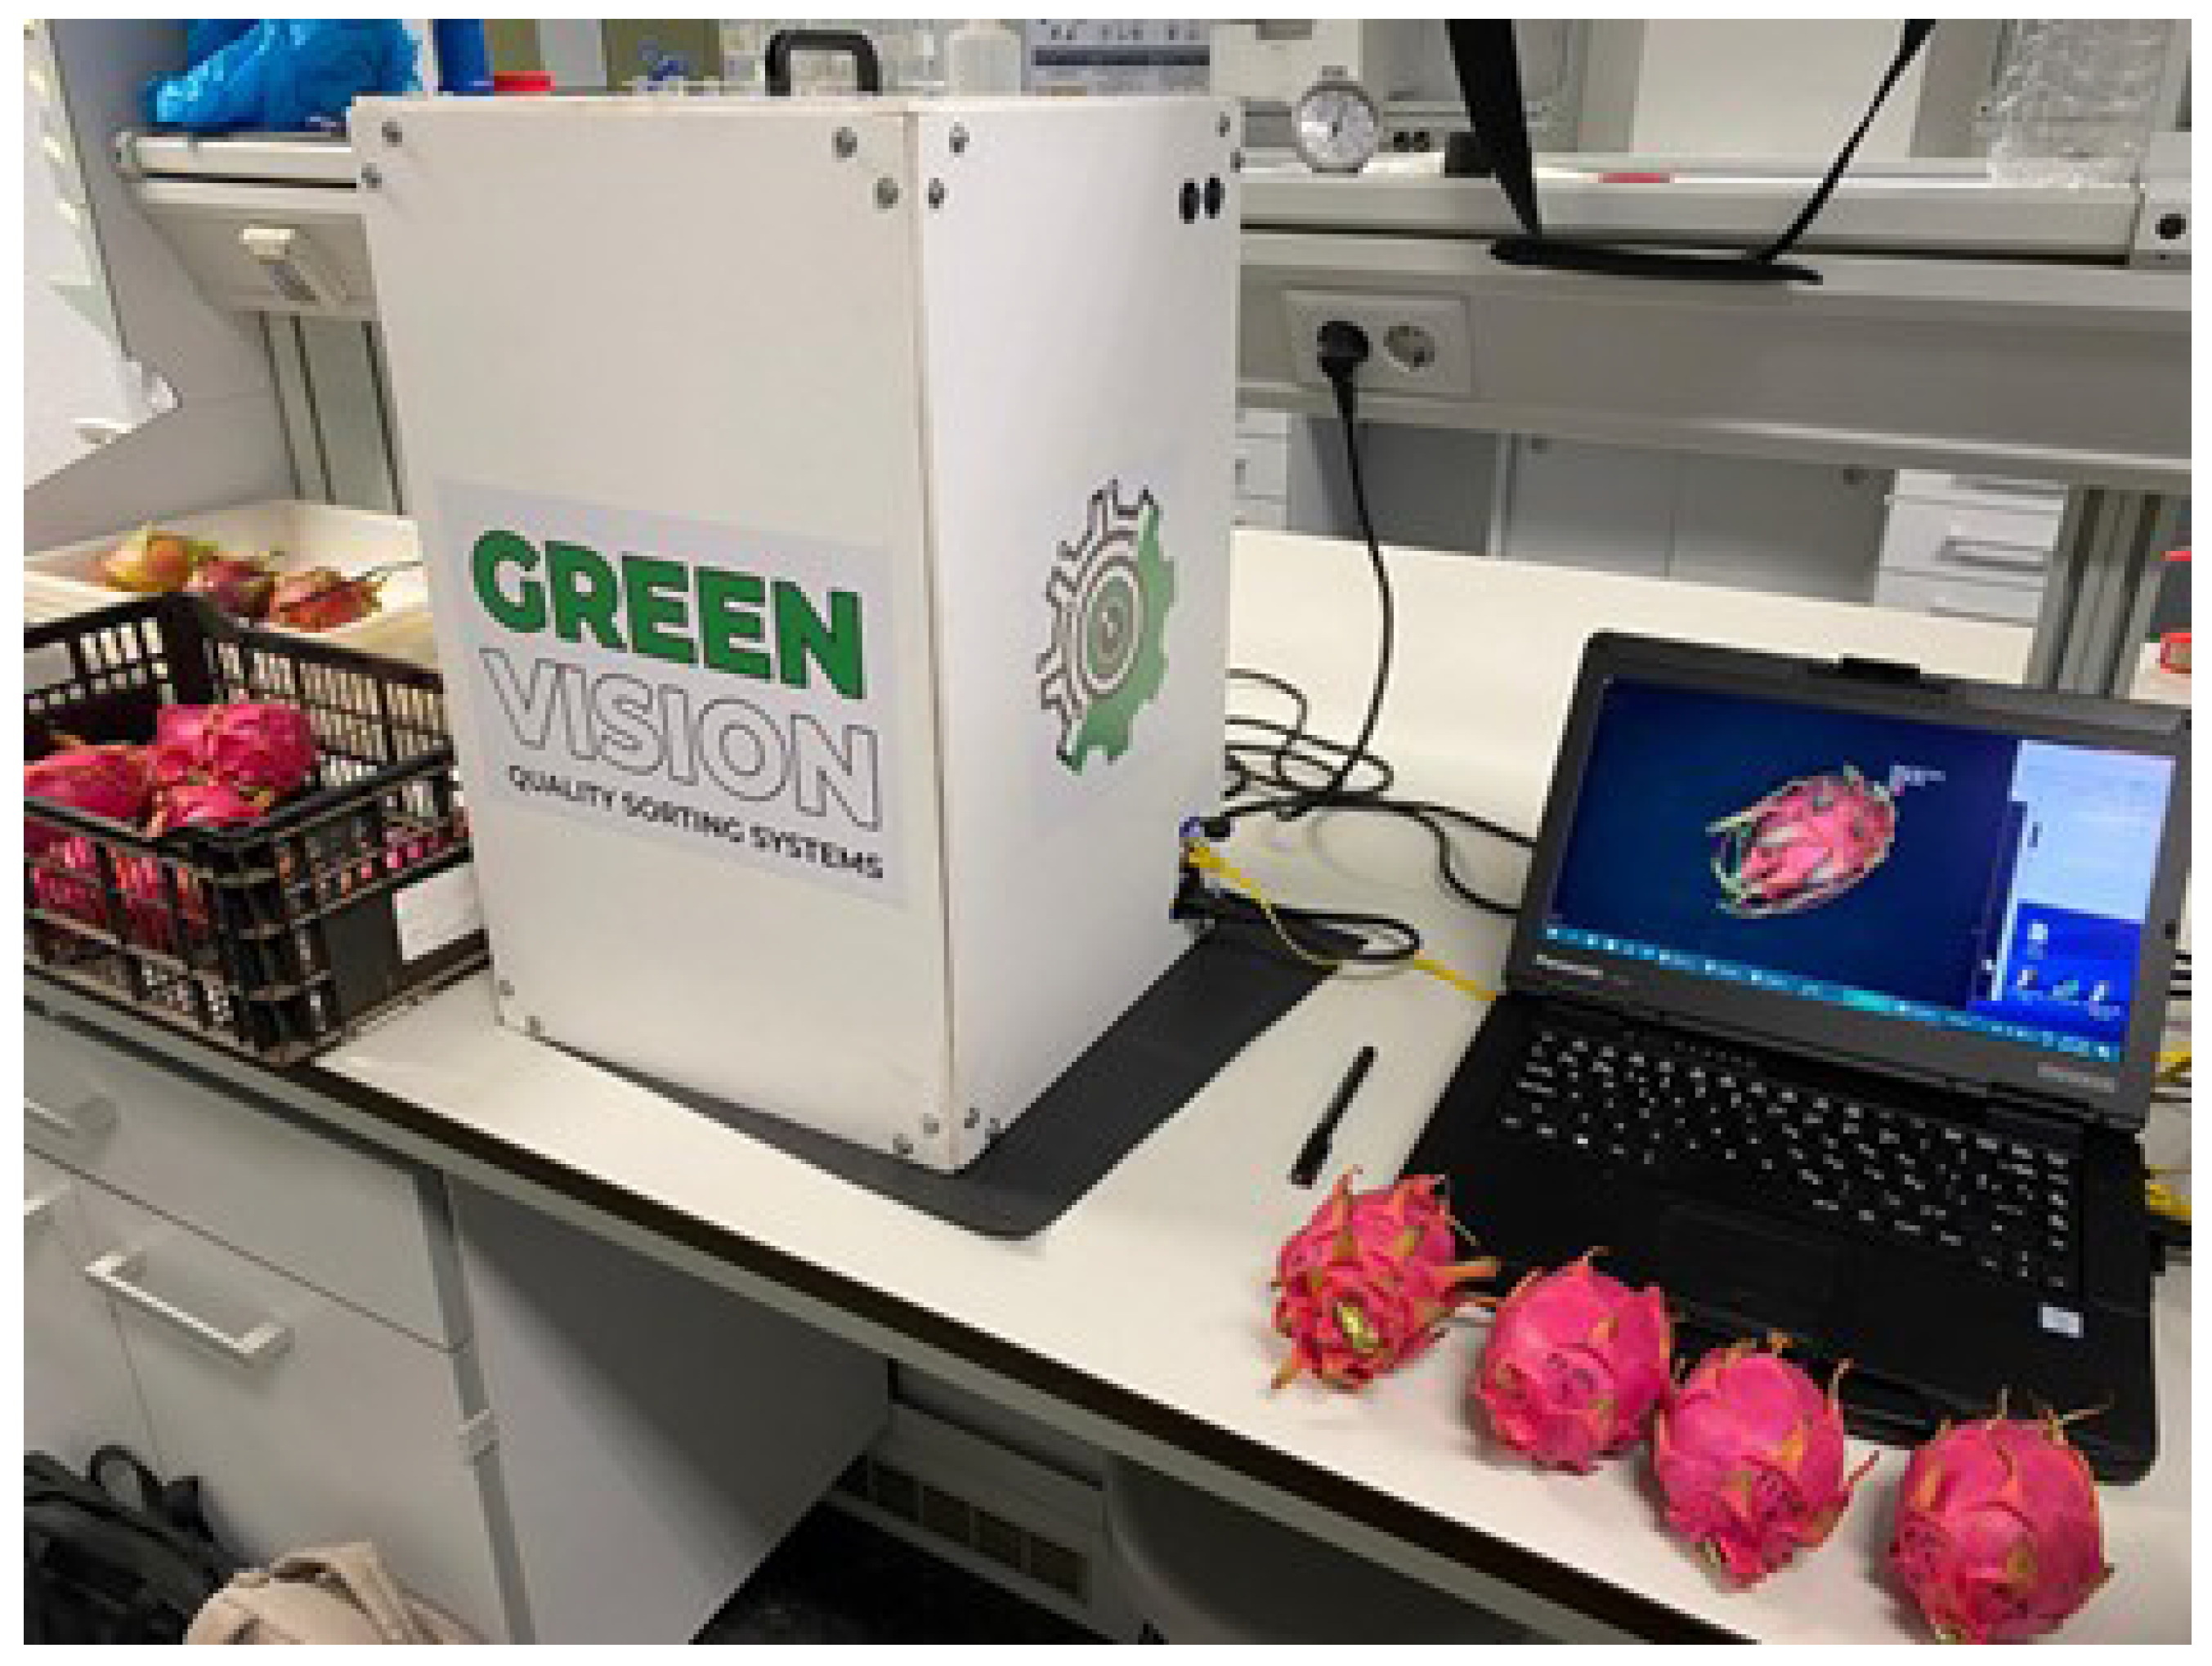
Figure 3.
Dragon fruit image obtained from Greenvision imaging system with physical parameters.
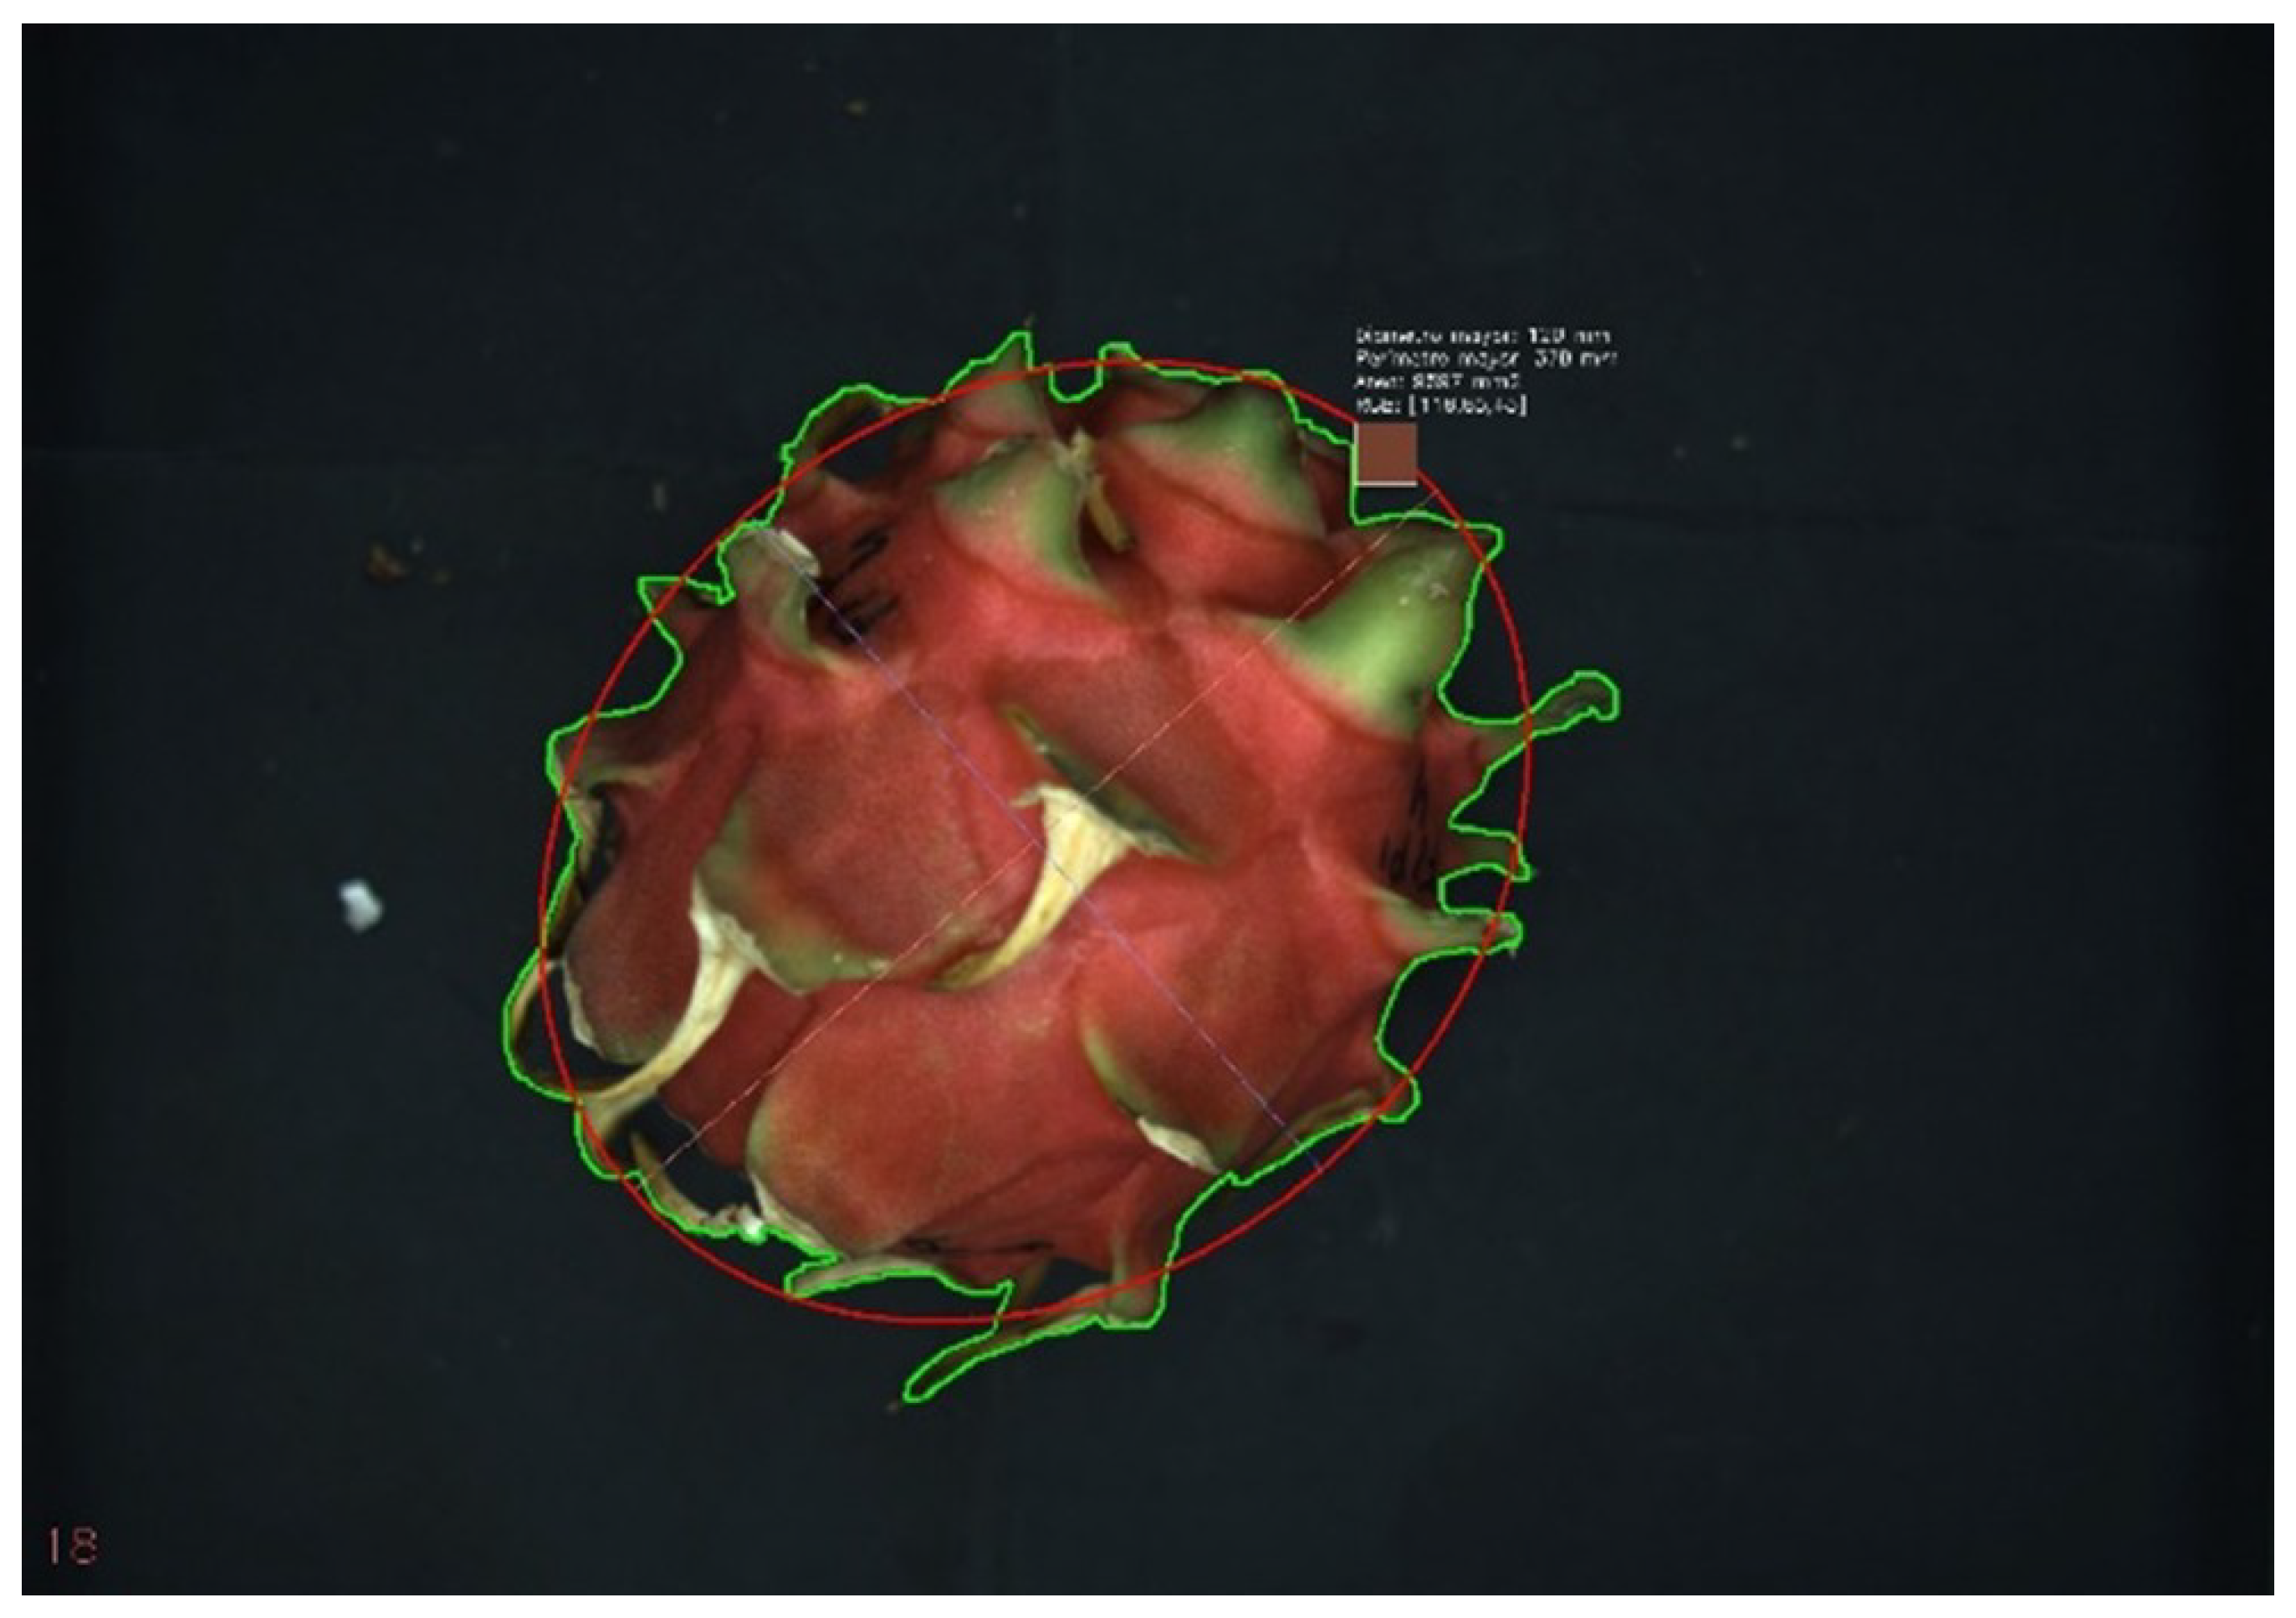
Figure 4.
Observed versus predicted values from the PLS model predicting weight according to the visible and ultraviolet variables obtained from the image analysis.
Figure 4.
Observed versus predicted values from the PLS model predicting weight according to the visible and ultraviolet variables obtained from the image analysis.
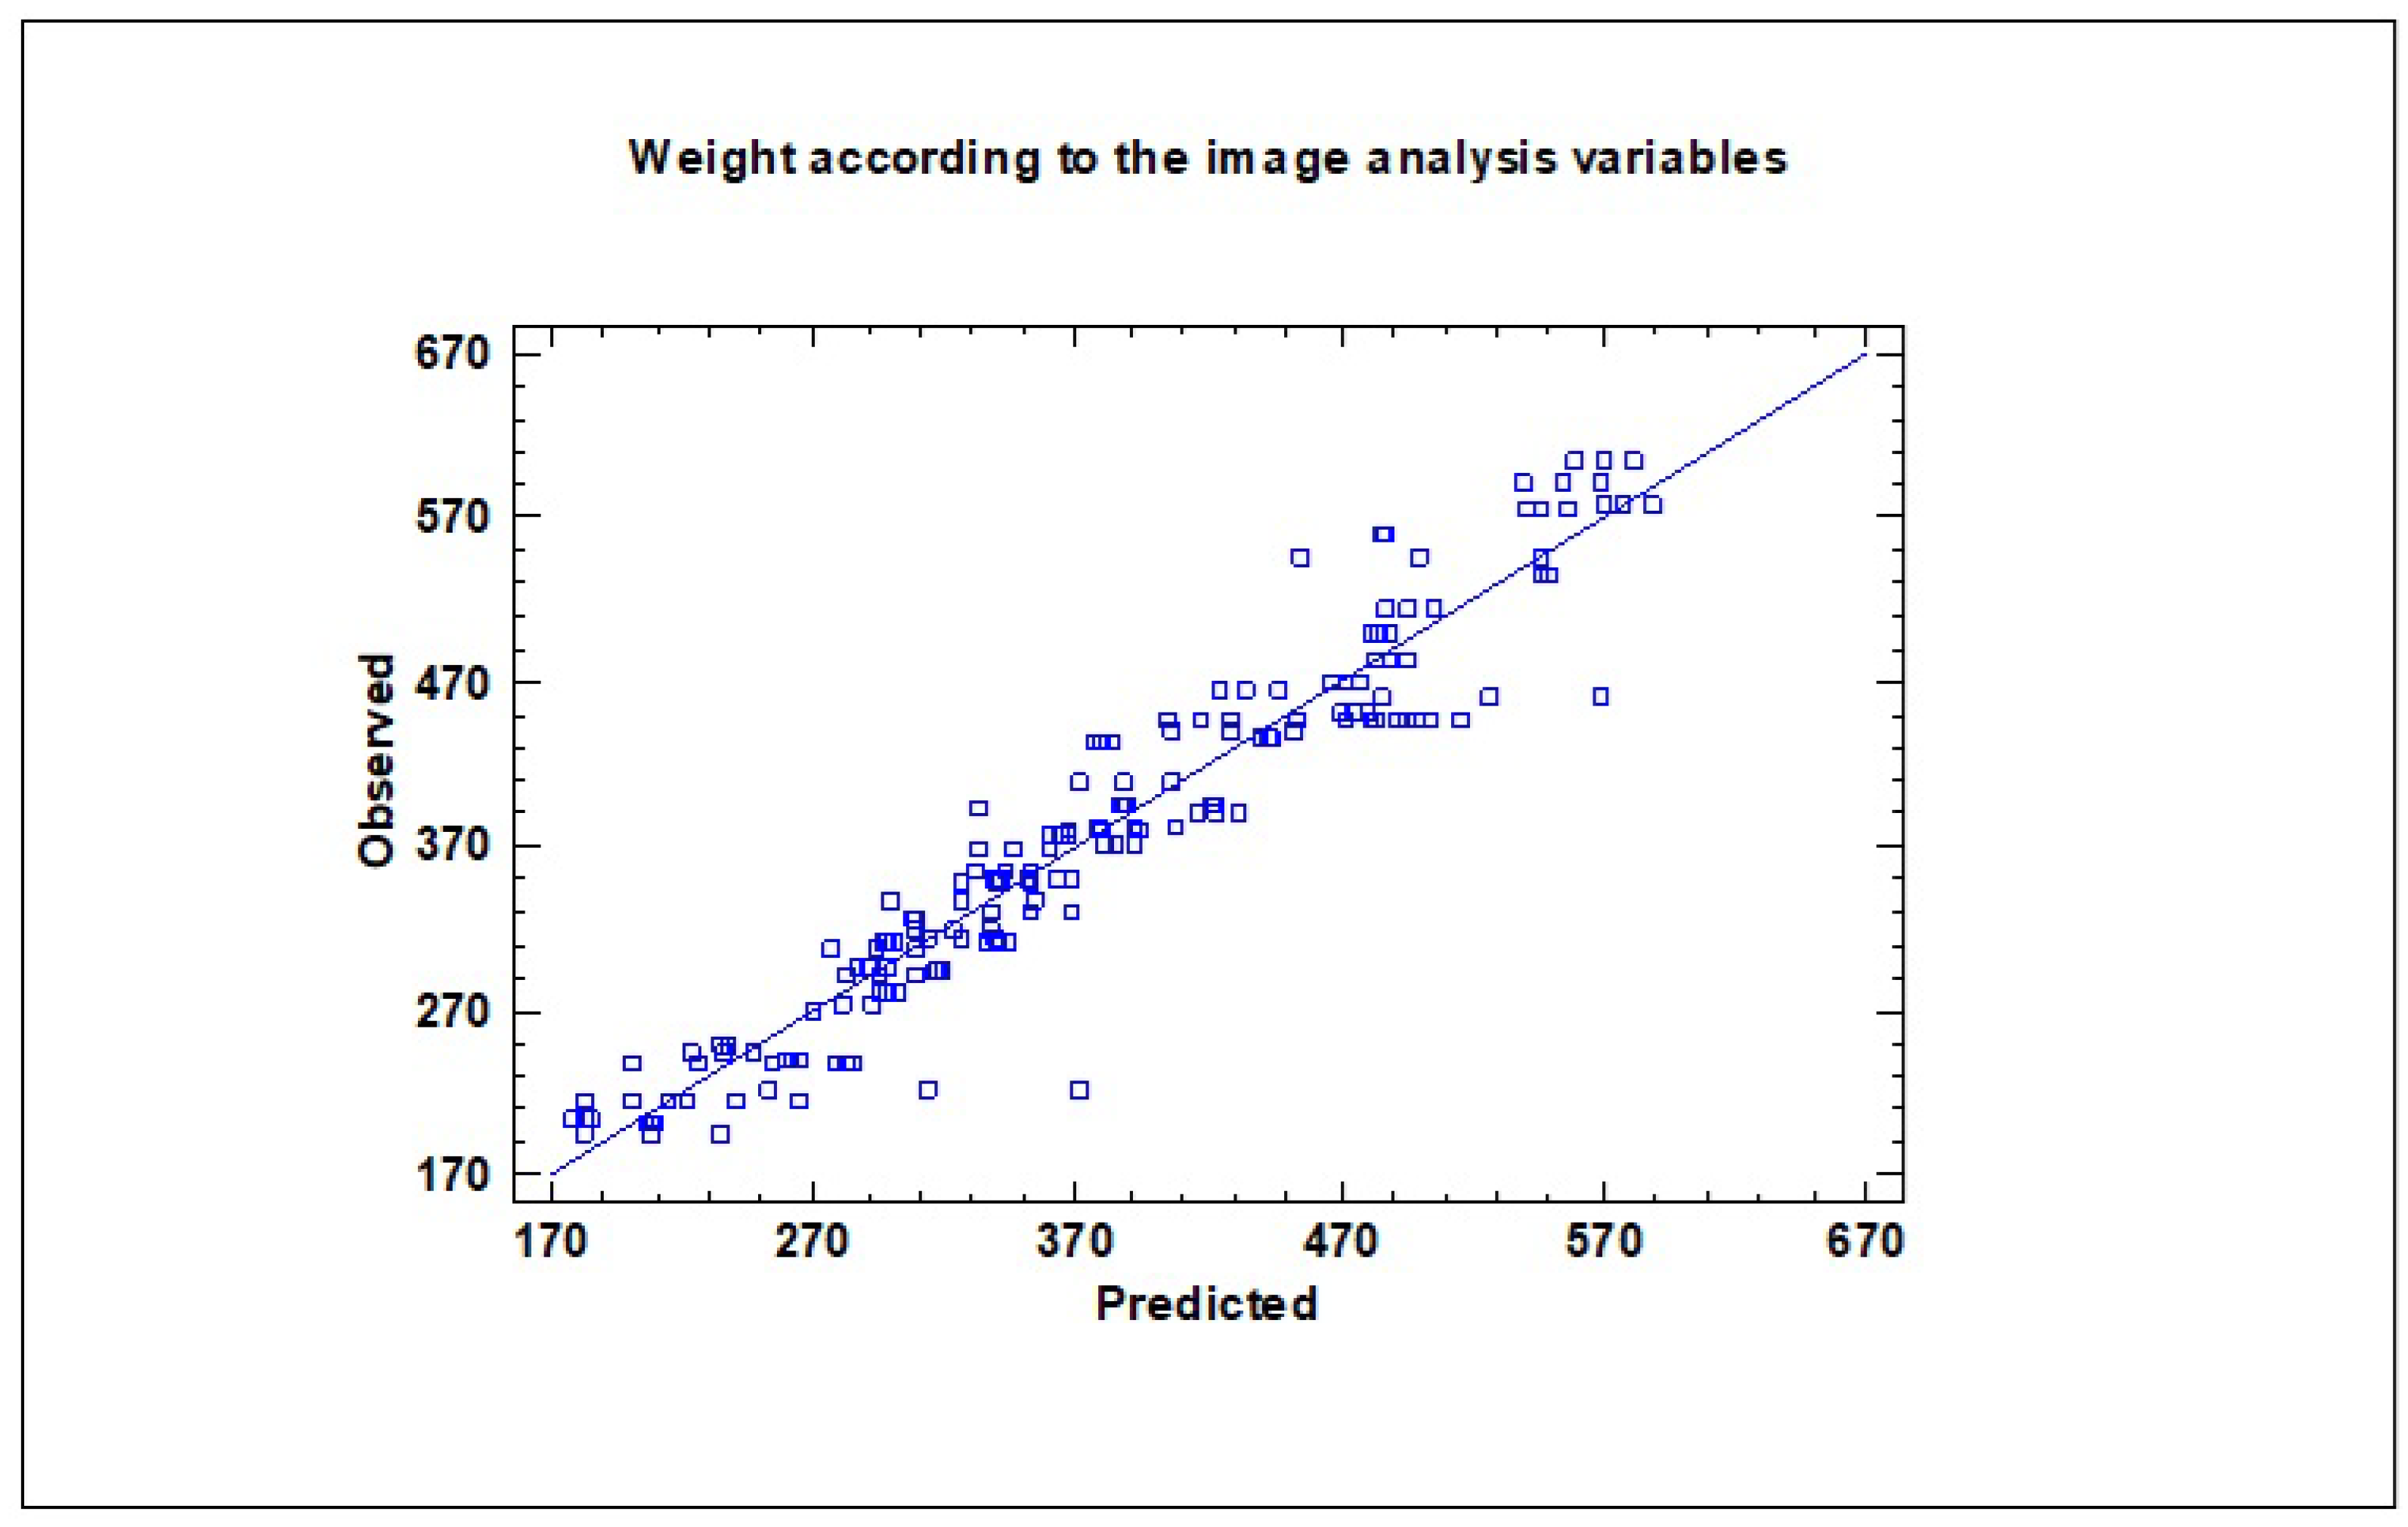
Figure 5.
Influence of testing day on the ripening index (average values and LSD intervals). Lowercase letters denote significant differences among the different harvesting times, as determined by a Duncan test (p < 0.05).
Figure 5.
Influence of testing day on the ripening index (average values and LSD intervals). Lowercase letters denote significant differences among the different harvesting times, as determined by a Duncan test (p < 0.05).
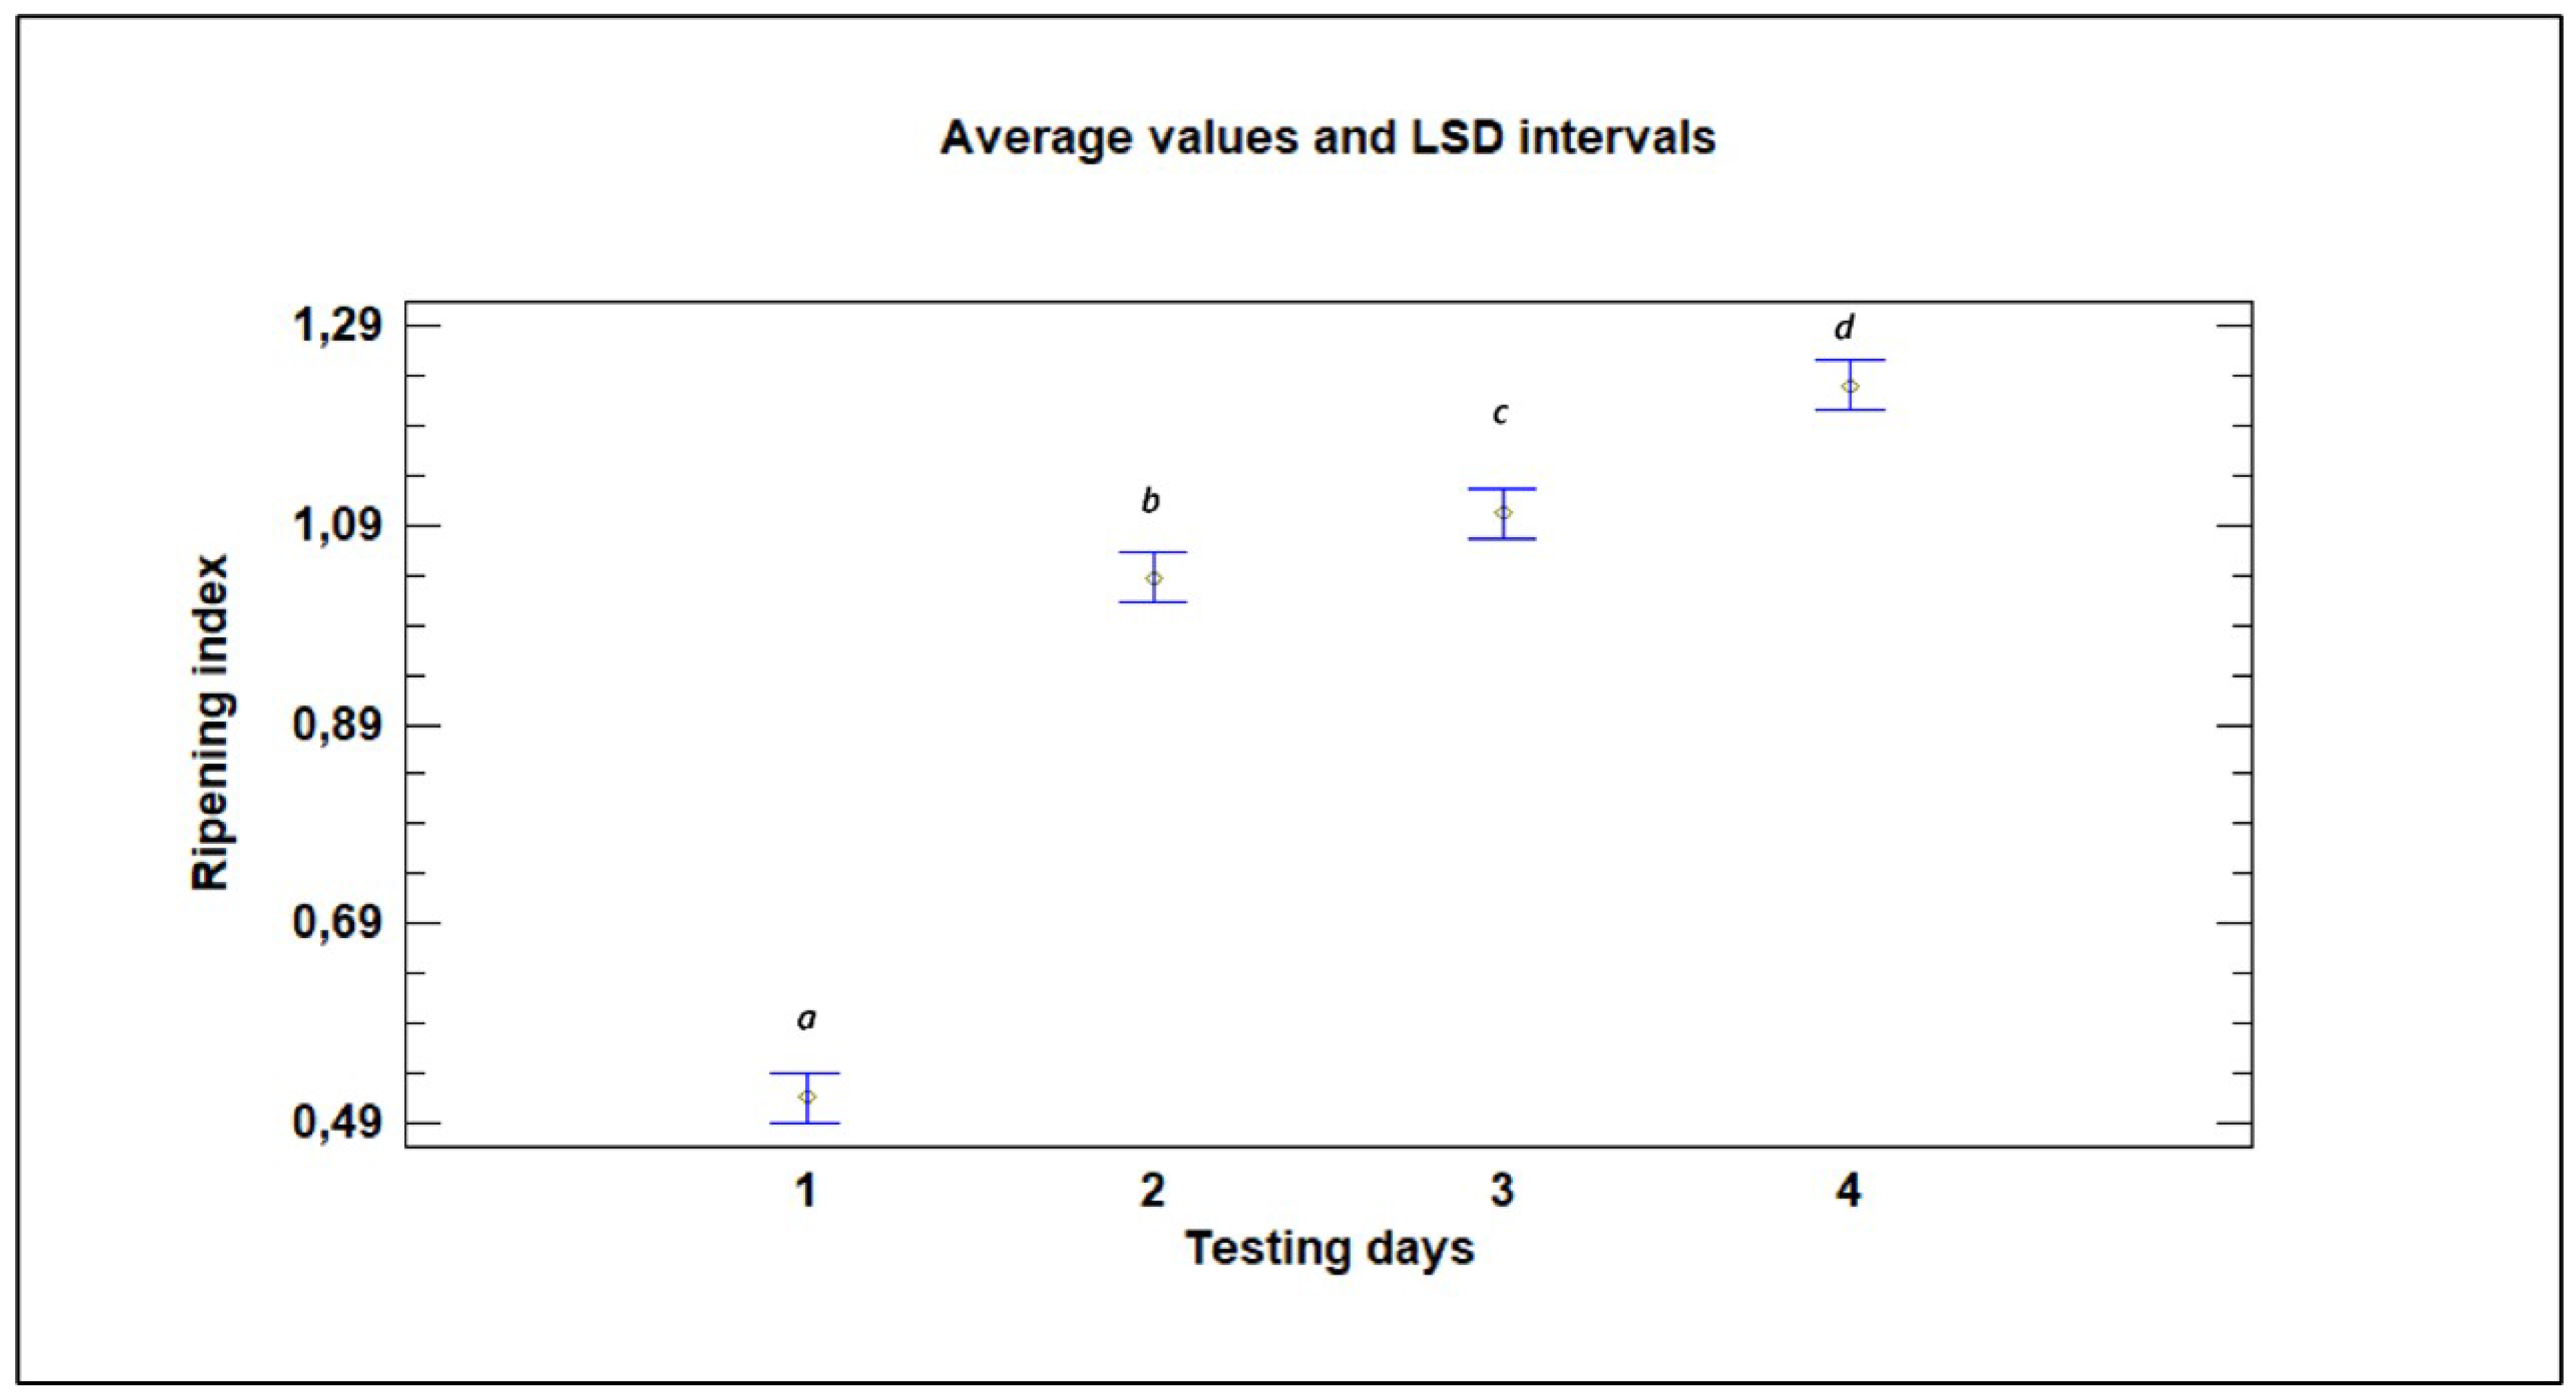
Figure 6.
Conglomerate dispersion diagram, according to weight and ripeness index.
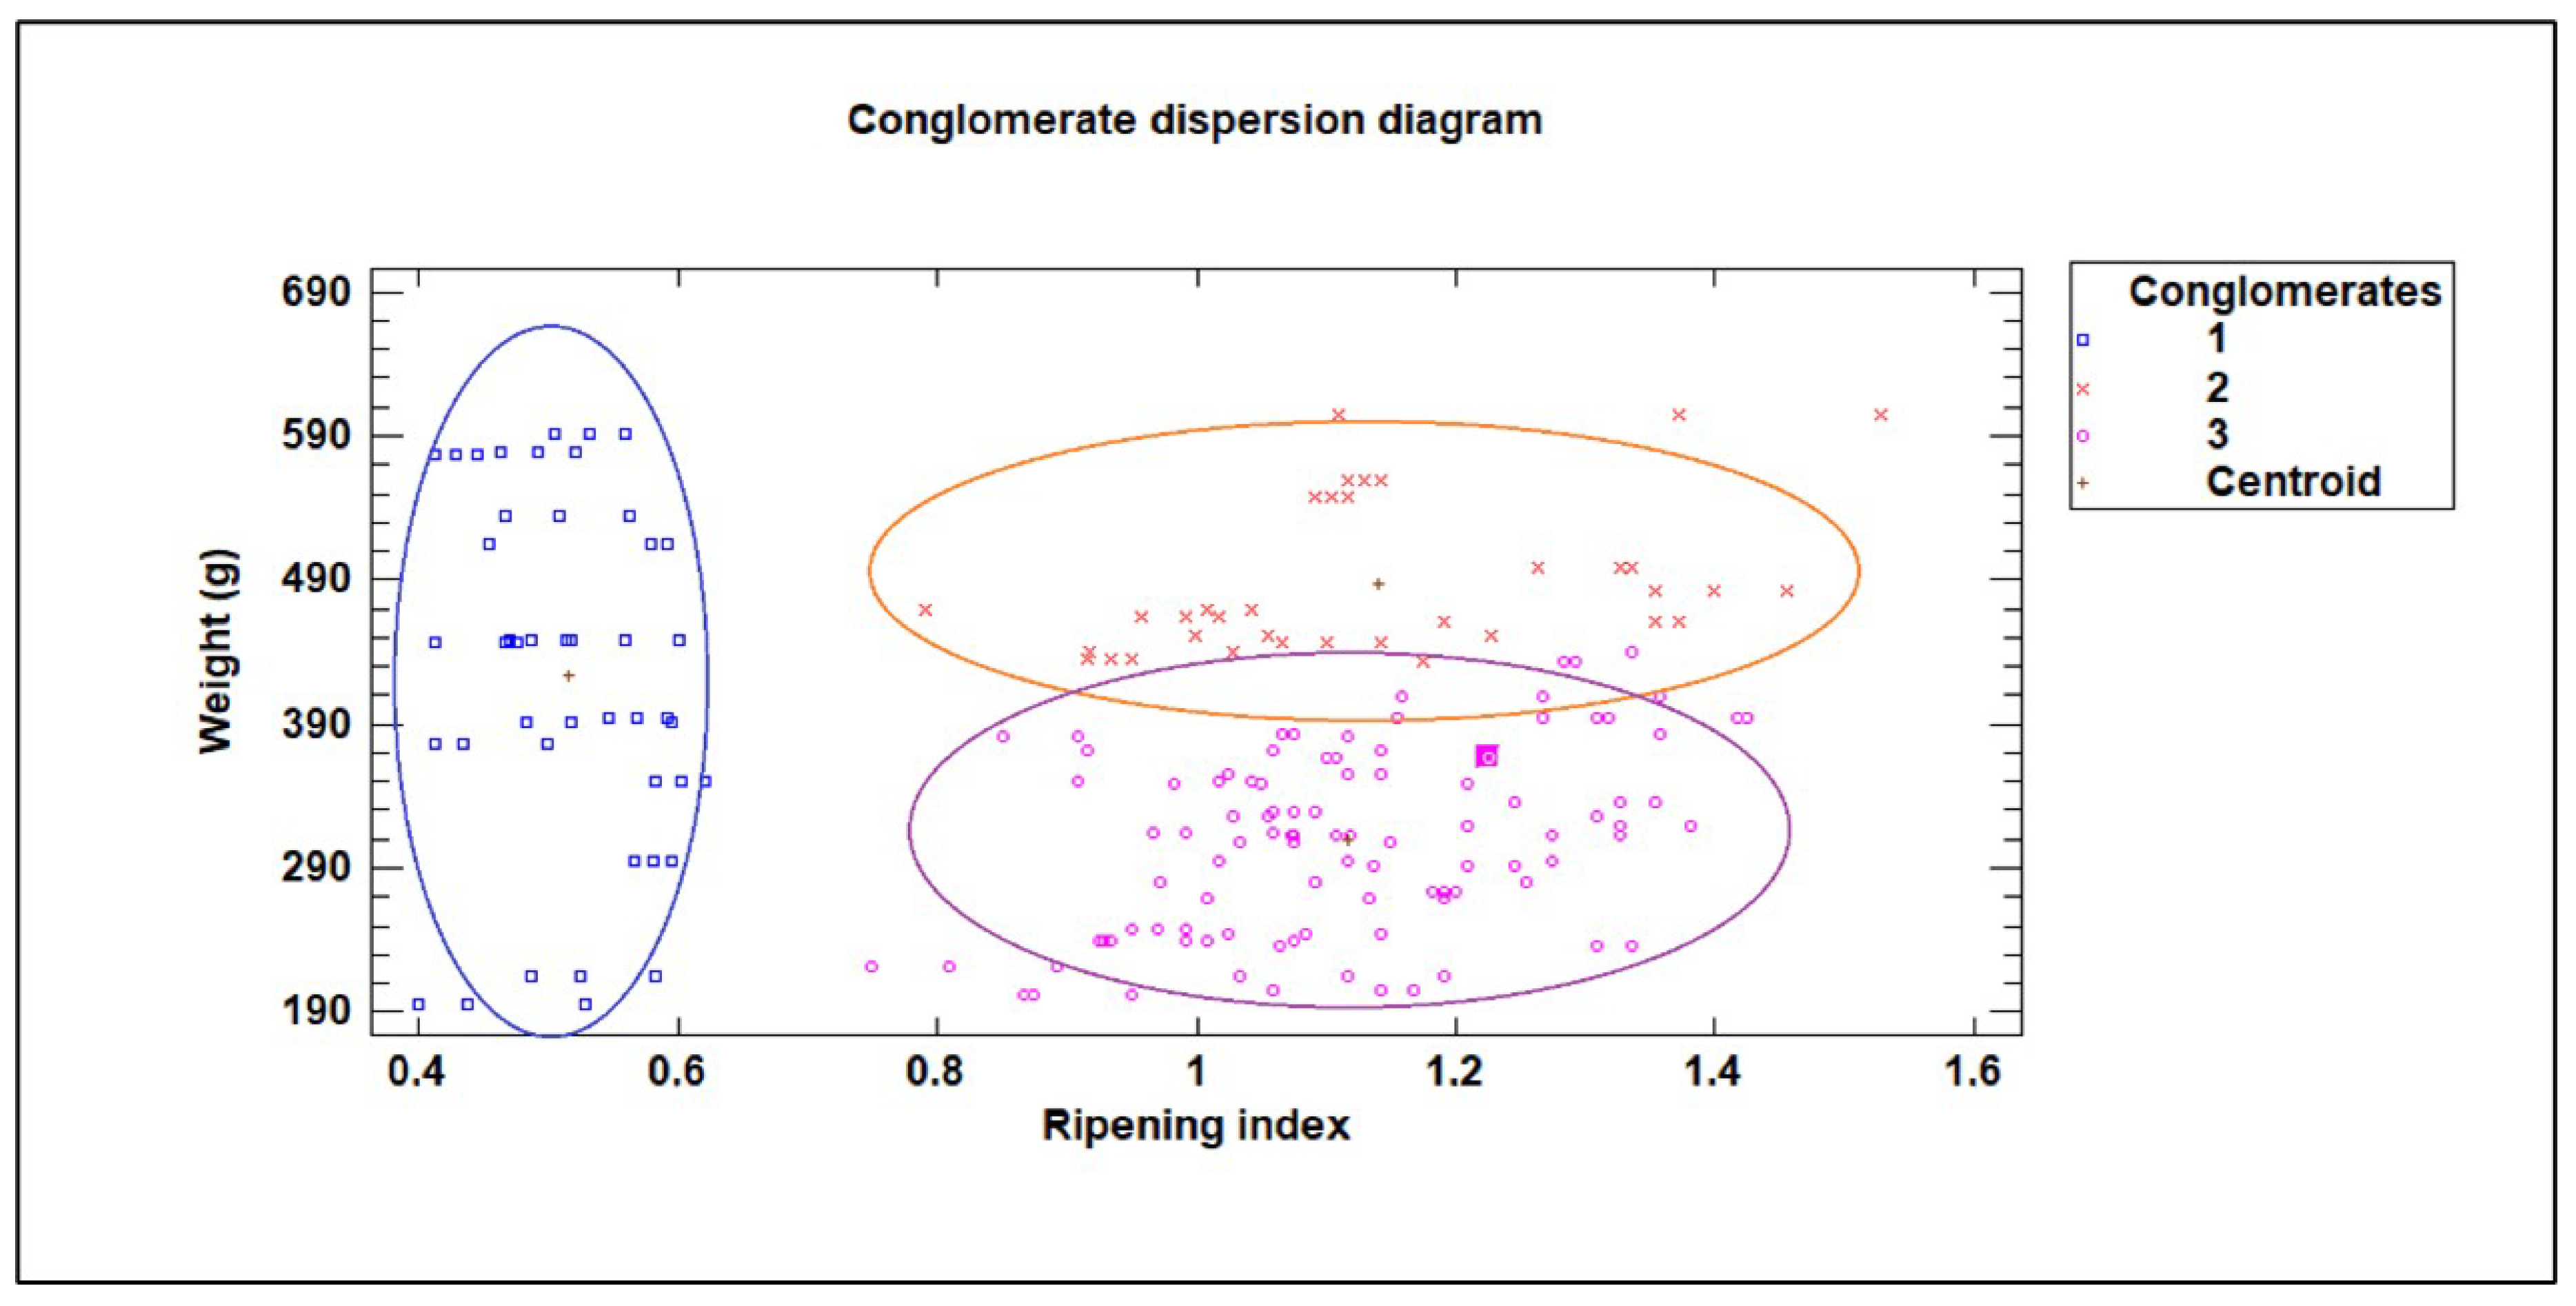
Figure 7.
Discriminant analysis to segregate into the three categories based on the non-destructive variables obtained from the image analysis.
Figure 7.
Discriminant analysis to segregate into the three categories based on the non-destructive variables obtained from the image analysis.
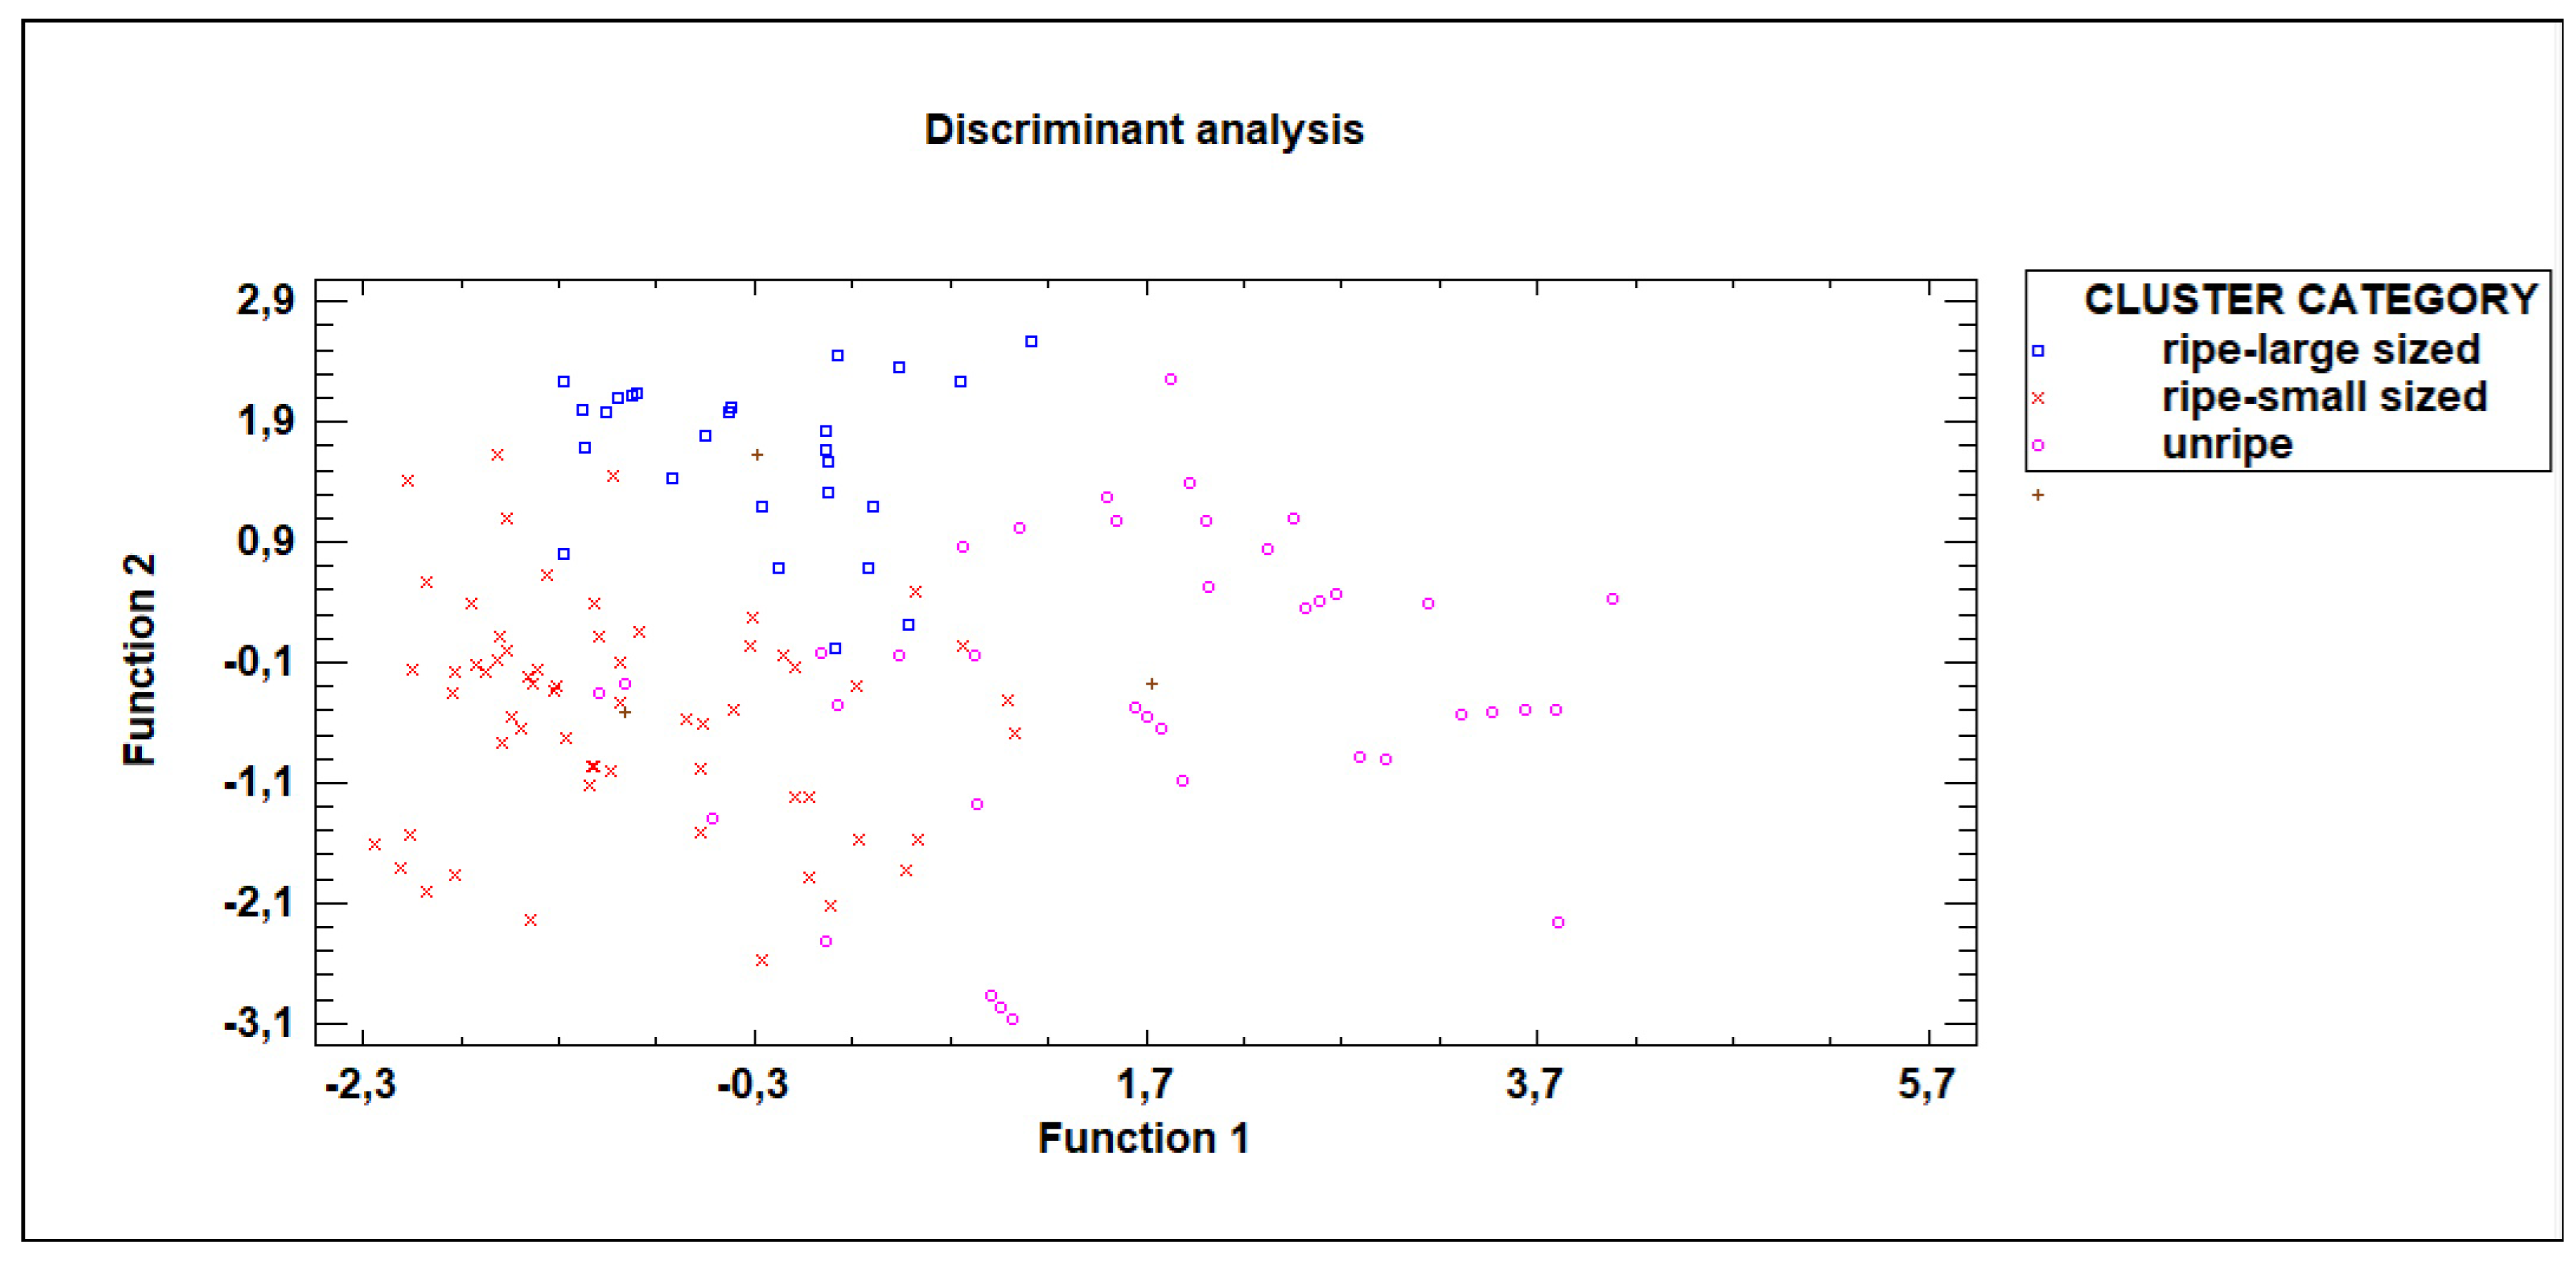

Table 1.
Measured variables (average values and standard deviation) from destructive analysis (Destructive firmness (N/mm), Soluble solid content (º Brix), Total acidity (g/L)), non-destructive characterization (Weight (g)), and image analysis including visible (Area visible, Perimeter visible, Major diagonal visible, Minor diagonal visible, Coordinate R visible, Coordinate G visible, Coordinate B visible) and ultraviolet (Area ultraviolet, Perimeter ultraviolet, Major diagonal ultraviolet, Minor diagonal ultraviolet, Coordinate R ultraviolet, Coordinate G ultraviolet, Coordinate B ultraviolet).
| Measured Variable | Average | Std. Deviation |
| Destructive firmness (N/mm) | 3.5 | 0.6 |
| Soluble solid content (º Brix) | 12.9 | 1.6 |
| Total acidity (g/L) | 0.1 | 0.1 |
| Weight (g) | 373.6 | 109.4 |
| Area visible | 9471.1 | 2112.7 |
| Perimeter visible | 646.2 | 163.5 |
| Major diagonal visible | 134.2 | 14.8 |
| Minor diagonal visible | 87.8 | 10.8 |
| Coordinate R visible | 56.1 | 12.4 |
| Coordinate G visible | 59.8 | 6.4 |
| Coordinate B visible | 31.0 | 3.6 |
| Area ultraviolet | 9917.7 | 2161.0 |
| Perimeter ultraviolet | 594.8 | 149.9 |
| Major diagonal ultraviolet | 138.3 | 15.3 |
| Minor diagonal ultraviolet | 91.1 | 10.9 |
| Coordinate R ultraviolet | 22.8 | 7.8 |
| Coordinate G ultraviolet | 74.2 | 26.0 |
| Coordinate B ultraviolet | 65.4 | 22.4 |
Table 2.
Summary of the components with percentage of variance explained in X and Y, R-Squared, mean squared error (MSE), and prediction error (PRESS).
Table 2.
Summary of the components with percentage of variance explained in X and Y, R-Squared, mean squared error (MSE), and prediction error (PRESS).
| Component | % Variance in X | % Variance in Y | R-Squared | Mean Squared Error (MSE) | PRESS (Prediction Error) |
| 1 | 43.71 | 81.19 | 81.19 | 2324.4 | 80.48 |
| 2 | 27.60 | 2.96 | 84.16 | 1985.55 | 83.32 |
| 3 | 10.14 | 4.31 | 88.46 | 1503.93 | 87.37 |
| 4 | 5.88 | 2.42 | 90.88 | 1210.39 | 89.83 |
| 5 | 5.40 | 0.65 | 91.53 | 1135.10 | 90.46 |
Table 3.
Classification matrix according to the three established fruit quality categories based on the image analysis variables.
Table 3.
Classification matrix according to the three established fruit quality categories based on the image analysis variables.
| Actual Category | Ripe-Large Sized | Ripe-Small Sized | Unripe |
| Ripe-Large Sized | 93.31% | 3.85% | 3.85% |
| Ripe-Small Sized | 8.20% | 85.25% | 6.56% |
| Unripe | 5.26% | 15.79% | 78.95% |
Disclaimer/Publisher’s Note: The statements, opinions and data contained in all publications are solely those of the individual author(s) and contributor(s) and not of MDPI and/or the editor(s). MDPI and/or the editor(s) disclaim responsibility for any injury to people or property resulting from any ideas, methods, instructions or products referred to in the content. |
© 2026 by the authors. Licensee MDPI, Basel, Switzerland. This article is an open access article distributed under the terms and conditions of the Creative Commons Attribution (CC BY) license (http://creativecommons.org/licenses/by/4.0/).
Copyright: This open access article is published under a Creative Commons CC BY 4.0 license, which permit the free download, distribution, and reuse, provided that the author and preprint are cited in any reuse.


