1. Introduction
Quantum key distribution (QKD) generates secure keys between remote communication entities based on the basic principles of quantum mechanics, and has the potential to fundamentally change the way to secure information exchange in the future. In recent years, significant progress has been made in the research of QKD protocols and networks [
1,
2,
3]. The transmission distance and secure key rate (SKR) have been greatly improved, and the secure key rate can reach 110 Mbps [
4]. The longest transmission distance of twin-field QKD has been extended to 1002 km [
5]. However, the high cost of deploying dedicated fiber is a major obstacle to the widespread use of QKD. A promising solution to reduce deployment costs is to coexist QKD with classic optical communication. The coexistence system based on WDM or SDM technology has emerged. The spatial division multiplexing (SDM) technology utilizing spatial degrees of freedom is the main direction for the future development of fiber optic networks, initially proposed to solve the capacity shortage of single-mode fiber (SMF) [
6,
7]. At present, there are several types of optical fibers that can achieve SDM, such as multi-core fiber (MCF), FMF, few-mode multi-core fiber, etc. Compared with MCF, FMF has simpler manufacturing process, and existing SMF fusion devices can be directly used for FMF. The effective mode field area of FMF is large, which is conducive to reducing nonlinear noise and suitable for transmitting sensitive quantum signals [
8].
Nevertheless, whether using MCF or FMF in coexistence system, the SpRS generated by the classical signal is a challenge for this scheme. The wavelength range of SpRS exceeds 200 nm, which can easily affect the quantum channel and hinder the practical application of coexistence schemes. This study establishes a SpRS model for FMF-based coexistence system and quantifies critical influencing factors. The ring-assisted FMF is proposed based on the analysis, achieving significant enhancement in quantum signal transmission distance.
2. Theoretical Model of SpRS When Quantum Signal Coexists with Classical Signal in FMF
In the coexistence system, each mode carries only classical or quantum signal. Different wavelengths are added to each mode by using WDM. Since the proposed SpRS model builds on mode crosstalk, we first calculate the crosstalk mechanism as detailed in [
9].
Pi and
Pj denote the transmitted powers in each channel along the z-axis. Equations(1) and (2) can be obtained for the conditions that
Pj(0) =
pc (classical channel initial power) and
Pi(0) =
pq (quantum channel initial power) .
α are the attenuation coefficient in the channels, and
hij is the power coupling coefficient.
Then, the derivation of SpRS is carried out, in which the classical signal of the n-th wavelength channel in j-th mode generates SpRS in the m-th quantum channel of i-th mode. The SpRS arises through two distinct mechanisms: (1) Direct crosstalk, where the classical signal leak into quantum channel and directly generate SpRS; (2) Induced crosstalk, where classical signals first produce SpRS in their original channels, and the generated SpRS subsequently crosstalks into quantum channel.
In the first part, the power of SpRS can be described as [
10]:
here,
ηmn denotes the Raman scattering coefficient between the
m-th and
n-th wavelength channels. The crosstalk power density at position
z,
PICXT(
z) is defined per differential length d
z and can be calculated using Eq. (2). To account for both SpRS generation and fiber attenuation effects, the SpRS power at the output end of the FMF is obtained by integrating contributions along the fiber length with appropriate loss:
where L is the fiber length.
Next, we analyze the second contribution to SpRS. The SpRS power generated within a fiber segment dz in the j-th mode can be expressed as:
Pcs(
z) represents the signal power at the differential segment d
z, which can be calculated by using Eq. (1). As described in Eq. (7), this power partially couples into the
i-th mode and propagates to the output port of the FMF.
The power equation can be derived as [
11,
12],
The total SpRS power in the system is determined by the derived equations:
For the case of multiple classical channels in system, the SpRS of the
m-th channel in
i-th mode (quantum channel) can be expressed as,
According to the derivation results, the SpRS power in FMF is determined by fiber length, initial signal power,
α and
hij. Among them,
hij is closely associated with the inherent properties of the fiber, which dominates the mode coupling in the FMF. Currently, research on
hij remains limited in coexistence system utilizing other fibers. The
hij can be expressed as [
13],
β is propagation constant.
κij is mode coupling coefficient, which can be calculated as [
14],
where, (
n2-
n02) is the refractive index perturbation [
15], and
f(
x,y) is the mode field distribution.
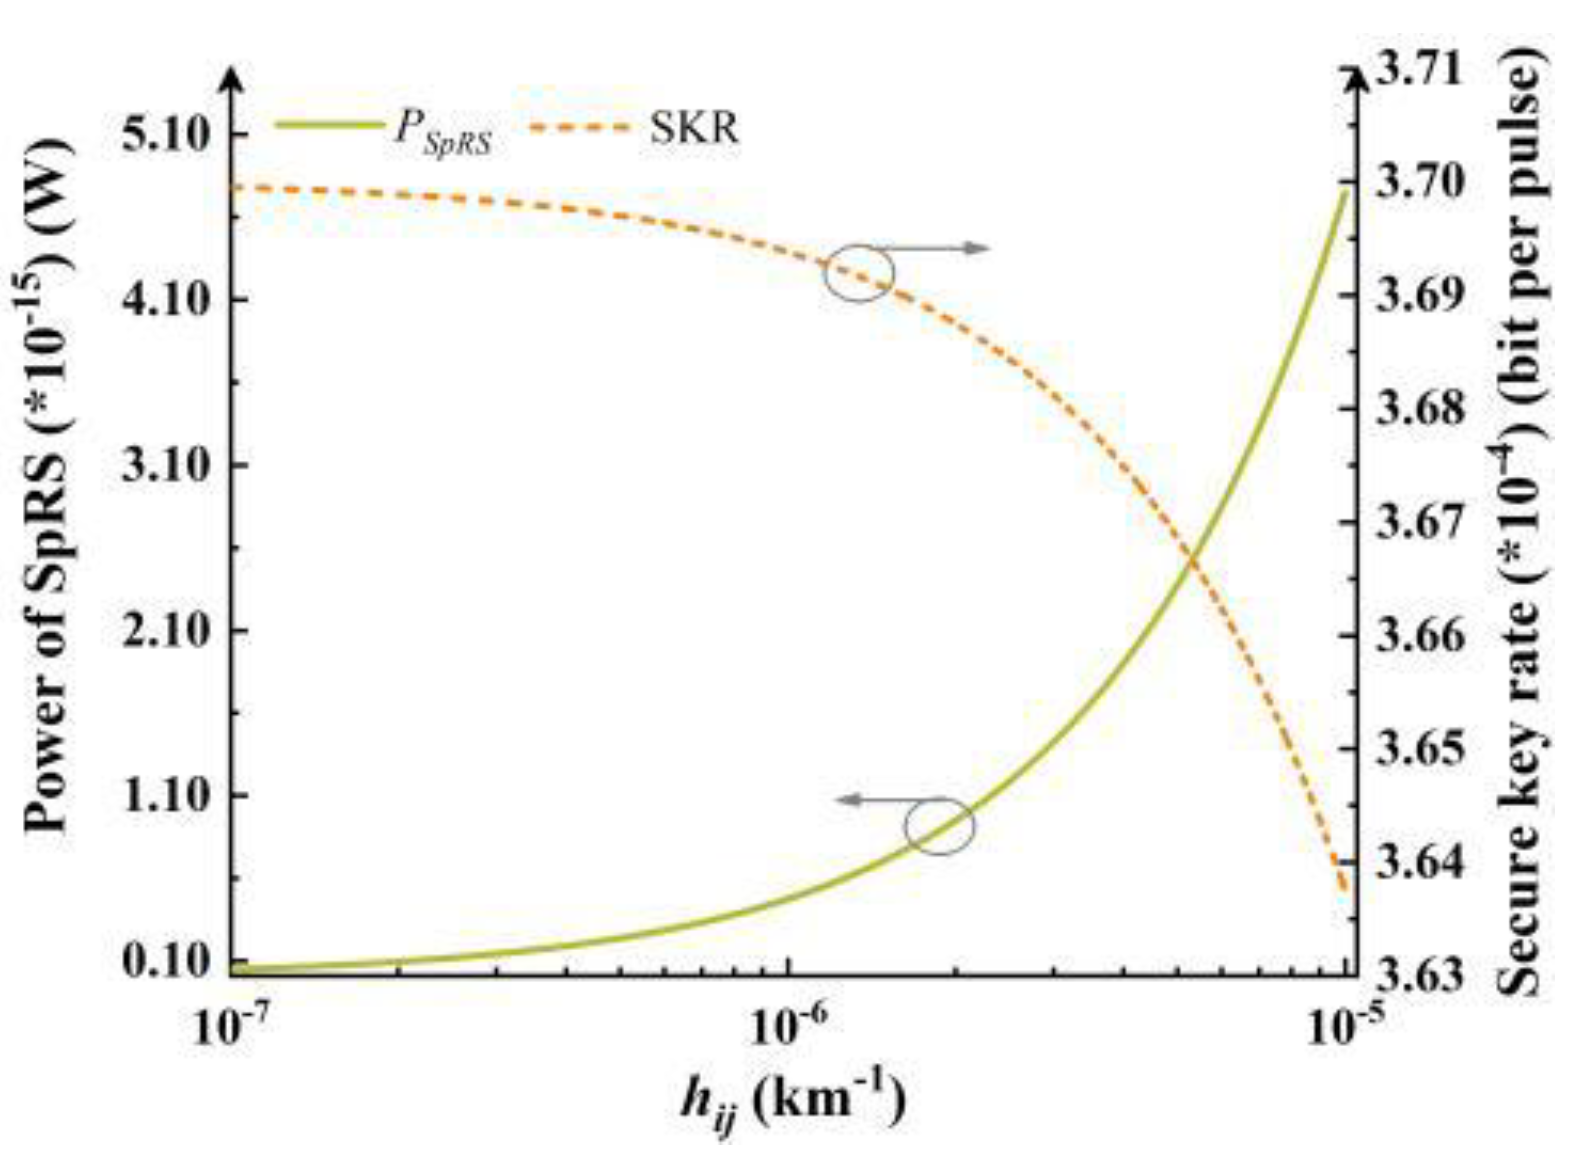
Figure 1 illustrates the relationship between SpRS, SKR and
hij. By modeling SpRS as equivalent noise photons, the
pSRS can be expressed as [
16],
h is the Planck`s constant.
f is the frequency of the quantum channel. Δ
f is the receiving bandwidth of the quantum channel, and Δ
t is the detector effective gating width. Taking the widely used BB84 protocol with decoy-state method as an example, the SKR of quantum signal can be described as [
17],
H2 is the binary Shannon entropy,
q is set to 1/2 for the BB84 protocol,
fe accounts for the efficiency of error correction which is set to 1.15.
μ is the average number of photons in one pulse.
Q1 and
e1 are the gain and the error rate of single-photon state.
Qμ and
Eμ are the overall gain and the quantum bit error rate respectively, which can be obtained by the noise count which including the dark count of single photon detector and
pSRS. According to Eq. (14), the SKR is calculated. As
hij increases, the power of SpRS grows significantly, and the elevated noise subsequently degrades the SKR of quantum signal, as shown in
Figure 1.
3. Influencing Factors on SpRS in Coexistence System
The previous analysis investigates the impact of mode coupling (h
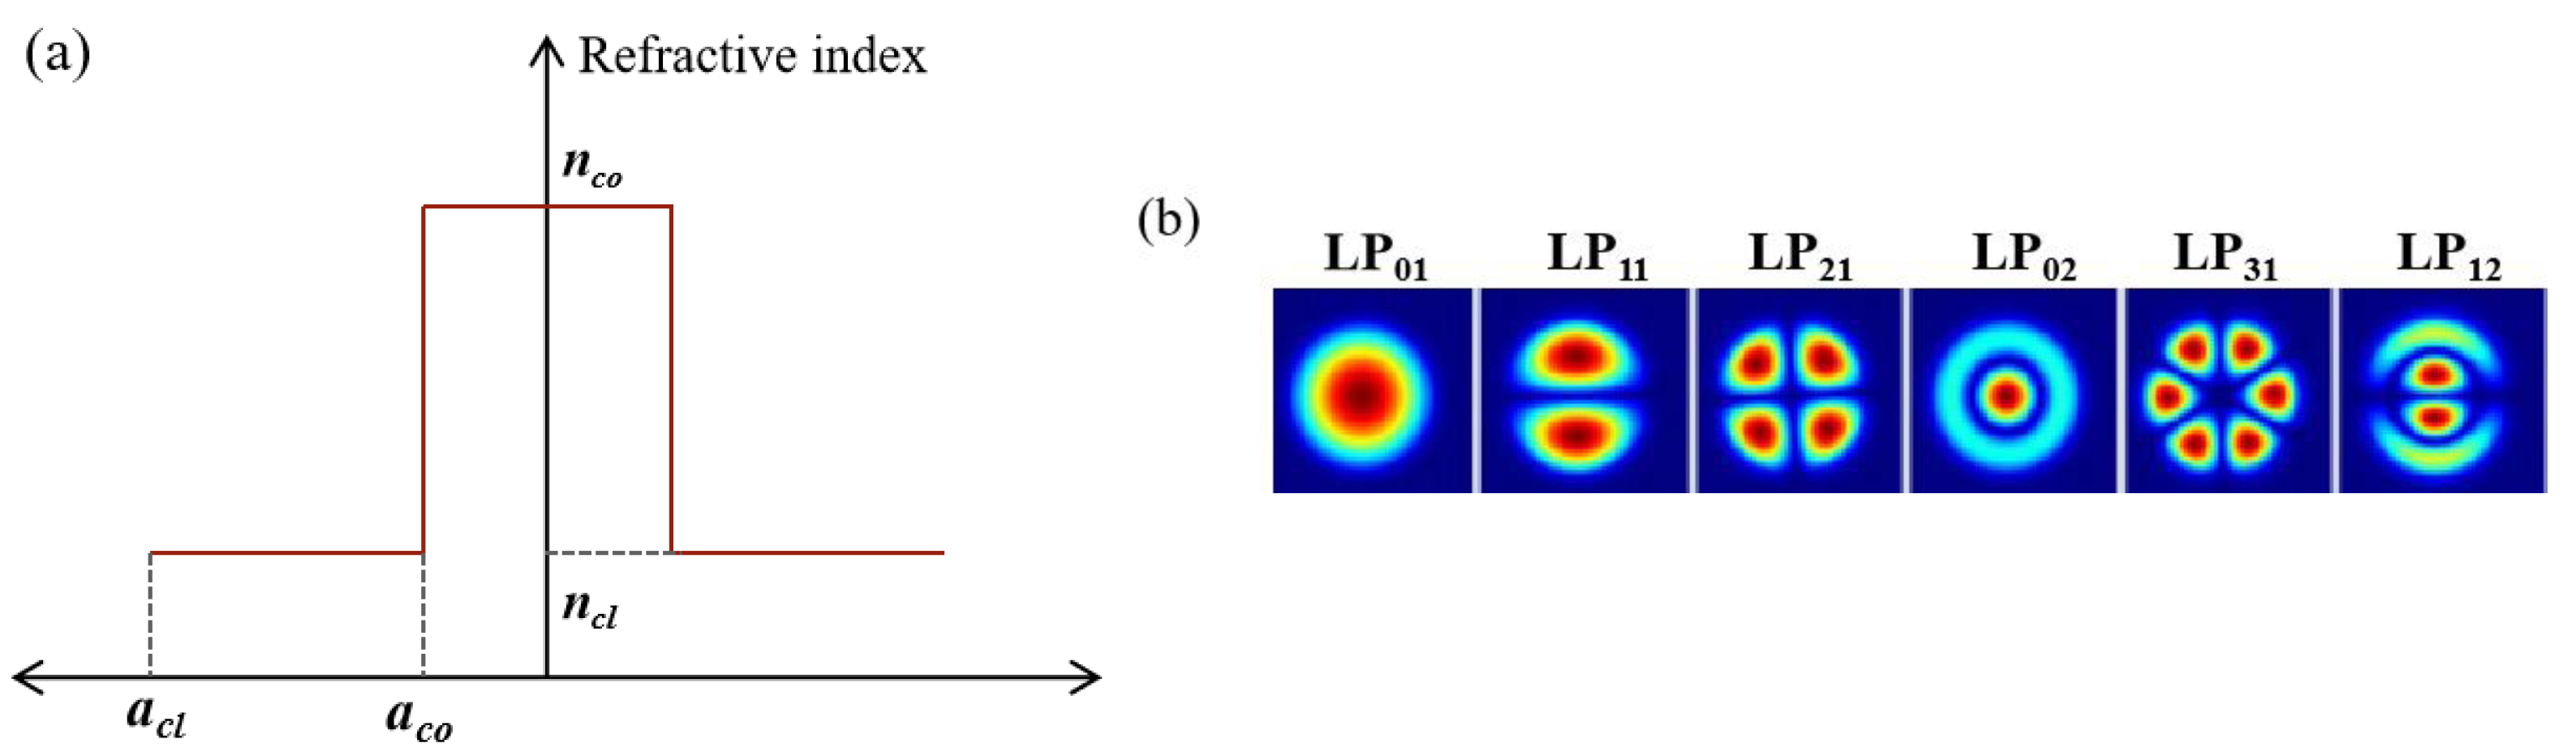
ij) induced by SDM technology on SpRS and quantum signal performance. Additionally, the variation in the number of wavelengths caused by WDM also affects the SpRS power. To further enhance the overall system performance, the subsequent research will analyze and compare the influence of classical signal wavelength and mode number in coexistence system. The analysis focuses on common FMF, specifically four-mode (4-MF) and six-mode (6-MF) fibers. The fiber structures are illustrated in
Figure 2(a), while the supported modes for each fiber are detailed in
Figure 2(b) (4-MF: LP
01, LP
11, LP
21, LP
02; 6-MF: LP
01, LP
11, LP
21, LP
02, LP
31, LP
12). The radius and refractive index are listed in
Table 1. In the discussion, the quantum channel is assigned to the LP
01 mode, while other modes serve as classical channels. Based on Eqs. (11) and (12), the h
ij between LP
01 and other modes can be derived, with results summarized in
Table 2. The wavelength of the quantum channel is 1550.12 nm, and the wavelengths of classical signals correspond to the ITU standard channel with a interval of 0.8 nm. η
mn between the wavelengths of quantum and classical channels can be obtained from Ref.[
16]. The power of quantum signal and classical signals are set to -80 dBm and 0 dBm respectively. Referring to YOFC official website, α is set to 0.2 dB/km (LP
01), 0.2 dB/km (LP
11), 0.21 dB/km (LP
21), 0.21 dB/km (LP
02), 0.215 dB/km (LP
31) and 0.215 dB/km (LP
12). Based on the above parameters, the analysis is carried out.
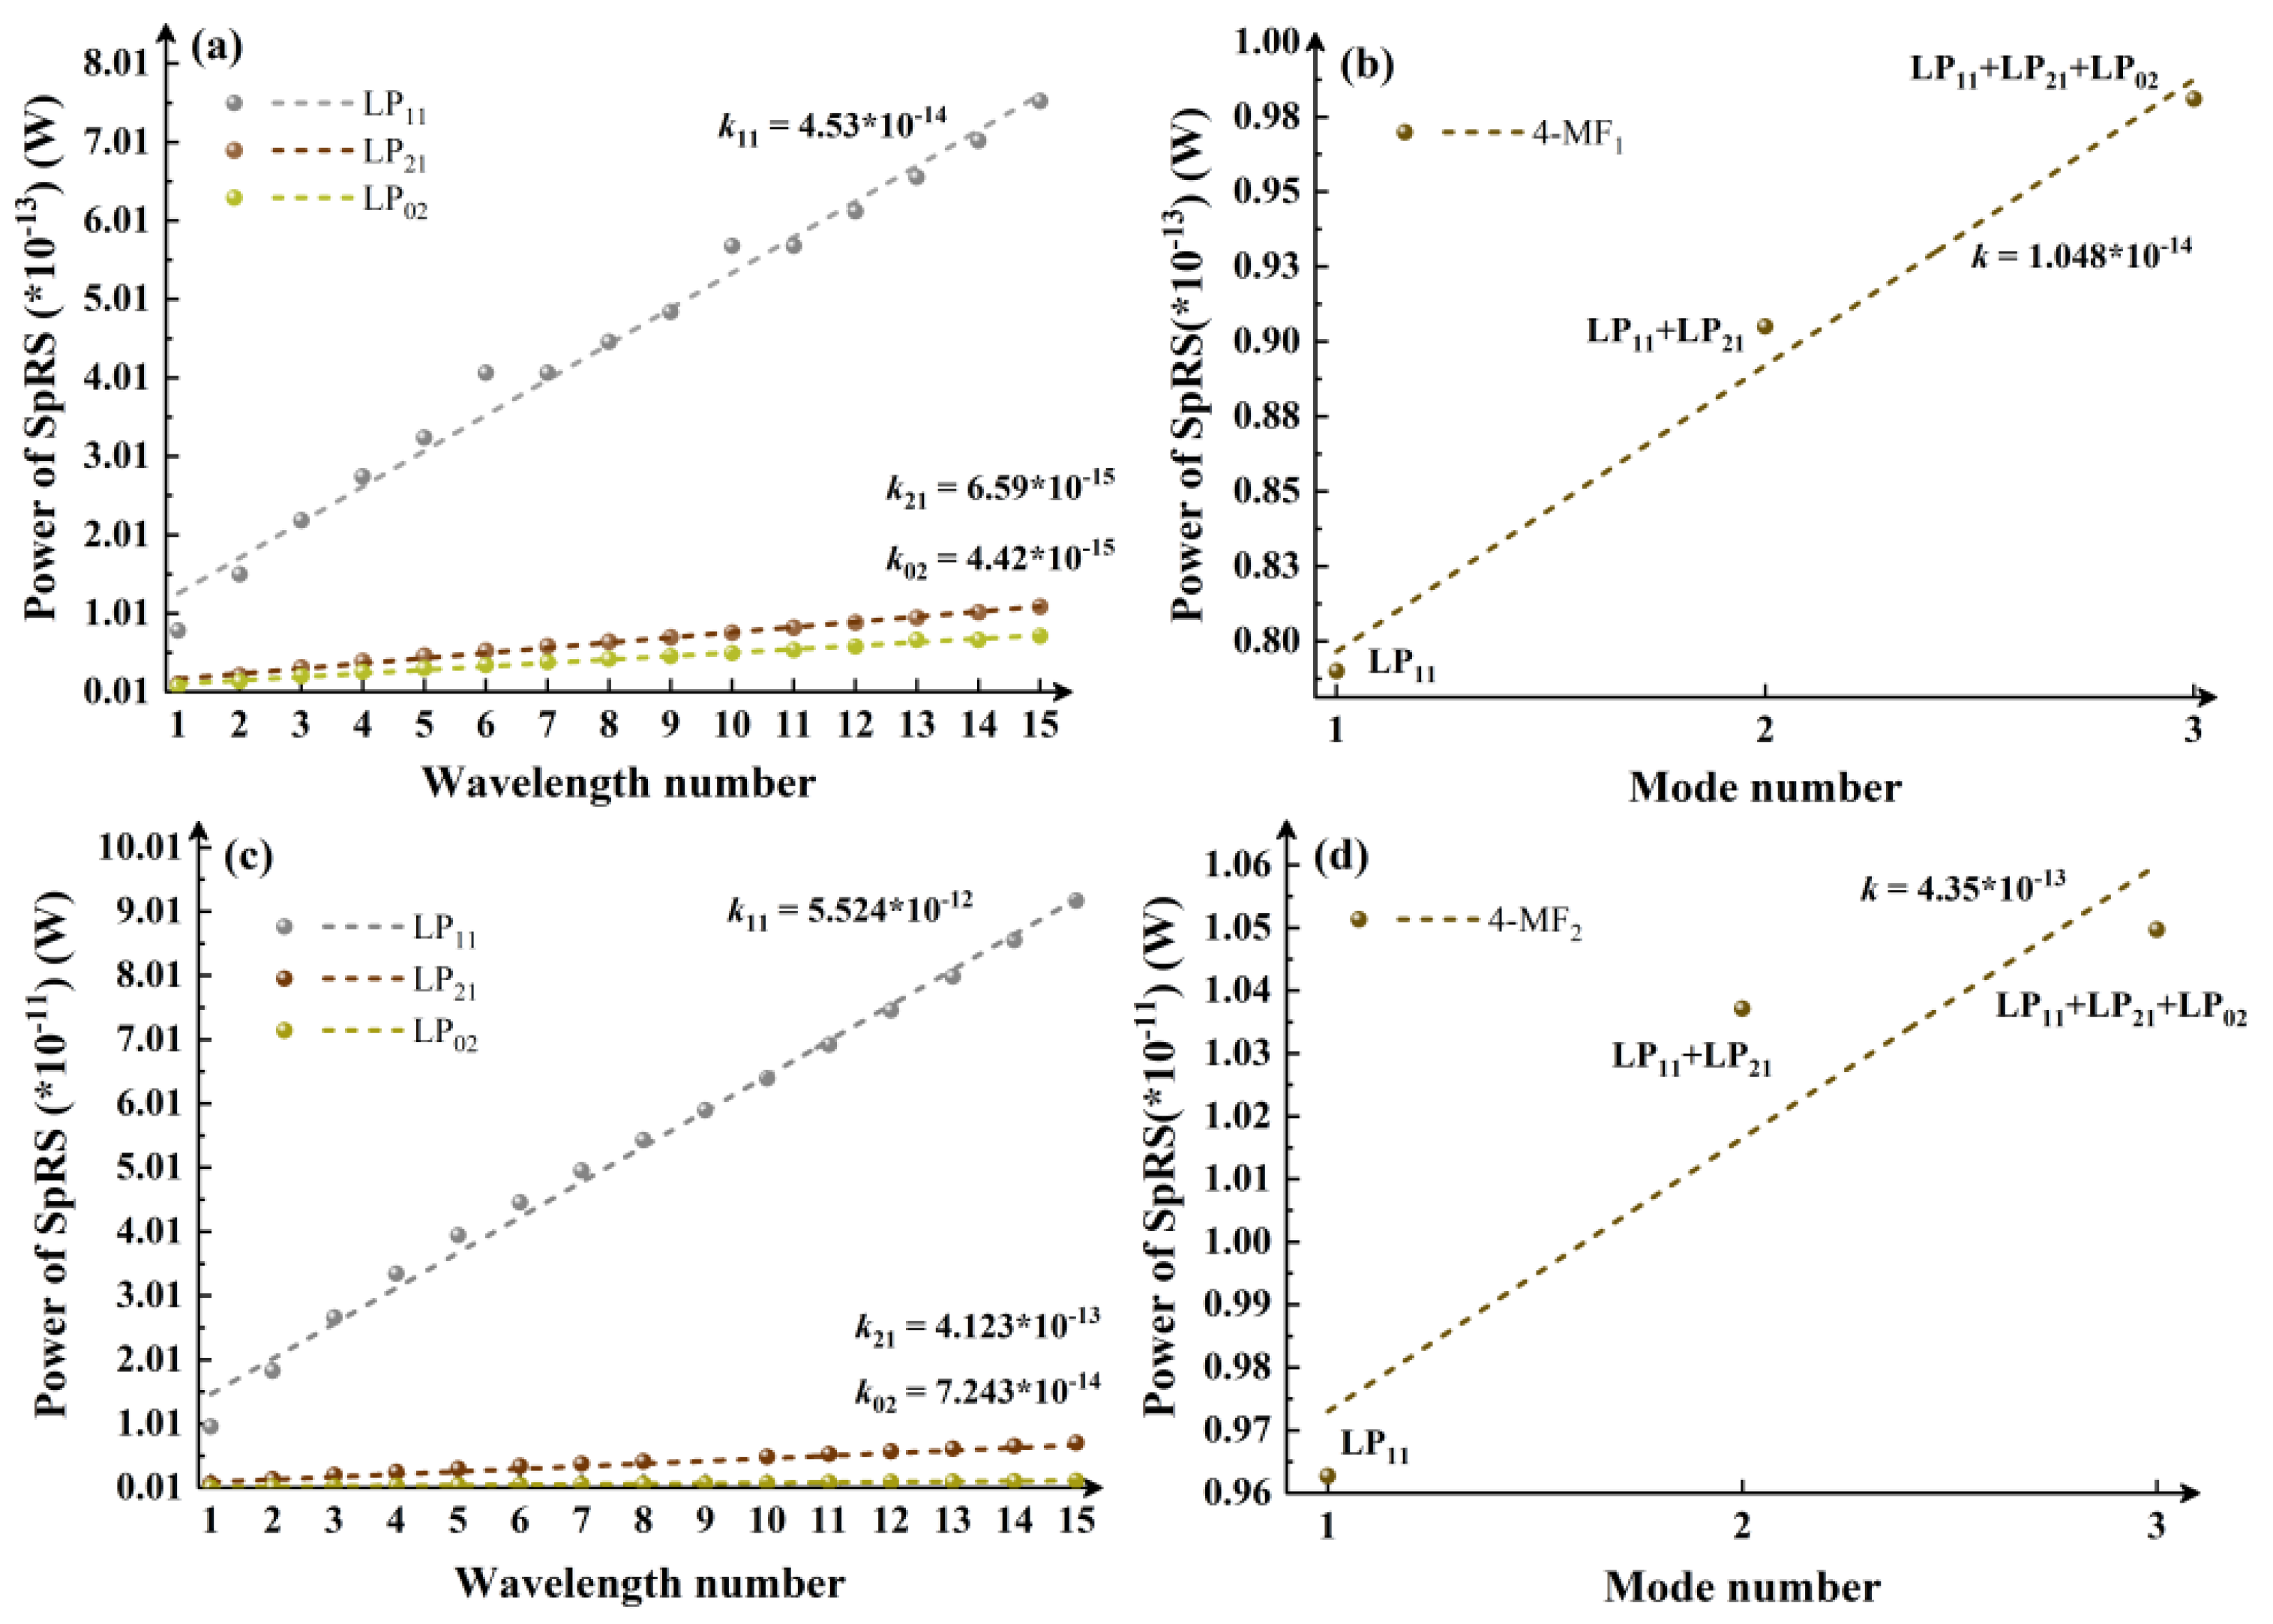
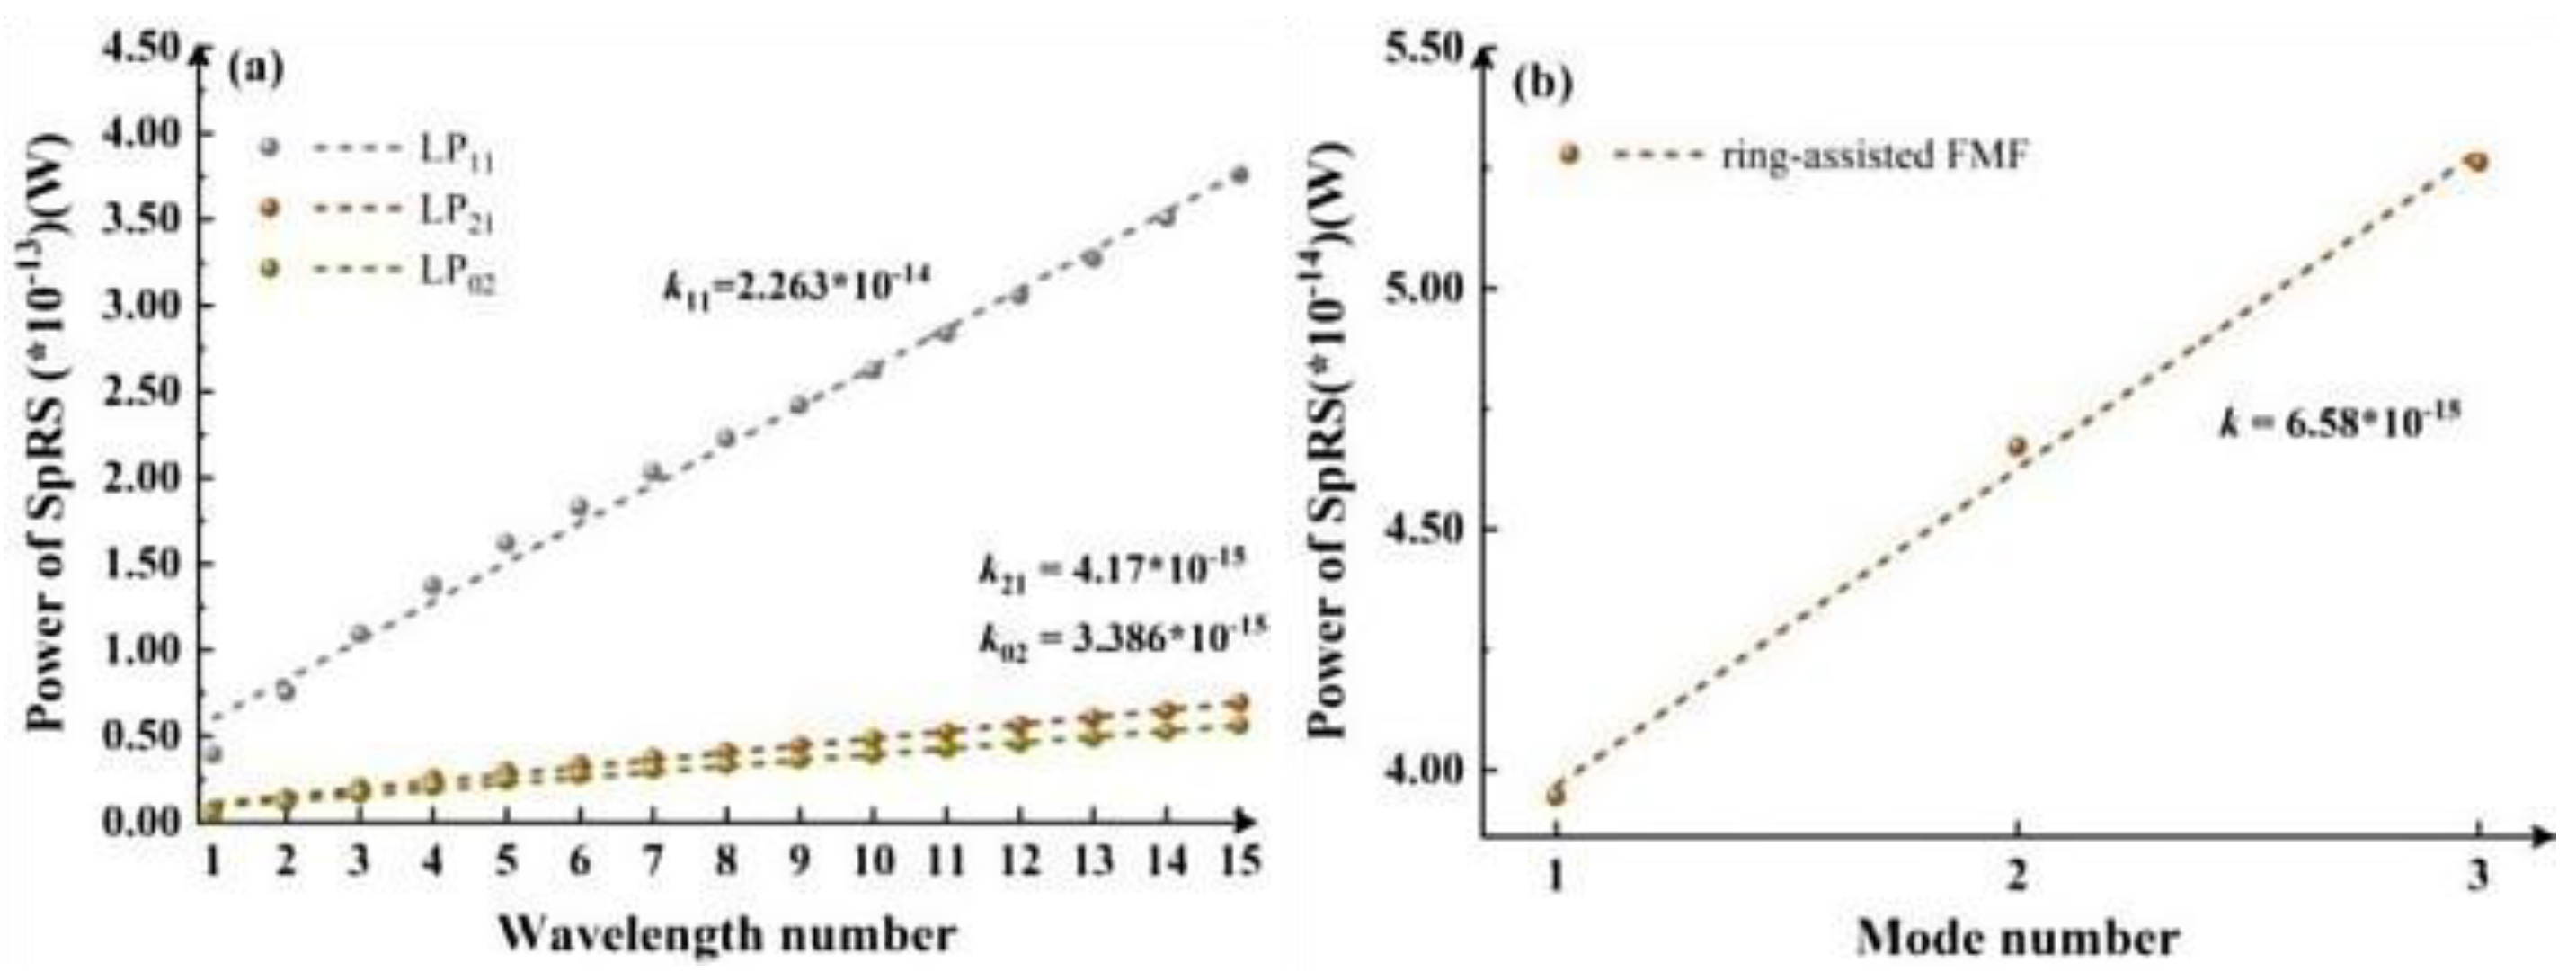
Figure 3 shows a comparative analysis of the influence of wavelength and mode number on SpRS in 4-MF. Specifically,
Figure 3(a) depicts the variation of SpRS power in the 4-MF
1 fiber when classical signals employ single-mode, as the number of wavelengths in the mode channel increases (from 1542.14 nm to 1554.13 nm, increasing by an interval of 0.8 nm according to the ITU standard, excluding 1550.12 nm).
Figure 3(b) illustrates the evolution of the SpRS power in the 4-MF
1 fiber when each mode channel contains only a fixed wavelength (1542.14 nm), while the number of modes occupied by the classical signal increases from 1 to 3 (successively activating the LP
11, LP
21 and LP
02 mode). Similarly,
Figure 3(c) and (d) correspond to the calculation results for the same scenarios in 4-MF
2, where (c) represents the change in the number of wavelengths under a single mode, and (d) represents the change in the number of modes under a single wavelength. The slopes of SpRS power increase under different conditions are listed in the figure to provide a direct comparison of the impacts from classical signal modes and wavelengths on SpRS. In Figure. 3(a) and (c),
k11 is defined as the slope of SpRS power growth when the classical channel operates in LP
11 mode, while
k21 and
k02 are assigned to LP
21 and LP
02 modes, respectively. From
Figure 3(a) and (c), a significantly accelerated SpRS power growth is observed when the classical channel uses LP
11 mode, with
k11 exceeding slopes of other modes by an order of magnitude (10
−14 vs. 10
−15). A comparative analysis of mode- and wavelength-dependent effects is performed through the calculated results in Figure. 3(a)-(b) and (c)-(d). It is observed that, excluding LP
01 mode cases, SpRS growth trends induced by wavelength number increments under single-mode operation (
Figure 3(a) and (c)) generally exhibit lower growth rates compared to those caused by mode number increments under fixed single-wavelength conditions (
Figure 3(b) and (d)).
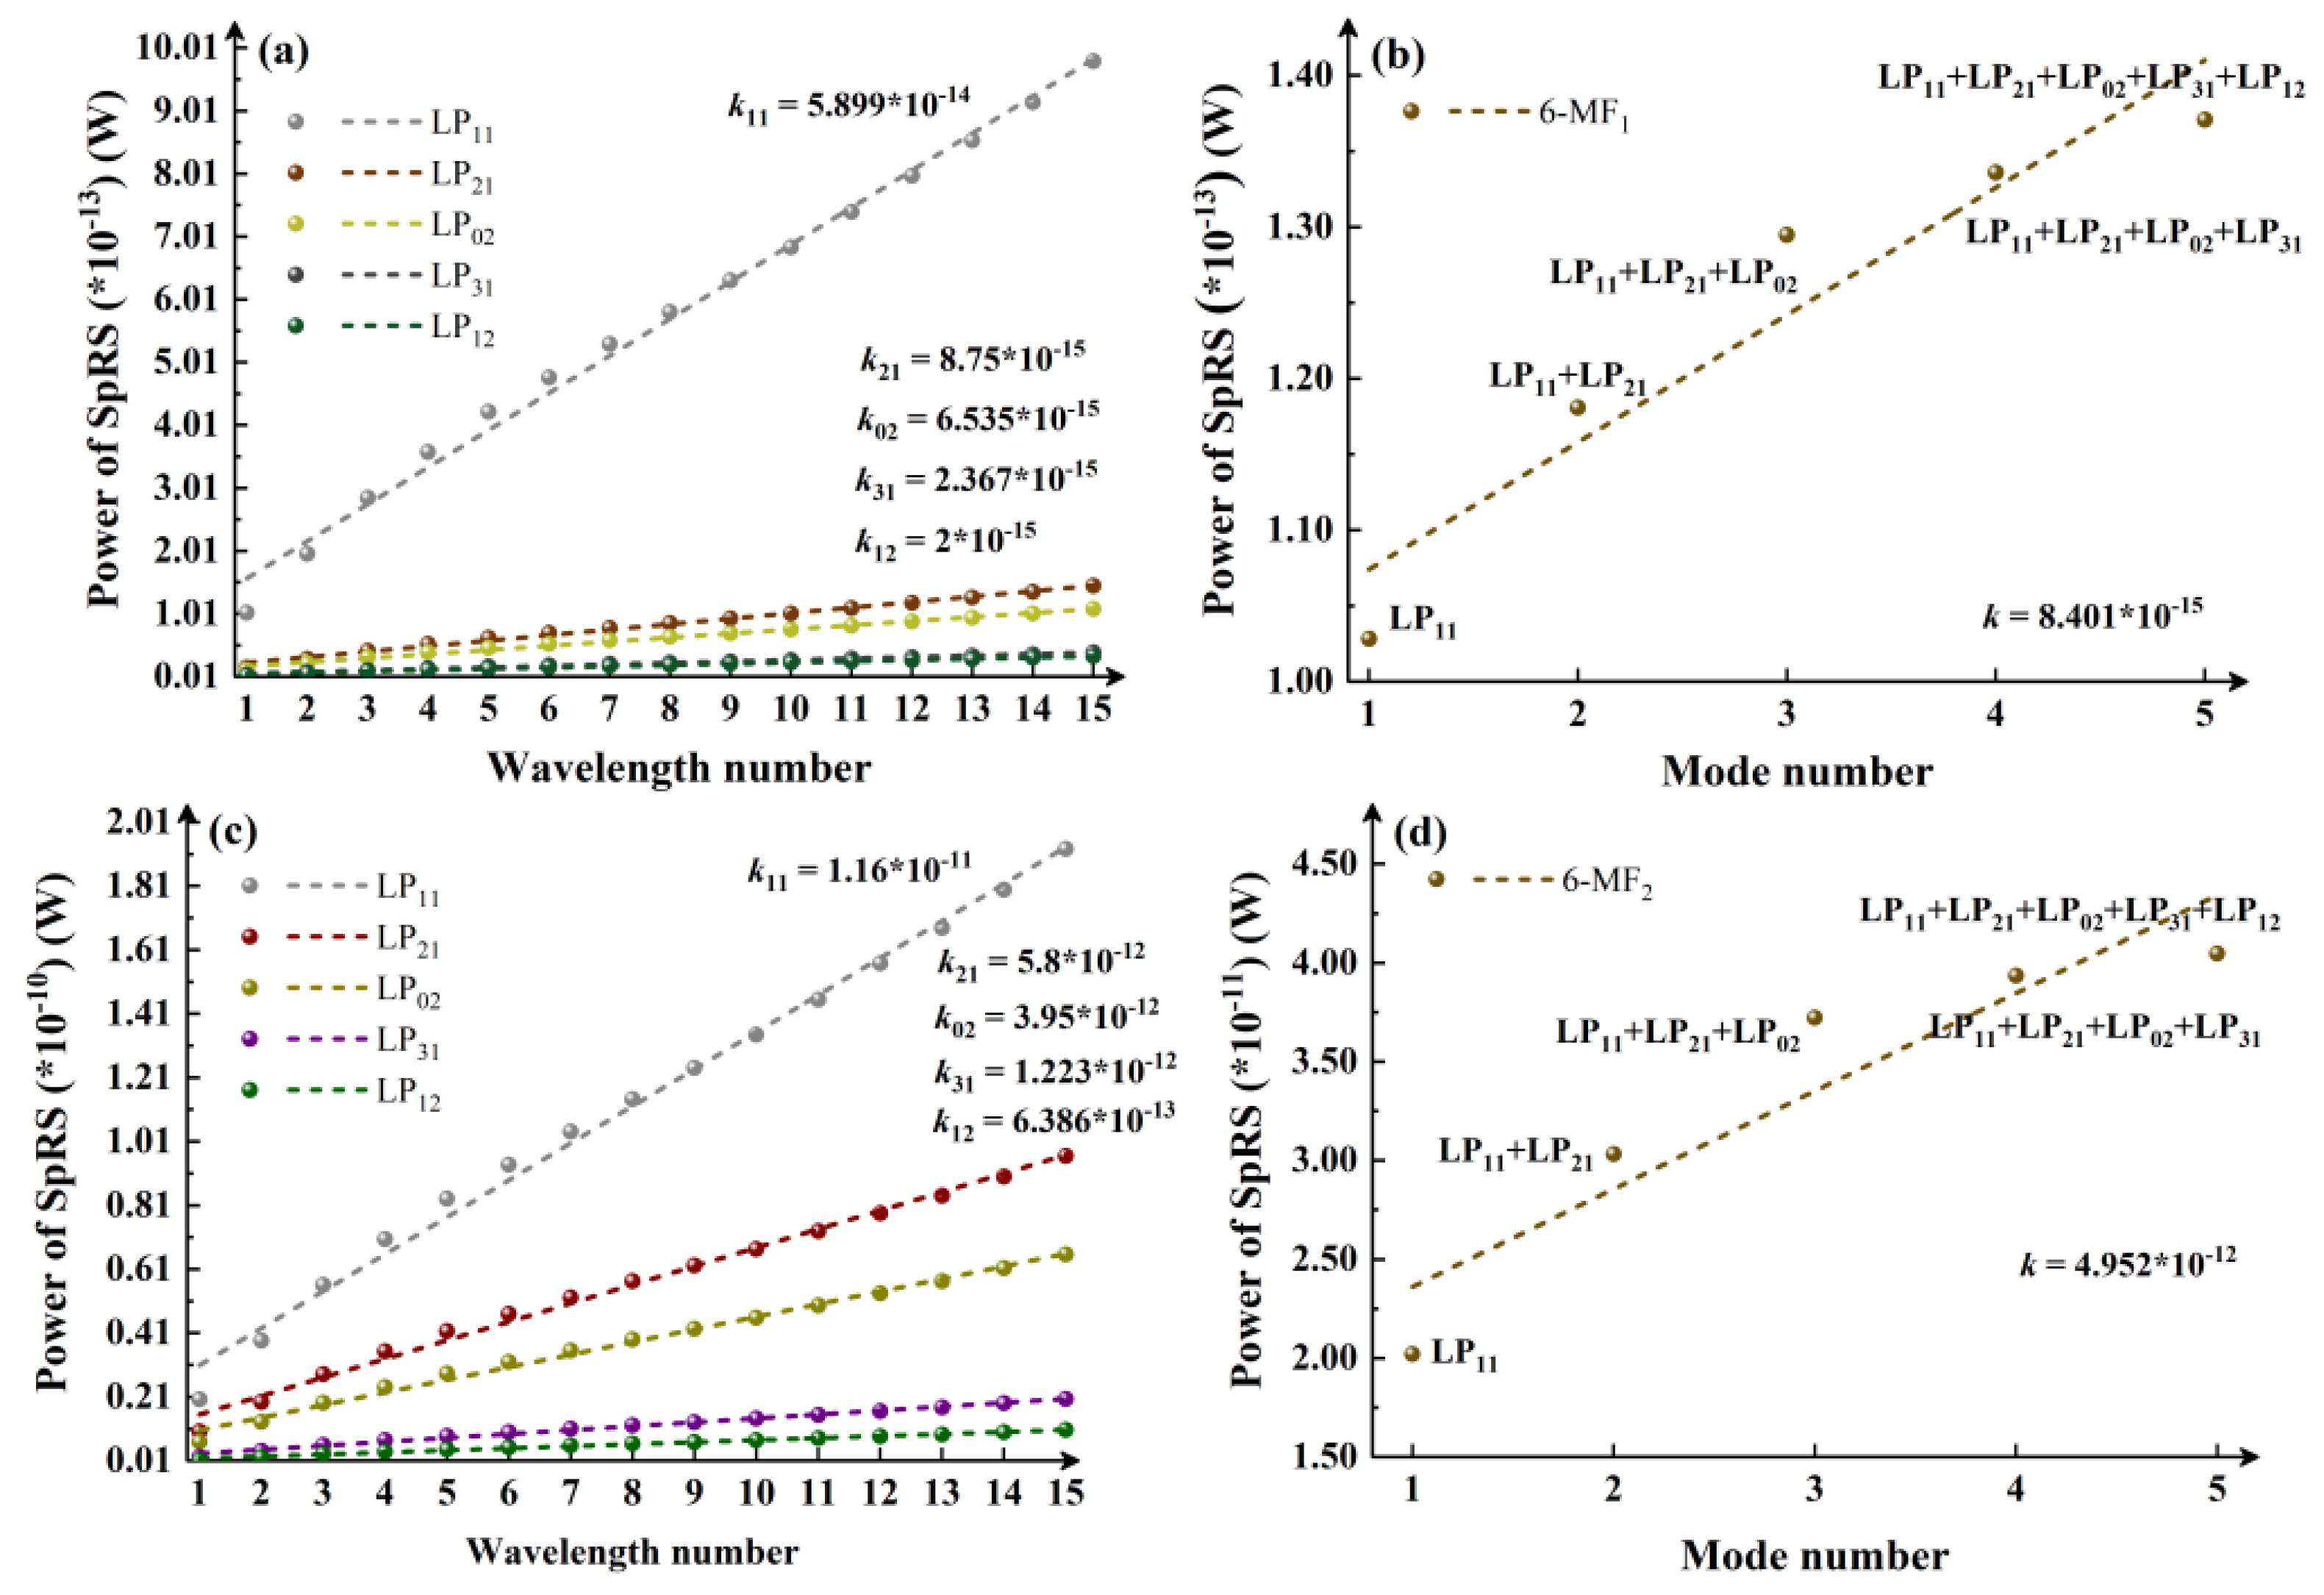
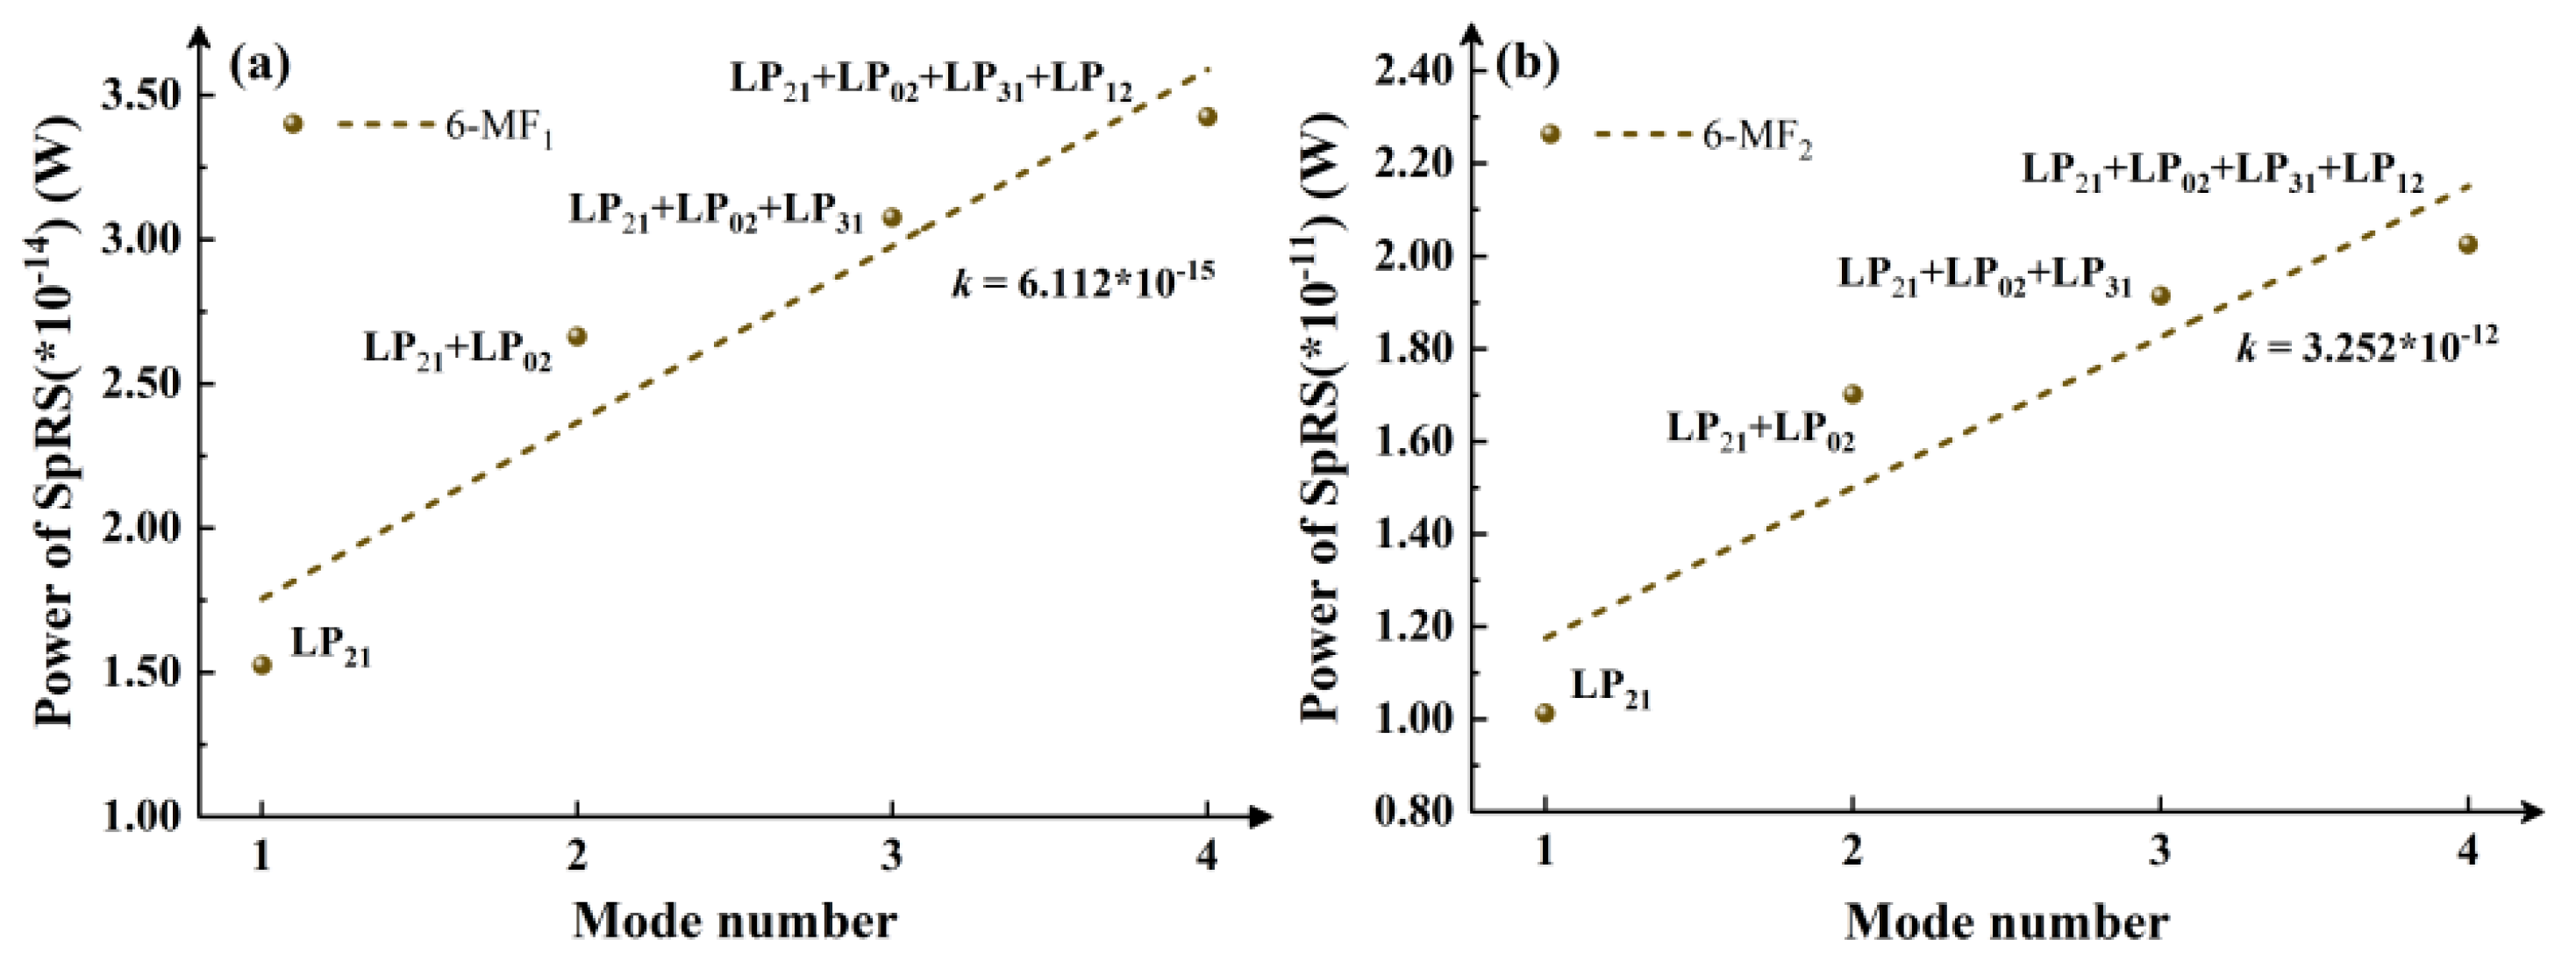
Further calculations are performed in 6-MF, as shown in
Figure 4. Similarly, from Figure. 4(a) and (c), the SpRS power growth remains fastest when the classical channel operates in LP
11 mode, with its slope exceeding those of other modes by nearly an order of magnitude (10
-14 vs. 10
-15). Consistently, the mode- and wavelength-dependent effects are analyzed using the results in
Figure 4(a)-(b) and (c)-(d). It is found that, excluding LP
01 mode cases, SpRS growth trends caused by increasing wavelength numbers under single-mode operation (
Figure 4(a) and (c)) are generally lower than or comparable to those induced by increasing mode numbers under single-wavelength conditions (
Figure 4(b) and (d)).
Considering that the LP
11 mode has a relatively large influence on SpRS, which may lead to errors in the data trend, the situation where the classical signal is in the LP
11 mode is excluded in
Figure 5. In the case of using a 6-MF, the growth trend of SpRS brought about by the increase in the number of modes when there is a single wavelength is analyzed. The activation order of the modes is LP
21, LP
02, LP
31 and LP
12 (The 4-MF only activates the two modes of LP
21 and LP
02, and it has no reference value). By comparing the
k values of the two groups of Figure. 4(a) and 5(a), and Figure. 4(c) and 5(b), it can be observed that under a single mode, the SpRS growth caused by wavelength increase remains lower than or comparable to the SpRS increase induced by mode number growth at a fixed wavelength. This result is consistent with the above discussion.
In summary, the analysis demonstrates that adjacent classical signal modes dominate quantum signal degradation compared to other factors. When adjacent mode exist, increasing the number of wavelengths generates more pronounced SpRS growth than adding modes. However, if the adjacent mode is removed, wavelength-induced SpRS growth becomes weaker or comparable to mode-induced growth. The quantified relationships derived from this analysis offer guidance for optimizing system performance.
4. Optimization and Performance Demonstration of FMF for Coexistence System
As demonstrated in
Section 2 and
Section 3, it can be seen that in addition to the number of modes and wavelengths, the mode coupling characteristics (
hij) of the FMF also have a great influence on the performance of the coexistence system. This section will focus on the optimization of
hij.
Since the difficulty of de-multiplexing 6-MF in practical applications, the optimization is based on 4-MF. According to previous studies, mode coupling is related to Δ
neff. As shown in
Table 2 and
Table 3,
hij remains low when Δ
neff is large. Therefore, to reduce SpRS power and extend quantum signal transmission distance, Δ
neff can be appropriately increased. The most intuitive way to improve Δ
neff is increasing the refractive index difference between core and cladding. However, for the given number of modes and parameters, a large Δ
neff means a small mode field area, making it difficult to suppress nonlinear effect [
18]. To address this contradiction, a ring-assisted FMF is designed. By carefully selecting parameters of the refractive index ring in the core, the Δ
neff between each mode can be optimized. The optimized fiber structure is shown in
Figure 6, with 4-MF
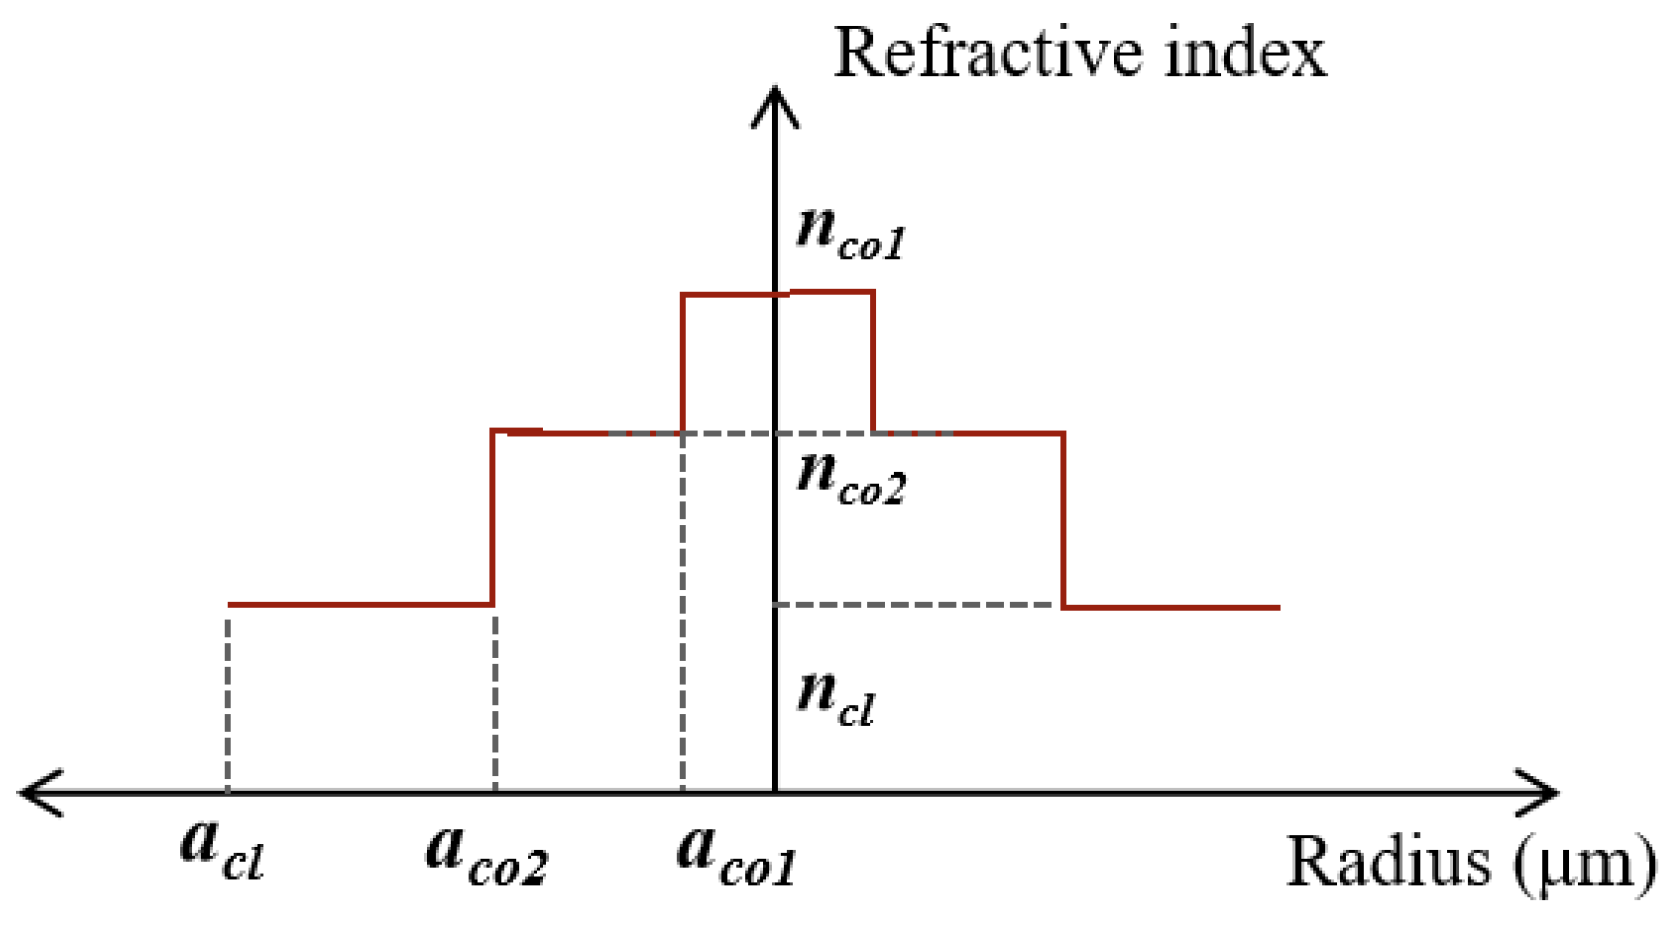
1 as the basic design parameters.
Aco1 is the radius and
nco1 is the refractive index of refractive index ring.
Considering the changes involving multiple parameters, the ergodic method is adopted for parameter design. The quantum signal is in the LP
01 mode, and the LP
11 mode has the greatest influence on it. Therefore, the primary optimization objective focuses on minimizing the Δ
neff between LP
01 and LP
11.
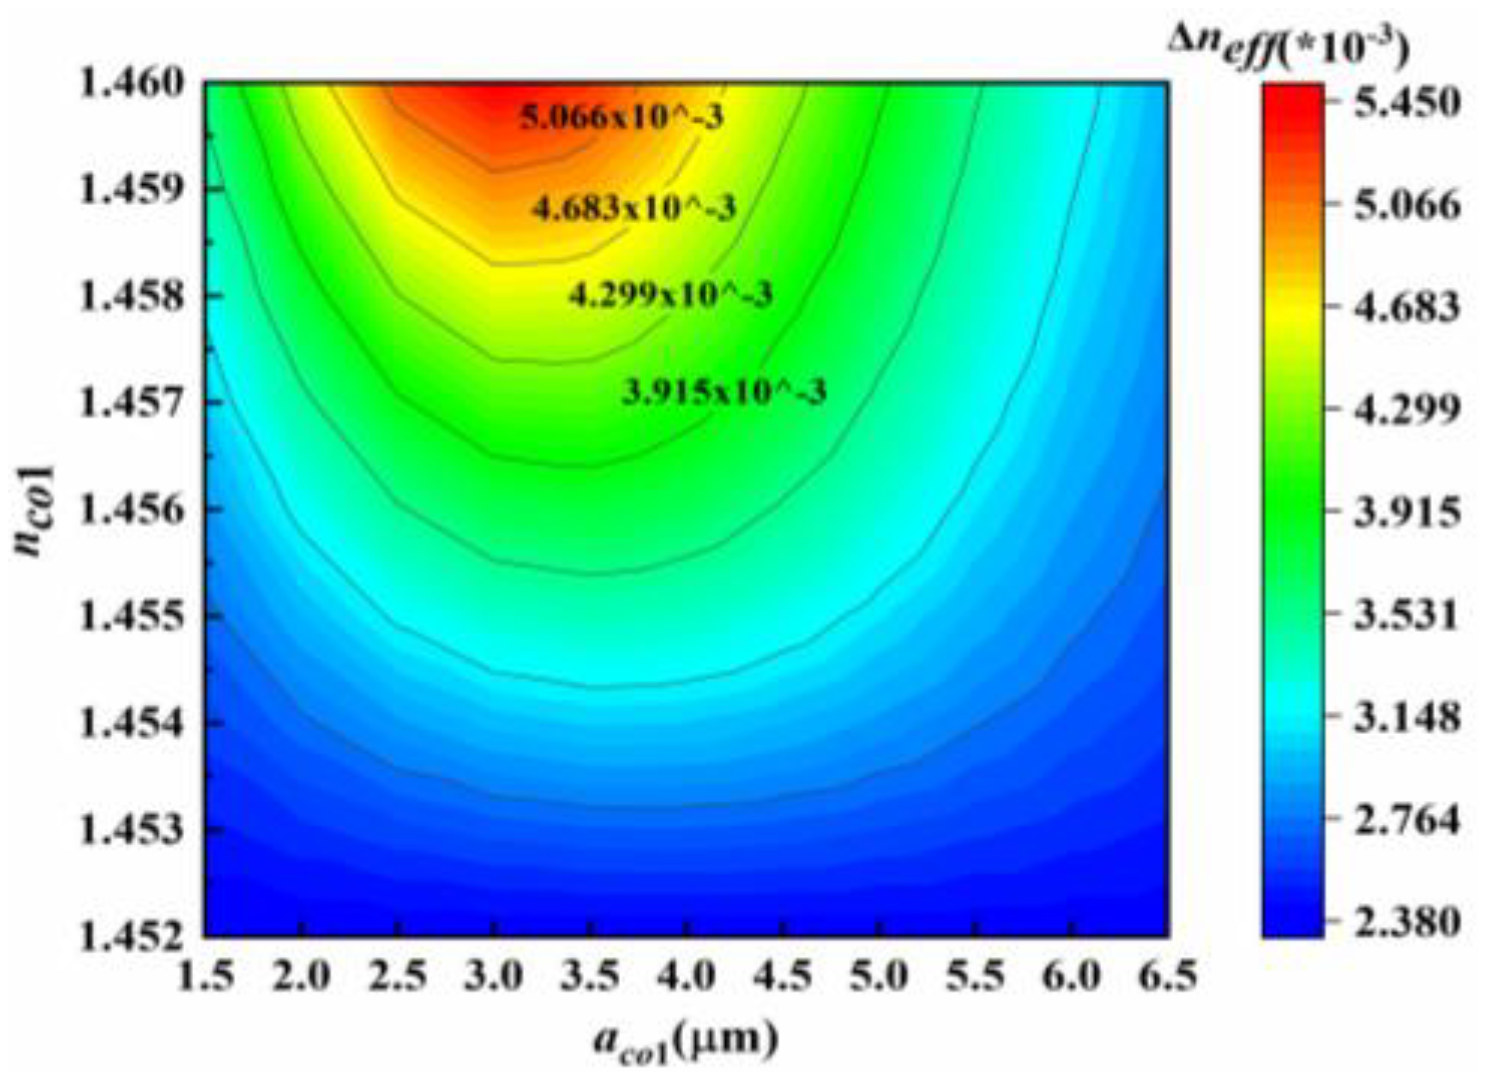
Figure 7 illustrates the influence of variation in refractive index ring radius and refractive index on Δ
neff. The radius ranges from 1.5nm to 6.5 nm with a interval of 0.5 nm, while the refractive index varies from 1.452 to 1.46 with a interval of 0.001. The distribution of Δ
neff can be intuitively observed in
Figure 7(a), whereas in
Figure 7(b), there are 21 parameter combinations exhibiting that the Δ
neff between LP
01 and LP
11 is greater than 4*10
-3. Meanwhile, the Δ
neff between other modes should also strive to exceed 1*10
-3.
Based on the influence of multiple parameters, the ring-assisted FMF parameters can be determined as
aco2=7 μm,
aco1=5 μm,
nco2=1.452,
nco1=1.46. Correspondingly, the Δ
neff and
hij of the ring-assisted FMF are listed in
Table 4. Compared with the parameters in
Table 2 and
Table 3, the Δ
neff between LP
01 and LP
11 increases while
hij decreases significantly.
The performance of the optimized ring-assisted FMF in coexistence system is verified.
Figure 8 further confirms the impact of wavelength and mode number in the system. When the quantum channel is operated in LP
01 mode and the classical channel is configured with a single mode (each mode allocated 10 wavelengths through WDM), the SKR variation of key distribution with transmission distance is presented in
Figure 9, where 4-MF
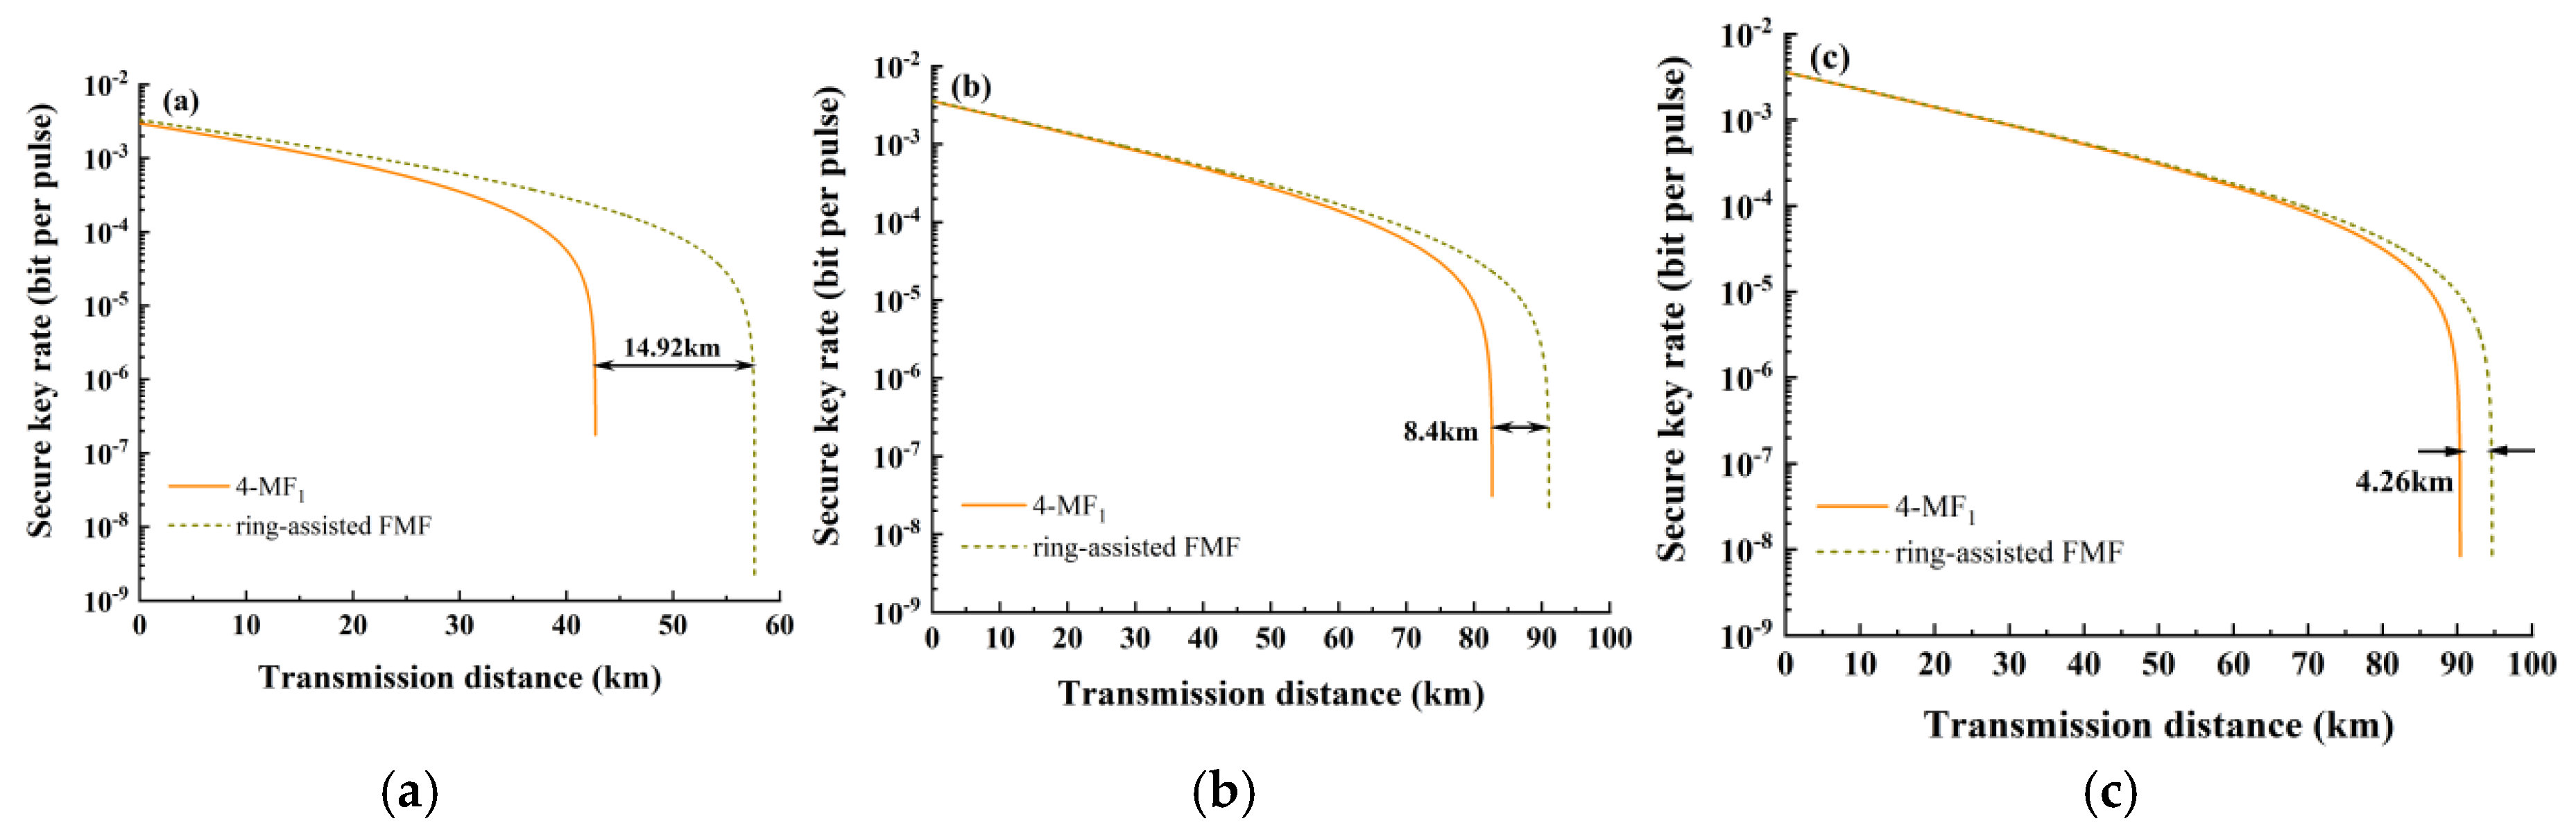
1 is represented by solid lines and the ring-assisted FMF is indicated by dashed lines. Apparently, with the employment of ring-assisted FMF, the transmission range of quantum signal has been significantly enhanced. In the case where the classical channel is configured at LP
11, the transmission distance can extend up to 57.64 km, which indicates a impressive improvement of 34.9%. Meanwhile, when the classical channels are set to LP
21 and LP
02 respectively, the corresponding transmission distances achieve 91.05 km and 94.63 km, with respective enhancements of 10.2% and 4.7%.
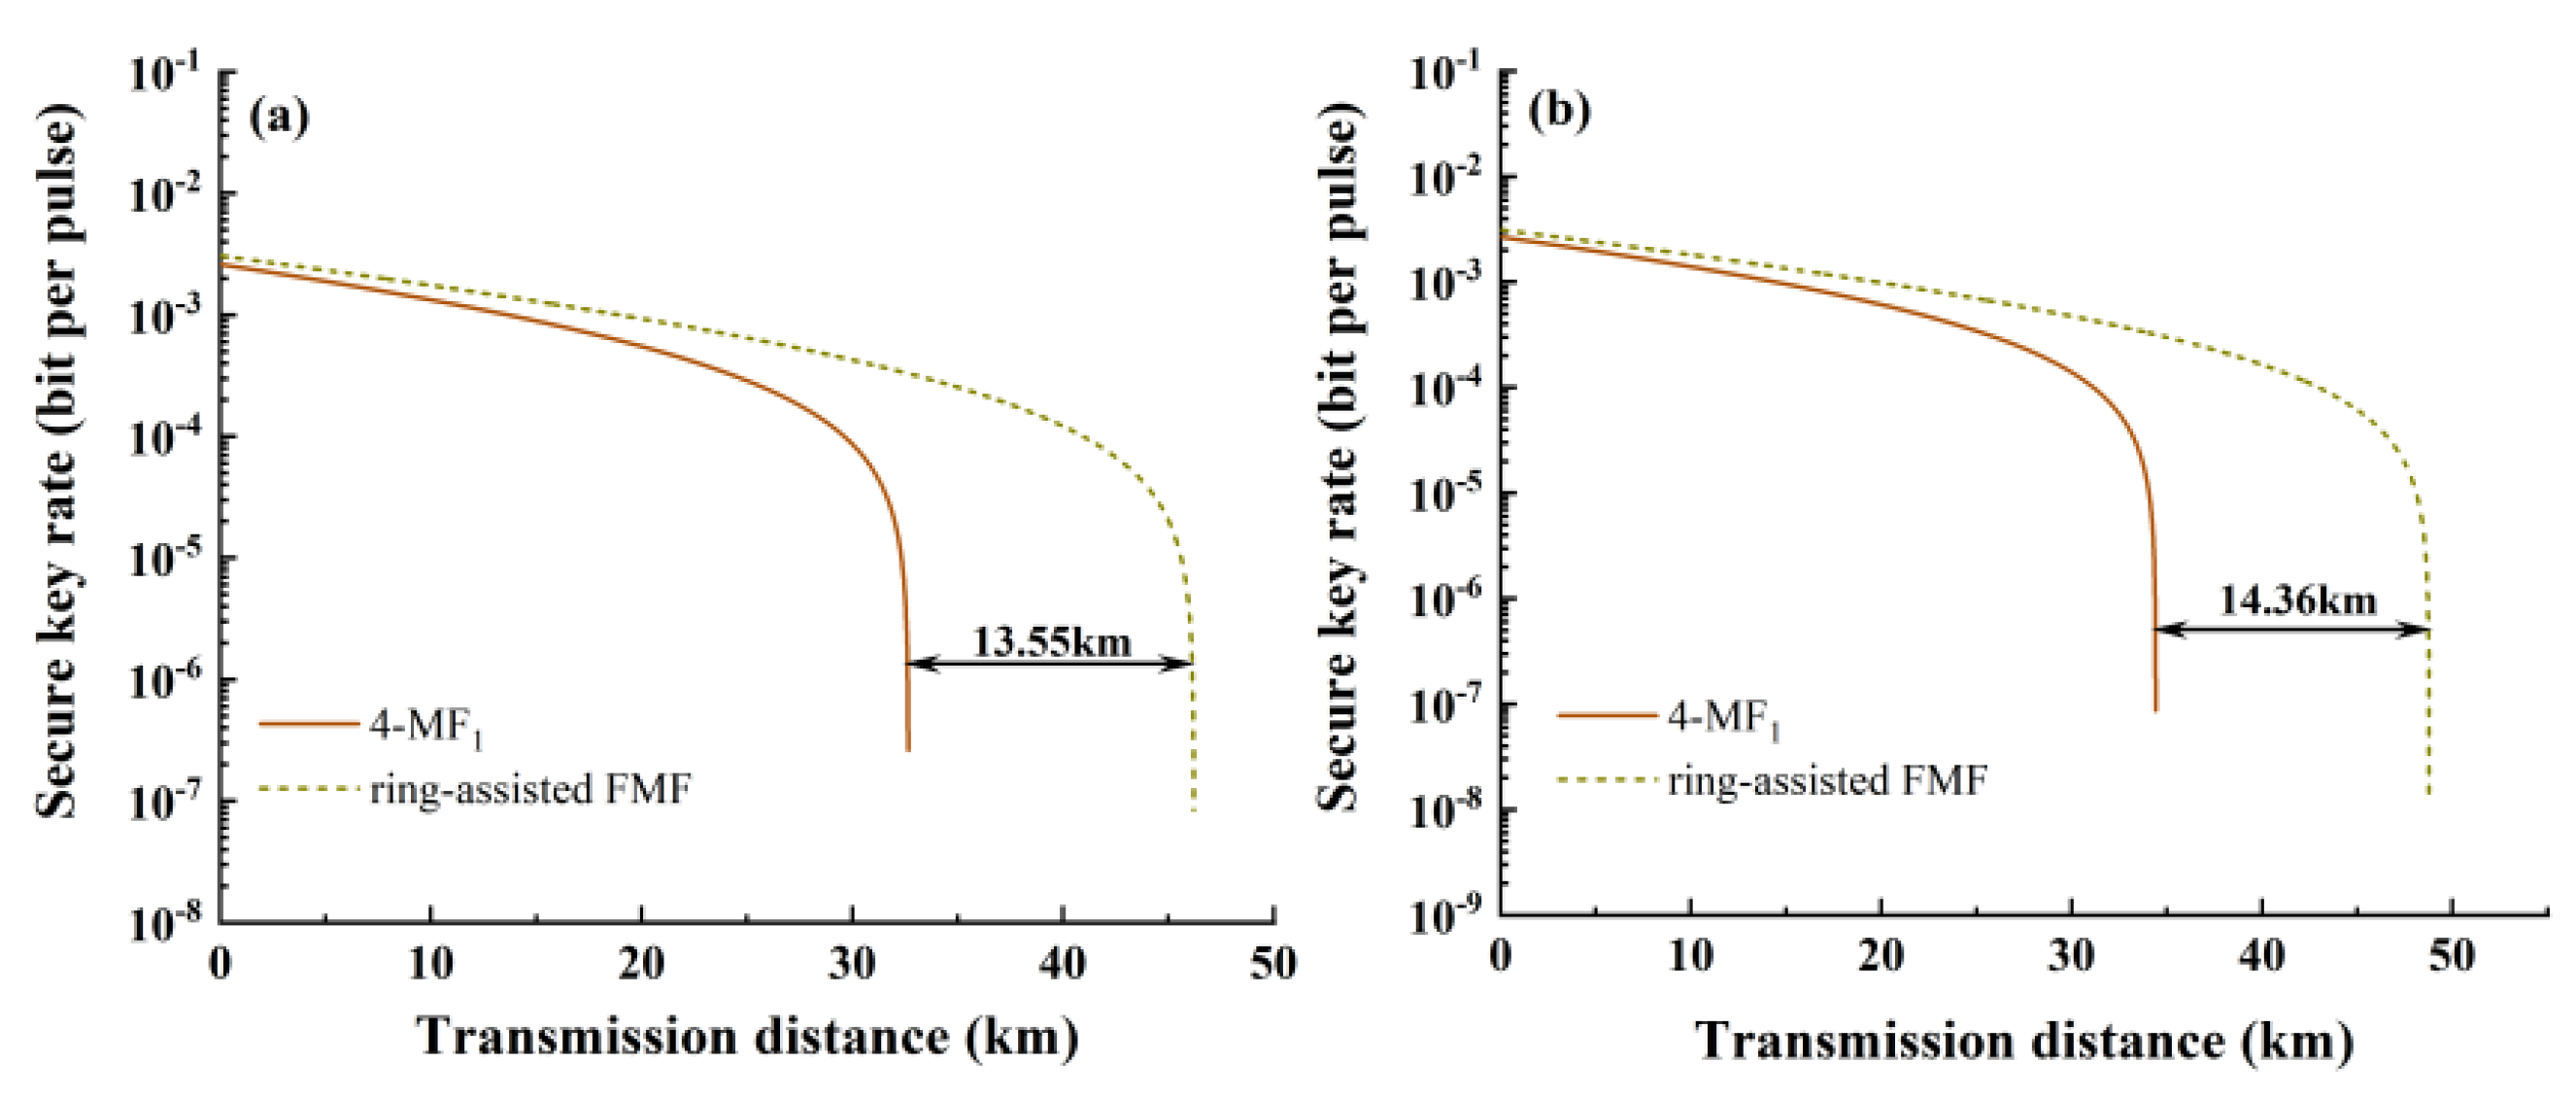
A comparative analysis of the performance in multi-mode configurations is subsequently conducted. As shown in
Figure 10, quantum signal transmission distances are compared between ring-assisted FMF and 4-MF
1 fibers in
Figure 10(a), where LP
11, LP
21, and LP
02 modes are simultaneously utilized as classical channels. Each mode is configured with 10 wavelengths spanning 1539.77~1546.92 nm with a interval of 0.8nm.
Figure 10(b) illustrates the transmission distance comparison for systems employing LP
11 and LP
21 modes under identical wavelength configurations. Significant improvements are observed with the ring-assisted FMF configuration: transmission distances are increased to 46.2 km (three modes) and 48.77 km (two modes), corresponding to enhancement rates of 41.5% and 41.7%, respectively. The results confirm the positive effect of optimization.
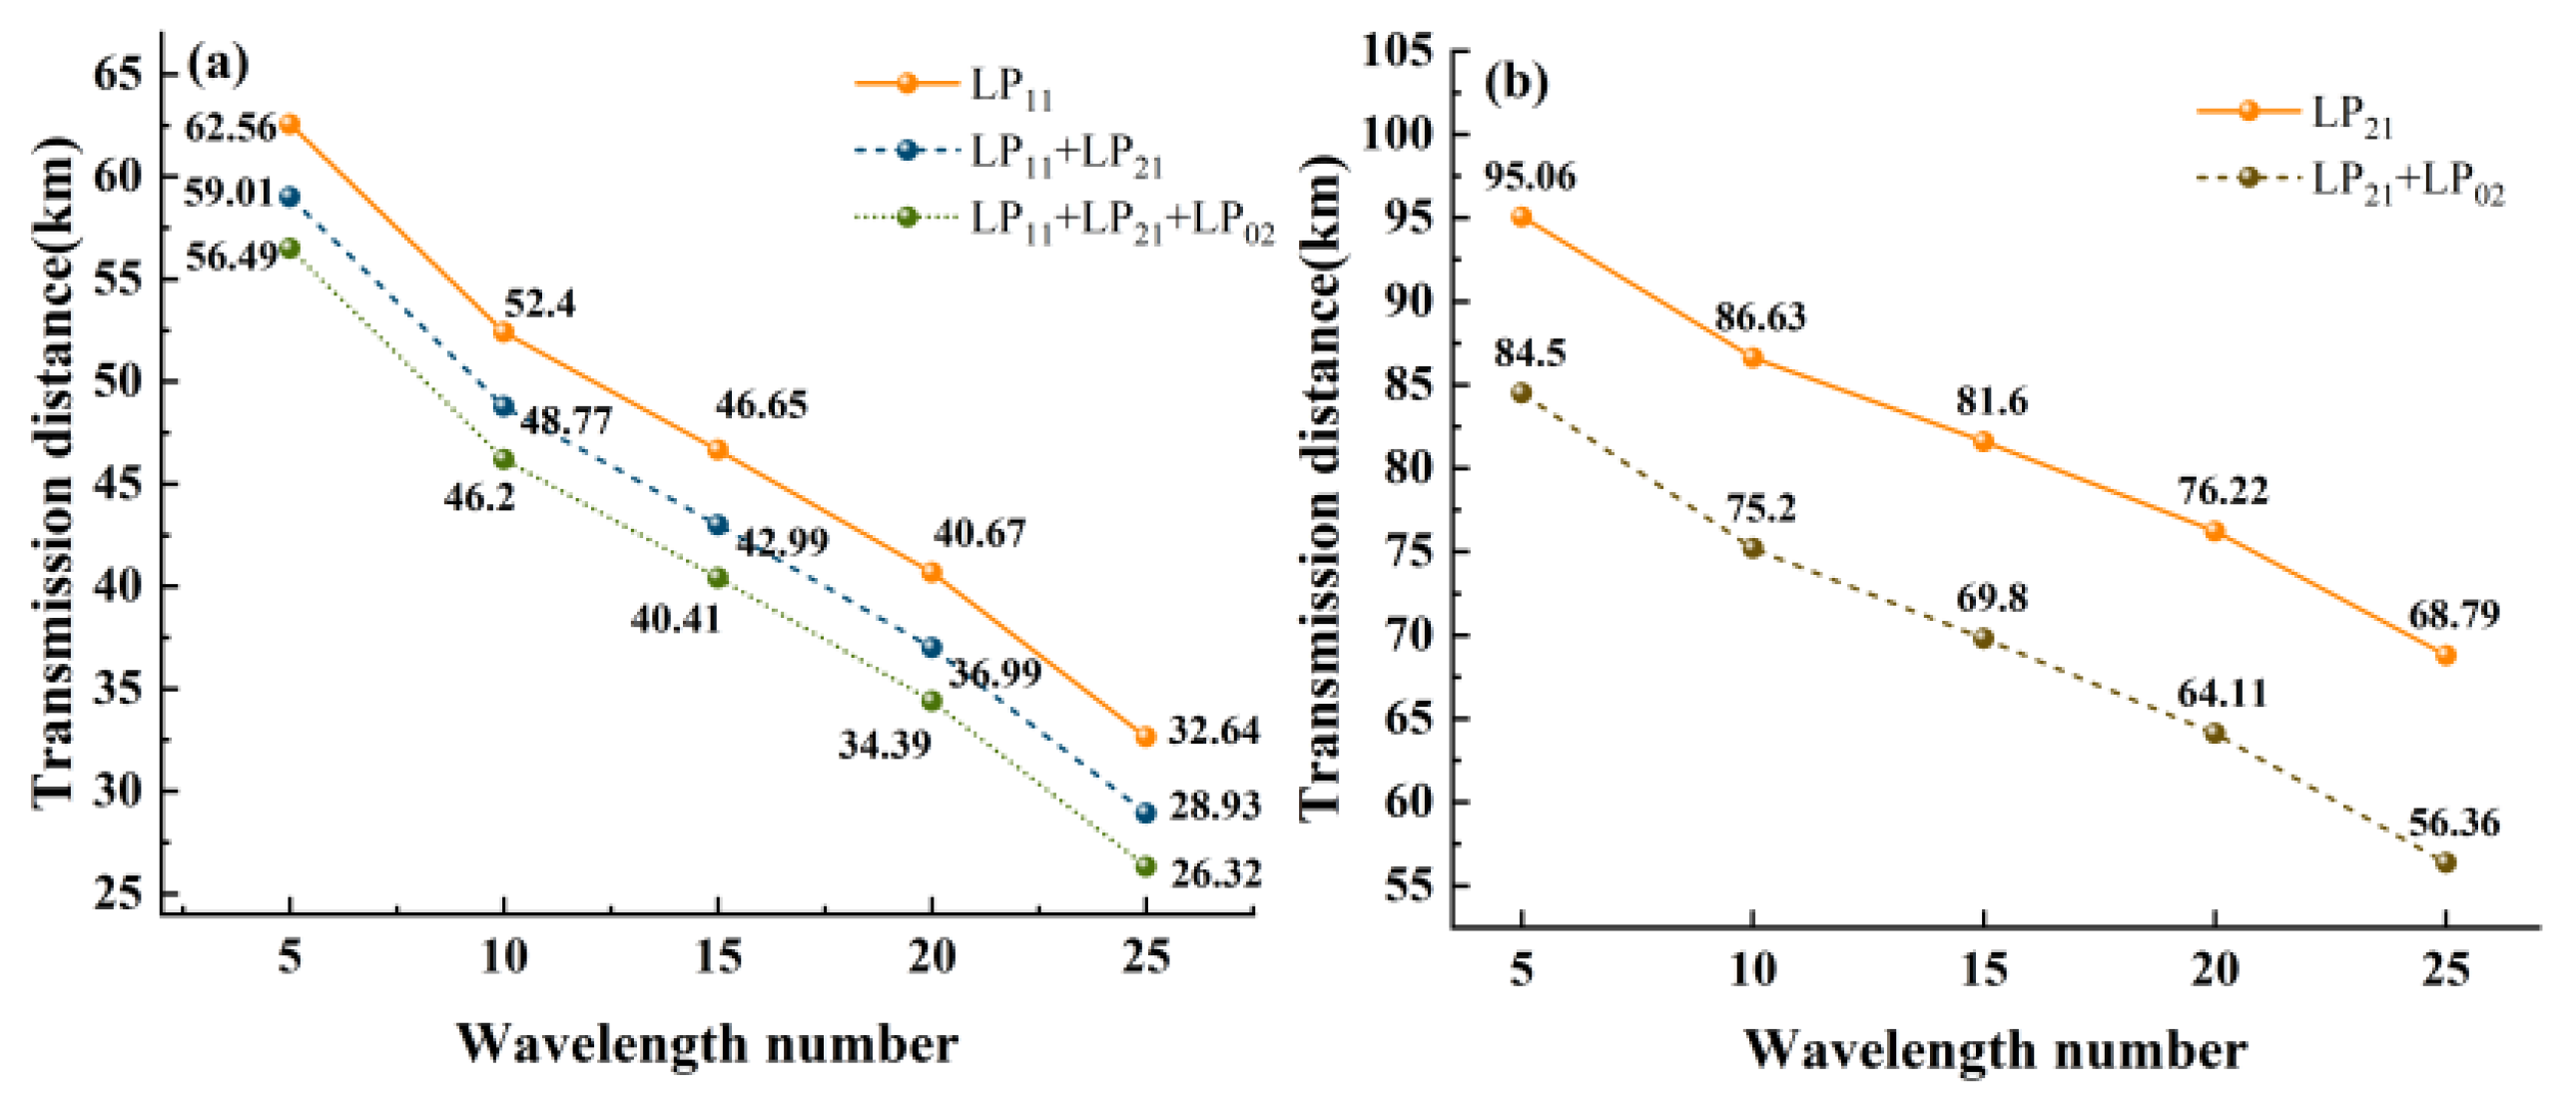
Figure 11 presents the calculated transmission distances of quantum signals under different mode configurations and wavelength numbers.
Figure 11(a) and (b) illustrate the transmission distances when utilizing 1~3 modes (including LP
11 mode) and 1~2 modes (excluding LP
11 mode), respectively. The results indicate that wavelength number exerts comparable or greater influence on transmission distance than mode number when employing LP
11 mode, whereas mode number dominates in systems without LP
11 mode. Moreover, the figures provide practical references for metropolitan area network applications by demonstrating the trade-off between transmission distance and channel capacity under different configurations. The number of wavelengths and modes can be selected according to the requirement.
Figure 1.
Power of SpRS versus hij (the green line), and the SKR versus hij (the orange dashed line).
Figure 1.
Power of SpRS versus hij (the green line), and the SKR versus hij (the orange dashed line).
Figure 2.
The radius and refractive index distribution of (a) step-index fiber and (b) The modes that can be supported in fibers.
Figure 2.
The radius and refractive index distribution of (a) step-index fiber and (b) The modes that can be supported in fibers.
Figure 3.
4-MF1: (a) Variation of SpRS power with the increasing number of wavelengths in the mode channel under single-mode classical signal; (b) Variation of SpRS power as the number of occupied modes by classical signals increases from 1 to 3 under a single-wavelength. 4-MF2: (c) Variation of SpRS power with the increasing number of wavelengths in the mode channel under single-mode classical signal; (d) Variation of SpRS power as the number of employed modes by classical signals increases from 1 to 3 under a single-wavelength.
Figure 4.
6-MF1: (a) Variation of SpRS power with the increasing number of wavelengths in the mode channel under single-mode classical signal (b) Variation of SpRS power as the number of occupied modes by classical signals increases from 1 to 3 under a single-wavelength; 6-MF2: (c) Variation of SpRS power with the increasing number of wavelengths in the mode channel under single-mode classical signal (d) Variation of SpRS power as the number of employed modes by classical signals increases from 1 to 3 under a single-wavelength.
Figure 5.
Under the condition of using 6-MF and excluding classical signal operating in the LP11, the growth trend of SpRS with the increase in the number of modes under the condition of a single-wavelength.
Figure 5.
Under the condition of using 6-MF and excluding classical signal operating in the LP11, the growth trend of SpRS with the increase in the number of modes under the condition of a single-wavelength.
Figure 6.
The radius and refractive index distribution of the ring-assisted FMF.
Figure 6.
The radius and refractive index distribution of the ring-assisted FMF.
Figure 7.
The variation of Δneff with aco1 and nco1.
Figure 7.
The variation of Δneff with aco1 and nco1.
Figure 8.
Theoretical verification: (a) Variation of SpRS power with the increasing number of wavelengths in the mode channel under single-mode classical signal; (b) Variation of SpRS power as the number of occupied modes by classical signals increases from 1 to 3 under a single-wavelength.
Figure 8.
Theoretical verification: (a) Variation of SpRS power with the increasing number of wavelengths in the mode channel under single-mode classical signal; (b) Variation of SpRS power as the number of occupied modes by classical signals increases from 1 to 3 under a single-wavelength.
Figure 9.
The relationship between SKR and transmission distance for classical signals in single mode. (a) LP11, (b) LP21 and (c) LP02.
Figure 9.
The relationship between SKR and transmission distance for classical signals in single mode. (a) LP11, (b) LP21 and (c) LP02.
Figure 10.
The relationship between SKR and transmission distance for classical signals under (a) three modes and (b) two modes.
Figure 10.
The relationship between SKR and transmission distance for classical signals under (a) three modes and (b) two modes.
Figure 11.
The variation of the transmission distance with the number of wavelengths of the ring-assisted FMF in different modes.
Figure 11.
The variation of the transmission distance with the number of wavelengths of the ring-assisted FMF in different modes.
Table 1.
The radius and refractive index of each fiber.
Table 1.
The radius and refractive index of each fiber.
| |
Nco |
ncl |
acl (μm) |
aco (μm) |
| 4-MF1
|
1.452 |
1.444 |
62.5 |
7 |
| 4-MF2
|
1.45 |
1.444 |
62.5 |
7.5 |
| 6-MF1
|
1.456 |
1.444 |
62.5 |
8 |
| 6-MF2
|
1.454 |
1.444 |
62.5 |
9 |
Table 2.
The hij of the FMF.
Table 2.
The hij of the FMF.
| |
LP01&LP11
|
LP01&LP21
|
LP01&LP02
|
LP01&LP31
|
LP01&LP12
|
| 4-MF1
|
3.72e-4 |
5.40e-5 |
3.55e-5 |
- |
- |
| 4-MF2
|
6.7691e-2 |
3.5761e-3 |
5.9524e-4 |
- |
- |
| 6-MF1
|
4.8449e-4 |
7.1666e-5 |
5.3517e-5 |
1.9382e-5 |
1.6384e-5 |
| 6-MF2
|
9.7320e-1 |
7.3291e-2 |
4.1994e-2 |
1.0743e-2 |
5.4185e-3 |
Table 3.
The Δneff of the FMF.
Table 3.
The Δneff of the FMF.
| |
LP01&LP11 |
LP11&LP21 |
LP21&LP02 |
LP02&LP31 |
LP31&LP12 |
| 4-MF1 |
2.4 |
2.9 |
0.6 |
- |
- |
| 4-MF2 |
1.9 |
2.4 |
0.3 |
- |
- |
| 6-MF1 |
2.1 |
2.8 |
0.9 |
2.4 |
1.6 |
| 6-MF2 |
1.7 |
2.2 |
0.7 |
1.9 |
1.2 |
Table 4.
The Δneff and hij of the ring-assisted FMF.
Table 4.
The Δneff and hij of the ring-assisted FMF.
| |
Δneff(*10-3) |
hij(km-1) |
| |
LP01&LP11 |
LP11&LP21 |
LP21&LP02 |
LP01&LP11 |
LP01&LP21 |
LP01&LP02 |
| ring-assisted FMF |
4.0 |
4.7 |
1.0 |
1.8551e-4 |
3.4145e-5 |
2.7724e-5 |