
Submitted:
04 July 2025
Posted:
08 July 2025
You are already at the latest version
Abstract
Multiband transmission is, nowadays, being implemented worldwide to increase the optical transport network capacity, mainly because it uses the already installed single mode fiber (SMF). The G.654E SMF, due to its attributes, e.g. low-loss, and large-effective area in comparison with the standard G.652 SMF, can also increase network capacity and can also be used for MB transmission. Nevertheless, in MB transmission power mode coupling arises when bands with wavelengths below the cut-off wavelength are used, inducing multipath interference (MPI). This work investigates the impact of the MPI, due mode coupling from G.654E SMF, in the transmission reach of a C+L+S band transmission system. Our results indicate that for the S-band scenario, the band below the wavelength cut-off, an approximately 25% reach decrease is observed when the MPI/span increases to -26 dB/span considering quadrature phase-shift keying (QPSK) signals with a 64 GBaud symbol rate. We also concluded that if the L-band were not above the wavelength cut-off it would be much more affected than the S-band, with an approximately 55% reach decrease due to MPI impact.
Keywords:
G.654E fiber
; multipath interference
; multiband transmission
; optical networks
; physical layer impairments
1. Introduction
The announced optical network capacity crunch due to the continuous demand for high bandwidth services, such as cloud computing, video streaming and 5G/6G services has ignited the research for solutions that can potentially bring more capacity to optical transport networks [1,2,3]. The two major promising solutions that are being studied for mitigating this problem are the exploitation of the spatial division multiplexing (SDM) technique in the optical domain and the utilization of the unused spectrum in single mode fibers (SMFs). The first solution consists in either installing additional SMFs creating a set of parallel fibers in each link or installing new fibers, like the multicore fibers or the multimode fibers [1,2]. In the second solution, called multiband (MB), the installation of new fibers is precluded and the unused spectrum available in SMFs working on the C-band, i.e., the O, E, S, L and U bands, is exploited [3]. Both solutions have pros and cons. For example, the SDM solution has a large capital expenditure associated, despite having the advantage of providing much more capacity than the MB solution, so it has been regarded by network operators and equipment vendors as a medium to long term solution. In contrast MB is seen as a near to midterm solution, since there is no need to install new fibers.
Several commercial systems are already using the C+L bands in SMFs, with an aggregate bandwidth of around 10 THz [4]. Further research with other bands, namely the exploitation of the C+L+S- bands scenario, which allows a capacity increase of more than 3 times in comparison with the common C-band scenario, is being analyzed [5]. Also, recently, an experimental work has used 37.6 THz of the SMF spectrum to transmit a record capacity of 402 Tbps over 50 km, occupying the O+E+S+C+L+U-bands, which confirms the desire to extend the life of already deployed optical fibers [6].
Nevertheless, the MB solution has several technical shortcomings, unlike those found in common C-band systems that have been addressed over the last few years [3]. For example, the optical amplified technologies for other bands, than the C and L bands, must be improved, such as the thulium doped fiber amplifier (TDFA) technology used in S-band that has a high noise factor and consumes much more power than the common erbium doped fiber amplifier (EDFA) [7]. Also, the MB optical node architecture is more complex and has a superior cost than common C-band nodes [8]. Lastly, several physical layer impairments (PLIs) are enhanced when other bands than the C-band are used for transmission, like the inter-channel stimulated Raman scattering (ISRS), a wideband phenomenon that is responsible for power transfer from high to low frequencies [5,9].
In 2016, the G.654E SMF was standardized by ITU-T G.654.E for terrestrial long-haul links [10]. The main attributes of this SMF are the low-loss, large-effective-area and shifted cable cut-off wavelength, in comparison with the standard G.652 SMF, which allows to reduce the effect of transmission non-linear effects, hence improving the transmission performance for high data rate and high spectral efficiency signals in C-band transmission scenarios, as it has been demonstrated over the last years in several field trials [11,12]. However, when the G.654E SMF is used in MB transmission systems power mode coupling arises when bands with wavelengths below the cut-off wavelength are used, which is the case of the S, E and O bands, inducing multipath interference (MPI) [13].
MPI is a PLI commonly encountered in optical communications systems operated in the C-band [14], that occurs when multiple replicas of the transmitted signal propagate over different optical paths. When the differential delay between the signal and its replicas is much smaller than the laser source coherence time it is called coherent MPI, otherwise it is called incoherent MPI [15]. There are several sources of coherent MPI in optical communications systems, such as the leakage signals in reconfigurable optical add-drop multiplexer (ROADM) nodes [16], and the mode coupling in either bend insensitive fibers (G.657) used in passive optical networks [17], quasi-single mode fibers [18] and G.654E fibers used for long-haul transmission. Coherent MPI modelling is a complex task, since the signal replicas are correlated and consequently the Gaussian statistics cannot be considered a rigorous tool, as shown in [19,20]. Nevertheless, most of the works in the literature that deal with the impact of coherent MPI in system Quality of Transmission (QoT) use the Gaussian statistics so that the simplistic signal-to-noise metric can be used, e.g., [13].
In [13] the signal-to-noise ratio penalty due to coherent MPI has been assessed for the MB transmission scenario using the G.654E SMF and considering several modulation formats. It has been concluded that to mitigate the MPI impact the transmission distance should be reduced, but this reduction was not quantified. Recently, in [21] we have computed the transmission distance reach in a C+L+S MB scenario considering the impact of MPI and concluded that for the S-band scenario an approximately 25% reach decrease is observed when the MPI per span increases to -26 dB/span for quadrature phase-shift keying (QPSK) signals.
In this paper, we will further develop the work in [21] by presenting and discussing with more detail the analytical formalism, based on the generalized signal-to-noise ratio (GSNR), used to assess the impact of the MPI on the transmission reach of C+L+S MB systems using the G.654E SMF. We study the maximum transmission reach as a function of the MPI for each one of the three bands, C, L and S, for a broader range of transmission scenarios than in [21], e.g., we consider two modulation formats—QPSK, and 16-quadrature amplitude modulation (QAM)—and three symbol rates—32, 64 and 128 GBaud –, thereby assessing the influence of the modulation format and symbol rate on the MPI impact.
This paper is organized as follows. In Section 2, we present the MPI characterization in G.654E SMF transmission. In Section 3 the QoT model is presented and discussed. In Section 4, we show and discuss the results of the MPI impact on the transmission reach of C+L+S MB systems for several transmission scenarios. Finally, in Section 5, some concluding remarks are drawn.
2. Characterization of Multipath Interference in G.654E SMF
In G.654E SMFs the coupling of optical power between the fundamental mode (LP01) and the high order mode (LP11) is originated in scattering events from fiber non-uniformities, from fiber microbending losses or from splices. A small fraction of the signal propagating in the LP01 mode is coupled into the LP11 mode and after travelling some distance is scattered back to the fundamental mode as indicated in Figure 1, [13]. Therefore, many replicas of the signal co-propagated with the signal itself appear in the fundamental mode.
As the refractive index is mode dependent, the transmission speed in the two modes is different, giving rise to a time delay between the signal and its replicas. These signal replicas are called forward scattered MPI and the time delay is described as [22],
with L being the fiber length, the speed of light in vacuum and the difference between the refractive index of the fundamental mode and the higher order mode. Note that the time delay, , between the signal and its replicas comes only from the refractive index difference in the two modes since the path signal length and the path of replicas is the same. This interference is classified as coherent since the time delay between the signal and its replicas is typically shorter than the laser source coherence time, i.e.,
where is the laser source linewidth. This condition is true for fibers with several hundred kilometers, e.g., considering a typical value for the refractive difference for the LP11 mode of [22], and , we can conclude that there is coherent interference for .
Due to the presence of multiple delayed replicas at the SMF output the MPI level can be defined as follows [19],
where is the ratio between the delayed replica power and the signal power, and the phase is a random variable given by for the case of forward scattered MPI from mode coupling [22]. This randomness comes from variations in the refractive index of the fundamental mode and higher modes. In this way the MPI, given in eq. (3), is a random variable whose statistic must be characterized. In the presence of correlation, due to coherence nature of the MPI, the i.i.d. assumption no longer holds and as a consequence the statistics of the MPI are difficult to predict and different from Gaussian statistics, as shown in [19], where it appears that they can be more rigorously described by fat-tailed statistics, like the extended skew-normal distribution [20], power-law and accumulative law distributions [23]. Nevertheless, in this work for the sake of simplicity, as was also done in several works in the literature, e.g., [13], we consider that the MPI is described by Gaussian statistics, so that the QoT can be computed in a straightforward way with the GSNR formulation presented in the next section.
3. Quality of Transmission Model
The QoT of an optical transmission system in a coherent dispersion uncompensated and amplified wavelength division multiplexed C+L+S MB system can be estimated through the GSNR [5].
Figure 2 depicts an optical transmission system with several identical spans, where each span is composed by a section of G.654E SMF with several splices and an optical amplifier stage composed by a band demultiplexer, an amplifier for each one of the bands—C, L and S—and a band multiplexer. This MB C+L+S transmission system has several optical channels characterized by its bandwidth and central wavelength, which can transport optical signals with a certain baud rate and modulation format. In such a scenario, the transmitted signal is impacted by the amplified spontaneous emission (ASE) noise originated from the optical amplifiers, by the non-linear interference (NLI) noise from the optical fiber transmission and by the MPI noise from the mode coupling in the G.654E SMF, so the GSNR of channel i after transmission along several identical spans can be given by [21],
where is the launch power in channel i, is the accumulated ASE noise power in channel i, is the NLI noise power in channel i that also includes the ISRS effect and is the MPI noise power in channel i.
The accumulated ASE noise power, , in channel i after several identical spans, , can be modelled as [24],
where h is the Planck’s constant, and are, respectively, the noise figure and amplifier gain (in linear units) for channel i, is the central frequency of channel i and is the channel’s bandwidth considered to be the same as the symbol rate. Note that the amplifier gain, , is set to perfectly compensate for the span loss experienced by channel i and also for the loss or gain due to the ISRS effect in each span and can be given by [9,24],
where
is the gain that compensates the span loss, with the span length in km and the attenuation coefficient in Np/km, and
is the gain or loss to compensate for the ISRS effect per span, with the optical power at the end of each span that can be given by eq. (8) of [24].
The NLI noise power, , in channel i after several identical spans, , is calculated using an analytical approximation of the generalized Gaussian noise (GGN) model proposed in [9], and known in the literature as the ISRS-GN model, that allows faster and still accurate GSNR estimations,
with the NLI coefficient, , given by,
where is the self-phase modulation (SPM) coefficient of channel i at frequency defined by eq. (10) of [9], and is the cross-phase modulation (XPM) coefficient of channel i at frequency defined by eq. (11) of [9]. For simplicity, we assume incoherent accumulation of the NLI noise power, e.g., [24,25].
Lastly, the MPI noise power, , in channel i originated in G.654E SMFs, where multiple replicas of the transmitted signal due to LP01-LP11 coupling appear, can be modelled with eq. (3), that defines the MPI level. It is assumed that the MPI noise power in channel i, , after several identical spans, , is just the sum of the MPI noise powers of every span along the lightpath, as in [13,22], and can be given by,
4. Transmission Reach Assessment
In this section we compute the transmission reach considering a C+L+S MB signal impaired by ASE noise, NLI and MPI, modelled as described in Section 3. In Section 4.1, we present the system parameters, while in Section 4.2 we present and validate our procedure to assess the transmission reach without the MPI impact. Next, in Section 4.3, we assess the impact of the MPI in the transmission reach for two modulation formats, QPSK and 16-QAM, and considering a 64 GBaud symbol rate. Finally, in Section 4.4 we assess the impact of the symbol rate on the transmission reach, by considering the 32 GBaud and the 128 GBaud scenarios.
4.1. System Parameters
We have considered, as our reference scenario, a C+L+S MB optical transmission system using a bandwidth of 15.3 THz, which can accommodate 192 channels (64 channels per band), each operating at 64 GBaud, with a channel spacing of 75 GHz and a 1 dBm channel launch power. Two other baud rate scenarios are also studied, the 32 and 128 GBaud. Furthermore, two different 500 GHz bandgaps are considered, the first one between the L- and C-bands, and the second one between the C- and S-bands, as in [5]. The optical transmission system considered is composed of a transmitter and a receiver connected by several spans of equal length (i.e., ) as indicated in Figure 2. Different amplifier noise figures are considered for each band as in [5]. These parameters are summarized in Table 1.
The optical G.654E SMF considered is characterized by a dispersion parameter of 21 ps/nm/km, a loss coefficient of 0.17 dB/km [13], and a Raman gain profile with [26], as presented in Table 2. We additionally consider splice losses varying from 0.0043 to 0.068 dB every 4.2 km, which results in a MPI level, per span, variation from -46 dB/span to -28 dB/span [13].
4.2. Transmission Reach Assessement Without MPI
In this section we present and validate our procedure to assess the transmission reach in a C+L+S MB scenario without the MPI impact for the 64 GBaud scenario. To estimate the maximum reach for each transmission band—C, L and S-band—without MPI we use the following four step procedure:
i) In the first step, and assuming a single span, we assess the channel frequency for each band, considering a range of power channels values between -15 and 5 dBm, that minimizes the GSNR, given by eq. (4). The channel with the lowest GSNR is selected to represent each band, so that every channel within the band can, at least, propagate the estimated distance.
ii) In the second step, with the channel frequency assessed in step 1, we compute the GSNR as a function of the channel power, so that the power that maximizes the GSNR for each one of the bands can be found, which is called the optimum channel power. At the end of this step, we will show that the optimum channel power is 1 dBm.
iii) In the third step, using the channel frequency found in step 1 and the optimum channel power found in step 2 we can compute the GSNR as a function of the number of spans.
iv) Finally, in step four, we compare the required signal-to-noise ratio (RSNR) for a particular modulation format and bit error rate (BER) with the GSNR computed in step 3 and estimate the maximum reach for each transmission band and modulation format. A fixed 2 dB system margin is assumed to account for performance degrading effects [5].
Next, we present some results for a C+L+S MB scenario. In Figure 3 we represent the GSNR as a function of the channel launch power, referred in the second step described above, for the three bands studied without the MPI impact. The green line represents the L-band, the red line the C-band and the blue line the S-band. As we can observe in Figure 3 there is an optimal power that maximizes the GSNR, which is approximately 1 dBm for each one of the three bands. The channel power choice is an important parameter in the GSNR computation since it influences the amplifier gain and consequently the ASE noise power. Also, from Figure 3 the GSNR for the L-band is 1.5 dB better than the C-band GSNR and 6.8 dB better than the S-band, for the 1 dBm channel power scenario. These differences are mainly explained by the higher amplifier noise factor in the S-band and C-band when compared to the L-band [5], as well as the ISRS effect that is responsible for power transfer between the higher to lower frequencies. Similar results are reported in [27].
Figure 4 represents the NLI noise power as a function of the channel frequency considering a 1 dBm channel power. It can be observed that the L-band is more affected by the NLI noise power in comparison with the C and S bands, which is justified once again by the influence of the ISRS [5]. However, regarding the influence of ASE noise power it can be shown that the L band is the least affected band, and the most affected is the S-band due to higher amplifier noise factors and due to using channels with higher frequencies [5].
Figure 5 shows the GSNR as a function of the channel frequency, for a 1 dBm channel power. It can be observed that the L-band presents the best GSNR, while the S-band gives the worst GSNR. Similar results are reported in [5,27].
In Figure 6 the GSNR is represented as a function of the number of spans for the three studied bands. It can be observed that, as expected, the GSNR for all the three bands decreases with the number of spans, which is in accordance with the behavior found in [28]. Also, the L-band has a superior GSNR in comparison with the C and S-bands, mainly due to the ISRS power transfer [5]. The C and the S-band has a GSNR with, respectively, less than 1dB and 5.5 dB in comparison with the L-band GSNR. In [5] similar results are obtained for a single span.
Considering QPSK and 16-QAM signals and that the practical required optical signal-to-noise ratio (ROSNR)for these two modulation formats is given in Table 3, for a BER equal to [29], the maximum transmission reach can be assessed as described in the fourth step of our procedure. As observed in Table 3 there is a 7.1 dB difference between the ROSNR in the reference bandwidth and the RSNR in the signal bandwidth, that comes from . Note that in our computations the GSNR in eq. (4) is computed in the signal bandwidth. The maximum transmission reach for QPSK signals is, respectively, 45, 36 and 12 spans, for the L, C and S bands. Likewise, for 16-QAM signals the maximum transmission reach is, respectively, 7, 5, and 2 spans for the L, C and S bands. The C-band maximum reaches are in line with the literature results, e.g., [30].
4.3. Transmission Reach Assessment with MPI
In this section we present some results regarding the MPI impact on C+L+S MB transmission scenario considering QPSK and 16-QAM signals with a 64 GBaud symbol rate. As in G.654E SMFs the S band signals are below the wavelength cut-off, the coherent MPI impact, due to mode coupling, only affect transmitting signals in this band [13]. Signals from the L and C bands are not affected by this phenomenon as their wavelength is above the cut-off wavelength [13]. Nevertheless, for comparison purposes we consider the expected MPI impact on the L and C bands, as if their wavelengths were not above the cut-off wavelength.
Figure 7 represents the GSNR for the three studied bands as a function of the number of spans for three MPI scenarios—no MPI, -34 dB/span and -28 dB/span, for a typical splice loss of, respectively, 0.034 dB and 0.068 dB [13]. A 1 dBm optical launch power was used so that the GSNR is maximized as shown in the previous sub-section. As can be seen in Figure 7, without MPI, the L-band has a greater reach than the C and S bands, as already pointed out, whereas when the MPI is considered, this trend continues. It can also be observed that the transmission reach in the S-band decreases when MPI is considered. For a 2000 km link (20 spans) the S-band suffers a 0.3 dB GSNR penalty for a -34dB/span MPI, and for a more restrictive MPI per span, e.g., -28 dB/span, a 1 dB penalty is achieved. If the L-band suffered from the MPI impact a larger GSNR penalty would be obtained, respectively, 1 dB and 2.7 dB for -34 dB/span and -28 dB/span, as observed in Figure 7.
Figure 8 represents the number of spans as a function of the MPI/span for the three bands considering two modulation formats, QPSK and 16-QAM. These two signal formats are considered feasible if the estimated GSNR is higher than the RSNR given in Table 3 (a fixed 2 dB system margin is considered). From Figure 8 it can be observed that the impact of the MPI for the S-band scenario is mild compared with the hypothetical impact in the L-band scenario. For the hypothetical impact in the L-band scenario an approximately 55% reach decrease is estimated when the MPI/span increases to -26 dB/span for QPSK signals, whereas for 16-QAM signals an approximately 75% decrease is observed. The S-band scenario is less impacted by the MPI due to the reduction of signal power induced by the ISRS effect in this band—an approximately 25% reach decrease is observed for QPSK signals.
4.4. Impact of The Symbol Rate on the Transmission Reach
In this section the maximum transmission reach in a C+L+S MB system impacted by MPI is assessed for three symbol rates—32, 64 and 128 GBaud. In Table 1 the channel bandwidth, the number of channels per band and the total number of channels used for the three symbol rates are presented.
The procedure to assess the transmission reach presented in Section 4.2 is followed for the 32 and 128 GBaud scenarios and it can be concluded that the optimum channel power, the one that maximizes the GSNR, is, respectively, -2 dBm and 4 dBm for the 32 and 128 GBaud symbol rates, as indicated in Table 1.
The number of spans as a function of the MPI/span for the three symbol rates was computed, assuming the same ROSNRs used in the previous sub-section. It can be concluded that the symbol rate does not affect the transmission reach as a function of the MPI/span for the S-band. Only, for QPSK signals with 32 GBaud, in the hypothetical L-band scenario, a slightly greater transmission distance can be achieved when the MPI/span is smaller than -34 dB/span in comparison with the 128 GBaud scenario, as can be observed in Table 4. It is also observed that the symbol rate does not affect the transmission reach as a function of the MPI/span for 16-QAM signals.
5. Conclusions
In this work we have assessed the impact of the coherent MPI, due mode coupling in G.654E SMFs, in the transmission reach of a C+L+S MB scenario. The applied analytical formulation, based on the GSNR, considers, besides the coherent MPI, the NLI noise and the ASE noise accumulated along several spans. Several transmission scenarios with two modulation formats—QPSK and 16-QAM—and three symbol rate values—32, 64 and 128 GBaud—were tested and discussed.
As in G.654E SMFs the S band is below the wavelength cut-off, the coherent MPI impact, due to mode coupling, only affect transmitting signals in this band. We concluded that in the S-band scenario the transmission reach decreases almost 300 km, which corresponds to an approximately 25% reach decrease when the MPI/span increases to -26 dB/span, considering QPSK signals with a 64 GBaud symbol rate. If L and C band signals were not above the wavelength cut-off the L-band scenario would be more affected by MPI than the C or S-band scenarios—an approximately 55% reach decrease would be observed for this band. The S-band would be the least impacted band by the MPI due to the reduction of signal power induced by the ISRS effect in this band. We have also concluded that the symbol rate almost does not influence the impact of the MPI on the transmission reach in a C+L+S MB scenario.
Author Contributions
Conceptualization, L. Cancela and J. Pires; methodology, L. Cancela; software, L. Cancela; validation, L. Cancela; formal analysis, L. Cancela; investigation, L. Cancela and J. Pires; resources, L. Cancela; data curation, L. Cancela; writing—original draft preparation, L. Cancela; writing—review and editing, L. Cancela and J. Pires; visualization, L. Cancela; supervision, L. Cancela and J. Pires; project administration, L. Cancela and J. Pires. All authors have read and agreed to the published version of the manuscript.
Funding
This research received no external funding.
Data Availability Statement
Data is contained within the article or supplementary material.
Acknowledgments
This work was supported under the project of Instituto de Telecomunicações UIDB/50008/2020.
Conflicts of Interest
The authors declare no conflicts of interest.
References
- Winzer, P.; Neilson, D. From scaling disparities to integrated parallelism: a decathlon for a decade. J. Lightwave Technol. 2017, 35, 1099–1115. [Google Scholar] [CrossRef]
- Klaus, W.; Winzer, P.; Nakajima, K. The role of parallelism in the evolution of optical fiber communication systems. Proceedings of the IEEE 2022, 110, 1619–1654. [Google Scholar] [CrossRef]
- Deng, N.; Zong, L.; Jiang, H.; Duan, Y.; Zhang, K. Challenges and enabling technologies for multi-band WDM optical networks. J. Lightwave Technol. 2022, 40, 3385–3394. [Google Scholar] [CrossRef]
- Cantono, M.; Schmogrow, R.; Newland, M.; Vusirikala, V.; Hofmeister, T. Opportunities and challenges of C+L transmission systems. J. Lightwave Technol. 2020, 38, 1050–1060. [Google Scholar] [CrossRef]
- Souza, A.; Costa, N.; Pedro, J.; Pires, J. Comparison of fast quality of transmission estimation methods for C+L+S optical systems. J. Opt. Commun. Netw. 2023, 15, F1–F12. [Google Scholar] [CrossRef]
- Puttnam, B.; et al. 402 Tb/s GMI data-rate OESCLU-band transmission. Proceedings of Optical Fiber Communications Conference and Exhibition (OFC), USA, 2024. paper Th4A.3. [Google Scholar]
- Radovic, M.; Sgambelluri, A.; Cugini, F.; Sambo, N. Power-aware high-capacity elastic optical networks. J. Opt. Commun. Netw. 2024, 16, B16–B25. [Google Scholar] [CrossRef]
- Ramos, J.Ó; Cancela, L.; Rebola, J. Impact of the reconfigurable optical add-drop multiplexer architecture on the design of multi-band C+ L+ S optical networks. Optical Fiber Technology Journal 2024, 85. [Google Scholar] [CrossRef]
- Semrau, D.; Killey, R.; Bayvel, P. A closed-form approximation of the Gaussian noise model in the presence of inter-channel stimulated Raman scattering. J. Lightwave Technol. 2019, 37, 1924–1936. [Google Scholar] [CrossRef]
- Yamamoto, Y. Practical Aspects of G.654.E Fibers for Terrestrial Long-Haul Transmission. Proceedings of Optical Fiber Communications Conference and Exhibition (OFC), USA, 2019. paper Tu3J.1. [Google Scholar]
- Zhang, C.; Zhang, A.; Fan, Z.; Lv, K.; Feng, L.; Liu, Y. 400 Gb/s DWDM Field Trial over a Record Distance of 3820 km G.654.E Fiber Link with 107 GBaud Transceivers and C-band EDFAs. Proceedings of Asia Communications and Photonics Conference/ International Photonics and Optoelectronics Meetings (ACP/POEM), 2023. [Google Scholar] [CrossRef]
- Yamamoto, Y.; Hirano, M. Ultra-low loss ITU-T 654.E Fiber ’PureAdvance’ for terrestrial optical transmission systems. Sumitomo Electric Technical Review 2023, 96, 35–39. [Google Scholar]
- Zhang, C.; et al. Optical layer impairments and their mitigation in C+L+S+E+O multi-band optical networks with G.652 and loss-minimized G.654 fibers. J. Lightwave Technol. 2022, 40, 3415–3424. [Google Scholar] [CrossRef]
- Ramachandran, S.; Nicholson, J.; Ghalmi, S.; Yan, M. Measurement of multipath interference in the coherent crosstalk regime. IEEE Photon. Technol. Lett. 2003, 15, 1171–1173. [Google Scholar] [CrossRef]
- Arie, A.; Tur, M.; Goldstein, E. Probability-density function of noise at the output of a two-beam interferometer. J. Opt. Soc. Am. A 1991, 8, 1936–1942. [Google Scholar] [CrossRef]
- Yu, C.; Wang, W.; Brorson, S. System degradation due to multipath coherent crosstalk in WDM network nodes. J. Lightwave Technol. 1998, 16, 1380–1386. [Google Scholar] [CrossRef]
- Travagnin, M. BER penalty induced by coherent MPI noise in FTTH optical links. J. Lightwave Technol. 2013, 31, 3021–3031. [Google Scholar] [CrossRef]
- Downie, J.; et al. Quasi-Single-Mode Fiber transmission for optical communications. J. Sel. Top. Quantum Electron. 2017, 23, 31–42. [Google Scholar] [CrossRef]
- Mlejnek, M.; Roudas, I.; Downie, J.; Kaliteevskiy, N.; Koreshkov, K. Coupled-mode theory of multipath interference in quasi-single mode fibers. IEEE Photonics Journal 2015, 7, 1–16. [Google Scholar] [CrossRef]
- Cancela, L.; Pires, J. Applying the skew-normal distribution to model coherent MPI and to evaluate its impact on PAM signals. Optical Fiber Technology Journal 2020, 56. [Google Scholar] [CrossRef]
- Cancela, L.; Pires, J. MPI Impact in C+L+S Multiband Transmission Reach. Proceedings of Advanced Photonic Congress, Québec, Canada, 2024. paper NeTu2C.4. [Google Scholar]
- Zheng, W.; Sardesai, H.; Taylor, M.; Craig, D.; Fowlkes, J.; Simpson, J. Measurement and system impact of multipath interference from dispersion compensating fiber modules. IEEE Transactions on Instrumentation and Measurement 2004, 53, 15–23. [Google Scholar] [CrossRef]
- Clauset, A.; Shalizi, C.; Newman, M. Power-law distributions in empirical data. Society for Industrial and Applied Mathematics (SIAM) Review 2009, 51, 661–703. [Google Scholar] [CrossRef]
- Semrau, D.; Killey, R.; Bayvel, P. Achievable rate degradation of ultra-wideband coherent fiber communication systems due to stimulated Raman scattering. Optics Express 2017, 25, 13024–13034. [Google Scholar] [CrossRef]
- Mehrabi, M.; Beyranvand, H.; Emadi, M. Multi-band elastic optical networks: Inter-channel stimulated Raman scattering-aware routing, modulation level and spectrum assignment. J. Lightwave Technol. 2021, 39, 3360–3370. [Google Scholar] [CrossRef]
- Yamamoto, Y.; Hasegawa, T.; Osada, N. Low loss optical fibers for terrestrial long-haul networks, PureAdvance. Sumitomo Electric Technical Review 2021, 93, 19–24. [Google Scholar]
- Souza, A.; Correia, B.; Costa, N.; Pedro, J.; Pires, J. Accurate and scalable quality of transmission estimation for wideband optical systems. Proceedings of IEEE 26th International workshop on Computer Aided Modeling and Design of Communications Links and Networks (CAMAD); 2021. [Google Scholar] [CrossRef]
- Paz, E.; Saavedra, G. Maximum transmission reach for optical signals in elastic optical networks employing band division multiplexing. 2021, arXiv:2011.03671. [Google Scholar] [CrossRef]
- OpenZR+ MSA Specification, version 3.0. Available online: https://openzrplus.org/wp-content/uploads/2024/04/openzrplus_rev3p0_final2.pdf (accessed on 17 June 2025).
- Zami, T.; Lavigne, B.; Bertolini, M. How 64 GBaud optical carriers maximize the capacity in core elastic WDM networks with fewer transponders per Gb/s. J. Opt. Commun. Netw. 2019, 11, A20–A32. [Google Scholar]
Figure 1.
Mode coupling scheme along G.654E SMF.
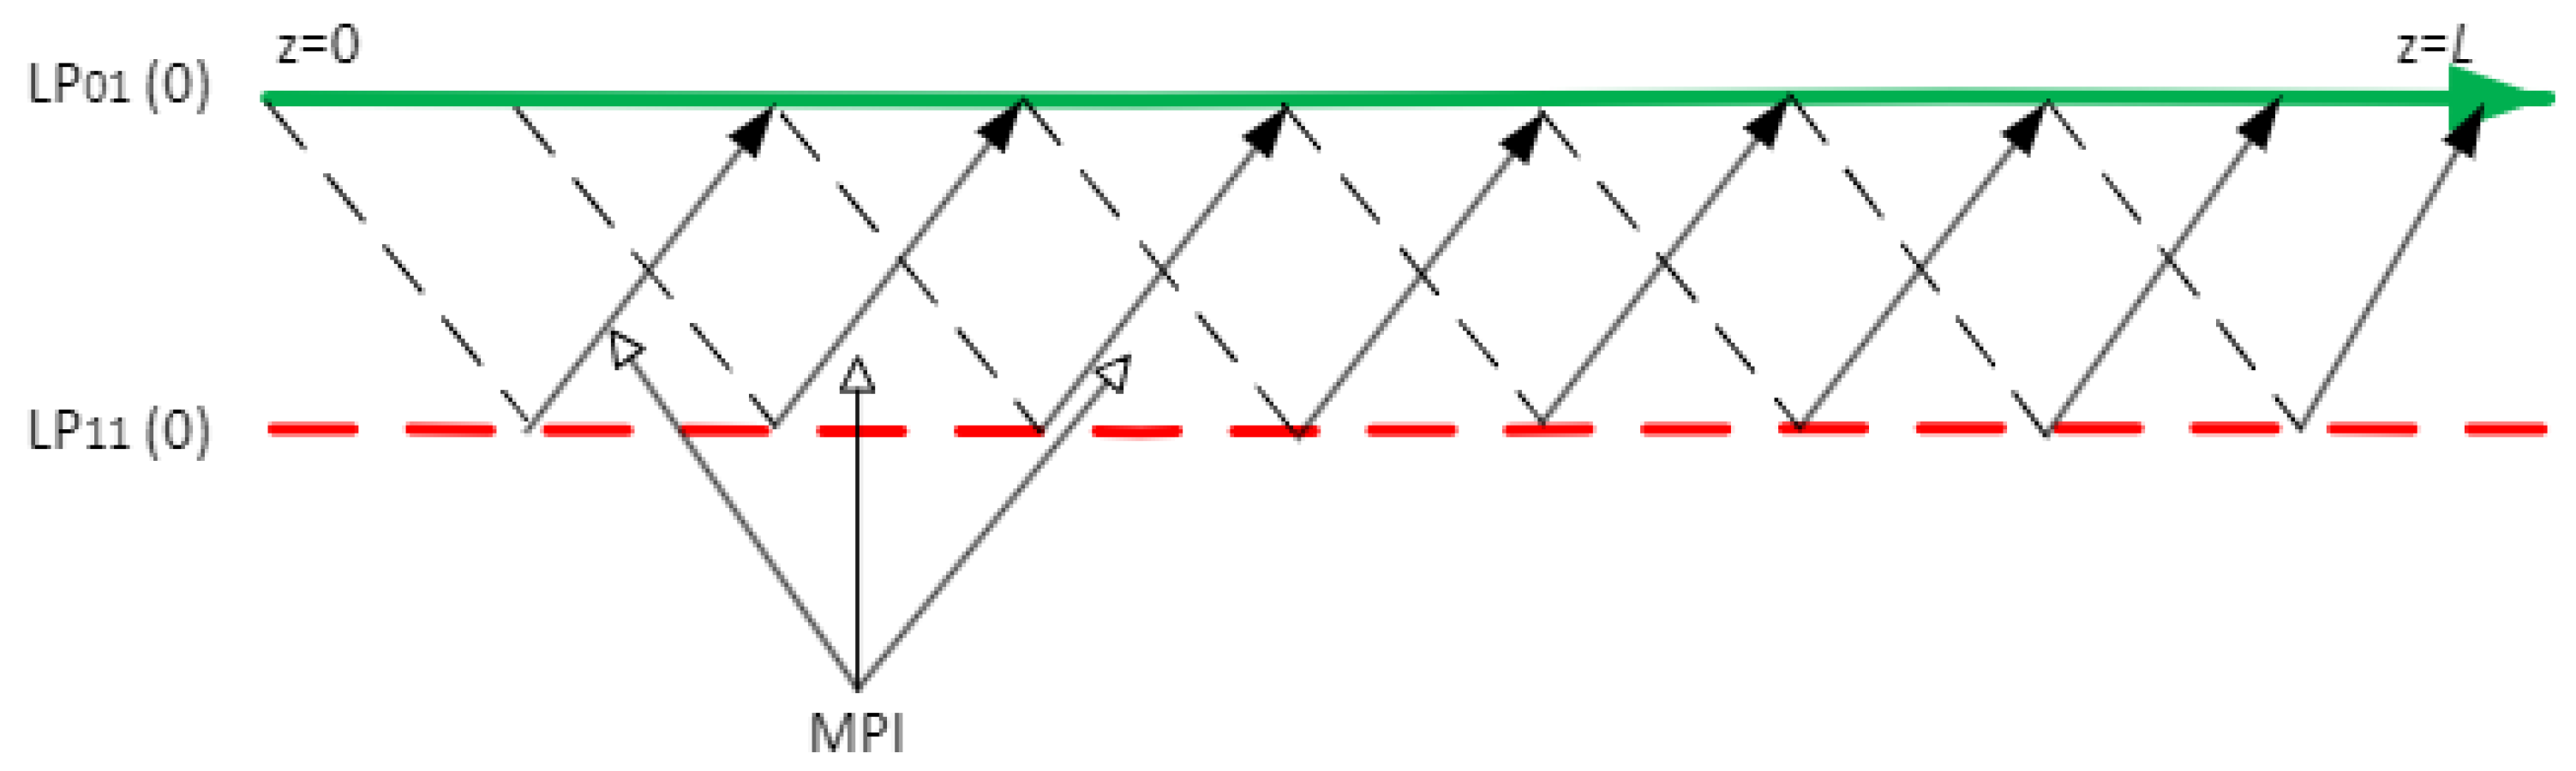
Figure 2.
Optical transmission system composed of a transmitter and a receiver connected by several spans for evaluating the QoT in a C+L+S MB system.
Figure 2.
Optical transmission system composed of a transmitter and a receiver connected by several spans for evaluating the QoT in a C+L+S MB system.
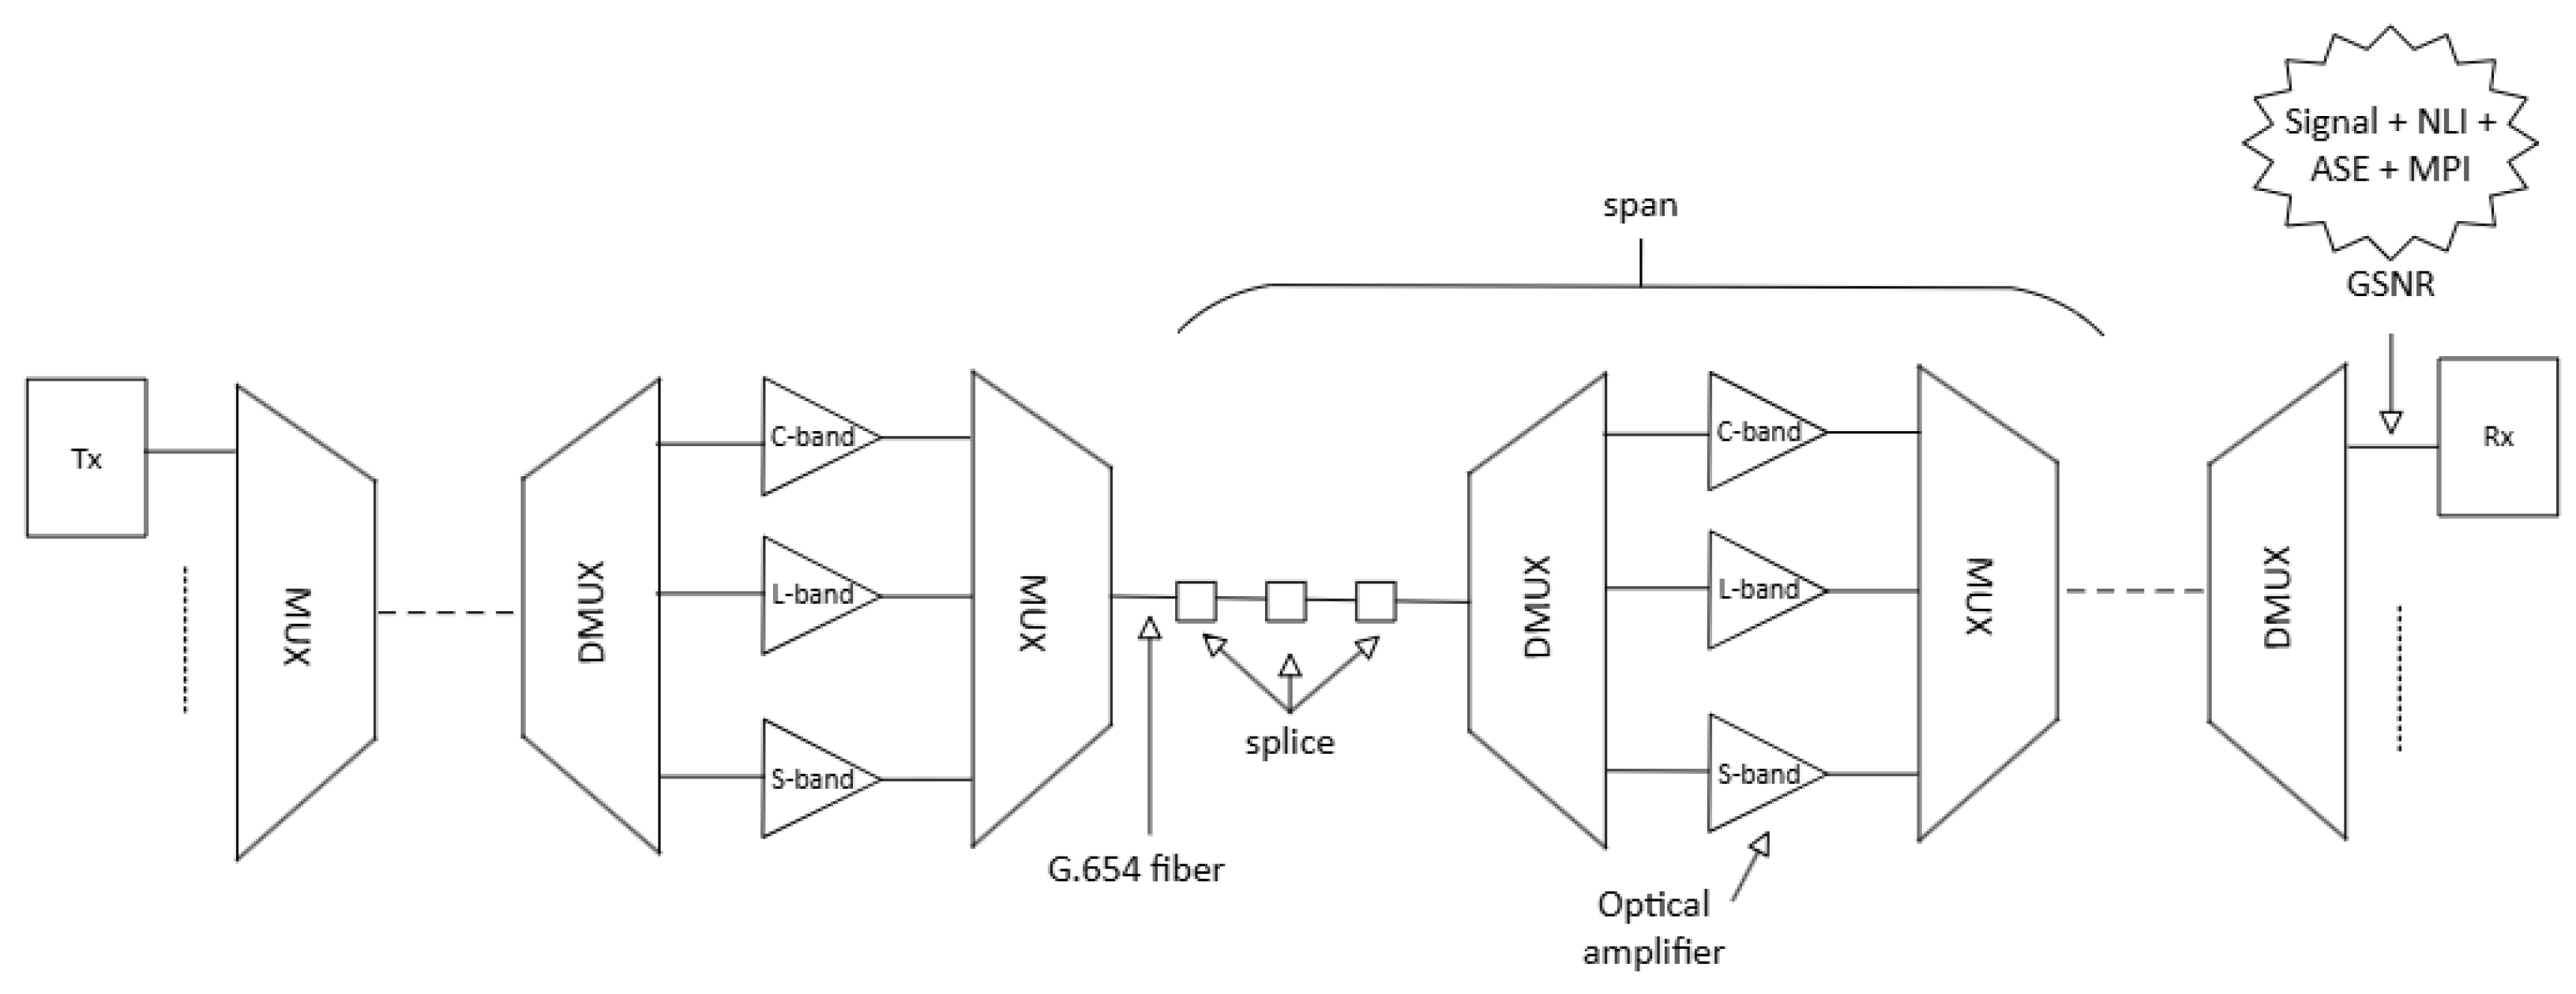
Figure 3.
GSNR per band as a function of the optical channel power.
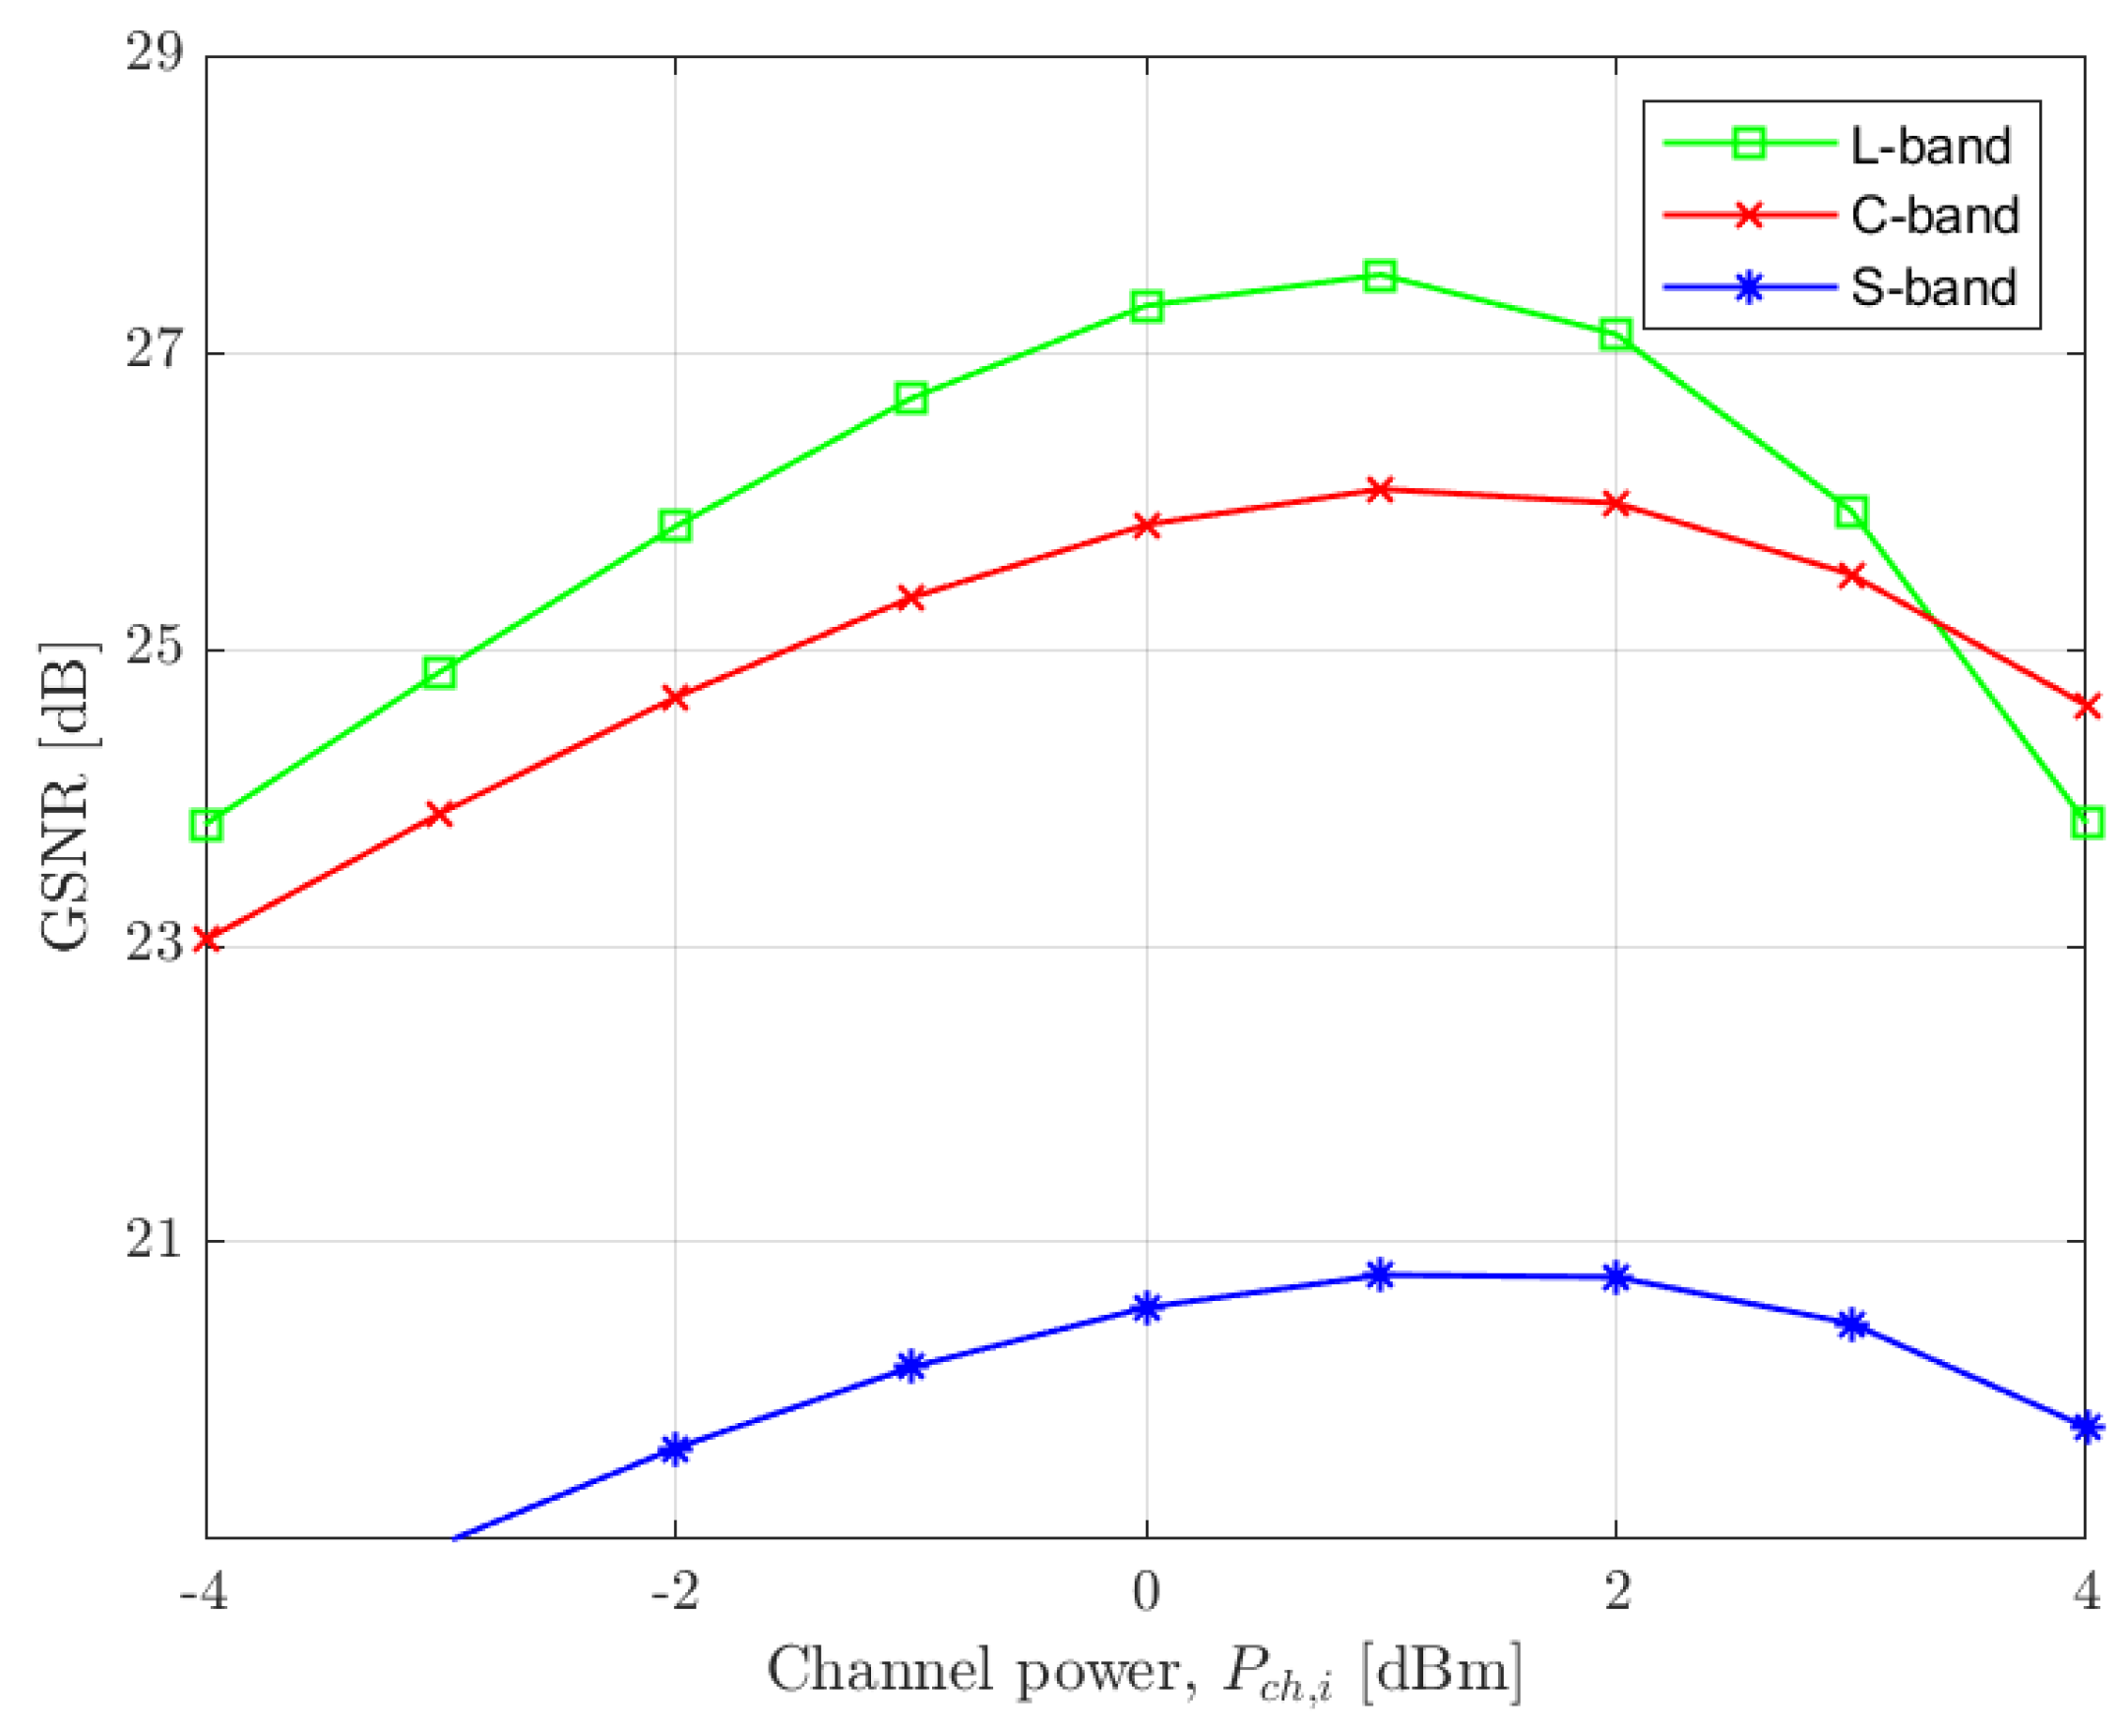
Figure 4.
NLI noise power as a function of the channel frequency.
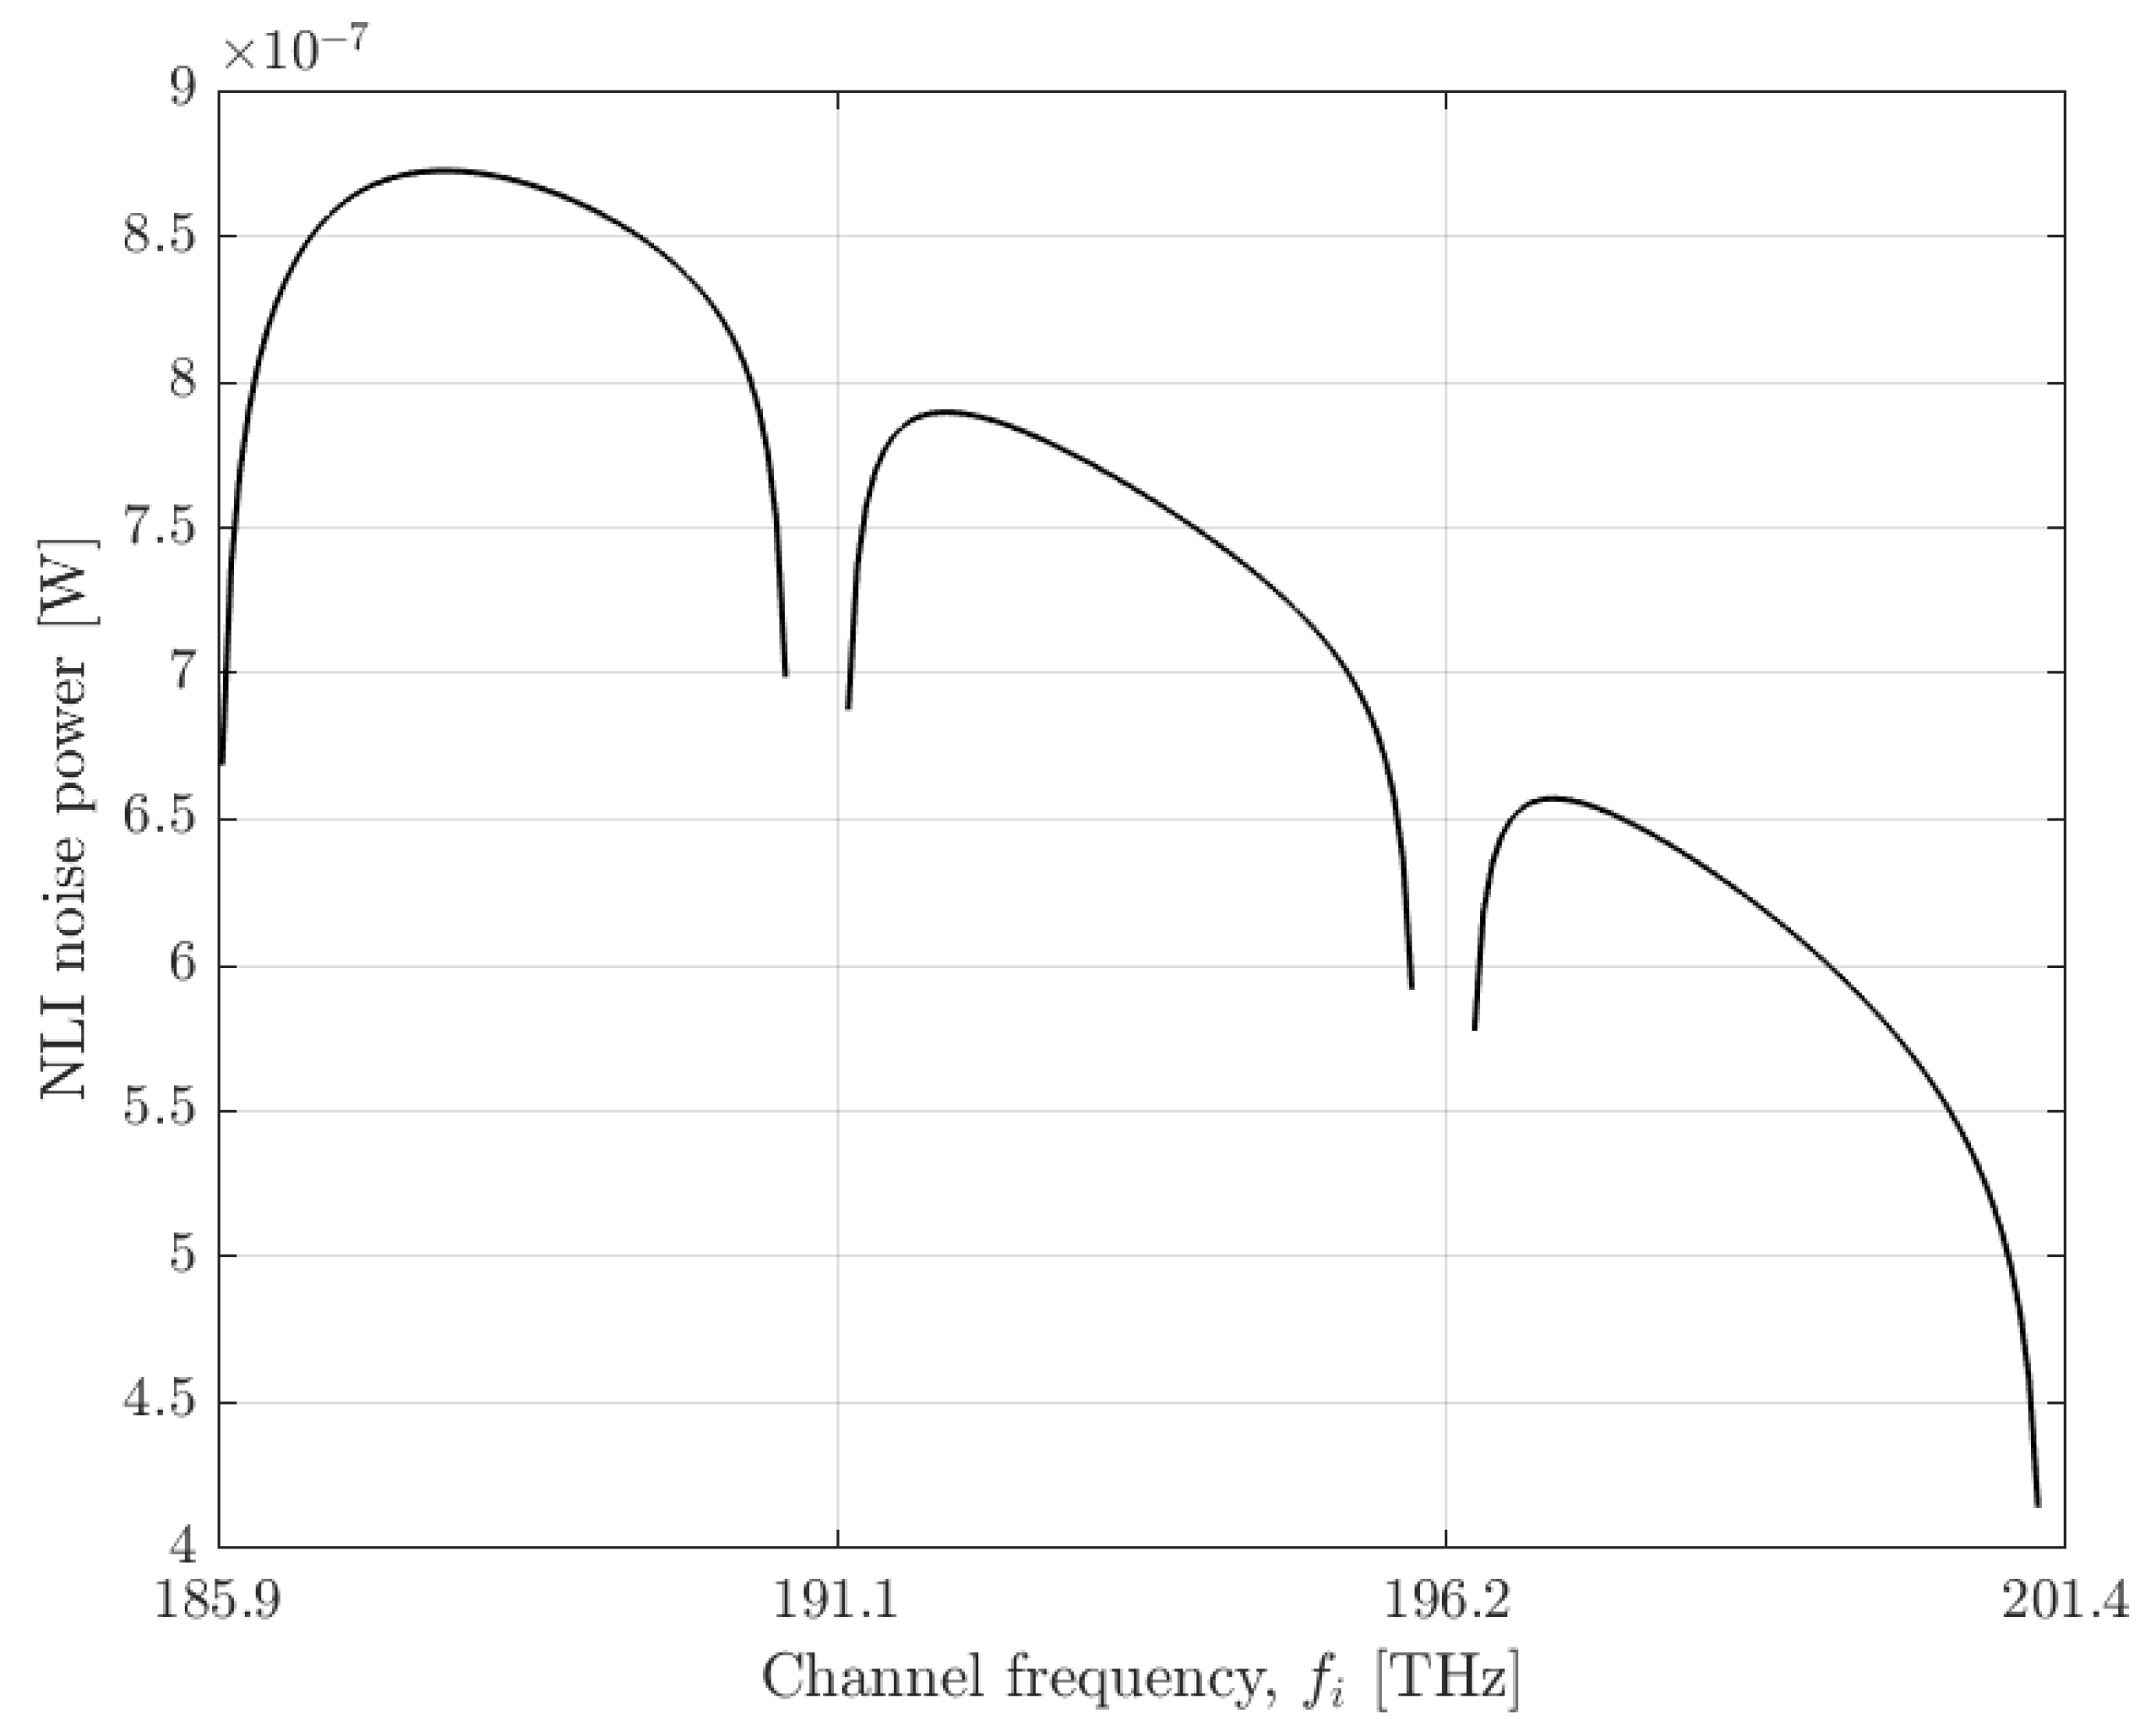
Figure 5.
GSNR as a function of the channel frequency.
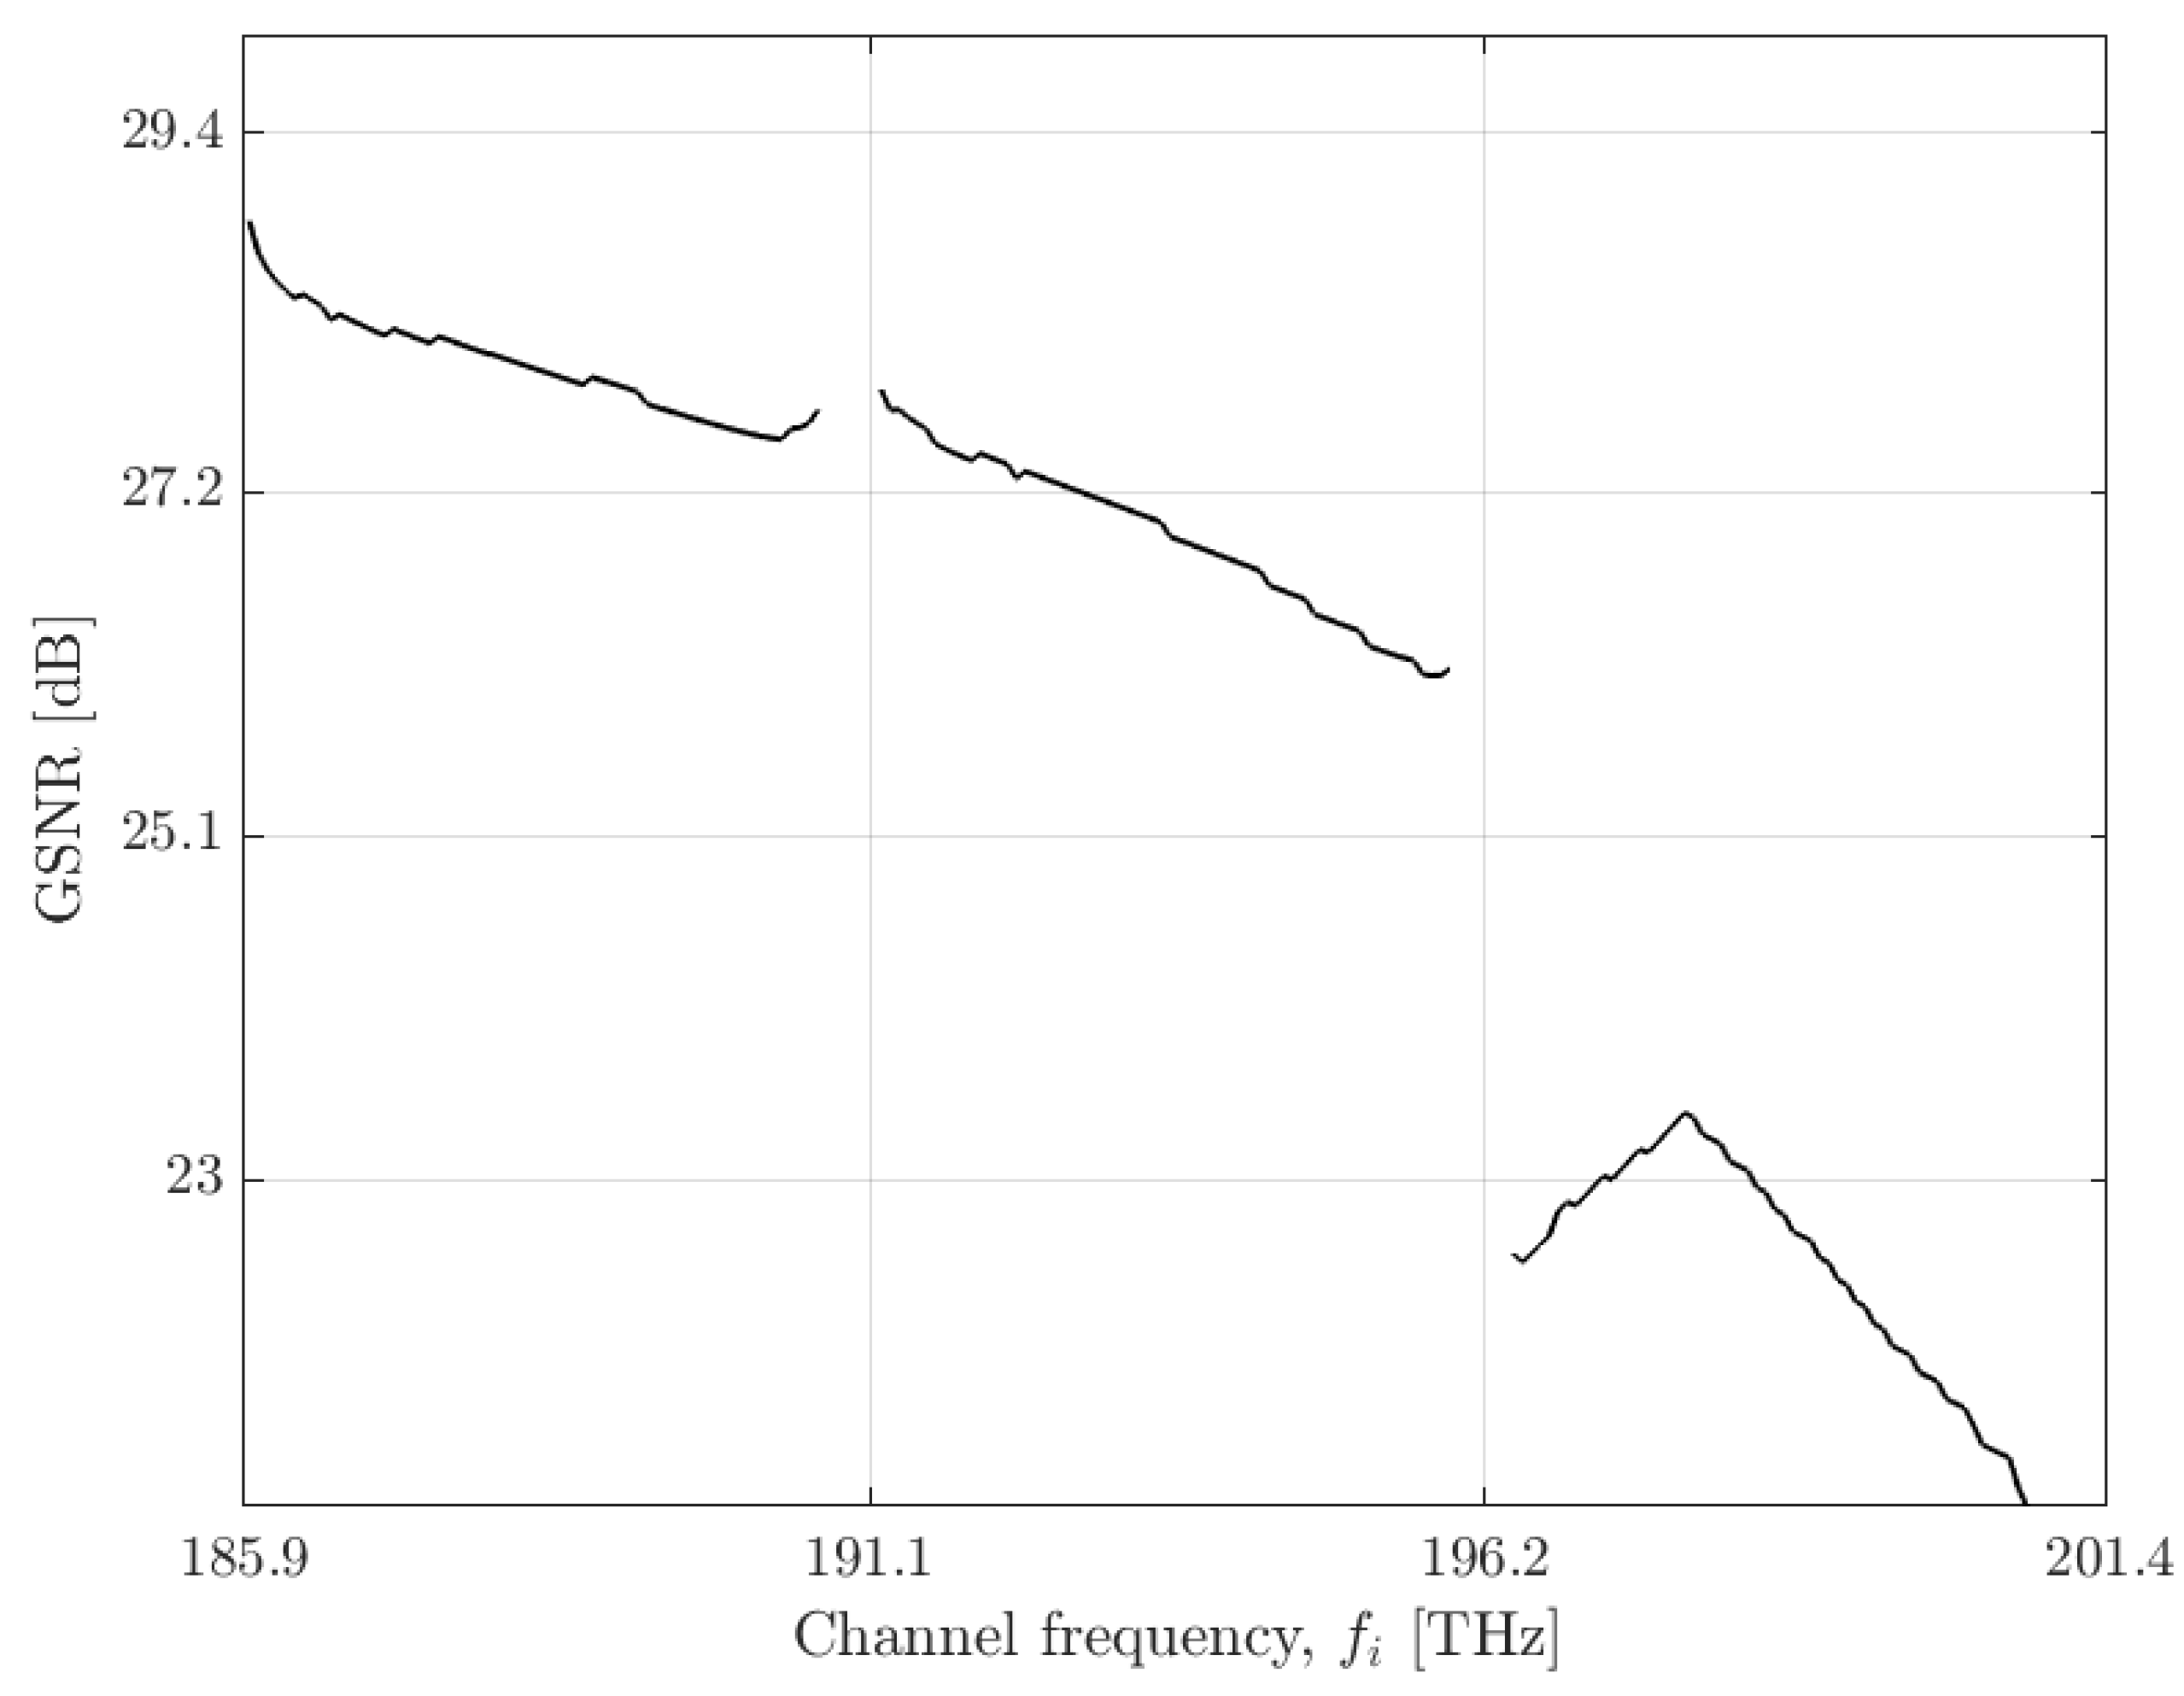
Figure 6.
GSNR per band as a function of the number of spans.
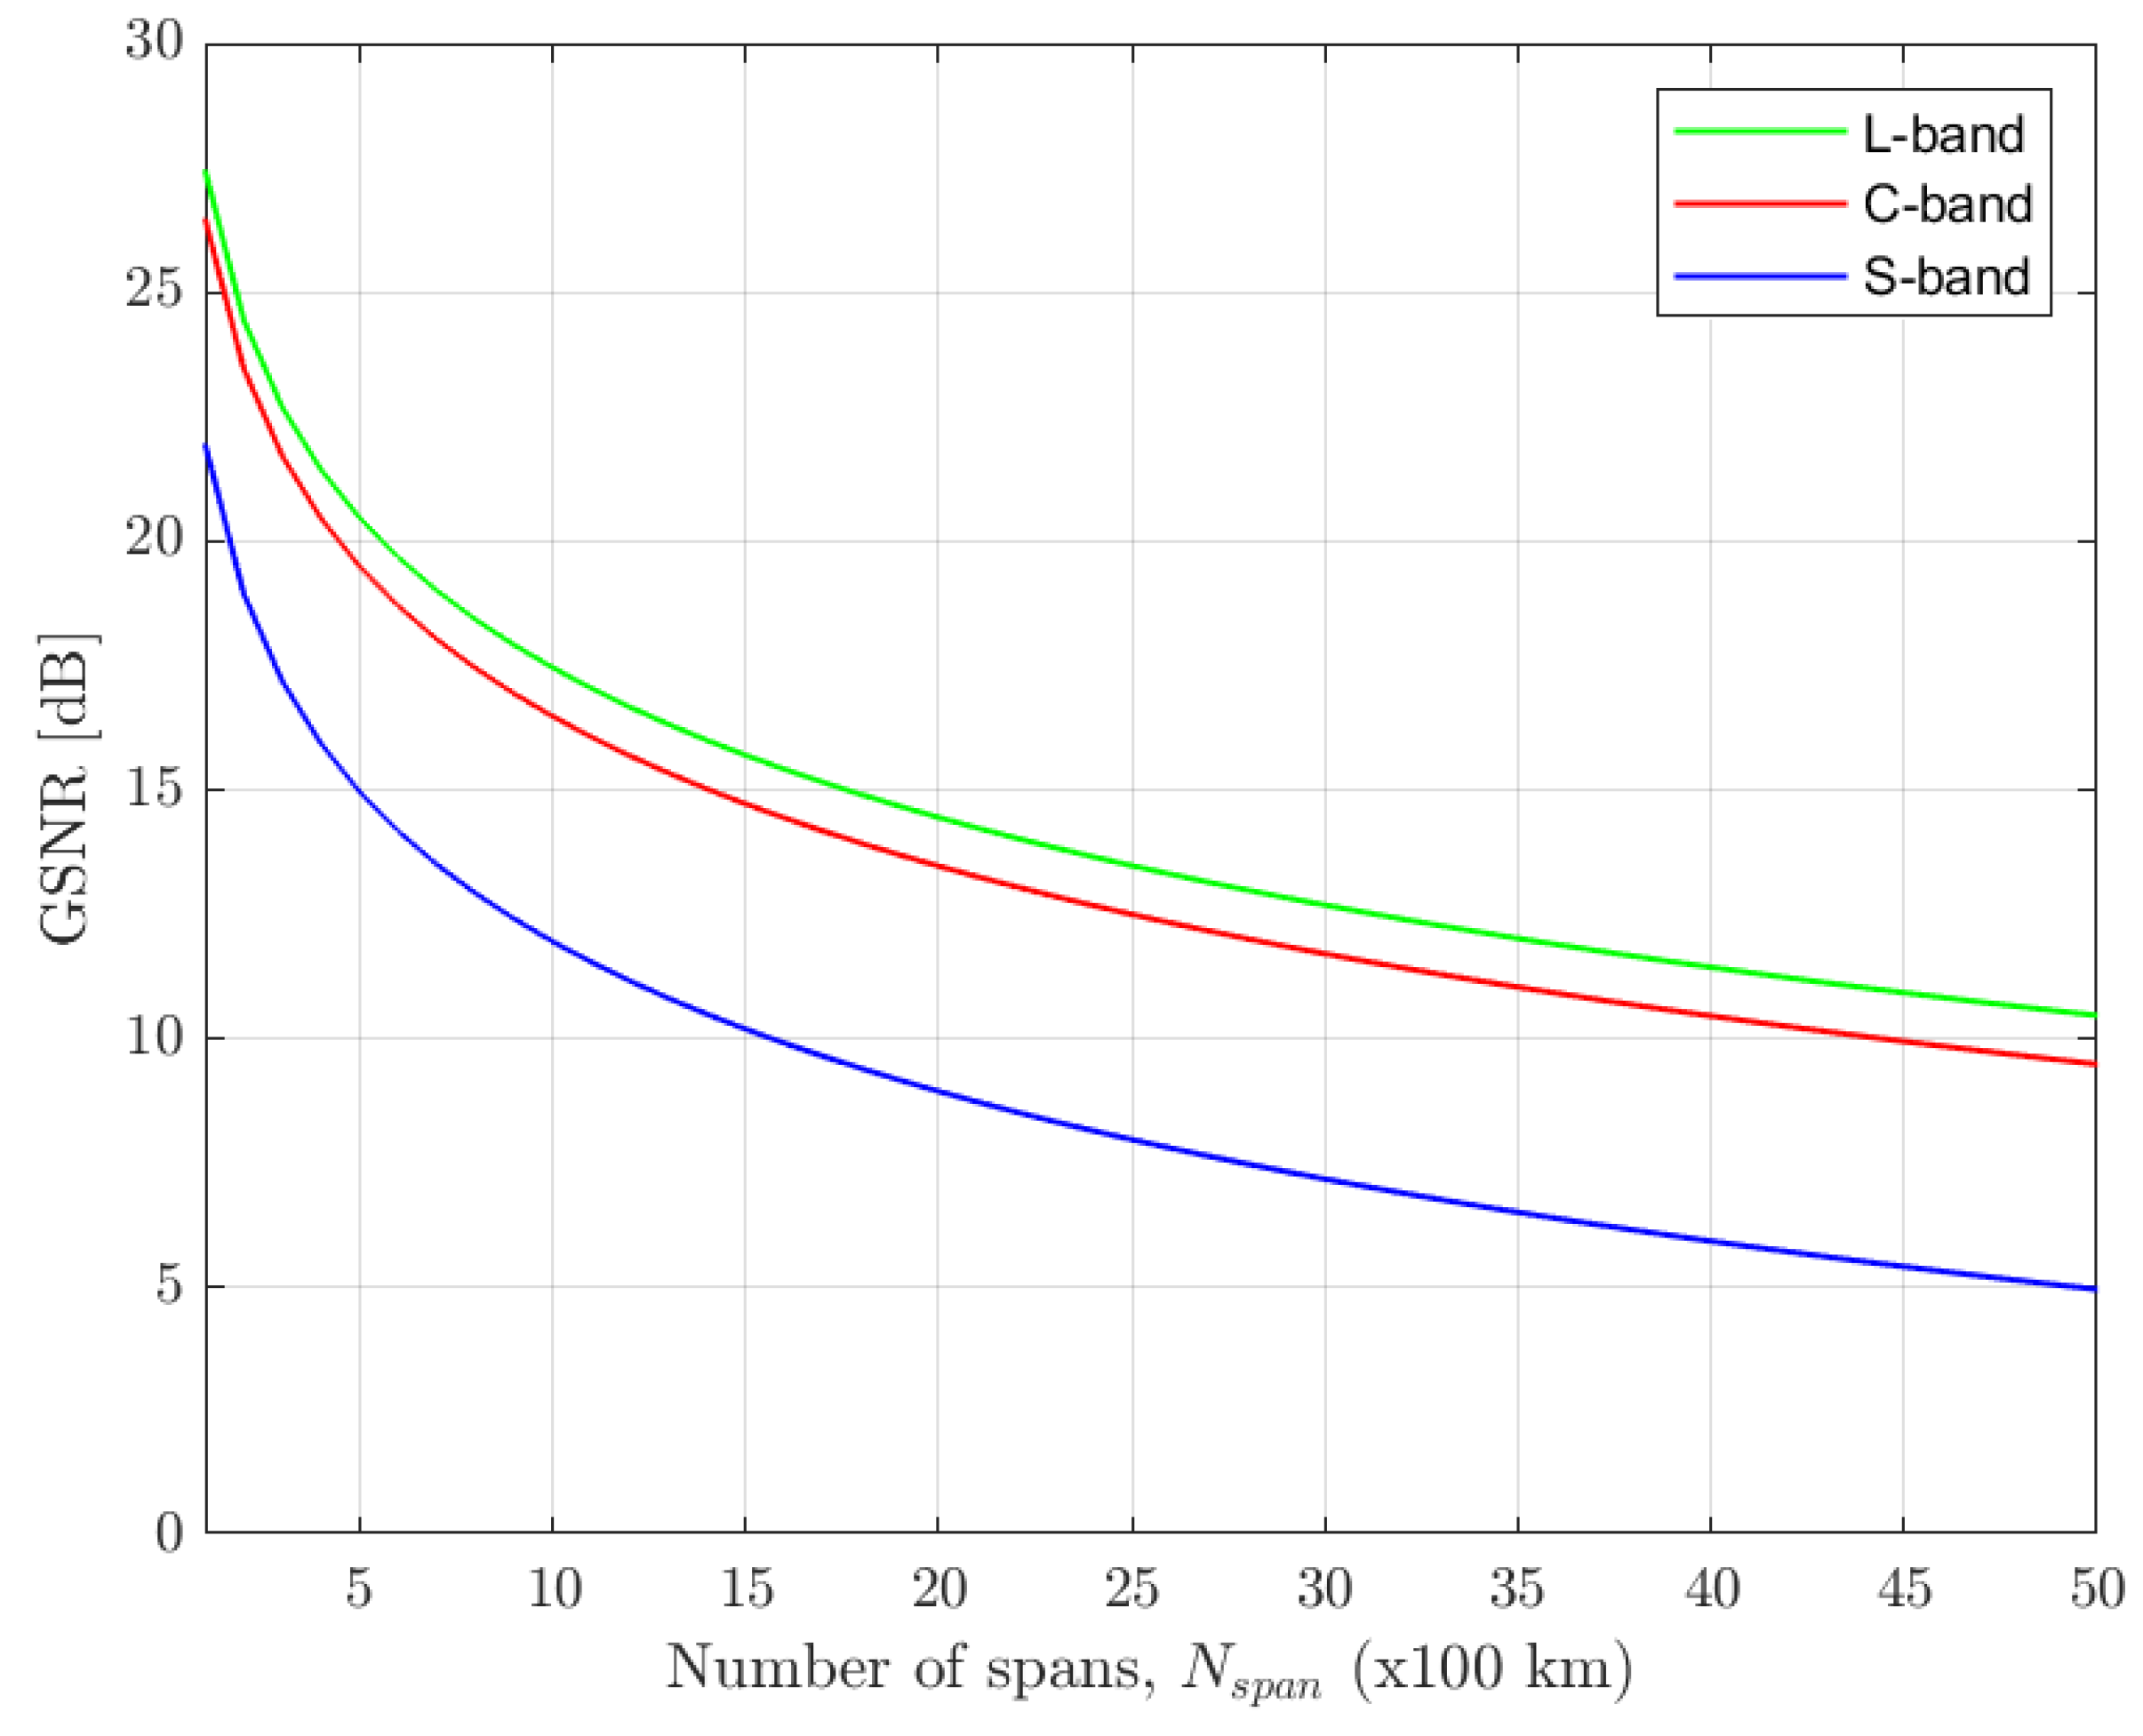
Figure 7.
GSNR as a function of the number of spans for the three bands and three MPI scenarios—no MPI, -34 dB/span and -28 dB/span.
Figure 7.
GSNR as a function of the number of spans for the three bands and three MPI scenarios—no MPI, -34 dB/span and -28 dB/span.

Figure 8.
Number of spans as a function of the MPI level per span for the three bands considering QPSK and 16-QAM signals.
Figure 8.
Number of spans as a function of the MPI level per span for the three bands considering QPSK and 16-QAM signals.
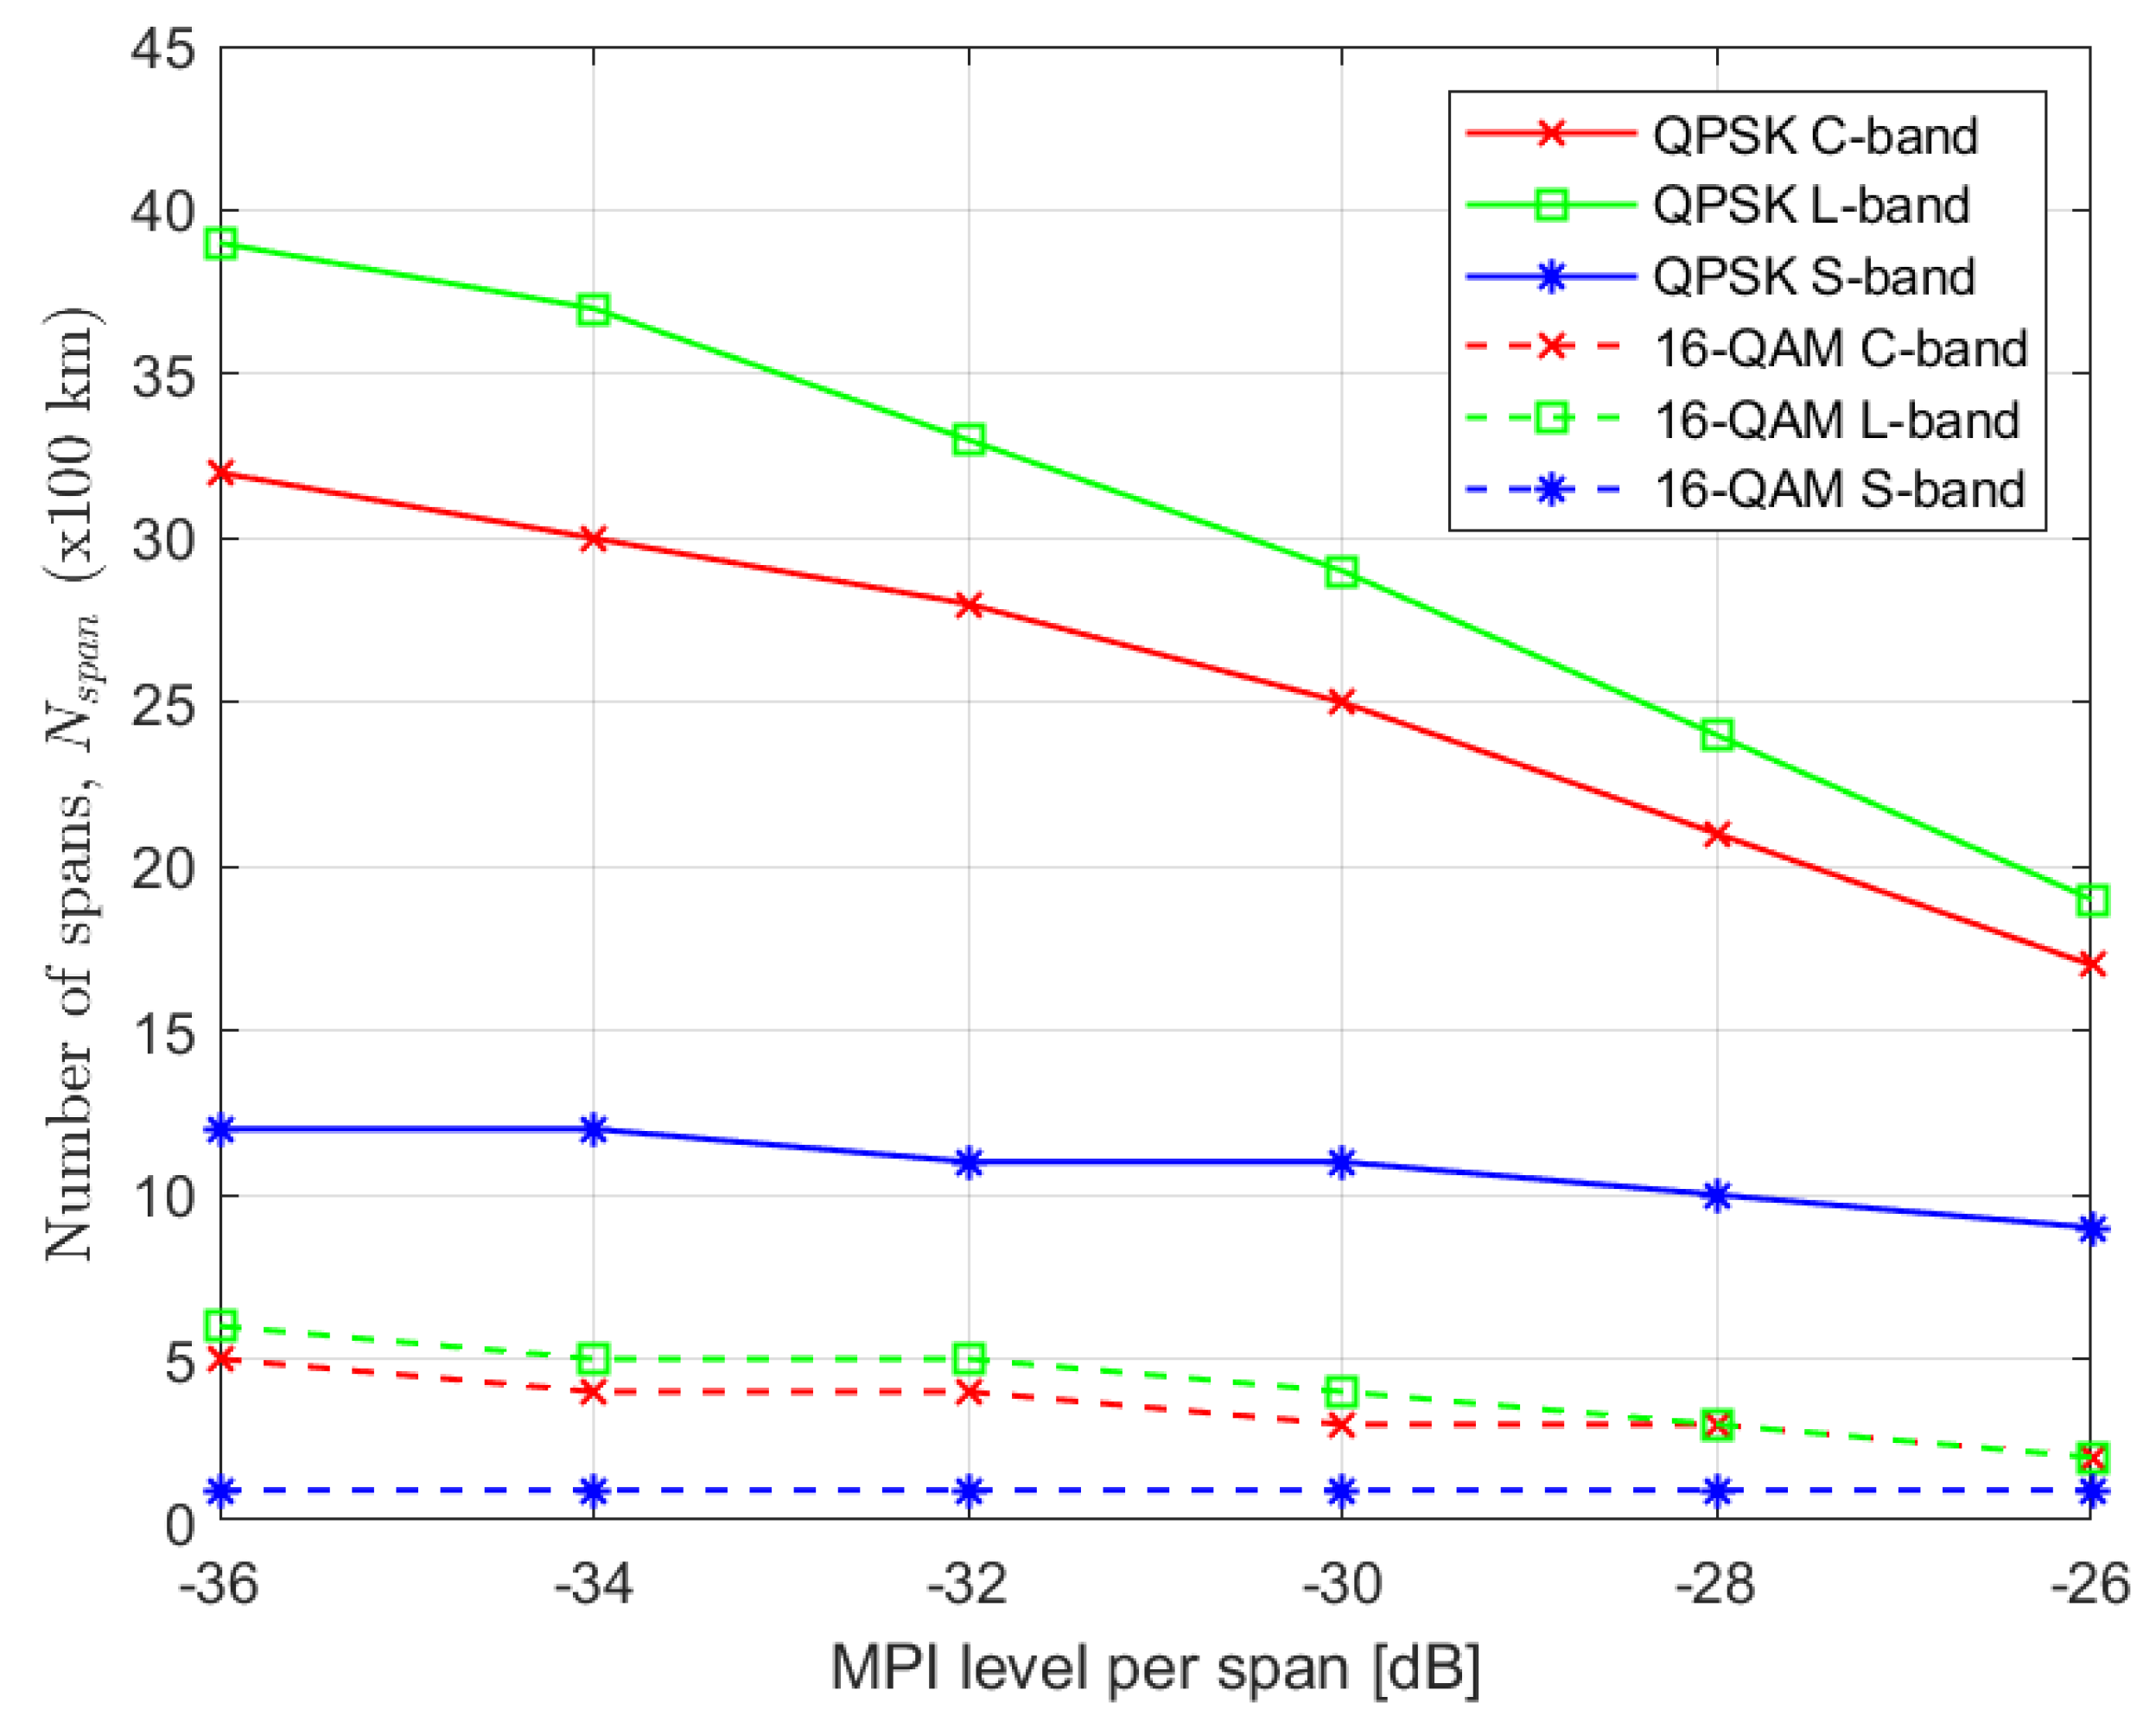

Table 1.
C+L+S MB optical transmission system parameters.
| System parameters | |||
|---|---|---|---|
| Bands | C+L+S | ||
| System bandwidth (THz) | 15.3 | ||
| Bandgaps (GHz) | 500 | ||
| Channel spacing (GHz) | 37.5 | 75 | 137.5 |
| Number of channels | 384 | 192 | 102 |
| Number of channels per band | 128 | 64 | 34 |
| Symbol rate (GBaud) | 32 |
64 (reference scenario) |
128 |
| Span length (km) | 100 | ||
| Splice loss (dB) | 0.0043 to 0.068 | ||
| Splice distance (km) | 4.2 | ||
| Amplifier gain | compensate span loss and ISRS effect | ||
| Amplifier noise figure | as in [5] | ||
| Channel launch power (dBm) | -2 | 1 | 4 |
| G.654E SMF parameters | |
|---|---|
| Dispersion parameter (ps/nm/km) | 21 |
| Loss coefficient (dB/km) | 0.17 |
| Raman gain profile (W.THz.km)-1 | 0.018 |
| Core effective area (µm2) | 125 |
Table 3.
Practical ROSNRs for various modulation formats considering a BER equal to .
| Modulation format | Bit rate (Gbit/s) | ROSNR in the reference bandwidth of 12.5 GHz (dB) [29] |
RSNR in the signal bandwidth (dB) |
|---|---|---|---|
| QPSK | 200 | 16 | 8.9 |
| 16-QAM | 400 | 24 | 16.9 |
Table 4.
Number of spans as a function of the MPI level per span considering three symbol rates—32, 64 and 128 GBaud—for the L-band scenario and QPSK signals.
Table 4.
Number of spans as a function of the MPI level per span considering three symbol rates—32, 64 and 128 GBaud—for the L-band scenario and QPSK signals.
| Symbol rate (GBaud) | no MPI | -36 dB/span | -34 dB/span | -32 dB/span | -30 dB/span | - 28 dB/span |
|---|---|---|---|---|---|---|
| 32 | 45 | 40 | 37 | 33 | 29 29 28 |
24 |
| 64 | 45 | 39 | 37 | 33 | 24 | |
| 128 | 43 | 38 | 37 | 32 | 23 |
Disclaimer/Publisher’s Note: The statements, opinions and data contained in all publications are solely those of the individual author(s) and contributor(s) and not of MDPI and/or the editor(s). MDPI and/or the editor(s) disclaim responsibility for any injury to people or property resulting from any ideas, methods, instructions or products referred to in the content. |
© 2025 by the authors. Licensee MDPI, Basel, Switzerland. This article is an open access article distributed under the terms and conditions of the Creative Commons Attribution (CC BY) license (http://creativecommons.org/licenses/by/4.0/).
Copyright: This open access article is published under a Creative Commons CC BY 4.0 license, which permit the free download, distribution, and reuse, provided that the author and preprint are cited in any reuse.


