
Submitted:
06 January 2026
Posted:
07 January 2026
You are already at the latest version
Abstract
Safety management in the chemical process industry remains a critical challenge due to recurring high impact industrial accidents and the limited predictive capability of conventional threshold based safety systems. Traditional PLC–SCADA frameworks rely on static alarm limits and reactive shutdown logic, which often fail to detect early stage nonlinear deviations in complex, multivariate processes. This study presents ChemSafeAI+, a machine learning driven dynamic safety and optimization framework designed to augment existing industrial control architectures. The system integrates real-time anomaly detection using gradient-boosting models, predictive analytics, safety action processing, operator aware visualization dashboards, and traceable console logging within a unified, modular architecture. The framework is evaluated using a validated synthetic dataset derived from the Haber–Bosch ammonia synthesis process, capturing realistic thermodynamic, kinetic, and operational variability across 5000 operating scenarios. Experimental results demonstrate strong anomaly detection capability and consistent early warning behavior across multiple abnormal operating conditions. SHAP-based explainability provides both global and local interpretability, aligning model decisions with domain relevant process variables. By combining predictive intelligence with safety oriented decision logic and operator traceability, ChemSafeAI+ demonstrates the feasibility of ML driven supervisory safety systems for proactive risk mitigation and improved operational resilience in industrial chemical environments.
Keywords:
machine learning
; dynamic safety framework
; anomaly detection
; chemical process
; optimization
; industrial AI
1. Introduction
The chemical process industry plays an essential role in global manufacturing, energy production, and agricultural supply chains; however, it remains one of the most hazardous industrial domains. Modern plants operate under extreme pressures and temperatures and complex multivariate interactions, making them highly susceptible to abnormal process conditions. Historical evidence shows that even minor deviations can escalate into catastrophic failures when early warning systems are inadequate [1,2,3]. These incidents consistently reveal the same pattern: traditional safety infrastructure struggles to detect subtle nonlinear deviations that precede large-scale industrial accidents.
In emerging economies such as India, the challenge is even more pronounced owing to rapidly expanding chemical production capacities, aging plants, and variability in monitoring infrastructure. Reports from national and international agencies indicate a persistent rise in hazardous chemical incidents, emphasizing systemic gaps in predictive monitoring, hazard communication, and emergency preparedness [4,5,6]. Such recurring failures highlight the limitations of threshold-based PLC safety systems that rely on static alarm limits and reactive emergency shutdown triggers.
Simultaneously, advancements in machine learning offer new possibilities for real-time anomaly detection, predictive diagnostics, and safety-aware optimization. Data-driven models can recognize abnormal signatures emerging from complex interactions across temperature, pressure, flow rates, and reaction kinetics patterns that conventional systems often overlook [7,8,9,10,11,12]. Recent advances in deep learning [10], edge computing [12], and explainable AI [13] have further enhanced the capabilities of industrial safety systems. Integrating these capabilities into industrial safety frameworks can reduce downtime, prevent high-consequence accidents, and support more informed operator decision-making processes.
This study introduces ChemSafeAI+, a unified machine-learning-driven safety and optimization framework designed to augment existing industrial PLC ecosystems. The system integrates anomaly detection, emergency response logic, real-time visualization, optimization insights, and operator activity traceability into a single architecture to achieve this [14,15]. By enabling the early detection of unsafe process trends and supporting proactive safety interventions, ChemSafeAI+ aims to strengthen industrial resilience and operational reliability in both new and legacy plant environments [16,17].
The remainder of this paper is organized as follows.
Section 2 presents the global and regional accident trends, chemical hazard impacts, and regulatory frameworks shaping industrial safety requirements. Section 4 describes the architecture of ChemSafeAI Section 5 outlines the data modelling and validation. Section 6 discusses the machine learning methods. Section 9 summarizes the system Section 12 presents results, and Section 14 concludes the work.
2. Background & Safety Landscape
Industrial chemical accidents remain a major global concern due to the large quantities of hazardous substances handled across manufacturing, storage, and transportation systems. Investigations from international safety boards and regulatory bodies consistently show that deviations in process variables, inadequate monitoring, human error, and equipment degradation are common contributors to industrial disasters [6,18,19].
2.1. Global Industrial Accident Trends
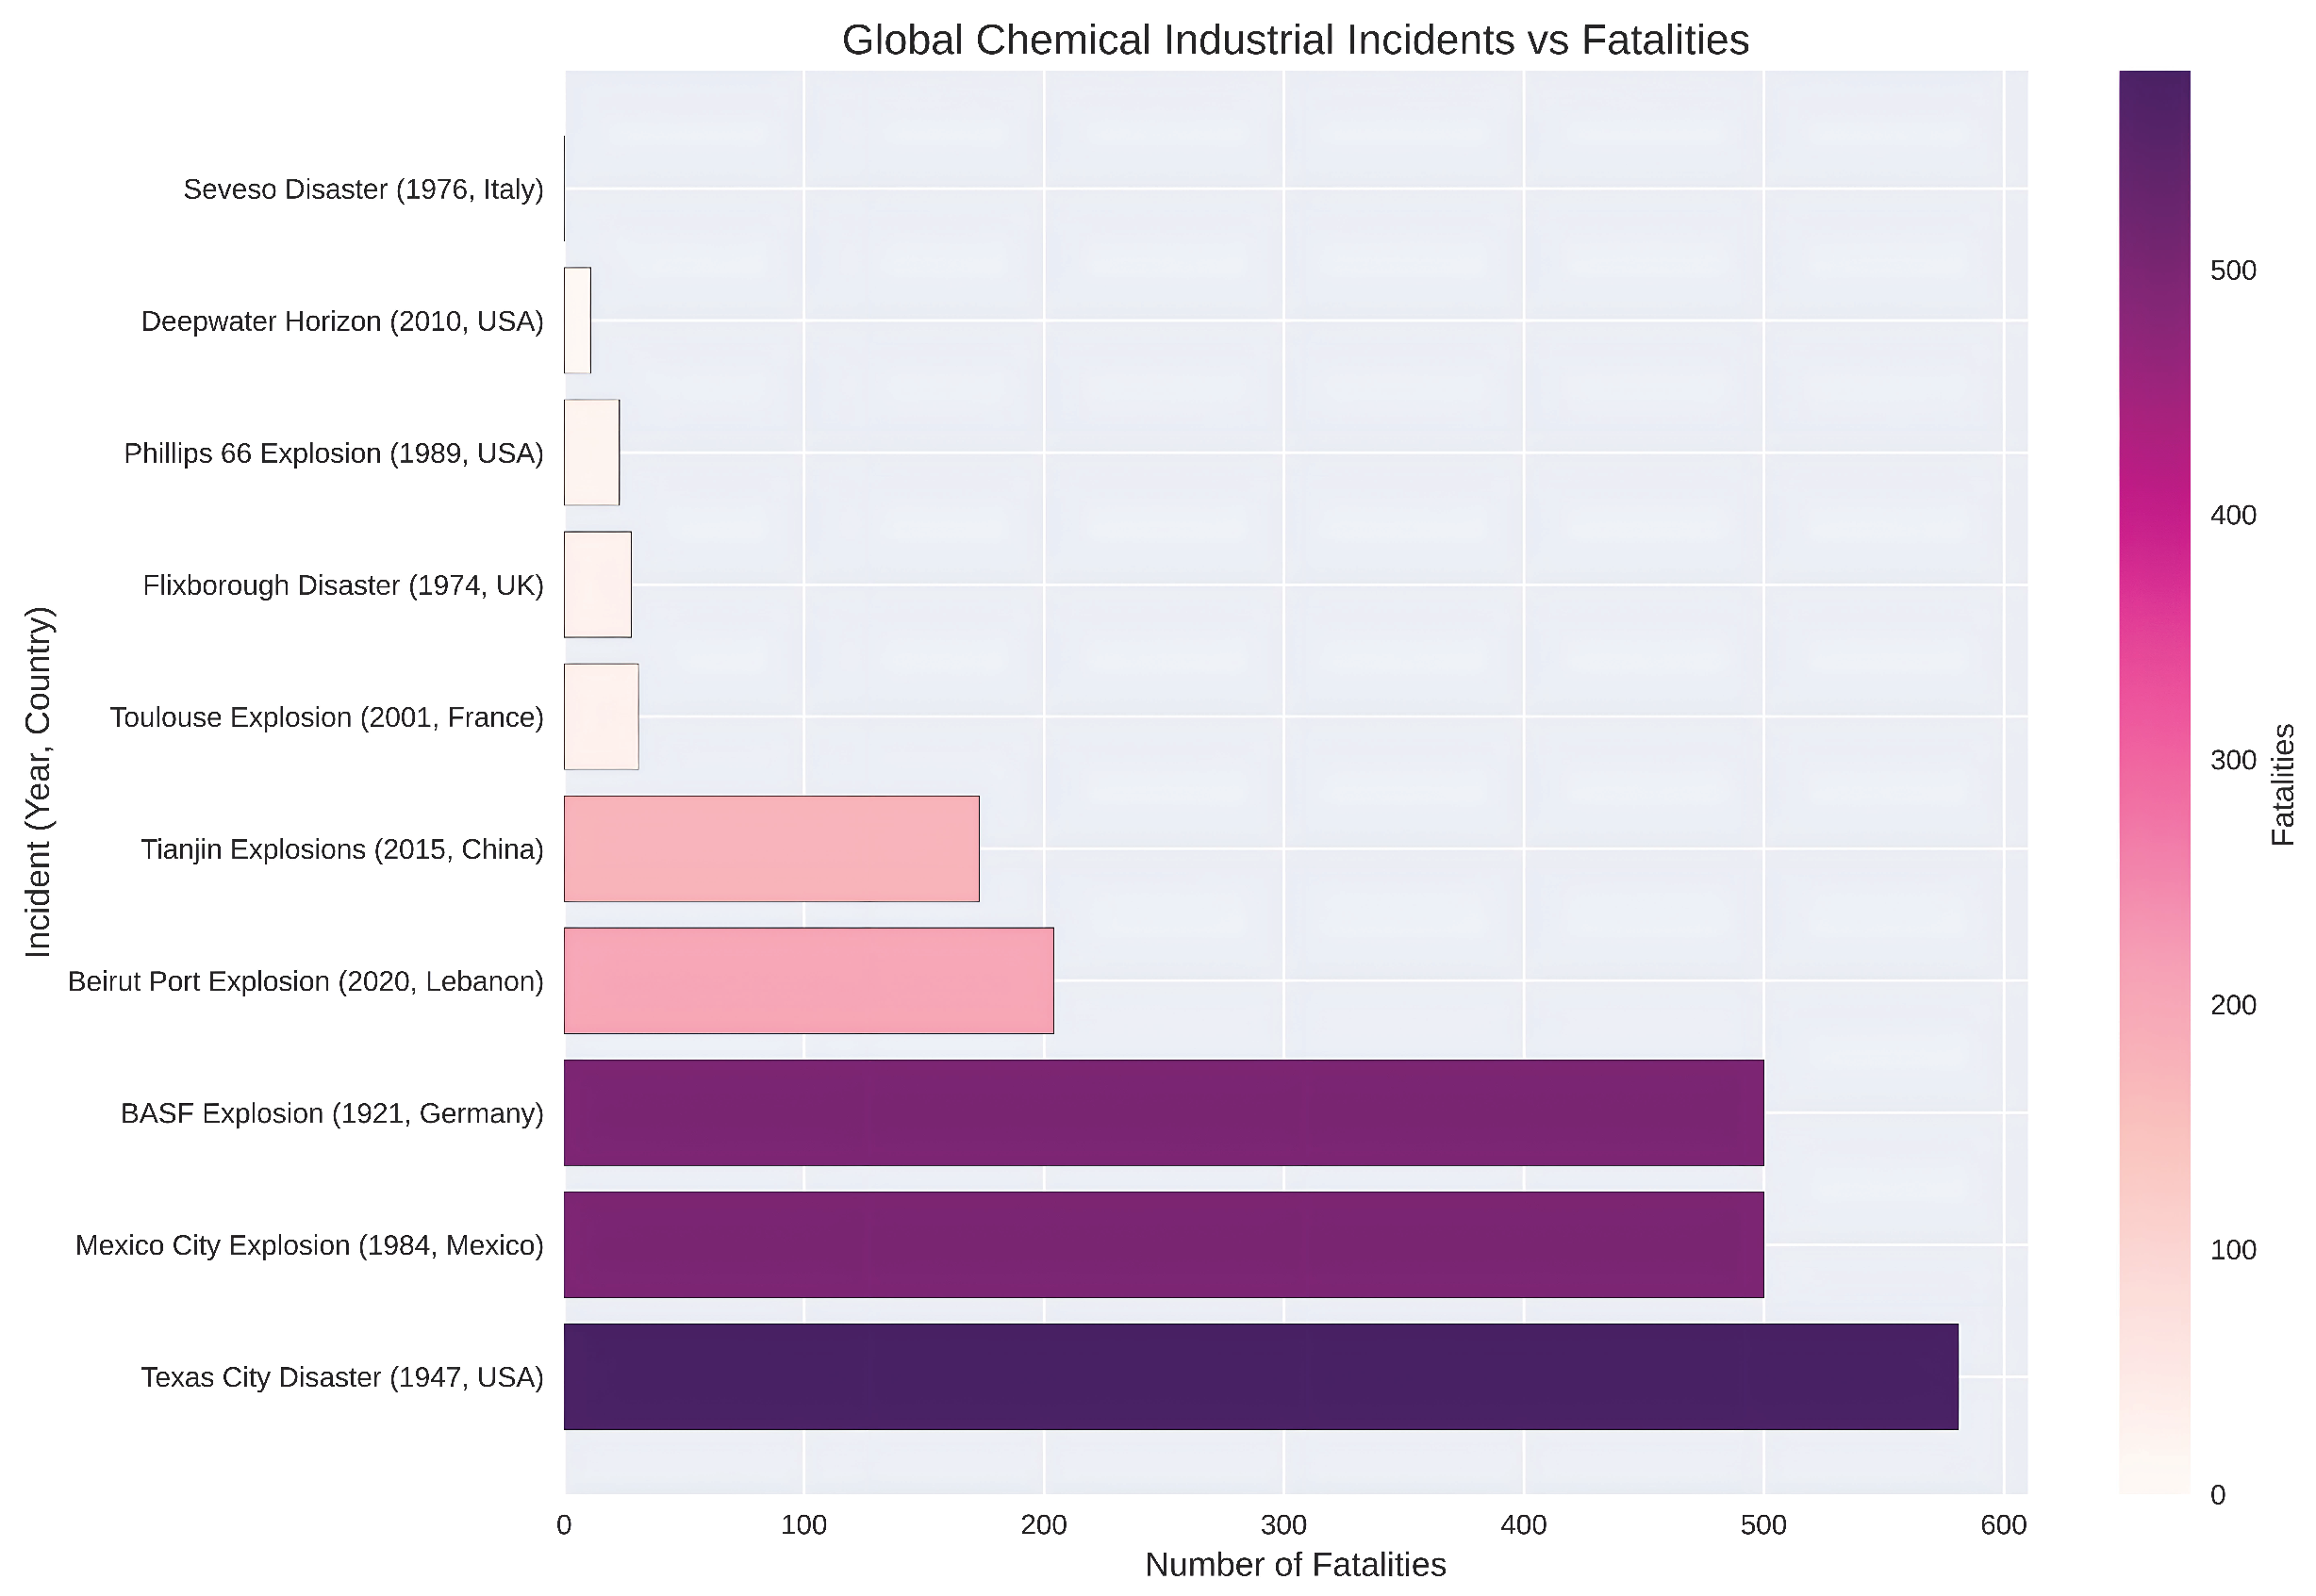
The global chemical sector has expanded significantly over the past decade, accompanied by increased risk exposure across petrochemical hubs, fertilizer production units, and hazardous material warehouses. Numerous high-impact incidents-including refinery explosions, storage fires, and toxic gas releases-demonstrate recurring vulnerabilities in detection, containment, and emergency response systems [1,2]. Table 2 summarizes representative global accident patterns.
Figure 1.
Summary of representative global chemical accident incidents showing incident type, location, time period, causal factors and reported impacts, highlighting recurring safety and operational risks in chemical process industries.
Figure 1.
Summary of representative global chemical accident incidents showing incident type, location, time period, causal factors and reported impacts, highlighting recurring safety and operational risks in chemical process industries.
2.2. Chemical Accident Trends in India
India has experienced multiple major chemical disasters over the past four decades, including Bhopal (1984), Jaipur IOC fire (2009), GAIL pipeline explosion (2014), and Visakhapatnam gas leak (2020). National disaster databases indicate persistent safety challenges across aging industrial clusters, insufficient hazard monitoring, and growing chemical inventories [4,5]. Table 2 highlights key recurring patterns.

Table 1.
Major industrial and chemical accidents in India, summarizing incident causes, casualties, environmental impacts, and economic or regulatory outcomes.
Table 1.
Major industrial and chemical accidents in India, summarizing incident causes, casualties, environmental impacts, and economic or regulatory outcomes.
| Incident | Location | Date | Primary Cause | Casualties | Environmental Impact | Economic Loss / Actions |
|---|---|---|---|---|---|---|
| Bhopal Gas Tragedy | Bhopal, MP | Dec 2–3, 1984 | Poor maintenance, safety lapses | 3,800+ dead; 500,000+ affected | Severe air, soil, and water contamination | $470M compensation; Environment Protection Act (1986) |
| Vizag Gas Leak | Visakhapatnam, AP | May 7, 2020 | Poor maintenance, storage failure | 11 dead; 1,000+ injured | Air pollution, ecological damage | Rs.300 Cr loss; plant shutdown and penalties |
| HPCL Refinery Explosion | Visakhapatnam, AP | Sept 14, 1997 | Gas leak, system failure | 60 dead; 100+ injured | Air and water pollution | Rs.500 Cr loss; major safety overhaul |
| GAIL Pipeline Explosion | Nagaram, AP | June 27, 2014 | Pipeline corrosion | 19 dead; 40+ injured | Land and crop damage | Rs.100 Cr loss; nationwide pipeline inspections |
| IOCL Jaipur Fire | Jaipur, Rajasthan | Oct 29, 2009 | Safety violations, leakage | 12 dead; 200+ injured | Soil contamination, fire damage | Rs.280 Cr loss; safety audits ordered |
| Baghjan Oil Well Fire | Tinsukia, Assam | June 9, 2020 | Equipment failure | 3 dead; several injured | Wetland destruction, wildlife loss | Rs.700 Cr loss; environmental compensation |
| Ennore Oil Spill | Chennai, TN | Jan 28, 2017 | Ship collision | No casualties | Coastal and marine ecosystem damage | Rs.200 Cr loss; emergency protocols improved |
| Dahej Chemical Explosion | Dahej, Gujarat | June 3, 2020 | Mishandled chemical reaction | 10 dead; 70+ injured | Chemical contamination, air pollution | Rs.250 Cr loss; mandatory safety audits |
Table 2.
Key recurring patterns observed in global and Indian chemical accidents.
| Accident Trend | Description |
|---|---|
| Large-scale explosions | Uncontrolled pressure rise, ignition of flammable gases, or runaway reactions causing severe structural and environmental damage. |
| Toxic industrial gas releases | Accidental release of ammonia, styrene, chlorine, or VOCs, leading to acute health impacts and long-term environmental contamination. |
| Fire and storage-related incidents | Fires in storage facilities due to improper segregation, thermal runaway, or failure of engineered safety controls. |
| Pipeline and transport accidents | Pipeline or transport system rupture of flammable or corrosive chemicals, damaging land, water resources, and infrastructure. |
| Human and organizational failures | Inadequate maintenance, delayed emergency response, procedural lapses, insufficient training, and weak safety culture. |
| Regulatory and compliance gaps | Inconsistent oversight, ageing infrastructure, and uneven enforcement of safety regulations, especially in developing regions. |
Organizations such as WHO and national toxicology agencies emphasize the severe health consequences of chemical exposure, including respiratory injury, neurological disorders, and long-term organ damage [20,21]. These risks intensify the need for real-time monitoring and predictive safety technologies [11,15,22].
2.3. Regulatory and Standards Landscape
Industrial safety regulations continue evolving to address increasing chemical hazards. Frameworks such as NDMA guidelines, international occupational safety directives, CSB recommendations, and labour safety protocols aim to enforce structured risk assessment, proactive hazard identification, and transparent incident reporting [5,18]. Despite these efforts, recurring failures highlight the need for intelligent, adaptive systems that go beyond compliance and offer early detection of dangerous operating trends [23,24,25].
3. Related Work
Industrial safety research has evolved significantly over the past several decades, spanning accident investigation, process hazard modeling, machine learning for anomaly detection, and intelligent optimization frameworks. Classical studies of industrial disasters provide foundational insight into recurring systemic failures, human factors, and the limitations of traditional engineering controls. Kletz’s seminal work [26] established detailed case histories illustrating how design flaws, insufficient monitoring, and organizational lapses repeatedly contribute to catastrophic outcomes. Such analyses underscore persistent vulnerabilities that remain relevant to modern industrial plants.
Model-based process monitoring emerged as a key discipline in the early 2000s, with quantitative fault detection frameworks demonstrating how mathematical process models can enable earlier detection of deviations. Venkatasubramanian et al. [27] presented a comprehensive taxonomy of model-based methods, highlighting their capability for structured diagnosis but also their dependence on accurate first-principles models, which may not fully capture nonlinear industrial behavior.
In parallel, the growth of plant instrumentation and digitization paved the way for data-driven methods. Jiang et al. [7] surveyed a broad range of statistical and learning-based approaches for industrial fault detection, emphasizing the potential of multivariate methods to capture correlations overlooked by threshold-based systems. Further advancements introduced classical machine learning algorithms such as Random Forests [28] and synthetic oversampling methods like SMOTE [29] to address class imbalance in safety-critical datasets. These methods, while effective in static scenarios, still struggle in dynamic plant environments where patterns evolve over time.
More recent studies have explored deep learning and unsupervised anomaly detection techniques tailored for industrial applications. Autoencoder-based diagnostics and hybrid systems integrating Isolation Forests have shown promise for capturing nonlinear deviations in complex processes [10,30,31]. Similarly, Singh et al. [8] demonstrated the applicability of machine learning techniques for real-time industrial fault detection, establishing a pathway toward practical deployment in chemical plants. Recent advances in variational autoencoders [31], graph neural networks [32], and transfer learning [33] have further improved detection capabilities. However, many of these studies focus solely on detection accuracy and do not incorporate operator decision-making, visualization, or interaction logging-components essential for real-world safety management [34,35].
Beyond anomaly detection, researchers have proposed dynamic safety frameworks that integrate predictive analytics with proactive intervention strategies. Patel and Shah [36] reviewed safety architectures emphasizing real-time risk assessment, while Zhou et al. [37] presented a vision for AI–IoT convergence in industrial safety systems. Recent work has explored federated learning for multi-plant safety [38,39], reinforcement learning for adaptive control [40], and digital twin integration [14]. Their frameworks highlight the importance of combining sensing, computation, and automated response, yet they rarely extend to end-to-end operational workflows involving dashboards, shutdown logic, or optimization routines [41,42].
Complementary developments in industrial automation, smart manufacturing, and AI-enabled visualization have further expanded the technological landscape. Studies focusing on human–machine interaction, web-based industrial interfaces, and intelligent manufacturing systems [43,44,45] highlight growing interest in bridging operational data streams with decision-making tools. Recent advances in edge AI [25], multimodal data fusion [22], and time series forecasting [46] have enhanced real-time decision support. Visualization research [47] has emphasized the need for intuitive, contextual representations that help operators interpret anomalies rather than only detect them [13,35]. Additionally, causal inference methods [48] and ensemble approaches [49] have improved the reliability and interpretability of safety-critical predictions.
Table 3 provides a consolidated comparison of representative studies across accident investigation, model-based monitoring, machine learning–based anomaly detection, safety frameworks, and visualization systems. While each contributes valuable insights, the literature reveals several gaps: (1) limited integration of anomaly detection with operator interfaces, (2) absence of unified frameworks combining detection, optimization, and emergency response, and (3) insufficient mechanisms for traceability and operator accountability. These gaps motivate the development of ChemSafeAI+, which aims to integrate anomaly detection, predictive safety logic, visualization, optimization guidance, and operator logging into a cohesive, deployable industrial safety solution.
4. System Overview: ChemSafeAI+
ChemSafeAI+ is designed as an adaptive, machine-learning-driven safety and optimization framework that complements existing industrial control architectures rather than replacing them. Modern chemical plants continue to rely on PLC–SCADA environments, where safety mechanisms typically depend on fixed threshold alarms, static interlocks, and operator-triggered emergency procedures. These approaches offer limited responsiveness under nonlinear, rapidly evolving operating conditions. Motivated by these constraints, ChemSafeAI+ introduces a dynamic, data-driven architecture capable of detecting anomalous trends, generating actionable safety responses, supporting optimization workflows, and preserving full operator traceability [43,44].
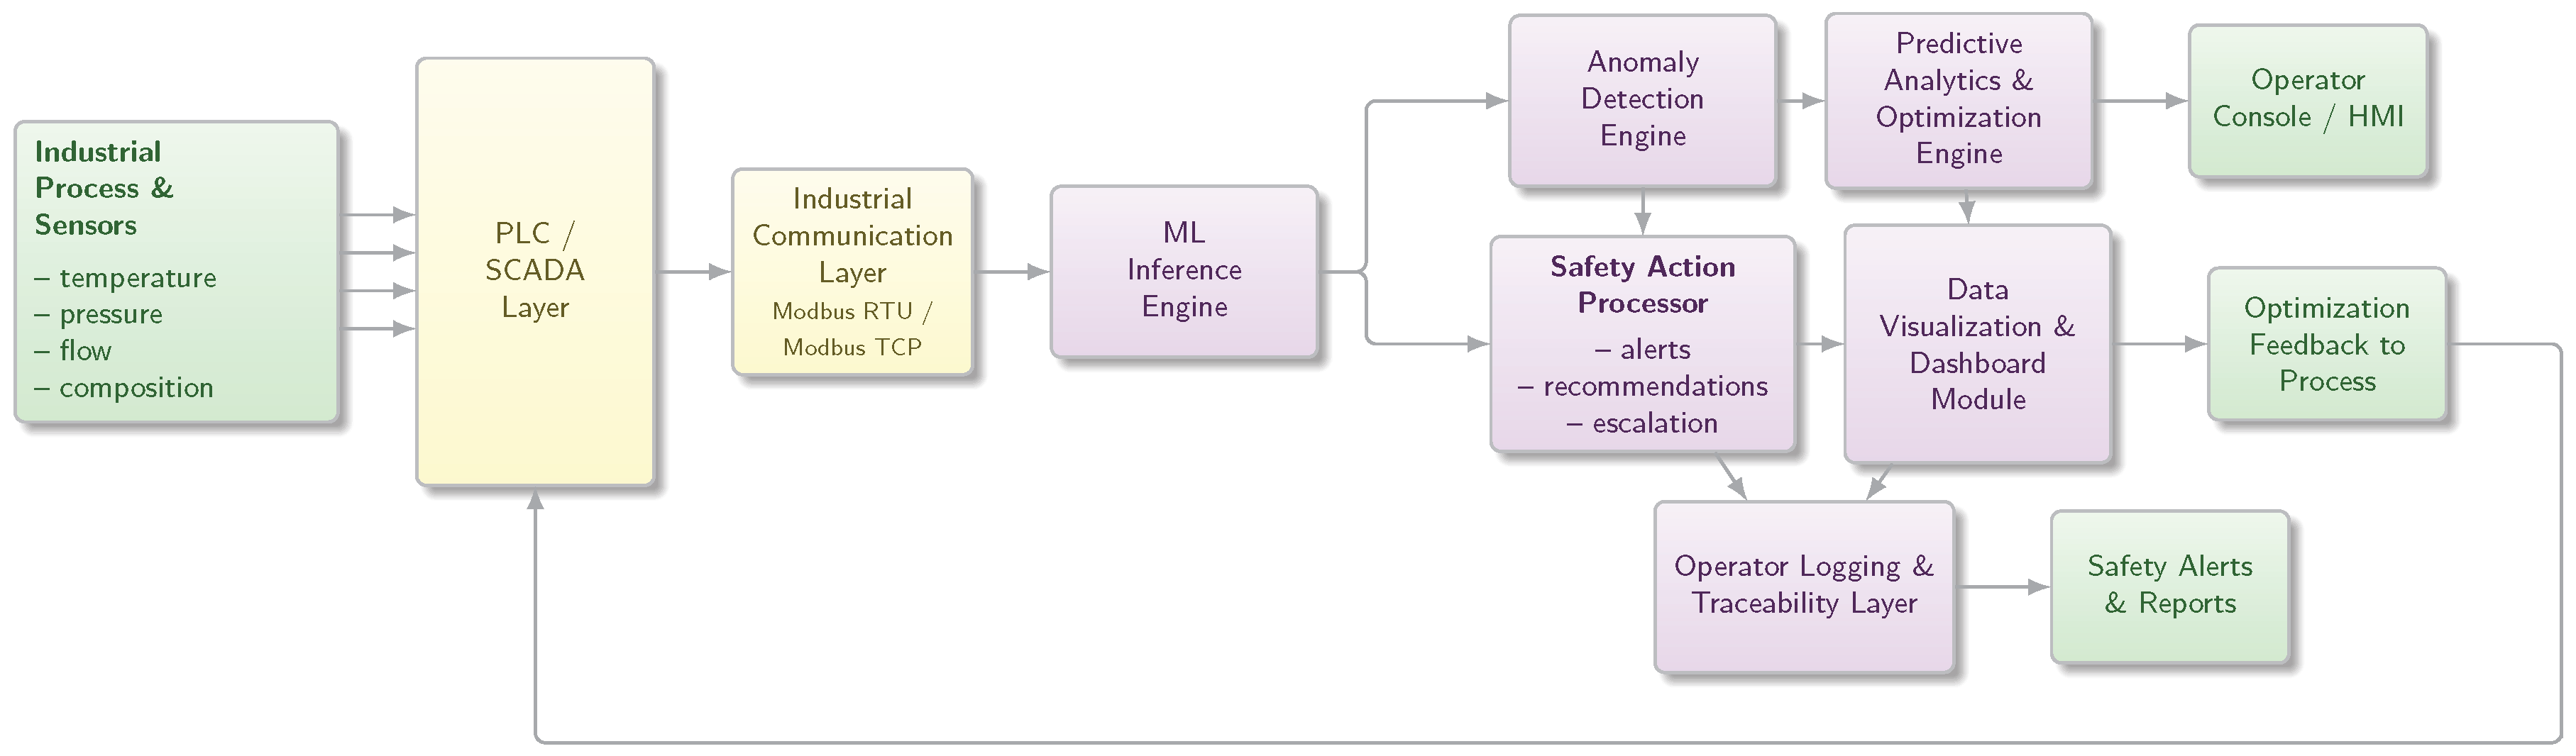
Figure 17 illustrates the high-level architecture of the system. Real-time process variables from field sensors are transmitted through industrial communication protocols (primarily Modbus RTU/TCP), processed by an ML inference engine, and routed to a set of functional modules responsible for safety action planning, visualization, optimization, and operator logging. This structure enables ChemSafeAI+ to operate as an intelligent supervisory layer embedded within existing automation environments.
Figure 2.
System architecture of the ChemSafeAI+ framework illustrating data acquisition from industrial sensors, integration with PLC/SCADA via industrial communication protocols, machine learning based anomaly detection and predictive analytics, safety action processing, visualization dashboards, and operator interaction layers.
4.1. System Design Motivation and Architecture
Conventional PLC-based safety implementations rely on static rule sets, predefined alarm limits, and sequential shutdown logic. While effective for preventing well-characterized hazards, these strategies struggle to identify subtle, multivariate deviations that precede unsafe states. Modern industrial processes exhibit inherently nonlinear behavior influenced by coupled parameters such as temperature, pressure, flow composition, catalyst activity, and transport dynamics. As a result, early-stage deviations may remain undetected until they cross predefined alarm boundaries, reducing the time available for operators to intervene [43,50]. ChemSafeAI+ addresses these limitations by integrating machine learning into the safety loop. Instead of relying solely on fixed thresholds, the system evaluates real-time process signatures against learned behavioral patterns, enabling detection of gradual drifts, abnormal correlations, and emerging failure modes. This approach strengthens predictive situational awareness and supports timely intervention before escalation occurs.
The architecture follows a modular pipeline with four dominant layers: (1) data acquisition and communication, (2) machine learning inference and anomaly scoring, (3) safety action planning (SAP), and (4) operator-facing interfaces for visualization, optimization, and logging. This modularity ensures compatibility with brownfield and greenfield plants while allowing incremental upgrades without disrupting core PLC logic.
4.2. Core Functional Components
ChemSafeAI+ incorporates four principal functional capabilities:
- Real-time anomaly detection and predictive warnings: Machine learning models continuously analyze incoming sensor data to identify deviations from normal operating behavior. These models capture nonlinear and multivariate patterns that lie beyond the scope of conventional single-variable alarm systems.
- Emergency shutdown assistance: When anomaly severity exceeds predefined safety margins, the Safety Action Planning (SAP) module generates high-priority recommendations or issues automatic shutdown signals to the PLC, depending on the configured control policy.
This unified structure ensures that detection, intervention, optimization, and traceability coexist within a single coordinated workflow.
4.3. PLC–Modbus Integration Layer
A key design requirement of ChemSafeAI+ is non-intrusive integration with industrial hardware. The system communicates with plant instrumentation via Modbus RTU or Modbus TCP, enabling compatibility with a wide range of PLCs and distributed control systems [54]. Process variables such as temperature, pressure, flow rates, and composition metrics are periodically polled or received asynchronously through gateway devices.
Figure 3 illustrates the integration layer, where the ML engine operates in parallel with existing SCADA interfaces. Safety recommendations generated by the system can be routed back to the PLC as coil writes or register updates, enabling automated alarms or shutdown execution.
This architecture enables ChemSafeAI+ to function as an intelligent supervisory layer that enhances, rather than replaces, established plant automation frameworks.
4.4. Safety Action Processor (SAP) Engine
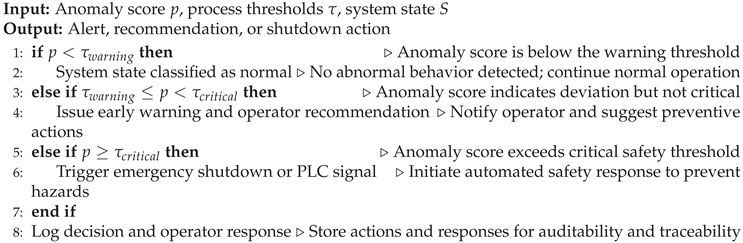
The Safety Action Processor (SAP) forms the core of the ChemSafeAI+ safety workflow and is responsible for processing anomaly scores generated by machine learning models, categorizing risk levels, issuing early-stage warnings, generating real-time safety recommendations, and triggering emergency shutdown procedures when required.
The SAP integrates both predictive and event-driven logic. Predictive logic leverages continuous anomaly scoring to anticipate unsafe operational trends before critical thresholds are breached, while event-driven logic responds immediately when key process variables exceed predefined safety limits.
Figure 4 presents the SAP interface, which includes anomaly alerts, shutdown triggers, and live response summaries. Operators can additionally simulate hypothetical operating conditions to evaluate system behavior, enabling scenario analysis without altering real plant operations. By combining predictive analytics with deterministic safety rules, the SAP enhances operator situational awareness and improves readiness for emergency intervention [9].
4.5. Data Visualization Module
The data visualization module transforms multivariate process data into interpretable plots, dashboards, and trend analyses to support effective operator decision-making. It facilitates time-series exploration, correlation analysis, value distribution assessment, and anomaly overlays for intuitive interpretation of complex process behavior.
The module supports both real-time and offline datasets, enabling historical comparison and post-incident review. Figure 4 illustrates a representative visualization of multiple process parameters. Effective visualization reduces operator cognitive load, allowing faster recognition of undesirable trends and supporting informed operational decisions [47].
4.6. Optimization and Predictive Analytics Engine
Beyond safety monitoring, ChemSafeAI+ incorporates an optimization and predictive analytics engine that evaluates trade-offs among production rate, energy consumption, and emission levels. Predictive models estimate downstream impacts of parameter adjustments, enabling the safe exploration of alternative operating conditions [51,52].
Operators can modify variables such as temperature, flow rates, and recycle ratios, and the system projects their influence on yield and environmental performance. This capability supports both operational planning and sustainability objectives while ensuring that predefined safety boundaries remain intact.
4.7. Operator Console Log and Traceability Layer
The operator console log records all operator interactions, system alerts, warnings, shutdown events, and optimization queries, creating a complete temporal record of safety-related actions. This traceability supports auditing, compliance verification, and post-incident analysis. Logging is essential for transparency in industrial environments and aligns with best practices in modern safety management systems [53].
This layer strengthens accountability, reduces ambiguity during investigations, and provides an empirical foundation for continuous system improvement.
5. Process and Data Modelling
This section details the process modelling foundation used to generate the operational dataset for ChemSafeAI+. The Haber–Bosch ammonia synthesis loop, a benchmark industrial process characterized by coupled nonlinear reaction kinetics, high-pressure equilibrium constraints, and multistage separation dynamics, is adopted as the basis for simulation. The modelling objective is not to replicate an industrial plant at full fidelity, but to reproduce the essential thermodynamic, kinetic, and flow-dependent relationships that govern reactor behavior, recycle dynamics, and product purification. These characteristics allow the machine learning components of ChemSafeAI+ to learn meaningful patterns grounded in chemical engineering principles rather than arbitrary synthetic structure.
5.1. Overview of the Haber–Bosch Process
Ammonia synthesis involves the reversible reaction:
a strongly exothermic equilibrium-limited process. Industrial plants operate at elevated pressures (typically 150–250 bar) and temperatures (400–500∘C) to balance reaction rate and equilibrium yield [55,56]. Figure 5 provides a high-level flow diagram of the synthesis loop.
Nitrogen is supplied from air separation, while hydrogen is derived from natural gas reforming. Following purification, the gases enter a high-pressure reactor where conversion per pass remains low (typically 12–22%), necessitating extensive recycle. Downstream cooling allows condensation of ammonia, enabling separation from unreacted gases. This closed-loop configuration couples reaction, heat transfer, mechanical compression, and separation operations, creating a process landscape well suited for studying anomaly formation and optimization.
5.2. Reaction Mechanism and Catalysis
Ammonia formation occurs through dissociative chemisorption of nitrogen (rate-limiting), followed by hydrogen adsorption and stepwise surface reactions [57]. Iron-based catalysts remain industrial standards, while ruthenium-based formulations offer superior activity at lower temperatures but with higher cost [58].
Figure 6 illustrates the conceptual catalytic sequence used as a reference for modelling.
Table 4 summarizes catalyst characteristics used to define feasible operating windows.
These catalyst properties influence temperature setpoints, conversion expectations, and permissible ramp rates, all of which shape the synthetic dataset used for ML training.
5.3. Gas Purification and Feed Conditioning
Feed purification is essential to avoid catalyst poisoning. In industrial plants, CO, CO2, H2O, and sulfur compounds must be reduced to ppm-levels [59]. In the modelling framework, impurities are represented as penalty factors that reduce effective conversion or trigger fault-like conditions when levels exceed safe bounds.
Table 5 lists representative impurity thresholds incorporated into the simulation.
Figure 7.
Generic schematic of gas purification steps (desulfurization, CO-shift, methanation).
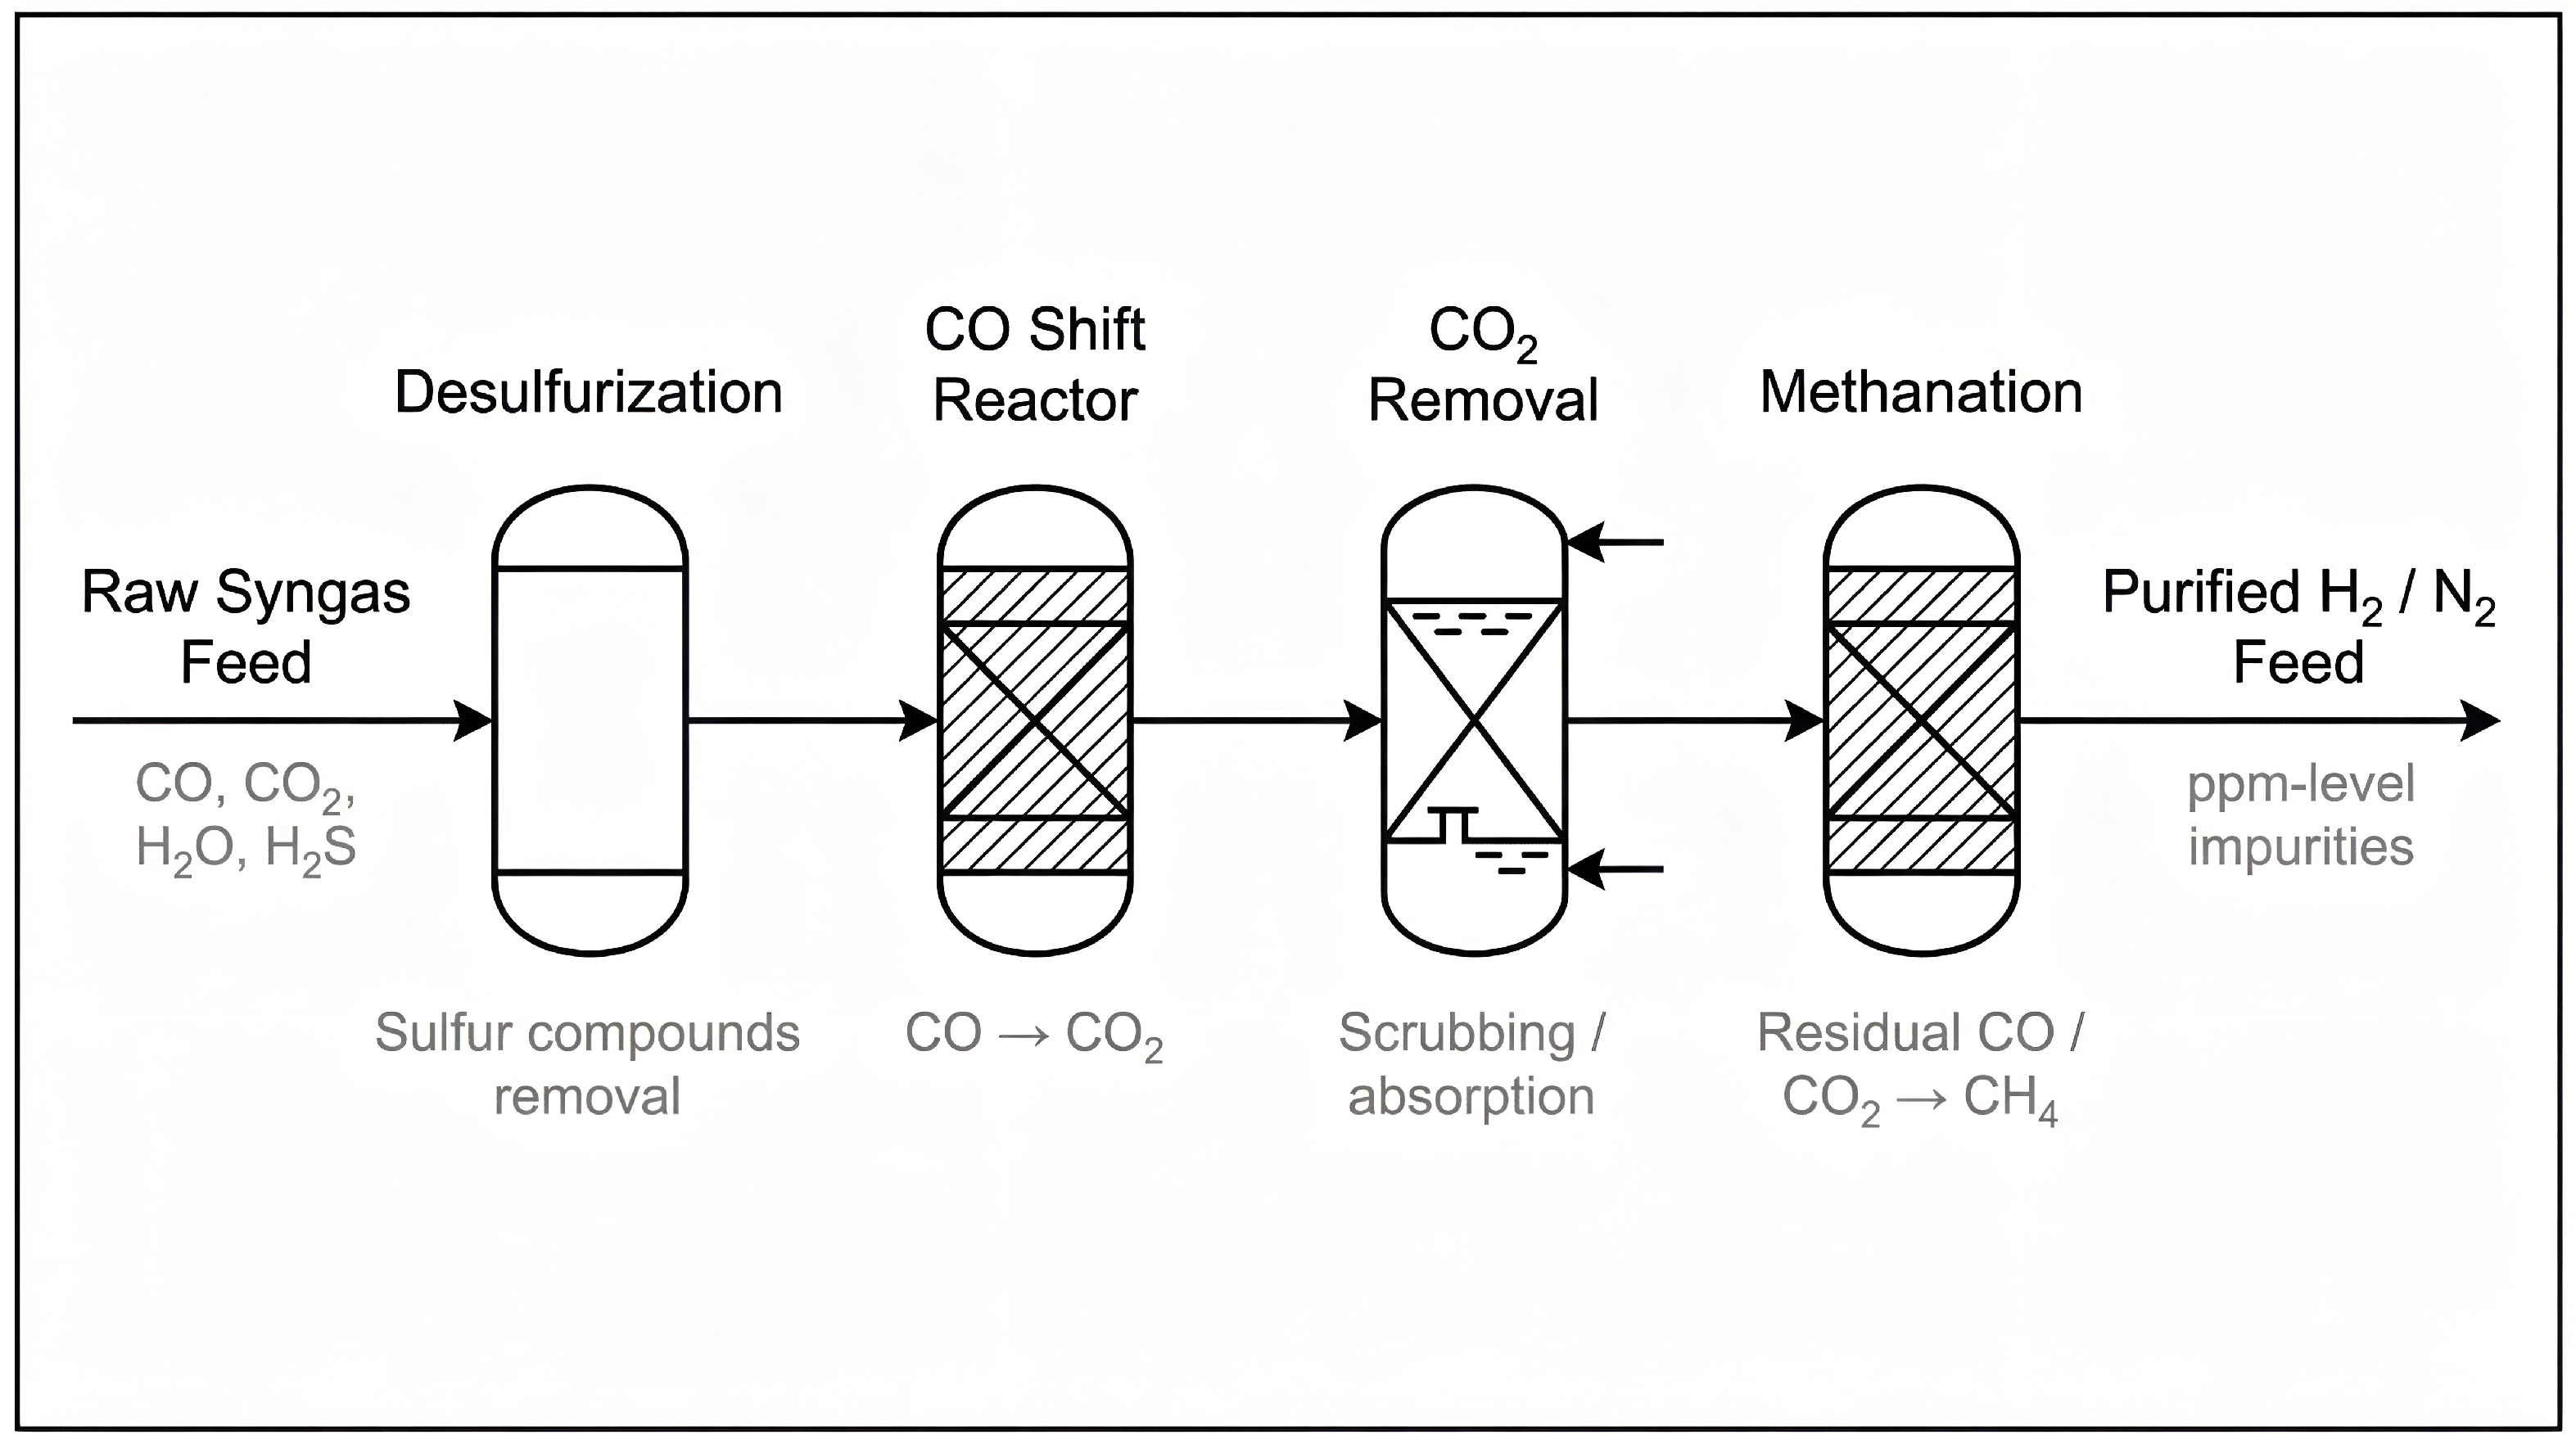
Impurities above these limits serve as anomaly triggers in the ChemSafeAI+ dataset.
5.4. Reactor Modelling and Operating Ranges
The core of the modelling framework represents the reactor as a pseudo-homogeneous plug flow system with equilibrium and kinetic constraints. Temperature, pressure, inlet composition, and recycle ratio are varied across industrially reasonable ranges [60,61].
Table 6 summarizes the operating domain sampled during data generation.
At each operating point, the modelling computes outlet composition, heat duty, equilibrium approach, and ammonia condensation efficiency. These outcomes form the ground truth targets for training predictive and anomaly detection models.
5.5. Separation and Recycle Modelling
Downstream cooling and condensation separate ammonia from the unreacted synthesis gas. The separation efficiency depends on temperature, pressure, and cooling load. A simplified refrigeration model computes ammonia removal fraction as a function of condenser temperature. Figure 8 illustrates the separation block included in the modelling.
Recycle compression power is modelled as a function of pressure ratio and flow, and becomes a useful optimization target since energy consumption is a key cost driver.
5.6. Safety Modelling and NH3 Hazard Representation
Ammonia poses inhalation toxicity, corrosive hazards, and environmental risks. To incorporate safety behaviour into the dataset, the model includes threshold-based classifications for leak events, exposure zones, and concentration alarms based on guidelines from industrial toxicology literature [62,63].
Table 7 summarizes representative toxicity limits used to generate safety-critical labels.
Figure 9.
Illustrative representation of ammonia exposure and hazard zones.
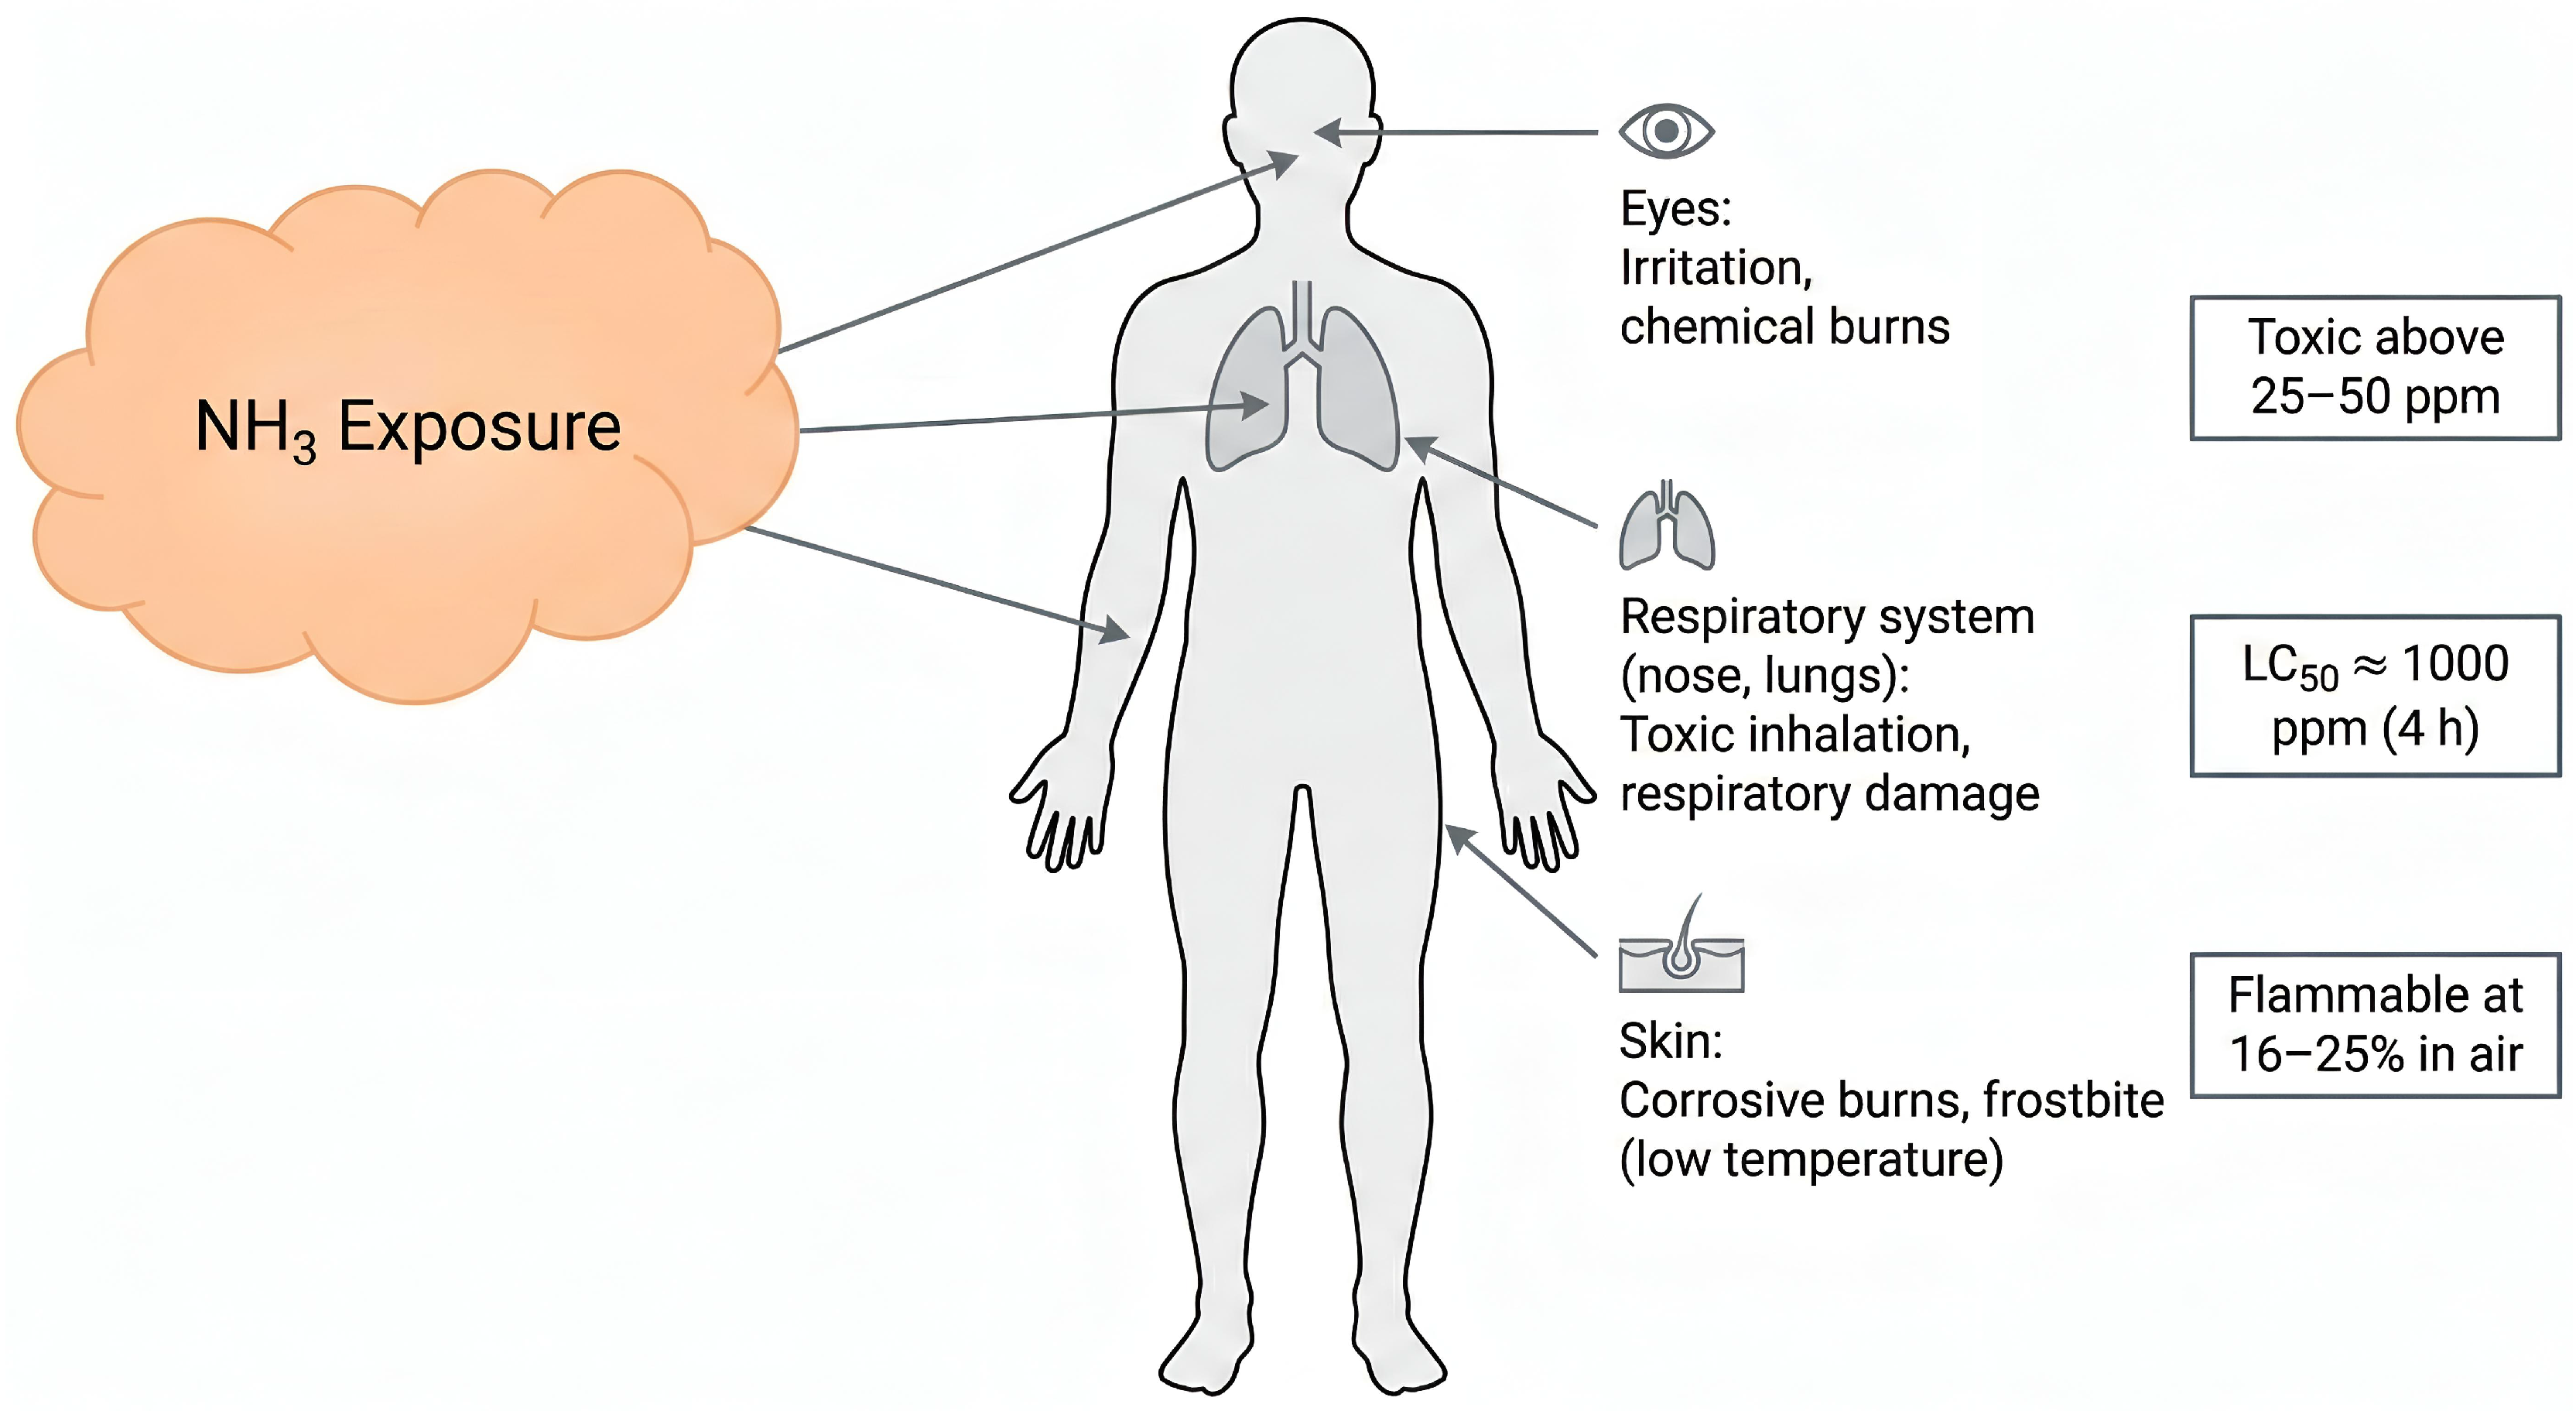
These thresholds allow ChemSafeAI+ to simulate hazardous situations such as leaks, overpressure events, or heat removal failures.
5.7. Dataset Construction
A total of 5000 operating points were generated by sampling the multidimensional operating ranges. Each sample includes:
- inlet conditions (T, P, composition, impurities),
- reactor outputs (conversion, outlet composition, heat release),
- separation metrics (condensation fraction, purge loss),
- energy consumption (compressor work, cooling duty),
- safety-relevant indicators (toxic concentration zones, leak flags).
The dataset preserves physical correlations (e.g., higher temperature lowers equilibrium conversion, higher pressure increases yield, increased recycle increases compressor work), making it appropriate for anomaly detection and optimization model training.
5.8. Data Validation Summary
To ensure that the generated operating dataset remained physically meaningful and suitable for machine-learning–based anomaly detection, multiple validation checks were incorporated during the modelling workflow. These checks allowed the simulation to reject infeasible samples and correct unrealistic operating combinations before final dataset construction.
Thermodynamic feasibility constraints were first applied to maintain consistency with the equilibrium-limited nature of ammonia synthesis. Temperature–pressure–conversion relationships were validated against established industrial behaviour [55,56,60]. Samples exhibiting trends that contradicted equilibrium expectations-such as increasing conversion with temperature at constant pressure-were removed. Stoichiometric consistency checks based on classical reaction engineering principles [61] were used to preserve mass balance across the reactor, condenser, and recycle loop.
Kinetic plausibility filters ensured that per-pass conversion values remained consistent with known catalyst performance limits. The accepted ranges were derived from studies on industrial Fe- and Ru-based catalysts [57,58]. Operating points that implied unrealistically high reaction rates, negative rates, or infeasible heat release were discarded. Likewise, condenser performance was validated by enforcing vapor–liquid equilibrium consistency so that ammonia removal efficiency remained compatible with refrigeration temperature limits.
Safety-related variables-including ammonia concentration zones, leak indicators, and exposure thresholds-were validated using industrial toxicology and accident literature [20,62,63]. Samples producing contradictory or non-monotonic hazard levels (e.g., lower exposure at higher leak rates) were automatically rejected.
This modelling approach ensures that ChemSafeAI+ is evaluated on a dataset with realistic process dynamics, safety behaviour, and nonlinear interactions reflective of an actual industrial ammonia synthesis loop.
6. Machine Learning Methods and Model Evaluation
This section presents the complete workflow used to develop, train, and evaluate the anomaly detection and predictive models integrated into the ChemSafeAI+ framework. All modelling was performed using the validated Haber–Bosch dataset introduced earlier. The overarching objective was to construct data-driven systems capable of identifying abnormal behaviour, forecasting key process indicators, and supporting operational decision-making under realistic industrial uncertainty.
The pipeline improves substantially over traditional threshold-based surveillance by incorporating robust preprocessing, diagnostics, and interpretable learning techniques. Methods such as KNN-based imputation, PCA-driven variance analysis, SMOTE-based imbalance assessment, and gradient-boosting classifiers collectively establish a modern and industrially aligned methodology for digitalized process monitoring [16,23,49]. Recent advances in robust detection under sensor faults [23] and adaptive threshold selection [16] have further enhanced the reliability of such systems.
6.1. Data Input and Initial Exploration
The dataset intentionally included missing values to reflect practical sensor drift, communication losses, and measurement dropouts typical of industrial operations. This enabled evaluation of preprocessing strategies under realistic noise and uncertainty. The dataset contained 39 process variables, including temperatures, pressures, reactant flow rates, conversions, catalyst activity, and yield.
Initial exploration using standard descriptive statistics revealed wide variation in scales, outliers, and non-linear relationships. Missing values were imputed using K-Nearest Neighbour (KNN) imputation to preserve local structure and avoid bias associated with simple mean or median filling [23]. This approach enhanced the reliability of the subsequent anomaly detection models by ensuring stable feature reconstruction, particularly important for real-time industrial applications [12].
6.2. Exploratory Data Analysis and Feature Diagnostics
Exploratory analysis using correlation structures and distribution assessments revealed several important patterns: strong nonlinear dependencies among core thermodynamic features, sensitivity of ammonia yield to fluctuations in hydrogen and nitrogen flow, and impurity-driven deviations characteristic of anomalous states. Substantial multicollinearity was also observed among temperature- and pressure-related variables. Refer to Appendix A, Table A4, Figure A1, Figure A2 and Figure A5.
These insights guided dimensionality diagnostics and model selection. Tree-based methods emerged as strong candidates due to their robustness to multicollinearity and their ability to capture complex nonlinear interactions [64]. Recent work has shown that incorporating process knowledge into machine learning models improves generalization [64], while graph neural networks can capture process topology relationships [32].
6.3. Dataset Splitting and Feature Scaling
To evaluate generalization performance, the dataset was split into training and test sets using a 70/30 ratio with a fixed random seed. Scaling was applied after the split to prevent data leakage. Numerical features were normalized to zero mean and unit variance using StandardScaler, improving model stability and convergence.
6.4. Dimensionality Diagnostics Using PCA
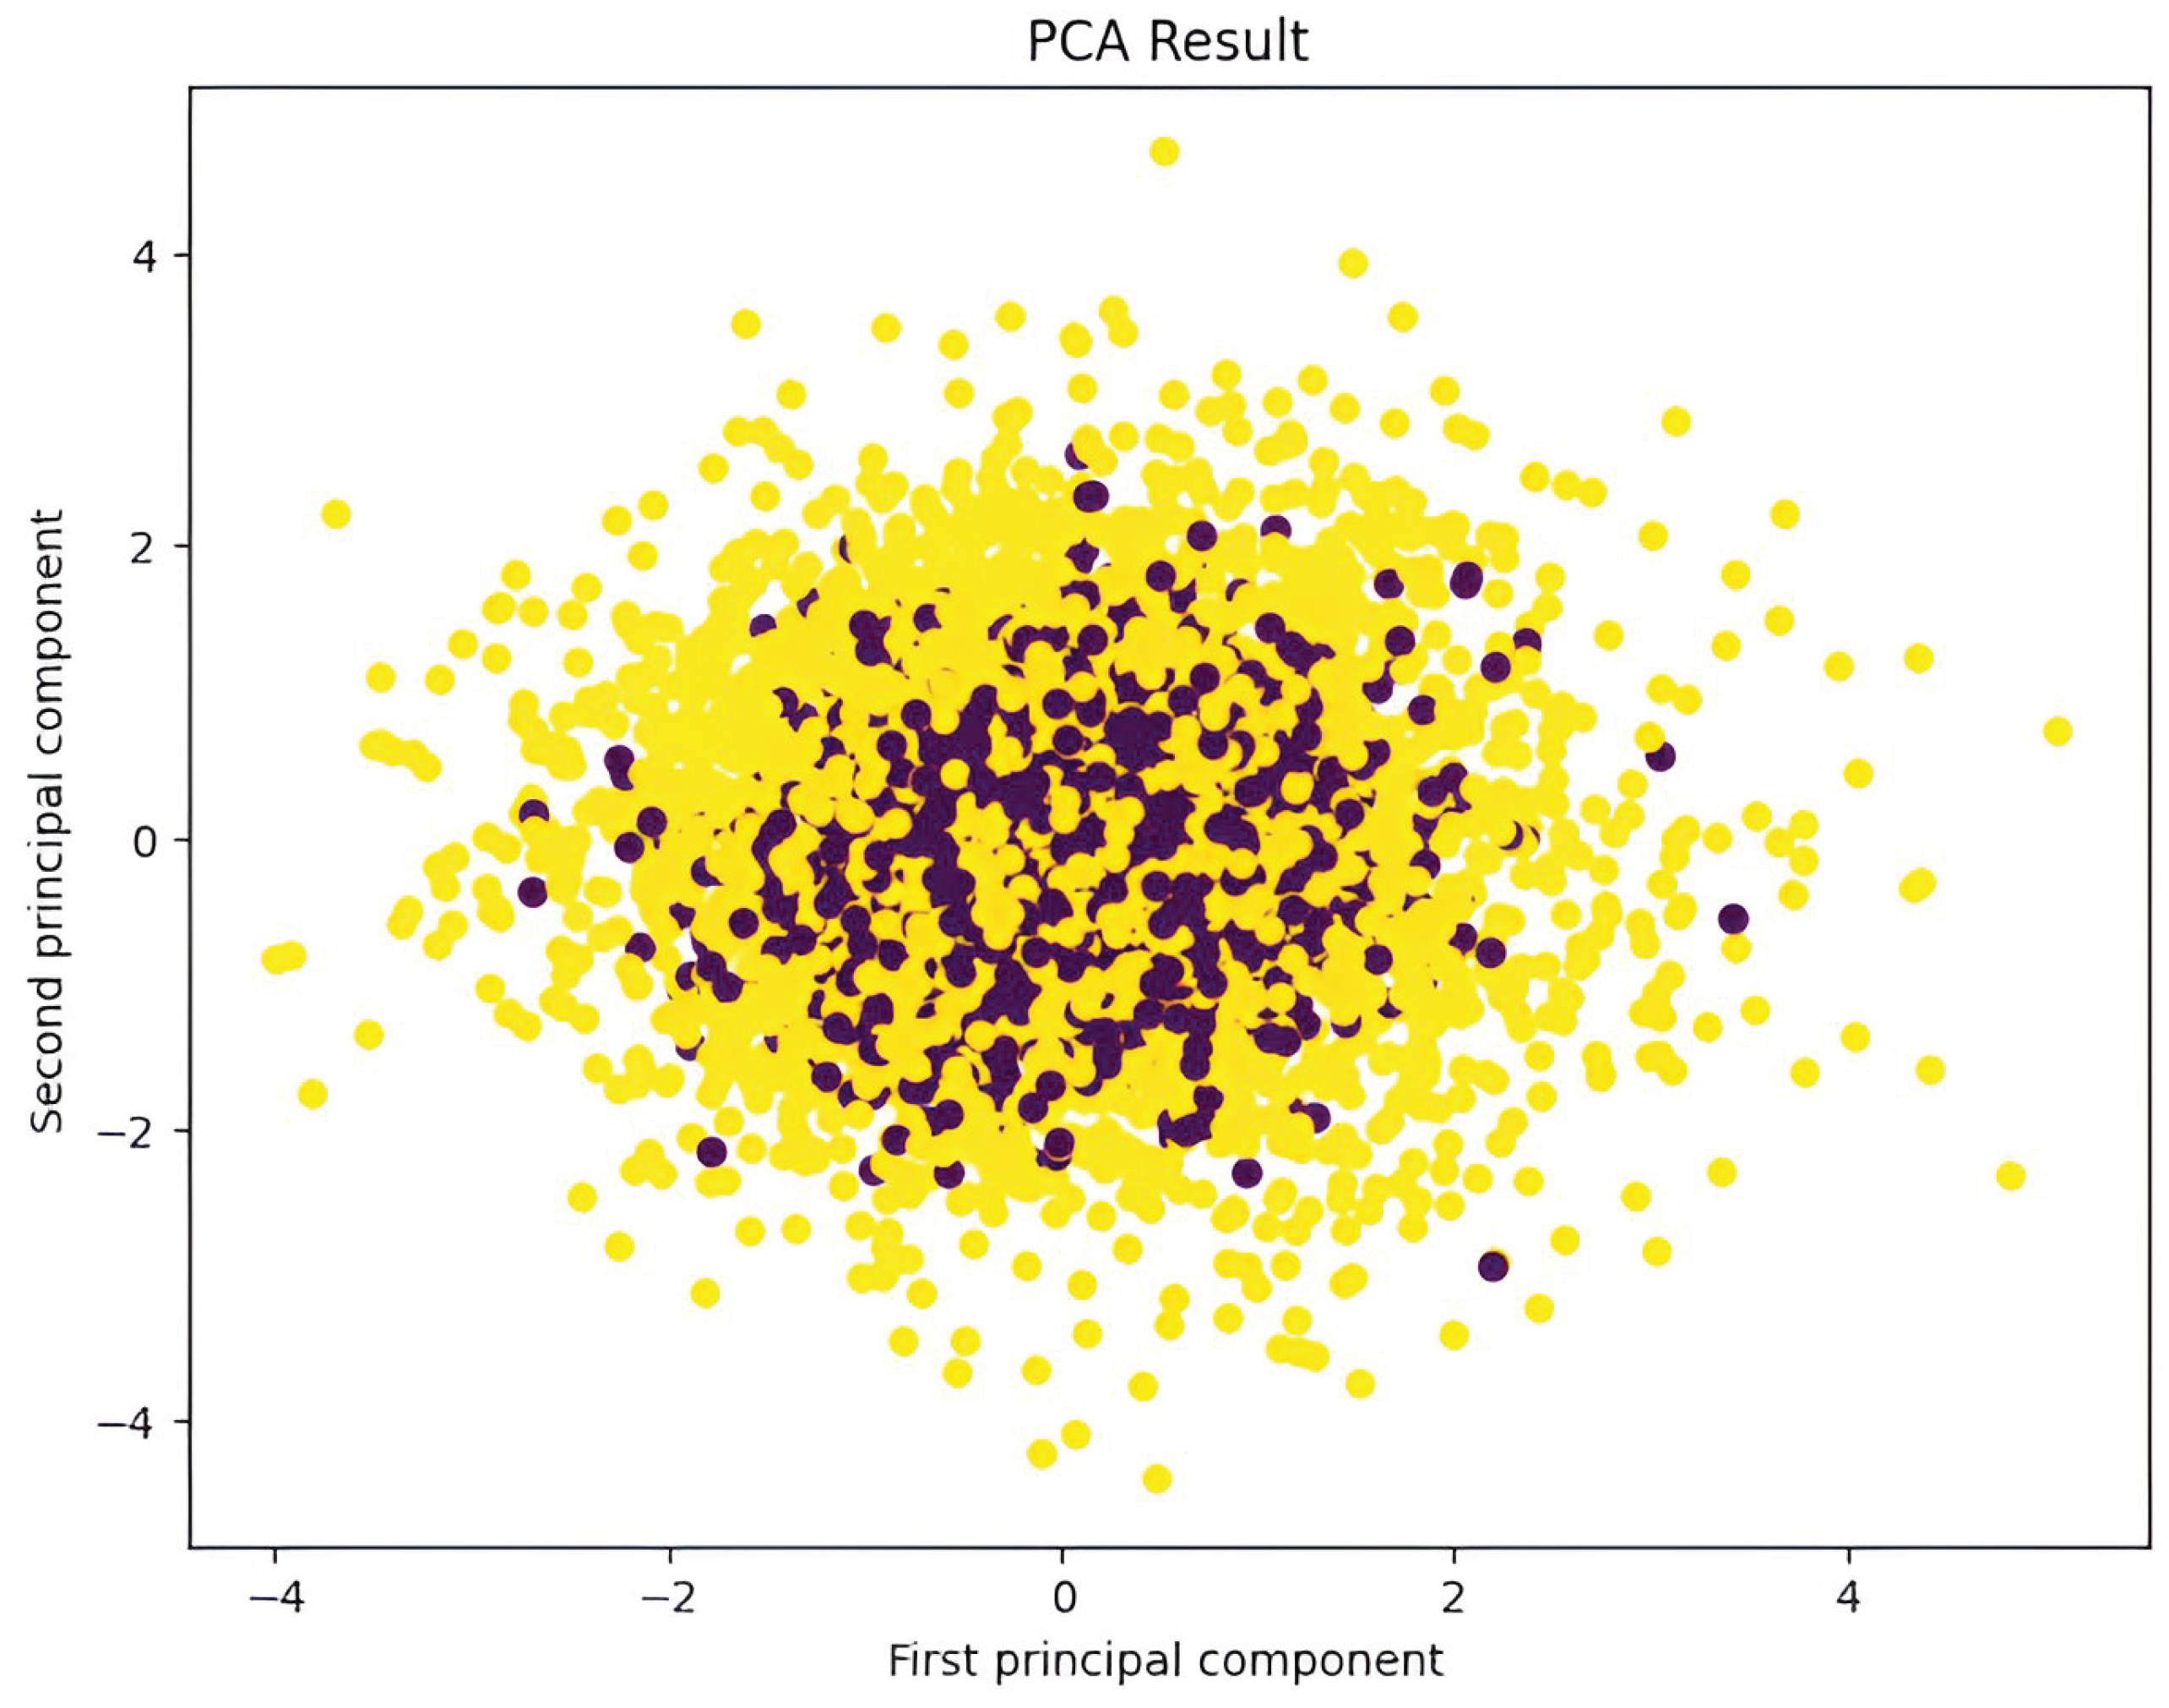
Principal Component Analysis (PCA) was used as an exploratory diagnostic tool to understand variance concentration and visualize separability between normal and anomalous states. The first two principal components captured approximately 95% of total variance, and the scatter plots showed clear clustering structure. Variables such as hydrogen flow rate, nitrogen flow rate, reactor temperature, and conversion efficiency contributed most strongly to the major components. Refer to Appendix A, Figures A3, A4, and A6 for detailed visual diagnostics and supporting analyses.
Figure 10.
Principal component analysis (PCA) projection of the dataset onto the first two principal components, illustrating the distribution and variance structure of the data in reduced dimensional space.
Figure 10.
Principal component analysis (PCA) projection of the dataset onto the first two principal components, illustrating the distribution and variance structure of the data in reduced dimensional space.
However, subsequent experiments showed that aggressive dimensionality reduction degraded classifier performance, and PCA was therefore not retained in the final training pipeline.
6.5. Assessment of Class Imbalance Using SMOTE
Class imbalance was assessed by experimenting with the Synthetic Minority Oversampling Technique (SMOTE). A Random Forest classifier was used to compare three configurations: baseline, SMOTE-augmented, and PCA-reduced datasets. SMOTE improved performance, while PCA-based reduction reduced discriminative capability. Refer to Appendix A, Table A1.
Figure 11.
Comparison of classification performance metrics (accuracy, precision, recall, and F1-score) for Random Forest models under baseline, SMOTE-based class balancing, and PCA-based dimensionality reduction configurations.
Figure 11.
Comparison of classification performance metrics (accuracy, precision, recall, and F1-score) for Random Forest models under baseline, SMOTE-based class balancing, and PCA-based dimensionality reduction configurations.
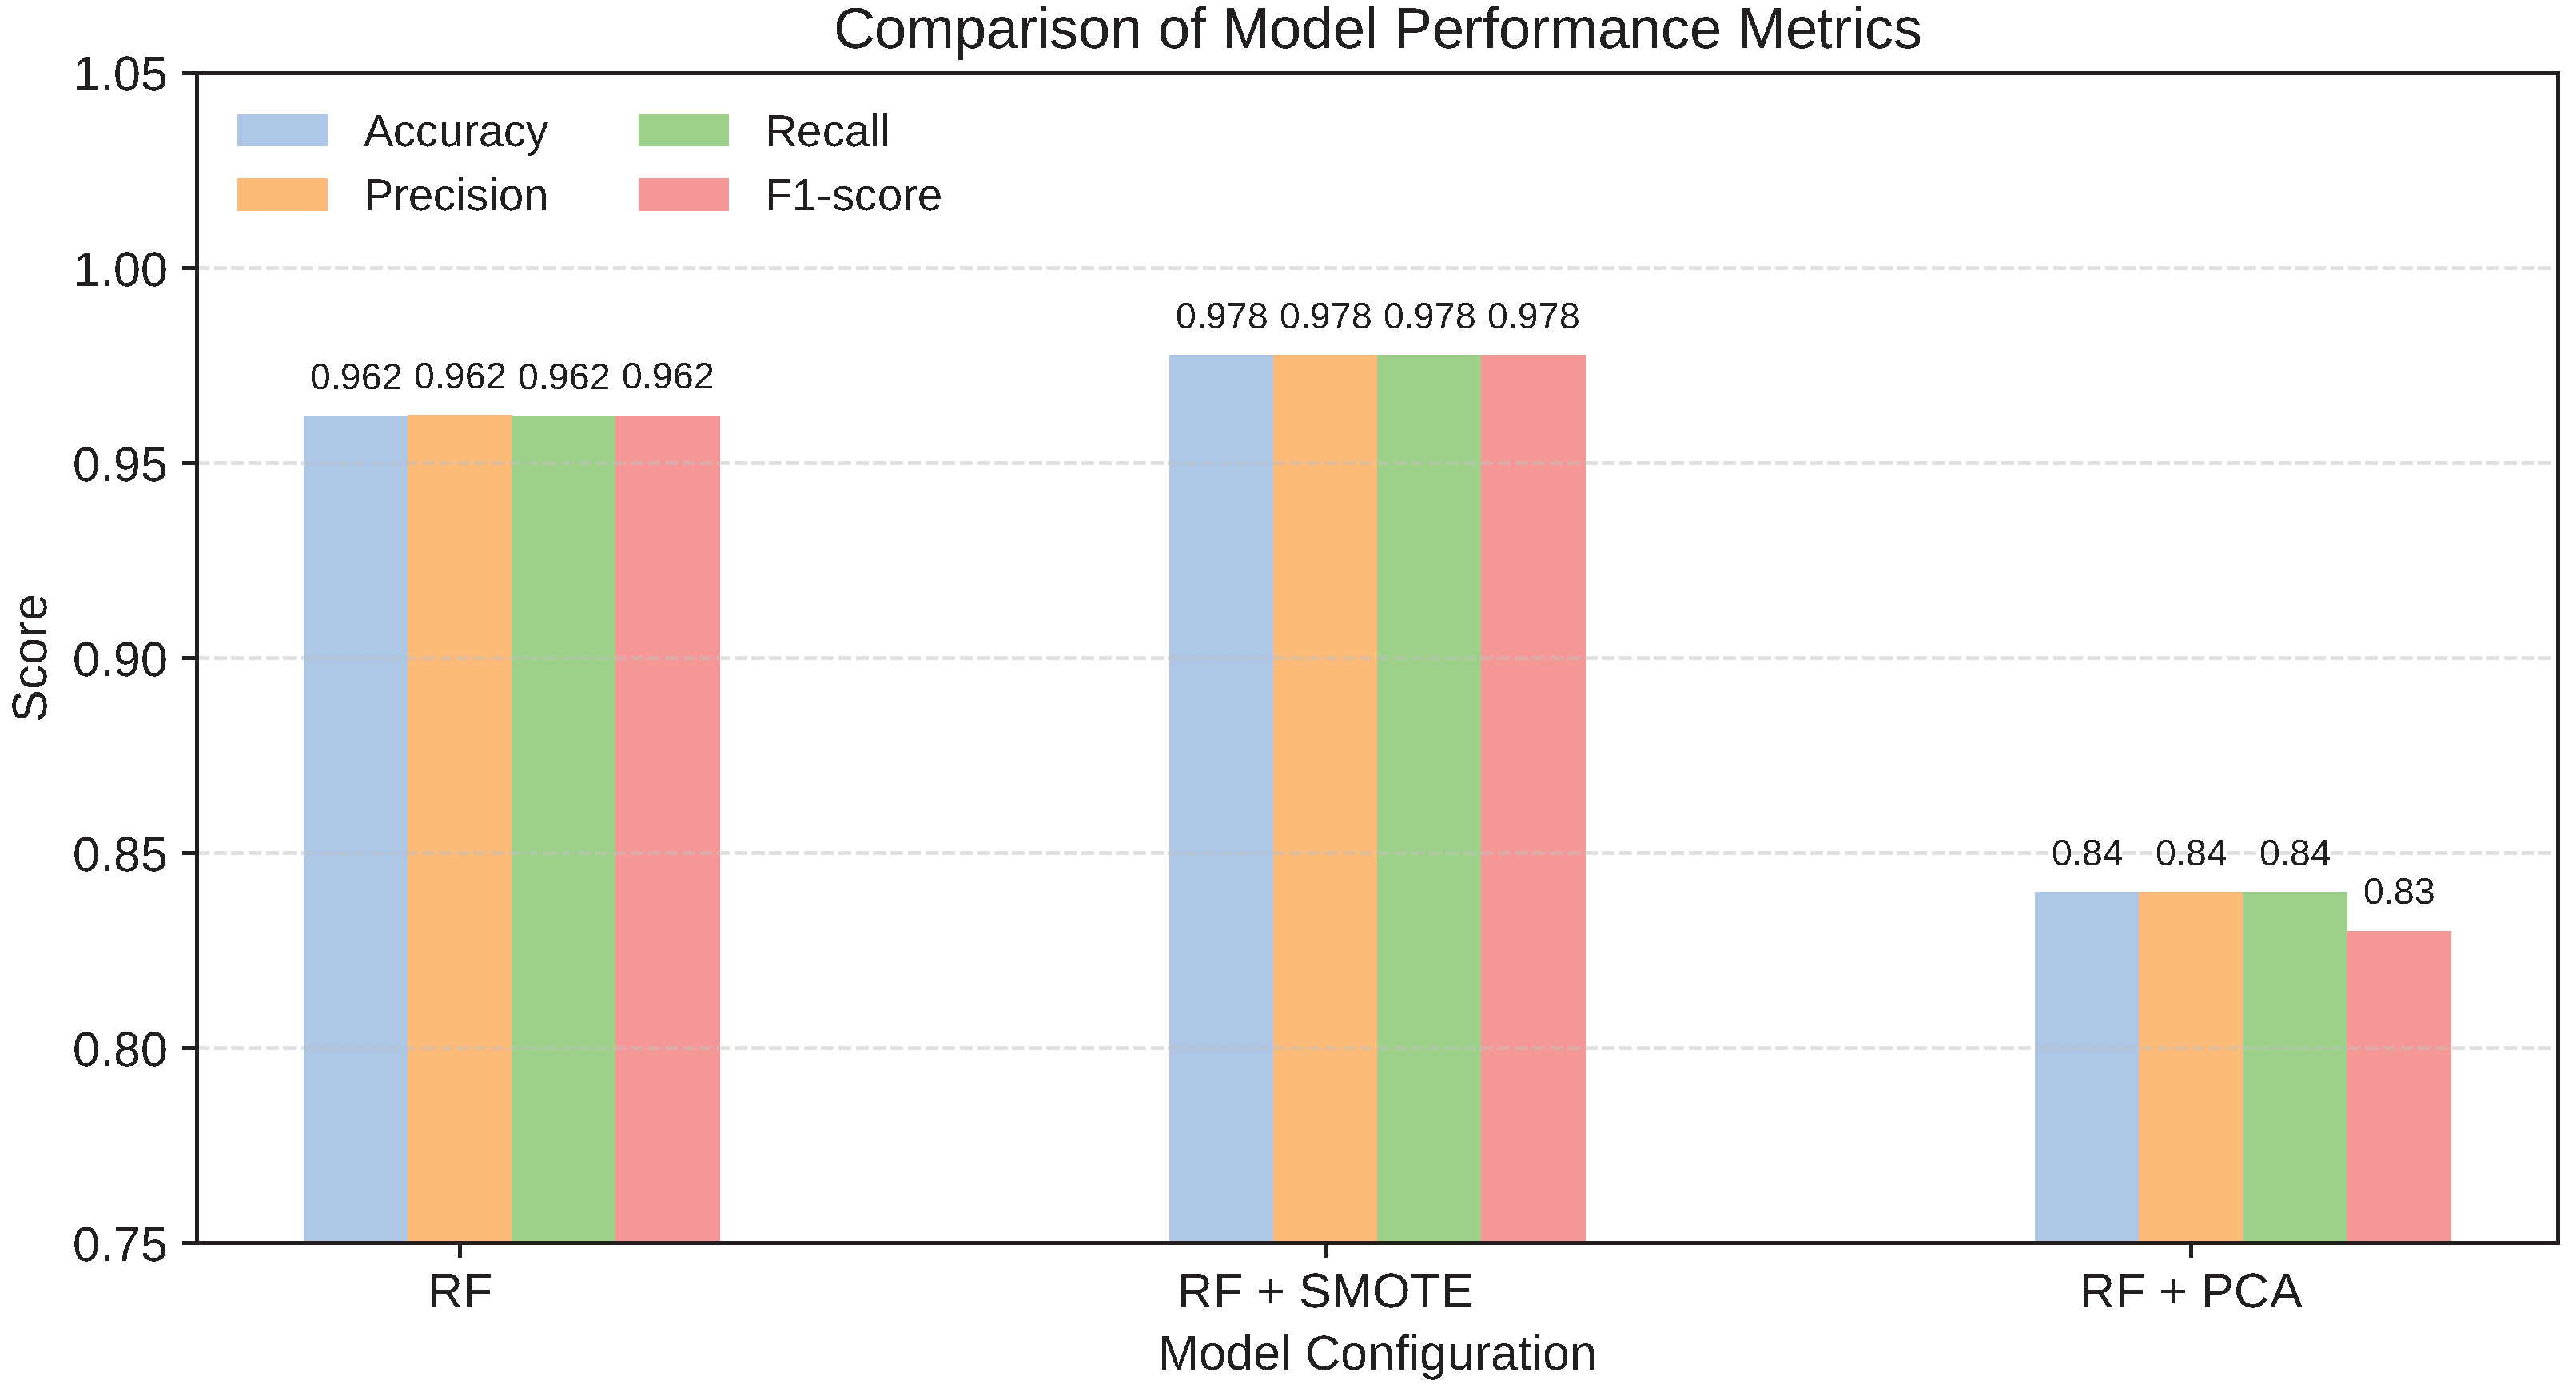
Figure 12.
Confusion matrices for Random Forest classifiers trained under different preprocessing strategies, illustrating the impact of class balancing (SMOTE) and dimensionality reduction (PCA) on prediction outcomes.
Figure 12.
Confusion matrices for Random Forest classifiers trained under different preprocessing strategies, illustrating the impact of class balancing (SMOTE) and dimensionality reduction (PCA) on prediction outcomes.
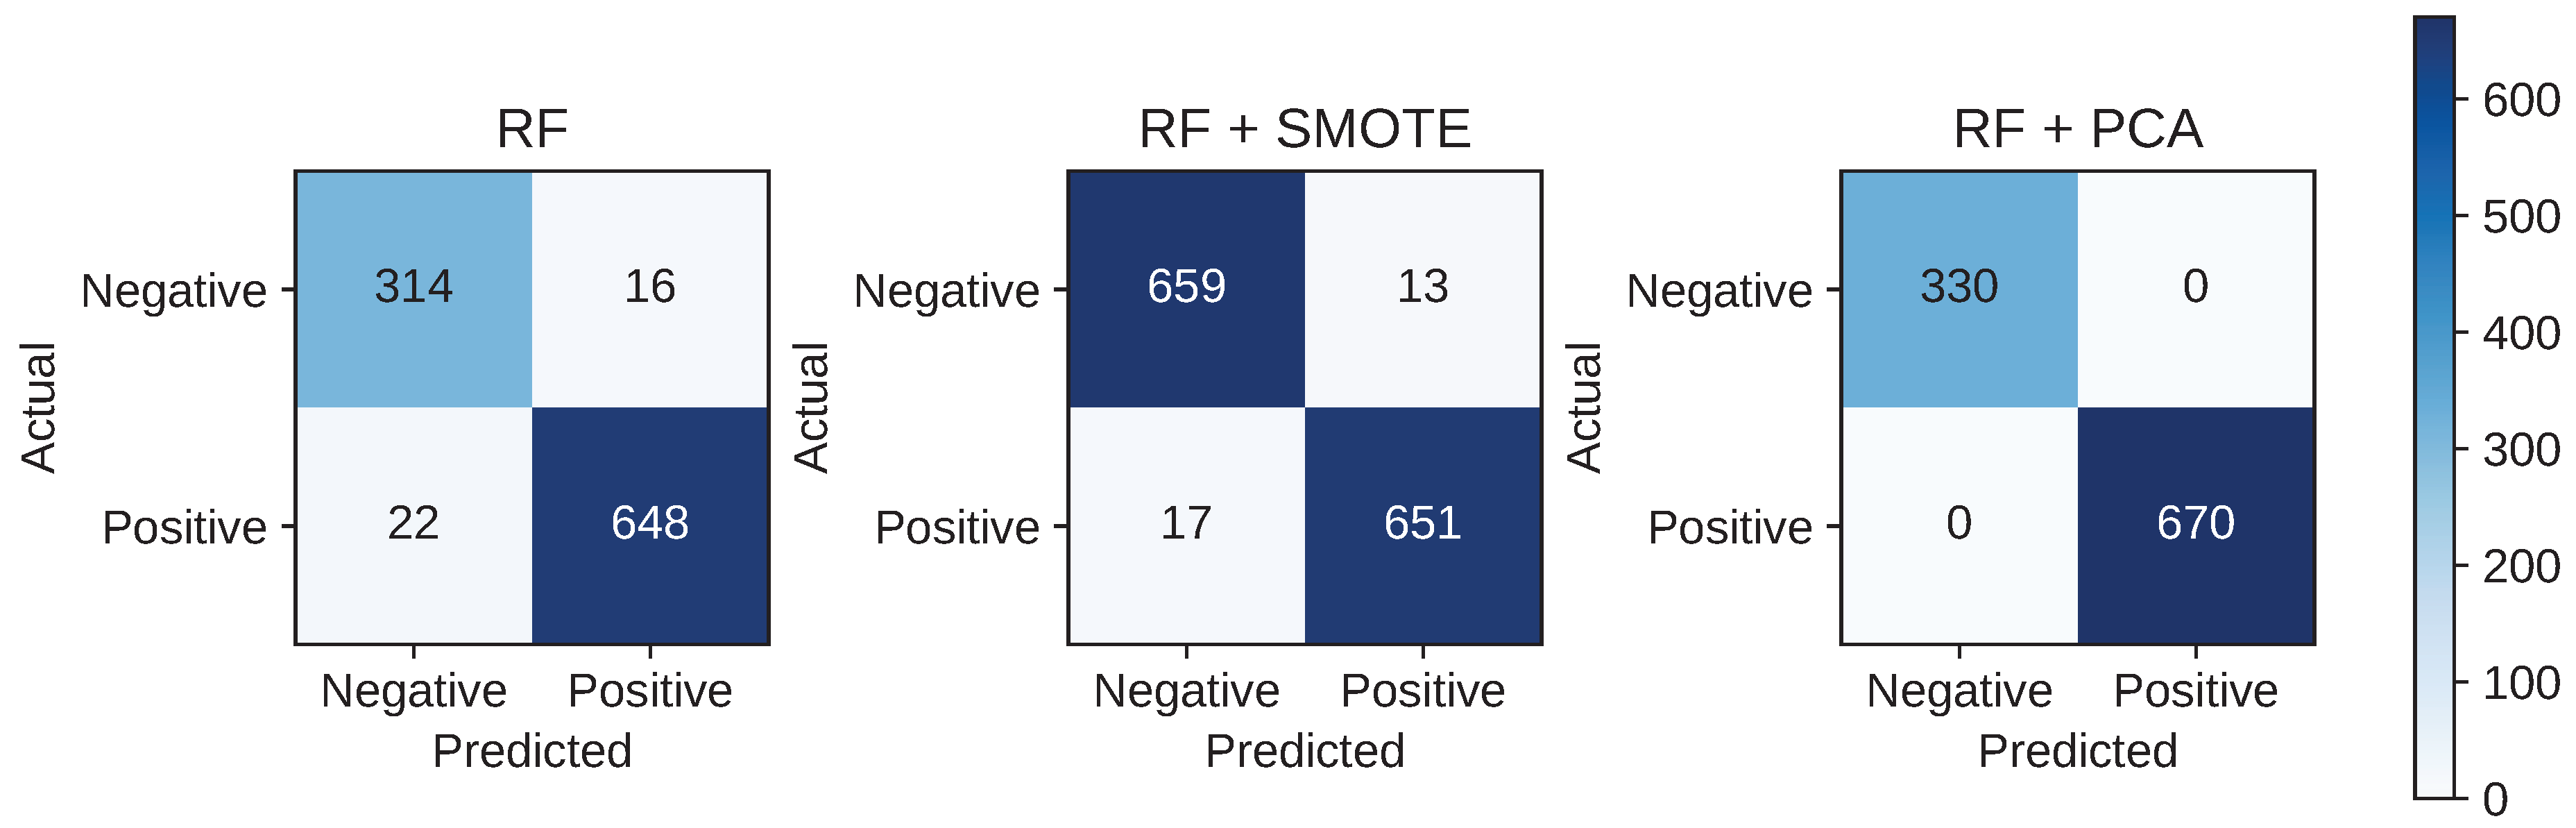
These results reinforced the decision to retain full-dimensional features and avoid PCA-based reduction.
6.6. Model Training for Anomaly Detection
Several classification models were trained and evaluated, including Logistic Regression, Random Forest, MLP, XGBoost, and LightGBM. All models used scaled features, imputed values, and consistent train–test partitions. Performance metrics included accuracy, precision, recall, F1-score, ROC–AUC, and confusion matrix analysis.
Table 8.
Comparative performance of anomaly detection models evaluated on the Haber–Bosch dataset.
| Model | Accuracy (%) | Precision (0/1) | Recall (0/1) | F1-score (0/1) | ROC–AUC | Confusion Matrix |
|---|---|---|---|---|---|---|
| Random Forest | 95.73 | 0.93 / 0.97 | 0.94 / 0.97 | 0.94 / 0.97 | 0.9526 | |
| Logistic Regression | 66.40 | 0.46 / 0.69 | 0.14 / 0.92 | 0.22 / 0.79 | 0.5304 | |
| MLP Classifier | 86.73 | 0.81 / 0.90 | 0.78 / 0.91 | 0.80 / 0.90 | 0.8461 | |
| XGBoost | 93.86 | 0.90 / 0.96 | 0.92 / 0.95 | 0.91 / 0.95 | 0.9335 | |
| LightGBM | 97.86 | 0.94 / 1.00 | 1.00 / 0.97 | 0.97 / 0.98 | 0.9836 |
Metrics are reported for class 0 (normal) and class 1 (anomaly), respectively.
LightGBM delivered the strongest performance across all metrics, combining accuracy, sensitivity, and computational efficiency. This aligns with recent findings on ensemble methods for industrial anomaly detection [49], where gradient boosting approaches consistently outperform baseline classifiers in process monitoring applications.
6.7. Model Explainability Using SHAP
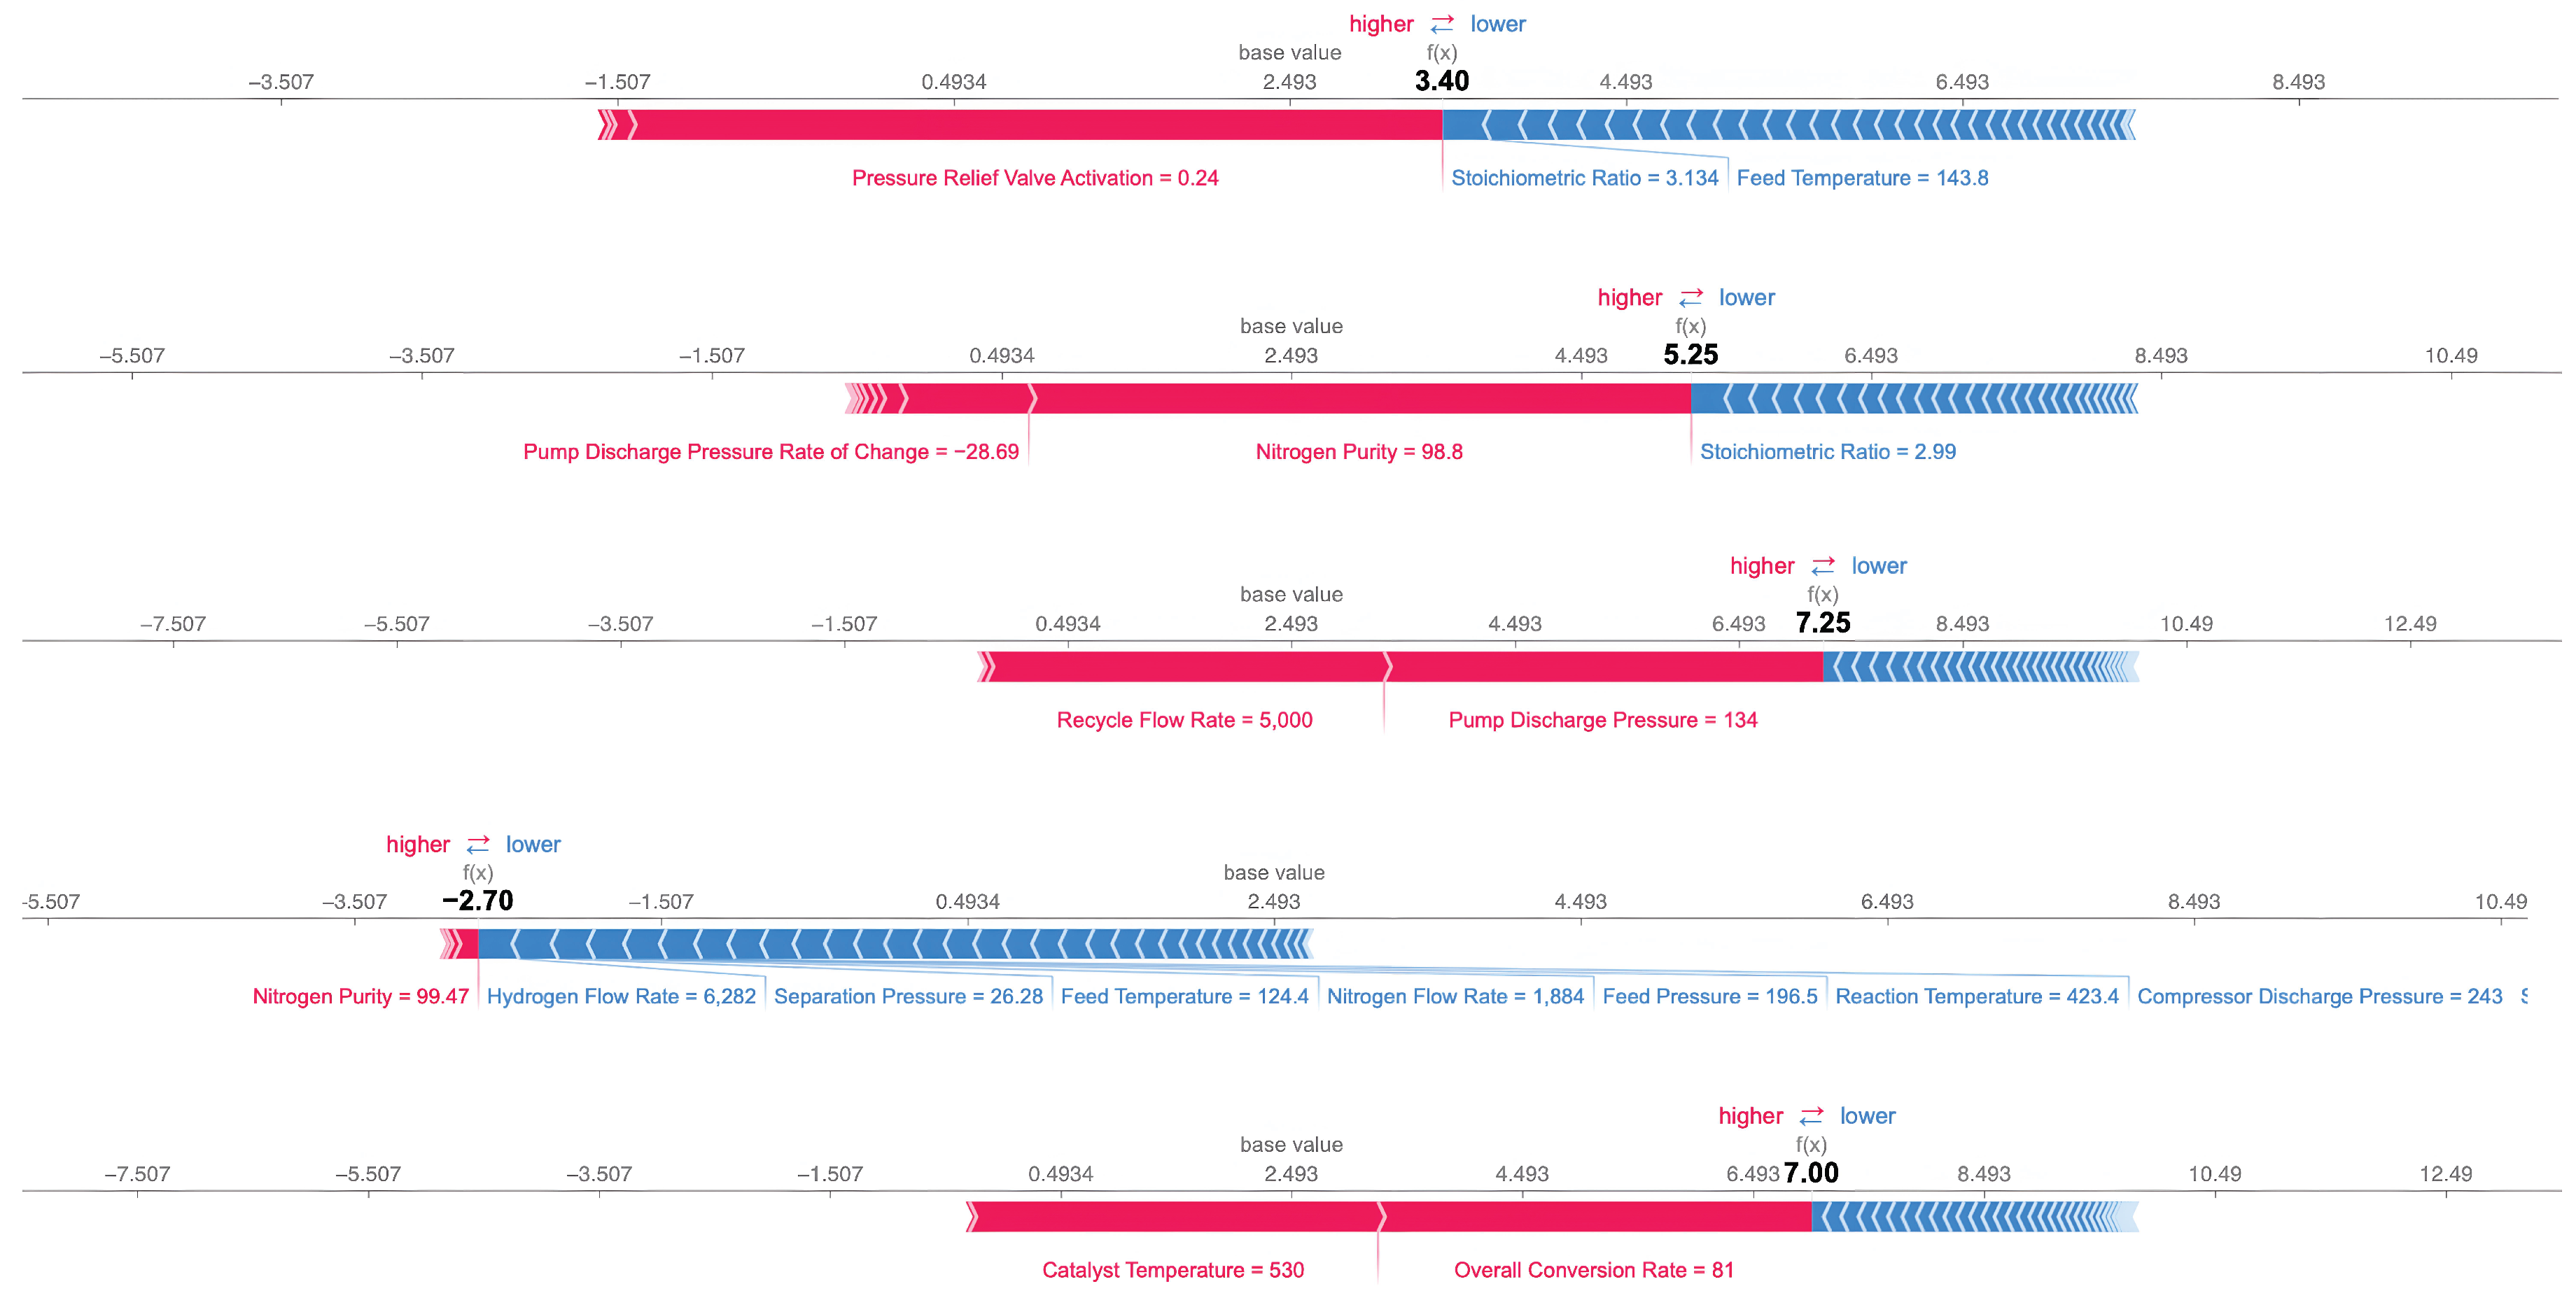
Model interpretability was ensured using SHAP (SHapley Additive exPlanations) values [65]. SHAP analysis identified stoichiometric ratio, hydrogen flow, reactor temperature, compressor discharge pressure, and catalyst-related attributes as dominant predictors. Local force plots for several instances highlighted how specific feature values pushed predictions toward normal or anomalous classifications, reinforcing both model transparency and alignment with domain knowledge [13,35]. Recent comparative studies have evaluated various explainability methods for industrial AI applications [35], emphasizing the importance of interpretability in safety-critical systems.(see Appendix A, Figure A7 and Algorithm A1)
Figure 13.
Local SHAP (SHapley Additive exPlanations) analysis illustrating feature level contributions to individual model predictions, showing how process variables positively or negatively influence the predicted outcome relative to the baseline value.
Figure 13.
Local SHAP (SHapley Additive exPlanations) analysis illustrating feature level contributions to individual model predictions, showing how process variables positively or negatively influence the predicted outcome relative to the baseline value.
6.8. Hyperparameter Tuning and Cross-Validation
Random Forest and LightGBM were further refined using Grid Search and k-fold cross-validation. Parameters such as depth, learning rate, number of estimators, and leaf size were systematically explored. Cross-validation ensured generalizable performance and reduced overfitting risk.
| Algorithm 1 Grid Search–Based Hyperparameter Optimization for Classification Models |
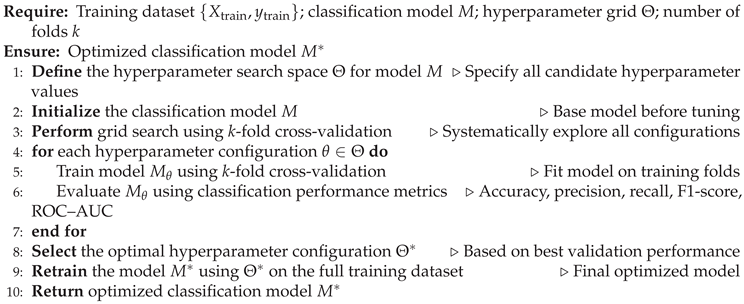 |
Table 9.
Best tuned classification models with corresponding accuracy, ROC–AUC and confusion matrices.
Table 9.
Best tuned classification models with corresponding accuracy, ROC–AUC and confusion matrices.
| Algorithm | Best Parameters | Accuracy | ROC-AUC | Confusion Matrix |
|---|---|---|---|---|
| Random Forest | bootstrap=False, max_depth=None, | |||
| min_samples_leaf=1, min_samples_split=5, | ||||
| n_estimators=300 | 0.964 | – | ||
| LightGBM (Grid) | feature_fraction=1.0, learning_rate=0.05, | |||
| max_depth=10, min_data_in_leaf=20, | ||||
| n_estimators=300, num_leaves=50 | 0.978 | 0.9847 | ||
| LightGBM (Manual) | feature_fraction=1.0, learning_rate=0.05, | |||
| max_depth=30, min_data_in_leaf=20, | ||||
| n_estimators=200, num_leaves=31 | 0.9787 | 0.9854 |
LightGBM consistently required fewer parameters while outperforming deeper ensembles, confirming its suitability as the final anomaly detection engine. The hyperparameter search space used for grid search optimization is detailed in Appendix A, Table A2.
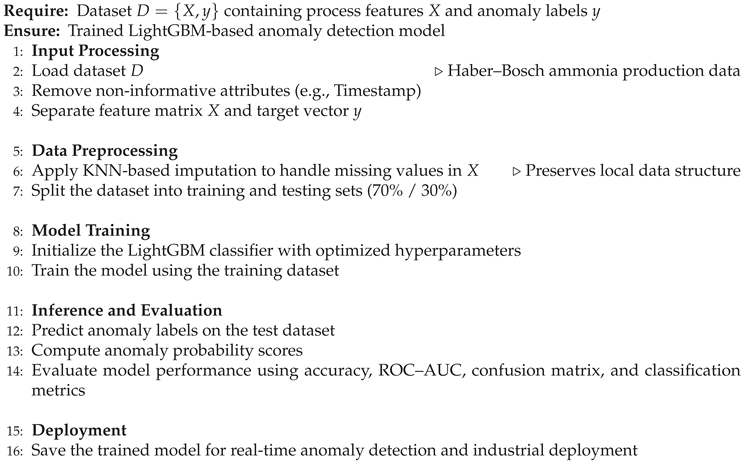
6.9. Final Model Selection
Based on accuracy, robustness, interpretability, and computational efficiency, LightGBM was selected as the primary anomaly detection model within ChemSafeAI+. Its low false-positive rate, high recall for critical anomalies, and well-behaved feature attributions make it suitable for real-time industrial deployment.
| Algorithm 2 LightGBM-Based Anomaly Detection for Ammonia Production |
 |
6.10. Final Operational Evaluation
A held-out dataset containing 40 operational features was used to validate the model on realistic process snapshots. LightGBM successfully detected multiple unsafe conditions, particularly those associated with elevated temperatures, unusual rate-of-change patterns, and catalyst degradation indicators.
Table 10.
Representative anomaly detection outcomes on operational process data with predicted class labels and associated probabilities.
Table 10.
Representative anomaly detection outcomes on operational process data with predicted class labels and associated probabilities.
| Row | Operational Data Highlights | Prediction | Probability | Interpretation |
|---|---|---|---|---|
| 1 |
|
Normal | 0.074 | All operating variables remain within stable and expected ranges. |
| 2 |
|
Anomalous | 0.999 | Excessive reaction temperature indicates potential thermal instability. |
| 3 |
|
Anomalous | 0.999 | Abnormal pressure dynamics suggest unstable process behaviour. |
| 4 |
|
Anomalous | 0.983 | Rapid thermal gradients indicate developing abnormal conditions. |
| 5 |
|
Anomalous | 0.990 | Elevated catalyst temperature highlights increased operational risk. |
These results demonstrate that the model reliably differentiates between safe and unsafe conditions and provides well-calibrated probability estimates for operator decision support.
7. Predictive Modelling for Process Forecasting
To support process optimization and proactive control, regression models were developed to forecast ammonia production, conversion efficiency, and emissions. The dataset contained key operational parameters including reactant flow rates, pressure, temperature, and catalyst specifications. Categorical features were encoded, and missing values were imputed using the mean of corresponding target variables.
7.1. Model Training and Evaluation
Regression models such as Random Forest, Gradient Boosting, SVR, KNN, and XGBoost were trained separately for each target. Performance was evaluated using and Mean Squared Error (MSE), where higher and lower MSE indicate superior predictive accuracy.
| Algorithm 3 Multi-Target Regression Model Training and Evaluation |
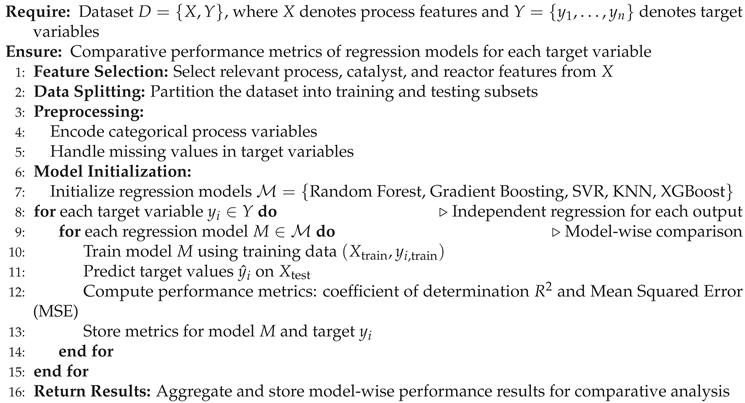 |
Figure 14.
Heatmap of coefficient of determination (R²) scores across regression targets and models, highlighting variations in explanatory power and predictive performance.
Figure 14.
Heatmap of coefficient of determination (R²) scores across regression targets and models, highlighting variations in explanatory power and predictive performance.
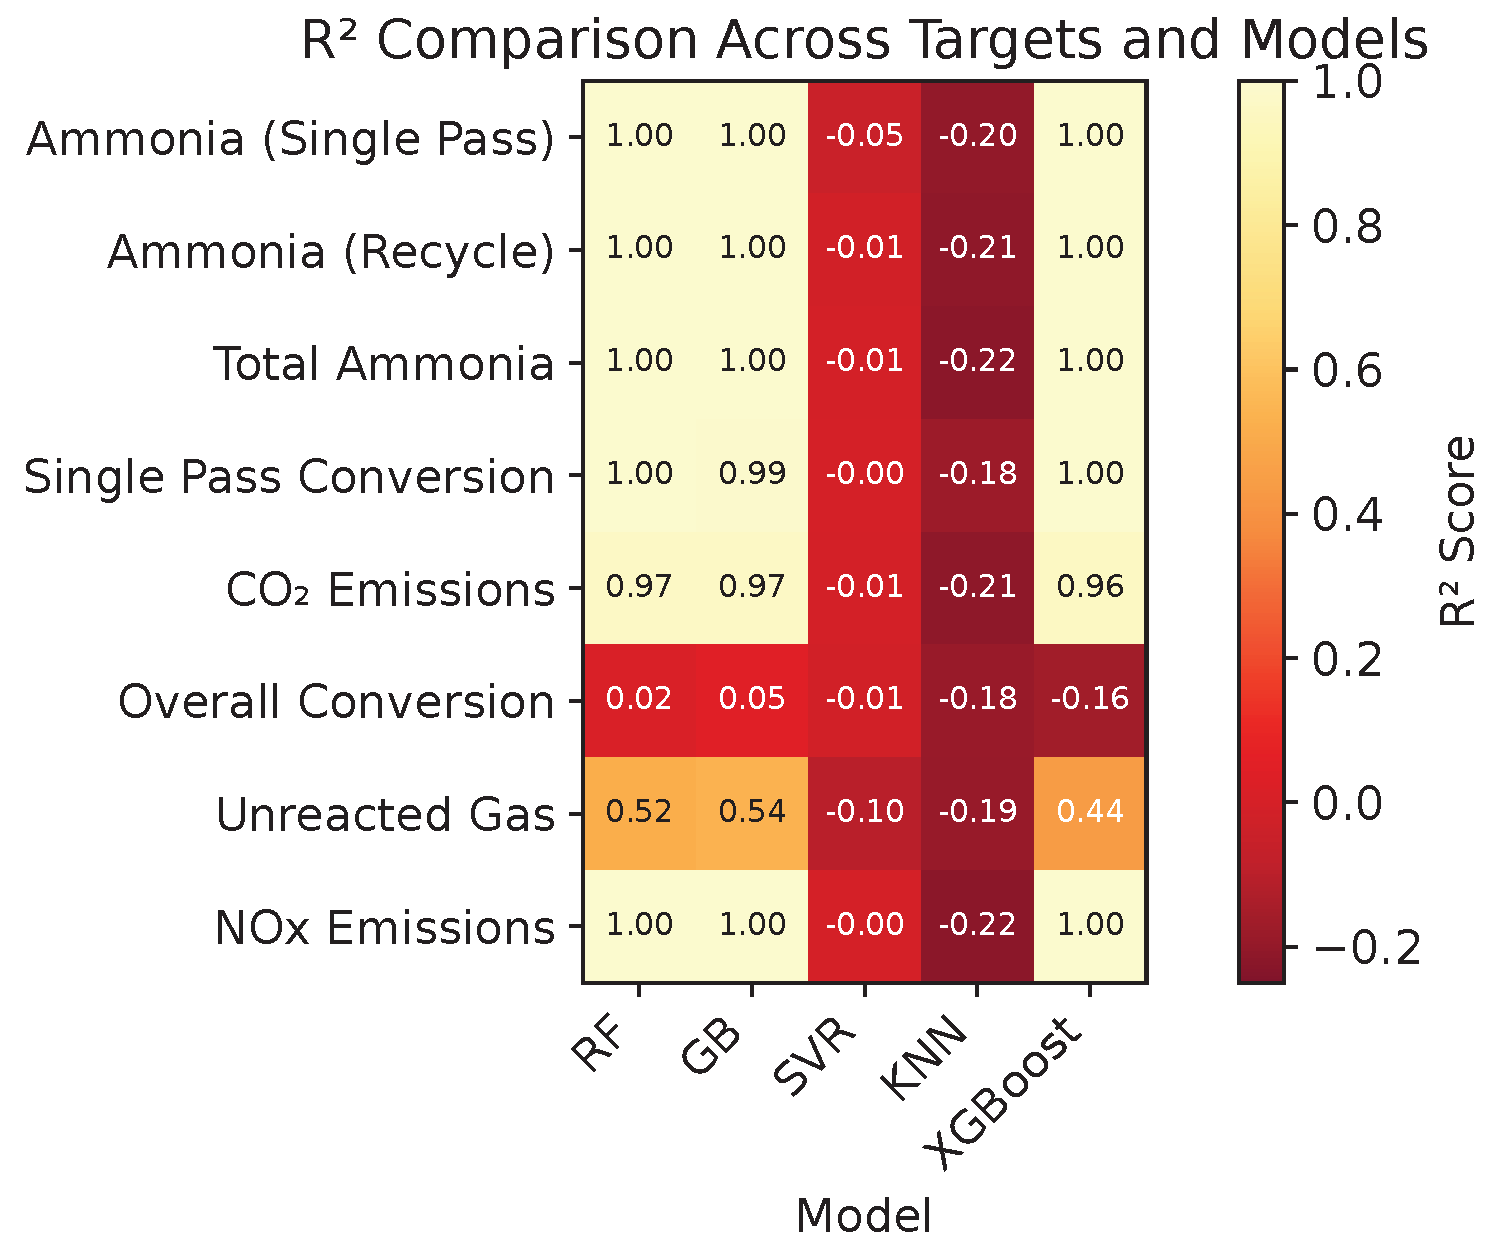
Figure 15.
Comparative evaluation of regression model performance using error based and goodness of fit metrics across multiple process targets.
Figure 15.
Comparative evaluation of regression model performance using error based and goodness of fit metrics across multiple process targets.
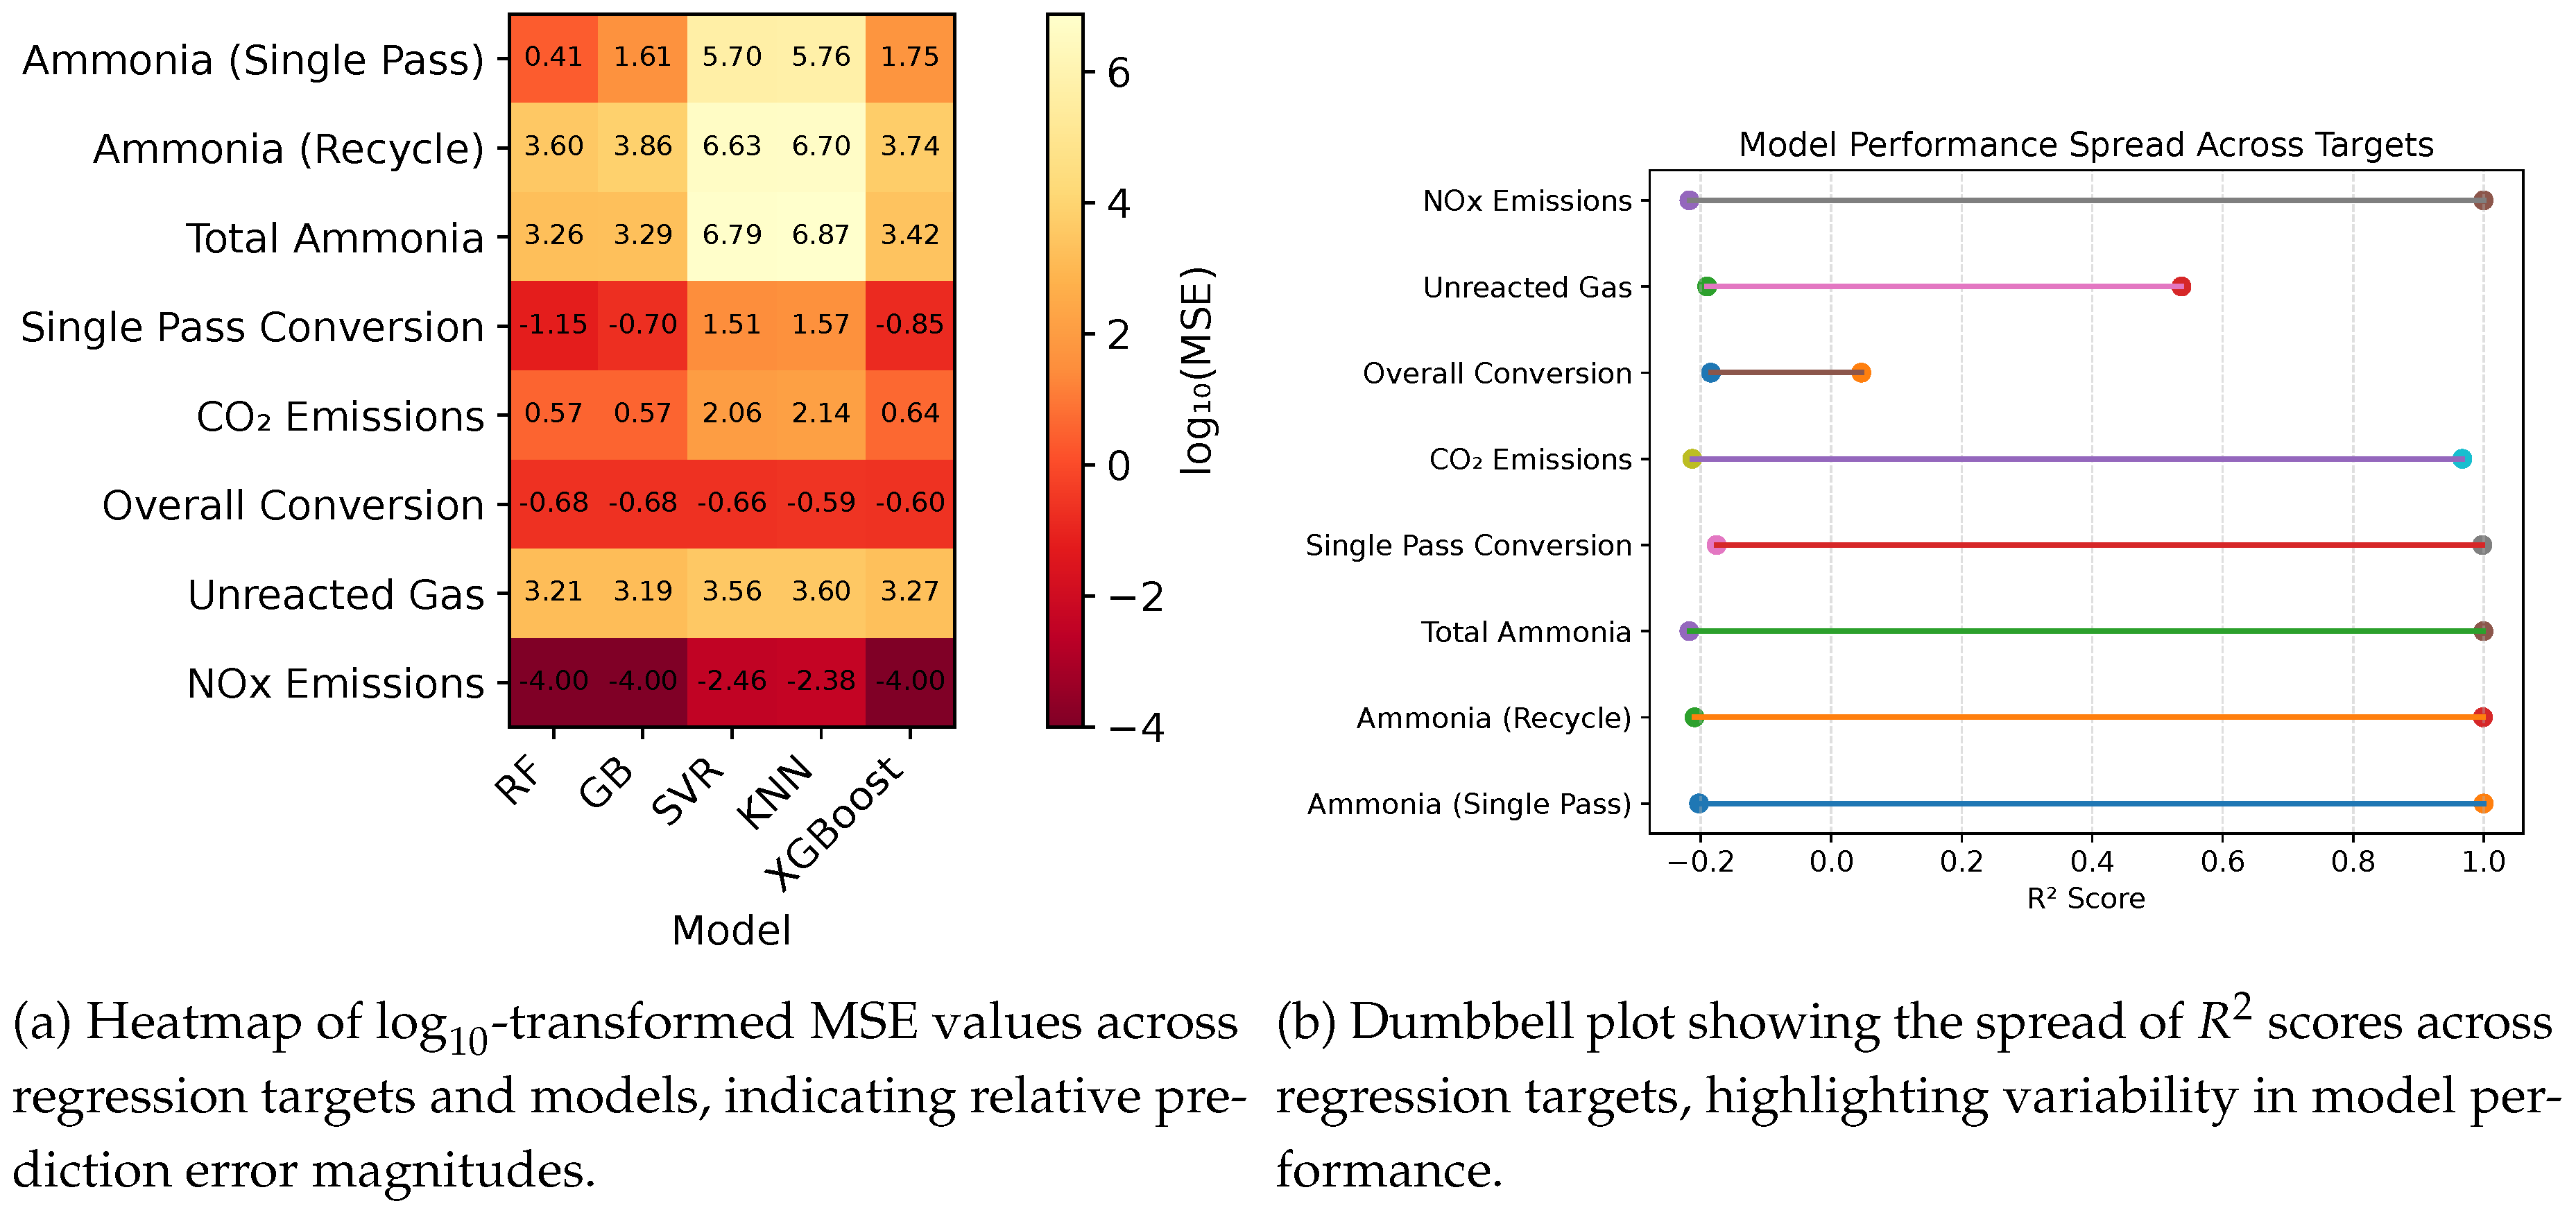
Random Forest and XGBoost consistently delivered the strongest results across most targets, while SVR and KNN struggled with nonlinear dynamics. Emission prediction models showed high reliability, with Random Forest and Gradient Boosting performing particularly well.
7.2. Testing and Results
Predictions generated on representative operational data demonstrate the regression model’s ability to forecast key outputs:
Table 11.
Predicted key process outputs generated by the trained regression models for representative operational conditions.
Table 11.
Predicted key process outputs generated by the trained regression models for representative operational conditions.
| Prediction Parameter | Value |
|---|---|
| CO2 Emissions (tons/hr) | 15.1778 |
| Ammonia Produced (Single Pass) (kmol/hr) | 1013.1274 |
| Ammonia Produced (Recycle) (kmol/hr) | 2609.6114 |
| Total Ammonia Produced (kmol/hr) | 3569.5205 |
| NOx Emissions (tons/hr) | 0.0850 |
The predictive workflow is effective but will benefit from additional refinement before full deployment within ChemSafeAI+ as a real-time forecasting module. For test data, refer to Table A5 in Appendix A.
8. Optimization Modelling for the Haber–Bosch Process
An optimization workflow was developed to enhance ammonia production while reducing environmental emissions [41,42]. The dataset contained 32 process features, including flow rates, temperatures, pressures, purities, and reactor configuration parameters, along with four targets: overall conversion, total ammonia produced, CO2 emissions, and NOx emissions. Recent advances in multi-objective optimization [41] and real-time process optimization [42] have demonstrated significant improvements in both safety and efficiency.
8.1. Optimization Pipeline Architecture
Preprocessing was performed using a ColumnTransformer to treat numerical and categorical features separately. Numerical variables were imputed using mean values and scaled using StandardScaler. Categorical variables were imputed using the most frequent value and encoded via OneHotEncoder.
A unified pipeline was constructed with a RandomForestRegressor trained on an 80/20 split. The resulting model demonstrated strong generalizability across all targets.
8.2. Bayesian Optimization for Process Enhancement
Bayesian optimization was employed to search the operating space while enforcing key constraints:
- Stoichiometric N2:H2 ratio maintained at 1:3.
- Inert gas flow limited to 1% of total flow.
- Twelve operational variables explored, including temperature (670–823.15 K), pressure (200–300 bar), cooling water temperatures, and reactor parameters.
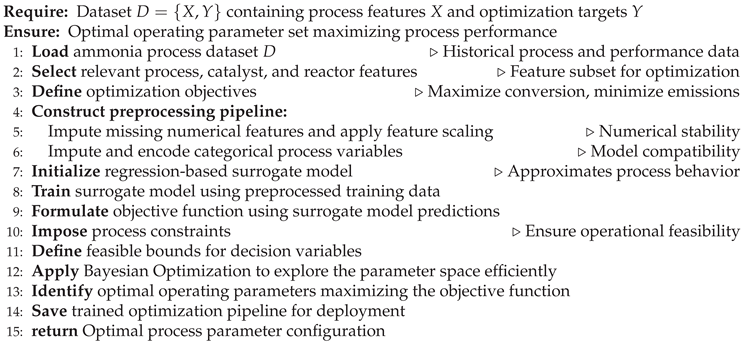
The objective function sought to maximize ammonia conversion while minimizing CO2 emissions. Ten random initialization points and twenty guided iterations were used, following established Bayesian optimization practices [66]. The final pipeline was serialized for deployment, enabling real-time optimization capabilities [41,42]. Decision variable bounds used for Bayesian optimization (refer to Appendix A, Table A3).
| Algorithm 4 Optimization Model Training Using Bayesian Optimization |
 |
8.3. Optimization Results
Representative optimized conditions are summarized below, demonstrating improvements across flow rates, thermal conditions, separation parameters, and reaction kinetics.
Table 12.
Comparison of optimized and baseline operating conditions for the Haber–Bosch ammonia synthesis process.
Table 12.
Comparison of optimized and baseline operating conditions for the Haber–Bosch ammonia synthesis process.
| Parameter | Previous Data | Optimized Data | Notes |
|---|---|---|---|
| N2 Flow (kmol/hr) | 1942.12 | 1875.47 | Ratio-adjusted |
| H2 Flow (kmol/hr) | 5559.75 | 5626.40 | Ratio-adjusted |
| Inert Gas Flow (kmol/hr) | 36.00 | 75.02 | Set to 1% of total flow |
| Temperature (K) | 450.53 | 717.74 | Optimized |
| Pressure (bar) | 186.35 | 290.93 | Optimized |
| Nitrogen Purity (%) | 99.62 | 99.51 | Optimized |
| Hydrogen Purity (%) | 99.89 | 99.89 | Optimized |
| Feed Pressure (bar) | 300.00 | 184.21 | Optimized |
| Feed Temperature (K) | 143.90 | 566.02 | Optimized |
| Cooling Water Temp IN (∘C) | 30.0 | 26.09 | Optimized |
| Cooling Water Temp OUT (∘C) | – | 40.98 | Optimized |
| Separation Temperature (K) | -32.78 | 246.38 | Optimized |
| Separation Pressure (bar) | 24.53 | 188.82 | Optimized |
| HX Outlet (∘C) | 14.41 | 10.49 | Optimized |
| (m2/s) | – | Adjusted | |
| Equilibrium Constant | – | 0.00749 | Adjusted |
| – | Adjusted | ||
| – | Adjusted | ||
| P_N2 (bar) | – | 45.60 | Adjusted |
| P_H2 (bar) | – | 136.79 | Adjusted |
| Volumetric Flow Rate (m3/hr) | – | 5594.72 | Adjusted |
| Total Heat Generated (kJ/hr) | – | Optimized |
The optimized configuration highlights significant potential for improved ammonia production efficiency and reduced environmental impact, demonstrating the value of integrated predictive modelling and Bayesian optimization within industrial process systems.
9. System Architecture and Technologies
This section introduces the AI-driven dynamic safety framework developed for ChemSafeAI+, designed to enable real-time monitoring, early fault detection, and predictive anomaly assessment in chemical process systems [12,25]. The framework integrates machine learning models, data pipelines, and a modular software architecture to support safety-critical decision-making [17,23]. It provides an overview of the complete technology stack-including frontend, backend, database, machine learning engines, and deployment workflow-forming the foundation for the detailed system components described in subsequent subsections [14,15].
9.1. Project Structure and Technologies Used
The ChemSafeAI+ platform follows a three-tier architecture consisting of the frontend, backend, and database layers. This modular design ensures scalability, maintainability, and clear separation of responsibilities across the system [15,45]. Recent advances in edge AI [25] and federated learning architectures [38] have further enhanced the scalability of such systems. Figure 16 illustrates the overall structure.
9.1.1. Frontend (React-Based)
The user interface is implemented using the React framework, following a component-driven architecture to ensure modularity and maintainability [45]. The frontend provides process visualization, anomaly feedback, optimization tools, and interactive simulation capabilities [13,47]. Recent work on human factors in AI-assisted systems [34] has informed the design of operator interfaces for safety-critical applications.
Key Components:
- Section1.js - Simulation and prediction interface for process inputs.
- Section2.js - Interactive charts and insights dashboard.
- Section3.js - Process optimization module.
- ProcessCard.js - Selectable process overview cards.
- ConsoleLog.js - Action logs and event tracking.
- ProcessDetail.js - Real-time monitoring and anomaly displays.
- App.js - Main application entry point for routing and authentication.
Frontend Technologies: React, React Router, Axios for API integration, CSS Modules for styling, DarkModeSwitch for UI customization, Session Storage for persistence, and React Hooks for state and lifecycle management.
9.1.2. Backend (Flask-Based)
The backend is implemented using Flask and structured using modular blueprints. It manages data ingestion, machine learning prediction pipelines, anomaly detection logic, optimization routines, and session management [12]. The system incorporates real-time processing capabilities [12,25] and robust detection mechanisms that handle sensor faults and missing data [23].
Core API Endpoints:
- /api/upload - Upload and parse CSV/Excel files.
- /api/generate-insights - Produce visual analytics and summaries.
- /api/optimize - Execute optimization routines.
- /api/predict - Model-based prediction services.
- /api/sessions - Persist and retrieve session-level data.
Backend Processing Features:
- Pandas for data cleaning and transformation.
- Plotly/Bokeh for interactive visualization.
- Machine learning inference using serialized models.
- Trend-based and threshold-based anomaly detection.
Backend Technologies: Flask, SQLAlchemy ORM, Pandas, Plotly/Bokeh, Joblib/Pickle for model serialization, LLM Used for insights, and SHAP for explainability.
9.1.3. Database (PostgreSQL)
The PostgreSQL database layer stores session history, user authentication details, process parameters, and detected anomalies. It ensures integrity, durability, and traceability for safety-critical applications.
Key Features:
- Session management - Storage of anomalies, warnings, and operational timelines.
- User authentication - Secure credential handling with hashed passwords.
- Relational consistency - Enforced through normalized schema design.
Technologies: PostgreSQL, SQLAlchemy, Werkzeug password hashing.
9.1.4. Machine Learning and Anomaly Detection Engine
The AI component of ChemSafeAI+ incorporates predictive modelling, anomaly classification, and explainability mechanisms based on historical and synthetic process data [10,31].
Key Features:
Technologies: LightGBM, RandomForest, XGBoost, SHAP, Joblib/Pickle for deployment.
9.1.5. DevOps and Deployment
The system is engineered for scalable deployment through containerization and version-controlled workflows.
Key Features:
- Docker-based containerization for consistent environments.
- Nginx reverse proxy for request routing and static asset delivery.
- Git/GitHub for collaborative development and version tracking.
Technologies: Docker, Nginx, Git/GitHub.
9.1.6. Authentication and Security
Robust authentication and secure communication protocols are implemented to safeguard sensitive industrial data [24].
Key Features:
- JWT for token-based authentication.
- CORS policies to control frontend-backend communication.
- HTTPS for encrypted data transfer.
- Password hashing using Werkzeug.
- Cybersecurity measures for industrial AI systems [24].
Technologies: JWT, Werkzeug, HTTPS, CORS.
9.1.7. Summary of Architectural Strengths
The full-stack architecture of ChemSafeAI+ delivers:
- Modularity - Reusable components and blueprints simplify extension.
- Scalability - Supports new processes, models, and visualization modules.
- Enhanced User Experience - Real-time feedback, interactive graphs, dark/light mode.
- Data Integrity - PostgreSQL ensures reliable persistence.
- High Performance - Optimized algorithms manage large process datasets.
- Security - Strong authentication and encrypted APIs.
Overall, the anomaly detection framework leverages a modern, production-ready technology stack-React, Flask, PostgreSQL, and machine learning engines-to deliver real-time monitoring, predictive analytics, and optimization capabilities for industrial chemical processes.
10. System Architecture and Project Flow
This section provides an integrated view of the ChemSafeAI+ system architecture, emphasizing its modular, scalable, and interoperable layout designed for industrial environments. The framework connects a React-based frontend, Flask backend, PostgreSQL database, and machine learning inference engine through well-defined APIs and secure authentication layers. This architecture enables real-time anomaly detection, visualization, and optimization while maintaining robustness and maintainability across the technology stack.
10.1. High-Level Architecture
The system follows a layered architecture in which each component operates independently yet seamlessly integrates with the others. The primary subsystems include:
- Frontend (React.js): Handles user interaction, visualization dashboards, dark/light mode, simulations, anomaly insights, and authentication workflows.
- Backend (Flask): Processes HTTP requests, executes model inference, generates insights, performs anomaly detection, manages sessions, and orchestrates optimization routines.
- Database (PostgreSQL): Stores user accounts, session history, anomaly logs, process parameters, and prediction records with strong consistency guarantees.
- Machine Learning Engine (LightGBM): Performs high-speed anomaly detection and regression-based prediction using trained models serialized with Joblib.
- API Layer (REST / WebSocket): Enables structured communication between the frontend and backend, supporting synchronous (REST) and real-time (WebSocket) updates.
- Authentication Module: Manages secure system access using JWT, password hashing, and CORS policies for controlled cross-origin communication.
Figure 17 illustrates the interaction between these layers and their roles in the ChemSafeAI+ ecosystem.
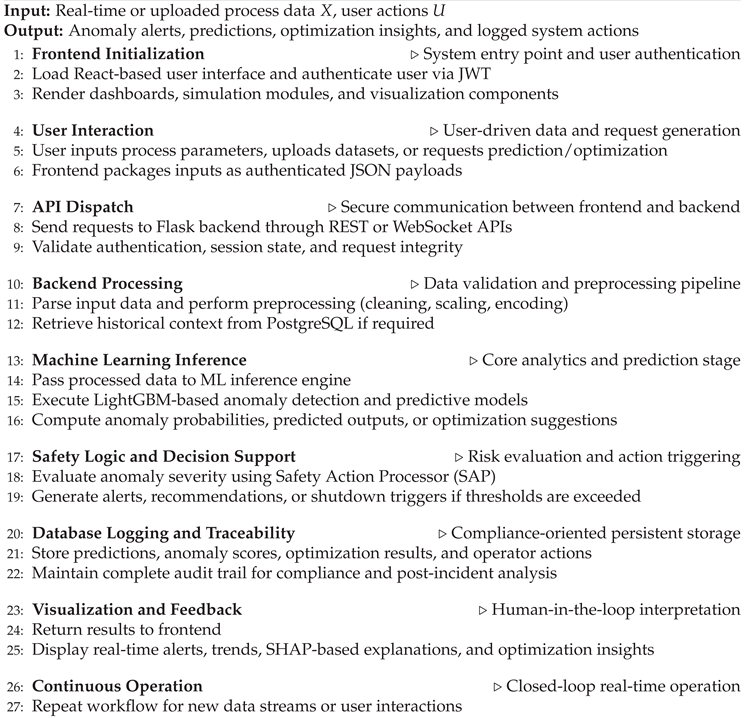
10.2. Project Flow and Workflow
The internal workflow of ChemSafeAI+ is designed to handle data acquisition, preprocessing, prediction, anomaly detection, visualization, and logging in a streamlined sequence. This ensures that operators receive actionable insights in real time while preserving traceability and system reliability.
10.2.1. Data Flow Overview
The typical system workflow proceeds through the following stages:
- 1.
- User Interaction (Frontend): Operators input process parameters, upload datasets, or request anomaly predictions through the React interface.
- 2.
- API Request Dispatch (REST Layer): The frontend sends structured JSON payloads to the backend via authenticated endpoints.
- 3.
- Backend Processing: Flask parses requests, validates inputs, retrieves historical context, and routes data to relevant modules.
- 4.
- ML Inference Engine: The LightGBM-based anomaly and prediction models evaluate sensor/process data and return probability scores, predicted outputs, or optimization suggestions.
- 5.
- Database Logging: All predictions, anomalies, and operator actions are recorded in PostgreSQL for traceability and compliance.
- 6.
- Frontend Visualization: Updated results are rendered as charts, alerts, parameter trends, or optimization recommendations.
Figure 18.
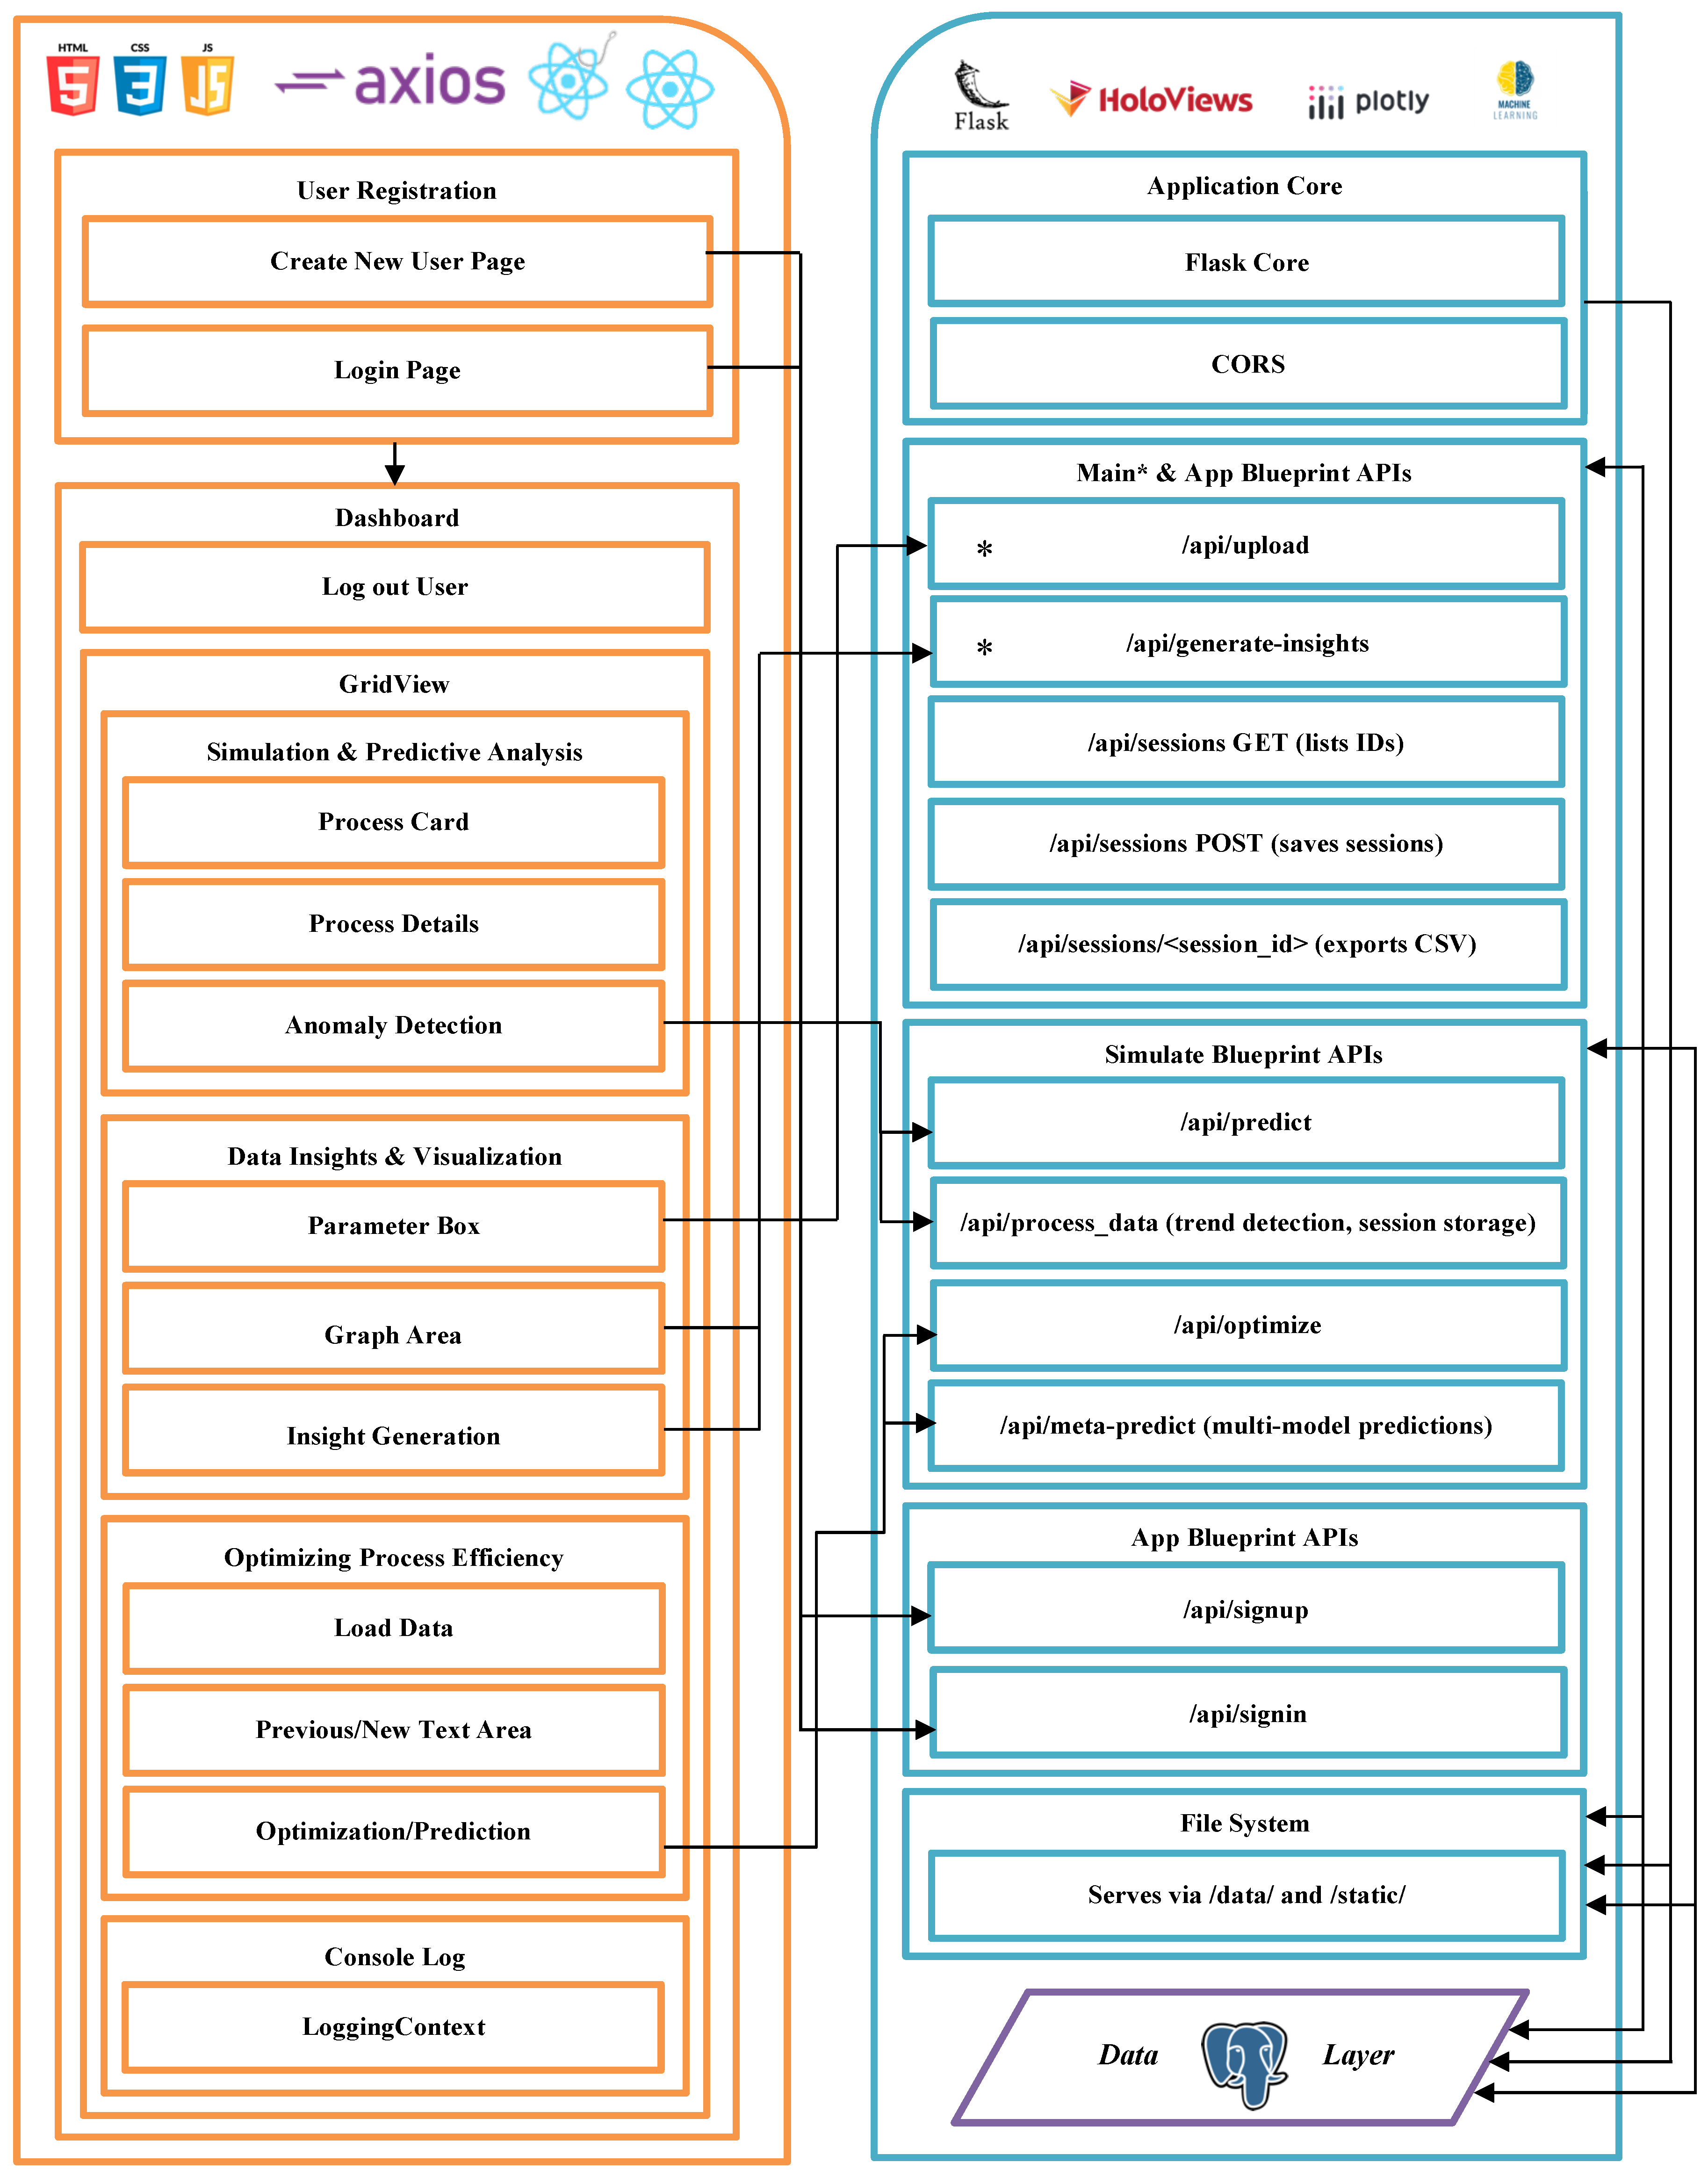
Detailed application workflow and API interaction architecture illustrating the frontend user interface components, backend Flask-based service layers, machine learning inference and optimization endpoints, data management, and system-level integration between user actions and core analytical services.
Figure 18.
Detailed application workflow and API interaction architecture illustrating the frontend user interface components, backend Flask-based service layers, machine learning inference and optimization endpoints, data management, and system-level integration between user actions and core analytical services.
10.2.2. Workflow Characteristics
The workflow exhibits several key characteristics:
- Modularity: Each subsystem (UI, API, ML, DB) operates independently for easier maintenance.
- Scalability: Components can be replaced or scaled (e.g., swapping LightGBM with another model) without altering the architecture.
- Real-Time Feedback: Results-including anomalies, visual insights, and optimization suggestions-are delivered instantly.
- Traceability: PostgreSQL logs every interaction, providing a complete audit trail for safety-critical decisions.
- Security: All communication is encrypted and authenticated to protect industrial data.
Together, this architecture and project flow enable ChemSafeAI+ to operate as a robust industrial safety and optimization platform capable of integrating data-driven intelligence with traditional process control systems.
11. Frontend and Backend Implementation
This section describes the implementation of the ChemSafeAI+ platform, detailing how the frontend and backend components integrate into a unified framework for simulation, anomaly detection, visualization, and optimization. The system adopts a component-wise architecture in which each module has dedicated UI logic, server processing routines, and supporting utilities. Together, these components ensure a seamless, scalable, and secure workflow for industrial safety applications.
11.1. Core Application Backbone: Frontend app.js and Backend __init__.py
The app.js file functions as the central coordinator of the React-based frontend. Using react-router-dom, the application defines a single-page architecture that maps routes to components such as Registration, BiometricAuthPage, Dashboard, SAP, and the simulation modules (/section1–/section3). A custom PrivateRoute wrapper enforces authentication by verifying the presence of a JWT or token stored in localStorage.
A global dark-mode system is implemented using react-toggle-dark-mode, with useState tracking theme state and propagating updates across all components via CSS class toggling. Additionally, useLog is used to maintain an event log, allowing state changes and user actions to be timestamped for auditability.
On the backend, __init__.py and run.py initialize the Flask application and configure dependencies. The backend employs Flask-Session with SESSION_TYPE=’filesystem’ for non-persistent session storage, and CORS is restricted to http://localhost:3000 to ensure secure cross-origin communication.
The backend registers modular blueprints:
- main: Core system routes,
- auth: Authentication logic at /auth,
- native: Desktop integration,
- simulate: Prediction, optimization, and anomaly detection.
Essential imports, including AmmoniaOptimizationPipeline, database initialization, and security utilities, establish the foundation for system intelligence and data persistence. The backend runs on 0.0.0.0:5000 in development mode, supporting full integration with the frontend.
11.2. User Authentication: Signup and Sign-in
User authentication is implemented through a coordinated React-Flask workflow. On the frontend, the Registration component dynamically switches between Sign Up and Sign In modes using an isSignUp state flag. User input fields (username, email, password) are captured through controlled components, validated, and submitted to the backend via fetch requests targeting:
- /api/signup for account creation,
- /api/signin for login and token retrieval.
The Flask backend verifies credentials, hashes passwords using generate_password_hash, validates logins with check_password_hash, and returns an authentication token (placeholder for JWT in deployment). Upon successful authentication, the token is stored in localStorage, enabling secure access to protected routes.
CORS and secure cookie policies ensure safe communication between the frontend and backend. Error states propagate clear feedback to users for invalid credentials or duplicate accounts.
11.3. Simulation and Predictive Analysis (Section 1)
Figure 19 illustrates the simulation architecture.
The ProcessCard component serves as the user’s entry point to simulation modules. Each card features a flip animation implemented via conditional CSS classes and shows process metadata along with a “Simulate” button. Clicking the button triggers handleSimulateClick, displays a Loader animation, and transitions the user to the detailed simulation interface.
The ProcessDetail component performs full predictive analysis. When mounted, it fetches process parameters using useParams:
- For the Haber–Bosch process (id === ’1’), parameters are parsed from ammonia__data_.csv using Papa.parse and mapped to engineering units.
- For other processes (e.g., chlorine production), parameters are loaded from hardcoded templates.
A unit toggle allows switching between SI and industrial units. “Simulate” sends data to /api/predict, while “What If” dynamically retrieves random input rows for scenario analysis.
The Flask backend supports:
- /api/predict: Executes LightGBM anomaly detection and returns SHAP-based feature attributions.
- /process_data: Performs trend-based anomaly detection using sliding windows and threshold rules.
Results are visualized through warnings, alarms, and anomaly flags, which are stored via the PostgreSQL Session model.
| Algorithm 5 Safety Action Processor (SAP) Decision Logic |
 |
11.4. Data Insights and Visualization (Section 2)
Section 2 transforms uploaded datasets and session histories into actionable insights. The Section2 component supports dynamic chart selection (Line, Bar, Heatmap, Multi-Feature) and persists analysis settings using sessionStorage. Data can be uploaded or retrieved from past sessions via /api/sessions. Time filters, aggregation options, and multi-feature stacking enable flexible exploration.
The backend provides:
- /api/upload: Parses CSV/Excel data and returns metadata,
- /api/generate-insights: Produces Plotly and HoloViews visualizations, applies dark/light theming, and may fetch narrative insights using the LLM.
Generated charts, PNGs, and PDFs are stored and returned for download. Figure 20 shows a typical analysis dashboard.
11.5. Process Optimization Engine (Section 3)
Section 3 integrates predictive analytics with optimization workflows. The Section3 component manages uploads, dropdown selections (e.g., catalyst type, reactor design), modal dialogs, and state variables such as previousData and newData. Uploaded files are parsed using Papa.parse (CSV) or XLSX (Excel) and mapped to required model inputs.
Optimization requests are handled via:
- /api/optimize: Executes the AmmoniaOptimizationPipeline to generate optimized temperature, pressure, purity, and emission profiles,
- /api/meta-predict: Runs multi-model predictions for CO2, NOx, and ammonia yield.
These endpoints validate input structure using validate_and_prepare_data and ensure compatibility with trained models. Optimization results are presented in user-friendly form, as shown in Figure 21.
11.6. Console Logging System (Section 4)
Section 4 implements a persistent logging framework for transparency and traceability. The logging layer is powered by LoggingContext.js, a global context that stores logs in both React state and localStorage. The two primary functions are:
- addLog: Appends timestamped entries and triggers console output for debugging,
- clearLogs: Resets logs across state and storage.
The ConsoleLog component renders logs with CSS highlighting based on event type, supports dark/light mode, and auto-scrolls to the latest message via useEffect. An empty-state message ensures clarity when no logs are available.
11.7. Grid View Interface (Section 5)
The GridView component acts as the main navigation dashboard. Implemented fully in React and styled using GridView.css, it displays four interactive cells linking to:
- /section1: Simulation and anomaly detection,
- /section2: Data insights,
- /section3: Optimization,
- /console-log: Logs.
Keyboard shortcuts (e.g., Escape to return to Dashboard) enhance usability. Although backend-independent, the GridView forms the bridge to all analytical and control modules.
11.8. Database Management Layer
The database layer is implemented in database.py using Flask-SQLAlchemy with PostgreSQL. The connection URI:
postgresql://Username:password@localhost:5432/Username
provides secure access to the database, with modification tracking disabled for performance.
The core schema includes a single model, Session, which stores:
- session_id,
- timestamp,
- anomalies (JSON),
- warnings (JSON),
- parameters (JSON).
The module exposes three REST APIs:
- GET /api/sessions: Returns all session identifiers,
- POST /api/sessions: Stores a new session entry,
- GET /api/sessions/<session_id>: Exports session data to CSV.
The add_session helper function standardizes database insertion, while db.init_app(app) ensures smooth integration with the Flask app. The JSON-based schema supports flexible logging of future model outputs and system events.
| Algorithm 6 System Architecture and End-to-End Project Flow of ChemSafeAI+ |
 |
12. Results and Discussion
The implementation of ChemSafeAI+, an AI-driven safety and optimization framework, represents a major advancement in enhancing real-time monitoring, operational efficiency, and risk mitigation in chemical process industries. By combining anomaly detection, predictive analytics, and optimization, the framework enables proactive intervention rather than reactive control. This section evaluates its performance using three operational sessions-session-1744284452813, session-1744283710559, and session-1744282836799-and further analyzes optimization performance under multiple catalyst–reactor configurations. The results provide evidence of ChemSafeAI+’s adaptability, precision, and industrial relevance.
12.1. Methodology for Result Computation
Three operational sessions were retrieved from the PostgreSQL database using the /api/sessions endpoint (Section 11), representing distinct runs of a Haber–Bosch-inspired process. Each session includes recorded warnings, anomalies, predictions, operator interactions, and complete process parameters.
To assess optimization performance, session-1744284452813 was selected for deeper analysis. Three catalyst configurations-varying Reactor Bed Design, Reactor Type, and Catalyst Type-were evaluated while maintaining the strict stoichiometric constraint enforced by the AmmoniaOptimizationPipeline (Section 6). Optimization results were generated using the /api/optimize endpoint, which applies a RandomForestRegressor and Bayesian optimization to recommend improved operating conditions.
12.2. Results from Session Analysis
The three sessions collectively demonstrate ChemSafeAI+’s reliability across varied operating conditions. In all cases, warnings appeared before anomalies, validating the system’s ability to anticipate deviations. For each session, the first five operational rows were inspected, and anomaly-triggering patterns were cross-referenced with optimized values to assess improvement potential.
12.2.1. Warnings as Precursors to Anomalies
Table 13 summarizes the warnings and anomalies from the session.
Across all three sessions, warnings consistently preceded anomalies by milliseconds to seconds:
- Session 1744284452813: A Pressure Relief Valve Activation anomaly occurred at 11:31:53.556, following a warning at 11:31:53.340 (216 ms earlier). A Compressor Temperature anomaly occurred 28 seconds after its warning, indicating progressive thermal buildup.
- Session 1744282836799: A Stoichiometric Ratio anomaly occurred 3.1 seconds after a composition imbalance warning. A Compressor Discharge Pressure anomaly emerged only 215 ms after its warning, highlighting rapid pressure shifts.
- Session 1744283710559: A Separation Pressure anomaly occurred 9 seconds after its warning. A Separation Temperature anomaly occurred 16.7 seconds after a prior temperature warning, revealing gradual thermal deviation.
These intervals demonstrate that ChemSafeAI+ provides timely early indicators, enabling preventive operator actions or automated mitigation through the Safety Action Processor (SAP).
12.2.2. Anomaly Analysis Across Sessions
Table 14 lists all detected anomalies, their triggering conditions, and explanatory remarks. Several flagged values-such as a seemingly acceptable stoichiometric ratio-were within nominal limits in isolation. However, the LightGBM model evaluates multivariate relationships, flagging rows where the combination of parameters indicates instability. This aligns with real industrial failure modes, where faults emerge from interactions rather than single variables.
12.3. Optimization Results Using ChemSafeAI+
Optimization results for sessions 1744282836799, 1744283710559, and 1744284452813 were generated using RandomForestRegressor and Bayesian optimization. Parameters such as Feed Pressure, Reaction Temperature, and Flow Rates were improved to maximize ammonia yield and minimize emissions.
Table 15 summarizes optimized parameters and resulting performance shifts.
Certain fields were labeled “not optimized’’ when dependent on external utilities or scheduled for future implementation. “Ratio-adjusted’’ values refer to N2/H2 flows corrected to maintain the stoichiometric requirement. “Calculated’’ values, such as inert gas flow, were derived from constraints embedded in the optimization logic.
12.4. Catalyst–Reactor Optimization Report: Session 1744284452813
A deeper optimization study was performed using four catalyst–reactor configurations to assess how industrial design choices influence ammonia synthesis performance under optimized conditions.
12.4.1. Configuration Overview
Table 16 summarizes the four evaluated configurations:
- Configuration 1: Catalyst A, Fixed Bed, Single-bed Strengths: Highest gains in high-baseline scenarios (e.g., Row 1). Weaknesses: Slightly higher emissions than fluidized systems. Best for: Simple, stable operations.
- Configuration 2: Catalyst A, Fluidized Bed, Multi-bed Strengths: Lowest emissions (Row 2: 32.42). Weaknesses: Slightly lower conversion improvement than advanced catalysts. Best for: Scalable operations requiring predictable performance.
- Configuration 3: Catalyst B (K2O promoted), Fluidized Bed, Multi-bed Strengths: Highest conversion (98.67%) and highest production (8389.07 kmol/hr). Weaknesses: Slight emissions increase in some rows. Best for: Yield-focused operations.
- Configuration 4: Catalyst C (K2O + Al2O3 promoted), Fluidized Bed, Multi-bed Strengths: Lowest emissions in Row 3 (35.02). Weaknesses: Marginally lower conversion than Config 3 in select cases. Best for: Long-term, environmentally sensitive operations.
12.4.2. Comparative Performance Metrics
Table 17 presents ammonia production, conversion, and emissions before and after optimization across Rows 1–5.
Key findings include:
- Row 1 (High Baseline): Minimal improvement due to saturation effects. Configuration 1 performs best (98.49%).
- Row 2 (Low Baseline): Largest conversion gains observed. Configuration 3 achieves peak conversion (+4.96%), while Configuration 2 offers the lowest emissions.
- Row 3: Configuration 3 achieves the highest ammonia production (8389.07 kmol/hr); Configuration 4 minimizes emissions (35.02 ton/hr).
Summary: Configuration 3 delivers the highest overall performance, particularly for conversion and yield. Configuration 4 provides the best environmental balance, making it suitable for sustainability-driven operations.
12.5. Conclusion
This chapter demonstrates the strong performance of ChemSafeAI+ across anomaly detection, early warning, and optimization tasks. The three evaluated sessions show clear evidence that warnings consistently precede anomalies, validating the system’s predictive strength. Optimization analyses highlight significant improvements in ammonia yield, conversion efficiency, and emissions control.
Catalyst–reactor evaluations reveal that:
- Configuration 3 (Catalyst B) provides the greatest gains in conversion and production,
- Configuration 4 (Catalyst C) offers the best long-term environmental profile,
- Configuration 1 and 2 remain viable for simpler or scalable setups.
Although the framework includes additional features such as rich visualizations and interactive operator tools, their outputs align with the automated results presented here; thus, they are not reiterated to avoid redundancy. Overall, ChemSafeAI+ demonstrates substantial potential to transform chemical process safety and optimization, enabling scalable, efficient, and eco-conscious industrial operations.
12.6. Conclusion
Session-level evaluation, parameter optimization, and catalyst performance assessment all show that ChemSafeAI+ is capable of early deviation detection and actionable recommendation generation. The modular inference and optimization stages reinforce system behaviour and improve both safety and productivity, demonstrating the viability of ChemSafeAI+ as an integrated industrial AI framework.
13. Limitations and Future Work
While ChemSafeAI+ demonstrates strong performance in anomaly detection, early warning generation, and operational optimization, several limitations must be acknowledged. These limitations primarily arise from constraints in dataset scope, prototype implementation boundaries, and the absence of full industrial integration during the evaluation phase.
13.1. Limitations
First, the current dataset, although physically consistent and chemically grounded, is restricted to the ammonia synthesis loop and does not yet incorporate multi-unit process interactions such as reforming, air separation, or refrigeration cycles. As a result, anomaly correlations across interconnected units cannot be fully evaluated. Additionally, the synthetic nature of the dataset limits the representation of long-term degradation phenomena, rare fault events, equipment aging, and catalyst deactivation patterns-all of which influence real-world plant behaviour.
Second, the implementation relies on simulated PLC communication through Modbus, and a full industrial field test has not yet been conducted. Transient noise, sensor drift, actuator delays, and communication bottlenecks-common in real chemical plants-are therefore not currently reflected in system evaluation. Furthermore, while the Safety Action Processor (SAP) provides tiered decision logic, automatic actuation was intentionally disabled in this prototype to maintain operator-in-the-loop oversight.
Third, explainability is limited to model-based diagnostics such as SHAP visualizations and trend analysis. Although effective, the system does not yet implement domain-aware causal reasoning or root-cause reconstruction, which would further enhance interpretability for safety-critical environments. Finally, the authentication layer remains minimal and does not yet incorporate the advanced biometric safeguards required for high-security industrial deployments.
13.2. Future Work
Several enhancements are planned to expand ChemSafeAI+ into a comprehensive industrial safety ecosystem. A key future direction is the development of interactive 3D process visualizations that allow operators to navigate the plant virtually, explore real-time sensor states, and better understand anomaly propagation pathways. This is expected to improve situational awareness and reduce response time during abnormal operations.
A major extension involves generalizing the system to multiple chemical processes, enabling cross-unit anomaly detection, multi-equipment optimization, and integrated plant-wide safety analytics. Complementing this, advanced graphing modules-such as radar plots, multivariate overlays, and searchable historical logs-will provide deeper analytical capability and more intuitive process insights.
Security enhancements form another important trajectory. Future versions will incorporate biometric authentication, including facial and fingerprint verification, to protect sensitive operational data and prevent unauthorized modifications to safety configurations. A centralized supervisory dashboard will be introduced to consolidate alerts, system behaviour, operator actions, and long-term performance trends.
To encourage adaptability across industries, ChemSafeAI+ will include a model marketplace where users can deploy, customize, or upload domain-specific machine learning models. An upcoming module for equipment efficiency monitoring will further support predictive maintenance, energy optimization, and cost analysis. Finally, a redundant, tamper-resistant two-layer logging system will ensure secure archival of safety-critical interactions, providing traceability even under deletion attempts.
These enhancements collectively aim to extend ChemSafeAI+ beyond anomaly detection into a scalable, secure, operator-centric platform for intelligent industrial safety and optimization.
14. Conclusion
The ChemSafeAI+ framework represents a significant advancement in intelligent safety management for chemical process industries. By integrating machine learning–based anomaly detection, rule-driven safety logic, real-time visualization, and optimization modules into a unified system, ChemSafeAI+ addresses longstanding limitations of traditional PLC-based safety approaches. Evaluation across multiple operating sessions demonstrated that the framework consistently identifies deviations in key process variables-such as pressure, temperature, stoichiometric ratios, and catalyst-sensitive operating conditions-and issues timely warnings that precede full anomaly manifestation. This early detection capability enhances operator preparedness and reduces the likelihood of hazardous escalation.
The optimization module further contributes to system value by identifying operational adjustments that improve conversion efficiency, reduce energy consumption, and maintain safe operating envelopes. These results highlight the effectiveness of coupling physically grounded process modelling with modern machine learning techniques to support safer and more productive industrial operations. Additionally, the architecture’s compatibility with existing PLC infrastructure ensures that ChemSafeAI+ can be deployed in both brownfield and greenfield environments without disruptive system overhauls.
Looking ahead, planned enhancements-including 3D process visualization, expanded process coverage, advanced interpretability tools, biometric authentication, supervisory dashboards, and customizable machine learning model integration-will strengthen the system’s scalability and decision-support capabilities. Together, these developments position ChemSafeAI+ as a comprehensive and forward-looking platform capable of redefining safety, reliability, and optimization within chemical manufacturing environments.
Author Contributions
Conceptualization, S.S.; methodology, S.S.; software, S.S.; validation, S.S.; formal analysis, S.S.; investigation, S.S.; data curation, S.S.; writing-original draft preparation, S.S.; writing-review and editing, S.S.; visualization, S.S.; supervision, S.S.; project administration, S.S. The author has read and agreed to the published version of the manuscript.
Institutional Review Board Statement
Not applicable.
Informed Consent Statement
Not applicable.
Data Availability Statement
The data used in this study were generated synthetically based on validated process models. Data supporting the findings of this study are available from the corresponding author upon reasonable request.
Acknowledgments
The author acknowledges the use of computational resources and open-source software libraries that supported the development and evaluation of the proposed framework.
Conflicts of Interest
The author is the founder and developer of the ChemSafeAI+ platform described in this manuscript. The work was conducted as independent academic research, and no commercial funding, external sponsorship, or financial remuneration was involved in the development or evaluation of the framework.
Abbreviations
The following abbreviations are used in this manuscript:
| PLC | Programmable Logic Controller |
| SCADA | Supervisory Control and Data Acquisition |
| SAP | Safety Action Processor |
| HMI | Human Machine Interface |
| ML | Machine Learning |
| LightGBM | Light Gradient Boosting Machine |
| SHAP | SHapley Additive exPlanations |
| PCA | Principal Component Analysis |
| SMOTE | Synthetic Minority Oversampling Technique |
Appendix A
Appendix A.1
This appendix presents supplementary experimental results and configuration details supporting the main analysis. It includes extended regression performance metrics, hyperparameter search spaces, optimization bounds, and statistical summaries of process variables used for anomaly detection and optimization. Additional diagnostic figures are provided to enhance transparency and reproducibility.
Table A1.
Comparison of Regression Model Performances ( / MSE)
| Target Variable | Random Forest | Gradient Boosting | SVR | KNN | XGBoost |
|---|---|---|---|---|---|
| Ammonia Produced (Single Pass) | 1.0000 / 2.59 | 0.9999 / 40.99 | / 5.01e5 | / 5.75e5 | 0.9999 / 56.72 |
| Ammonia Produced (Recycle) | 0.9990 / 3975.78 | 0.9983 / 7251.79 | / 4.22e6 | / 5.04e6 | 0.9987 / 5520.99 |
| Total Ammonia Produced | 0.9997 / 1826.65 | 0.9997 / 1937.28 | / 6.19e6 | / 7.48e6 | 0.9996 / 2620.07 |
| Single Pass Conversion (%) | 0.9979 / 0.07 | 0.9936 / 0.20 | / 32.03 | / 37.48 | 0.9957 / 0.14 |
| CO2 Emissions (tons/hr) | 0.9672 / 3.72 | 0.9674 / 3.70 | / 114.72 | / 137.71 | 0.9618 / 4.33 |
| Overall Conversion (%) | 0.0169 / 0.21 | 0.0461 / 0.21 | / 0.22 | / 0.26 | / 0.25 |
| Unreacted Gas After Recycle | 0.5163 / 1603.32 | 0.5368 / 1535.31 | / 3652.59 | / 3945.29 | 0.4422 / 1848.71 |
| NOx Emissions | 0.9999 / 0.000 | 0.9999 / 0.000 | / 0.0035 | / 0.0042 | 0.9999 / 0.000 |
Table A2.
Hyperparameter Search Space for Grid Search Optimization
| Model | Hyperparameter | Search Range |
|---|---|---|
| Random Forest | Number of trees | 100, 200, 300 |
| Maximum depth | None, 10, 20, 30 | |
| Min. samples split | 2, 5, 10 | |
| Min. samples leaf | 1, 2, 4 | |
| Bootstrap | True, False | |
| LightGBM | Number of estimators | 100, 200, 300 |
| Learning rate | 0.01, 0.05, 0.1 | |
| Number of leaves | 31, 50, 100 | |
| Maximum depth | 10, 20, 30 | |
| Min. data in leaf | 20, 50, 100 | |
| Feature fraction | 0.6, 0.8, 1.0 |
Table A3.
Decision Variable Bounds Used for Bayesian Optimization
| Parameter | Lower Bound | Upper Bound |
|---|---|---|
| Temperature (K) | 670 | 823.15 |
| Pressure (bar) | 200 | 300 |
| Nitrogen Purity (%) | 99.5 | 99.9 |
| Hydrogen Purity (%) | 99.8 | 99.99 |
| Feed Temperature (K) | 500 | 650 |
| Feed Pressure (bar) | 150 | 200 |
| Cooling Water TemperatureIN (°C) | 20 | 40 |
| Cooling Water TemperatureOUT (°C) | 40 | 50 |
| Separation Temperature (K) | 200 | 270 |
| Separation Pressure (bar) | 150 | 300 |
| Heat Exchanger Outlet Temp. Difference (°C) | 5 | 50 |
| Total Heat Generated (kJ/hr) |
Table A4.
Statistical Summary of Process Variables Used for Anomaly Detection Model Training
| Variable | Count | Mean | Std | Min | 25% | 50% | 75% | Max |
|---|---|---|---|---|---|---|---|---|
| Nitrogen Flow Rate | 5000 | 2004.70 | 363.91 | 500.0 | 1858.72 | 2006.70 | 2144.99 | 3500.0 |
| Hydrogen Flow Rate | 5000 | 5961.70 | 1094.64 | 1500.0 | 5546.00 | 5967.26 | 6412.84 | 10500.0 |
| Inert Gas Flow Rate | 5000 | 38.13 | 1.74 | 32.0 | 36.70 | 38.06 | 39.48 | 44.0 |
| Nitrogen Purity (%) | 5000 | 99.68 | 0.17 | 98.8 | 99.63 | 99.70 | 99.77 | 100.0 |
| Hydrogen Purity (%) | 5000 | 99.94 | 0.04 | 99.74 | 99.93 | 99.95 | 99.97 | 100.06 |
| Feed Pressure (bar) | 5000 | 224.23 | 34.98 | 100.0 | 207.06 | 224.04 | 241.87 | 350.0 |
| Feed Temperature (K) | 5000 | 125.05 | 17.26 | 70.0 | 114.59 | 125.09 | 135.37 | 180.0 |
| Reaction Pressure (bar) | 5000 | 201.38 | 30.99 | 80.0 | 193.27 | 200.38 | 207.39 | 370.0 |
| Reaction Temperature (K) | 5000 | 449.69 | 29.67 | 320.0 | 439.15 | 449.89 | 460.43 | 580.0 |
| Catalyst Temperature (K) | 5000 | 463.99 | 21.94 | 370.0 | 454.08 | 464.50 | 475.38 | 530.0 |
| Catalyst Pressure Drop | 5000 | 0.85 | 0.40 | -0.40 | 0.61 | 0.82 | 1.02 | 2.60 |
| Stoichiometric Ratio | 5000 | 3.00 | 0.13 | 2.60 | 2.93 | 3.00 | 3.07 | 3.40 |
| Catalyst Activity (%) | 5000 | 94.27 | 4.67 | 66.0 | 93.52 | 94.84 | 96.28 | 100.0 |
| Catalyst Age (h) | 5000 | 30377.08 | 22670.94 | 0.0 | 15468.63 | 27426.25 | 40323.32 | 122640.0 |
| Catalyst Surface Area | 5000 | 119.82 | 24.73 | 40.0 | 105.57 | 119.77 | 134.20 | 200.0 |
| Single-pass Conversion (%) | 5000 | 19.49 | 4.21 | -1.0 | 17.76 | 19.82 | 21.89 | 31.64 |
| Overall Conversion (%) | 5000 | 94.65 | 2.68 | 81.0 | 93.52 | 94.96 | 96.27 | 98.0 |
| Recycle Conversion (%) | 5000 | 19.95 | 2.85 | 9.0 | 17.96 | 19.96 | 21.99 | 30.09 |
| Separation Temperature (°C) | 5000 | -33.04 | 2.61 | -42.0 | -34.46 | -33.04 | -31.67 | -24.0 |
| Separation Pressure (bar) | 5000 | 22.44 | 3.45 | 10.0 | 20.72 | 22.40 | 24.20 | 35.0 |
| Ammonia Concentration (%) | 5000 | 99.89 | 0.09 | 99.4 | 99.86 | 99.90 | 99.93 | 100.0 |
| Ammonia Leakage | 5000 | 0.0109 | 0.0086 | -0.01 | 0.0065 | 0.0100 | 0.0135 | 0.060 |
| Compressor Vibration | 5000 | 1.54 | 0.33 | 0.66 | 1.37 | 1.51 | 1.65 | 3.40 |
| Compressor Temperature (°C) | 5000 | 60.23 | 6.92 | 40.0 | 56.47 | 60.06 | 63.52 | 90.0 |
| Pump Vibration | 5000 | 0.82 | 0.16 | 0.44 | 0.74 | 0.80 | 0.87 | 1.70 |
| Pump Temperature (°C) | 5000 | 45.22 | 4.31 | 34.0 | 42.91 | 44.95 | 47.06 | 66.0 |
| Heat Exchanger (°C) | 5000 | 14.99 | 2.58 | 6.0 | 13.61 | 15.01 | 16.33 | 24.0 |
| Anomaly Label | 5000 | 0.67 | 0.47 | 0.0 | 0.0 | 1.0 | 1.0 | 1.0 |
Table A5.
Testing Data Used for Optimization and Prediction Scenarios
| Parameter | Optimization Data | Prediction Data |
|---|---|---|
| N2 Flow (kmol/hr) | 1942.12 | 900.00 |
| H2 Flow (kmol/hr) | 5559.75 | 2700.00 |
| Inert Gas Flow Rate (kmol/hr) | 36.00 | 36.45 |
| Temperature (K) | 450.53 | 720.35 |
| Pressure (bar) | 186.35 | 256.86 |
| Nitrogen Purity (%) | 99.62 | 99.47 |
| Hydrogen Purity (%) | 99.89 | 99.82 |
| Feed Pressure (bar) | 300.00 | 105.24 |
| Feed Temperature (K) | 143.90 | 506.27 |
| Cooling Water TempIN (°C) | 30.00 | 28.80 |
| Cooling Water TempOUT (°C) | – | 42.02 |
| Separation Temperature (K) | -32.78 | 236.62 |
| Separation Pressure (bar) | 24.53 | 22.91 |
| Heat Exchanger (°C) | 14.41 | 17.25 |
| Activation Energy, (J/mol) | – | 112095.96 |
| Pre-exponential Factor, A () | – | |
| Reverse (J/mol) | – | 73019.72 |
| Reverse A () | – | |
| Particle Radius (m) | – | 0.0015 |
| Effective Diffusivity (m2/s) | – | |
| Catalyst Activity (%) | 94.41 | 51.59 |
| Catalyst Age (hr) | 50762.78 | 28987.10 |
| Catalyst Surface Area (m2) | 84.24 | 93.68 |
| Catalyst Particle Size (mm) | – | 1.04 |
| Catalyst Pressure Drop (bar/m) | 0.91 | 1.77 |
| Reactor Volume (m3) | – | 1093.86 |
| Reactor Area (m2) | – | 25.56 |
| Equilibrium Constant | – | 0.0122 |
| Forward Rate Constant, | – | 35301.06 |
| Reverse Rate Constant, | – | |
| Catalyst Type | – | Iron-based (Standard) |
| Reactor Bed Design | – | Single Bed |
| Reactor Type | – | Fixed Bed |
| Mixing Efficiency | – | Partial Mixing |
| Initial (bar) | – | 26.31 |
| Initial (bar) | – | 78.93 |
| Volumetric Flow Rate (m3/hr) | – | 810.66 |
| Residence Time (hr) | – | 1.35 |
| Catalyst Volume (m3) | – | 0.094 |
| Space Velocity () | – | 8653.37 |
| Total Heat Generated (kJ/hr) | – | -93572.56 |
| Total Feed Input (kmol/hr) | – | 3636.40 |
This appendix presents supplementary figures and tables that support the main analysis. All appendix items are referenced in the main text and are labeled sequentially with the prefix “A” (e.g., Figure A1, Table A1).
Figure A1.
Pair wise distribution and scatter plots of key process variables, showing relationships and overlap between normal and anomalous operating conditions.
Figure A1.
Pair wise distribution and scatter plots of key process variables, showing relationships and overlap between normal and anomalous operating conditions.
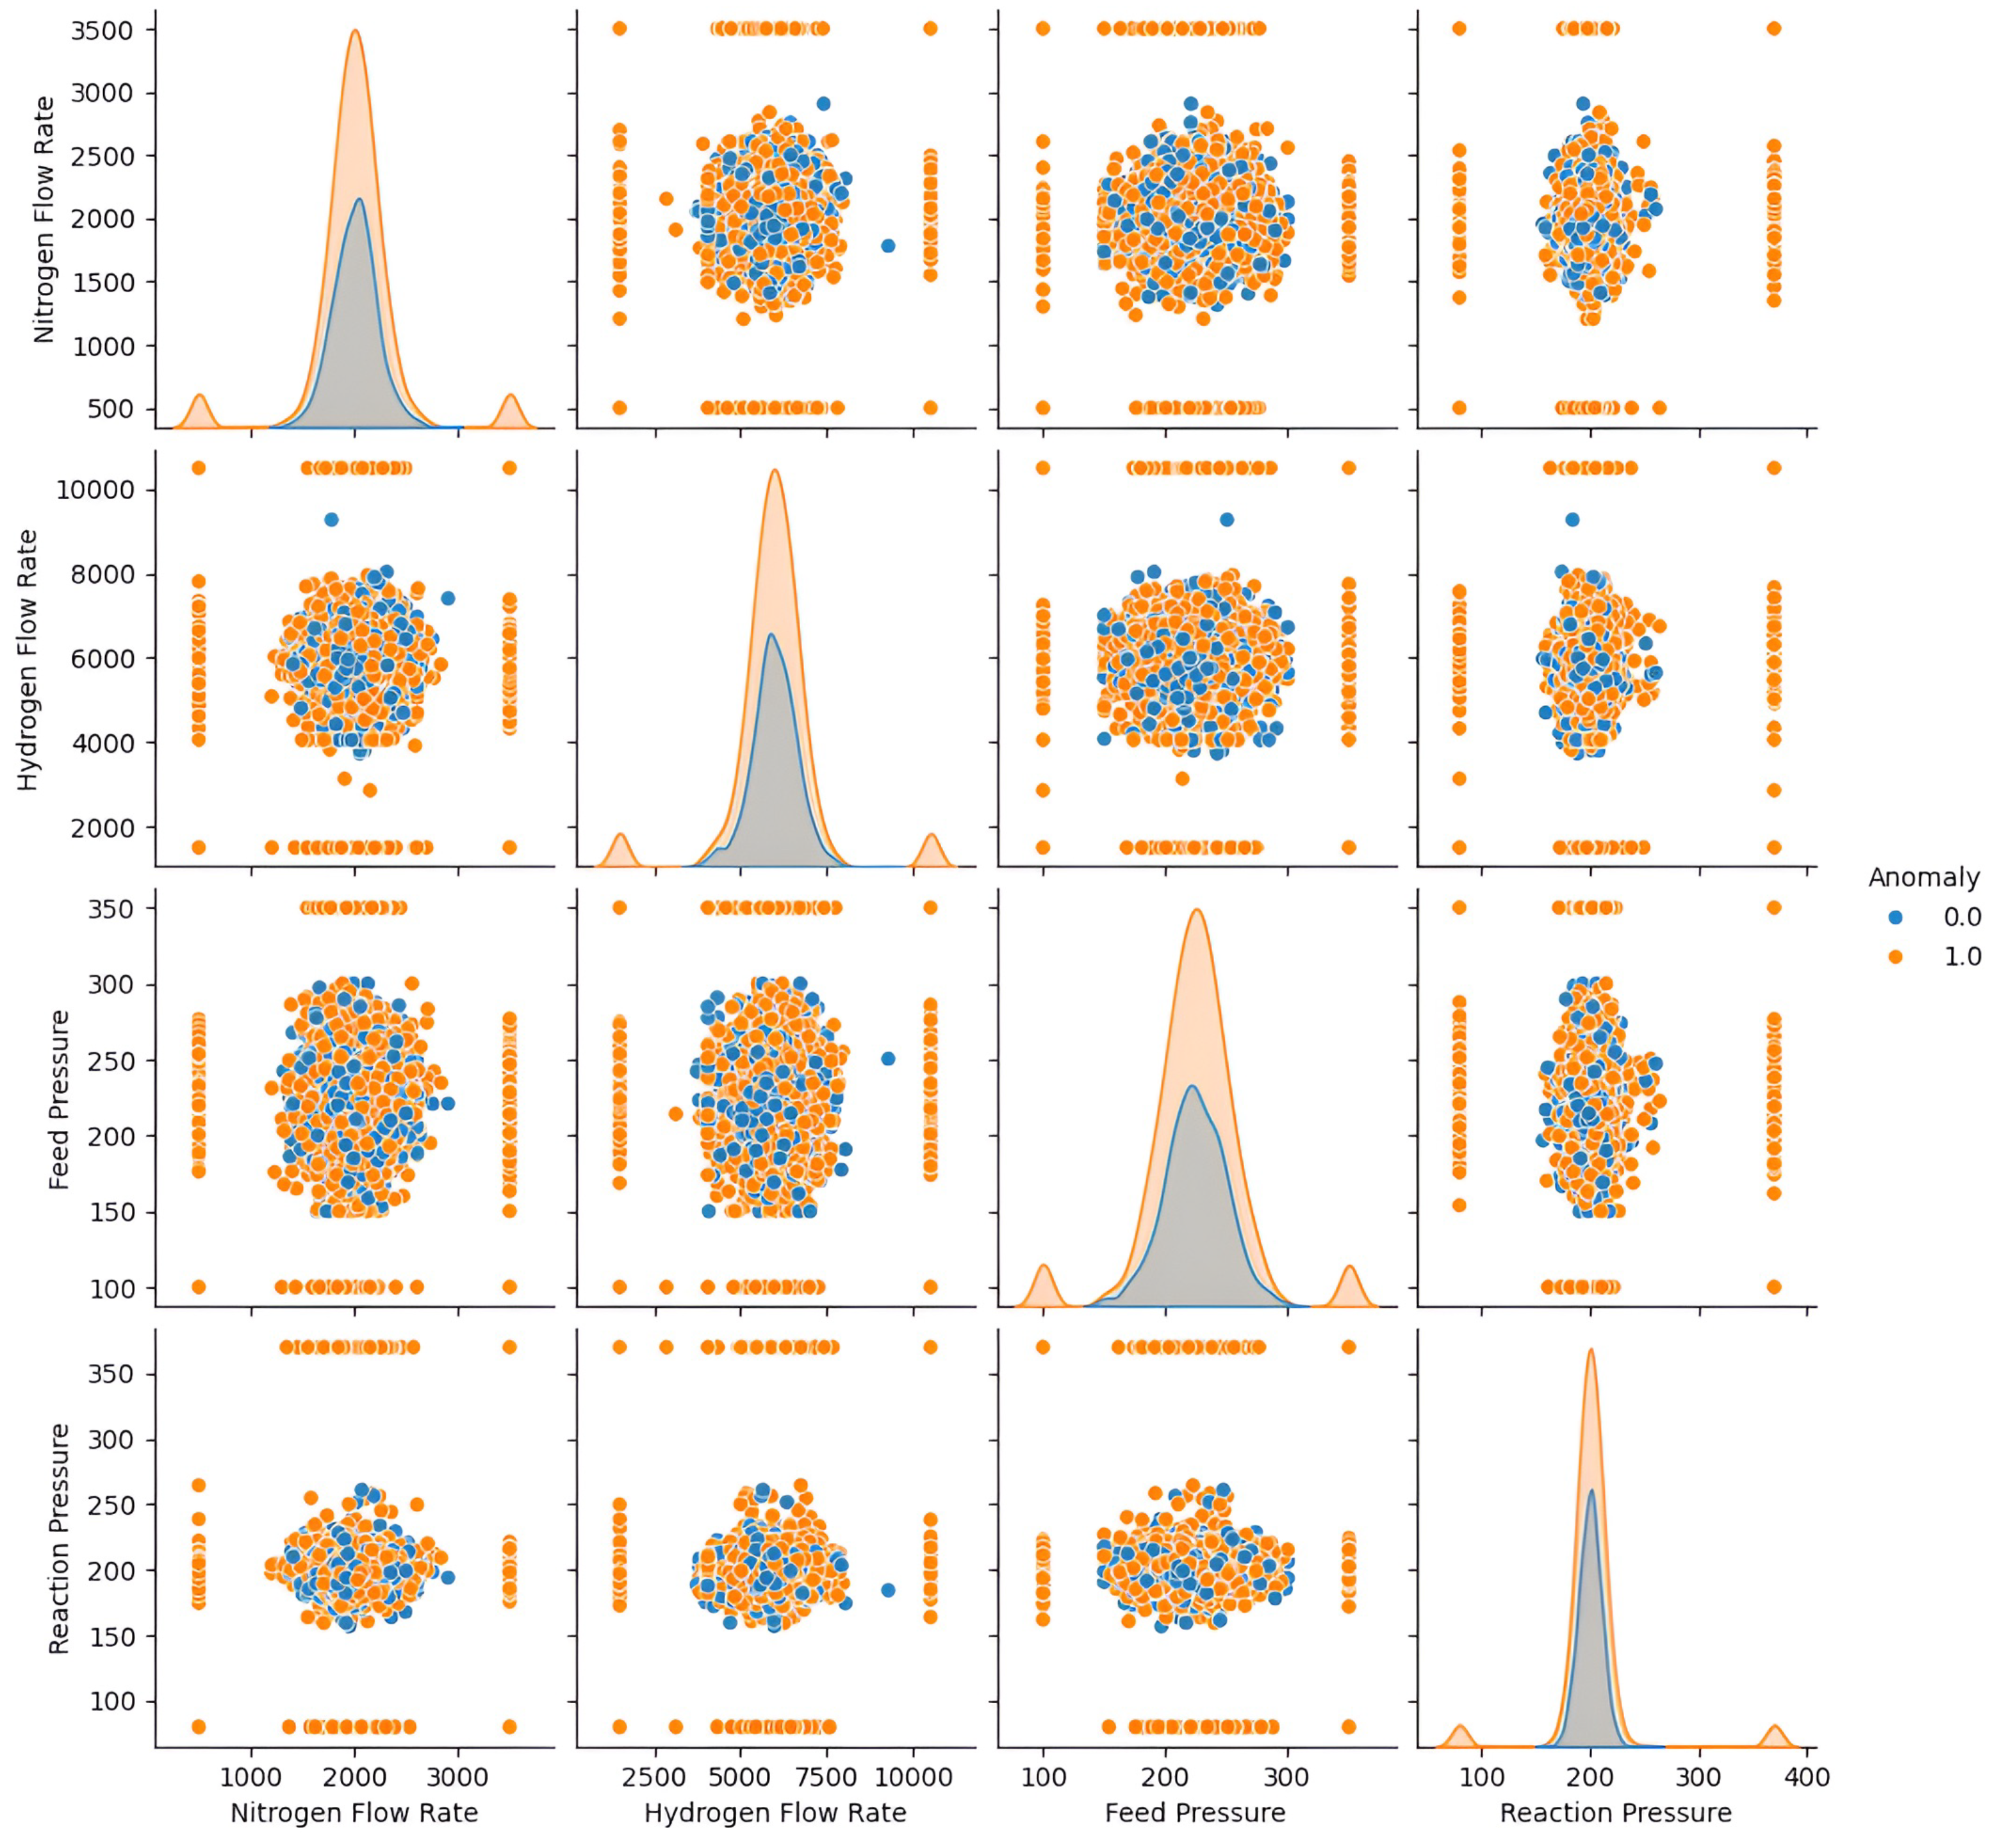
Figure A2.
Correlation heatmap of ammonia synthesis process variables, illustrating linear dependencies and interaction patterns among key operational parameters.
Figure A2.
Correlation heatmap of ammonia synthesis process variables, illustrating linear dependencies and interaction patterns among key operational parameters.
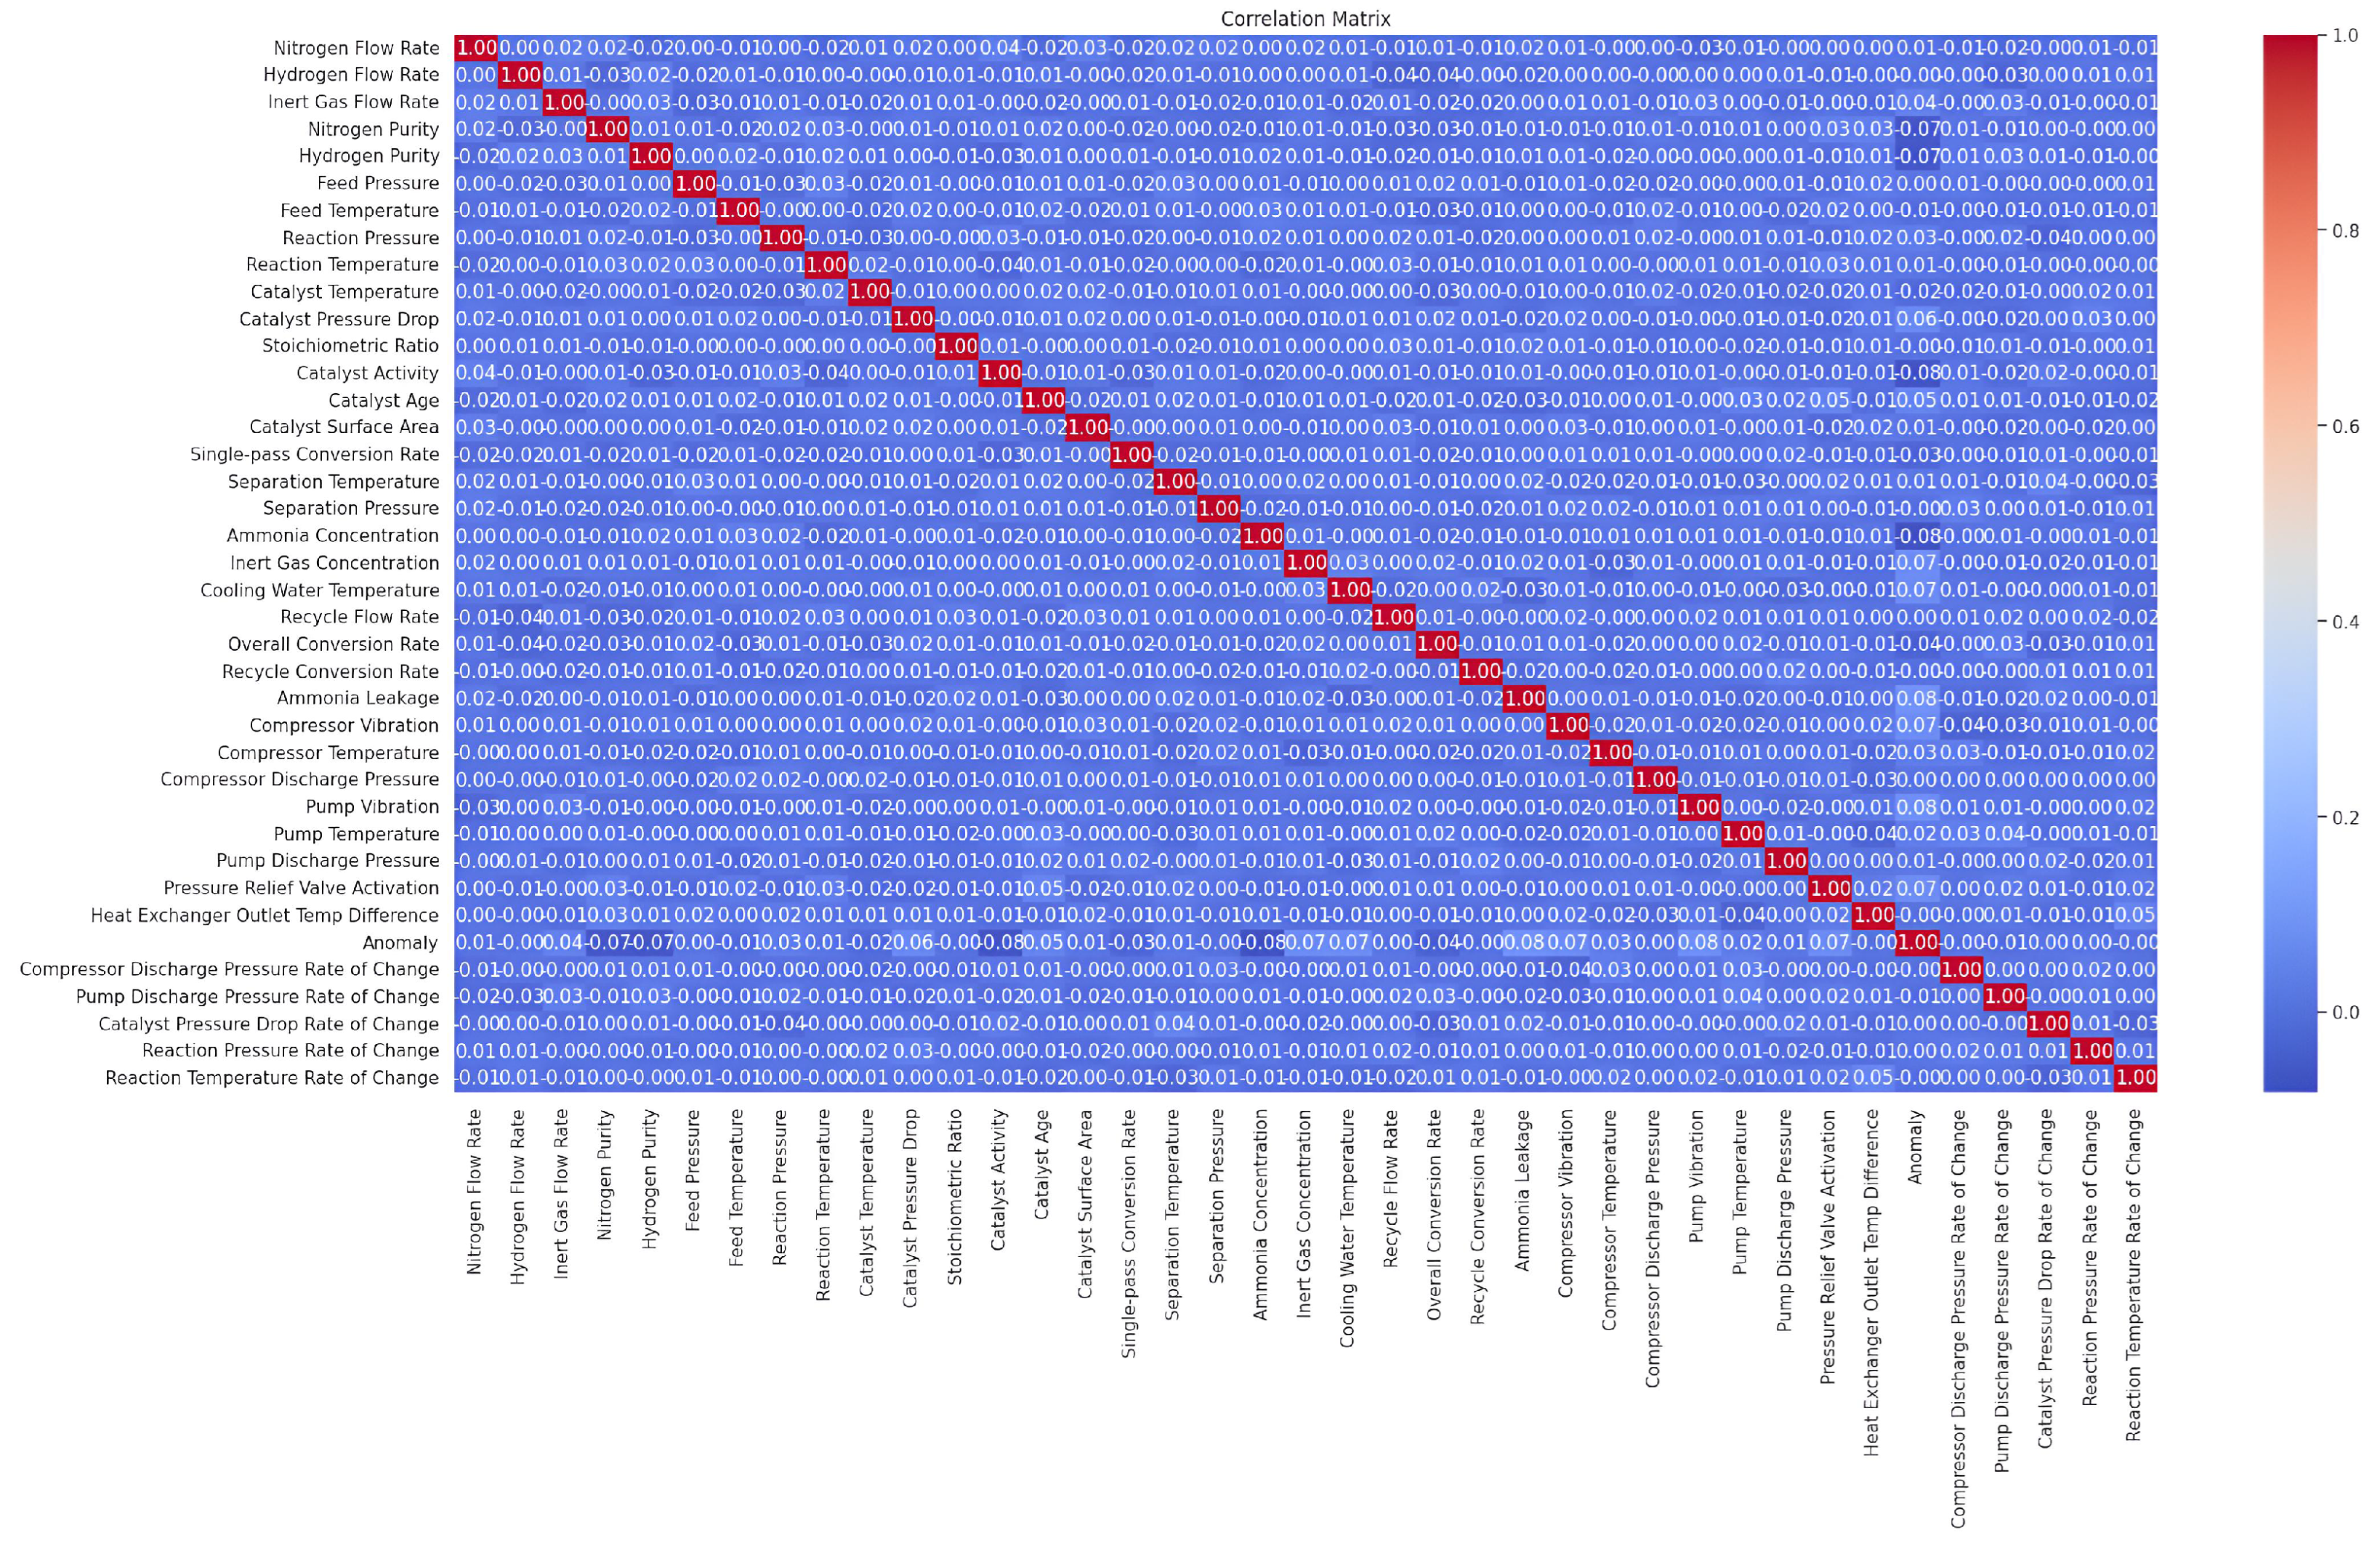
Figure A3.
Scree plot showing the explained variance ratio of successive principal components, used to guide dimensionality reduction selection.
Figure A3.
Scree plot showing the explained variance ratio of successive principal components, used to guide dimensionality reduction selection.
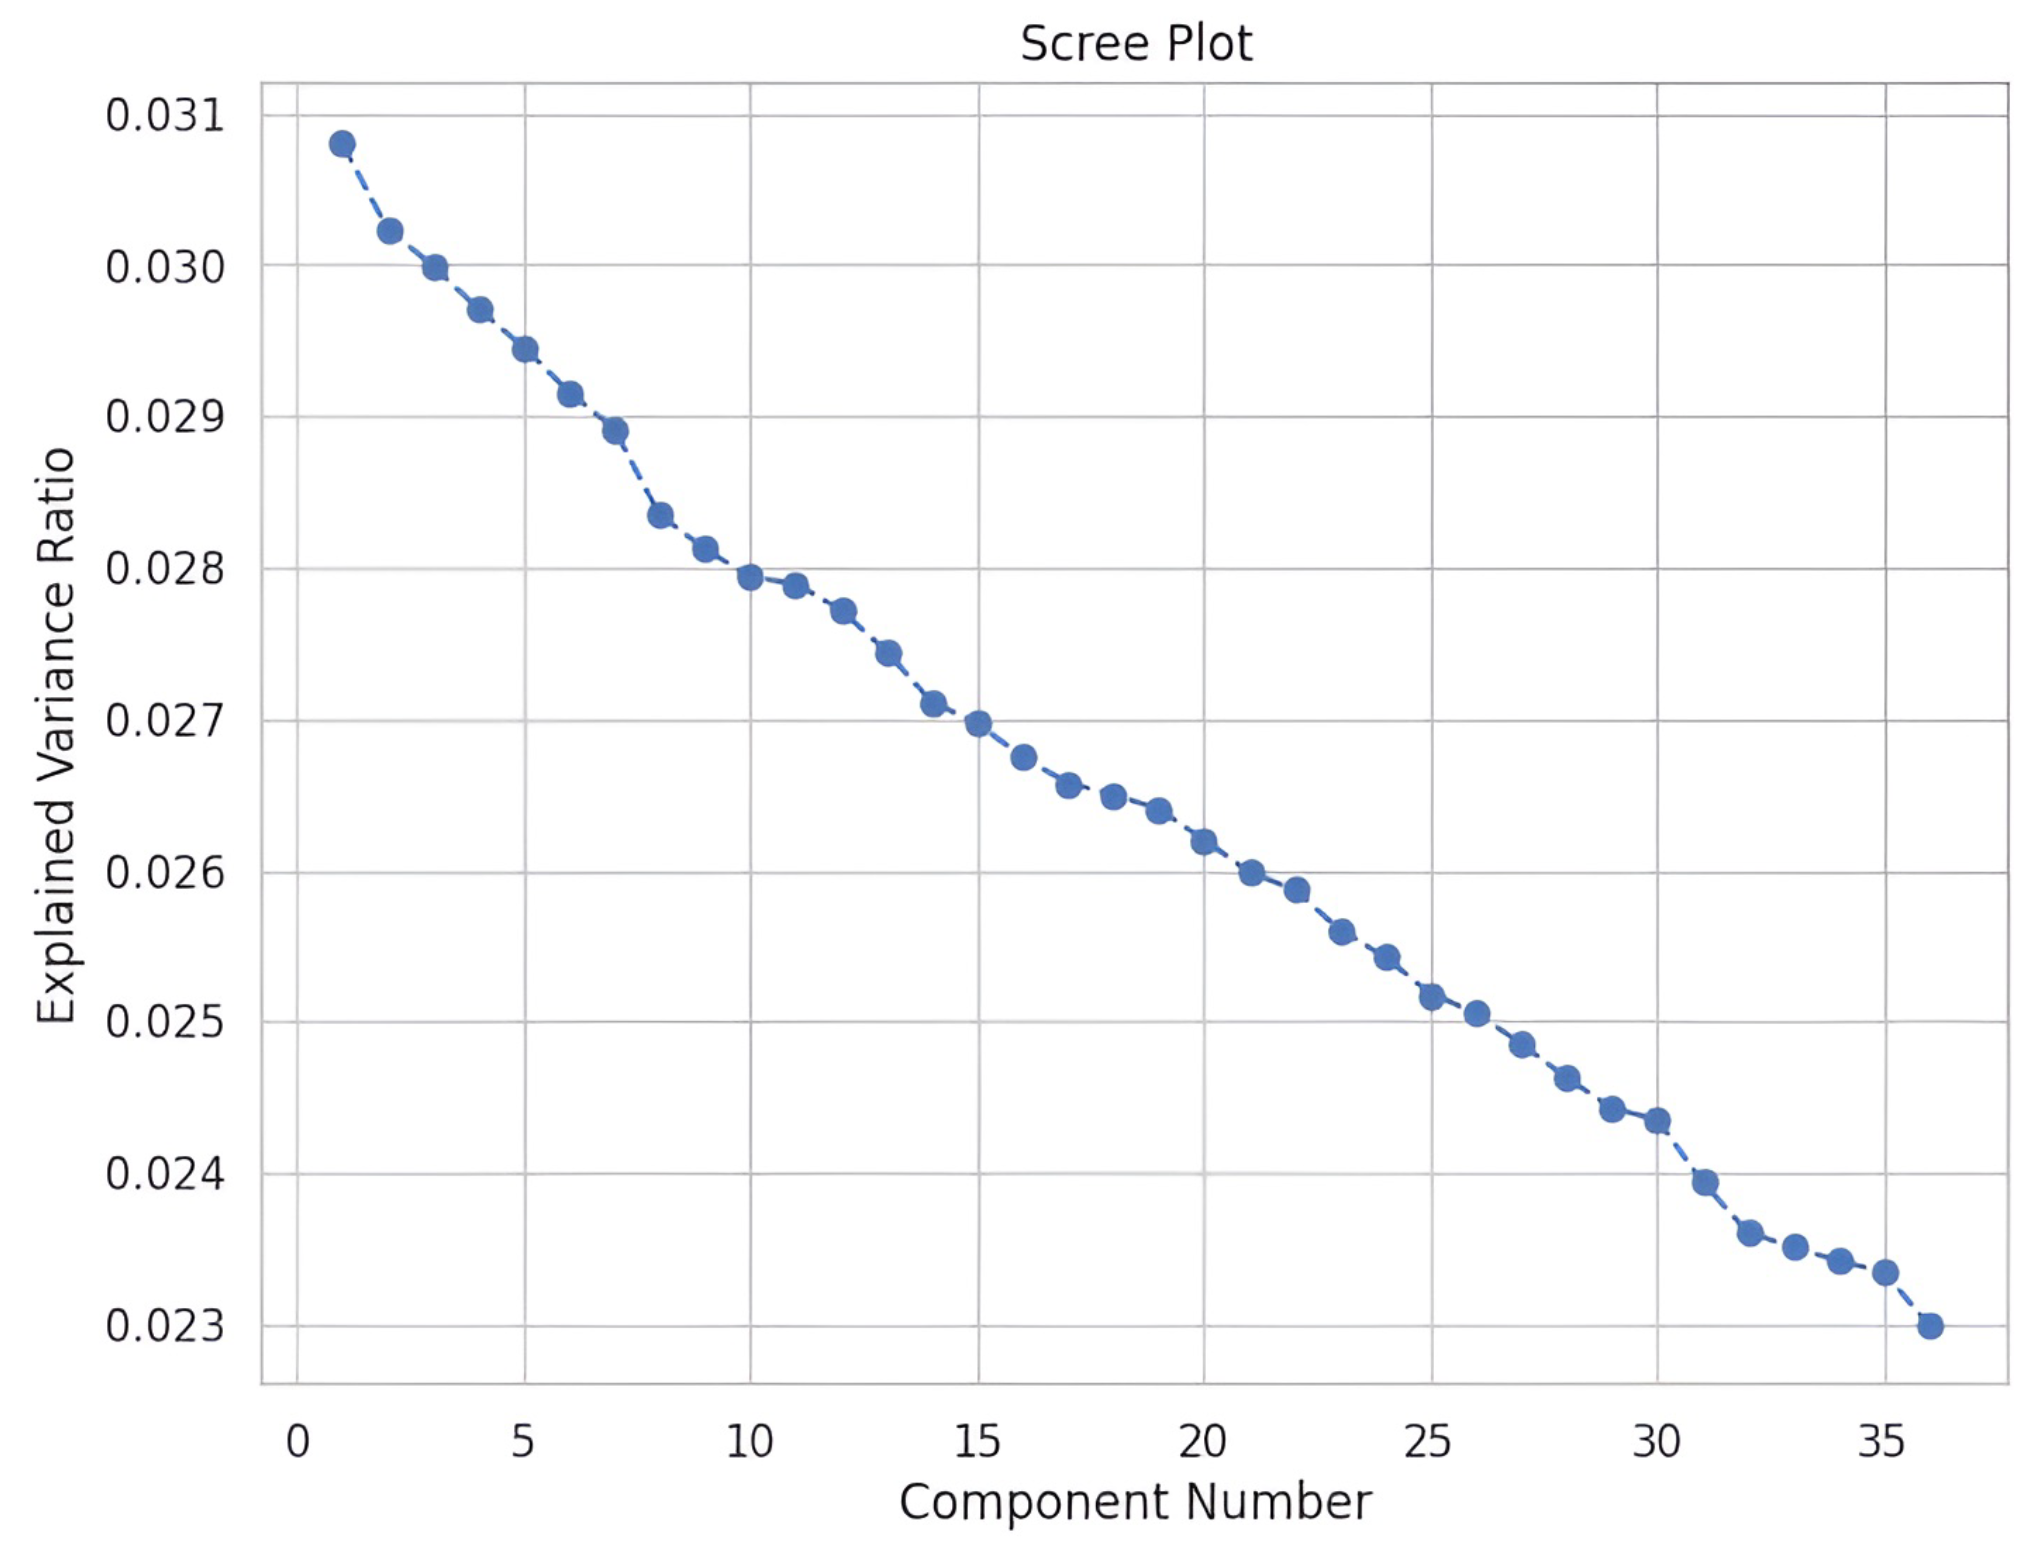
Figure A4.
Variation in cross-validated model accuracy as a function of the number of retained principal components, illustrating the impact of dimensionality reduction on predictive performance.
Figure A4.
Variation in cross-validated model accuracy as a function of the number of retained principal components, illustrating the impact of dimensionality reduction on predictive performance.
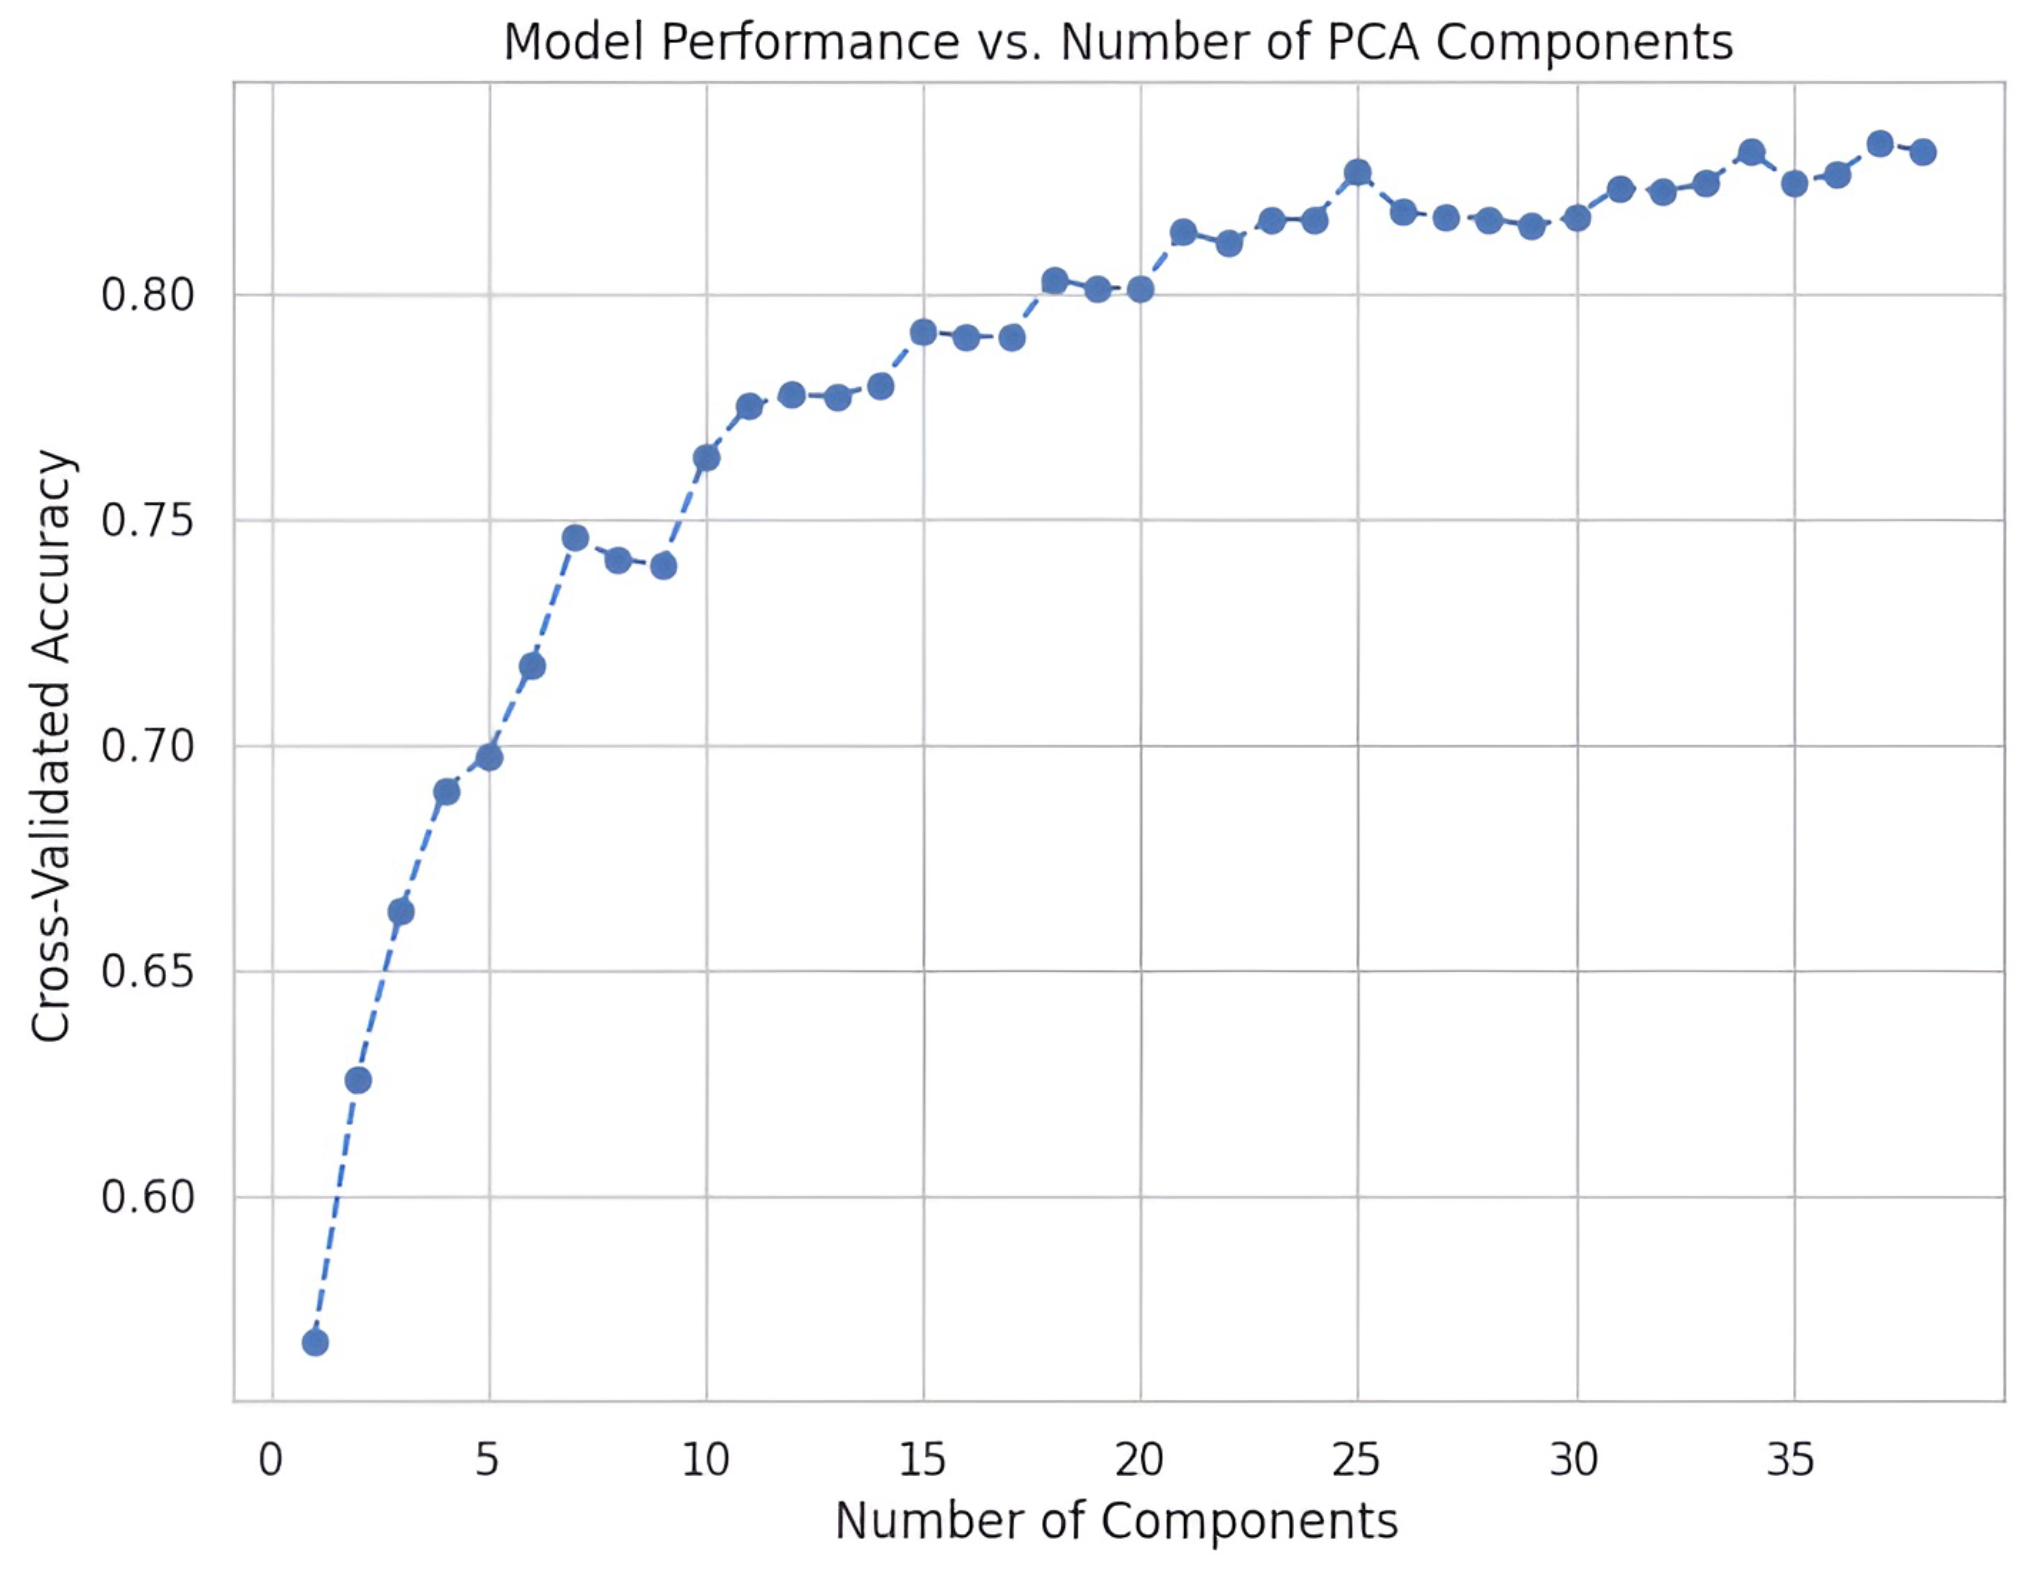
Figure A5.
Distribution of normal and anomalous data samples in the dataset, illustrating the relative frequency of regular operating conditions and detected anomalies.
Figure A5.
Distribution of normal and anomalous data samples in the dataset, illustrating the relative frequency of regular operating conditions and detected anomalies.
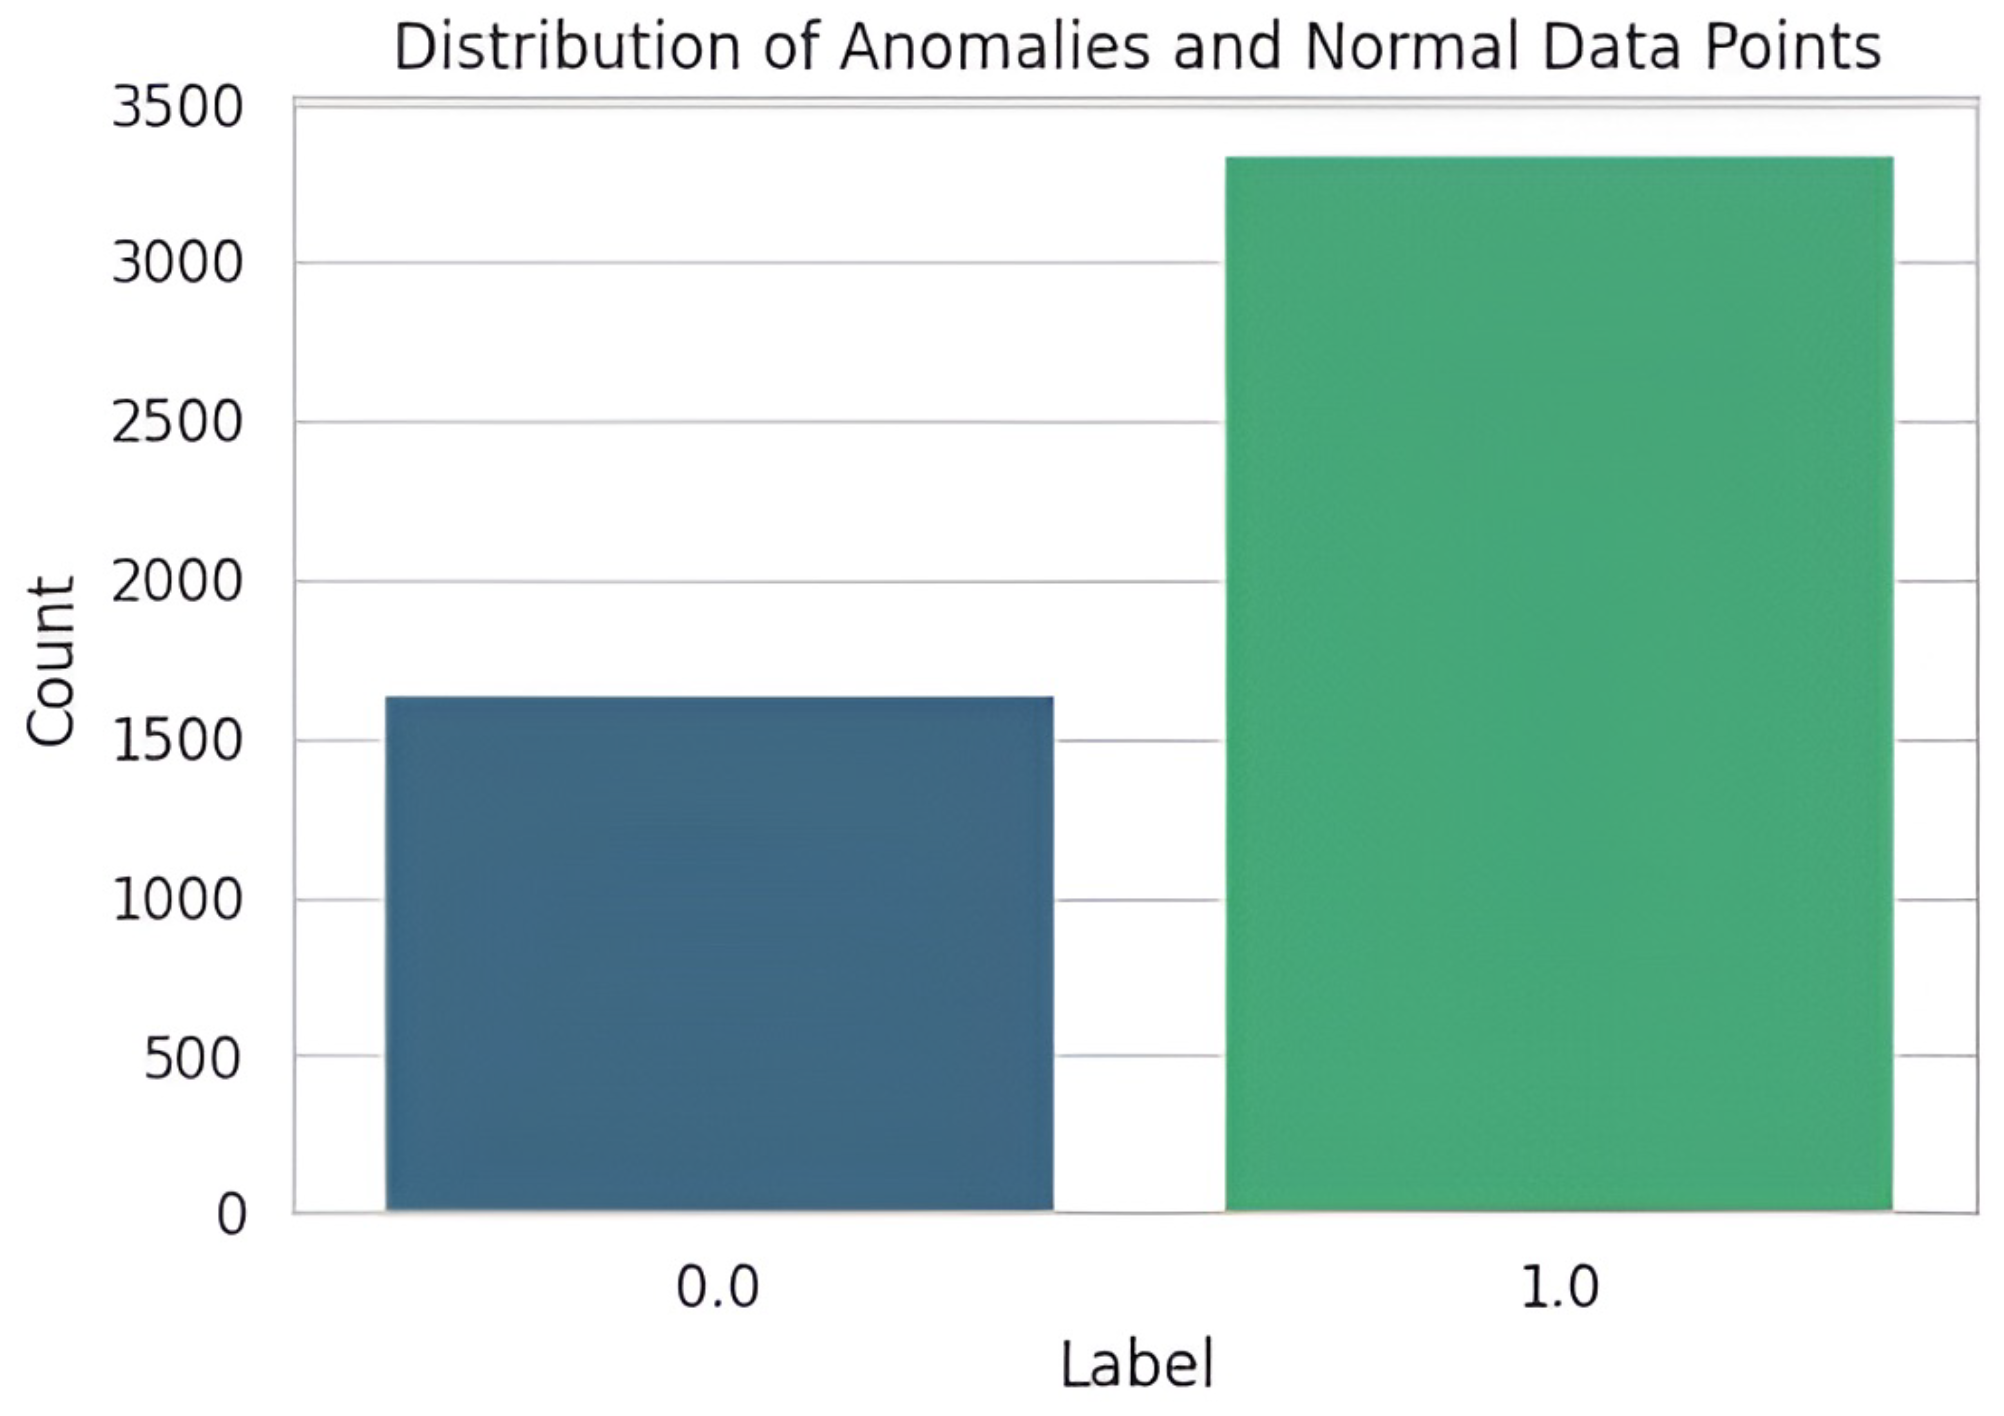
Figure A6.
Cumulative explained variance as a function of the number of principal components, illustrating the proportion of total variance captured with increasing dimensionality and the threshold used to guide component selection.
Figure A6.
Cumulative explained variance as a function of the number of principal components, illustrating the proportion of total variance captured with increasing dimensionality and the threshold used to guide component selection.
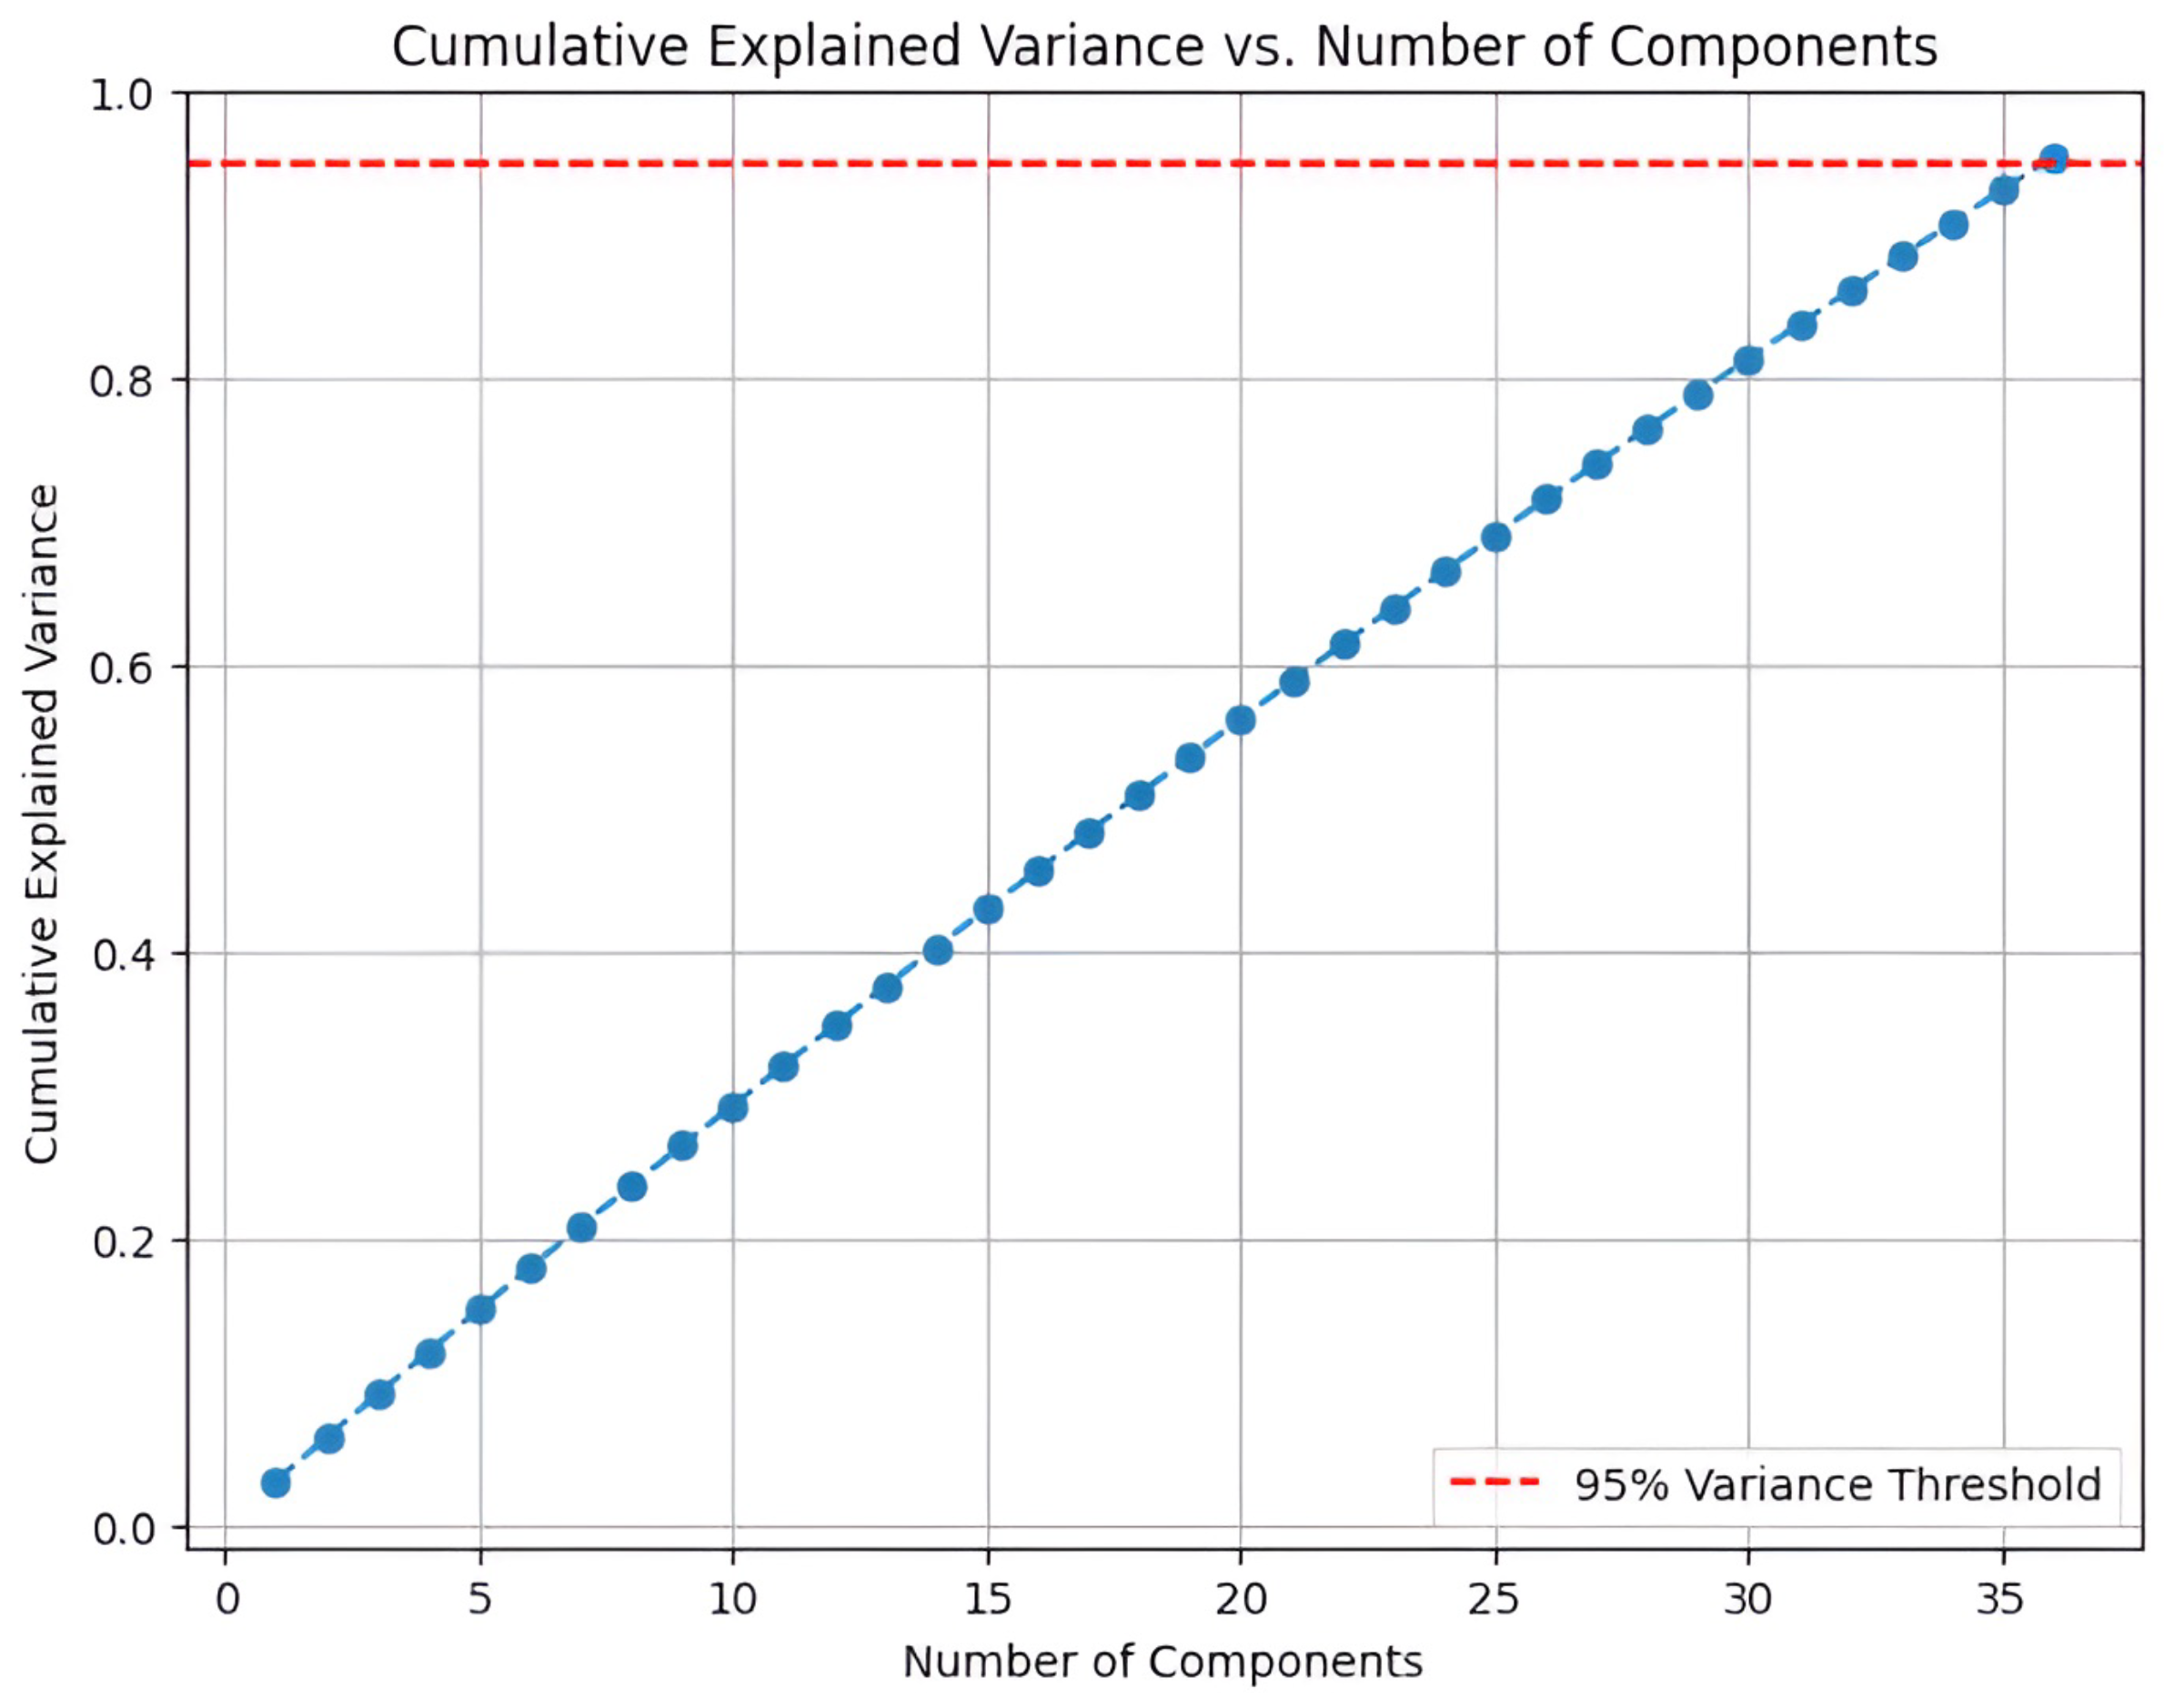
Figure A7.
Global SHAP summary plot illustrating the relative importance and directional impact of process variables on model predictions.
Figure A7.
Global SHAP summary plot illustrating the relative importance and directional impact of process variables on model predictions.
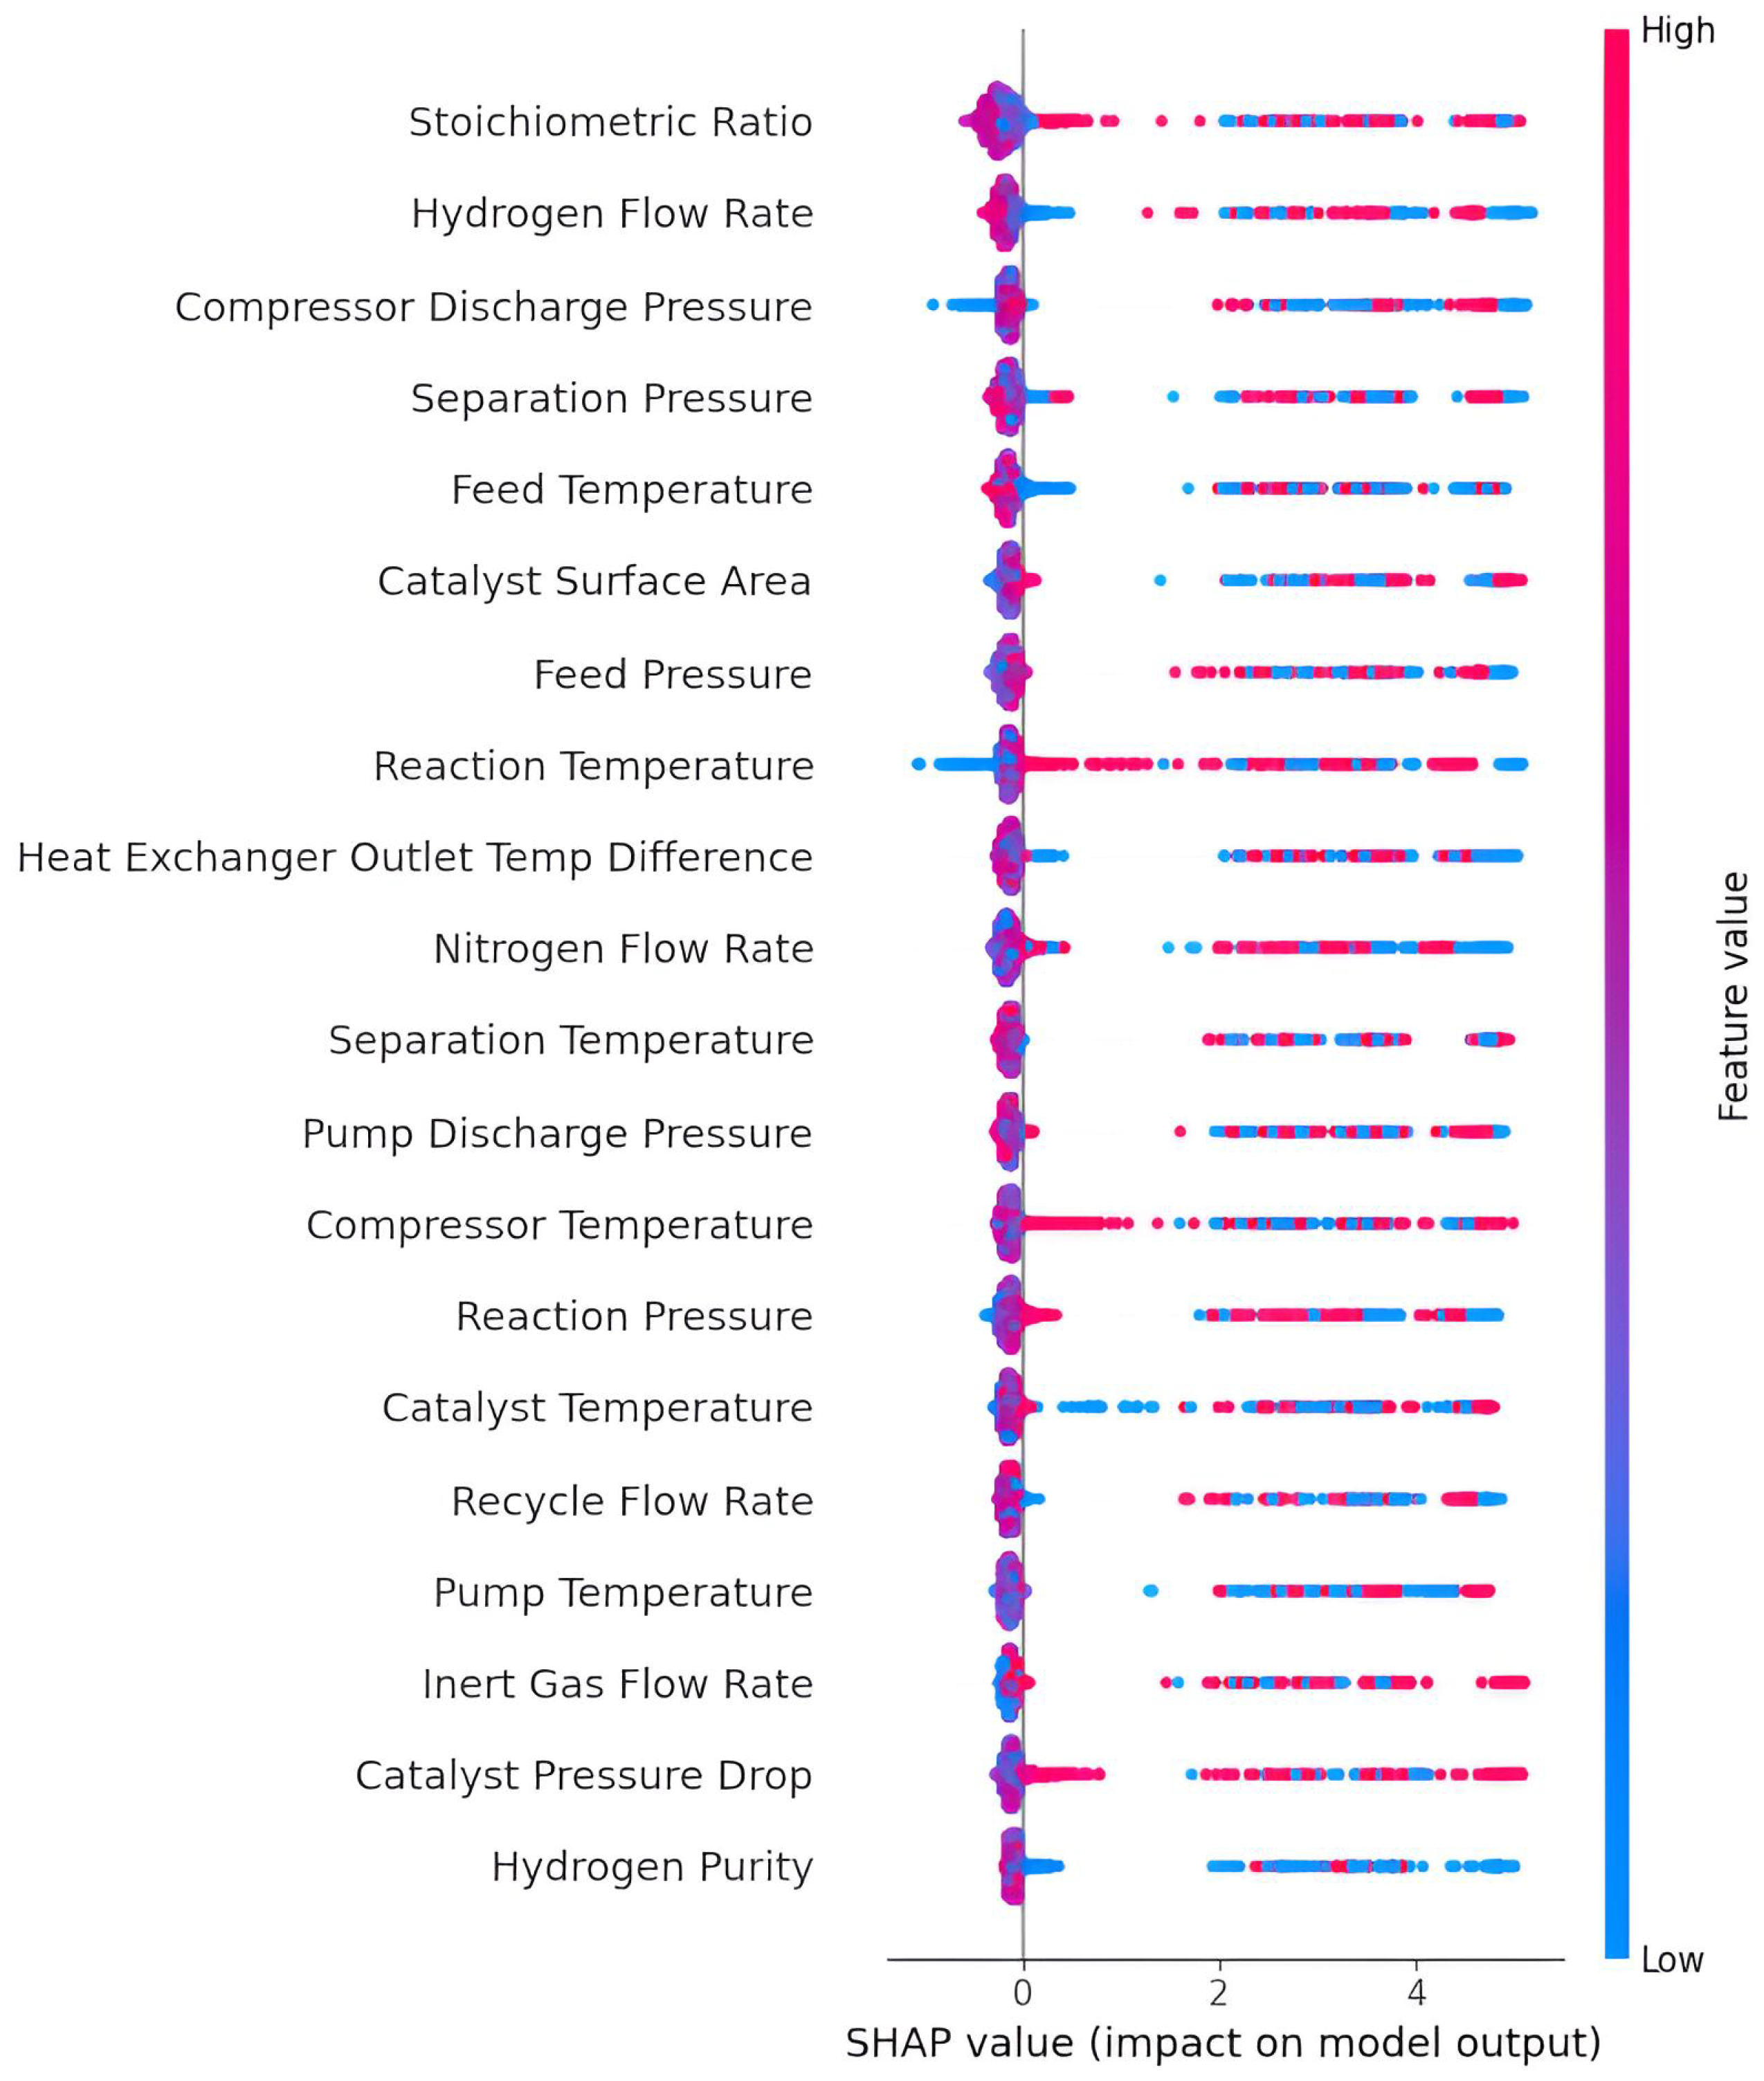
| Algorithm A1 SHAP-Based Model Interpretability for Anomaly Detection |
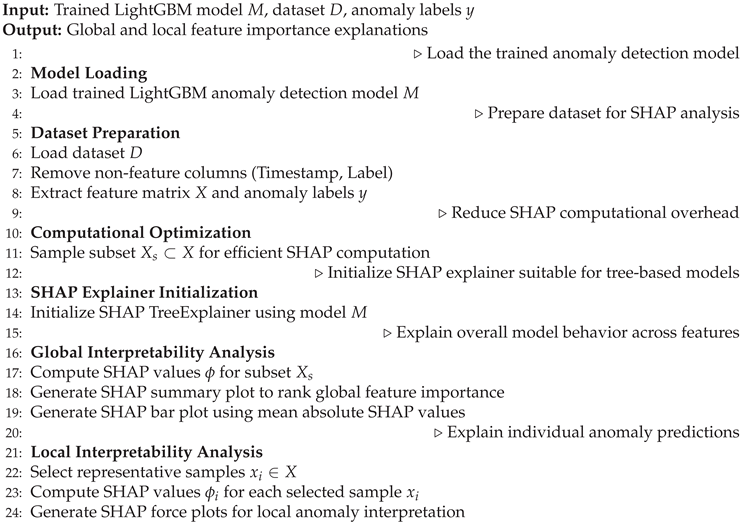 |
Figure A8.
Composite curve analysis for process heat integration, illustrating heat availability-demand matching and the corresponding pinch point constraints.
Figure A8.
Composite curve analysis for process heat integration, illustrating heat availability-demand matching and the corresponding pinch point constraints.
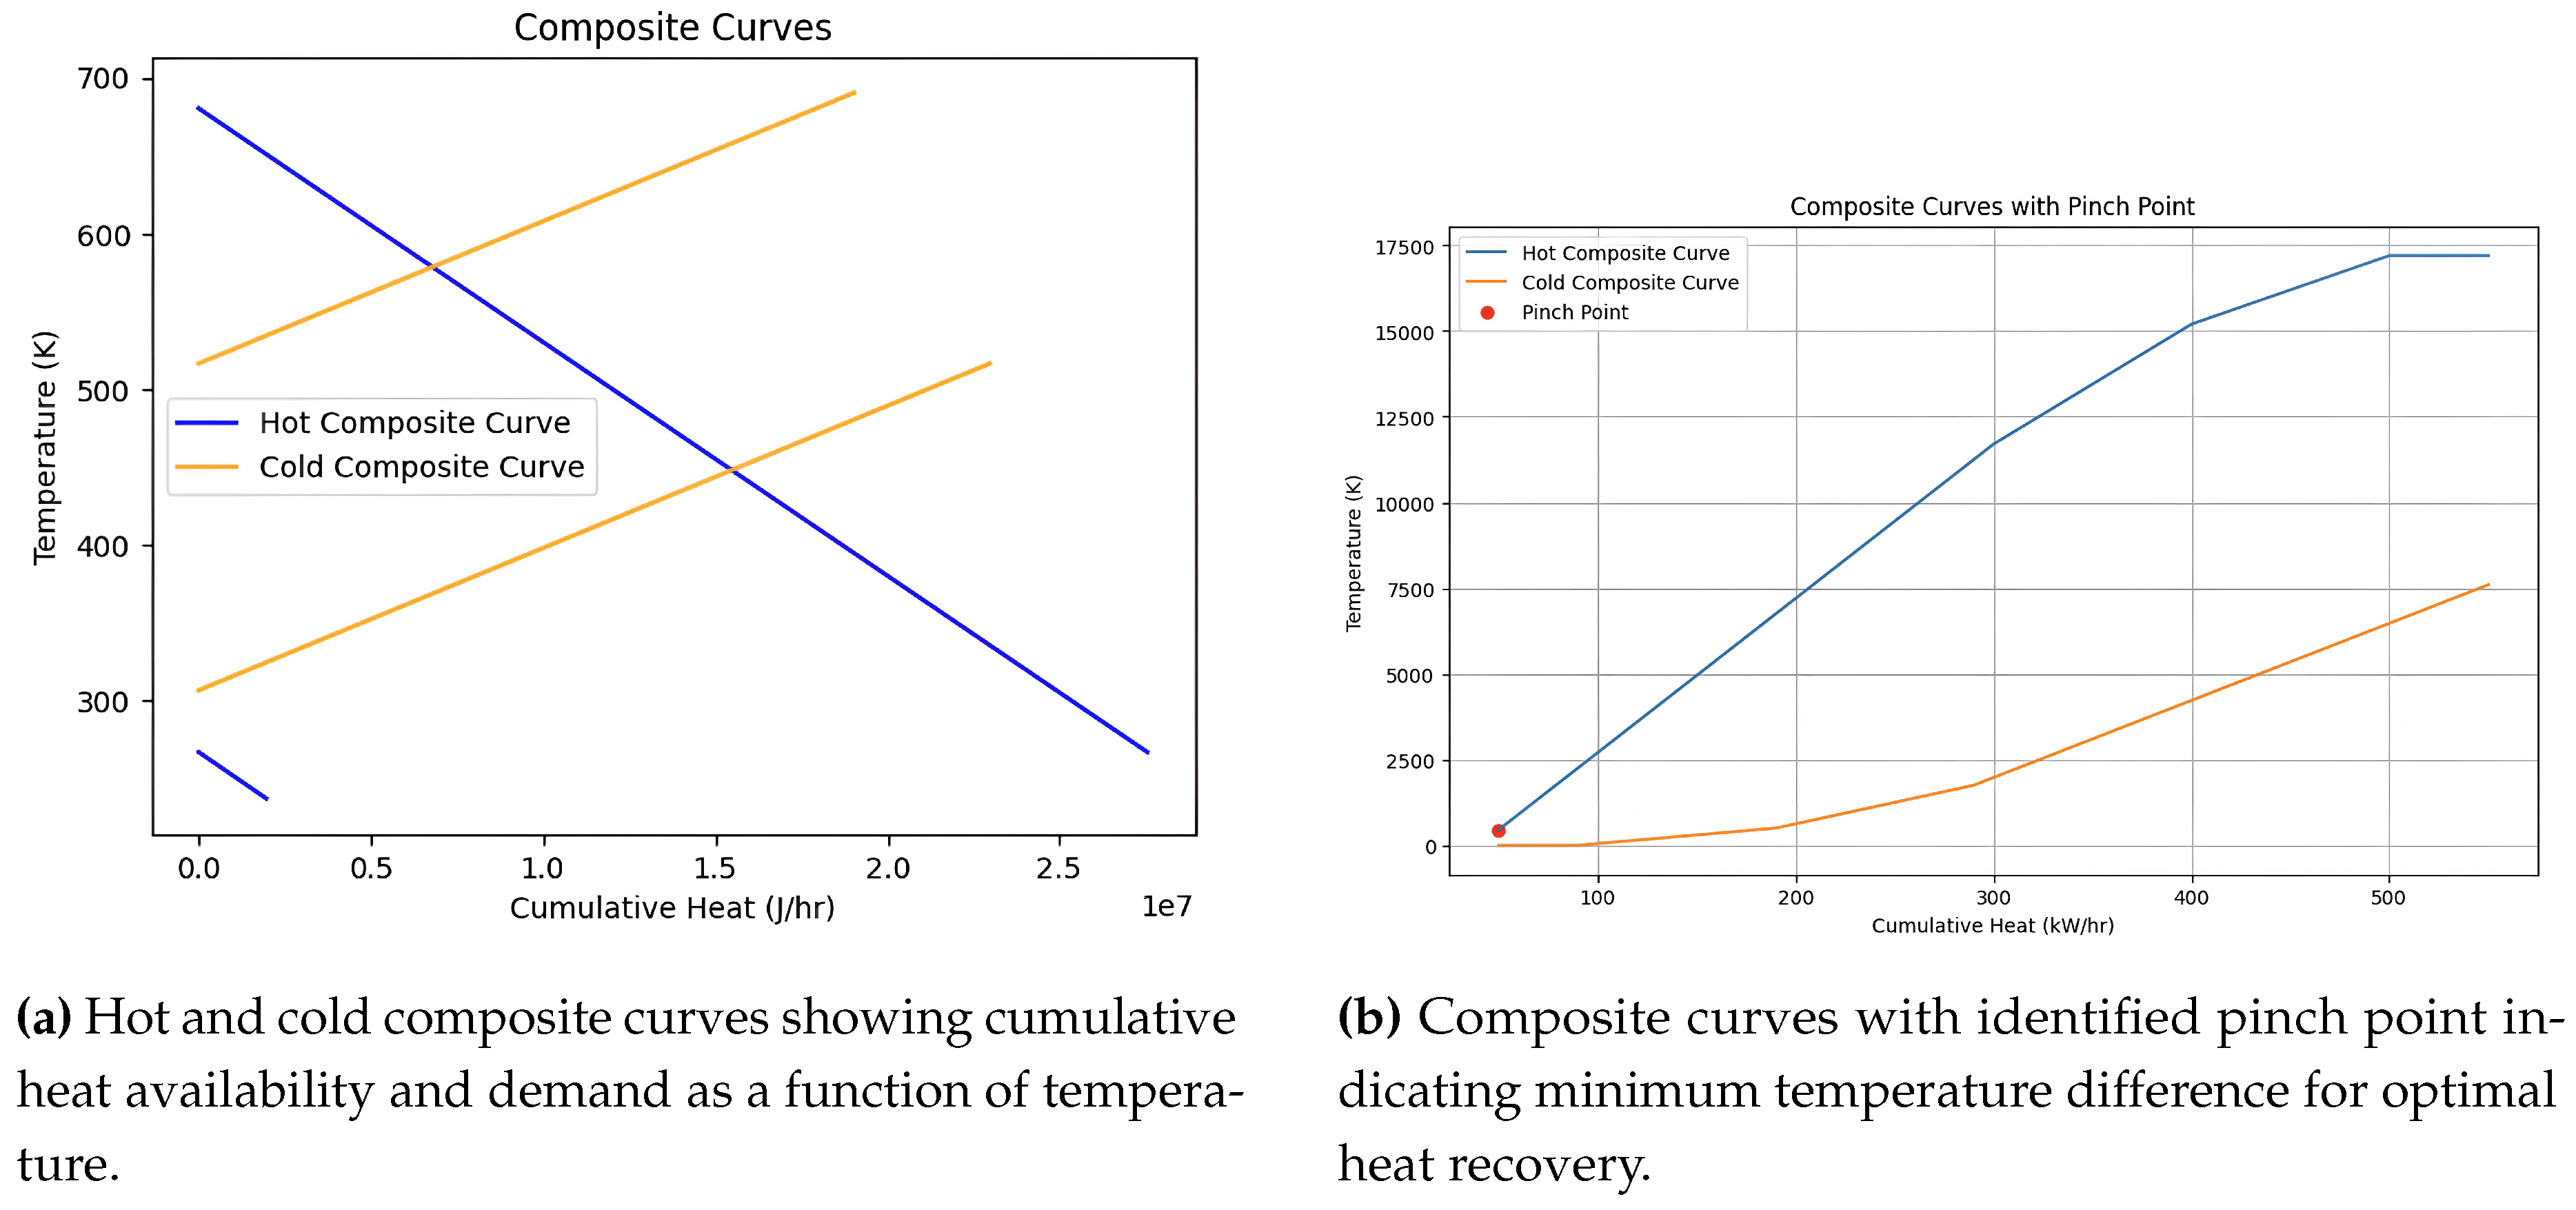
References
- Gupta, K. A Review of Major Chemical Accidents and their Causes. Journal of Safety Research 2018, 64, 39–52. [Google Scholar]
- Tianjin Explosion: A Comprehensive Review. Chemical Engineering Transactions 2015, 45, 123–128.
- Smith, A. Lessons from Texas City Refinery Explosion. Safety Journal 2010, 15, 15–22. [Google Scholar]
- Federation of Indian Chambers of Commerce; Industry. India’s Chemical Industry: Market Overview. Technical report. Federation of Indian Chambers of Commerce & Industry, 2020. [Google Scholar]
- National Disaster Management Authority. Chemical Accidents in India: Statistics and Trends. Technical report. National Disaster Management Authority, 2020. [Google Scholar]
- International Labour Organization. Global Trends in Industrial Accidents. Technical report; International Labour Organization, 2022. [Google Scholar]
- Jiang, Q.; Liu, Y.; Li, Z.; Huang, B. A Review of Data-Driven Fault Detection Methods for Industrial Processes. Journal of Process Control 2019, 79, 3–17. [Google Scholar]
- Singh, R.; Rengaswamy, R.; Venkatasubramanian, V. Machine Learning Techniques for Fault Detection in Industrial Processes. IFAC-PapersOnLine 2020, 53, 2653–2658. [Google Scholar]
- Patel, S.; Gupta, A. Machine Learning for Real-Time Anomaly Detection in Chemical Processes. Chemical Engineering Journal 2021, 398, 125–136. [Google Scholar]
- Chen, L.; Zhang, H.; Wang, J. Deep Learning-Based Anomaly Detection for Chemical Process Industries. Computers & Chemical Engineering 2023, 175, 108234. [Google Scholar]
- Wang, S.; Li, X.; Zhao, Y. Predictive Maintenance Framework for Chemical Process Equipment Using AI. Journal of Loss Prevention in the Process Industries 2023, 82, 104956. [Google Scholar]
- Kumar, A.; Singh, P.; Patel, R. Real-Time Process Monitoring Using Edge Computing and Machine Learning. IEEE Transactions on Industrial Electronics 2023, 70, 8234–8243. [Google Scholar]
- Li, Z.; Chen, W.; Zhang, M. Explainable AI for Industrial Safety: A Comprehensive Review. AI & Safety Journal 2023, 12, 145–162. [Google Scholar]
- Singh, M.; Gupta, K.; Sharma, A. Digital Twin Technology for Process Safety and Optimization in Chemical Plants. Process Safety and Environmental Protection 2023, 175, 456–468. [Google Scholar]
- Patel, N.; Brown, J.; Davis, K. IoT Integration for Real-Time Safety Monitoring in Chemical Industries. Sensors 2023, 23, 6421. [Google Scholar]
- Wang, Y.; Li, Z.; Zhao, M. Adaptive Threshold Selection for Real-Time Anomaly Detection. Control Engineering Practice 2024, 146, 105912. [Google Scholar]
- Gupta, S.; Verma, R.; Singh, A. Safety-Critical AI Systems: Design and Validation. Journal of Loss Prevention in the Process Industries 2024, 88, 105234. [Google Scholar]
- U.S. Chemical Safety Board. Investigations into Chemical Safety Failures. Technical report. U.S. Chemical Safety Board, 2022. [Google Scholar]
- U.S. Chemical Safety and Hazard Investigation Board. Investigation Report: Improving Safety in the Chemical Industry. Technical report. U.S. Chemical Safety and Hazard Investigation Board, 2021. [Google Scholar]
- World Health Organization. Health Effects of Chemical Exposures. Technical report; World Health Organization, 2019. [Google Scholar]
- Lee, J. Chemical Exposure and Occupational Health: A Review. Journal of Industrial Toxicology 2020, 52, 75–82. [Google Scholar]
- Singh, A.; Patel, M.; Sharma, R. Multimodal Data Fusion for Enhanced Process Safety Monitoring. IEEE Transactions on Automation Science and Engineering 2024, 21, 1234–1245. [Google Scholar]
- Chen, M.; Wu, X.; Zhang, H. Robust Anomaly Detection Under Sensor Faults and Missing Data. IEEE Transactions on Instrumentation and Measurement 2024, 73, 5008123. [Google Scholar]
- Gupta, R.; Verma, S.; Kumar, A. Cybersecurity in Industrial AI Systems: Challenges and Solutions. Computers & Security 2024, 138, 103678. [Google Scholar]
- Liu, X.; Zhang, P.; Chen, H. Edge AI for Low-Latency Anomaly Detection in Industrial Processes. IEEE Internet of Things Journal 2024, 11, 14567–14578. [Google Scholar]
- Kletz, T. What Went Wrong? Case Histories of Process Plant Disasters and How They Could Have Been Avoided, 5 ed.; Butterworth-Heinemann, 2009. [Google Scholar]
- Venkatasubramanian, V.; Rengaswamy, R.; Yin, K.; Kavuri, S.N. A Review of Process Fault Detection and Diagnosis: Part I: Quantitative Model-Based Methods. Computers & Chemical Engineering 2003, 27, 293–311. [Google Scholar]
- Breiman, L. Random Forests. Machine Learning 2001, 45, 5–32. [Google Scholar] [CrossRef]
- Chawla, N.V.; Bowyer, K.W.; Hall, L.O.; Kegelmeyer, W.P. SMOTE: Synthetic Minority Over-sampling Technique. Journal of Artificial Intelligence Research 2002, 16, 321–357. [Google Scholar] [CrossRef]
- Gao, Z.; Wang, C.; Chen, Y. Unsupervised Fault Detection for Industrial Processes Using Autoencoders and Isolation Forests. Journal of Process Control 2021, 103, 1–12. [Google Scholar]
- Wang, H.; Li, M.; Zhao, X. Unsupervised Anomaly Detection Using Variational Autoencoders in Process Industries. Control Engineering Practice 2024, 144, 105823. [Google Scholar]
- Zhang, L.; Wang, S.; Li, Y. Graph Neural Networks for Process Topology-Aware Anomaly Detection. Computers & Chemical Engineering 2024, 183, 108567. [Google Scholar]
- Chen, Y.; Wu, L.; Zhang, K. Transfer Learning for Fault Detection Across Different Chemical Processes. Journal of Process Control 2024, 135, 103156. [Google Scholar]
- Gupta, P.; Singh, N.; Verma, A. Human Factors in AI-Assisted Process Safety Systems. Safety Science 2024, 172, 106345. [Google Scholar]
- Liu, H.; Zhang, W.; Chen, L. Explainability Methods for Industrial AI: A Comparative Study. AI & Safety Journal 2024, 13, 89–104. [Google Scholar]
- Patel, M.; Shah, S. Dynamic Safety Frameworks for Process Industries. Journal of Loss Prevention in the Process Industries 2018, 53, 102–111. [Google Scholar]
- Zhou, K.; Liu, X.; Zhang, J.; Li, W. AI and IoT for Process Safety: A Comprehensive Review. Journal of Cleaner Production 2020, 275, 123068. [Google Scholar]
- Zhang, J.; Li, C.; Zhao, W.; et al. Federated learning for medical imaging: a guide for radiologists. Nature Communications 2023, 14, 1–15. [Google Scholar]
- Zhang, K.; Li, M.; Wang, X. Federated Learning for Collaborative Safety Across Chemical Plants. IEEE Transactions on Industrial Informatics 2024, 20, 7890–7901. [Google Scholar]
- Kim, S.; Park, H.; Lee, J. Reinforcement Learning for Adaptive Process Control in Chemical Manufacturing. Chemical Engineering Science 2024, 285, 119567. [Google Scholar]
- Patel, A.; Brown, M.; Davis, P. Multi-Objective Optimization for Process Safety and Efficiency. Industrial & Engineering Chemistry Research 2024, 63, 6789–6801. [Google Scholar]
- Kim, H.; Park, J.; Lee, K. Real-Time Process Optimization Using Online Machine Learning. Computers & Chemical Engineering 2024, 184, 108678. [Google Scholar]
- Smith, J.; Brown, T. Advances in Industrial Automation: Challenges and Opportunities for AI Integration. Journal of Industrial Engineering 2020, 45, 123–134. [Google Scholar]
- Chen, X.; Liu, Y. AI-Driven Frameworks for Intelligent Manufacturing. International Journal of Advanced Manufacturing Technology 2021, 115, 2101–2112. [Google Scholar]
- Davis, M.; Thompson, E. Web-Based Interfaces for Industrial AI Applications. Journal of Software Engineering 2023, 27, 88–99. [Google Scholar]
- Kim, J.; Park, M.; Lee, S. Time Series Forecasting for Predictive Safety in Chemical Processes. Chemical Engineering Journal 2024, 485, 149823. [Google Scholar]
- Carter, P.; Evans, R. Interactive Data Visualization for Industrial Applications. Data Science Journal 2021, 20, 45–56. [Google Scholar]
- Patel, S.; Kumar, V.; Brown, T. Causal Inference for Root Cause Analysis in Process Industries. Journal of Process Control 2024, 136, 103245. [Google Scholar]
- Singh, K.; Patel, R.; Kumar, S. Ensemble Methods for Improved Anomaly Detection in Chemical Processes. Journal of Process Control 2024, 137, 103312. [Google Scholar]
- Lee, J.; Williams, M. Application of AI in Process Safety Management: Advances and Opportunities. AI & Safety Journal 2020, 9, 71–83. [Google Scholar]
- Wang, L.; Zhang, Y. Predictive Analytics for Process Optimization in Industrial Manufacturing. IEEE Transactions on Industrial Informatics 2022, 18, 789–799. [Google Scholar]
- Green, H.; Taylor, C. AI-Driven Sustainability in Chemical Manufacturing. Environmental Science & Technology 2022, 56, 234–245. [Google Scholar]
- Kim, H.; Park, J. Real-Time Logging Systems for Industrial Automation. Journal of Control Systems 2020, 33, 301–310. [Google Scholar]
- Johnson, R.; Lee, K. Modbus Communication Protocols in Industrial Control Systems. Automation Technology Review 2019, 12, 56–67. [Google Scholar]
- Smil, V. Enriching the Earth: Fritz Haber, Carl Bosch, and the Transformation of World Food Production; MIT Press, 2001. [Google Scholar]
- Ertl, G. Catalytic Ammonia Synthesis over Iron Catalysts. Catalysis Reviews: Science and Engineering 1980, 22, 201–240. [Google Scholar] [CrossRef]
- Liu, H. Ammonia Synthesis Catalyst 100 Years: Practice, Enlightenment and Challenge. Chinese Journal of Catalysis 2014, 35, 1619–1640. [Google Scholar] [CrossRef]
- Nielsen, A. Ammonia Synthesis: Catalyst and Reactor Design. Chemical Engineering Journal 2021, 419, 129–145. [Google Scholar]
- Moulijn, J.A.; Makkee, M.; van Diepen, A.E. Chemical Process Technology, 2 ed.; Wiley, 2013. [Google Scholar]
- Appl, M. Ammonia: Principles and Industrial Practice; Wiley-VCH, 1999. [Google Scholar]
- Levenspiel, O. Chemical Reaction Engineering, 3 ed.; Wiley, 1998. [Google Scholar]
- Bhopal Gas Tragedy: Lessons for Today. Journal of Industrial Safety 2019, 50, 123–129.
- Visakhapatnam Gas Leak: An Analysis. Journal of Industrial Safety 2021, 58, 110–116.
- Chen, X.; Wu, Y.; Zhang, Z. Process Knowledge Integration in Machine Learning Models for Better Generalization. AIChE Journal 2024, 70, e18345. [Google Scholar]
- Lundberg, S.M.; Lee, S.I. A Unified Approach to Interpreting Model Predictions. In Proceedings of the Advances in Neural Information Processing Systems, 2017; pp. 4765–4774. [Google Scholar]
- Snoek, J.; Larochelle, H.; Adams, R.P. Practical Bayesian Optimization of Machine Learning Algorithms. In Proceedings of the Advances in Neural Information Processing Systems, 2012; pp. 2951–2959. [Google Scholar]
- Ke, G.; Meng, Q.; Finley, T.; Wang, T.; Chen, W.; Ma, W.; Ye, Q.; Liu, T.Y. LightGBM: A Highly Efficient Gradient Boosting Decision Tree. In Proceedings of the Advances in Neural Information Processing Systems, 2017; pp. 3146–3154. [Google Scholar]
- Chen, T.; Guestrin, C. XGBoost: A Scalable Tree Boosting System. In Proceedings of the Proceedings of the 22nd ACM SIGKDD International Conference on Knowledge Discovery and Data Mining, 2016; pp. 785–794. [Google Scholar] [CrossRef]
- Perry, R.H.; Green, D.W. Perry’s Chemical Engineers’ Handbook, 9 ed.; McGraw-Hill Education, 2023. [Google Scholar]
- Zhang, W.; Li, H.; Chen, M. Optimal Temperature Difference Control in Industrial Heat Exchangers for Process Safety. Chemical Engineering Research and Design 2023, 195, 234–248. [Google Scholar] [CrossRef]
- Liu, Y.; Wang, X.; Kumar, S. Inert Gas Management in Ammonia Synthesis: Safety and Efficiency Considerations. Industrial & Engineering Chemistry Research 2023, 62, 7123–7135. [Google Scholar]
Figure 3.
Legacy PLC integration with an AI-integrated safety system using a Modbus RTU to Modbus TCP/IP gateway, enabling interoperability between existing control infrastructure and advanced safety analytics
Figure 3.
Legacy PLC integration with an AI-integrated safety system using a Modbus RTU to Modbus TCP/IP gateway, enabling interoperability between existing control infrastructure and advanced safety analytics
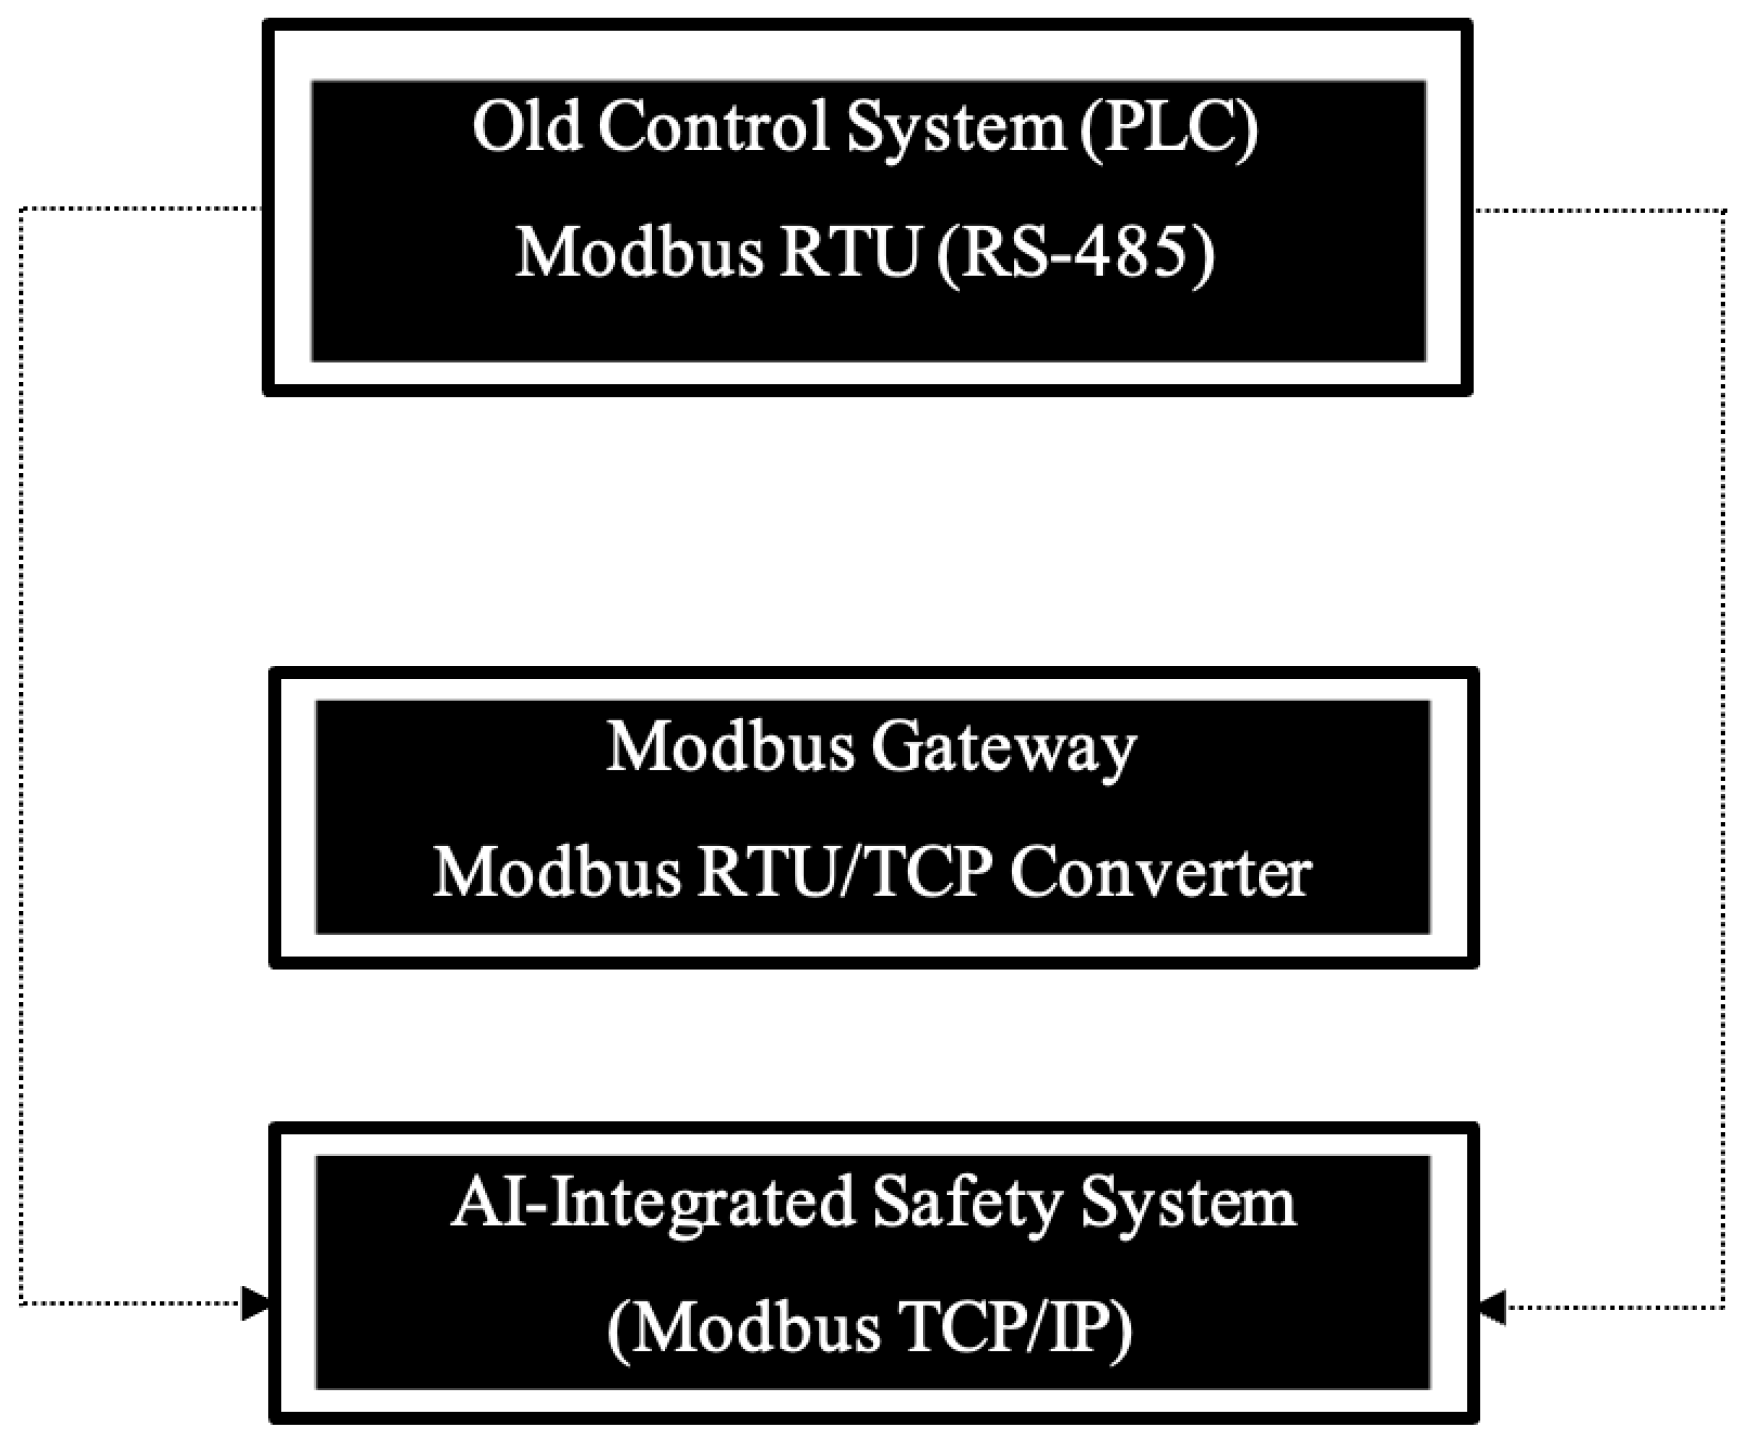
Figure 4.
User interface components of ChemSafeAI+: (a) SAP interface for anomaly detection, severity assessment, and shutdown control; (b) visualization and monitoring dashboards; (c) console log capturing safety actions and operator activity; (d) Overall interface of Dashboard with all the modules.
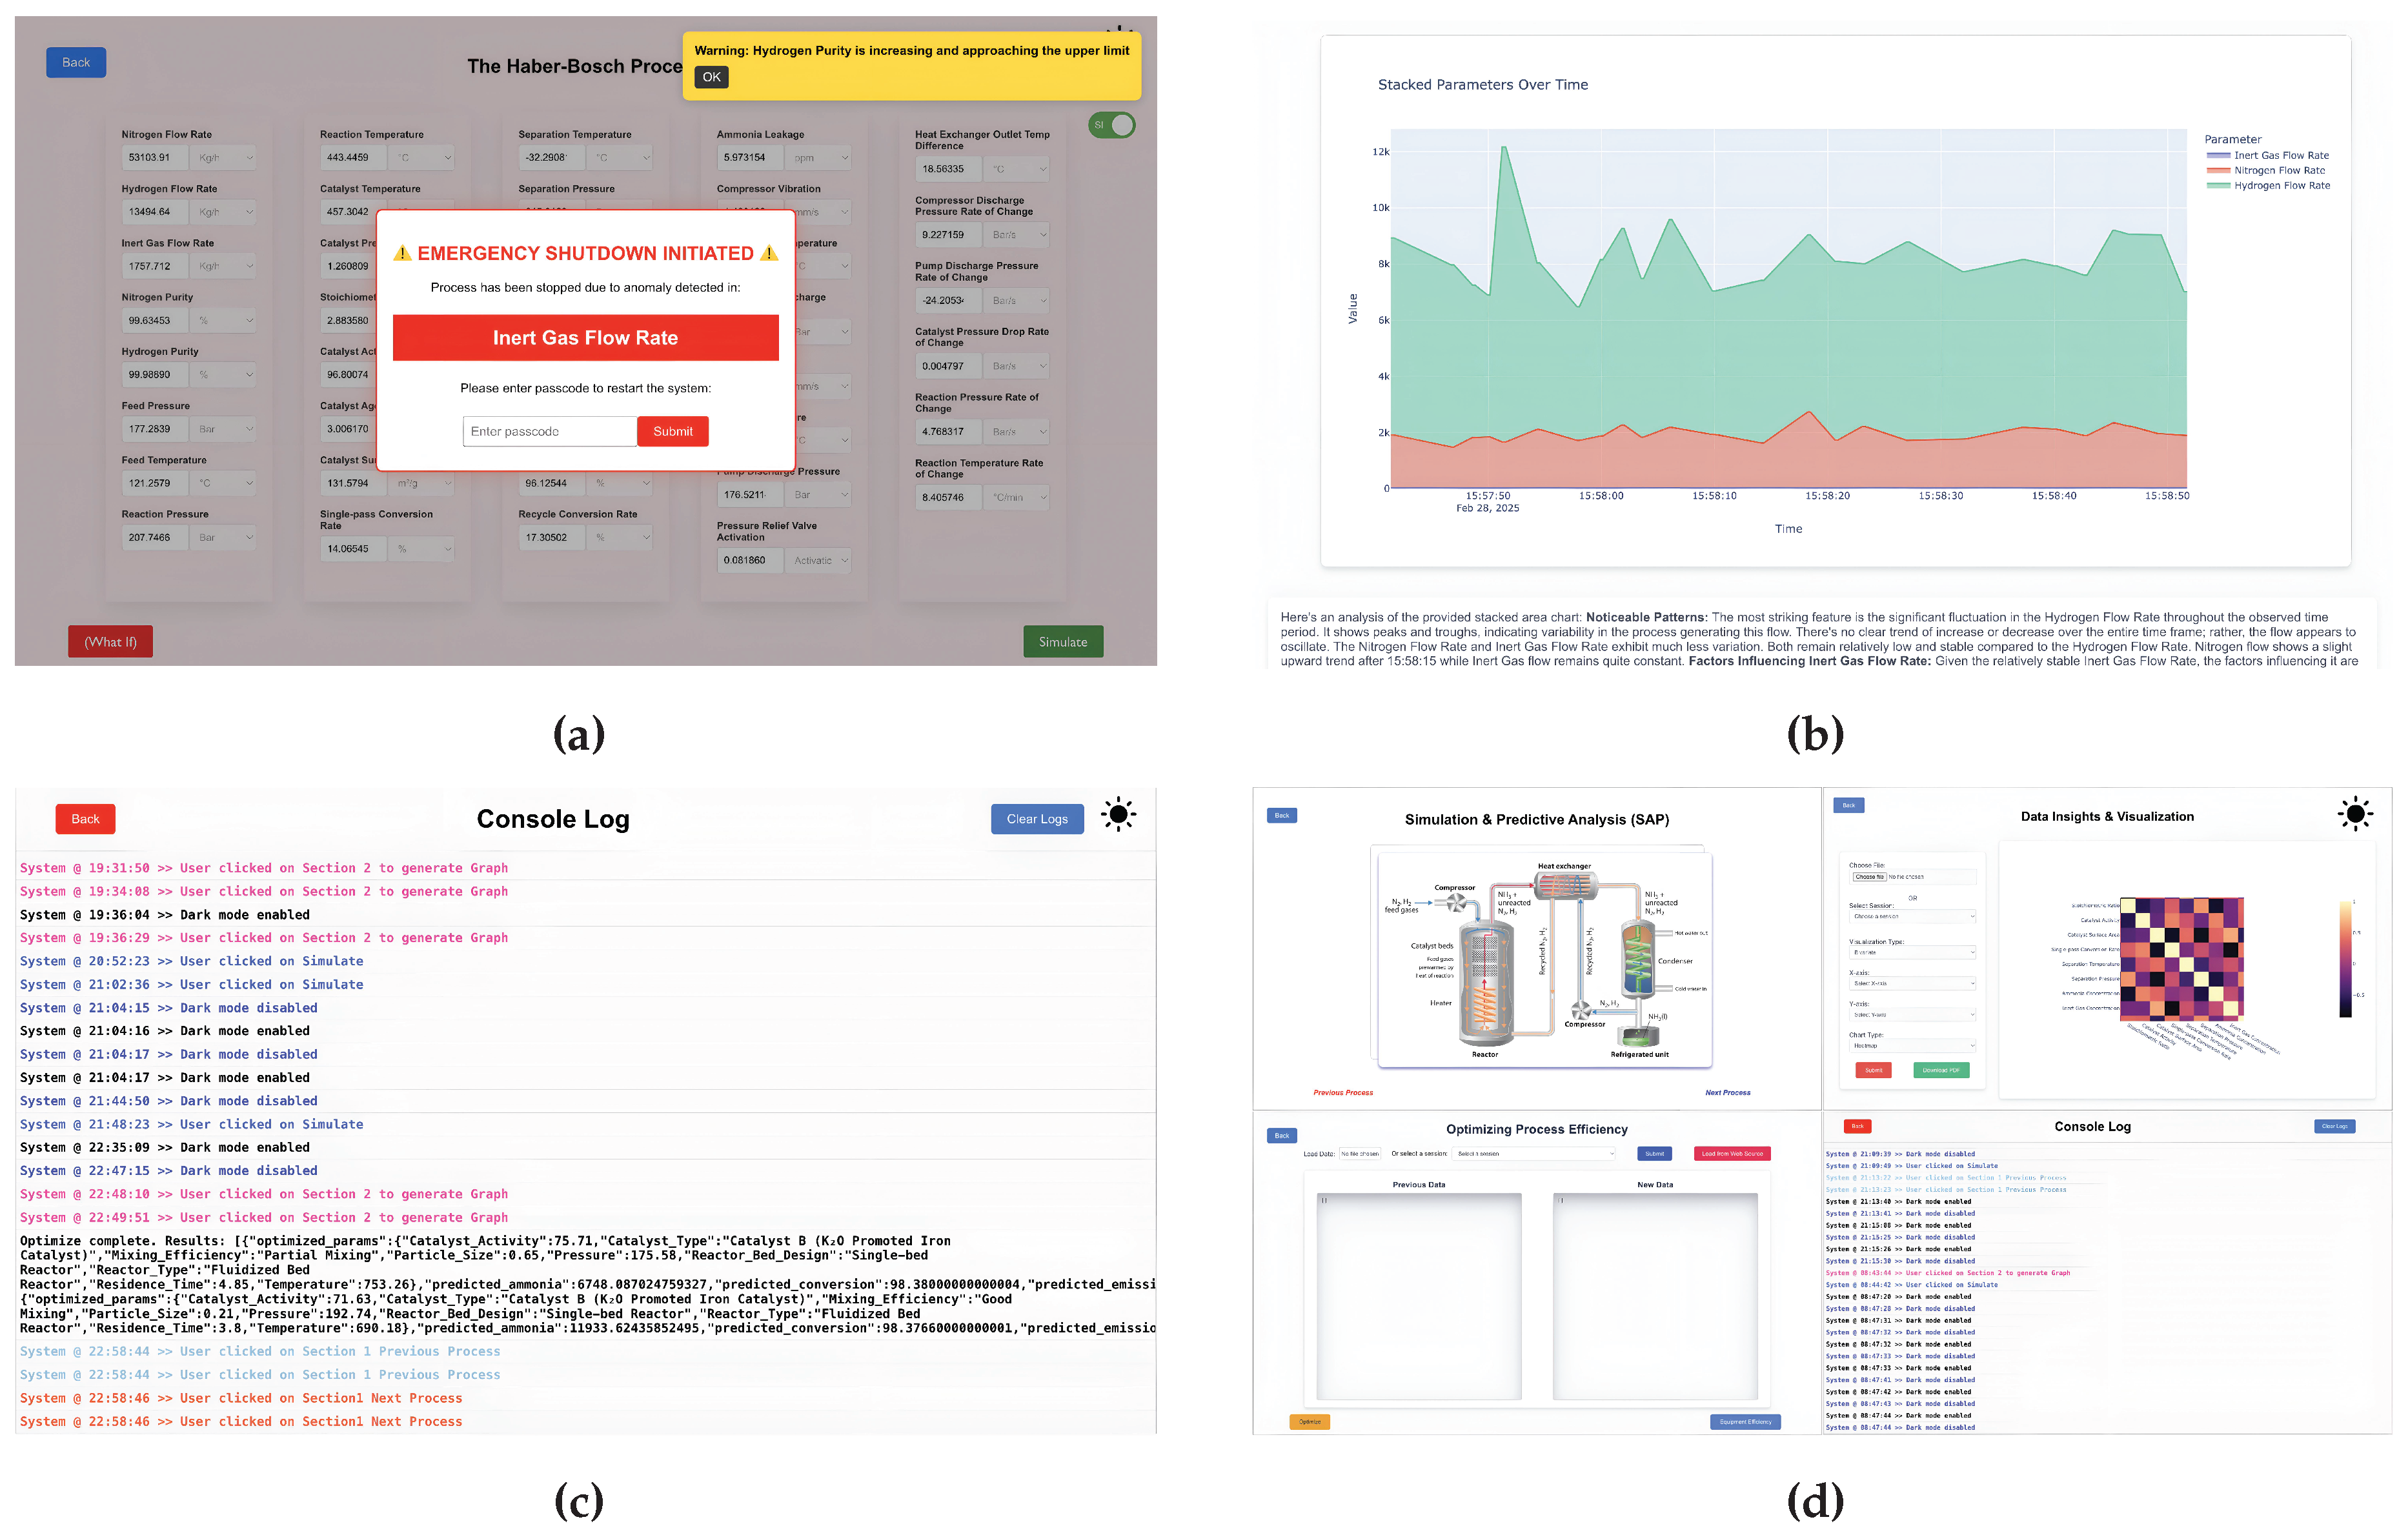
Figure 5.
Simplified industrial flow diagram of the Haber–Bosch synthesis loop.
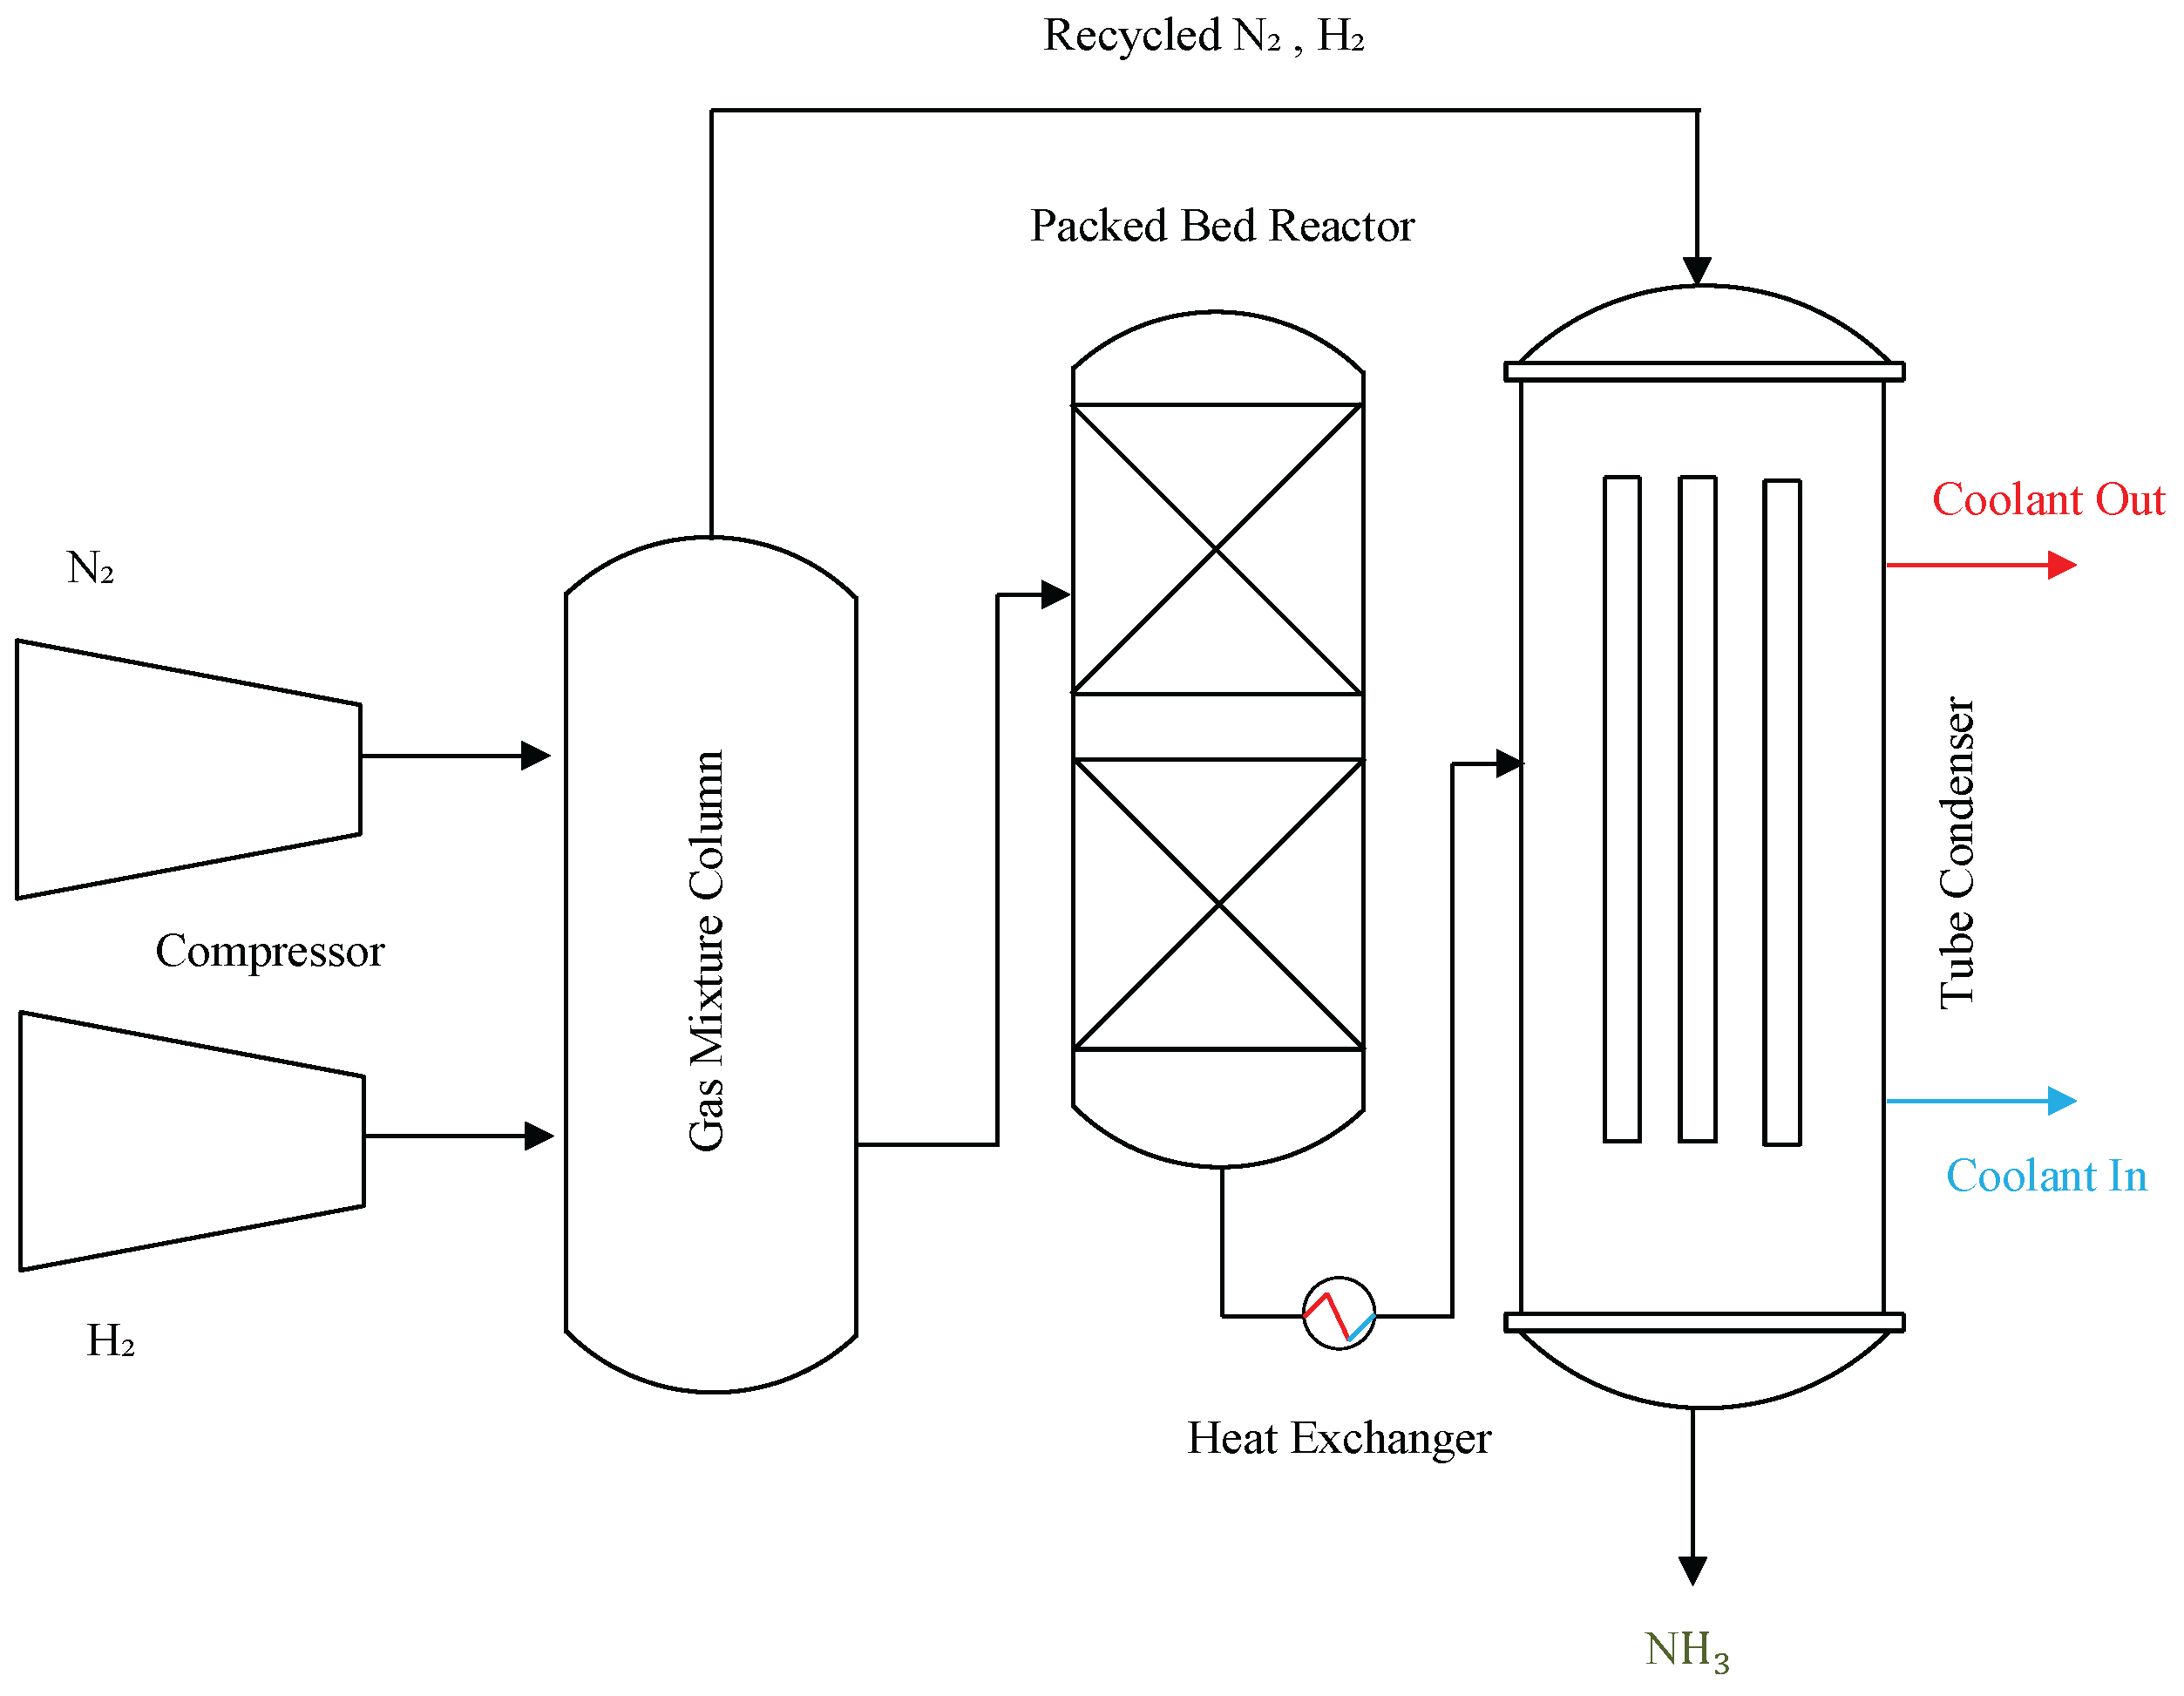
Figure 6.
Representative catalytic reaction mechanism for ammonia formation (schematic).
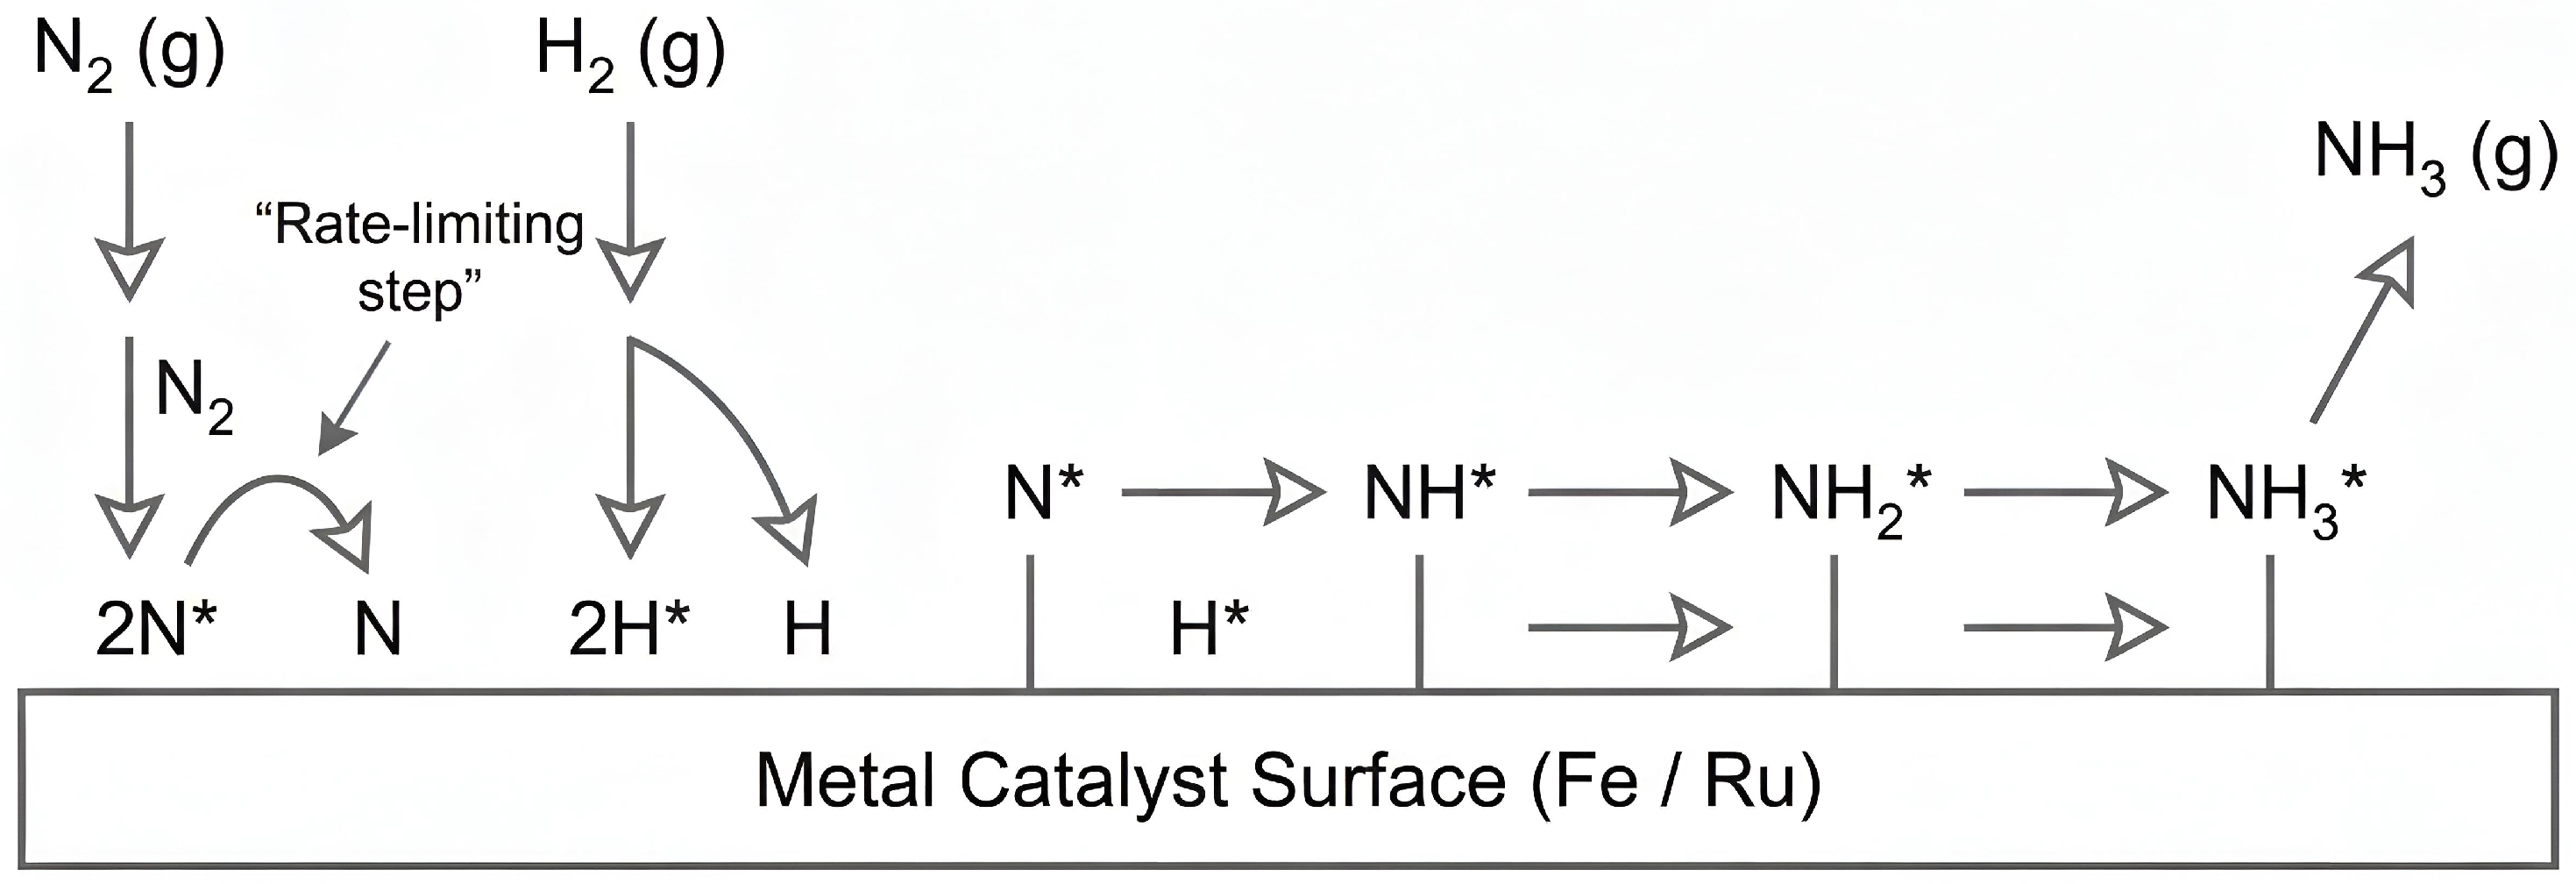
Figure 8.
Simplified separation and recycle block used in the process model.
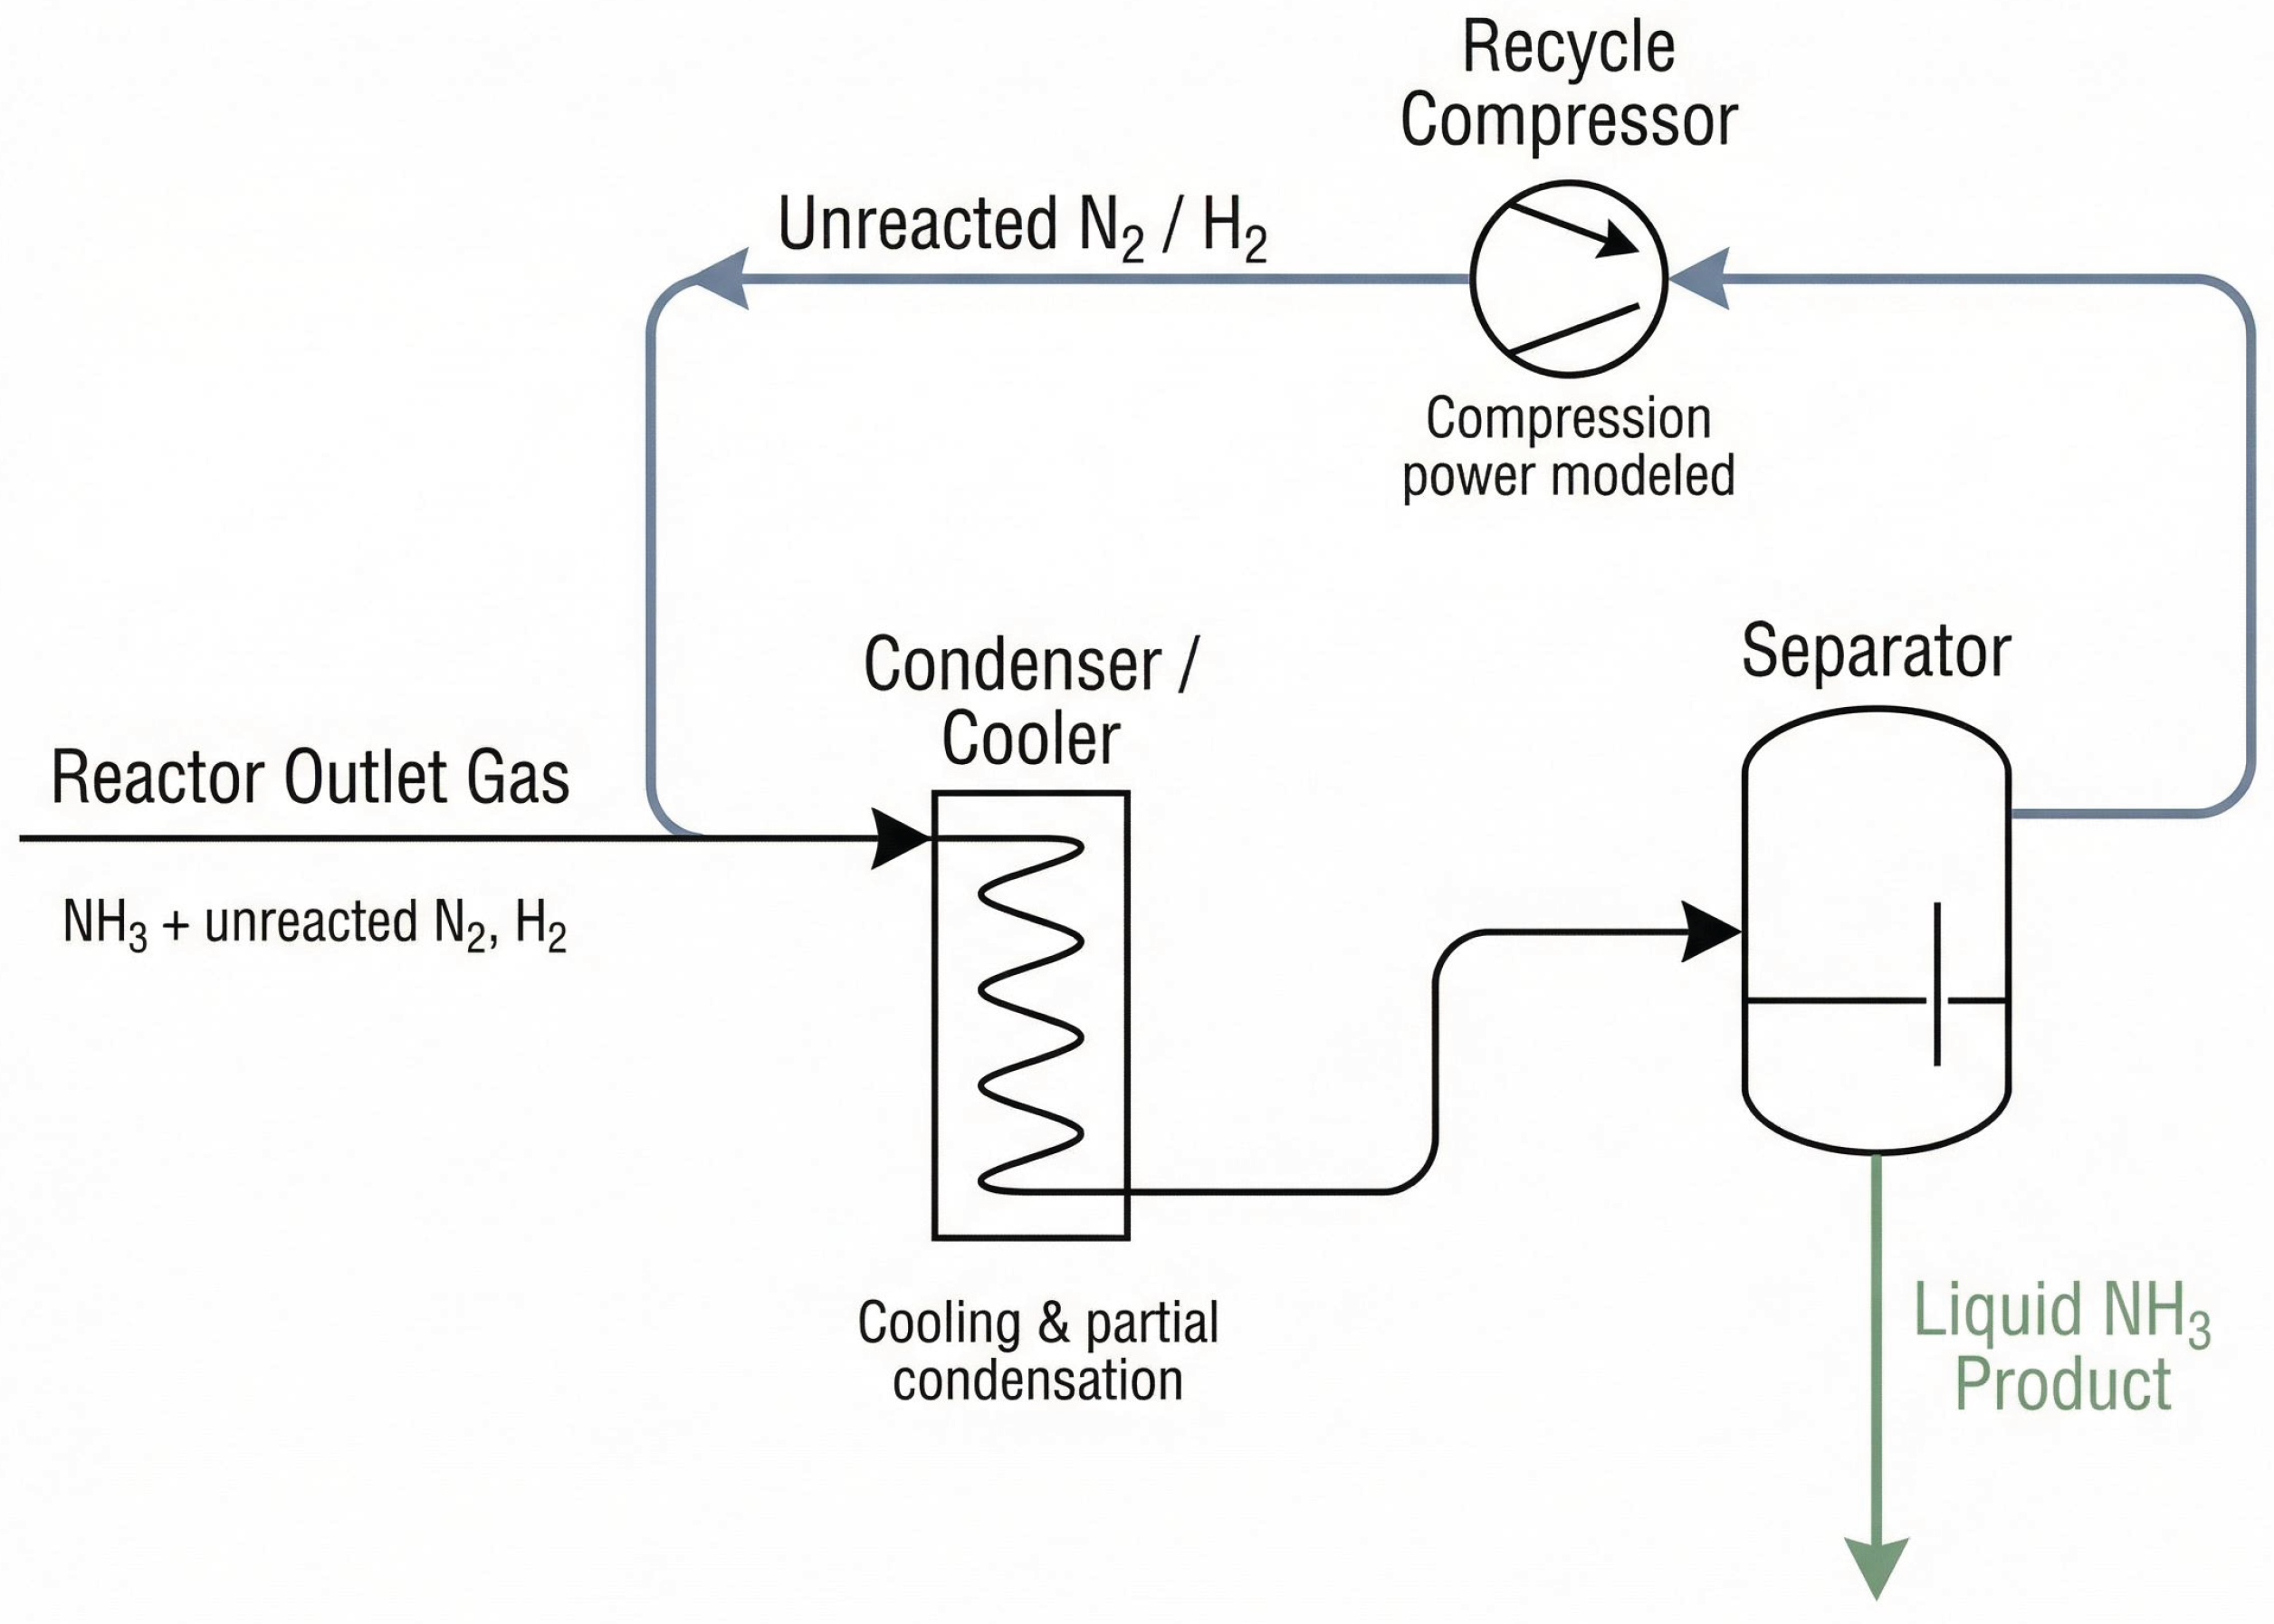
Figure 16.
Three-tier system architecture illustrating the frontend layer for visualization and user interaction, the backend layer for machine learning inference, safety logic, and data processing, and the database layer for process data storage, logging, and model outputs
Figure 16.
Three-tier system architecture illustrating the frontend layer for visualization and user interaction, the backend layer for machine learning inference, safety logic, and data processing, and the database layer for process data storage, logging, and model outputs
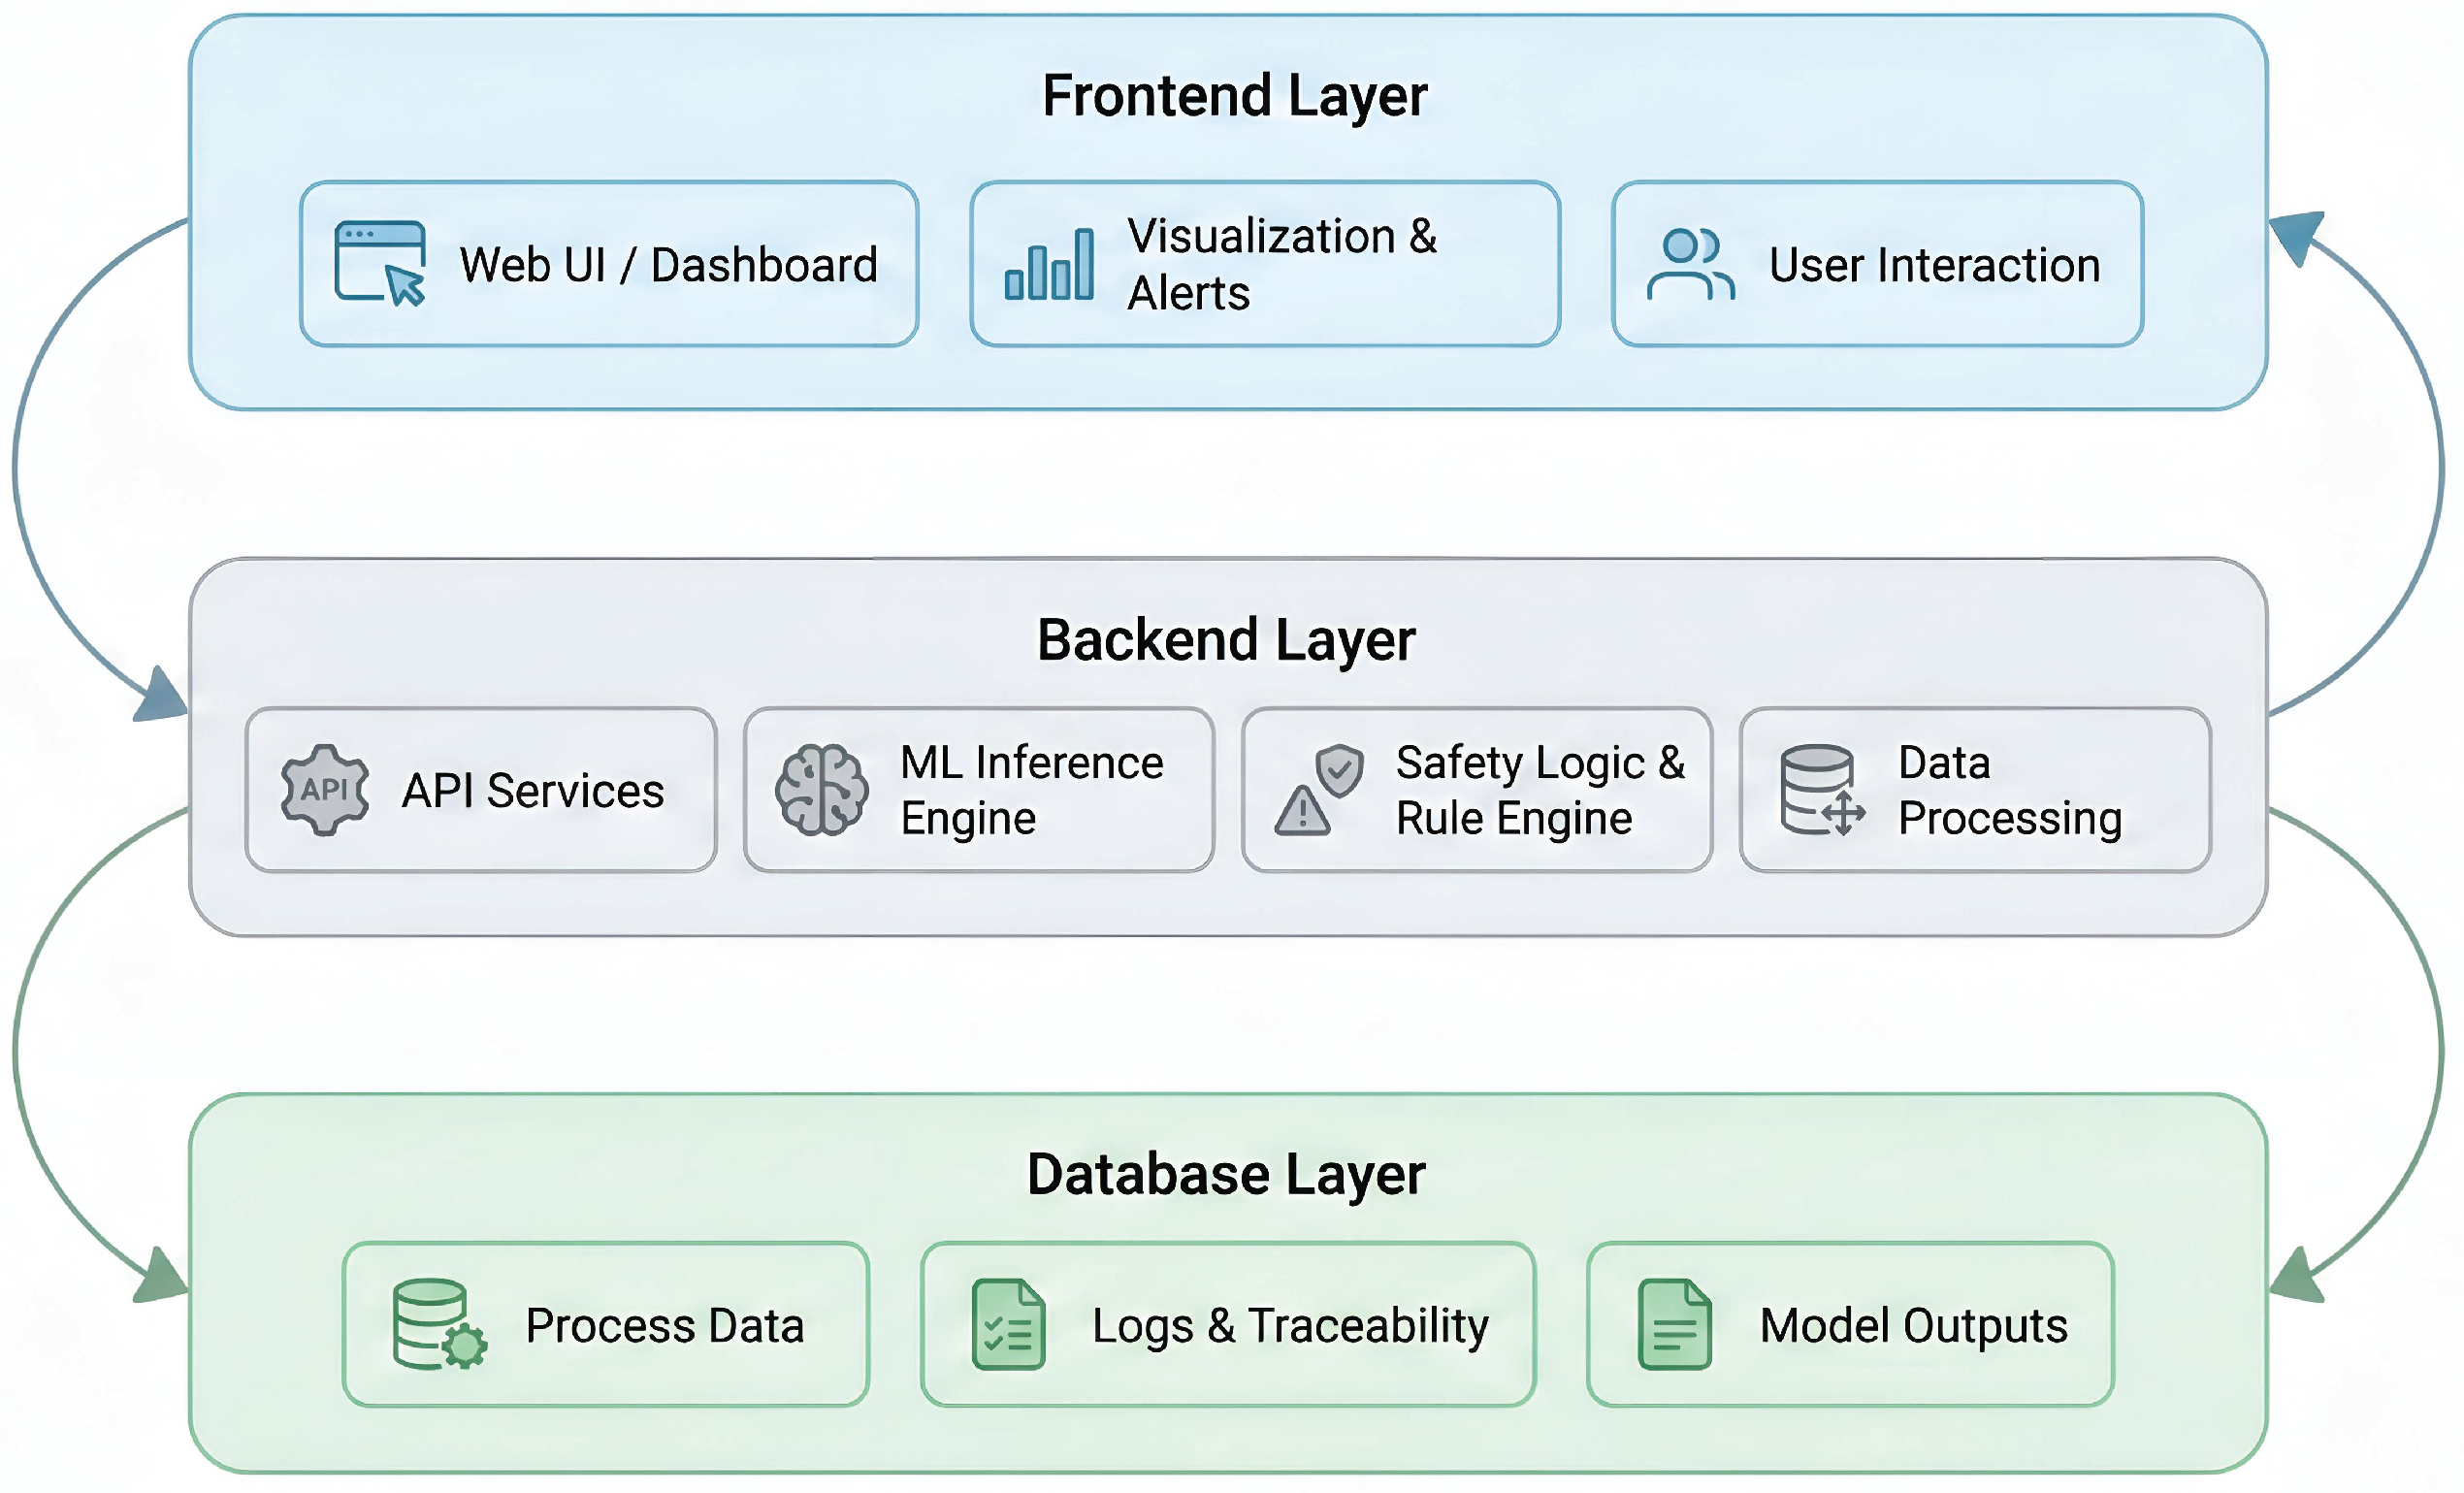
Figure 17.
System level architecture of the proposed platform illustrating the frontend interface, API and security layer, backend services, machine learning–based anomaly detection and optimization modules, database management, and deployment infrastructure supporting scalable and secure operation.
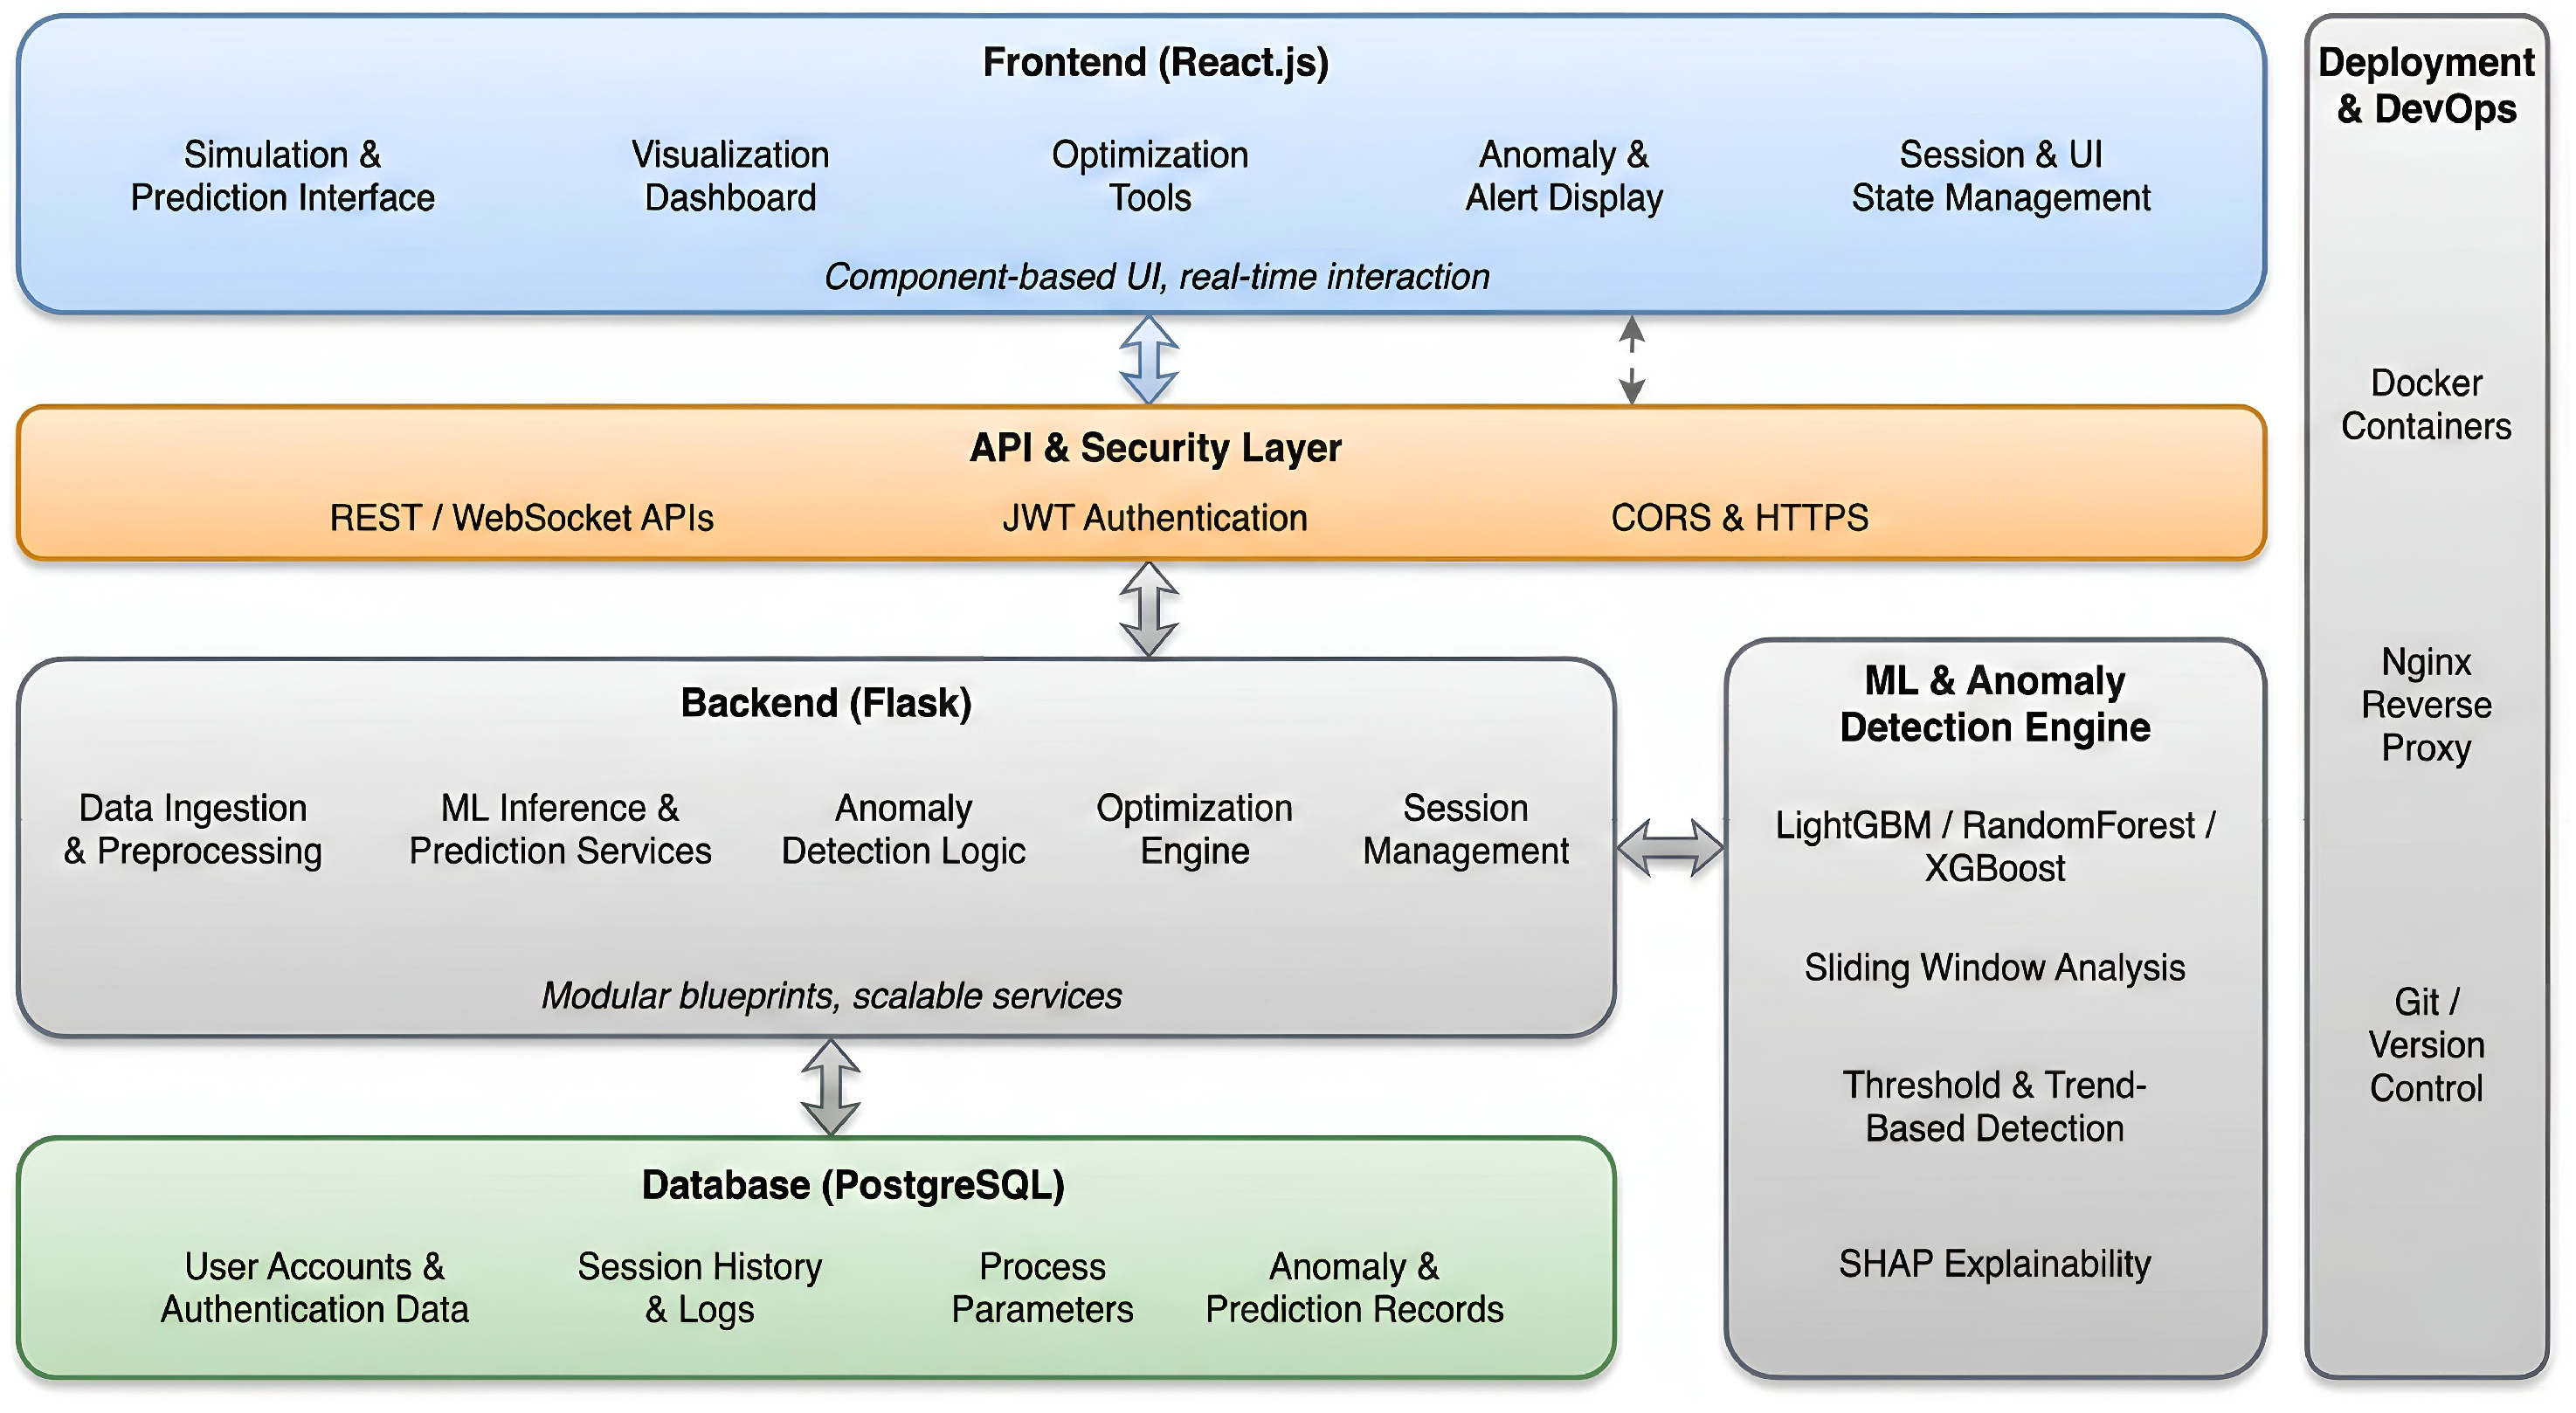
Figure 19.
Anomaly detection interface showing real-time process monitoring, threshold-based warnings, explainable alerts, and automated safety responses under abnormal operating conditions.
Figure 19.
Anomaly detection interface showing real-time process monitoring, threshold-based warnings, explainable alerts, and automated safety responses under abnormal operating conditions.
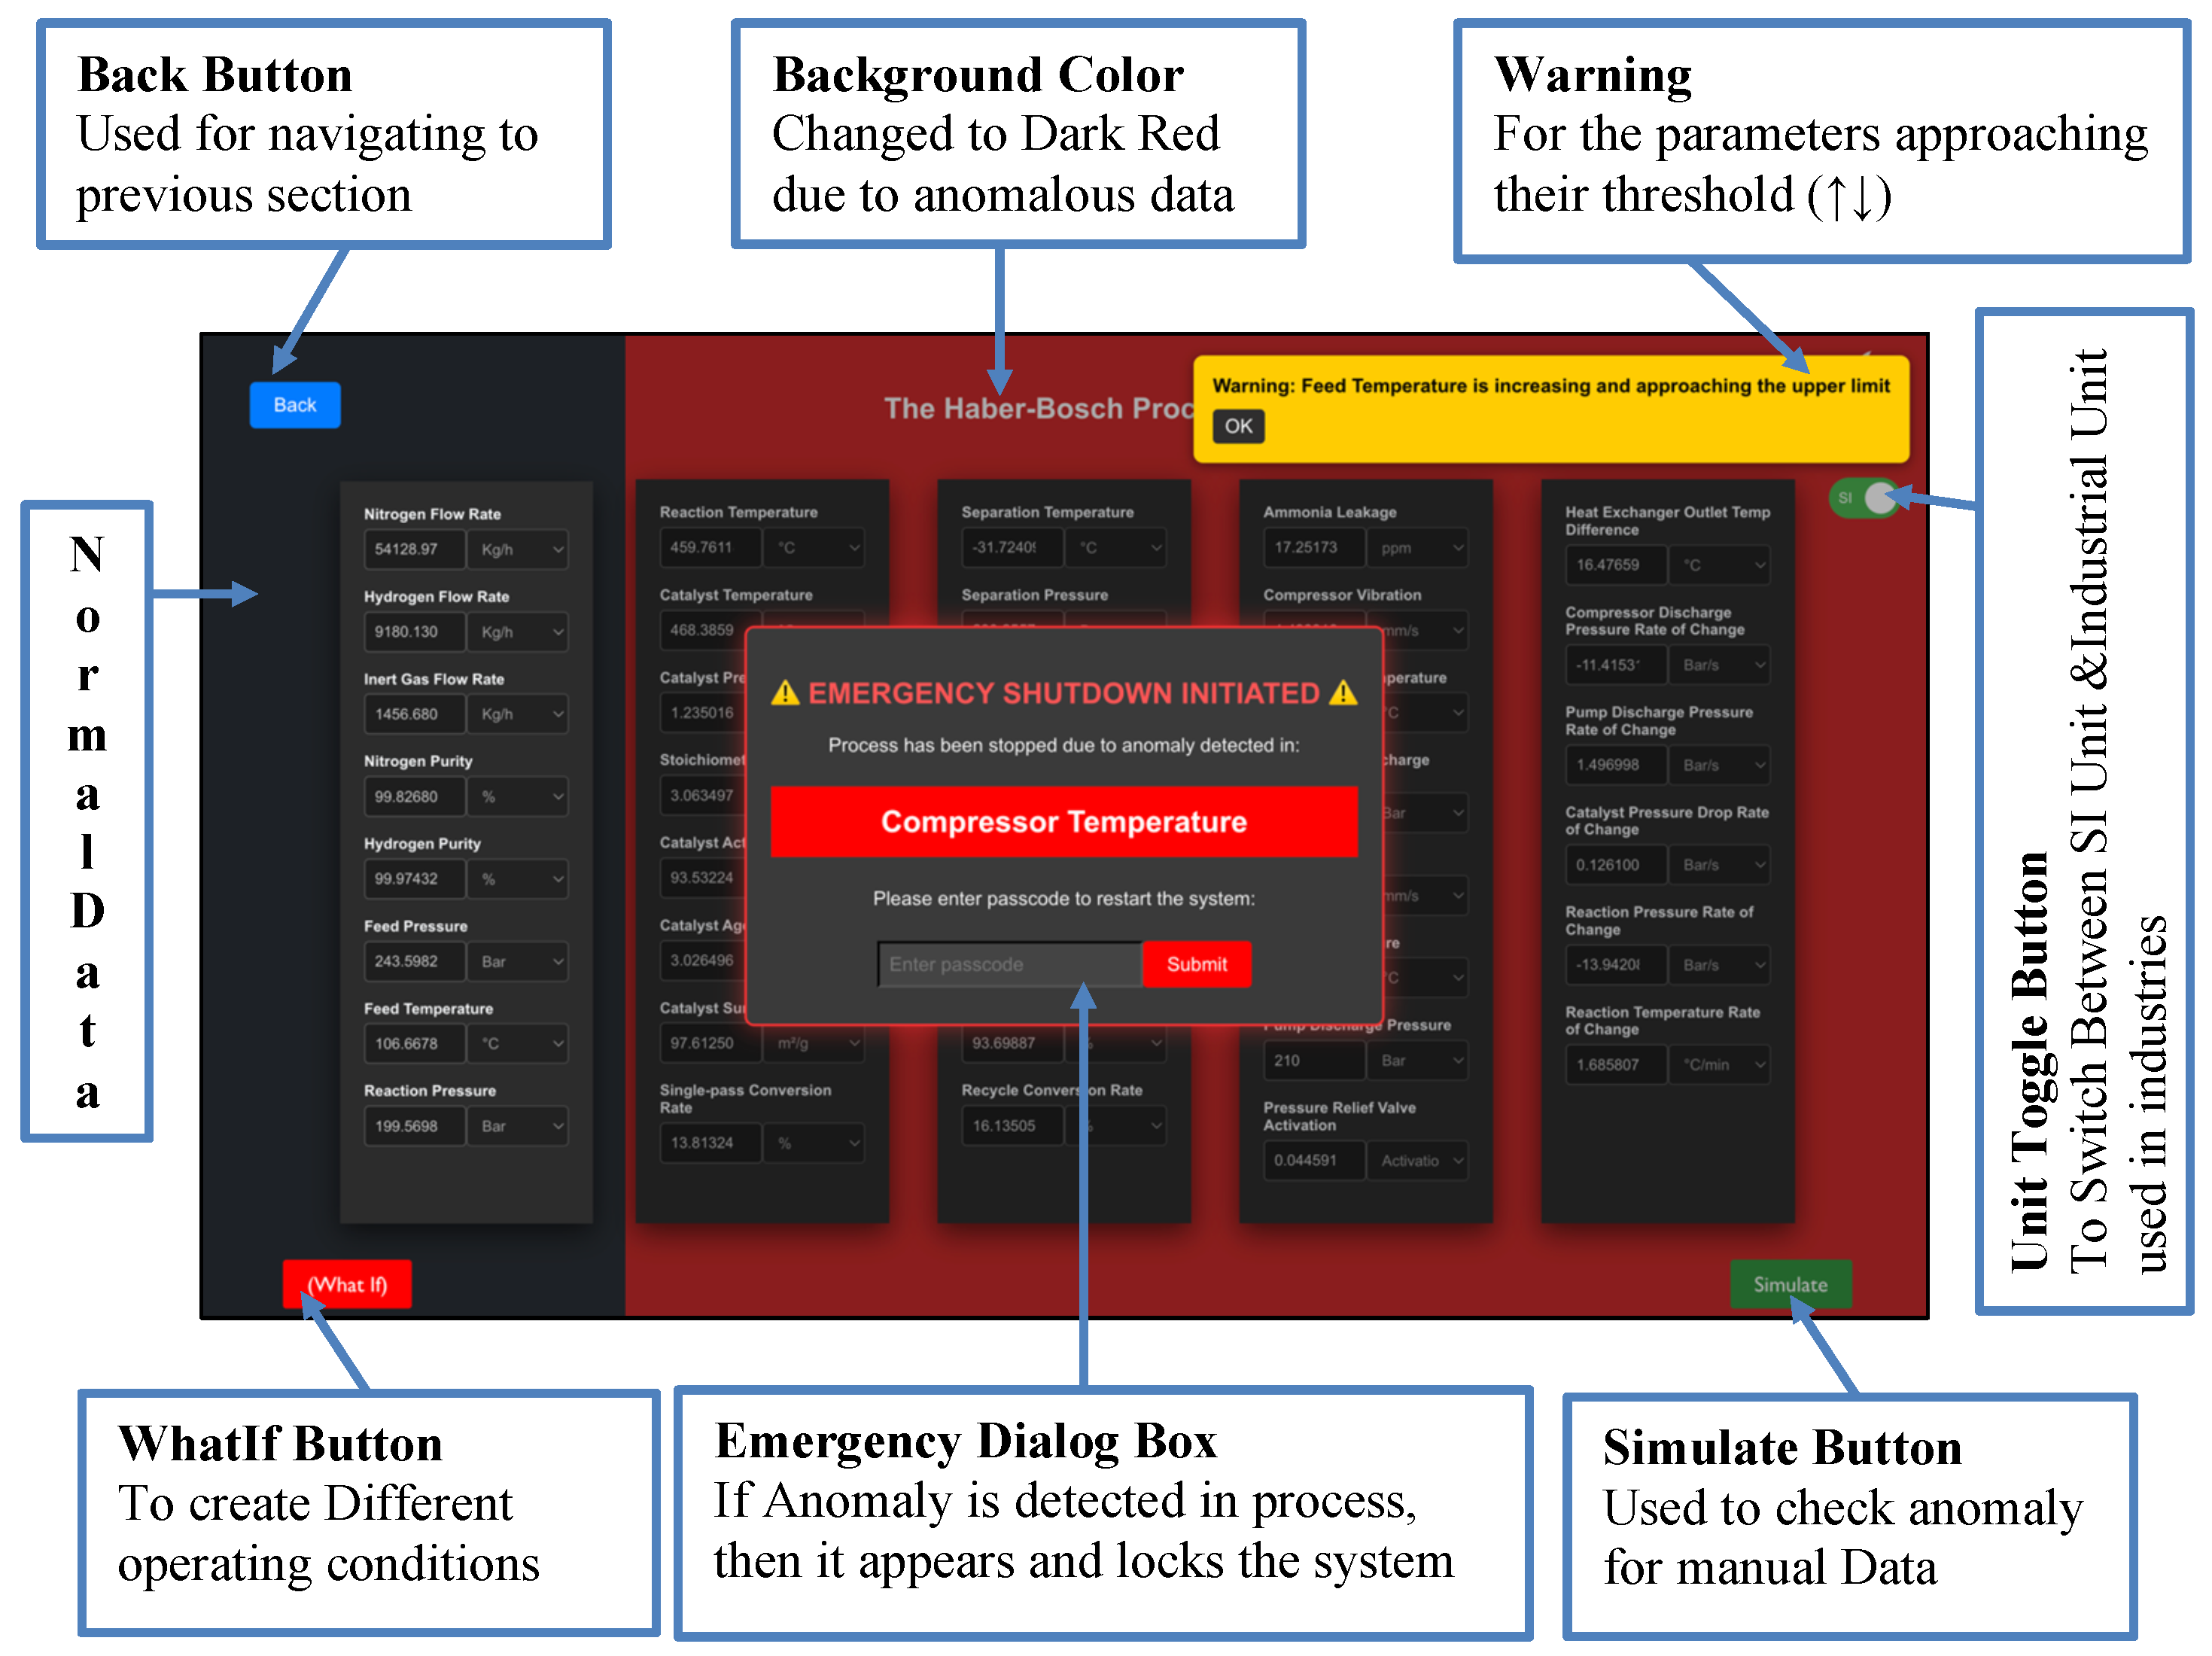
Figure 20.
Data insights and visualization interface enabling interactive exploration of process parameters through graphical analysis, session management, and configurable feature selection.
Figure 20.
Data insights and visualization interface enabling interactive exploration of process parameters through graphical analysis, session management, and configurable feature selection.
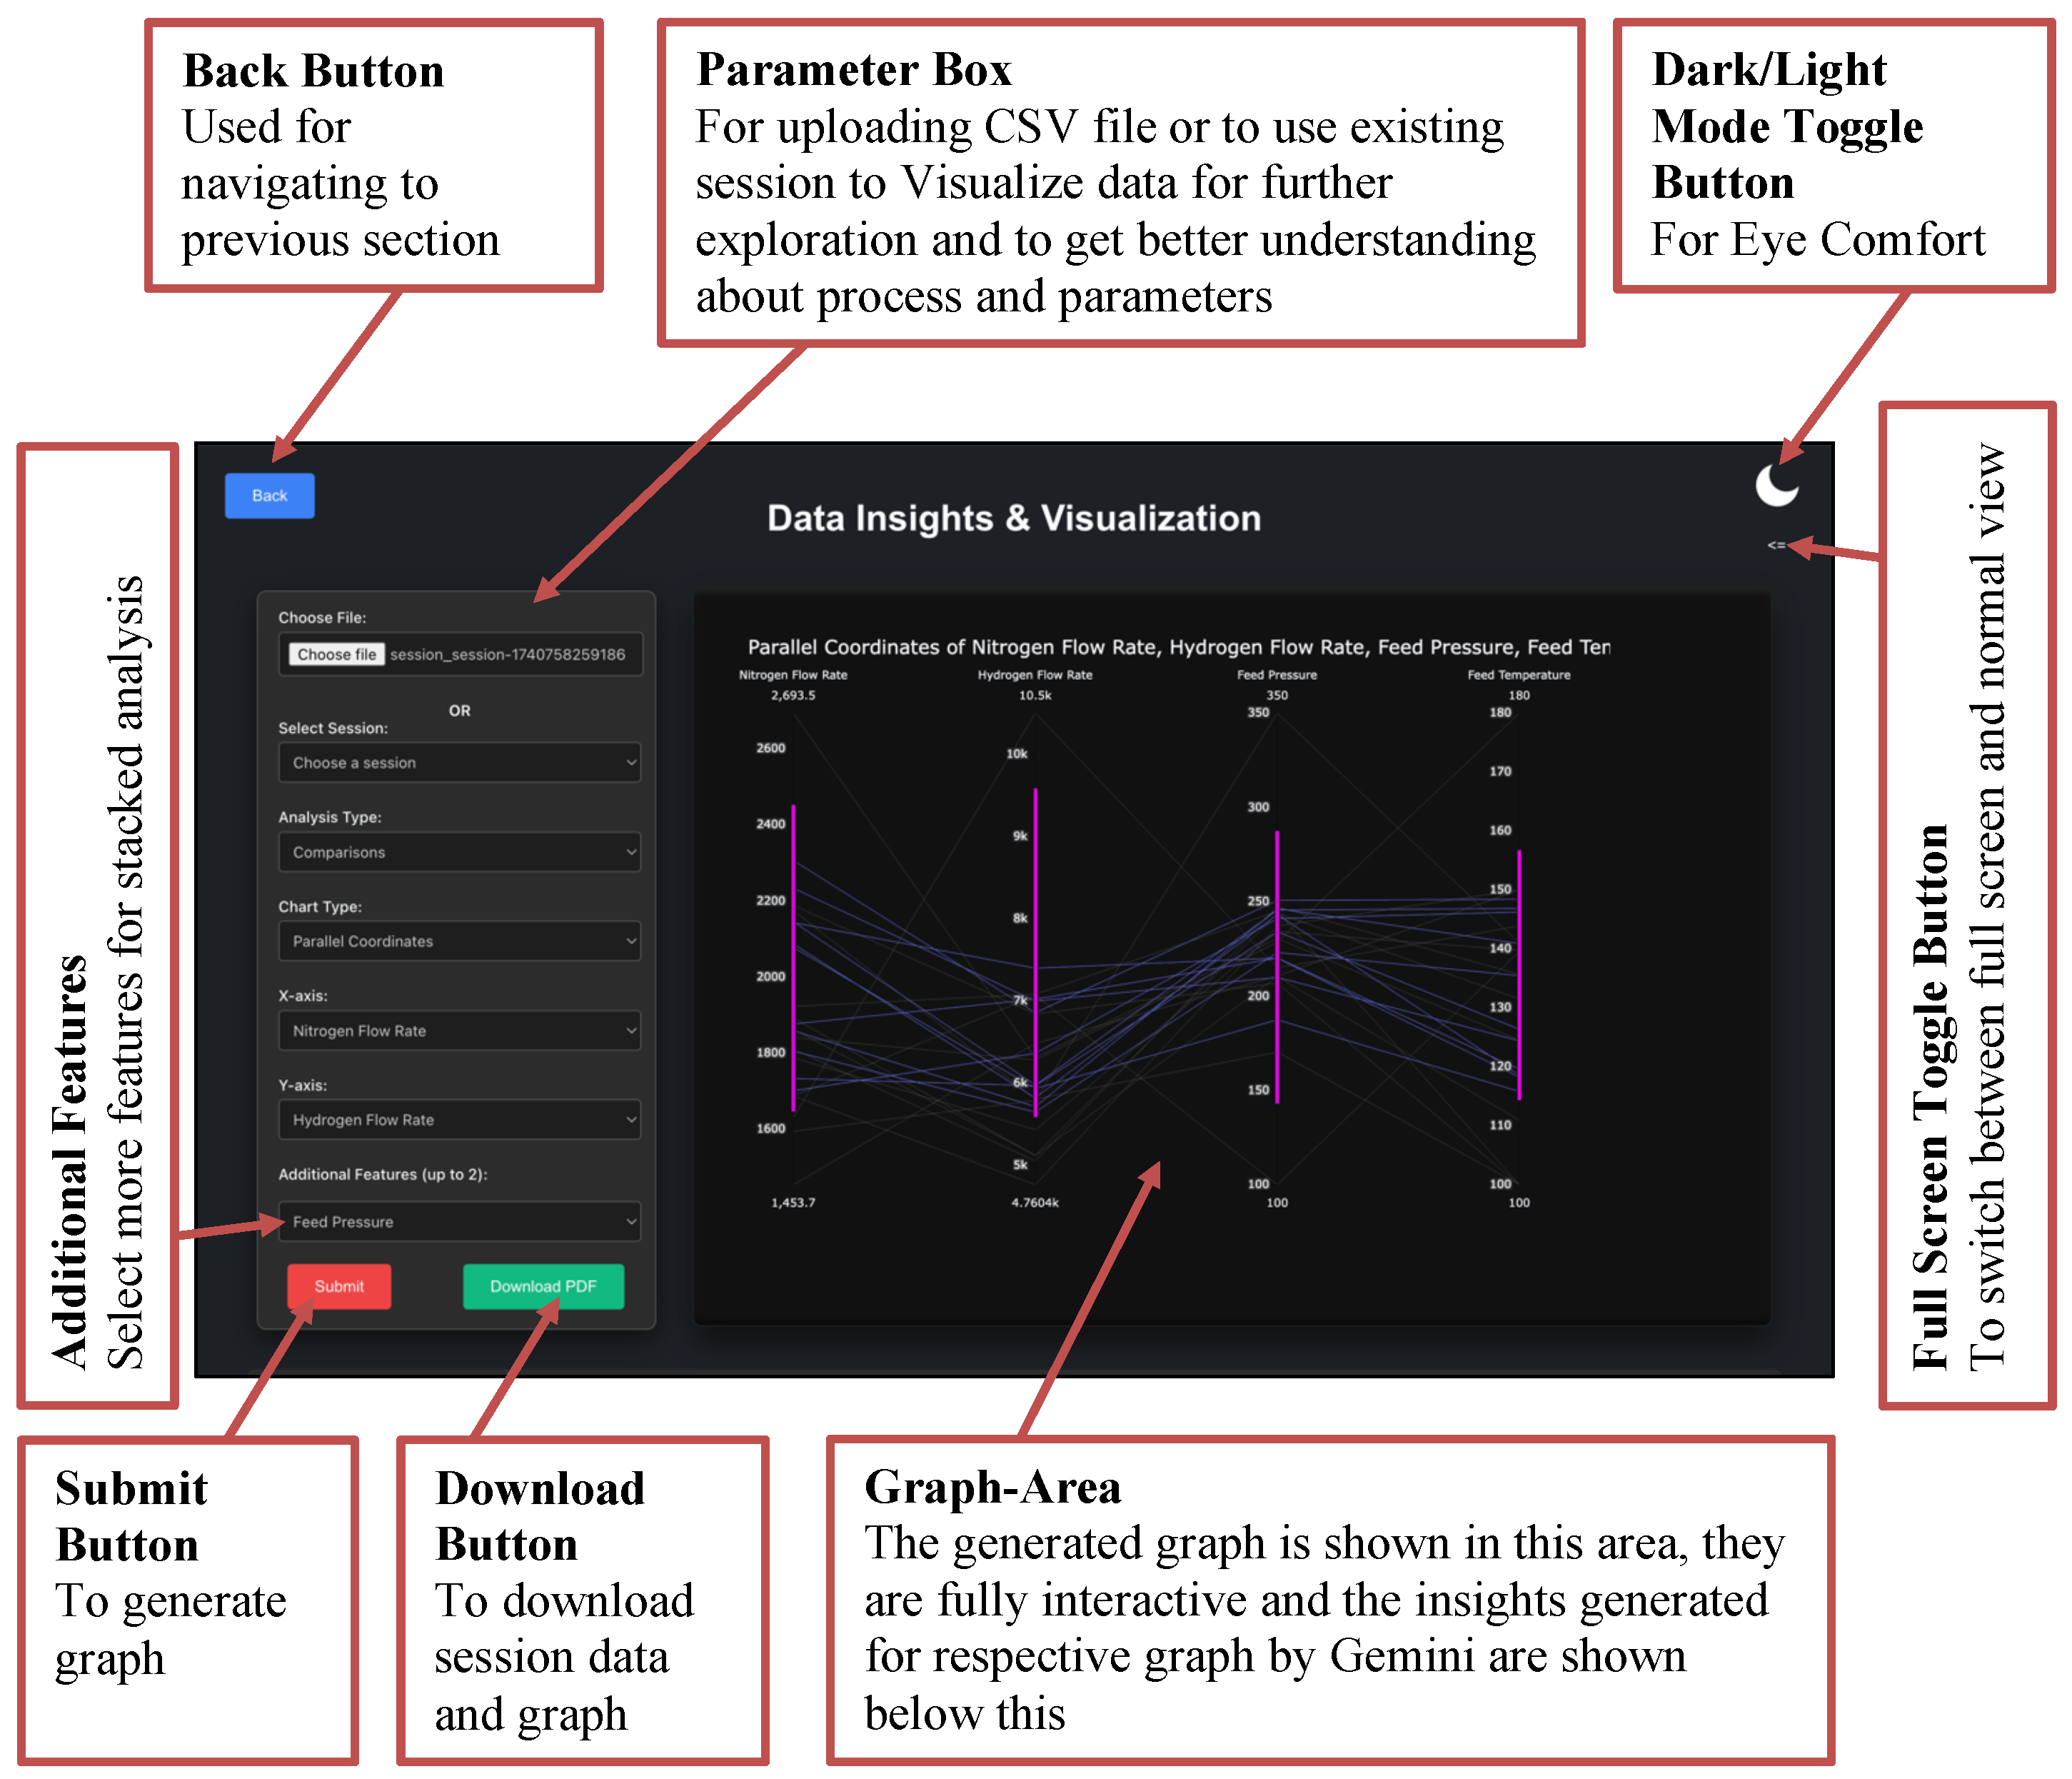
Figure 21.
Optimization pipeline interface illustrating user driven data loading, parameter configuration, and backend-assisted prediction and optimization of process performance metrics.
Figure 21.
Optimization pipeline interface illustrating user driven data loading, parameter configuration, and backend-assisted prediction and optimization of process performance metrics.
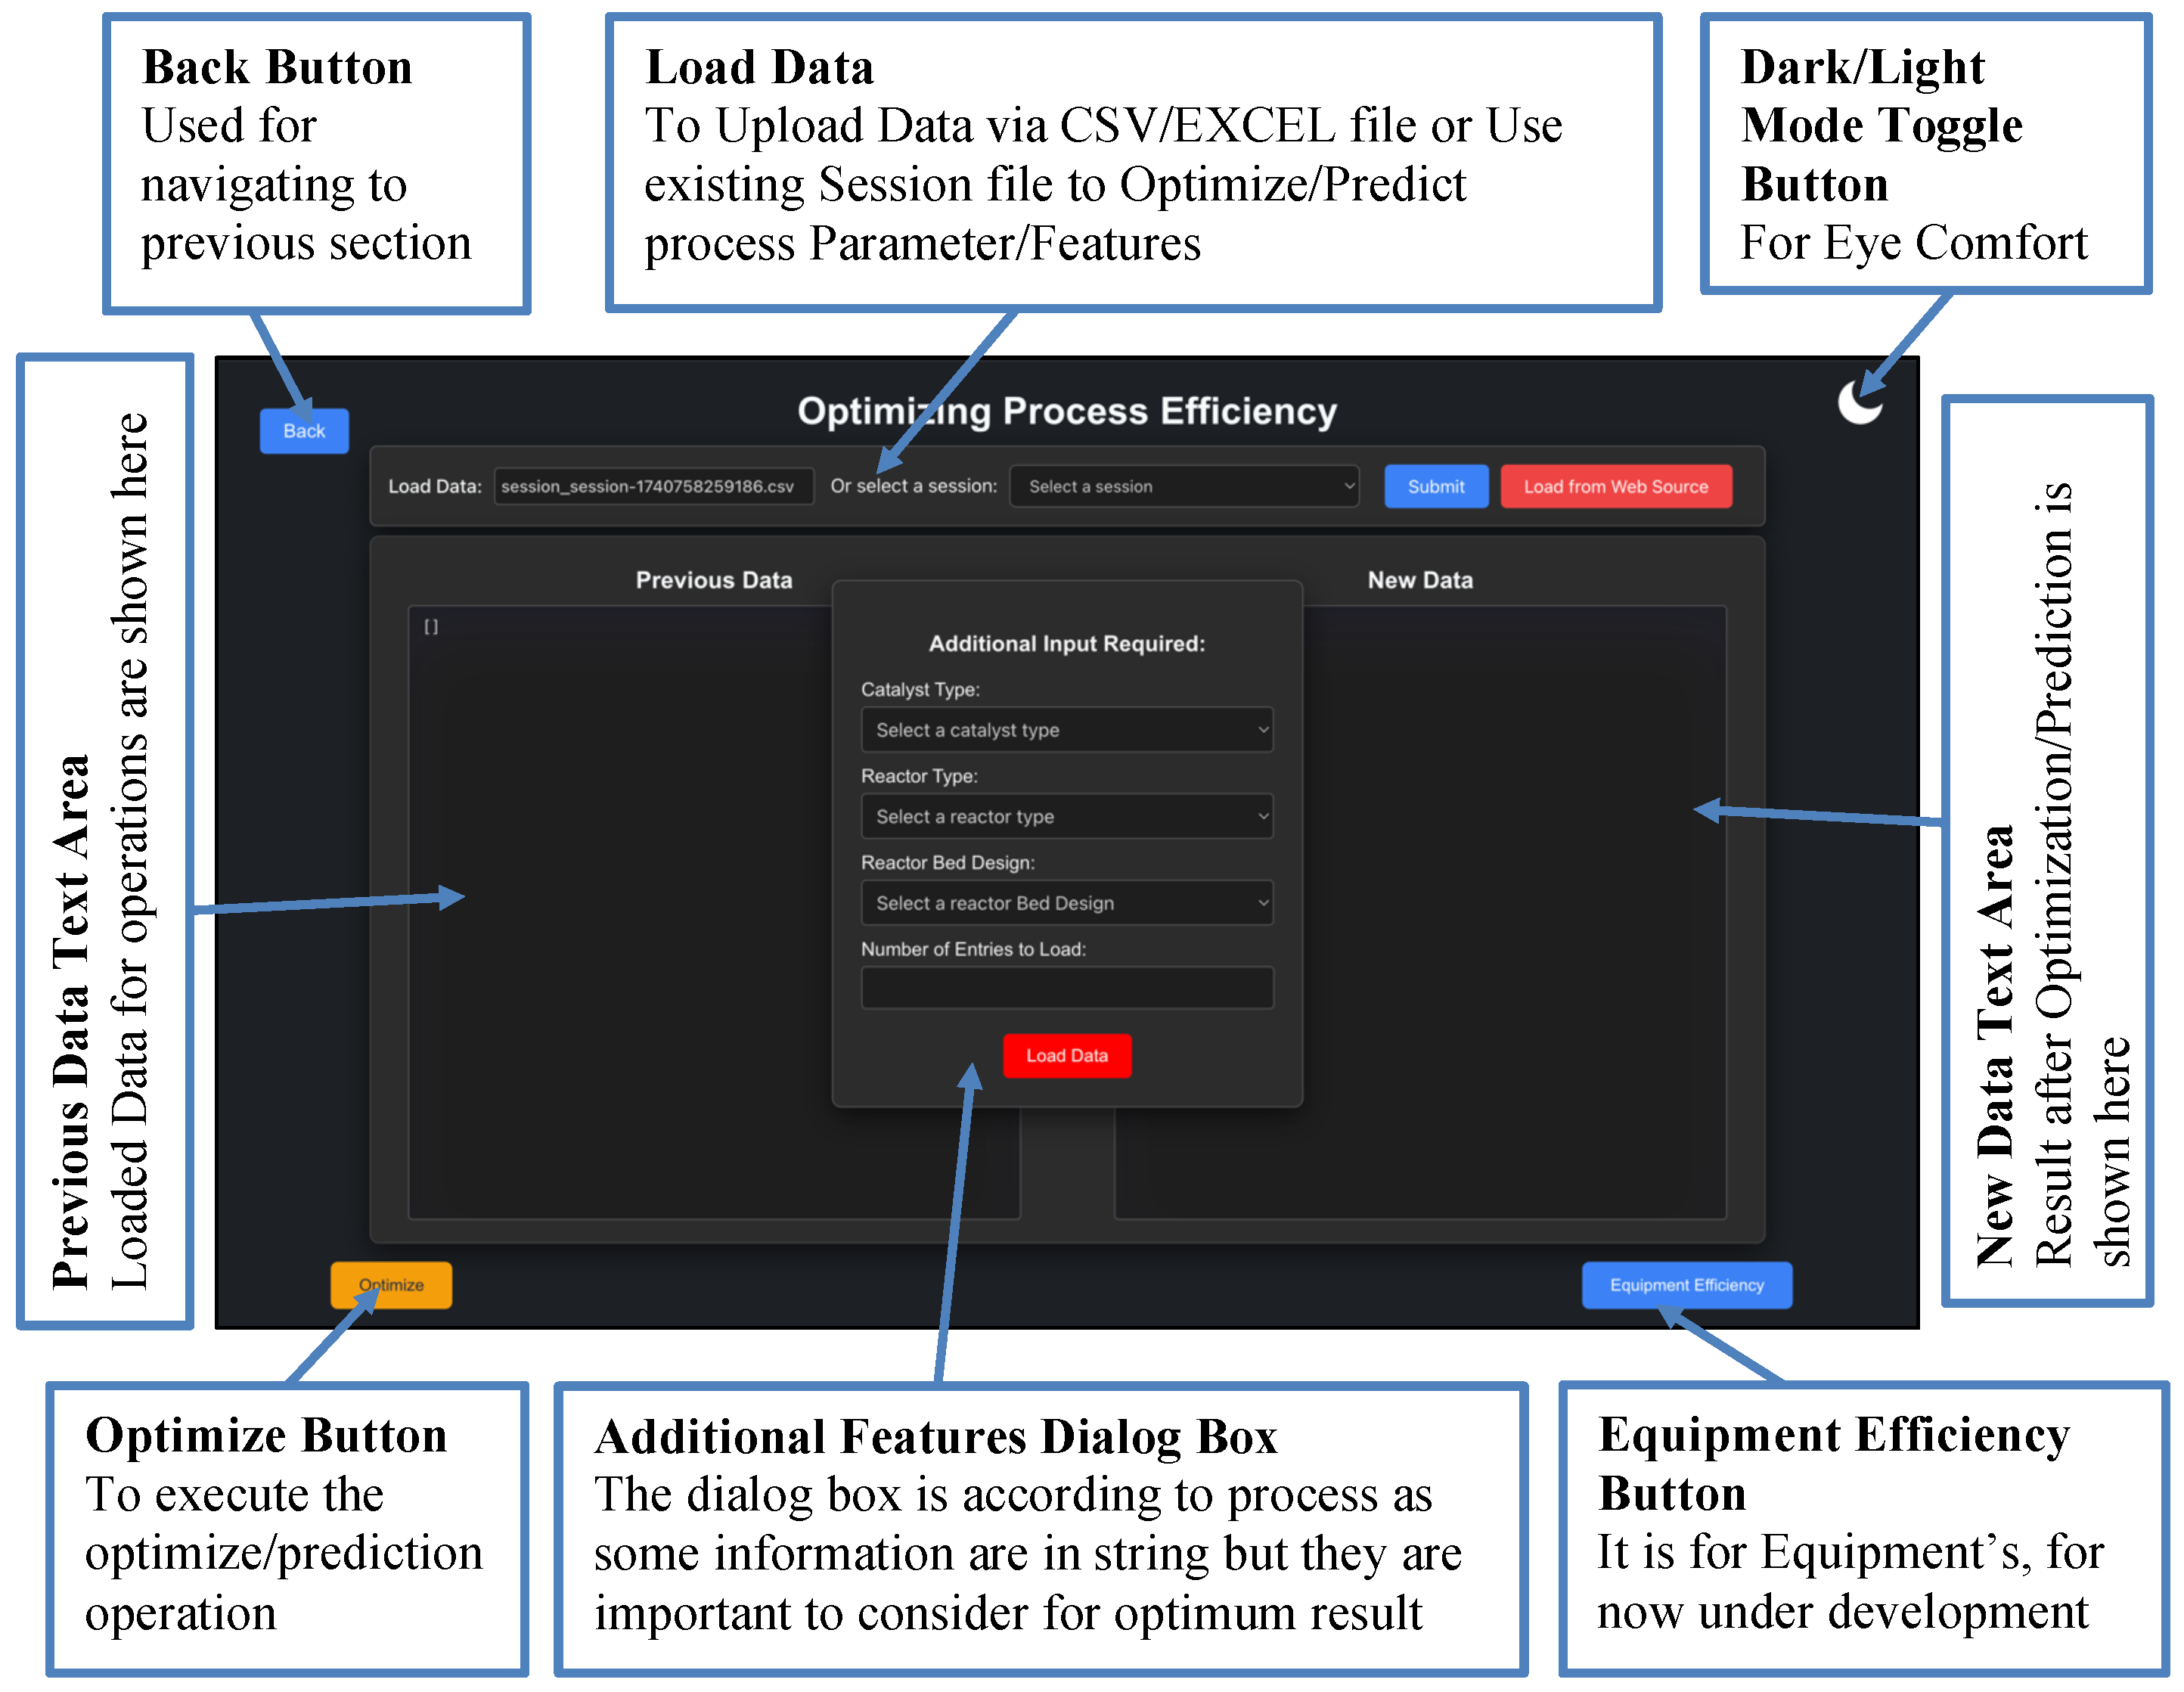
Table 3.
Comparative summary of representative studies in industrial safety and machine learning, highlighting contributions and key limitations.
Table 3.
Comparative summary of representative studies in industrial safety and machine learning, highlighting contributions and key limitations.
| Study / Source | Domain | Contribution | Key limitation relevant to this work |
|---|---|---|---|
| Kletz (2009) [26] | Accident case histories | Comprehensive documentation of industrial disasters and root causes | No predictive capability; focuses on incident aftermath rather than early detection |
| Venkatasubramanian et al. (2003) [27] | Model-based monitoring | Structured quantitative methods for fault detection | Relies heavily on accurate process models; limited adaptability to nonlinear plant behavior |
| Jiang et al. (2019) [7] | Data-driven monitoring | Survey of multivariate statistical and learning-based fault detection | Does not address real-time deployment challenges or operator workflow integration |
| Breiman (2001) [28] | Classical ML methods | Random forest algorithm for robust classification | Not optimized for temporal process dynamics; lacks interpretability in safety contexts |
| Chawla et al. (2002) [29] | Data imbalance handling | SMOTE oversampling for minority fault classes | Perturbs original data distribution; may distort physical relationships in process data |
| Gao et al. (2021) [30] | Unsupervised anomaly detection | Autoencoder + isolation forest hybrid for nonlinear fault detection | No coupling with shutdown logic, dashboards, or operator guidance mechanisms |
| Singh et al. (2020) [8] | Machine learning for industrial faults | Evaluation of ML techniques in industrial settings | Focuses on detection accuracy; lacks full safety workflow integration |
| Patel & Shah (2018) [36] | Industrial safety frameworks | Real-time dynamic safety architectures | Does not incorporate ML-based detection or adaptive learning |
| Zhou et al. (2020) [37] | AI + IoT for safety | Vision for integrated sensing and risk mitigation | Conceptual; no operational dashboard or optimization integration |
| Smith & Brown (2020) [43] | Industrial automation | Challenges and opportunities in AI-enabled automation | Does not address anomaly detection or safety mechanisms |
| Chen & Liu (2021) [44] | Intelligent manufacturing | AI-driven manufacturing models | Focus on productivity, not safety-critical control |
| Carter & Evans (2021) [47] | Industrial visualization | Visualization methods for industrial systems | No integration with anomaly detection or operator decision support |
| Davis & Thompson (2023) [45] | Industrial AI interfaces | Web-based platforms for industrial AI | No safety logic, shutdown workflows, or traceability features |
Table 4.
Comparison of representative ammonia synthesis catalysts and their operating temperature ranges.
Table 4.
Comparison of representative ammonia synthesis catalysts and their operating temperature ranges.
| Catalyst | Temp. Range | Notes |
|---|---|---|
| Fe-based | 430–500∘C | Industrial standard; robust; slower kinetics at lower temperatures |
| Ru-based | 350–450∘C | Higher activity; lower pressure operation possible; higher cost |
| Ni-based | 450–520∘C | Less common; inferior N2 dissociation kinetics |
Table 5.
Representative feed gas impurity limits used in the process model.
| Species | Max. Allowable Concentration |
|---|---|
| H2O | < 5 ppm |
| CO2 | < 5 ppm |
| CO | < 1 ppm |
| H2S | < 0.1 ppm |
Table 6.
Representative operating ranges of key variables in the Haber–Bosch ammonia synthesis loop used for data generation.
Table 6.
Representative operating ranges of key variables in the Haber–Bosch ammonia synthesis loop used for data generation.
| Variable | Range |
|---|---|
| Reactor temperature | 350–520∘C |
| Reactor pressure | 100–250 bar |
| N2:H2 ratio | 1:2.6–1:3.2 |
| Per-pass conversion | 10–22% |
| Recycle ratio | 4–10 |
| Cooling duty | 2–7 MW |
Table 7.
Representative ammonia exposure thresholds used for safety classification.
| Exposure Level | Concentration |
|---|---|
| Odor threshold | 5–50 ppm |
| Eye/respiratory irritation | 100–200 ppm |
| Immediate danger (IDLH) | 300 ppm |
| Fatal exposure | > 5000 ppm |
Table 13.
Temporal alignment of warning signals and corresponding anomaly events across operational sessions.
Table 13.
Temporal alignment of warning signals and corresponding anomaly events across operational sessions.
| Session ID | Anomalies (Timestamp) | Warnings (Timestamp) |
|---|---|---|
| session-1744284452813 | Pressure Relief Valve Activation at 2025-04-10 11h 31m 53s 556ms | Warning: Pressure Relief Valve Activation at 2025-04-10 11h 31m 53s 340ms |
| session-1744284452813 | Compressor Temperature at 2025-04-10 11h 32m 44s 193ms | Warning: Compressor Temperature is high at 2025-04-10 11h 32m 16s 072ms |
| session-1744282836799 | Stoichiometric Ratio at 2025-04-10 11h 03m 13s 912ms | Warning: Stoichiometric Ratio is decreasing at 2025-04-10 11h 03m 10s 802ms |
| session-1744282836799 | Compressor Discharge Pressure at 2025-04-10 11h 03m 24s 971ms | Warning: Compressor Discharge Pressure rising at 2025-04-10 11h 03m 24s 756ms |
| session-1744283710559 | Separation Pressure at 2025-04-10 11h 22m 18s 755ms | Warning: Separation Pressure is increasing at 2025-04-10 11h 22m 09s 671ms |
| session-1744283710559 | Separation Temperature at 2025-04-10 11h 24m 09s 974ms | Warning: Separation Temperature is rising at 2025-04-10 11h 23m 53s 287ms |
Table 14.
Session wise detected anomalies with corresponding parameter values and interpretative remarks.
Table 14.
Session wise detected anomalies with corresponding parameter values and interpretative remarks.
| Session ID | Anomaly | Row | Value | Remarks |
|---|---|---|---|---|
| session-1744284452813 | Stoichiometric Ratio | 5 | 3.0022 | Expected: 3:1 (H2:N2). Observed value shows a slight deviation, which may reduce reaction efficiency. Recommended operating tolerance is within to ensure optimal ammonia yield [60]. |
| session-1744283710559 | Compressor Discharge Pressure | 3 | 180.0 bar | Typical range: 200–250 bar. Operating at 180 bar may result in insufficient feed pressure and reduced conversion efficiency. Industry guidelines recommend maintaining pressures ≥ 200 bar [69]. |
| session-1744283710559 | Heat Exchanger Outlet Temperature Difference | 4 | 24.0 ∘C | Normal range: 10–20∘C. An elevated temperature difference suggests possible fouling or heat-transfer inefficiency. Optimal operation requires maintaining C [70]. |
| session-1744282836799 | Pump Temperature | 2 | 66.0 ∘C | Recommended range: 50–60∘C. Operation above this range increases the risk of pump wear and fluid degradation. Guidelines advise maintaining temperatures below 60∘C [69]. |
| session-1744282836799 | Heat Exchanger Outlet Temperature Difference | 4 | 6.0 ∘C | Normal range: 10–20∘C. A low temperature difference indicates underperformance or excessive cooling. An optimal C is recommended for effective heat recovery [70]. |
| session-1744282836799 | Inert Gas Flow Rate | 5 | 44.0 kmol/hr | Typical range: 10–20 kmol/hr (1–2% of total flow). Excess inert gas dilutes reactants and lowers ammonia synthesis efficiency. Recommended operational limit is kmol/hr [71]. |
Table 15.
Summary of optimized, adjusted, and non-optimized process parameters across operational sessions.
Table 15.
Summary of optimized, adjusted, and non-optimized process parameters across operational sessions.
| Session ID | Row | Parameter | Status | Optimized / Adjusted Value | Units |
|---|---|---|---|---|---|
| session-1744282836799 | Row 5 | Inert Gas Flow Rate | Calculated (1%) | 77.94 | kmol/hr |
| Row 4 | Heat Exchanger Outlet Temperature Difference | Optimized | 41.54 | ∘C | |
| Row 2 | Pump Temperature | Not optimized | – | ∘C | |
| session-1744283710559 | Row 4 | Heat Exchanger Outlet Temperature Difference | Optimized | 6.07 | ∘C |
| Row 3 | Compressor Discharge Pressure | Not optimized | – | bar | |
| session-1744284452813 | Row 5 | Stoichiometric Ratio (H2 flow) | Ratio-adjusted | 5927.45 | kmol/hr |
| Stoichiometric Ratio (N2 flow) | Ratio-adjusted | 1975.82 | kmol/hr |
Table 16.
Catalyst reactor configurations evaluated for comparative optimization analysis.
| Config | Catalyst | Reactor Type | Reactor Bed Design |
|---|---|---|---|
| 1 | Catalyst A (Standard Iron Catalyst) | Fixed Bed | Single-bed |
| 2 | Catalyst A (Standard Iron Catalyst) | Fluidized Bed | Multi-bed |
| 3 | Catalyst B (K2O Promoted Iron Catalyst) | Fluidized Bed | Multi-bed |
| 4 | Catalyst C (K2O + Al2O3 Promoted Iron Catalyst) | Fluidized Bed | Multi-bed |
Table 17.
Effect of Catalyst and Reactor Configuration on Conversion, Ammonia Production, and Emissions
Table 17.
Effect of Catalyst and Reactor Configuration on Conversion, Ammonia Production, and Emissions
| Row | Config | Catalyst | Reactor | Pre-Opt Conv (%) | Post-Opt Conv (%) | Conv (%) | Post-Opt NH3 (kmol/hr) | Post-Opt Emissions (ton/hr) |
|---|---|---|---|---|---|---|---|---|
| 1 | 1 | A | Fixed-Single | 98.00 | 98.49 | 0.49 | 7283.15 | 30.29 |
| 2 | A | Fluid-Multi | 98.00 | 98.48 | 0.48 | 7283.27 | 30.34 | |
| 3 | B | Fluid-Multi | 98.00 | 98.47 | 0.47 | 7282.98 | 30.25 | |
| 4 | C | Fluid-Multi | 98.00 | 98.47 | 0.47 | 7283.11 | 30.34 | |
| 2 | 1 | A | Fixed-Single | 93.71 | 98.64 | 4.93 | 7679.95 | 32.51 |
| 2 | A | Fluid-Multi | 93.71 | 98.65 | 4.94 | 7679.82 | 32.42 | |
| 3 | B | Fluid-Multi | 93.71 | 98.67 | 4.96 | 7679.59 | 32.48 | |
| 4 | C | Fluid-Multi | 93.71 | 98.65 | 4.94 | 7680.11 | 32.49 | |
| 3 | 1 | A | Fixed-Single | 95.33 | 98.24 | 2.91 | 8388.72 | 35.25 |
| 2 | A | Fluid-Multi | 95.33 | 98.25 | 2.92 | 8388.73 | 35.22 | |
| 3 | B | Fluid-Multi | 95.33 | 98.26 | 2.93 | 8389.07 | 35.14 | |
| 4 | C | Fluid-Multi | 95.33 | 98.24 | 2.91 | 8387.37 | 35.02 |
Disclaimer/Publisher’s Note: The statements, opinions and data contained in all publications are solely those of the individual author(s) and contributor(s) and not of MDPI and/or the editor(s). MDPI and/or the editor(s) disclaim responsibility for any injury to people or property resulting from any ideas, methods, instructions or products referred to in the content. |
© 2026 by the authors. Licensee MDPI, Basel, Switzerland. This article is an open access article distributed under the terms and conditions of the Creative Commons Attribution (CC BY) license (http://creativecommons.org/licenses/by/4.0/).
Copyright: This open access article is published under a Creative Commons CC BY 4.0 license, which permit the free download, distribution, and reuse, provided that the author and preprint are cited in any reuse.


