
Submitted:
06 January 2026
Posted:
07 January 2026
You are already at the latest version
Abstract
This study aimed to investigate whether the consumption of low-molecular weight polyphenols (LMWP, Oligonol) affects metabolic status related to fatigue and oxidative stress responses during a maximal exercise test in healthy young men. A blinded, crossover design was employed, con-sisting of a placebo condition, single consumption of LMWP (S-LMWP), and 5-day consumption of LMWP (5-LMWP), with washout intervals of at least two weeks between interventions. Among the volunteers, ten participants who met the criteria were finally enrolled in the study. Exercise performance, fatigue-related metabolic parameters, and oxidative stress markers were measured before and immediately after the maximal exercise test, as well as after a 30-min recovery period. Heart rate and lactate, as key fatigue-related parameters, were additionally assessed for 5 min immediately following the exercise. Exercise performance, and anthropometric parameters were not significantly different among the groups. However, both LMWP groups showed significantly lower blood lactate levels at the 30-min recovery period compared with placebo group. Addi-tionally, malondialdehyde levels which increased immediately after exercise, significantly re-covered toward baseline levels at 30 min in the LMWP groups, particularly in the S-LMWP group. In conclusion, short-term consumption of Oligonol may attenuate exercise-induced fatigue and oxidative stress responses during a maximal exercise test.
Keywords:
low molecular weight polyphenol
; exercise load
; fatigue
; lactate
; oxidative stress
; malondialdehyde
1. Introduction
Regular and moderate exercise has beneficial effects on health by reducing the risk of cardiovascular disease, cancer, osteoporosis, and diabetes [1,2]. In particular, it has an anti-stress effect by producing intermittently low or intermediate levels of reactive oxygen species (ROS) and regulating the signaling pathways in cellular levels [3]. However, acute and intense aerobic or anaerobic exercise can produce high levels of ROS which can induce oxidative stress thereby contributing to the wasting of antioxidants in the body and affecting health conditions such as recovery rate from fatigue or damage injury, etc. [2,4]. Oxidative stress is caused by an imbalance between the production of ROS and the performance to detoxify reactive intermediates or the antioxidant performance, as well as oxidative stress resulting from the overproduction of ROS can be a crucial mediator of damage to cellular components including lipids, membranes, proteins, and DNA [2,5,6]. Also, ROS produced during exercise contributes to delayed onset of muscle damage related to inflammation and muscle [7,8]. Accumulation of lactic acid in muscles during intense exercise is correlated with muscle fatigue, which increases the accumulation of hydrogen ions and disturbs acid-base equilibrium, consequently inhibiting muscle contraction in the body [9]. It has been reported that promptly removing these fatigue substances can quickly recover fatigue and improve exercise performance [10].
Polyphenols are antioxidants abundant in plants and have potential to be beneficial for health [11,12]. They are well-known for their working as radical scavengers and metallic chelators, but various factors in the body, such as food matrix interacting therein, liver capacity for metabolism, and gut microbiota can result in low bioavailability [13,14]. Nevertheless, both acute and chronic polyphenol supplementation can improve exercise capacity and performance [14,15,16]. This is thought to be associated with the recovery from exercise-induced muscle inflammation and oxidative stress [14]. Cases J et al. reported that supplement of PerfLoad extracted from grape (Vitis vinifera L.), pomegranate (Punica granatum L.), and green tea (Camellia sinensis L. Kuntze) at 60 minutes before exercise increased peak power output, average power output, and the activities of catalase in blood and plasma superoxide dismutase without inducing fatigue nor increasing heart rate [15]. According to Murphy CA et al., 7 days of blackcurrant intake improved overall performance capacities in repetitive short-distance cycling without changes in blood lactate concentration and heart rate [16].
The polyphenols are beneficial for increasing exercise performance with their antioxidant capacity, but they still have low bioavailability in the body, which need to be improved [13,14,15,16]. As one of endeavours to solve the problem relate to the bioavailability of polyphenols, reducing the size of high molecular weight (HMW) polyphenol has been developed, which can ameliorate their absorption into the gut membrane, as a result, one of the newly developed low-molecular-weight polyphenol (LMWP) is oligonol [17]. Oligonol is produced by the method of oligomerization of binding catechin to decomposed proanthocyanidin (PC) in an acidic environment and it contains catechin-type monomers and oligomers of PC [17,18]. As PC is structurally a polymer of catechin, its absorption rate into the gut is low due to its HMW when orally consumed [17]. Therefore, Tanaka T et al. developed a technology to convert HMW PC into low molecular weighted PC [17,19]. Nishioka H et al. reported that oligonol has higher levels of antioxidant activity compared to grape seed (Leucoselect®) and pine bark (Pycnogenol®) [20]. Oligonol also significantly had the strongest blood antioxidant capacity compared to (+) catechin and (-)-epigallocatechin 3-O-gallate in normal rats for a week at a dose of 20 mg/kg [20]. Furthermore, oligonol as an antioxidant, it improved various diseases induced oxidative stress by inhibiting inflammatory cytokines and proteins [21,22,23,24]. In exercise-induced oxidative stress, oligonol intake significantly decreased interleukin (IL)-6, IL-1β, and cortisol induced by 60 minutes of running at 75 % of VO2max intensity in men, also increased high-intensity interval exercise performance [25,26]. These results suggested that the antioxidant capacity of oligonol can contribute to maintaining exercise performance when particularly training intensity increases [26].
As mentioned above, interest in the effects of LMWP on fatigue-related substances and oxidative stress is increasing. However, few studies have investigated the effects of LMWP on exercise load, and no studies were performed to examine the various changes in biomarkers in one and short-term intake. Therefore, this study investigated the effect of LMWP on the exercise performance, fatigue related biochemical parameters, and oxidative stress responses following a maximal exercise test in healthy males in their twenties.
2. Materials and Methods
2.1. Study Subjects
Healthy males in their twenties were recruited through advertisements. Among the 20 volunteers, individuals with recent injuries, diagnosed chronic diseases, or who were unable to perform an exercise load test were excluded. Finally, 10 males were enrolled in the study. The minimum sample size for this study was calculated, with an effect size of f = 0.40, α value = 0.05, and power (1-β) = 0.8 level, using the G*Power 3.1.9.4 software [27]. All participants signed consent forms and received research details, including the study objectives, procedures, benefits, potential risks, data use and storage, and data disposal instructions. This study was approved by the Institutional Review Board of Dong-A University (2-1040709-AB-N-01-202212-HR-052-04).
2.2. Study Design
This study was cross-over design, and 2-week washout period between each test. All participants received 500 mL of water in the invisible bottles during the placebo phase (Placebo). During the single consumption of LMWP phase (S-LMWP) and the 5-day consumption of LMWP phase (5-LMWP), they received invisible bottles filled with 500 mL of water and 200 mg of oligonol. In the Placebo and S-LMWP, participants consumed before the exercise load test on the day of their visit, while in the 5-LMWP, they consumed it for five days before the visit and did not consume it on the day of the test. Oligonol, derived from the oligomerization of lychees, was provided by Amino Up Chemical Company (Sapporo, Japan). The research study subjects were not restricted for their behaviors in daily lives, but the intensive physical activity or alcohol consumption on the day before the test was prohibited, because it may potentially affect the test results. Participants were instructed to refrain from consuming any food or beverages, except water, from 9:00 p.m. the day before the test until the morning of the test day. Before test, participants completed the general characteristics, physical activity readiness questionnaire.
2.3. Nutrition Quotient
Nutrition Quotient (NQ) is an index used to assess eating behavior, meal quality, and nutritional status of individuals or groups [28,29]. In this study, NQ survey was used to investigate the usually dietary habits of the participants before the test. Furthermore, NQ was divided into four main parts (balance, moderation, practice, total) and each subdivided into three categories (75~100 % (high), 25.0~74.9 % (middle), 0~24.9 % (low)).
2.4. Exercise Load Test
Exercise load test was performed after body composition measurement. The VO2max was measured using Quark CPET gas analysis (COSMED, Rome, Italy) during test on the treadmill (T150DE, COSMED, Werneck, Germany). VO2max is defined when meeting at least two of the following criteria: 1) the subject can no longer continue the exercise or increase exercise intensity, 2) heart rate or oxygen consumption does not significantly increase anymore, 3) a respiratory exchange ratio (RER) is more than 1.10, 4) a rating of perceived exertion (RPE) is more than 17. All participants put on a face mask during the test and underwent a maximal exercise load test using the Bruce treadmill protocol. During the test, environmental factors such as temperature and humidity were recorded to ensure that all trials were conducted under the same conditions as possible. Grip strength was measured by pulling up to maximum for 2-3 seconds, repeating the process twice for each hand, and recording the highest value in 0.1 kg units using an electronic grip force meter (TAKEI, Tokyo, Japan). Back muscle strength was measured by lifting the handle of the Hellmas II digital back dynamometer (O2RUN CO., Seoul, Korea), with maximum about 3 seconds, repeating this process twice, and recording the highest value in 0.1 kg units.
2.5. Anthropometric Parameters and Blood Pressure
All the participants were asked to follow the specific guidelines before the measurement: neither intensive physical activity nor alcohol consumption within 12 hours, keeping the fasting status for at least 12 hours, and urination in 30 minutes before the measurement. All participants were measured for their body composition (body fat mass (BFM), body fat percentage (BFP), body mass index (BMI), body weight, height, lean body mass (LBM), skeletal muscle mass (SMM)) using an impedance body fat analyser (Accuniq BC720, SELVAS Healthcare, Seoul, Korea) before, after, and at 30 minutes of rest after a maximal exercise test. Blood pressure was measured in the upper arm using an automatic electronic blood pressure monitor (Automatic Blood Pressure Monitor-HEM7121, OMRON, Kyoto, Japan) at rest. The heart rate was also measured using HERAFit PRO (Health-One Co., Goyang, Korea) at before, after exercise, and at 1, 2, 3, 4, 5, and 30 minutes of rest, at the upper arm.
2.6. The Measurement of Lactate and Glucose in Whole Blood
Blood lactate levels were simply measured using a blood lactate analyzer (Lactate PRO2-LT1730, Arkray, Kyoto, Japan). 5 μl of whole blood was collected from the fingertip before, after exercise, and at 1, 2, 3, 4, 5, and 30 minutes of rest. Blood glucose levels were measured using a blood glucose test strip (BAROZEN2-GM01IAC, Handok Inc., Seoul, Korea) before a maximal exercise test.
2.7. Blood Collection
Blood samples were collected from the median cubital vein into vacutainers by trained nurses for the analysis of biochemical markers before, after, and at 30 minutes of rest after a maximal exercise test. The samples were centrifuged at 3,000 rpm at room temperature for 15 minutes, and then the separated serum was stored in a –80 ℃ deep freezer until the analysis.
2.8. Fatigue Parameters
Uric Acid (UA) was measured by enzymatic method, and phosphorus, lactate dehydrogenase (LDH), and creatine kinase (CK) were measured using a UV assay with a LABOSPECT 008AS (Hitachi High-Tech Co., Tokyo, Japan).
2.9. Oxidative Stress Related Markers
Malondialdehyde (MDA) concentrations in serum were measured by thiobarbituric acid reactive substances (TBARS) which is the end products of lipid peroxidation using a kit (OxiSelect™ TBARS Assay Kit, Cell Biolabs, San Diego, USA), and was analyzed using a microplate reader at 540 nm. Serum oxidized-LDL (ox-LDL) levels were measured using an Oxidized LDL ELISA kit (Mercodia, Uppsala, Sweden), and the wavelength was set to 450 nm.
2.10. Statistical Analysis
Statistical analysis was performed using SPSS version 27.0 (SPSS Inc., Chicago, IL, USA). The anthropometric parameters, exercise performance, and glucose level were analyzed using Friedman test for the comparison among three phases (placebo, S-LMWP and 5-LMWP). Heart rate, blood lactate level, fatigue metabolism, and oxidative stress data were analyzed using a repeated measures one-way analysis of variance (RM-ANOVA) for the interaction between phase (treatment) and time. We used Muchly's test to determine the homogeneity of variance. If Muchly's test was not the homogeneity of variance (P ≤ 0.05), Wilks' lambda test was used. Otherwise, sphericity assumed values were used. All data were analyzed using Wilcoxon signed-rank test for the comparison between two phases. The relationship between oxidative stress and biochemical markers was tested using Spearman correlation analysis. Data were presented as mean ± standard error. The p value < 0.05 was considered as statistically significant.
3. Results
3.1. General Information of the Study Subjects
General information including age, height, body weight, BMI, LBM, SMM, BFM, BFP, and NQ scores of subjects at baseline were presented in Table 1. Study subjects were found obese based on their mean BMI, but they were overweight based on their mean BFP. Furthermore, the average NQ values of all parts corresponded to the middle level of the categories. Table 2 shows anthropometric parameters of subjects according to LMWP consumption. Body weight and BMI were significantly lower in the 5-LMWP phase than those in the S-LMWP phase (p < 0.05). BFM and BFP were significantly lower in the S-LMWP phase compared to the placebo phase (p < 0.05). On the other hand, there were no significant differences in LBM and SMM among the three phases.
3.2. Exercise Performance, Fasting Glucose, and Blood Pressure of Subjects According to LMWP Consumption
Table 3 shows exercise performance, fasting glucose, and blood pressure of the study subjects according to LMWP consumption. Exercise performance was measured through maximal oxygen consumption (VO2max), maximal heart rate (HRmax), exercise time (ET), anaerobic threshold time (AT), left-hand grip strength (GL), right-hand grip strength (GR), and back muscle strength (BMS). HRmax was significantly higher in the 5-LMWP phase compared to the S-LMWP phase (p = 0.005). GL and GR were significantly lower in both LMWP consumption phases compared to the placebo phase (p < 0.05). On the other hand, VO2max, ET, AT, BMS, and glucose levels were not significantly different among the three phases. Compared with placebo phase, systolic blood pressure (SBP) was lower in the 5-LMWP phase (p = 0.005), and diastolic blood pressure (DBP) was significantly different in both the LMWP consumption phases (p < 0.05).
3.3. Comparison of Heart Rate Changes According to LMWP Consumption
Table 4 presents the time-dependent changes of heart rate according to LMWP consumption. Heart rate was measured in each phase before, immediately after exercise, and at 1, 2, 3, 4, 5, and 30 minutes of the rest. Heart rate in each phase was significantly changed in time-dependent manner (p < 0.001). However, there were no significant interactions between time and phases for heart rate changes (p = 0.293). Heart rate was significantly higher in the 5-LMWP phase compared to the placebo phase at 1 minute (p= 0.009) and 2 minutes (p= 0.041) of rest. After 5 minutes of rest, the heart rate increased in the 5-LMWP phase compared to the S-LMWP phase (p = 0.041).
3.4. Comparison of Blood Lactate Levels According to LMWP Consumption
Figure 1 presents blood lactate levels according to LMWP consumption before, immediately after exercise, and at 1, 2, 3, 4, 5, and 30 minutes of the rest. Blood lactate levels in each phase were significantly changed in time-dependent manner (p < 0.001). In addition, significant interaction between phases and time for blood lactate levels was observed (p < 0.001). Precisely, blood lactate levels were significantly lower in the S-LMWP phase compared to the placebo phase at 3, 5, and 30 minutes after the rest (p < 0.05). In particular, they were significantly lower in both the S-LMWP and 5-LMWP phases compared to the placebo phase at 30 minutes of rest (p = 0.005).
3.5. Comparison of Fatigue Metabolism and Oxidative Stress Related Markers Levels According to LMWP Consumption
Table 5 shows the serum levels of fatigue metabolism and oxidative stress-related markers levels according to the LMWP consumption before, immediately after exercise, and at 30 minutes of rest. All variables were significantly changed in time-dependent manner (p < 0.001), but the significant interaction between treatment and time was only observed in the CK (p = 0.008). At 30 minutes of the rest after exercise, UA levels were significantly lower in the S-LMWP phase compared to the placebo phase (p = 0.028). The CK levels were significantly higher in the S-LMWP phase compared to the placebo phase at all time points (p < 0.05). However, CK-MB and ox-LDL levels were not significantly different among the three phases.
3.6. Changes of Phosphorus and LDH Levels According to LMWP Consumption
Figure 2 shows changes of phosphorus and LDH levels in serum according to the LMWP consumption before, immediately after exercise, and at 30 minutes of rest. The phosphorus levels were significantly lower in the 5-LMWP phase compared to the placebo phase before exercise (p = 0.036) (Figure 2a). The LDH levels were significantly lower in the 5-LMWP phase compared to the placebo phase at all time points (p < 0.05) (Figure 2b). Both phosphorus and LDH levels were significantly changed in time-dependent manner (p < 0.001). In addition, significant treatment and time interactions were observed in serum phosphorus changes (p < 0.001), but not in LDH changes (p = 0.592).
3.7. Changes of MDA Levels According to LMWP Consumption
Figure 3a presents the changes of serum MDA before, after exercise, and at 30 minutes rest after exercise, and Figure 3b shows the changed percentage of MDA levels before exercise and at 30 minutes rest after exercise according to LMWP consumption. The MDA levels were significantly changed in time-dependent manner (p < 0.001), but no interaction between the treatment and time was observed (p = 0.101) (Figure 3a). After 30 minutes of rest, MDA levels tended to be lower in the S-LMWP phase compared to the placebo phase but did not reach statistical significance (p = 0.059) (Figure 3a). On the other hand, the levels of MDA were significantly higher in the 5-LMWP phase compared to the S-LMWP (p = 0.022) (Figure 3a). In addition, changed percentage of MDA levels was significantly lower in the S-LMWP phase compared to the placebo phase (p = 0.007) (Figure 3b).
3.8. Relationships Between Oxidative Stress Related Markers and Biochemical Markers
Figure 4 shows the relationship between oxidative stress-related markers (MDA, ox-LDL) and biochemical markers (lactate, SBP, glucose, phosphorus, LDH) during the study period. Lactate levels were tested for correlation with the percentage of MDA changed before exercise and at 30 minutes of rest (Figure 4a-d), while SBP, glucose, ox-LDL, phosphorus, and LDH were analyzed for correlation with pooling MDA (Figure 4e-i). After exercise, significant positive relationships in lactate were observed with the changed percentage of serum MDA at 3, 4, 5, and 30 minutes of rest after exercise (p < 0.001). SBP levels were negatively, but not significantly correlated with MDA levels (p = 0.065). In addition, serum levels of ox-LDL, glucose, Phosphorus, and LDH were positively correlated with MDA levels (p < 0.05).
4. Discussion
This study aimed to investigate the effects of LMWP on fatigue and oxidative stress responses during the exercise load test in healthy men in their twenties. Recently, several studies have shown their antioxidant effects [17,19,20,21,22,23,24,25,26]. However, there have been no studies on the changes in various biomarkers according to short period consumption of LMWP after a maximal exercise test. This is the first study which demonstrated that consumption of LMWP can alleviate both fatigue and oxidative stress responses during an exercise load test.
It was reported that exercise-induced oxidative damage can negatively impact cellular membranes, leading to cellular swelling, reduced membrane flow, maintenance of the ionic gradient, tissue inflammation, DNA damage, and protein changes [30,31,32]. The elevated levels of MDA, a well-known marker of lipid peroxidation, have been associated with impaired metabolism, integrity, and performance of muscle cells [30]. Thompson D et al. reported that prior to a 90-minute intermittent running test, the subjects who consumed 400 mg of vitamin C for 2 weeks were decreased MDA levels compared with the placebo group [33]. However, several studies showed that antioxidant were not effective components for exercise performance and muscle injury [34]. These conflicting results suggest the need for effective antioxidant compounds that can increase bioavailability, which is limited by differences in the level of absorption resulting from characteristics between individuals and species [35]. In the present study, increased MDA levels immediately after the exercise were significantly recovered close to the baseline level at 30 minutes in the S-LMWP phase. These results suggest that a single intake of LMWP can improve muscle damage by recovering exercise-induced increased MDA levels.
CK and LDH are related to muscle damage, and increased serum concentrations of these molecules are used as indicators of damage to muscle membranes and other tissue structures [36,37,38]. Howatson G et al. reported that there was no significant difference in CK levels when supplemented with tart cherry juice compared to placebo until 48 hours of recovery after marathon, but that CK response was correlated with the inflammatory response [39]. However, in this study, the S-LMWP phase showed an increasing trend than the placebo phase, but a large standard error was found within the S-LMWP phase. In addition, the CK levels before exercise were significantly higher in the S-LMWP phase than in the placebo phase. Previous studies have reported that exercise-induced CK levels were well recovered by supplementing with polyphenols for more than 7 days [40,41]. That is, changes in CK levels during the S-LMWP phase may not be influenced by LMWP consumption because the phase did not give enough time to affect CK levels by LMWP. Also, CK-MB which was indicated as a potential marker of type I muscle fiber damage [42], was measured in our study. Hooper DR et al. demonstrated that tart cherry extract decreased CK activity and CK-MB levels compared with placebo group following intense resistance exercise [40]. CK-MB has also been reduced by vitamin E consumption one hour before exercise [43]. In this study, CK-MB levels in both LMWP phases were reduced than in the placebo phase but which did not reach statistical significance.
LDH is an enzyme that functions to remove lactate, which is produced during the anaerobic energy metabolism of glucose during muscle contraction [44]. Under normal conditions, serum LDH activity explains the metabolism of lactate and the extent of basal cell damage which is related with the muscle soreness after exercise [45]. The current study also confirmed that supplementation with LMWP during 5 days could significantly reduce the LDH activity after a maximal exercise test. These results were partly supported by the previous study showing the consumption of oligomerized lychee fruit extract for 30 consecutive days significantly reduced the exercise-induced increase in the LDH activity [46].
Accumulation of lactate indicates the status in which production exceeds removal at maximal workloads, which also indicate the decrease in the concentration of cytoplasmic NADH and/or NADPH, this result means that the activity of the free radical scavenging enzymes may be compromised and substrates that generate free radicals can be accumulated [47]. Similarly, Davies KJ et al. found increases in free radicals and MDA levels in the muscle and liver of rats after exhaustive exercise [48]. Lovlin R et al. found a positive correlation between blood lactate concentration and plasma MDA (r = 0.51, p < 0.001) [47]. In our study, we also found a positive correlation between lactate activity and serum MDA levels at rest after exercise. These results show that serum MDA levels and lactate were significantly reduced at 30-minute of rest in the S-LMWP phase compared to the placebo phase. Likewise, a previous study reported that the change (%) in blood lactate levels was significantly lower in the 7-day LMWP supplementation group and that power output could be improved during high-intensity intermittent exercise [26]. Interestingly, in this study, the 5-LMWP phase showed that the HRmax was the highest and the AT was the fastest, but blood lactate levels were significantly lower than the placebo after a 30 minutes rest. Therefore, these results suggest the 5-day consumption of LMWP could be beneficial for recovery in aerobic performance after a maximal exercise test.
Aerobic exercise can potentially result in increased oxidative damage to tissues [49]. This damage can lead to the production of ox-LDL, which can cause inflammation of endothelial cells and result in arteriosclerosis [50]. In this study, ox-LDL levels increased at all phases after exercise. However, there was no significant results were observed in relation to LMWP intervention after 30-minute of rest. Nevertheless, there was a significant recovery in MDA levels with short-term consumption of LMWP, suggesting that consumption of LMWP may help reduce oxidative stress caused by a maximal exercise test.
There are a few limitations in this study. First, the study included a small number of subjects, even though it was designed as a cross-over with statistical power calculation. But, if a greater number of subjects are enrolled, the statistical power would be increased. Nevertheless, we found significant effects of LMWP consumption on changes in a few parameters. Second, we did not measure changes in lipid profile according to LMWP consumption after a maximal exercise test. As mentioned above, exercise induces oxidative stress, which leads to oxidative damage and may affect lipid levels in the blood [40]. Therefore, further studies are needed to investigate the effects of LMWP consumption on lipid profile including lipoproteins.
5. Conclusions
Despite these limitations, this is the first study to report that short-term consumption of LMWP (oligonol) is a useful antioxidant compound in the recovery from oxidative stress and fatigue during the maximal exercise load test. That is, this study demonstrated that short-term LMWP (oligonol) consumption may contribute to the alleviation of oxidative stress and fatigue induced by a maximal exercise test in healthy men in their twenties.
Author Contributions
J.H.W and O.Y.K. designed this study; H.K. J.P., S.M.H, S.O. B.K J.H.W. and O.Y.K. conducted all experiments and analyzed all the data; H.K. J.P. and O.Y.K. wrote the manuscript; J.H.W. and O.Y.K. revised the manuscript and provided financial support. Each author participated sufficiently in the work to take public responsibility for the contents of the paper. The manuscript has not been published and is not being considered for publication elsewhere, in whole or in part, in any language. All authors have read and agreed to the published version of the manuscript.
Funding
This study was supported by grants from the National Research Foundation of Korea (NRF; NRF-2022R1A2C1010398).
Institutional Review Board Statement
The study was conducted in accordance with the Declaration of Helsinki, and approved by the Institutional Review Board of Dong-A University (2-1040709-AB-N-01-202212-HR-052-04).
Informed Consent Statement
The study participants were explained the study objective and informed consent was obtained from all subjects involved in the study.
Data Availability Statement
The data presented in this study are not publicly available but are available from the corresponding author on reasonable request.
Conflicts of Interest
The authors declare no conflict of interest.
References
- Leeuwenburgh, C.; Heinecke, J.W. Oxidative stress and antioxidants in exercise. Curr Med Chem 2001, 8, 829–838. [Google Scholar] [CrossRef]
- Pingitore, A.; Lima, G.P.; Mastorci, F.; Quinones, A.; Iervasi, G.; Vassalle, C. Exercise and oxidative stress: potential effects of antioxidant dietary strategies in sports. Nutrition 2015, 31, 916–922. [Google Scholar] [CrossRef]
- Powers, S.K.; Duarte, J.; Kavazis, A.N.; Talbert, E.E. Reactive oxygen species are signalling molecules for skeletal muscle adaptation. Exp Physiol 2010, 95, 1–9. [Google Scholar] [CrossRef] [PubMed]
- Simioni, C.; Zauli, G.; Martelli, A.M.; Vitale, M.; Sacchetti, G.; Gonelli, A.; Neri, L.M. Oxidative stress: role of physical exercise and antioxidant nutraceuticals in adulthood and aging. Oncotarget 2018, 9, 17181–17198. [Google Scholar] [CrossRef]
- Lushchak, V.I. Free radicals, reactive oxygen species, oxidative stress and its classification. Chem Biol Interact 2014, 224, 164–175. [Google Scholar] [CrossRef] [PubMed]
- Valko, M.; Leibfritz, D.; Moncol, J.; Cronin, M.T.; Mazur, M.; Telser, J. Free radicals and antioxidants in normal physiological functions and human disease. Int J Biochem Cell Biol 2007, 39, 44–84. [Google Scholar] [CrossRef] [PubMed]
- Aoi, W.; Naito, Y.; Takanami, Y.; Kawai, Y.; Sakuma, K.; Ichikawa, H.; Yoshida, N.; Yoshikawa, T. Oxidative stress and delayed -onset muscle damage after exercise. Free Radic Biol Med 2004, 37, 480–487. [Google Scholar] [CrossRef]
- Ferreira, L.F.; Reid, M.B. Muscle-derived ROS and thiol regulation in muscle fatigue. J Appl Physiol (1985) 2008, 104, 853–860. [Google Scholar] [CrossRef]
- Jacobs, I. Blood lactate. Implications for training and sports performance. Sports Med 1986, 3, 10–25. [Google Scholar] [CrossRef]
- Jaap, A.J.; Shore, A.C.; Tooke, J.E. Relationship of insulin resistance to microvascular dysfunction in subjects with fasting hyperglycaemia. Diabetologia 1997, 40, 238–243. [Google Scholar] [CrossRef]
- Wan, M.L.Y.; Co, V.A.; El-Nezami, H. Dietary polyphenol impact on gut health and microbiota. Crit Rev Food Sci Nutr 2021, 61, 690–711. [Google Scholar] [CrossRef]
- Costa, C.; Tsatsakis, A.; Mamoulakis, C.; Teodoro, M.; Briguglio, G.; Caruso, E.; Tsoukalas, D.; Margina, D.; Dardiotis, E.; Kouretas, D.; et al. Current evidence on the effect of dietary polyphenols intake on chronic diseases. Food Chem Toxicol 2017, 110, 286–299. [Google Scholar] [CrossRef]
- Di Lorenzo, C.; Colombo, F.; Biella, S.; Stockley, C.; Restani, P. Polyphenols and human health: the role of bioavailability. Nutrients 2021, 13, 273. [Google Scholar] [CrossRef]
- Bowtell, J.; Kelly, V. Fruit-derived polyphenol supplementation for athlete recovery and performance. Sports Med 2019, 49 (Suppl. 1), 3–23. [Google Scholar] [CrossRef] [PubMed]
- Cases, J.; Romain, C.; Marín-Pagán, C.; Chung, L.H.; Rubio-Pérez, J.M.; Laurent, C.; Gaillet, S.; Prost-Camus, E.; Prost, M.; Alcaraz, P.E. Supplementation with a polyphenol-rich extract, PerfLoadⓇ, improves physical performance during high-intensity exercise: a randomized, double blind, crossover trial. Nutrients 2017, 9, 421. [Google Scholar] [CrossRef] [PubMed]
- Murphy, C.A.; Cook, M.D.; Willems, M.E. Effect of New Zealand blackcurrant extract on repeated cycling time trial performance. Sports (Basel) 2017, 5, 25. [Google Scholar] [CrossRef]
- Tanaka, T.; Yoshitake, N.; Zhao, P.; Matsuo, Y.; Kouno, I.; Nonaka, G. Production of oligomeric proanthocyanidins by fragmentation of polymers. Jpn J Food Chem 2007, 14, 134–139. [Google Scholar]
- Fujii, H.; Nishioka, H.; Wakame, K.; Magnuson, B.A.; Roberts, A. Acute, subchronic and genotoxicity studies conducted with Oligonol, an oligomerized polyphenol formulated from lychee and green tea extracts. Food Chem Toxicol 2008, 46, 3553–3562. [Google Scholar] [CrossRef]
- Park, C.H.; Noh, J.S.; Fujii, H.; Roh, S.S.; Song, Y.O.; Choi, J.S.; Chung, H.Y.; Yokozawa, T. Oligonol, a low-molecular-weight polyphenol derived from lychee fruit, attenuates gluco-lipotoxicity-mediated renal disorder in type 2 diabetic db/db mice. Drug Discov Ther 2015, 9, 13–22. [Google Scholar] [CrossRef]
- Nishioka, H.; Fujii, H.; Sun, B.; Aruoma, O.I. Comparative efficacy of oligonol, catechin and (−)-epigallo catechin 3-O-gallate in modulating the potassium bromate-induced renal toxicity in rats. Toxicology 2006, 226, 181–187. [Google Scholar] [CrossRef]
- Yum, H.Y.; Zhong, X.; Park, J.; Na, H.K.; Kim, N.; Lee, H.S.; Surh, Y.J. Oligonol inhibits dextran sulfate sodium-induced colitis and colonic adenoma formation in mice. Antioxid Redox Signal 2013, 19, 102–114. [Google Scholar] [CrossRef]
- Kim, K.J.; Park, J.M.; Lee, J.S.; Kim, Y.S.; Kangwan, N.; Han, Y.M.; Kang, E.A.; An, J.M.; Park, Y.K.; Hahm, K.B. Oligonol prevented the relapse of dextran sulfate sodium-ulcerative colitis through enhancing NRF2-mediated antioxidative defense mechanism. J Physiol Pharmacol 2018, 69. [Google Scholar]
- Bak, J.; Je, N.K.; Chung, H.Y.; Yokozawa, T.; Yoon, S.; Moon, J.Y. Oligonol ameliorates CCl4-induced liver injury in rats via the NF-Kappa B and MAPK signaling pathways. Oxid Med Cell Longev 2016, 2016, 3935841. [Google Scholar] [CrossRef] [PubMed]
- Choi, Y.Y.; Maeda, T.; Fujii, H.; Yokozawa, T.; Kim, H.Y.; Cho, E.J.; Shibamoto, T. Oligonol improves memory and cognition under an amyloid β25-35-induced Alzheimer's mouse model. Nutr Res 2014, 34, 595–603. [Google Scholar] [CrossRef] [PubMed]
- Lee, J.B.; Shin, Y.O.; Min, Y.K.; Yang, H.M. The effect of oligonol intake on cortisol and related cytokines in healthy young men. Nutr Res Pract 2010, 4, 203–207. [Google Scholar] [CrossRef]
- Kawamura, A.; Hashimoto, S.; Suzuki, M.; Ueno, H.; Sugita, M. Oligomerized polyphenols in lychee fruit extract supplements may improve high-intensity exercise performance in male athletes: a pilot study. Phys Act Nutr 2021, 25, 8–15. [Google Scholar] [CrossRef]
- Faul, F.; Erdfelder, E.; Lang, A.G.; Buchner, A. G*Power 3: a flexible statistical power analysis program for the social, behavioral, and biomedical sciences. Behav Res Methods 2007, 39, 175–191. [Google Scholar] [CrossRef]
- Lee, J.S.; Kim, H.Y.; Hwang, J.Y.; Kwon, S.; Chung, H.R.; Kwak, T.K.; Kang, M.H.; Choi, Y.S. Development of nutrition quotient for Korean adults: item selection and validation of factor structure. J Nutr Health 2018, 51, 340–356. [Google Scholar] [CrossRef]
- Yook, S.M.; Lim, Y.S.; Lee, J.S.; Kim, K.N.; Hwang, H.J.; Kwon, S.; Hwang, J.Y.; Kim, H.Y. Revision of Nutrition Quotient for Korean adults: NQ-2021. J Nutr Health 2022, 55, 278–295. [Google Scholar] [CrossRef]
- Thirumalai, T.; Therasa, S.V.; Elumalai, E.K.; David, E. Intense and exhaustive exercise induce oxidative stress in skeletal muscle. Asian Pac J Trop Dis 2011, 1, 63–66. [Google Scholar] [CrossRef]
- Okafor, O.Y.; Erukainure, O.l.; Ajiboye, J.A.; Adejobi, R.O.; Owolabi, F.O.; Kosoko, S.B. Modulatory effect of pineapple peel extract on lipid peroxidation, catalase activity and hepatic biomarker levels in blood plasma of alcohol-induced oxidative stressed rats. Asian Pac J Trop Biomed 2011, 1, 12–14. [Google Scholar] [CrossRef]
- Alessio, H.M. Exercise-induced oxidative stress. Med Sci Sports Exerc 1993, 25, 218–224. [Google Scholar] [CrossRef] [PubMed]
- Thompson, D.; Williams, C.; McGregor, S.J.; Nicholas, C.W.; McArdle, F.; Jackson, M.J.; Powell, J.R. Prolonged vitamin C supplementation and recovery from demanding exercise. Int J Sport Nutr Exerc Metab 2001, 11, 466–481. [Google Scholar] [CrossRef]
- Kawamura, T.; Muraoka, I. Exercise-Induced Oxidative Stress and the Effects of Antioxidant Intake from a Physiological Viewpoint. Antioxidants (Basel) 2018, 7, 119. [Google Scholar] [CrossRef]
- Powers, S.K.; Smuder, A.J.; Kavazis, A.N.; Hudson, M.B. Experimental guidelines for studies designed to investigate the impact of antioxidant supplementation on exercise performance. Int J Sport Nutr Exerc Metab 2010, 20, 2–14. [Google Scholar] [CrossRef]
- Brown, S.J.; Child, R.B.; Day, S.H.; Donnelly, A.E. Exercise-induced skeletal muscle damage and adaptation following repeated bouts of eccentric muscle contractions. J Sports Sci 1997, 15, 215–222. [Google Scholar] [CrossRef]
- Willoughby, D.S.; McFarlin, B.; Bois, C. Interleukin-6 expression after repeated bouts of eccentric exercise. Int J Sports Med 2003, 24, 15–21. [Google Scholar] [CrossRef]
- Foschini, D.; Prestes, J. Acute hormonal and immune responses after a bi-set strength training. Fit Perform J 2007, 6, 38–44. [Google Scholar] [CrossRef]
- Howatson, G.; McHugh, M.P.; Hill, J.A.; Brouner, J.; Jewell, A.P.; van Someren, K.A.; Shave, R.E.; Howatson, S.A. Influence of tart cherry juice on indices of recovery following marathon running. Scand J Med Sci Sports 2010, 20, 843–852. [Google Scholar] [CrossRef] [PubMed]
- Hooper, D.R.; Orange, T.; Gruber, M.T.; Darakjian, A.A.; Conway, K.L.; Hausenblas, H.A. Broad spectrum polyphenol supplementation from tart cherry extract on markers of recovery from intense resistance exercise. J Int Soc Sports Nutr 2021, 18, 47. [Google Scholar] [CrossRef] [PubMed]
- Huang, C.C.; Lee, M.C.; Ho, C.S.; Hsu, Y.J.; Ho, C.C.; Kan, N.W. Protective and recovery effects of resveratrol supplementation on exercise performance and muscle damage following acute plyometric exercise. Nutrients 2021, 13, 3217. [Google Scholar] [CrossRef] [PubMed]
- Carmona, G.; Roca, E.; Guerrero, M.; Cusso, R.; Barcena, C.; Mateu, M.; Cadefau, J.A. Fibre-type-specific and mitochondrial biomarkers of muscle damage after mountain races. Int J Sports Med 2019, 40, 253–262. [Google Scholar] [CrossRef]
- Santos, S.A.; Silva, E.T.; Caris, A.V.; Lira, F.S.; Tufik, S.; Dos Santos, R.V. Vitamin E supplementation inhibits muscle damage and inflammation after moderate exercise in hypoxia. J Hum Nutr Diet 2016, 29, 516–522. [Google Scholar] [CrossRef]
- Lu, H.K.; Hsieh, C.C.; Hsu, J.J.; Yang, Y.K.; Chou, H.N. Preventive effects of spirulina platensis on skeletal muscle damage under exercise-induced oxidative stress. Eur J Appl Physiol 2006, 98, 220–226. [Google Scholar] [CrossRef]
- You, L.J.; Zhao, M.M.; Regenstein, J.M.; Ren, J.Y. In vitro antioxidant activity and in vivo anti-fatigue effect of loach (Misgurnus anguillicaudatus) peptides prepared by papain digestion. Food Chem 2011, 124, 188–194. [Google Scholar] [CrossRef]
- Kang, S.W.; Hahn, S.; Kim, J.J.; Yang, S.M.; Park, B.J.; Lee, S.C. Oligomerized lychee fruit extract (OLFE) and a mixture of vitamin C and vitamin E for endurance capacity in a double blind randomized controlled trial. J Clin Biochem Nutr 2012, 50, 106–113. [Google Scholar] [CrossRef] [PubMed]
- Lovlin, R.; Cottle, W.; Pyke, I.; Kavanagh, M.; Belcastro, A.N. Are indices of free radical damage related to exercise intensity. Eur J Appl Physiol Occup Physiol 1987, 56, 313–316. [Google Scholar] [CrossRef]
- Davies, K.J.; Quintanilha, A.T.; Brooks, G.A.; Packer, L. Free radicals and tissue damage produced by exercise. Biochem Biophys Res Commun 1982, 107, 1198–1205. [Google Scholar] [CrossRef]
- Jenkins, R.R. Exercise and oxidative stress methodology: a critique. Am J Clin Nutr 2000, 72, 670S–4S. [Google Scholar] [CrossRef]
- Morel, D.W.; Hessler, J.R.; Chisolm, G.M. Low density lipoprotein cytotoxicity induced by free radical peroxidation of lipid. J Lipid Res 1983, 24, 1070–1076. [Google Scholar] [CrossRef] [PubMed]
Figure 1.
Time-dependent blood lactate levels according to LMWP consumption. Tested by Wilks's lambda test (repeated measured ANOVA) and Wilcoxon signed-rank test (non-parametric paired t-test). p0: comparison of changes according to time, p1: treatment x group interaction. *Significant difference between the placebo and S-LMWP. #Significant difference between the S-LMWP and 5-LMWP. †Significant difference between the placebo and 5-LMWP. After, immediately after the maximal exercise test; Before, Before the maximal exercise test; 5-LMWP, 5-day consumption of low molecular weight polyphenol; Rest, 30-min rest after the exercise; S-LMWP, single consumption of low molecular weight polyphenol.
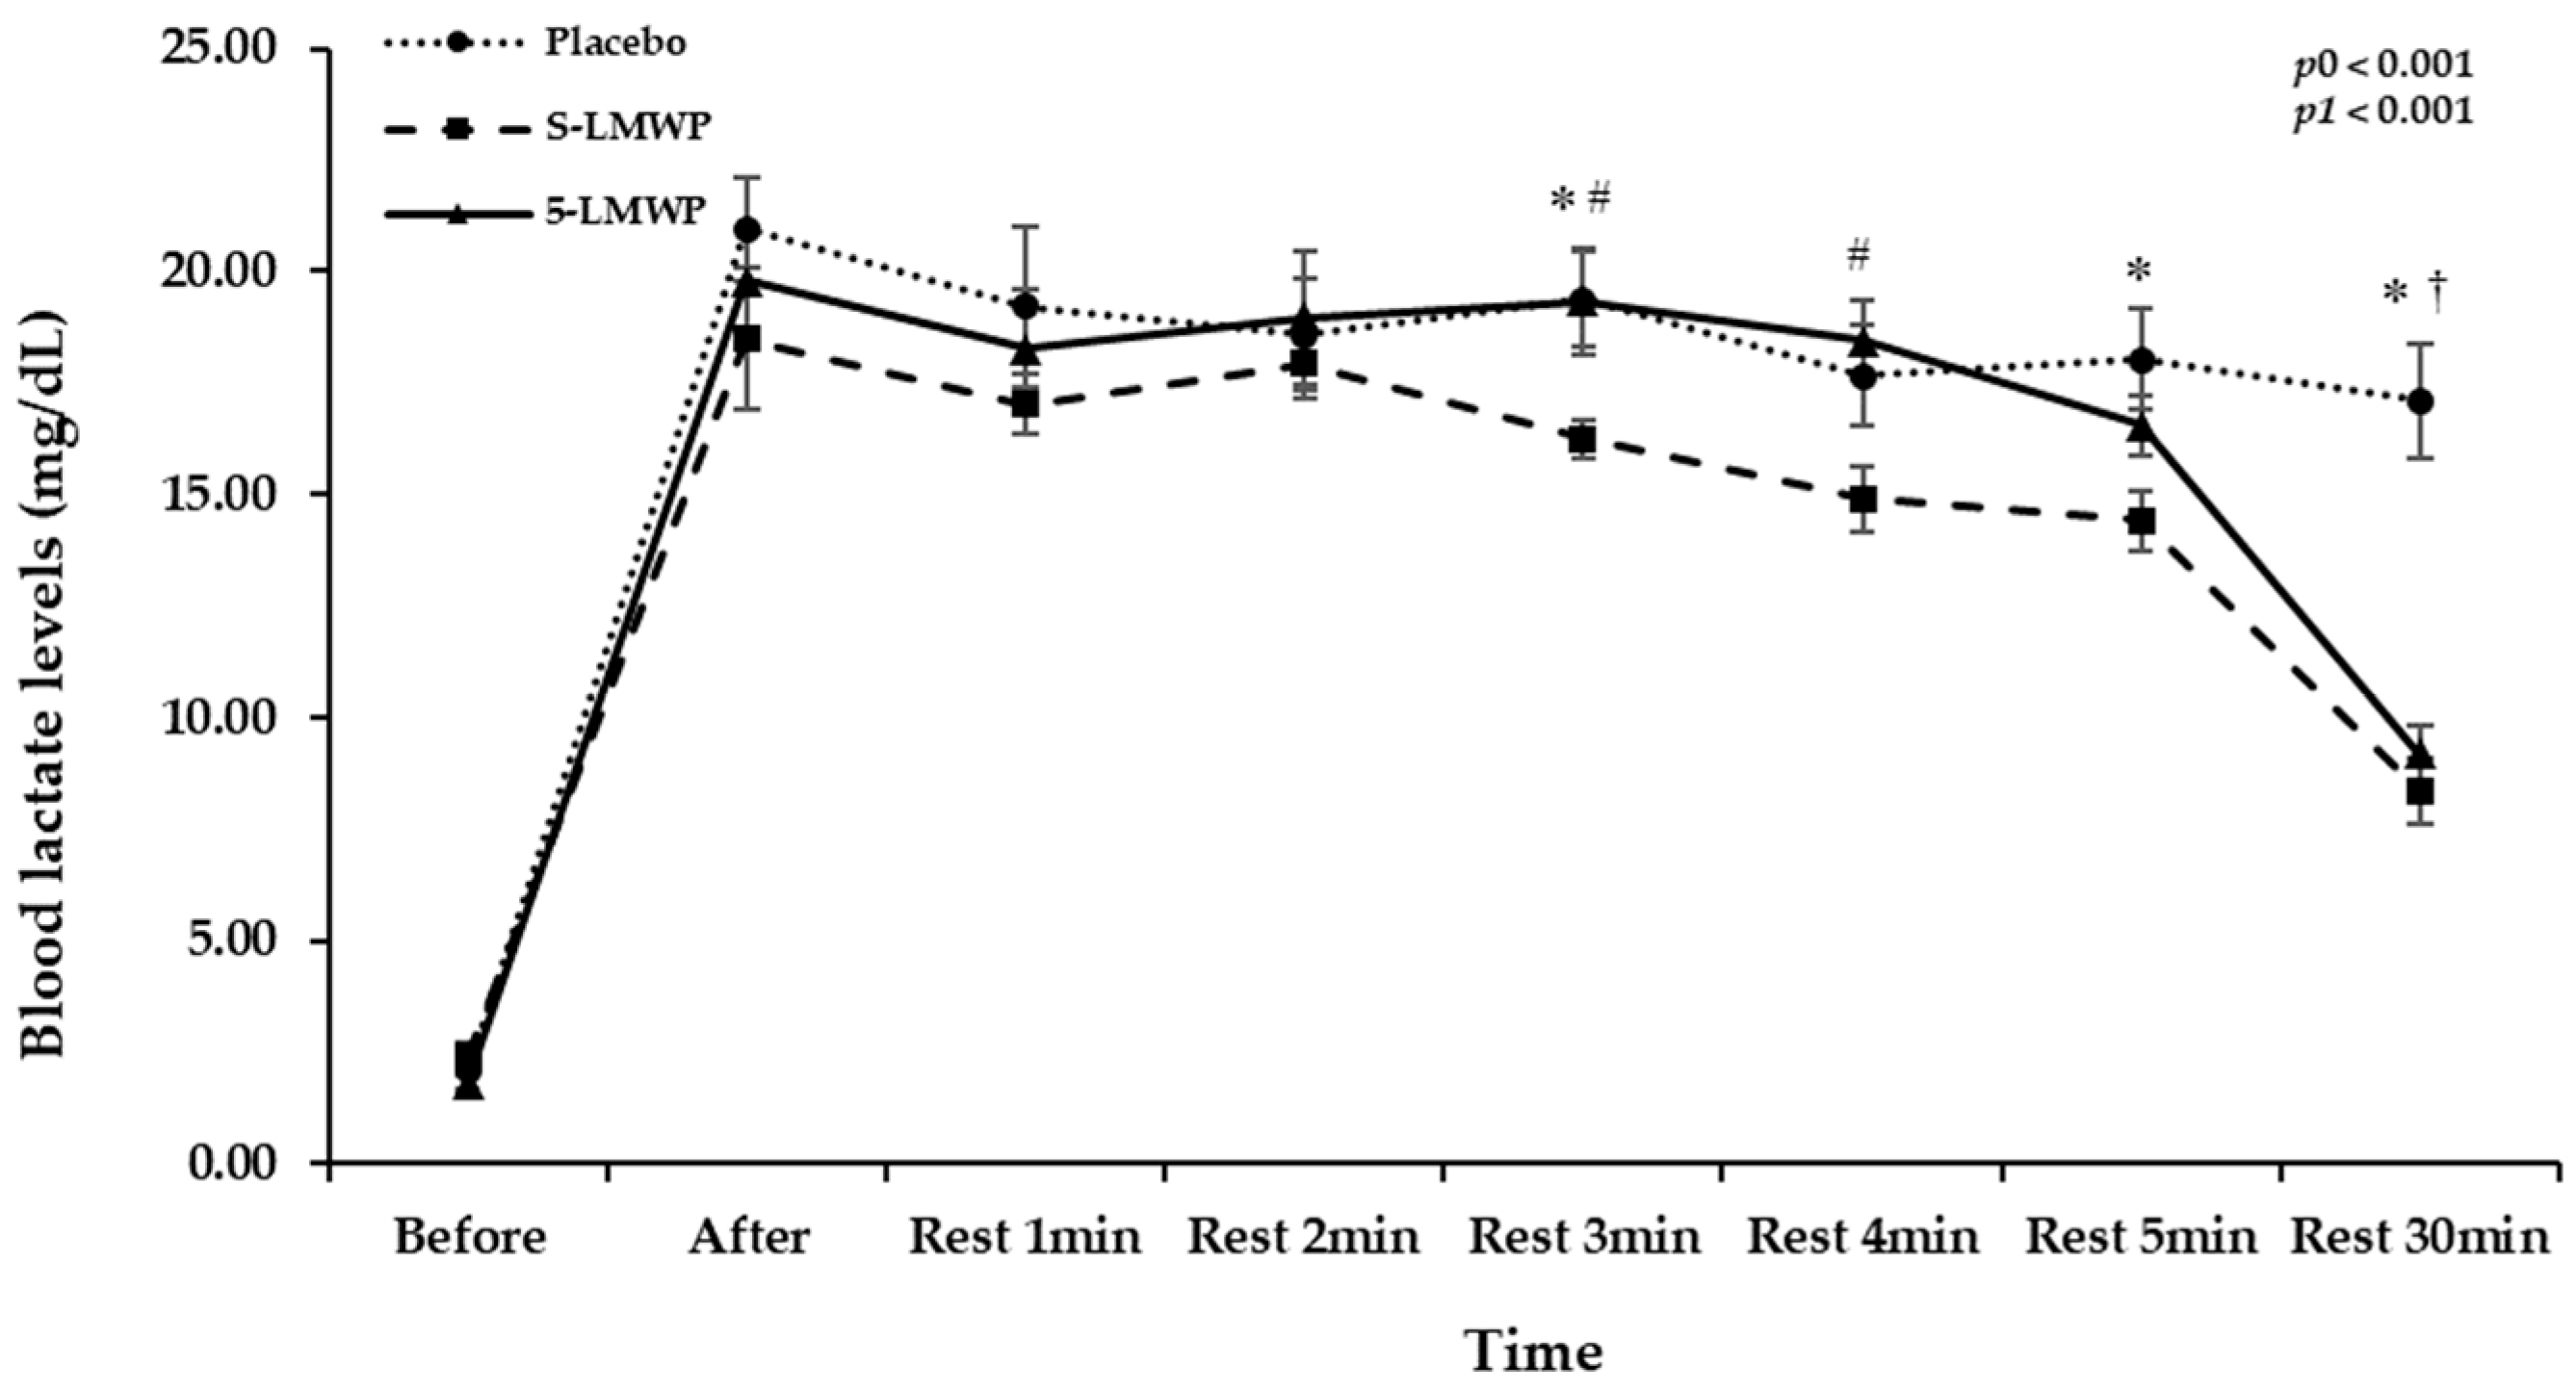
Figure 2.
Serum levels of Phosphorus and LDH according to LMWP consumption. The effects of low molecular weight polyphenol (LMWP) consumption on serum levels of phosphorus (a), and LDH (b). Tested by Muchly's test for the homogeneity of variance and Wilcoxon signed-rank test (non-parametric paired t-test). p0: comparison of changes according to time, p1: treatment x group interaction. †Significant difference between the placebo and 5-LMWP. After, immediately after the maximal exercise test; Before, before a maximal exercise test; LDH, lactate dehydrogenase; 5-LMWP, 5-day consumption of low molecular weight polyphenol; Rest, 30-min rest after the exercise; S-LMWP, single consumption of low molecular weight polyphenol.
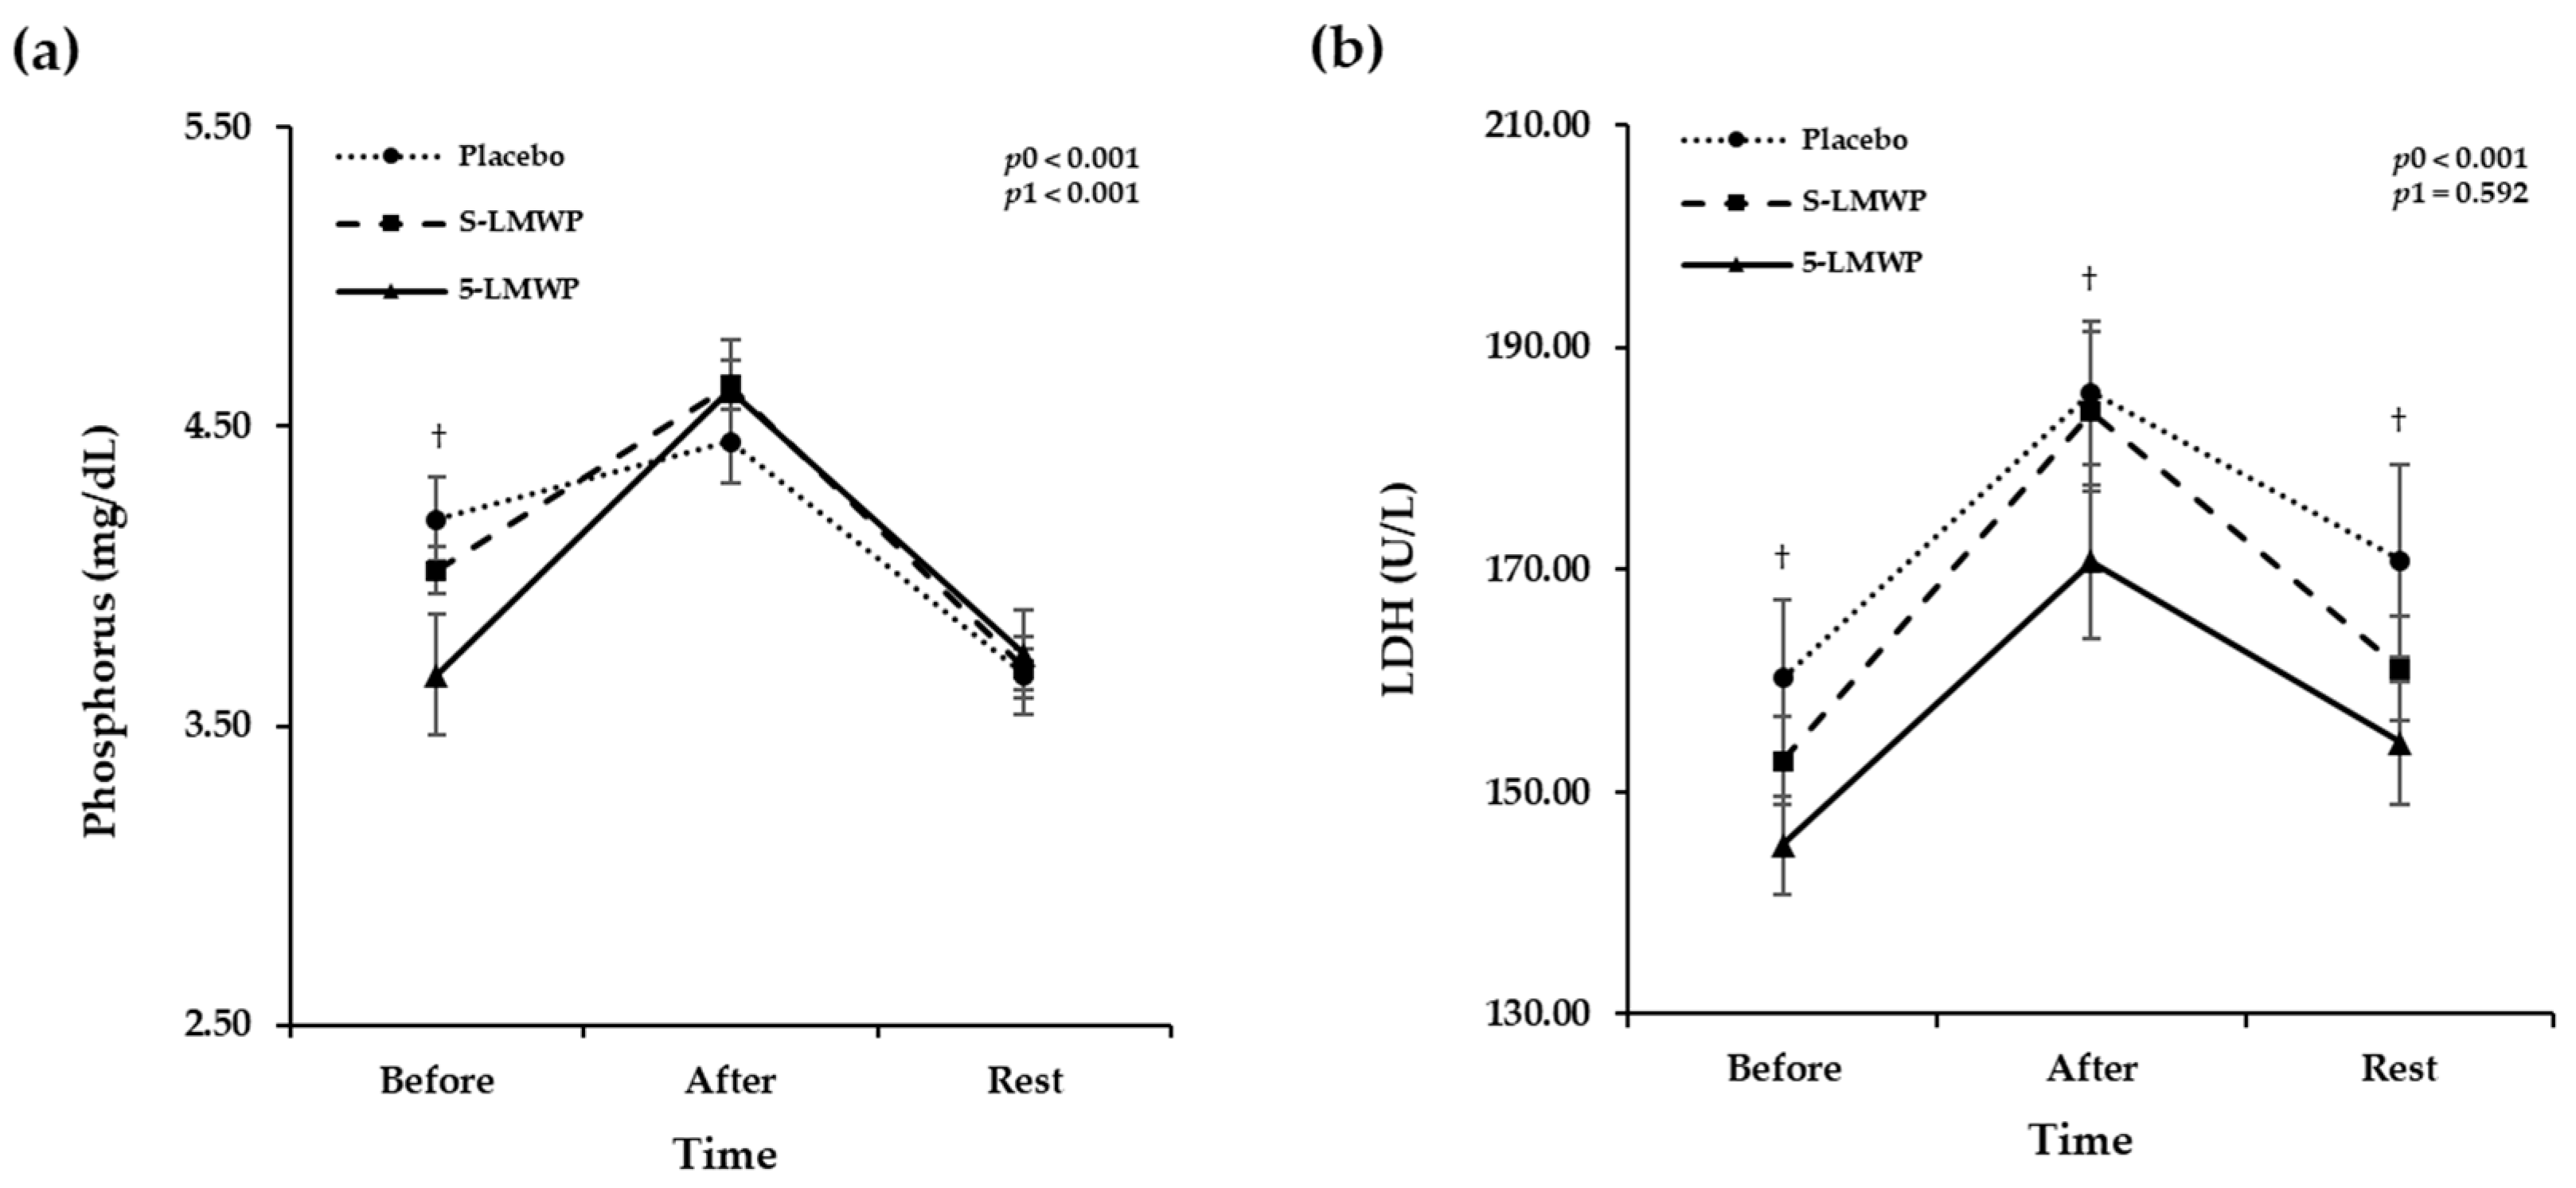
Figure 3.
Serum levels of MDA according to LMWP consumption. The effects of low molecular weight polyphenol (LMWP) consumption on serum levels of malondialdehyde (MDA) (a), and changed percentage of serum MDA levels before and at 30 minutes of rest after exercise (b). Tested by Wilks's lambda test (repeated measured ANOVA) and Wilcoxon signed-rank test. p0: comparison of changes according to time, p1: treatment x group interaction. *Significant difference between the placebo and S-LMWP. #Significant difference between the S-LMWP and 5-LMWP. After, immediately after a maximal exercise test; Before, before the maximal exercise test; 5-LMWP, 5-day consumption of low molecular weight polyphenol; MDA, malondialdehyde; Rest, 30-min rest after the exercise S-LMWP, single consumption of low molecular weight polyphenol.
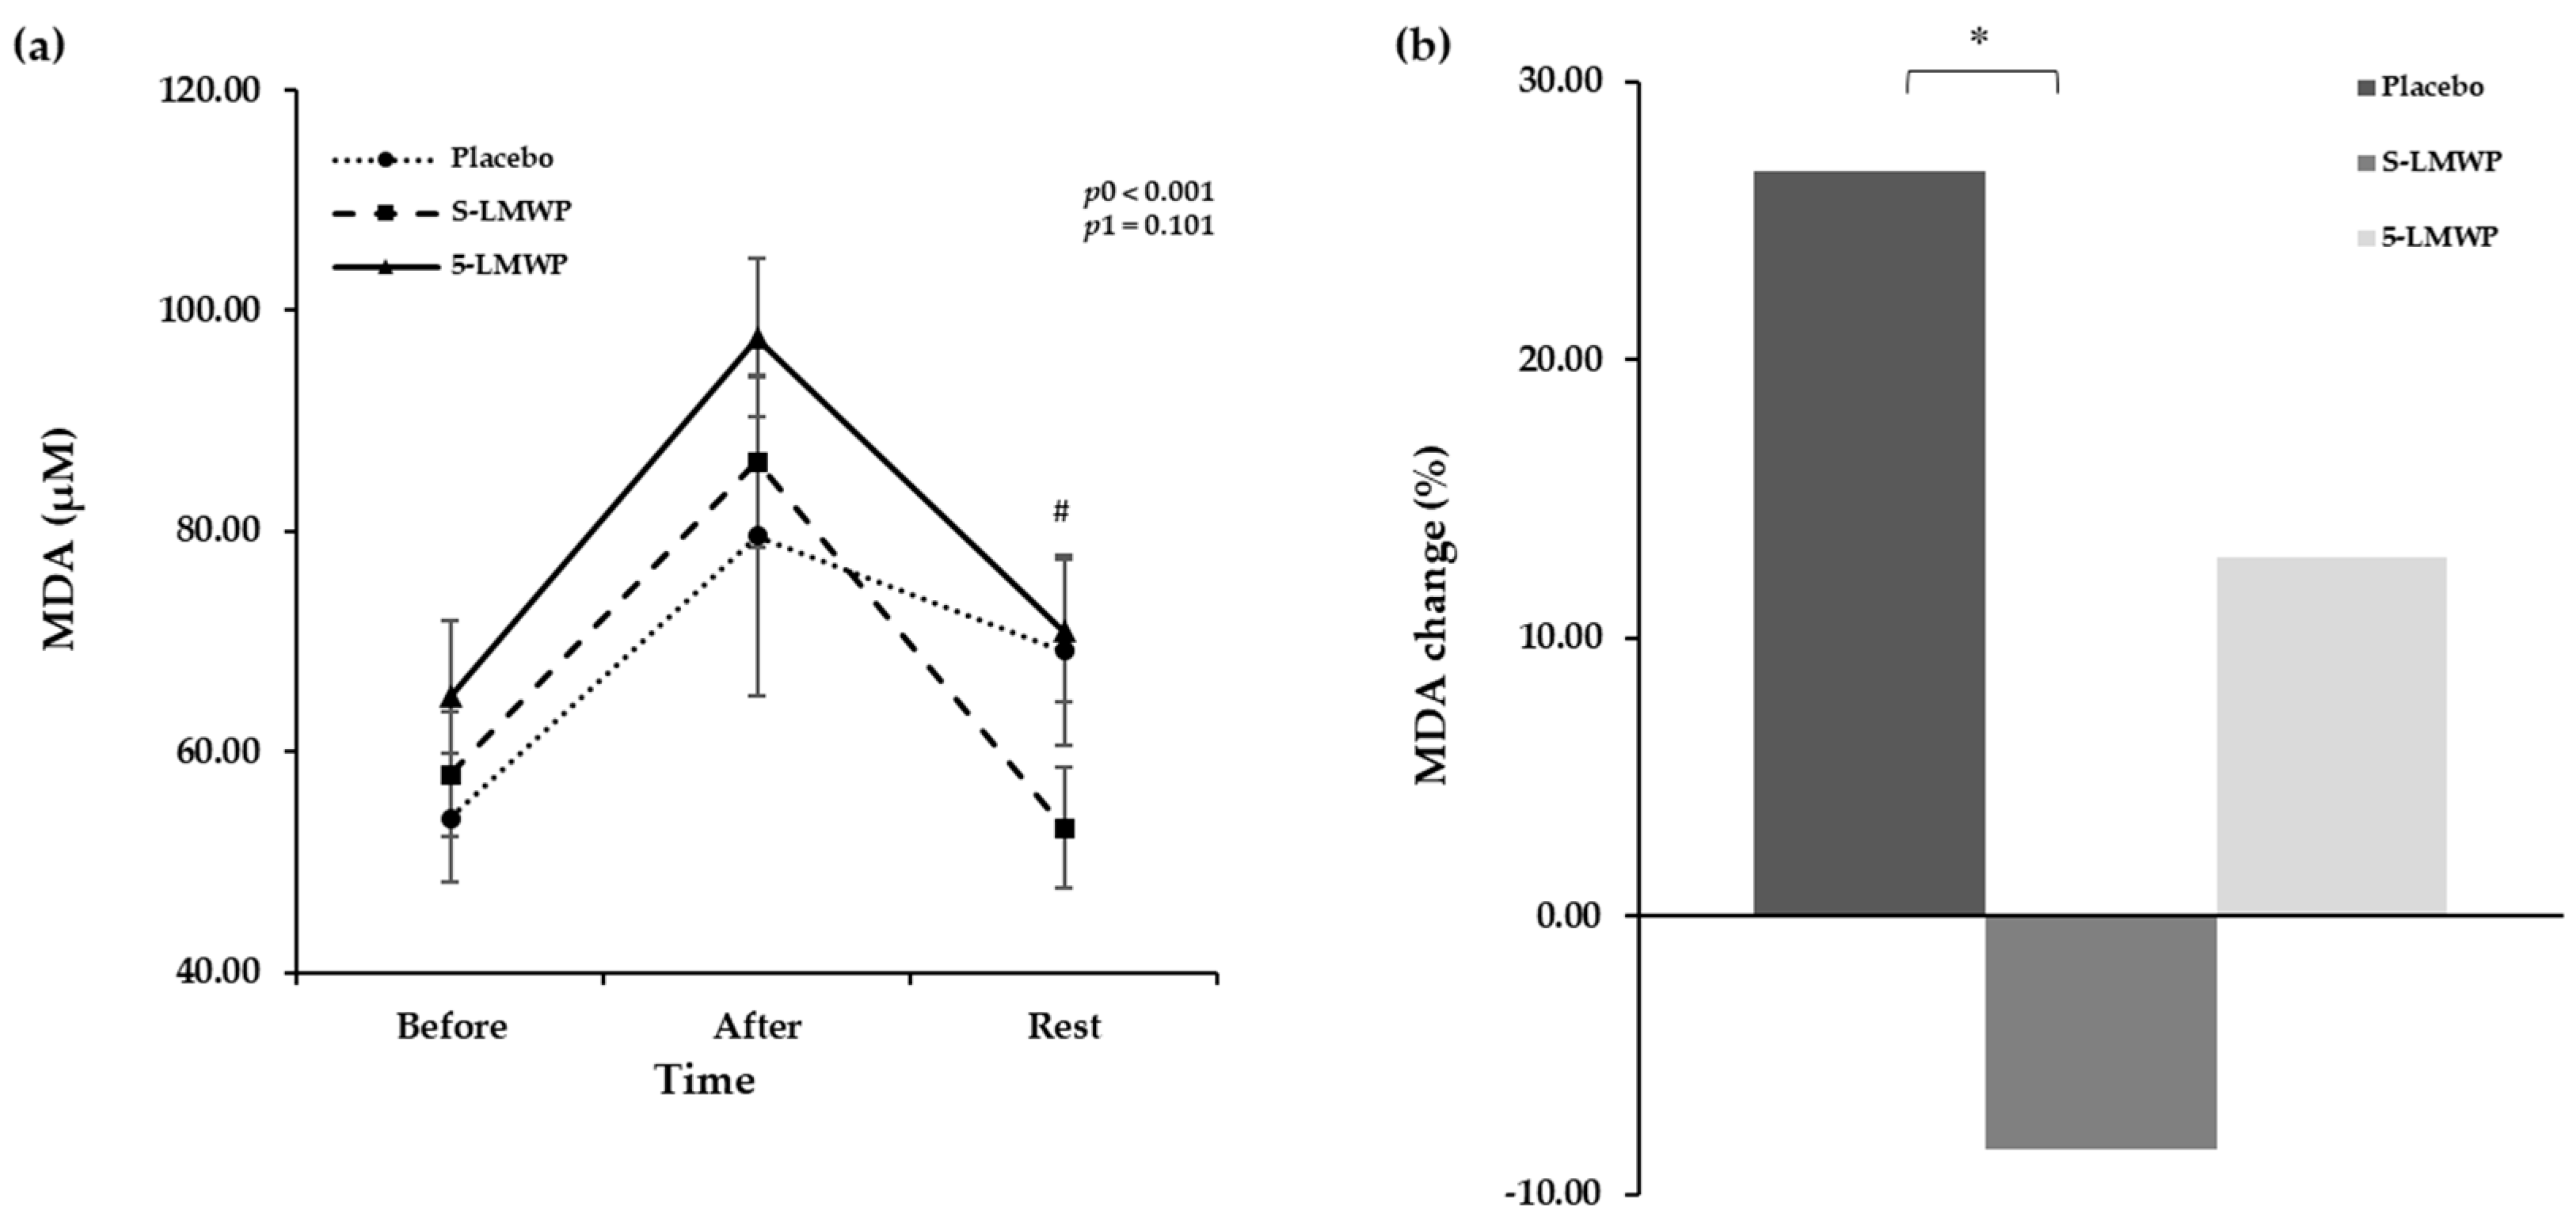
Figure 4.
Relationships between oxidative stress related markers and biochemical markers. Correlation between lactate levels at each time point and MDA change (%) (a-d), and correlation with pooling MDA levels and glucose (e), SBP (f), ox-LDL (g), phosphorus (h), and LDH levels (i). Tested by Spearman correlation analysis (unadjusted). MDA change (%) was the changed percentage of serum MDA levels before and at 30 minutes of rest after exercise. Rest, 30-min rest after the exercise; r, correlation coefficient; p, p value; LDH, lactate dehydrogenase; MDA, malondialdehyde; ox-LDL, oxidized-LDL; SBP, systolic blood pressure.
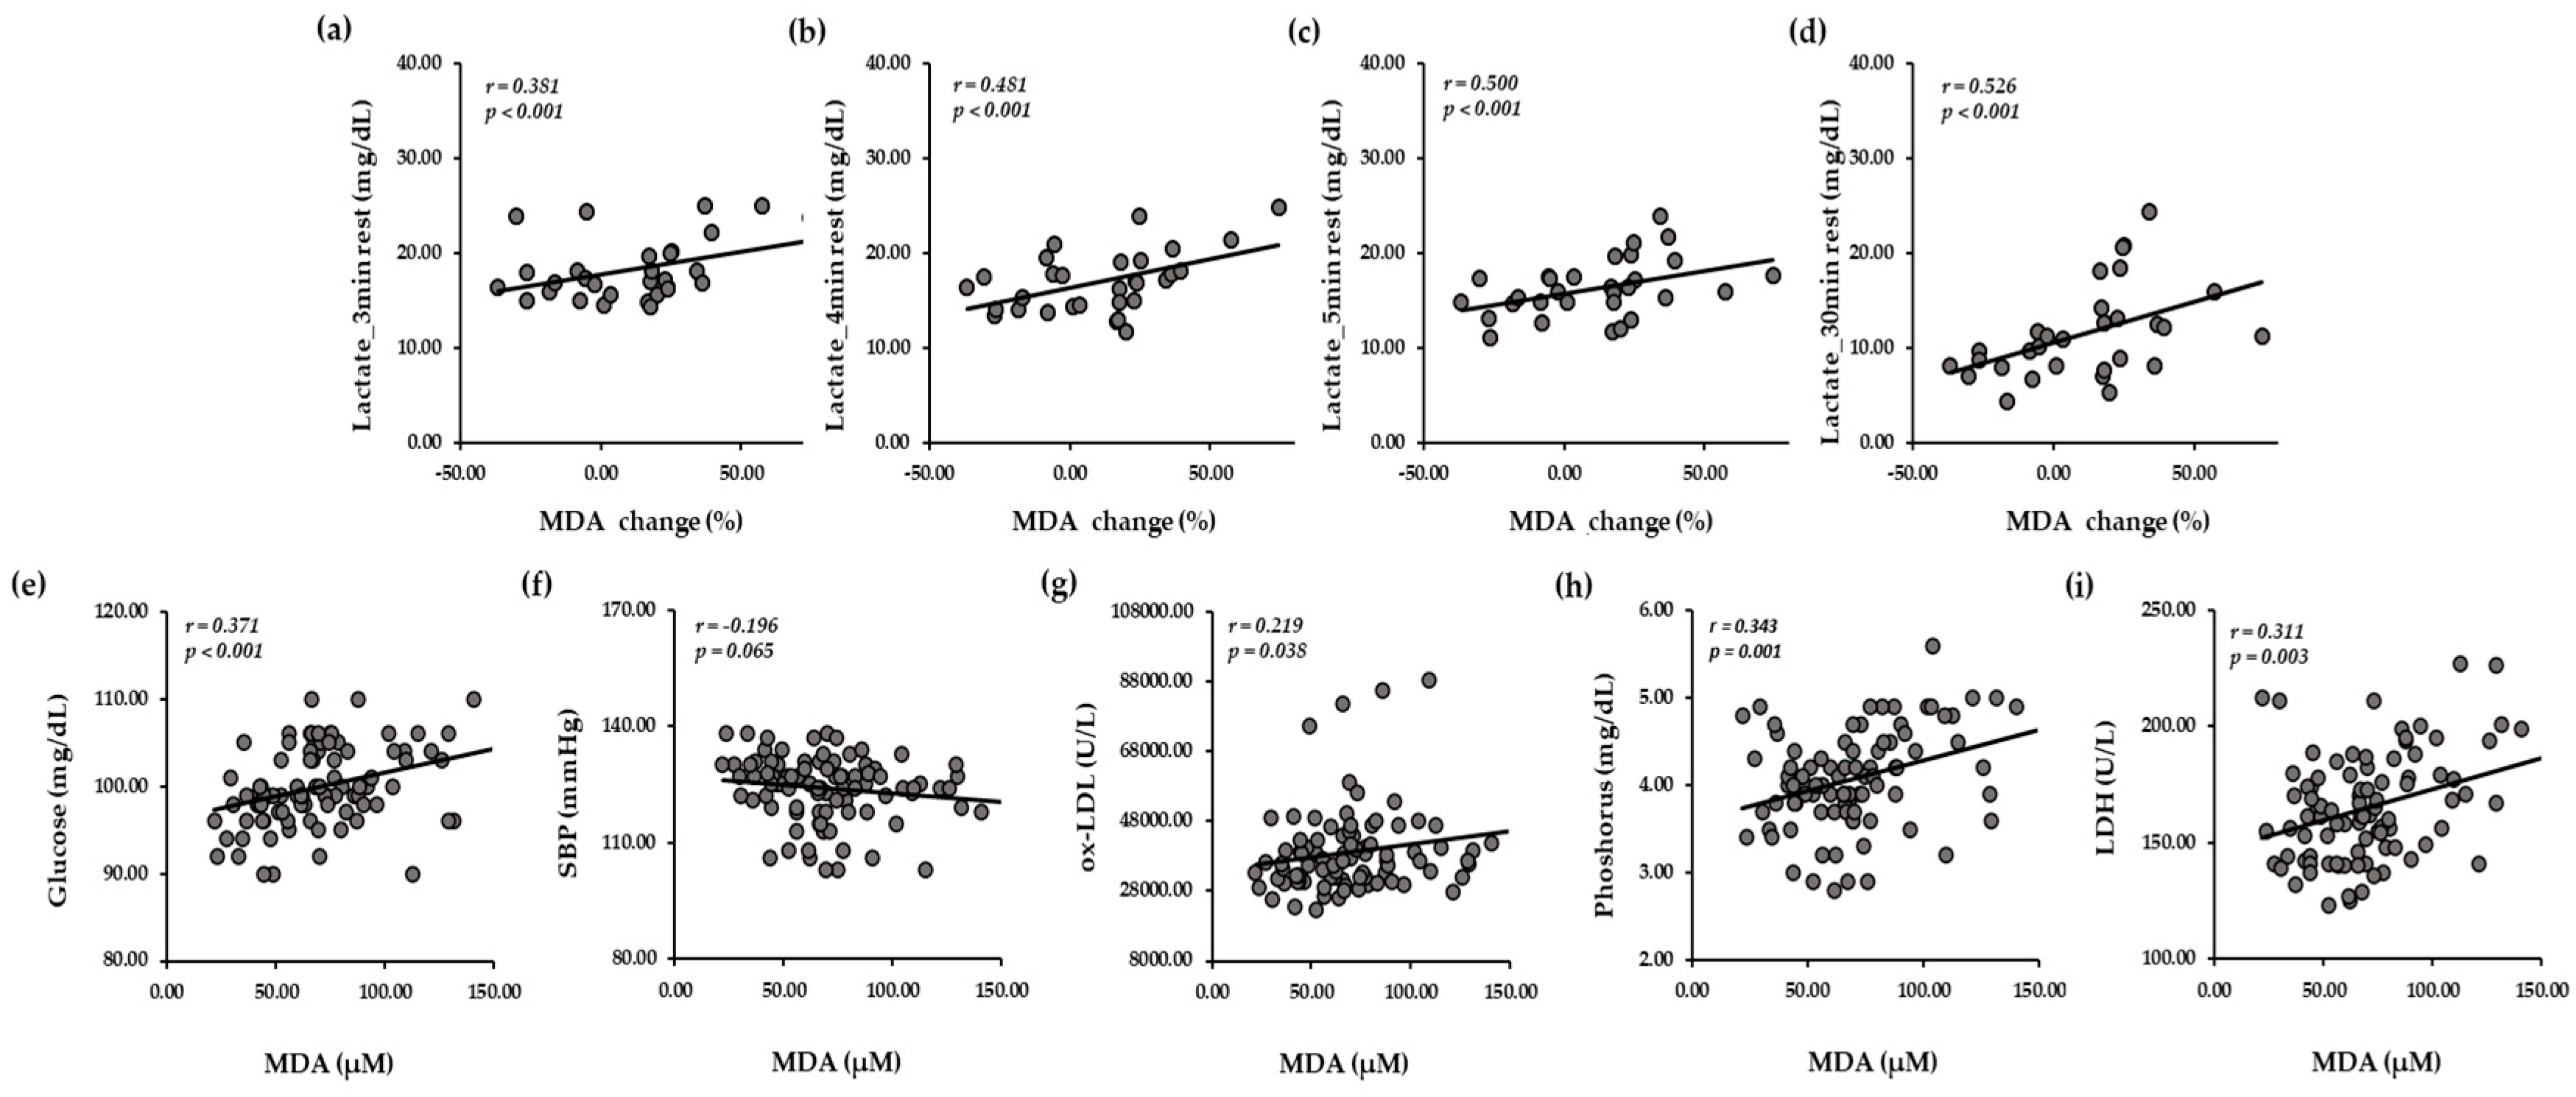

Table 1.
General characteristics and NQ of subjects at baseline (n=10).
| Variables | Mean | ± | SE | Min | Max |
|---|---|---|---|---|---|
| Age (years) | 24.00 | ± | 0.52 | 22.00 | 27.00 |
| Height (cm) | 177.47 | ± | 1.87 | 166.70 | 188.10 |
| Weight (kg) | 80.32 | ± | 2.79 | 67.70 | 93.50 |
| BMI (kg/m2) | 25.52 | ± | 0.81 | 23.50 | 30.00 |
| LBM (kg) | 61.34 | ± | 1.93 | 50.90 | 70.30 |
| SMM (kg) | 34.39 | ± | 1.10 | 28.50 | 39.80 |
| BFM (kg) | 18.98 | ± | 1.89 | 8.90 | 28.80 |
| BFP (%) | 23.37 | ± | 1.75 | 11.20 | 30.80 |
| NQ1 (balance) | 28.88 | ± | 4.45 | 3.93 | 47.00 |
| NQ2 (moderation) | 38.76 | ± | 3.17 | 25.90 | 53.90 |
| NQ3 (practice) | 58.82 | ± | 2.41 | 48.06 | 67.76 |
| NQ4 (total) | 43.82 | ± | 2.18 | 34.90 | 56.57 |
Data are presented as mean ± standard error (S.E.), minimum (Min) and maximum (Max). BMI, body mass index; BFM, body fat mass; BFP, body fat percentage; LBM, lean body mass; NQ, nutrition quotient; SMM, skeletal muscle mass.
Table 2.
Comparison of anthropometric parameters according to LMWP consumption (n=10).
| Variables | Placebo | S-LMWP | 5-LMWP | p value | ||||||
|---|---|---|---|---|---|---|---|---|---|---|
| Weight (kg) | 80.32 | ± | 2.79ab | 80.87 | ± | 3.01a | 80.35 | ± | 2.98b | 0.125 |
| BMI (kg/m2) | 25.52 | ± | 0.81ab | 25.80 | ± | 0.85a | 25.57 | ± | 0.86b | 0.124 |
| LBM (kg) | 61.34 | ± | 1.93 | 62.23 | ± | 2.01 | 61.66 | ± | 1.89 | 0.452 |
| SMM (kg) | 34.39 | ± | 1.10 | 34.91 | ± | 1.14 | 34.59 | ± | 1.07 | 0.452 |
| BFM (kg) | 18.98 | ± | 1.89a | 18.64 | ± | 1.92b | 18.69 | ± | 2.00ab | 0.358 |
| BFP (%) | 23.37 | ± | 1.75a | 22.78 | ± | 1.71b | 22.94 | ± | 1.07ab | 0.031 |
Data are presented as mean ± standard error (S.E.). Tested by Friedman test (non-parametric ANOVA). The same alphabets above the values indicate no significant difference from each other and were tested by Wilcoxon signed-rank test (non-parametric paired t-test). BMI, body mass index; BFM, body fat mass; BFP, body fat percentage; LBM, lean body mass; 5-LMWP, 5-day consumption of low molecular weight polyphenol; S-LMWP, single consumption of low molecular weight polyphenol; SMM, skeletal muscle mass.
Table 3.
Comparison of exercise performance and glucose level, blood pressure according to LMWP consumption (n=10).
Table 3.
Comparison of exercise performance and glucose level, blood pressure according to LMWP consumption (n=10).
| Variables | Placebo | S-LMWP | 5-LMWP | p value | ||||||
|---|---|---|---|---|---|---|---|---|---|---|
| VO2max (ml/kg/min) | 47.29 | ± | 1.39 | 47.85 | ± | 1.63 | 47.06 | ± | 1.41 | 0.273 |
| HRmax (bpm) | 190.80 | ± | 2.21ab | 189.30 | ± | 1.92b | 193.00 | ± | 1.61a | 0.006 |
| ET (sec) | 736.00 | ± | 12.49 | 741.50 | ± | 18.80 | 755.50 | ± | 16.37 | 0.085 |
| AT (sec) | 502.50 | ± | 19.99 | 508.00 | ± | 23.43 | 486.50 | ± | 21.20 | 0.132 |
| GL (kg) | 43.41 | ± | 1.25a | 41.21 | ± | 1.32b | 40.22 | ± | 0.88b | 0.003 |
| GR (kg) | 45.87 | ± | 1.93a | 43.77 | ± | 2.23b | 42.87 | ± | 2.13b | 0.061 |
| BMS (kg) | 152.45 | ± | 5.94 | 143.60 | ± | 6.26 | 146.00 | ± | 8.21 | 0.122 |
| Glucose (mg/dL) | 98.40 | ± | 1.07 | 99.80 | ± | 1.82 | 101.60 | ± | 1.31 | 0.256 |
| SBP (mmHg) | 129.10 | ± | 1.57a | 122.40 | ± | 3.21ab | 120.20 | ± | 2.47b | 0.014 |
| DBP (mmHg) | 80.50 | ± | 3.46a | 73.70 | ± | 2.24b | 73.40 | ± | 1.78b | 0.199 |
Data are presented as mean ± standard error (S.E.). Tested by Friedman test (non-parametric ANOVA). The same alphabets above the values indicate no significant difference from each other and were tested by Wilcoxon signed-rank test (non-parametric paired t-test). AT, Anaerobic threshold time; BMS, Back muscle strength; DBP, Diastolic Blood pressure; ET, Exercise time; GR, Right-hand grip strength; GL, Left-hand grip strength; HRmax, Maximal heart rate; 5-LMWP, 5-day consumption of low molecular weight polyphenol; S-LMWP, Single consumption of low molecular weight polyphenol; SBP, Systolic blood pressure; VO2max, Maximal oxygen consumption.
Table 4.
Comparison of heart rate changes indicating exercise performance according to LMWP consumption (n=10).
Table 4.
Comparison of heart rate changes indicating exercise performance according to LMWP consumption (n=10).
| Time | Placebo | S-LMWP | 5-LMWP | p0 | p1 | ||||||
|---|---|---|---|---|---|---|---|---|---|---|---|
| Exercise | <0.001 | 0.293 | |||||||||
| Before | 65.60 | ± | 2.57 | 62.70 | ± | 1.78 | 63.40 | ± | 1.63 | ||
| After | 191.30 | ± | 2.07 | 189.30 | ± | 1.92 | 192.00 | ± | 1.50 | ||
| Rest | |||||||||||
| 1 min | 116.30 | ± | 4.97b | 123.70 | ± | 1.97ab | 130.80 | ± | 3.97a | ||
| 2 min | 111.90 | ± | 4.57b | 117.10 | ± | 2.12ab | 120.50 | ± | 3.22a | ||
| 3 min | 108.90 | ± | 5.69 | 111.10 | ± | 1.68 | 115.00 | ± | 2.80 | ||
| 4 min | 113.40 | ± | 3.31 | 110.20 | ± | 2.16 | 115.70 | ± | 2.53 | ||
| 5 min | 110.60 | ± | 3.04ab | 107.00 | ± | 2.03b | 113.50 | ± | 1.95a | ||
| 30 min | 96.50 | ± | 3.84 | 96.10 | ± | 3.47 | 102.10 | ± | 2.61 | ||
Data are presented as mean ± standard error (S.E.). Tested by Wilks's lambda test (repeated measured ANOVA). p0: comparison of changes according to time, p1: treatment x group interaction. The same alphabets above the values indicate no significant difference from each other and were tested by Wilcoxon signed-rank test (non-parametric paired t-test). 5-LMWP, 5-day consumption of low molecular weight polyphenol; S-LMWP, single consumption of low molecular weight polyphenol.
Table 5.
Comparison of fatigue metabolism and oxidative stress related markers levels according to LMWP consumption (n=10).
Table 5.
Comparison of fatigue metabolism and oxidative stress related markers levels according to LMWP consumption (n=10).
| Variables | Placebo | S-LMWP | 5-LMWP | p0 | p1 | |||||||
|---|---|---|---|---|---|---|---|---|---|---|---|---|
| UA (mg/dL) | Before | 6.71 | ± | 0.27 | 6.57 | ± | 0.16 | 6.50 | ± | 0.23 | <0.001 | 0.089 |
| After | 6.56 | ± | 0.26 | 6.60 | ± | 0.19 | 6.56 | ± | 0.23 | |||
| Rest | 8.37 | ± | 0.34a | 7.85 | ± | 0.31b | 8.27 | ± | 0.33ab | |||
| CK (U/L) |
Before | 153.60 | ± | 18.41b | 203.00 | ± | 32.40a | 139.80 | ± | 11.70ab | <0.001 | 0.008 |
| After | 178.10 | ± | 21.66b | 238.40 | ± | 39.26a | 167.20 | ± | 14.73b | |||
| Rest | 163.20 | ± | 19.53b | 211.20 | ± | 33.77a | 152.40 | ± | 12.73ab | |||
| CK-MB (ng/dL) |
Before | 1.64 | ± | 0.20 | 1.48 | ± | 0.14 | 1.43 | ± | 0.16 | <0.001 | 0.139 |
| After | 1.89 | ± | 0.24 | 1.74 | ± | 0.17 | 1.71 | ± | 0.20 | |||
| Rest | 1.70 | ± | 0.20 | 1.57 | ± | 0.16 | 1.58 | ± | 0.17 | |||
| ox-LDL (mU/L) | Before | 35985.37 | ± | 2515.65 | 35152.11 | ± | 2672.22 | 34060.01 | ± | 3167.76 | <0.001 | 0.250 |
| After | 44276.02 | ± | 4940.21 | 42444.66 | ± | 2452.35 | 43410.29 | ± | 5461.12 | |||
| Rest | 40597.81 | ± | 4153.36 | 36440.74 | ± | 2478.22 | 40847.47 | ± | 4772.95 | |||
Data are presented as mean ± standard error (S.E.). Tested by Wilks's lambda test (repeated measured ANOVA). p0: comparison of changes according to time, p1: treatment x group interaction. The same alphabets above the values indicate no significant difference from each other and were tested by Wilcoxon signed-rank test (non-parametric paired t-test). After, immediately after the maximal exercise test; Before, before the maximal exercise test; CK, creatine Kinase; CK-MB, creatine kinase myocardial band; LDH, lactate dehydrogenase; 5-LMWP, 5-day consumption of low molecular weight polyphenol; ox-LDL, oxidized-LDL; Rest, 30-min rest after the exercise; S-LMWP, single consumption of low molecular weight polyphenol; UA, uric acid.
Disclaimer/Publisher’s Note: The statements, opinions and data contained in all publications are solely those of the individual author(s) and contributor(s) and not of MDPI and/or the editor(s). MDPI and/or the editor(s) disclaim responsibility for any injury to people or property resulting from any ideas, methods, instructions or products referred to in the content. |
© 2026 by the authors. Licensee MDPI, Basel, Switzerland. This article is an open access article distributed under the terms and conditions of the Creative Commons Attribution (CC BY) license.
Copyright: This open access article is published under a Creative Commons CC BY 4.0 license, which permit the free download, distribution, and reuse, provided that the author and preprint are cited in any reuse.


