
Submitted:
06 January 2026
Posted:
08 January 2026
You are already at the latest version
Abstract
The main objective of this study is to automatically detect real-time snow-related road-surface conditions utilizing existing webcams along interstate freeways. Blowing snow is considered one of the most critical road surface conditions, causing vertigo and adversely affecting vehicle performance. A comprehensive image reduction process was performed to extract two distinct reference datasets. The first dataset comprised two image categories: blowing snow and no blowing snow, while the second dataset consisted of five categories: blowing snow, dry, slushy, snow-patched, and snow-covered. Six pre-trained convolutional neural networks (CNN) were utilized for road-surface condition classification: AlexNet, SqueezeNet, ShuffleNet, ResNet18, GoogleNet, and ResNet50. In Dataset 1, it was concluded that AlexNet is a superior model with respect to training time and 97.56% overall detection accuracy. Regardless of differences in training time, ResNet50 achieved the highest overall accuracy of 97.88%, as well as the highest recall and F1-score. In Dataset 2, the ResNet18 model achieved an optimal overall detection accuracy of 96.10%, while the AlexNet model demonstrated the shortest training time and an overall detection accuracy of 95.88%.
In addition, a comprehensive comparison was conducted between pre-trained CNNs and traditional machine learning models, with the former displaying significantly superior detection performance. Analysis of the confusion matrices revealed that AlexNet performed the best in detecting blowing snow events. The proposed models could automatically provide real-time accurate and consistent surface condition information.
Keywords:
roadside webcams
; surface condition detection
; advanced traveler information system
; pre-trained convolutional neural networks
; AlexNet
; ResNet
1. Introduction
Blowing snow is a severe winter weather phenomenon that significantly degrades roadway visibility and driver perception, leading to increased crash risk and operational disruptions, particularly on rural and mountainous freeway corridors. Unlike active snowfall, blowing snow may occur under clear skies and persist after precipitation has ended, which complicates detection and response strategies. Prior studies have shown that adverse roadway and environmental conditions can substantially influence crash occurrence and severity, underscoring the importance of timely identification of hazardous surface conditions during winter operations (Sharafeldin et al., 2022a, 2022b).
Existing approaches for detecting blowing snow have primarily relied on meteorological observations, remote sensing products, or specialized ground-based instruments. These methods often depend on wind speed thresholds, atmospheric measurements, or data fusion frameworks to infer the presence of blowing snow events. While such approaches have demonstrated effectiveness in specific regions or controlled settings, they face notable limitations when applied to large-scale roadway networks. In particular, spatial coverage constraints, installation and maintenance costs, and sensitivity to local climatic variability reduce their practicality for continuous monitoring of remote freeway segments. Recent studies employing machine learning techniques based on meteorological and instrument-derived data have reported promising detection performance; however, challenges remain in capturing localized blowing snow events and achieving scalable deployment across diverse roadway environments (Xie et al., 2021; Ye et al., 2022).
In parallel with these developments, transportation agencies have increasingly deployed roadside webcams as part of Road Weather Information Systems (RWIS) and Advanced Traveler Information Systems (ATIS). These cameras provide continuous visual coverage of roadway conditions and are already installed along many critical freight and commuter corridors. However, the interpretation of webcam imagery remains largely manual, relying on traffic management center (TMC) operators to visually inspect images, which is labor-intensive and subject to human error. Automated image-based detection of blowing snow using existing webcam infrastructure therefore represents a cost-effective and scalable solution.
Recent advances in deep learning, particularly convolutional neural networks (CNNs), have demonstrated strong performance in image classification tasks across a wide range of transportation and weather-related applications. Unlike traditional machine learning methods that depend on manually engineered image features, CNNs can automatically learn hierarchical visual patterns directly from raw imagery, making them well-suited for complex visual phenomena such as blowing snow. Despite this potential, limited research has explored deep learning-based detection of blowing snow events using roadside camera imagery, especially under diverse surface and weather conditions.
Within the transportation domain, prior research has shown that convolutional neural networks applied to roadside webcam imagery can effectively identify weather and surface conditions, highlighting their potential for operational deployment (Khan and Ahmed, 2021). However, limited research has specifically focused on deep learning-based detection of blowing snow events using roadway camera images under diverse winter surface conditions.
This study addresses this gap by developing an automated framework for detecting blowing snow and related road surface conditions using images extracted from existing roadside webcams along Interstate 80 (I-80) in Wyoming. Six pre-trained convolutional neural network architectures, including AlexNet, SqueezeNet, ShuffleNet, ResNet18, GoogleNet, and ResNet50, are evaluated using transfer learning on two curated image datasets. The first dataset focuses on binary classification of blowing snow versus non-blowing snow conditions, while the second dataset extends the analysis to five surface condition categories, including blowing snow, dry, slushy, snow-covered, and snow-patched surfaces. In addition, the performance of deep learning models is systematically compared against traditional machine learning approaches to assess relative detection capability.
The primary contributions of this research are as follows:
- Development of two large-scale, manually annotated road surface condition datasets derived from roadside webcam imagery, including blowing snow events.
- Comprehensive evaluation of six pre-trained CNN models for real-time detection of blowing snow and other winter surface conditions.
- Quantitative comparison between deep learning-based approaches and traditional machine learning models using identical image data.
- Demonstration of a scalable and cost-effective framework that can be integrated into existing RWIS and ATIS platforms to support operational decision-making.
The remainder of this paper is organized as follows. Section 2 presents the background and related work on image-based road weather detection and deep learning methods. Section 3 describes the proposed methodology and data preparation process. Section 4 presents the experimental results and performance evaluation. Section 5 discusses the findings and practical implications, and Section 6 concludes the study with recommendations for future research.
2. Background
Blowing snow is a complex winter weather phenomenon that presents significant challenges for roadway monitoring and operations, particularly in rural and mountainous regions. It occurs when strong winds lift loose snow particles from the ground and transport them across the roadway, often reducing visibility to near whiteout conditions while simultaneously altering surface friction. Unlike active snowfall, blowing snow may persist long after precipitation has ceased and can develop rapidly under favorable wind and temperature conditions, making timely detection difficult using conventional weather monitoring techniques.
Early efforts to characterize blowing snow focused on understanding its physical properties through field observations and atmospheric measurements. Ground-based studies examined particle size, vertical and horizontal distribution, and transport mechanisms using in situ instruments, providing valuable insight into the dynamics of blowing snow events (Mann et al., 2000; Nishimura and Nemoto, 2005). Optical and photoelectric sensors were later used to detect snowfall and blowing snow occurrence under controlled conditions, improving understanding of event frequency and intensity at specific locations (Naaim-Bouvet et al., 2014).
To extend spatial coverage, recent studies have applied satellite and ground-based remote sensing techniques to detect and characterize blowing snow. Satellite lidar observations have been used to estimate blowing snow occurrence and vertical structure in polar regions, providing large-scale insights into event frequency and layering (Loeb & Kennedy, 2023; Robinson et al., 2025). However, satellite methods remain limited near the surface due to cloud cover and optical depth effects. To overcome these limitations, ground-based instruments such as ceilometers and combined lidar–radar systems have been increasingly employed to detect blowing snow under cloudy and precipitating conditions (Ye et al., 2022). In particular, ceilometer-based approaches have demonstrated effective identification of blowing snow layers and improved near-surface detection compared to spaceborne systems (Gossart et al., 2017).
Several studies have attempted to infer blowing snow occurrence using meteorological thresholds based on wind speed, temperature, and humidity. Threshold-based formulations estimate the initiation of snow transport from surface and atmospheric conditions, offering a simplified means of detection (He and Ohara, 2017). While these approaches provide practical insight, their effectiveness is highly sensitive to local terrain, snow characteristics, and climatic variability. As a result, threshold values often require site-specific calibration and may fail to capture localized or transient blowing snow events. Overall, existing blowing snow detection methods provide valuable physical understanding but remain limited in scalability and practicality for continuous, real-time monitoring across large rural roadway networks.
To address these limitations, recent studies have explored data-driven and machine learning approaches for detecting blowing snow events. These methods typically rely on supervised learning models trained using meteorological observations, instrument-derived measurements, or a combination of both. Decision tree and ensemble-based models have been among the most commonly applied techniques. For example, (Xie et al., 2021) developed a decision tree model using meteorological parameters such as wind speed, temperature, humidity, and snow depth, demonstrating improved detection performance compared to fixed threshold methods. However, the study also reported sensitivity to site-specific conditions and limited capability in reproducing the high frequency of localized blowing snow events. More recent work incorporated advanced machine learning algorithms with specialized sensing instruments. (Ye et al., 2022) proposed an AdaBoost-based framework integrating ceilometer observations with surface meteorological data to distinguish between blowing snow and fog events. Although high classification accuracy was achieved, reliance on instrument-based inputs and carefully curated features limited scalability and applicability across roadway segments lacking such infrastructure. Consequently, despite improvements over threshold-based methods, machine learning approaches remain constrained by non-visual data dependencies and site-specific calibration requirements.
In parallel with these developments, advances in deep learning have enabled new opportunities for image-based road weather and surface condition detection. Deep learning models learn hierarchical representations directly from raw data through multiple nonlinear processing layers, eliminating the need for manually engineered features. This capability is particularly advantageous for image-based applications, where visual patterns are complex and difficult to describe using handcrafted descriptors. As training data volume increases, deep learning models generally continue to improve in performance, whereas traditional machine learning approaches often reach a performance plateau (Malik, 2020). The effectiveness of deep learning methods depends on factors such as dataset size, task complexity, desired accuracy, and available computational resources. When sufficient data and parallel computing resources are available, deep learning provides a robust and scalable framework for visual pattern recognition tasks.
Among deep learning architectures, CNNs have emerged as the dominant approach for image classification and visual recognition. By exploiting the spatial structure of images through convolutional filtering at multiple resolutions, convolutional neural networks can extract low-level features such as edges and textures as well as higher-level semantic patterns. These characteristics have resulted in strong performance across a wide range of computer vision applications, including object recognition, scene understanding, and facial recognition (Lawrence et al., 1997; Pinheiro and Collobert, 2014; Szegedy et al., 2015).. In transportation applications, convolutional neural networks have been shown to outperform traditional machine learning approaches when analyzing roadway imagery under visually complex conditions, making them well suited for detecting subtle surface and atmospheric patterns associated with adverse winter weather (Ballester and Araujo, 2016).
Training convolutional neural networks from scratch typically requires extensive labeled data, careful network design, and substantial computational resources. To mitigate these requirements, transfer learning has become a widely adopted strategy for image-based classification tasks. Transfer learning involves fine-tuning networks that have been pre-trained on large and diverse image datasets, allowing learned visual representations to be reused for related applications. Most pre-trained convolutional neural networks are trained on the ImageNet Large Scale Visual Recognition Challenge (ILSVRC) dataset, which contains more than one million labeled images across one thousand object categories (Russakovsky et al., 2015). Networks trained on such datasets learn general-purpose visual features that can be effectively transferred to domain-specific problems, including road weather and surface condition detection. Because pre-trained architectures vary in depth, parameter count, inference speed, and accuracy, selecting an appropriate model requires balancing detection performance against computational efficiency, particularly for real-time applications.
Within the transportation domain, prior studies have demonstrated the feasibility of image-based weather and surface condition detection using roadway imagery. (Khan and Ahmed, 2019) investigated snow detection using in-vehicle video data and texture-based image features combined with traditional machine learning classifiers. Building on this work, (Khan and Ahmed, 2021) applied pre-trained convolutional neural networks to roadside webcam imagery for classifying weather and surface conditions, while (Khan et al., 2021) extended this research through a multilevel image-based detection framework that improved classification accuracy across multiple weather categories. Although these studies highlight the potential of vision-based approaches for roadway weather monitoring, they did not explicitly focus on detecting blowing snow events or systematically evaluate multiple deep learning architectures under diverse winter surface conditions.
Given the widespread deployment of roadside webcams along rural and mountainous freeway corridors and the operational need for scalable, real-time monitoring solutions, a focused investigation into image-based deep learning approaches for blowing snow detection is warranted. Motivated by these gaps, this study develops and evaluates a deep learning-based framework for detecting blowing snow and related road surface conditions using roadside webcam imagery. By systematically comparing multiple pre-trained convolutional neural network architectures and benchmarking their performance against traditional machine learning models, this research seeks to advance automated road weather monitoring and support more effective winter roadway management.
3. Methodology
The research methodology integrates image acquisition, quality control, manual annotation, dataset construction, and model training through transfer learning within a unified processing pipeline. Six pre-trained convolutional neural network architectures, namely AlexNet, SqueezeNet, ShuffleNet, ResNet18, GoogleNet, and ResNet50, are employed to evaluate detection performance across binary and multi-class classification tasks. The following subsections describe each methodological component in detail. Figure 1 illustrates the overall workflow of the proposed image-based framework for detecting blowing snow and road surface conditions using roadside webcam imagery.
3.1. Roadside Webcam Image Acquisition
Roadside webcam images were collected from the Wyoming Department of Transportation (WYDOT) along I-80, a major rural and mountainous freeway corridor that is frequently affected by severe winter weather conditions. A total of 55 webcam locations were selected for this study, as shown in Figure 2. Each equipped with multiple cameras capturing roadway views in different directions, including westbound, eastbound, and close-up views of the road surface. Images were captured at a temporal resolution of one image every five minutes.
The data collection period spanned four months from February to May 2019, covering peak winter and early spring conditions when blowing snow events are most likely to occur. Only images that provided a clear view of the road surface were retained for further analysis, while general roadway overview images were excluded. Approximately 6 million road surface images were extracted as the raw data for the study, while images providing a general view were omitted. Historical weather data of Wyoming from the National Climatic Data Center (NCDC) were utilized to facilitate the manual annotation process.
3.2. Image Filtering and Quality Control
To ensure the reliability of the training data, an extensive image filtering and quality control process was conducted prior to annotation. Images affected by inadequate lighting conditions, including completely dark or severely underexposed frames, were removed. Corrupted images resulting from camera malfunctions and images captured when camera lenses were obstructed by snow or ice were also excluded. In addition, images that were out of focus or did not clearly represent road surface conditions were discarded.
This filtering process substantially reduced the raw dataset to a subset of high-quality images suitable for manual annotation and model training. The objective of this step was to eliminate noise and artifacts that could adversely affect model learning and evaluation.
3.3. Manual Image Annotation and Validation
Following image filtering and quality control, the remaining images were manually annotated to establish reliable ground truth labels for model training and evaluation. Annotation was performed by trained reviewers using predefined criteria based on visible roadway and atmospheric conditions, as illustrated in Table 1. To reduce subjectivity and labeling errors, all annotated images were independently reviewed and validated by a second group of reviewers prior to inclusion in the final datasets.
3.4. Datasets Construction
Two annotated datasets were constructed to support different classification objectives. Dataset 1 was developed for binary classification and consisted of two categories, blowing snow and no blowing snow. A detailed investigation considering the climatic region of the roadway (e.g., Wyoming falls within a dry-freeze region) was conducted to determine the most frequent surface conditions in this region. Based on this investigation, Dataset 2 was designed for multi-class classification and included five road surface condition categories, namely blowing snow, dry, slushy, snow-covered, and snow-patched.
To ensure balanced learning and fair model comparison, each class within a dataset contained an equal number of images, i.e., four thousand images. Therefore, the total number of images for Datasets 1 and 2 are eight and twenty thousand, respectively. Images were randomly sampled across different camera locations, times of day, and weather conditions to reduce spatial and temporal bias. The resulting datasets provided a representative and balanced foundation for subsequent deep learning model training and performance evaluation. Figure 3 illustrates representative images for each classification category.
3.5. CNN Model Selection, Image Preprocessing and Resizing
3.5.1. Models Selection
To evaluate the suitability of different deep learning architectures for detecting blowing snow and road surface conditions, several pre-trained convolutional neural network models were selected based on their established performance, architectural diversity, and computational efficiency.
AlexNet
AlexNet was introduced by Krizhevsky et al. (2012) and represented a major breakthrough in deep convolutional neural networks by significantly outperforming earlier architectures such as LeNet (Krizhevsky et al., 2012). The model achieved first place in the ImageNet Large Scale Visual Recognition Challenge in 2012, demonstrating the effectiveness of deep CNNs for large-scale image recognition ((Krizhevsky et al., 2017). AlexNet consists of multiple convolutional layers followed by fully connected layers and incorporates techniques such as local response normalization and dropout to improve generalization (Alom et al., 2018).
SqueezeNet
SqueezeNet was proposed by Iandola et al. (2016) with the objective of achieving AlexNet-level accuracy while drastically reducing model size and parameter count (Iandola et al., 2016). This was accomplished through architectural strategies such as replacing 3 × 3 filters with 1 × 1 filters, reducing input channels using squeeze layers, and increasing activation map depth. As a result, SqueezeNet achieved comparable accuracy to AlexNet with approximately fifty times fewer parameters, making it suitable for resource-constrained applications.
1.1.1.1. ShuffleNet
While many high-performing CNN architectures rely on increased depth and width, such designs often require substantial computational resources (Szegedy et al., 2015; Szegedy et al., 2016; Xie et al., 2017; Shafiq et al., 2022). ShuffleNet was introduced by Zhang et al. (2018) to achieve competitive accuracy with limited computational cost through grouped convolutions, channel shuffle operations, and specialized ShuffleNet units (Zhang et al., 2018). The model demonstrated improved efficiency and accuracy compared to MobileNet at similar computational complexity and achieved significant speedup relative to AlexNet (Howard et al., 2017; Krizhevsky et al., 2017).
1.1.1.1. ResNets
Residual Networks were introduced by He et al. (2016) to address the degradation problem encountered when training very deep neural networks (He et al., 2016). By reformulating layers to learn residual functions with respect to their inputs, residual learning enables more effective optimization of deep architectures (Shafiq et al., 2022). Residual networks demonstrated strong performance on the ImageNet dataset, achieving higher accuracy than plain networks with similar complexity and winning the ILSVRC 2015 classification task while maintaining lower computational complexity than earlier architectures such as VGG networks (Simonyan and Zisserman, 2014; Russakovsky et al., 2015; Shafiq et al., 2022).
1.1.1.1. GoogleNet
GoogleNet, also known as the Inception architecture, was introduced by Szegedy et al. (2015) and achieved state-of-the-art performance in the ImageNet Large Scale Visual Recognition Challenge 2014 (Szegedy et al., 2015). Its core innovation is the Inception module, which performs parallel convolutions at multiple spatial scales and concatenates the resulting feature maps, enabling efficient use of computational resources. Compared to sequential architectures such as AlexNet, this design improves representational capacity while maintaining computational efficiency (Ballester and Araujo, 2016).
Image Preprocessing and Resizing
Prior to deep learning model training, the annotated images were preprocessed to ensure consistency and compatibility with the input requirements of the selected convolutional neural network architectures. Preprocessing focused on emphasizing the road surface region while reducing background variability and irrelevant visual information.
Each image was cropped to highlight the roadway surface area captured by the webcam, minimizing the influence of surrounding features such as sky, roadside objects, and infrastructure elements. The cropped images were then resized to fixed spatial resolutions of 224 × 224 pixels and 227 × 227 pixels, depending on the input specifications of each convolutional neural network. Table 2 displays the depth and required resolution for running each model. The depth of a network refers to the largest number of fully connected layers on a path from the input layer to the output layer. Whereas, these resolutions correspond to the standard input dimensions required by the evaluated pre-trained models.
This preprocessing step ensured uniform image dimensions across datasets and facilitated efficient training and evaluation of multiple deep learning architectures using a standardized input format.
3.6. Model Training and Transfer Learning
Following image preprocessing and resizing, transfer learning was employed to train and evaluate the CNN models for detecting blowing snow and road surface conditions. All experiments were implemented using MATLAB R2022a, which was used to train and evaluate the six pre-trained CNN architectures. For each dataset, images were randomly divided into training and testing subsets, with 80 percent of the images allocated for training and parameter tuning and the remaining 20 percent reserved for testing. The number of images used in each subset is reported in the Results section.
SqueezeNet was initially selected for preliminary training on Dataset 1 due to its reputation as one of the fastest convolutional neural networks with competitive classification accuracy. This initial analysis was conducted to assess dataset suitability and identify effective transfer learning configurations. Based on the resulting training behavior and performance trends, all six pre-trained convolutional neural network architectures were subsequently trained and evaluated on both Dataset 1 and Dataset 2 using identical transfer learning procedures to ensure fair comparison.
To optimize the performance of the pre-trained CNN models, the parameters and training options were updated and fine-tuned through careful observation of the training progress. After multiple trials, the best set of parameters was determined to be as follows: Optimizer = Stochastic Gradient Descent with Momentum (SGDM), initial learning rate = 0.001, learning rate drop factor = 0.1, learning rate drop period = 8, max epoch = 7, mini-batch size = 300.
It is noteworthy that the computational requirements of this study were carried out on an ELITEBOOK equipped with an Intel® Core (TM) i7-10510U CPU @ 1.80 GHz 2.30 GHz processor, 16 GB of memory, and a 64-bit Windows 10® operating system.
Following training, model outputs were extracted and systematically compared to determine the most effective convolutional neural network architecture for blowing snow and road surface condition detection. Performance evaluation focused on classification accuracy and complementary metrics described in the subsequent section.
3.7. Performance Indices
Five performance indices were selected for evaluating the models, including Recall (Sensitivity), Specificity, Precision, F1-score, and Testing accuracy. These indices are commonly used in the evaluation of learning algorithms and have been widely utilized in related research works (Ardakani et al., 2020; Maeda-Gutiérrez et al., 2020; Osman et al., 2019). The representing formulas for these indices are presented as follows:
where TP, TN, FP, and FN refer to true positive, true negative, false positive, and false positive values for image classifications, respectively.
4. Results and Discussion
4.1. Performance Evaluation of the Detection Models
4.1.1. Dataset 1
The analysis of Dataset 1 utilized the six selected pre-trained CNN, as outlined in Table 1. The holdout procedure was applied, with 80% of the data (6,400 images, split evenly between blowing snow and no blowing snow categories) used for training the networks, and the remaining 20% (1,600 images, equally distributed between categories) used for testing. The results were then extracted and presented in Table 3.
ResNet50 emerged with the highest overall testing accuracy of 97.88%. However, AlexNet stood out as the best model in terms of achieving acceptable results within a relatively short training time, achieving a validation accuracy of 97.50% in approximately 32 minutes.
Upon detailed comparison, ResNet50 consistently outperformed AlexNet across all performance indices. Despite its longer training time, ResNet50 proved to be the most superior network for the classification and identification process of Dataset 1.
ResNet18 surpassed GoogleNet in recall, F1-score, overall testing accuracy, and required less training time, achieving values of 97.35%, 96.86%, 96.88%, and approximately 203 minutes, respectively. However, the ShuffleNet model yielded the poorest performance evaluation results and had the second highest training time after ResNet50. Additionally, relative training time analysis was conducted by calculating the ratio of other pre-trained models to the model with the least training time, providing insights into the proportion of time consumption across different models on any operating system.
As discussed in the previous section, AlexNet and ResNet50 outperformed other models in terms of training time and overall detection accuracy, respectively. Therefore, for brevity, the training progress and confusion matrix are reported only for these two models.
The progress of the training process for AlexNet and ResNet50 is illustrated in Figure 3. Both networks started training with a validation accuracy of approximately 55% for AlexNet and 58% for ResNet50. By the end of the first epoch, AlexNet's training accuracy reached approximately 88%, while ResNet50 achieved a significantly higher accuracy of over 90%. Both training curves showed gradual improvement throughout the epochs, although ResNet50's curve displayed a smoother gradient starting from the third epoch.
It was observed that the training curve for AlexNet closely mirrored the validation curve from the middle of the third epoch, while ResNet50 consistently outperformed the validation curve. At the conclusion of the validation process, ResNet50 demonstrated better performance. The overall validation accuracy for AlexNet was 97.50%, slightly higher than ResNet50, which achieved a value of 97.27%.
The output confusion matrices of the tested images for AlexNet and ResNet50 models are shown in Figure 4. The number of correct classifications for each image group is highlighted in blue along the diagonal. For AlexNet, it is evident that both accuracies in the classification of blowing snow and no-blowing snow are nearly equal, with the model predicting 780 out of 800 images correctly for blowing snow and 781 out of 800 images correctly for no-blowing snow.
In contrast, ResNet50 achieved higher accuracy, correctly classifying 784 out of 800 images for blowing snow events and 782 out of 800 images for no-blowing snow events. These results demonstrate the superior ability of the ResNet50 model to detect blowing snow conditions.
4.1.2. Dataset 2
Similarly, the analysis of Dataset 2 was conducted, with 80% of the data used to train the networks (a total of 16,000 images, with 3,200 images in each category), and the remaining 20% of the data (a total of 4,000 images, with 800 images in each category) used for testing purposes. Table 5 presents the results of the analysis for Dataset 2.
Since the main goal of this study was to select the best model capable of providing real-time classification for blowing snow events efficiently, the comparison between networks was based on the overall testing accuracy, performance indices for blowing snow images, and training time. It was deduced that ResNet18 achieved the best overall accuracy and the best performance indices in the blowing snow category classification, with slightly higher results compared to ResNet50, which outperformed only in the recall of blowing snow with a percentage of 95%.
In terms of training time, AlexNet achieved decent results, holding second place in the least training time after SqueezeNet. However, while SqueezeNet had the minimum training time, it attained the poorest results for all other comparison metrics between models.
The progress of the training process for AlexNet and ResNet18 is depicted in Figure 5. Initially, the validation percentages were approximately 20% for AlexNet and 18% for ResNet18. Both training curves saw a significant jump after the first epoch, with AlexNet reaching approximately 85% and ResNet18 reaching 90%. Subsequently, both curves showed a gradual increase in grade until the end of the seventh epoch. Ultimately, at the conclusion of the seventh epoch, ResNet18 demonstrated optimal performance. The overall validation accuracy for AlexNet was 96.44%, slightly higher than ResNet18, which achieved a value of 96.10%.
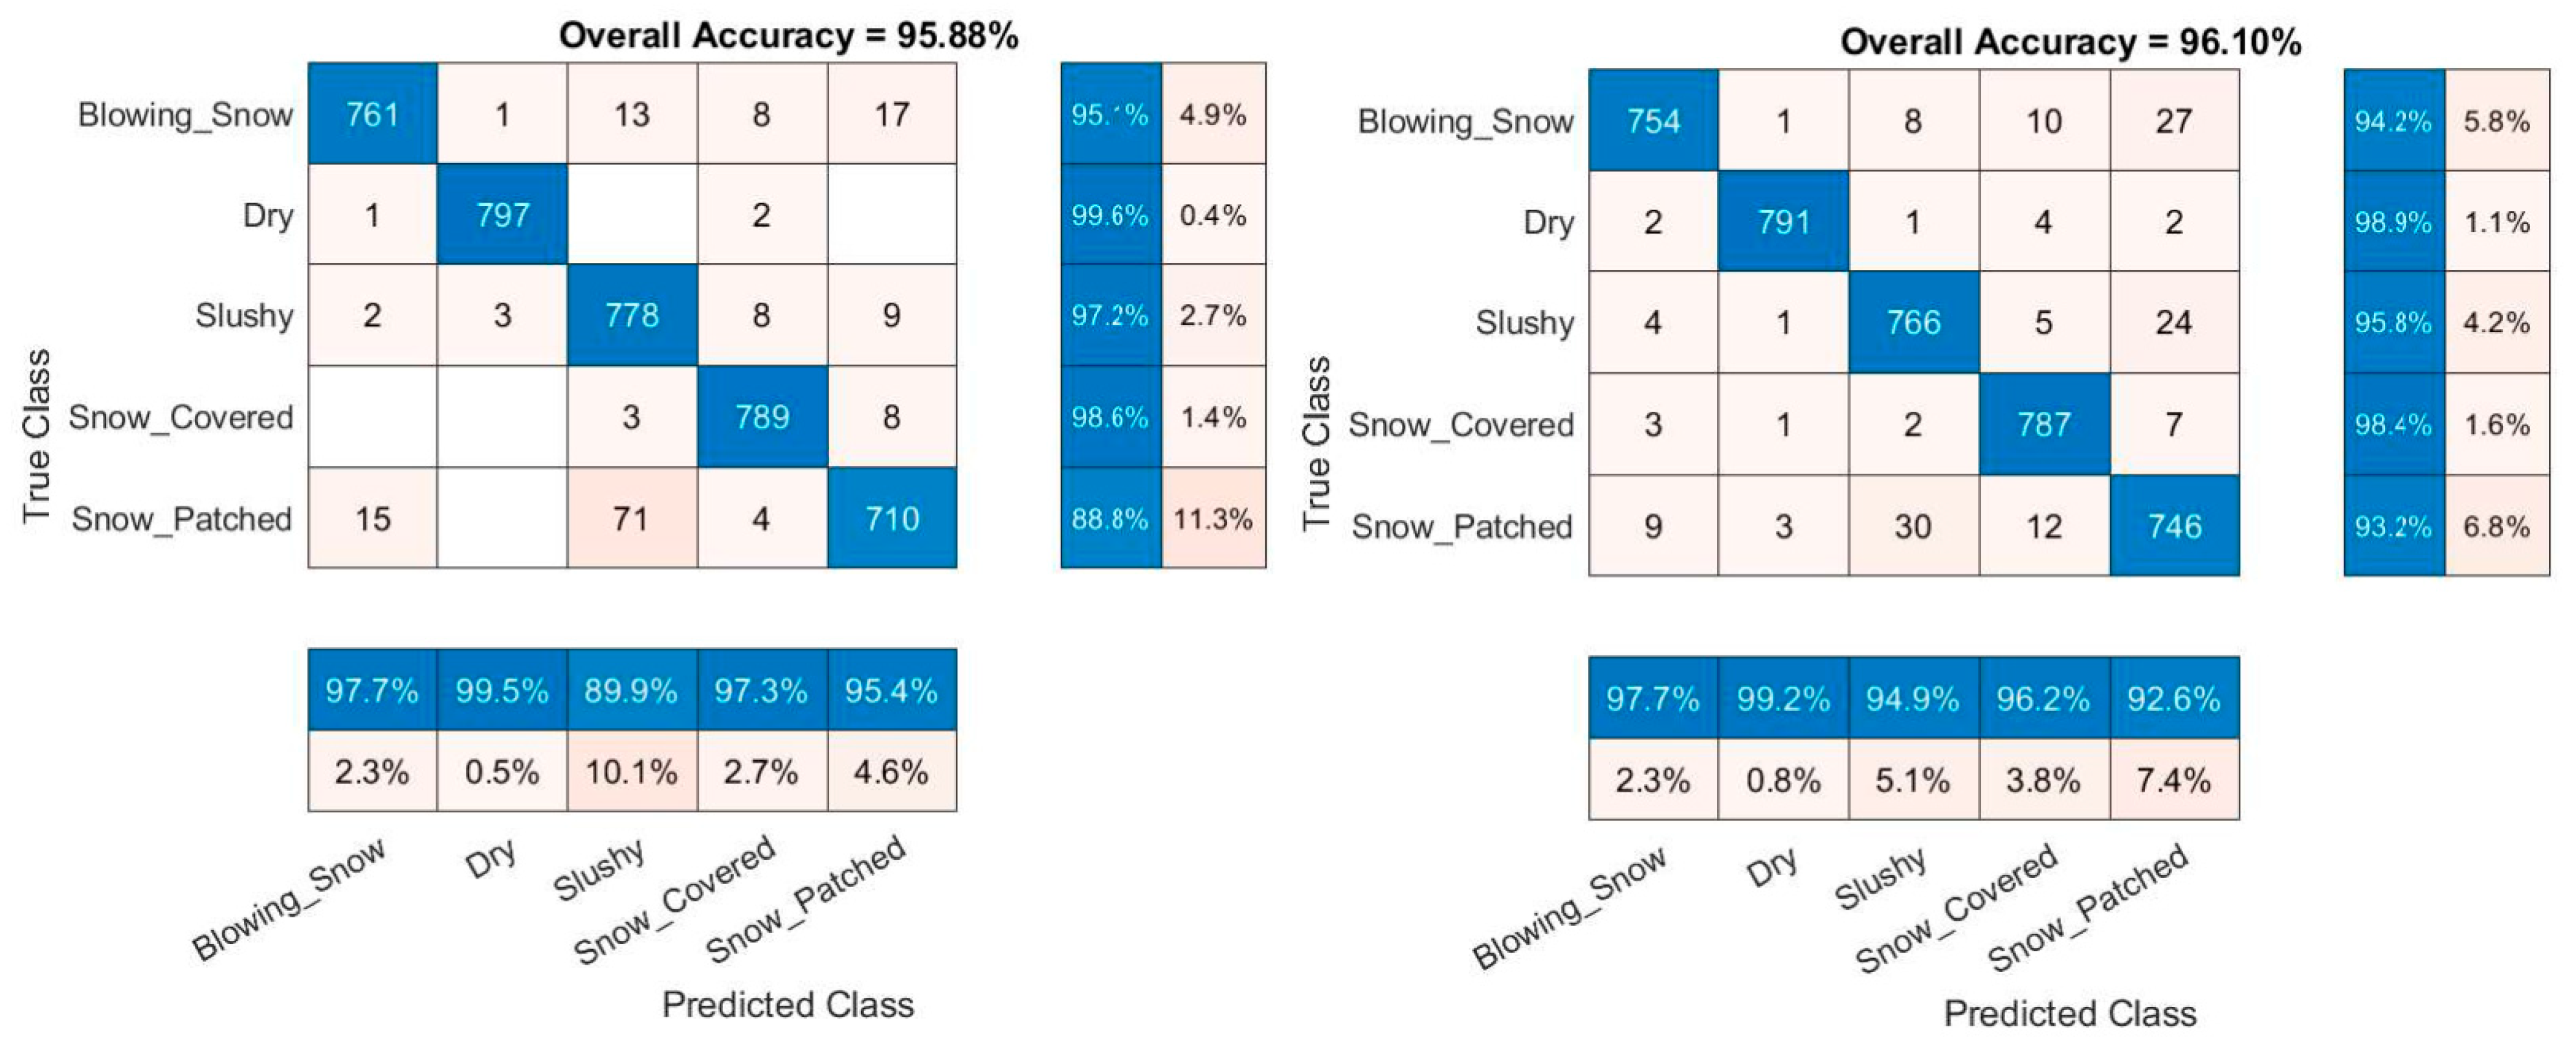
Figure 6 illustrates the confusion matrices of the tested images for AlexNet and ResNet18 models. Interestingly, AlexNet correctly classified 761 out of 800 images for blowing snow events, outperforming ResNet18, which correctly classified 754 out of 800 images. This indicates that AlexNet is the superior model for identifying blowing snow events.
Figure 6.
Training progress of surface detection networks, a) AlexNet, b) ResNet18 (Dataset 2).
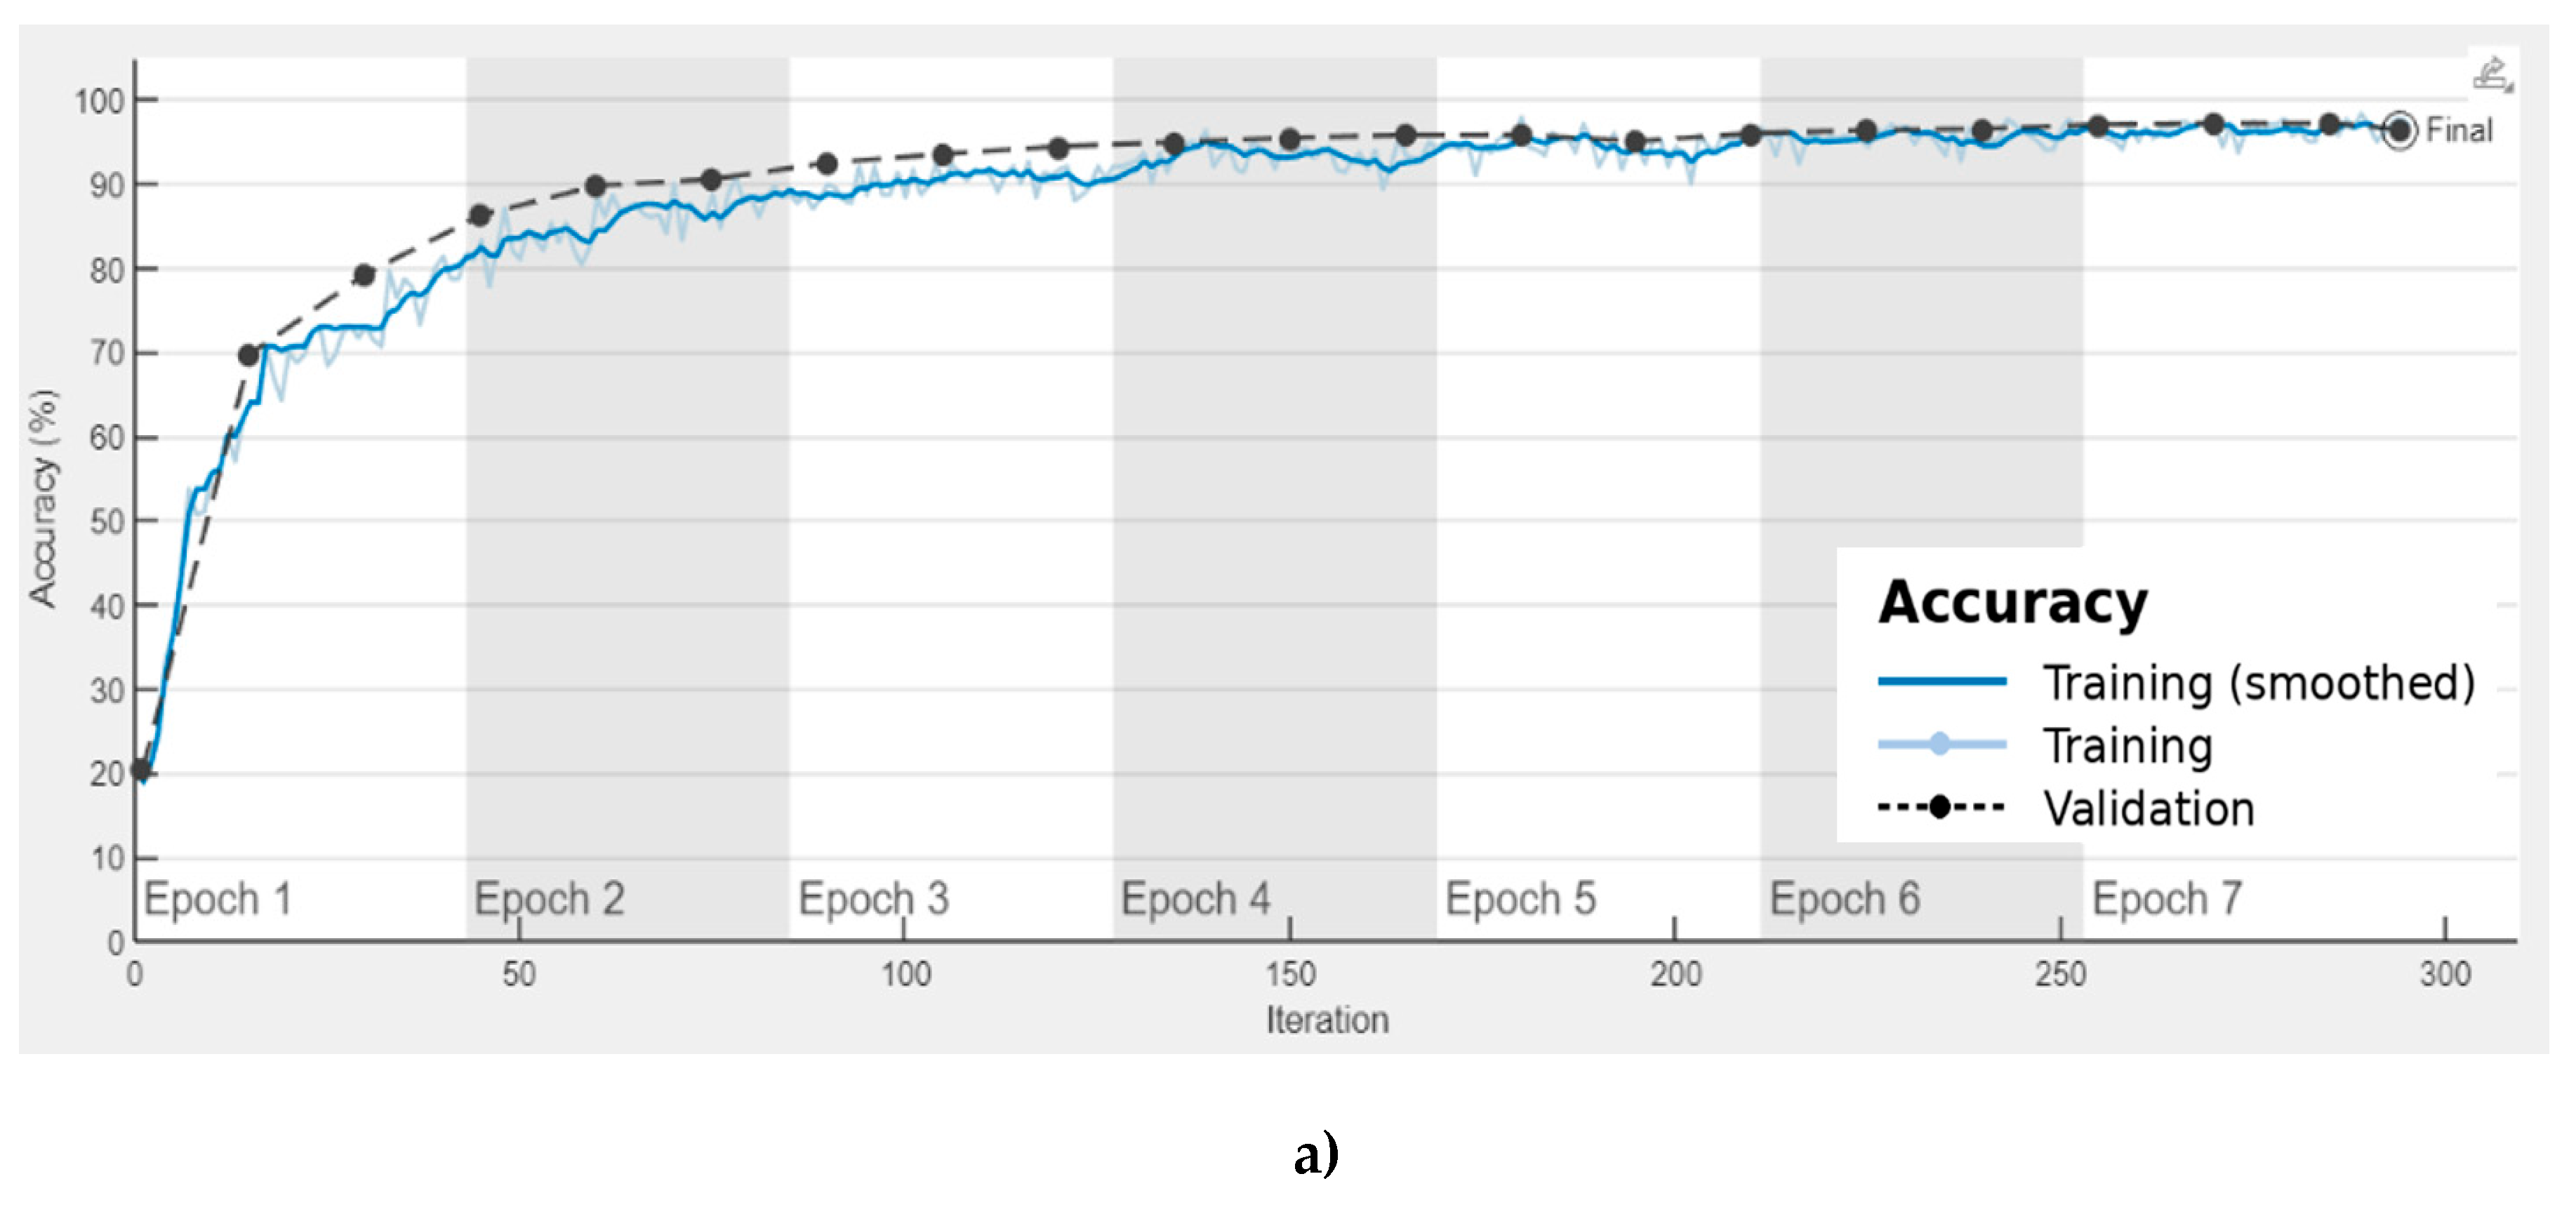
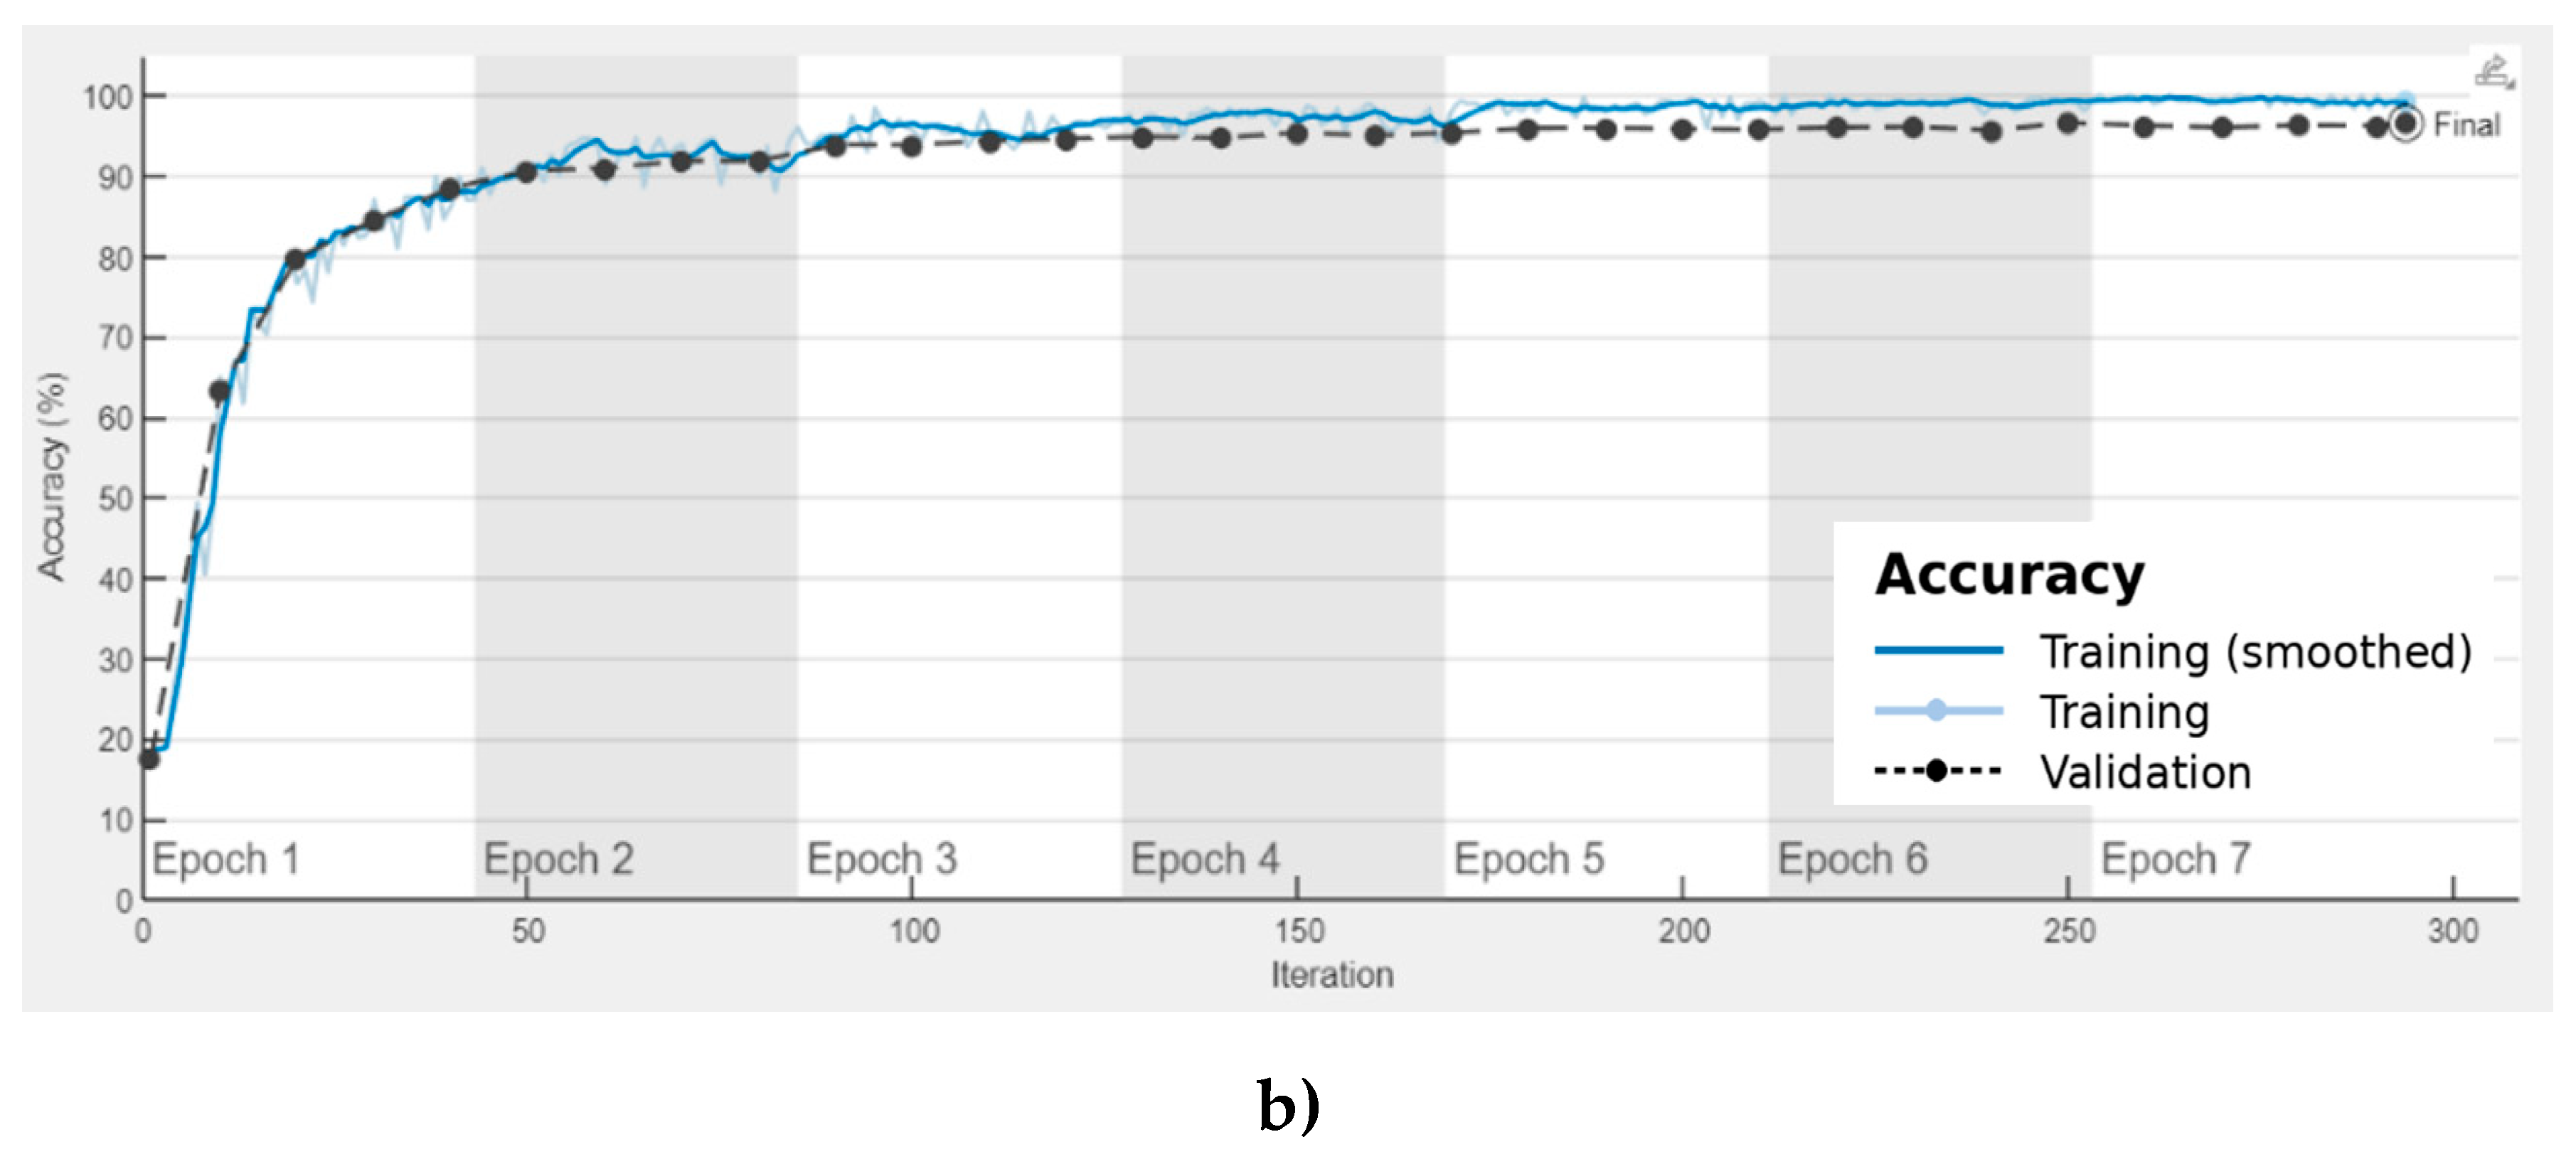
Figure 7.
Confusion matrices of the pre-trained models a) AlexNet, b) ResNet18 (Dataset 2).
4.2. Detection Performance Comparison of Deep CNN with Machine Learning Models
To evaluate the effectiveness of the proposed deep learning architectures compared to traditional machine learning models, six models were comprehensively evaluated using identical image datasets. These models included the Classification And Regression Tree (CART), K-Nearest Neighbors (K-NN), Support Vector Machine (SVM), Random Forest (RF), XGBoost, Gradient Boosting (GB), and Naïve Bayes (NB) models.
Traditional machine learning techniques require the extraction of image features for model training. In this study, a widely accepted and successful feature extraction method known as Local Binary Pattern (LBP) was employed. The LBP approach compares each pixel of an image to its neighboring pixels, thus expressing the local variation of image texture (Ojala et al., 1996).
The LBP method determines texture variations by computing the similarity of each pixel with its neighboring pixels. Initially, the LBP descriptor size was fixed to a 3×3 window for extracting texture variations. However, in this study, a modified version of LBP with two parameters was utilized. The first parameter denotes the number of pixels around the center pixel, while the second parameter denotes the radius of the circle around the center pixel (Ojala et al., 2002). The LBP features can be defined using the following equations.
where P represents the number of pixels, R indicates the radius, and and are the gray-level intensity of surrounding and center pixels, respectively. The number of pixels around the center pixel was set to eight (), while a radius of one () was selected, following the approach of a prior study (Khan and Ahmed, 2019). This approach resulted in the extraction of 59 features in total. The traditional machine learning models were then trained, validated, tested, and their performance was compared to that of the pre-trained deep learning models using the extracted image features. The evaluation demonstrated that the pre-trained deep learning models outperformed the traditional machine learning models in various performance metrics, including accuracy, precision, recall, specificity, and F-1 score.
Regarding Dataset 1, the machine learning model that demonstrated the highest overall accuracy in detecting blowing snow was the RF model, achieving an accuracy rate of 89.69%, as outlined in Table 5. This model also exhibited a recall rate of 92.05%, a specificity rate of 87.52%, a precision rate of 87.16%, and an F1-score rate of 89.54%. The KNN, SVM, and XGBoost models also demonstrated impressive detection performance, achieving accuracy rates of over 87%. However, none of the traditional machine learning models surpassed the detection performance of the pre-trained deep CNN model. Specifically, ResNet18 demonstrated the highest overall accuracy rate of 97.88% in detecting blowing snow, which is substantially higher than the accuracy rates achieved by the traditional models. These results underscore the superiority of Deep CNN over machine learning models in detecting blowing snow.
In Table 6, a comparison of the detection performance between deep CNN and traditional machine learning models is presented for Dataset 2, encompassing five categories: Blowing Snow, Dry, Slushy, Snow Covered, and Snow Patched. The results for this dataset mirrored those observed for Dataset 1. The RF model exhibited the highest detection accuracy, achieving a rate of 86.45%. Additionally, the KNN, SVM, and XGBoost models performed commendably, achieving overall detection rates exceeding 80%. However, the CART, GB, and NB models struggled in detecting blowing snow. Nonetheless, none of the traditional machine learning models outperformed the deep CNN model in terms of detection accuracy, as demonstrated in Table 6. The ResNet18 model achieved the highest detection accuracy rate for Dataset 2 at 96.10%, markedly surpassing the rates attained by traditional machine learning models.
4.3. Development for Surface Condition Detection Software
To enable practical deployment of the proposed deep learning-based weather detection framework, a software application was developed to operationalize the trained convolutional neural network models and support real-time processing of roadside webcam imagery. The software integrates multiple pre-trained neural network architectures, including AlexNet, ResNet18, ShuffleNet, GoogleNet, and ResNet50, which were selected based on their demonstrated performance and complementary object recognition capabilities. While AlexNet, ResNet18, and ShuffleNet exhibited superior detection performance, GoogleNet and ResNet50 were retained as alternative models to enhance robustness under visually complex or challenging conditions.
The software was implemented using the MATLAB platform and incorporates the complete processing pipeline of the proposed framework, including image acquisition, preprocessing, model inference, and result visualization. The application enables simultaneous processing and display of multiple roadway images, allowing users to assess weather and road surface conditions across several locations concurrently rather than on an image-by-image basis. This capability is particularly important for operational environments where rapid situational awareness across large roadway networks is required.
To support real-time operation, the software integrates direct access to officially provided Wyoming Department of Transportation roadside webcam feeds. Users can select camera locations from predefined lists and automatically retrieve the most recent images for analysis. The system supports periodic automated updates at fixed time intervals, enabling near real-time weather detection without continuous user intervention. Manual refresh options are also available to allow on-demand analysis when required.
The software architecture and operational workflow build upon a previously developed automated weather detection system for the Wyoming Department of Transportation, which documented the integration of roadside webcams, deep learning-based classification, and user-oriented visualization for real-time roadway weather monitoring (Ahmed et al., 2023). The graphical interface layout, control elements, and operational features are illustrated in Figure 8, with detailed implementation descriptions documented in the final project report.
5. Conclusions
The primary objective of this research was to develop an affordable detection framework capable of providing real-time reports on surface conditions, encompassing blowing snow, dry, slushy, snow-covered, and snow-patched areas. However, the study's main focus was on effectively detecting and reporting blowing snow events to road users. Surface images collected from roadside webcams along Interstate-80 in Wyoming constituted the dataset for this study. Utilizing six pre-trained CNN architectures—AlexNet, SqueezeNet, ShuffleNet, ResNet18, GoogleNet, and ResNet50—two annotated image datasets were created from the raw data. Extensive efforts were made to reduce the image dataset, ensuring its readiness for modeling. To guarantee high accuracy, image annotation was carried out by two teams of well-trained observers and reviewers, resulting in the production of a high-quality training dataset. Dataset 1 consisted of two image categories: blowing snow and no blowing snow, facilitating effective classification. Conversely, Dataset 2 included a more comprehensive range of surface conditions: dry, slushy, blowing snow, snow-covered, and snow-patched areas. Initially, several iterations were conducted on Dataset 1 using SqueezeNet to determine the optimal transfer learning options. These options were subsequently employed to analyze the two datasets using the six models. The analysis results were then extracted, and performance metrics were calculated for each model relative to the two datasets.
For Dataset 1, ResNet50 emerges as the superior model, providing the highest performance indices with an impressive overall detection accuracy of 97.88%, irrespective of its training time. Conversely, AlexNet stands out for its efficiency in training time while still delivering commendable results. In contrast, ShuffleNet performed the poorest, exhibiting the longest training time and the lowest performance indices, with an overall detection accuracy of 95.13%.
Turning to Dataset 2, ResNet18 achievied an overall detection accuracy of 96.10% displaying the highest performance indices for the blowing snow category. Although ResNet50 trails slightly behind with an overall accuracy of 96.05%, ResNet18's superior performance in specific categories and its shorter training time elevate its standing. Notably, AlexNet demonstrates remarkable efficiency in training time, requiring only 562 minutes to train, a significant reduction compared to other models. An intriguing finding arises when examining the confusion matrices of AlexNet and ResNet18. Surprisingly, AlexNet outperforms ResNet18 in correctly detecting blowing snow events, indicating its superiority in this aspect of detection.
To assess the efficacy of proposed deep learning architectures against traditional machine learning models, a thorough evaluation was conducted on identical image datasets. Six models—CART, K-NN, SVM, RF, XGBoost, GB, and NB—were scrutinized. As feature extraction plays a pivotal role in traditional machine learning techniques, the study utilized the LBP approach to extract image features. Employing a modified LBP method with two parameters, 59 features were extracted, upon which traditional machine learning models were trained and tested. The results clearly showcased the markedly superior detection performance of pre-trained deep CNN models over traditional machine learning models in identifying blowing snow, underscoring the dominance of deep CNN in this domain.
The proposed surface detection framework offers a feasible solution for implementation by TMCs, streamlining the manual process of surface condition identification and mitigating the risk of human errors. By leveraging real-time surface condition information extracted from the proposed models, TMCs can integrate this data into the ATIS. Subsequently, this information can be transmitted via highway radios and TMC websites, thereby enhancing road users' driving behavior and facilitating informed travel decisions, particularly in adverse road conditions. Ultimately, these efforts contribute to improving overall road safety and optimizing travel routes.
In summary, the study demonstrated the effectiveness of six pre-trained CNN models in detecting surface conditions from images captured by roadside webcams. Given the outstanding performance and superior accuracy of the final two proposed models on Dataset 2, a surface condition prediction framework could be developed based on these models. This framework could be established in three sequential steps: first, utilizing AlexNet and ResNet18 models to classify images provided by WYDOT over the study period; second, extracting a ground truth dataset to classify daily surface conditions for the same period; and finally, conducting extensive statistical analysis to identify the best statistical model for predicting future daily surface conditions. By leveraging these predictions, traffic agencies can efficiently allocate resources for road weather maintenance, provide timely information to motorists, and alleviate crash risks.
Future research will focus on integrating the developed weather and road surface condition detection software with image-based traffic conflict severity frameworks for vehicle–vehicle and vehicle–pedestrian interactions. Prior studies have demonstrated the use of video-based trajectory extraction and collision- and kinematics-based indicators to quantify conflict severity, including energy dissipation and impact characteristics (Mohamed & Ahmed, 2025a; Mohamed & Ahmed, 2025b). Incorporating real-time environmental conditions such as blowing snow and reduced visibility into these frameworks can enhance the realism and operational relevance of safety assessments, supporting proactive identification of high-risk conditions and locations before crashes occur.
Author Contributions
The authors confirm the contribution to the paper as follows: study conception and design: ahmed mohamed, and mohamed m. ahmed; data preparation and reduction: md nasim khan, and ahmed mohamed; analysis and interpretation of results: ahmed mohamed, md nasim khan, and mohamed m. ahmed; draft manuscript preparation: ahmed mohamed, and mohamed m. ahmed. all authors reviewed the results and approved the final version of the manuscript. the authors have no conflict of interest to declare.
Acknowledgments
This work was sponsored by the Wyoming Department of Transportation (WYDOT). Grant Number: RS05220. The authors sincerely thank Dr. Lizhe Li for his substantial contribution to the development and implementation of the Surface Condition Detection Software.
References
- Ahmed, M. M.; Khan, M. N.; Mohamed, A.; Das, A.; Li, L. Automated real-time weather detection system using artificial intelligence (Report No. WY-2402F). Wyoming Department of Transportation. 2023. Available online: https://rosap.ntl.bts.gov/view/dot/75476.
- Alom, M.Z.; Taha, T.M.; Yakopcic, C.; Westberg, S.; Sidike, P.; Nasrin, M.S.; Essen, B.C.; Awwal, A.A.; Asari, V.K. The History Began from AlexNet: A Comprehensive Survey on Deep Learning Approaches. 2018. [Google Scholar] [CrossRef]
- Ardakani, A. A.; Kanafi, A. R.; Acharya, U. R.; Khadem, N.; Mohammadi, A. Application of deep learning technique to manage COVID-19 in routine clinical practice using CT images: Results of 10 convolutional neural networks. Computers in Biology and Medicine 2020, 121, 103795. [Google Scholar] [CrossRef]
- Ballester, P.L.; Araújo, R.M. On the Performance of GoogLeNet and AlexNet Applied to Sketches. AAAI Conference on Artificial Intelligence, 2016. [Google Scholar] [CrossRef]
- Chan, S.; Reddy, V.; Myers, B.; Thibodeaux, Q.; Brownstone, N.; Liao, W. Machine learning in dermatology: Current applications, opportunities, and limitations. Dermatology and Therapy 2020, 10, 365–386. [Google Scholar] [CrossRef]
- Gossart, A.; Souverijns, N.; Gorodetskaya, I. V.; Lhermitte, S.; Lenaerts, J. T. M.; Schween, J. H.; Mangold, A.; Laffineur, Q.; van Lipzig, N. P. M. Blowing snow detection from ground-based ceilometers: Application to East Antarctica. The Cryosphere 2017, 11(6), 2755–2772. [Google Scholar] [CrossRef]
- He, K.; Zhang, X.; Ren, S.; Sun, J. Deep Residual Learning for Image Recognition. 2016 IEEE Conference on Computer Vision and Pattern Recognition (CVPR), Las Vegas, NV, USA, 2016; pp. 770–778. [Google Scholar] [CrossRef]
- He, S.; Ohara, N. A new formula for estimating the threshold wind speed for snow movement. Journal of Advances in Modeling Earth Systems 2017, 9(7), 2514–2525. [Google Scholar] [CrossRef]
- Howard, A.G.; Zhu, M.; Chen, B.; Kalenichenko, D.; Wang, W.; Weyand, T.; Andreetto, M.; Adam, H. MobileNets: Efficient Convolutional Neural Networks for Mobile Vision Applications. 2017. [Google Scholar] [CrossRef]
- Iandola, F. N.; Han, S.; Moskewicz, M. W.; Ashraf, K.; Dally, W. J.; Keutzer, K. SqueezeNet: AlexNet-level accuracy with 50× fewer parameters and . arXiv 2016, arXiv:1602.07360. [Google Scholar] [CrossRef]
- Khan, M. N.; Ahmed, M. M. Snow detection using in-vehicle video camera with texture-based image features utilizing k-nearest neighbor, support vector machine, and random forest. Transportation Research Record: Journal of the Transportation Research Board 2019, 2673(8), 221–232. [Google Scholar] [CrossRef]
- Khan, M. N.; Ahmed, M. M. Weather and surface condition detection based on road-side webcams: Application of pre-trained convolutional neural network. International Journal of Transportation Science and Technology 2021. [Google Scholar] [CrossRef]
- Khan, M. N.; Das, A.; Ahmed, M. M.; Wulff, S. S. Multilevel weather detection based on images: A machine learning approach with histogram of oriented gradient and local binary pattern based features. Journal of Intelligent Transportation Systems: Technology, Planning, and Operations 2021, 25(5), 513–532. [Google Scholar] [CrossRef]
- Krizhevsky, A.; Sutskever, I.; Hinton, G. E. ImageNet classification with deep convolutional neural networks. Advances in Neural Information Processing Systems 2012, 25. Available online: http://refhub.elsevier.com/S2046-0430(21)00052-6/h0150. [CrossRef]
- Lawrence, S.; Giles, C. L.; Tsoi, A. C.; Back, A. D. Face recognition: A convolutional neural-network approach. IEEE Transactions on Neural Networks 1997, 8(1), 98–113. [Google Scholar] [CrossRef]
- Loeb, N.; Kennedy, A. Blowing snow at McMurdo Station, Antarctica during the AWARE field campaign: Multi-instrument observations of blowing snow. Journal of Geophysical Research: Atmospheres 2023, 128(2). [Google Scholar] [CrossRef]
- Maeda-Gutiérrez, V.; Galván-Tejada, C. E.; Zanella-Calzada, L. A.; Celaya-Padilla, J. M.; Galván-Tejada, J. I.; Gamboa-Rosales, H.; Luna-García, H.; Magallanes-Quintanar, R.; Guerrero Méndez, C. A.; Olvera-Olvera, C. A. Comparison of convolutional neural network architectures for classification of tomato plant diseases. Applied Sciences 2020, 10(4), 1245. [Google Scholar] [CrossRef]
- Mann, G. W.; Anderson, P. S.; Mobbs, S. D. Profile measurements of blowing snow at Halley, Antarctica. J. Geophys. Res. 2000, 105(D19), 24491–24508. [Google Scholar] [CrossRef]
- Mohamed, A.; Ahmed, M. M. Assessing traffic conflicts severity through simulated collision dynamics and impact analysis; Transportation Research Record: Journal of the Transportation Research Board, 2025a. [Google Scholar] [CrossRef]
- Mohamed, A.; Ahmed, M. M. Multi-camera machine vision for detecting and analyzing vehicle–pedestrian conflicts at signalized intersections: Deep neural-based pose estimation algorithms. Applied Sciences 2025b, 15(19), 10413. [Google Scholar] [CrossRef]
- Naaim-Bouvet, F.; Bellot, H.; Nishimura, K.; Genthon, C.; Palerme, C.; Guyomarc’h, G.; Vionnet, V. Detection of snowfall occurrence during blowing snow events using photoelectric sensors. Cold Regions Science and Technology 2014, 106–107, 11–21. [Google Scholar] [CrossRef]
- Nishimura, K.; Nemoto, M. Blowing snow at Mizuho Station, Antarctica. Philosophical Transactions of the Royal Society A: Mathematical, Physical and Engineering Sciences 2005, 363, 1647–1662. [Google Scholar] [CrossRef] [PubMed]
- Osman, O. A.; Hajij, M.; Bakhit, P. R.; Ishak, S. Prediction of near-crashes from observed vehicle kinematics using machine learning. Transportation Research Record: Journal of the Transportation Research Board 2019, 2673, 463–473. [Google Scholar] [CrossRef]
- Ojala, T.; Pietikäinen, M.; Harwood, D. A comparative study of texture measures with classification based on featured distributions. Pattern Recognition 1996, 29(1), 51–59. [Google Scholar] [CrossRef]
- Ojala, T.; Pietikäinen, M.; Mäenpää, T. Multiresolution gray-scale and rotation invariant texture classification with local binary patterns. IEEE Transactions on Pattern Analysis and Machine Intelligence 2002, 24(7), 971–987. [Google Scholar] [CrossRef]
- Pinheiro, P.H.; Collobert, R. Recurrent Convolutional Neural Networks for Scene Labeling. International Conference on Machine Learning, 2014. [Google Scholar] [CrossRef]
- Robinson, J.; Jaeglé, L.; Palm, S. P.; Shupe, M. D.; Liston, G. E.; Frey, M. M. ICESat-2 observations of blowing snow over Arctic sea ice during the 2019–2020 MOSAiC expedition. Journal of Geophysical Research: Atmospheres 2025, 130(16), e2025JD043919. [Google Scholar] [CrossRef]
- Russakovsky, O.; Deng, J.; Su, H.; Krause, J.; Satheesh, S.; Ma, S.; Huang, Z.; Karpathy, A.; Khosla, A.; Bernstein, M.; Berg, A. C.; Fei-Fei, L. ImageNet large scale visual recognition challenge. International Journal of Computer Vision 2015, 115(3), 211–252. [Google Scholar] [CrossRef]
- Shafiq, M.; Gu, Z. Deep residual learning for image recognition: A survey. Applied Sciences 2022, 12(18), 8972. [Google Scholar] [CrossRef]
- Sharafeldin, M.; Albatayneh, O.; Farid, A.; Ksaibati, K. A Bayesian approach to examine the impact of pavement friction on intersection safety. Sustainability 2022a, 14(19), 12495. [Google Scholar] [CrossRef]
- Sharafeldin, M.; Farid, A.; Ksaibati, K. Investigating the impact of roadway characteristics on intersection crash severity. Eng 2022b, 3(4), 412–423. [Google Scholar] [CrossRef]
- Simonyan, K.; Zisserman, A. Very Deep Convolutional Networks for Large-Scale Image Recognition. The 3rd International Conference on Learning Representations (ICLR2015), 2015; Available online: https://.
- Szegedy, C.; Vanhoucke, V.; Ioffe, S.; Shlens, J.; Wojna, Z. Going deeper with convolutions. In Proceedings of the IEEE Conference on Computer Vision and Pattern Recognition (CVPR), 2015; pp. 1–9. [Google Scholar] [CrossRef]
- Szegedy, C.; Vanhoucke, V.; Ioffe, S.; Shlens, J.; Wojna, Z. Rethinking the Inception architecture for computer vision. In Proceedings of the IEEE Conference on Computer Vision and Pattern Recognition (CVPR), 2016; pp. 2818–2826. [Google Scholar] [CrossRef]
- Xie, S.; Girshick, R.; Dollár, P.; Tu, Z.; He, K. Aggregated residual transformations for deep neural networks. In Proceedings of the IEEE Conference on Computer Vision and Pattern Recognition (CVPR), 2017; pp. 5987–5995. [Google Scholar] [CrossRef]
- Xie, Z.; Ma, W.; Ma, Y.; Hu, Z.; Sun, G.; Han, Y.; Hu, W.; Su, R.; Fan, Y. Decision tree-based detection of blowing snow events in the European Alps. Hydrology and Earth System Sciences 2021, 25(7), 3783–3804. [Google Scholar] [CrossRef]
- Ye, J.; Liu, L.; Wu, Y.; Yang, W.; Ren, H. Using machine learning algorithm to detect blowing snow and fog in Antarctica based on ceilometer and surface meteorology systems. Remote Sensing 2022, 14(9), 2126. [Google Scholar] [CrossRef]
- Zhang, X.; Zhou, X.; Lin, M.; Sun, J. ShuffleNet: An extremely efficient convolutional neural network for mobile devices. In Proceedings of the IEEE/CVF Conference on Computer Vision and Pattern Recognition (CVPR), 2018; pp. 6848–6856. [Google Scholar] [CrossRef]
Figure 1.
Workflow of The Proposed Framework for Blowing Snow and Road Surface Condition Detection.

Figure 2.
Locations of webcams on the I-80, Wyoming (Khan and Ahmed, 2021).
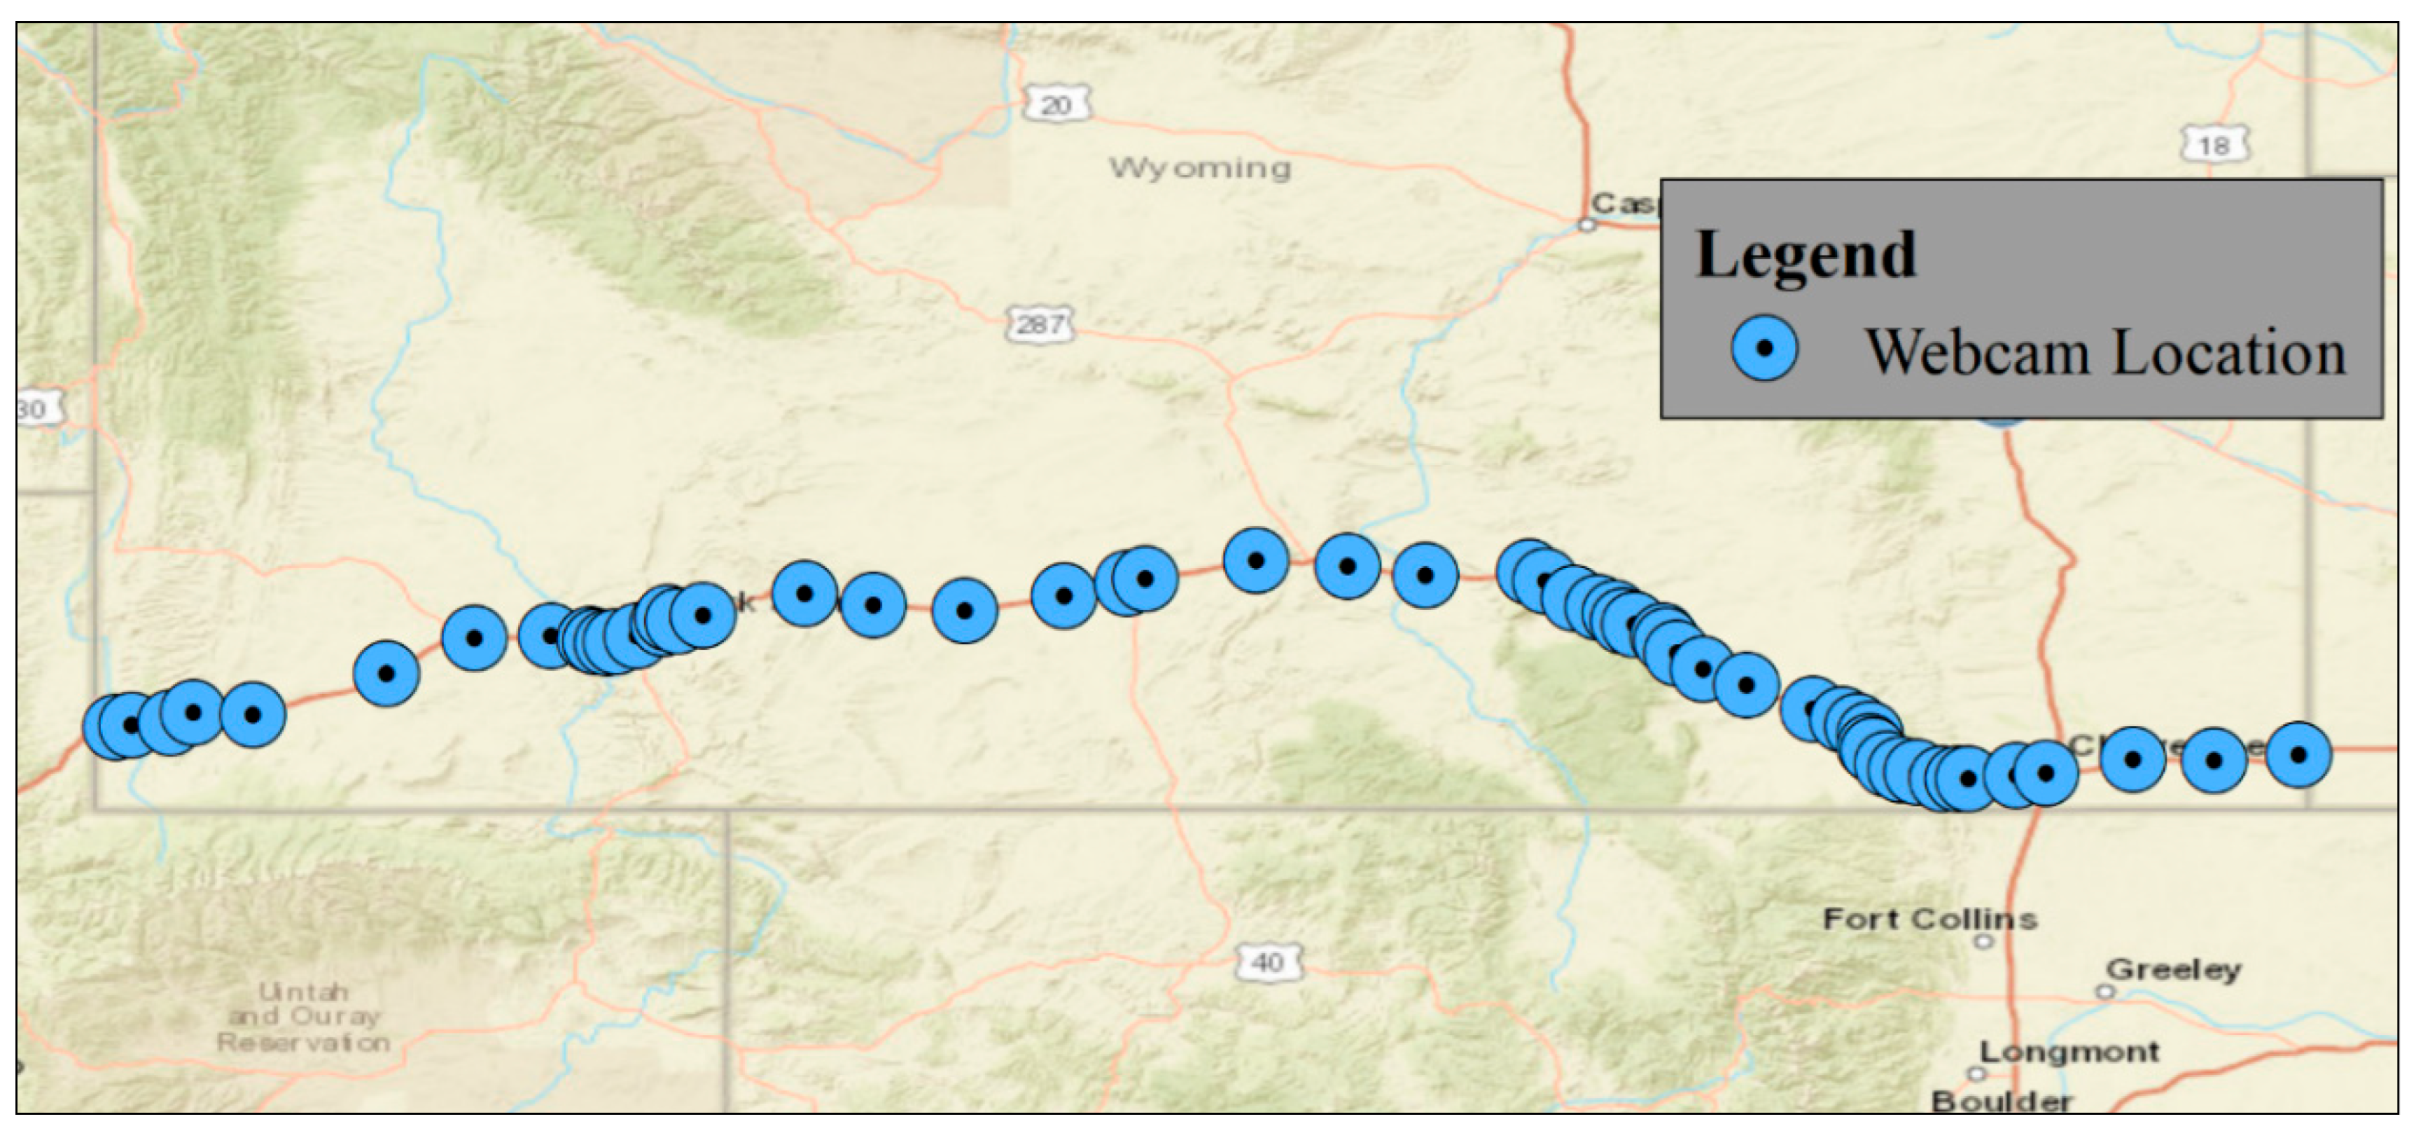
Figure 3.
Sample Images of Surface Condition Categories.
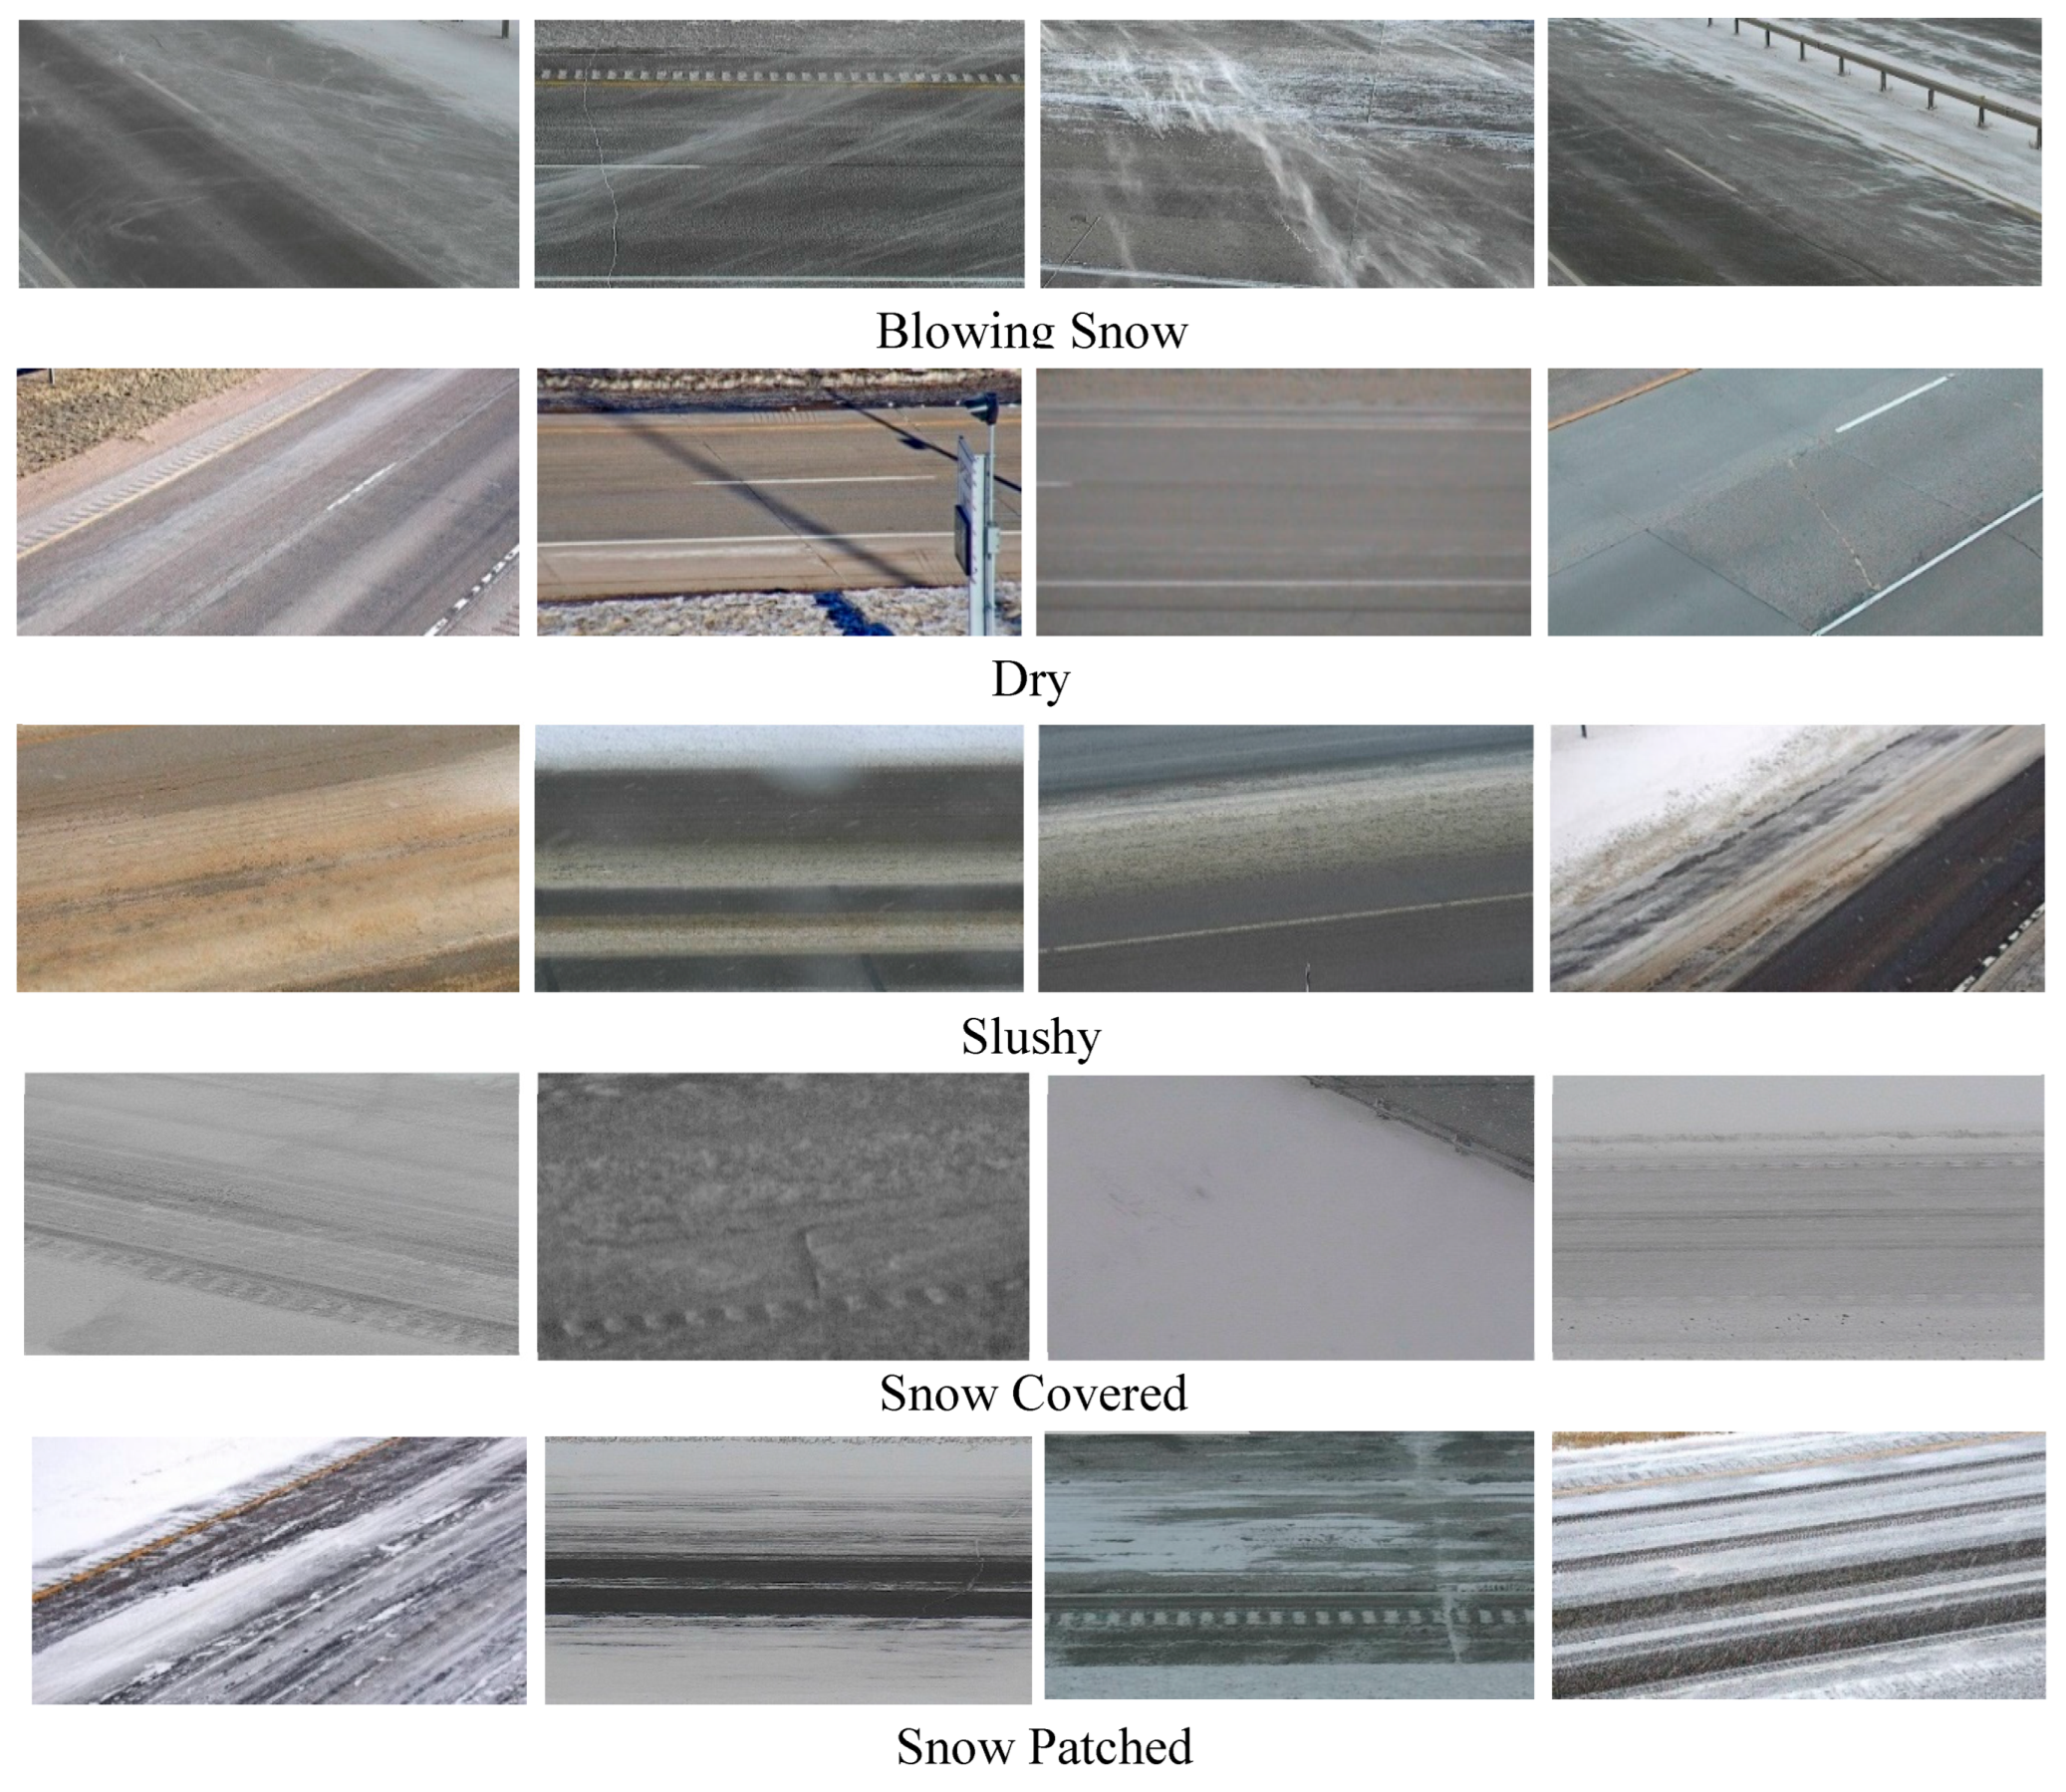
Figure 4.
Training progress of surface detection networks, a) AlexNet, b) ResNet50 (Dataset 1).
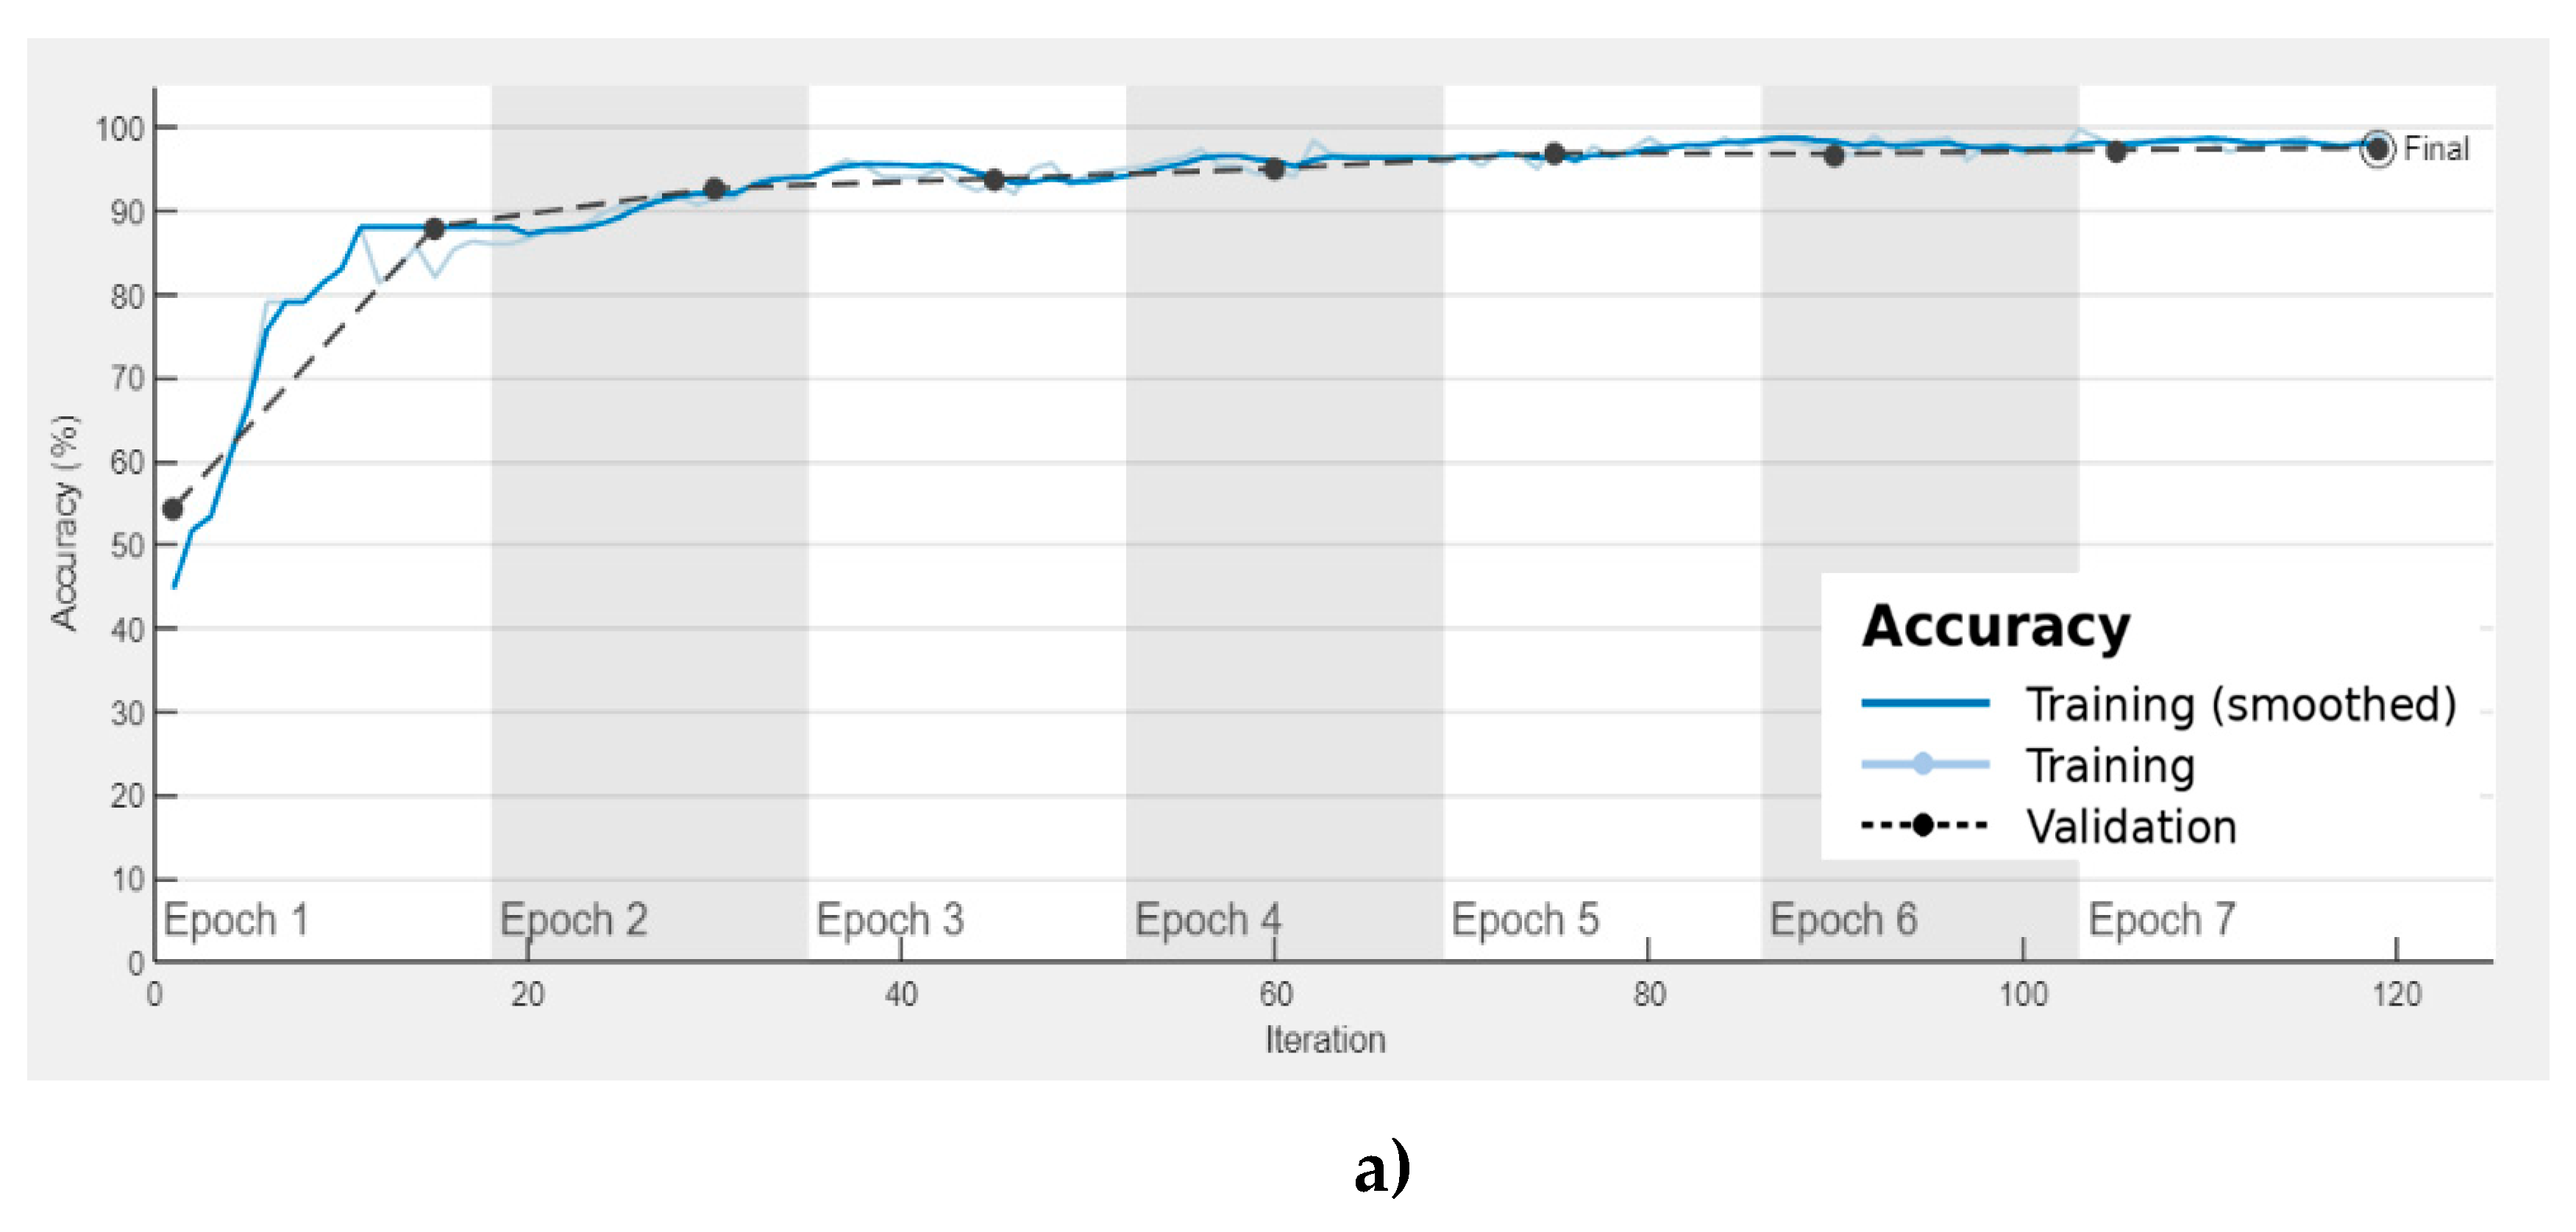
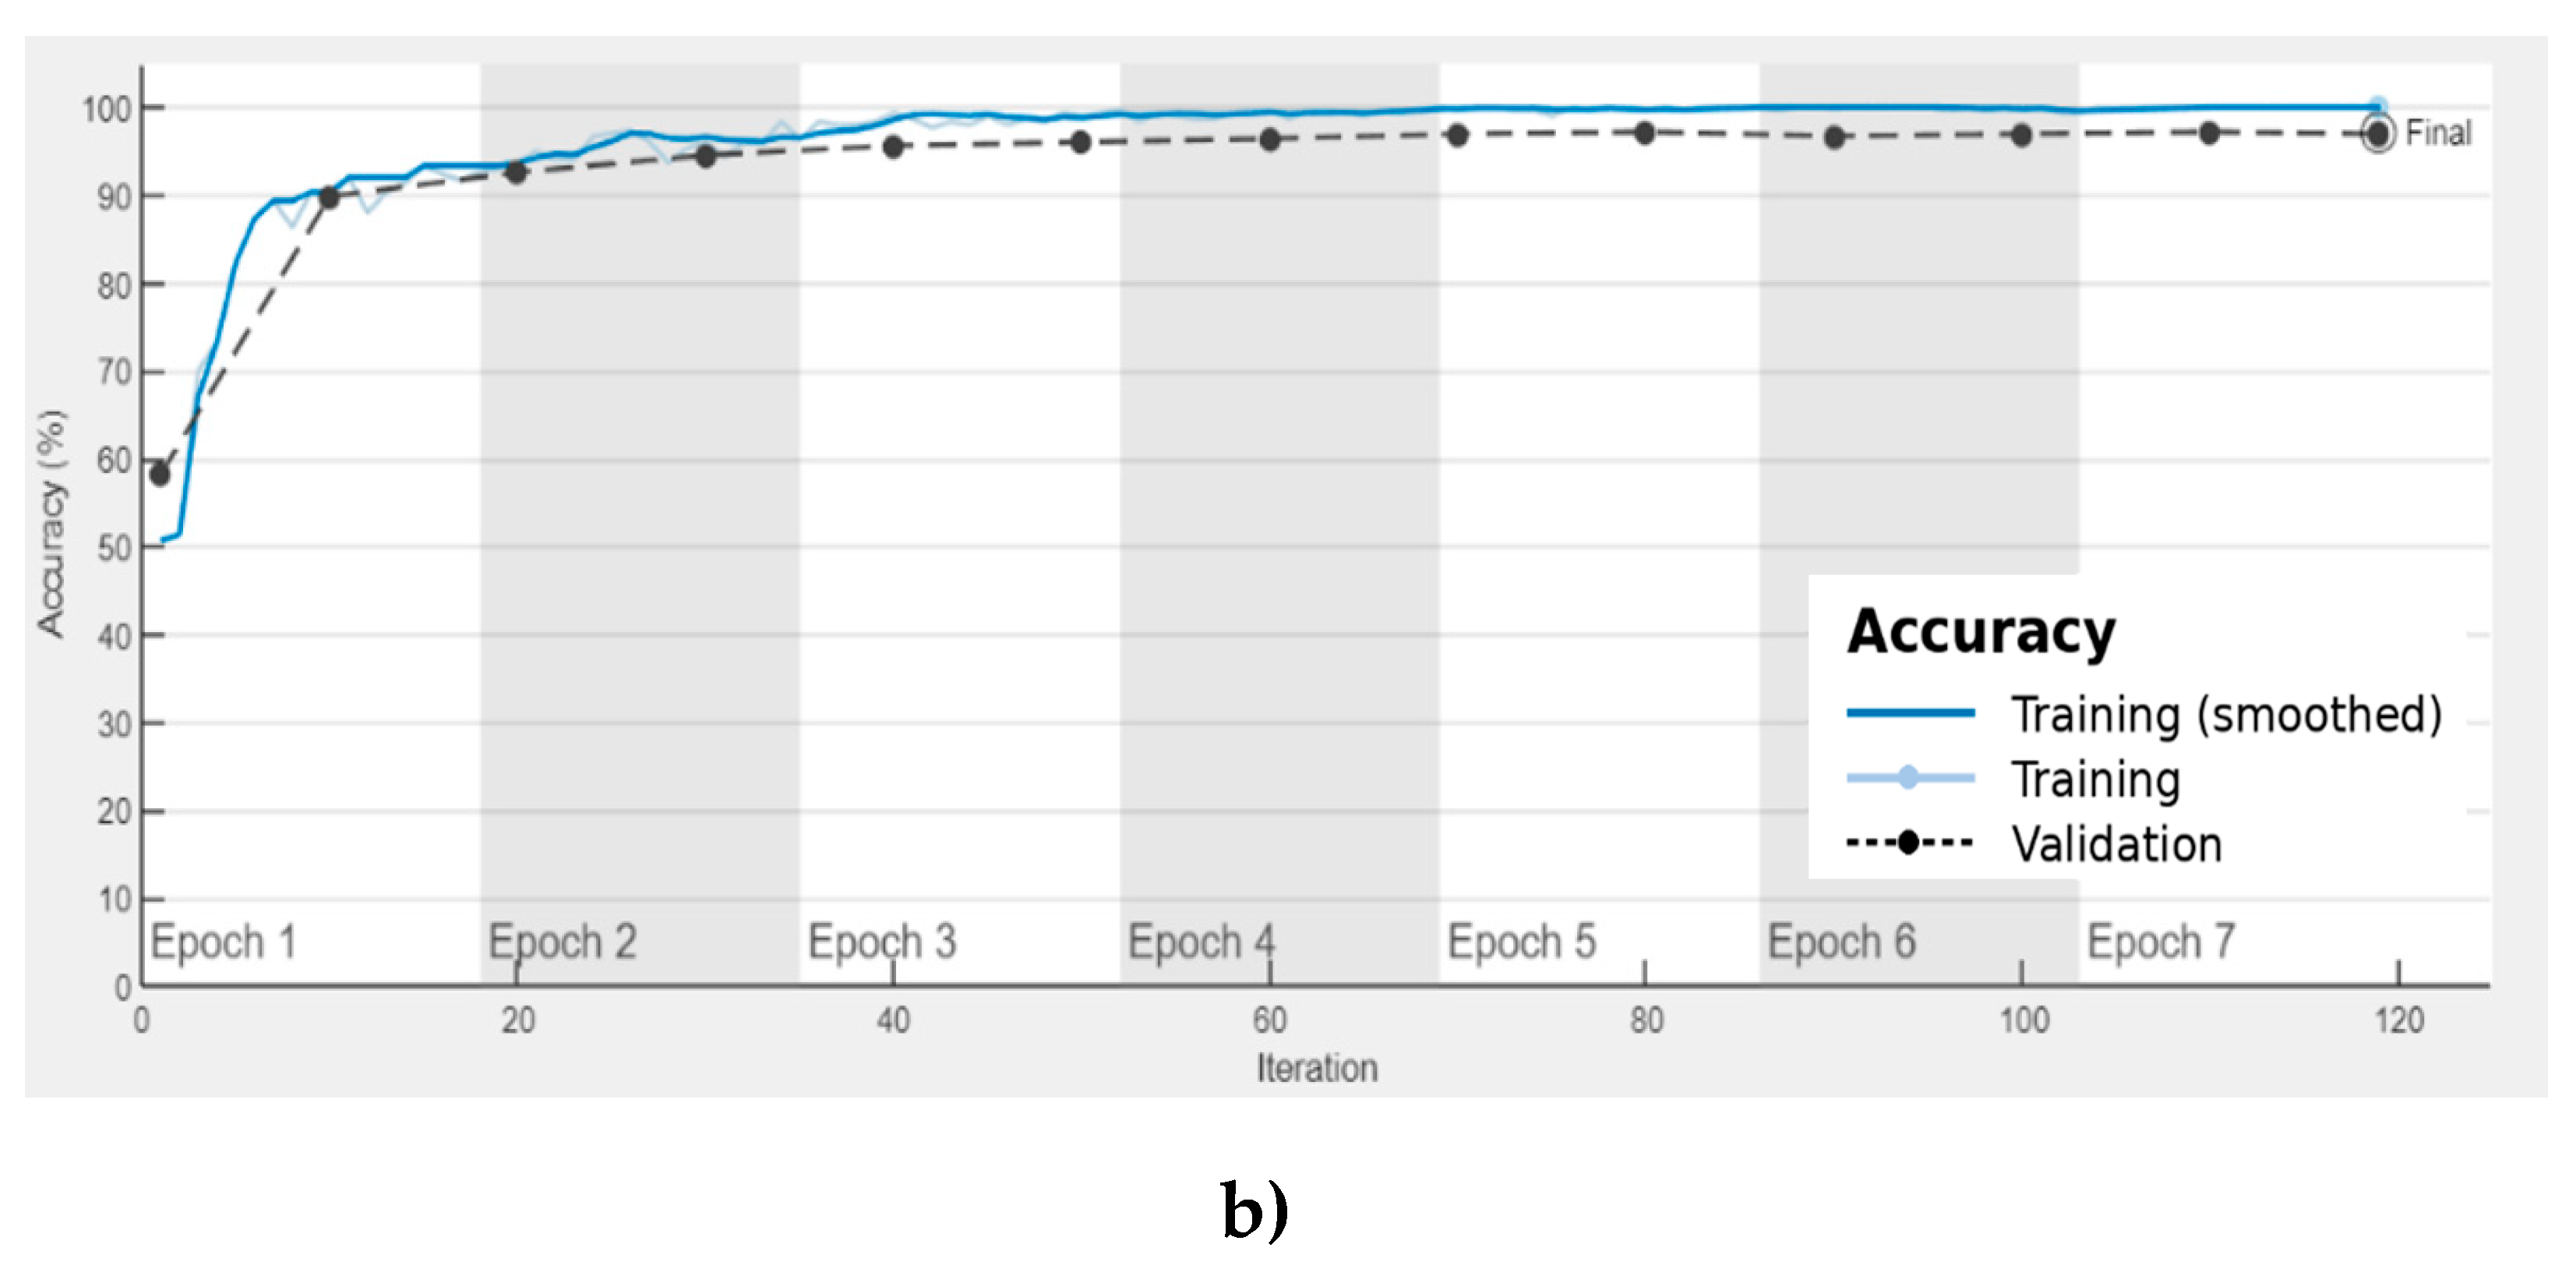
Figure 5.
Confusion matrices of the pre-trained models a) AlexNet, b) ResNet50 (Dataset 1).
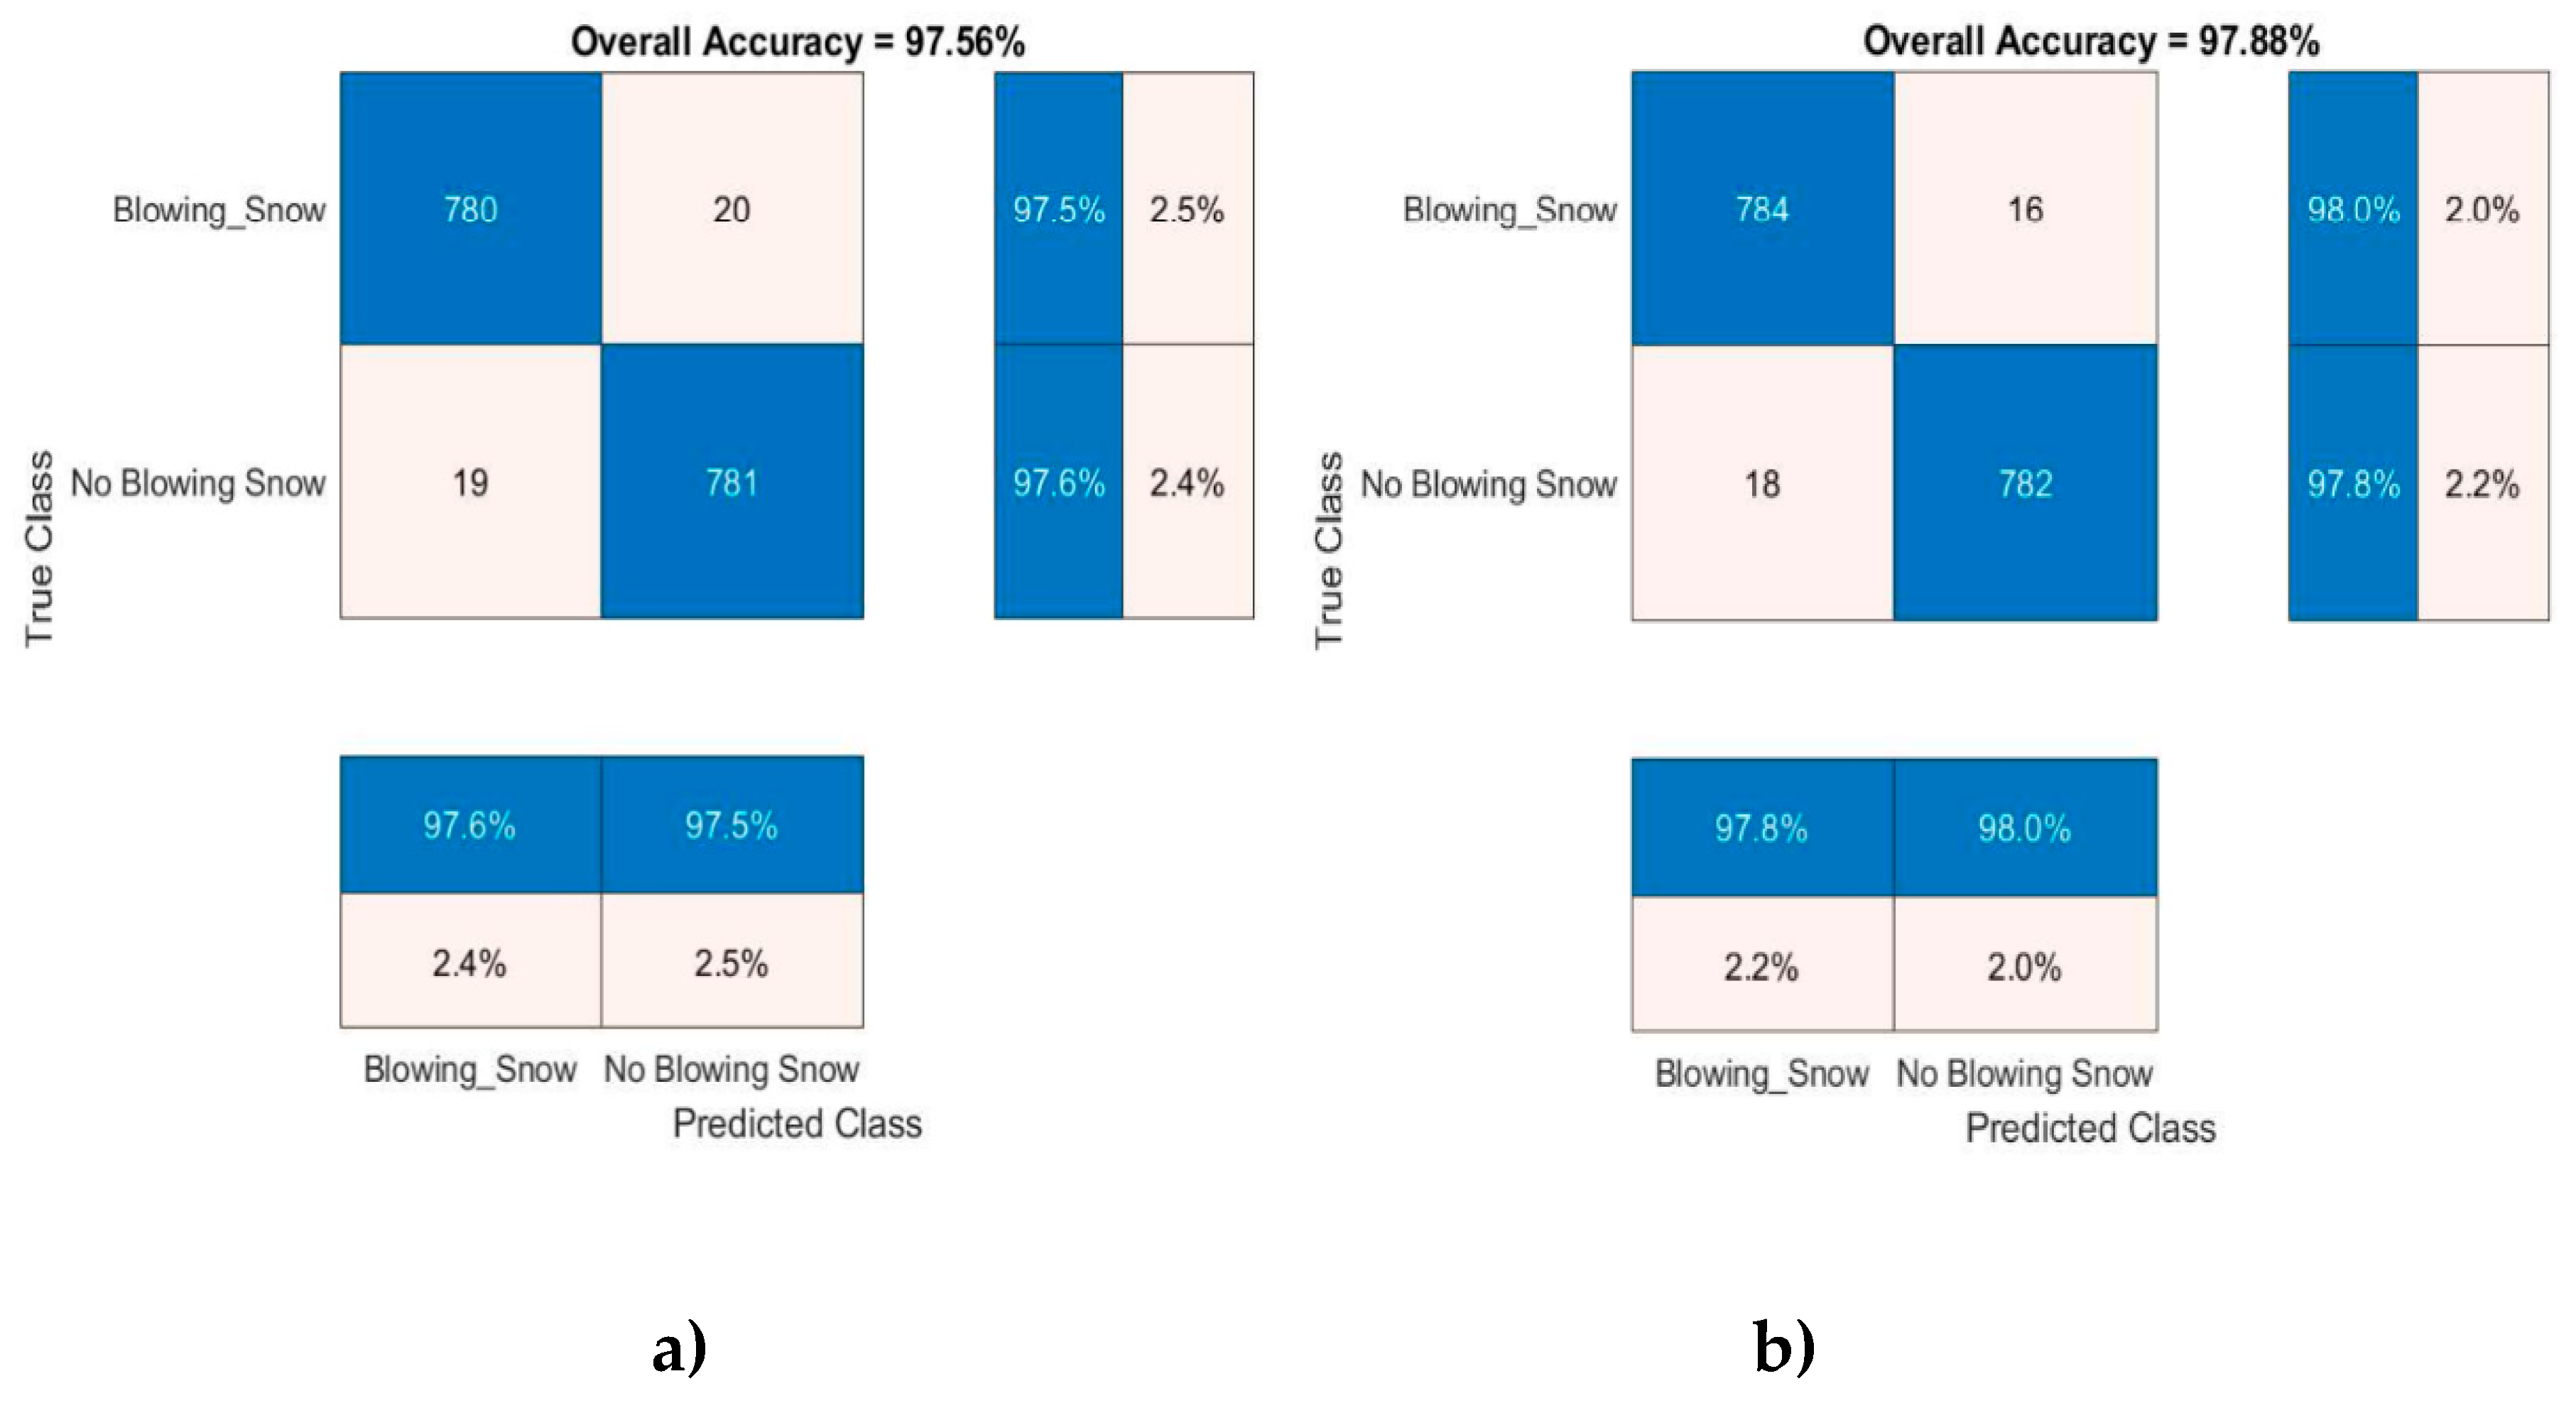
Figure 8.
Road Surface Condition Detection Software Layout (Ahmed et al., 2023).
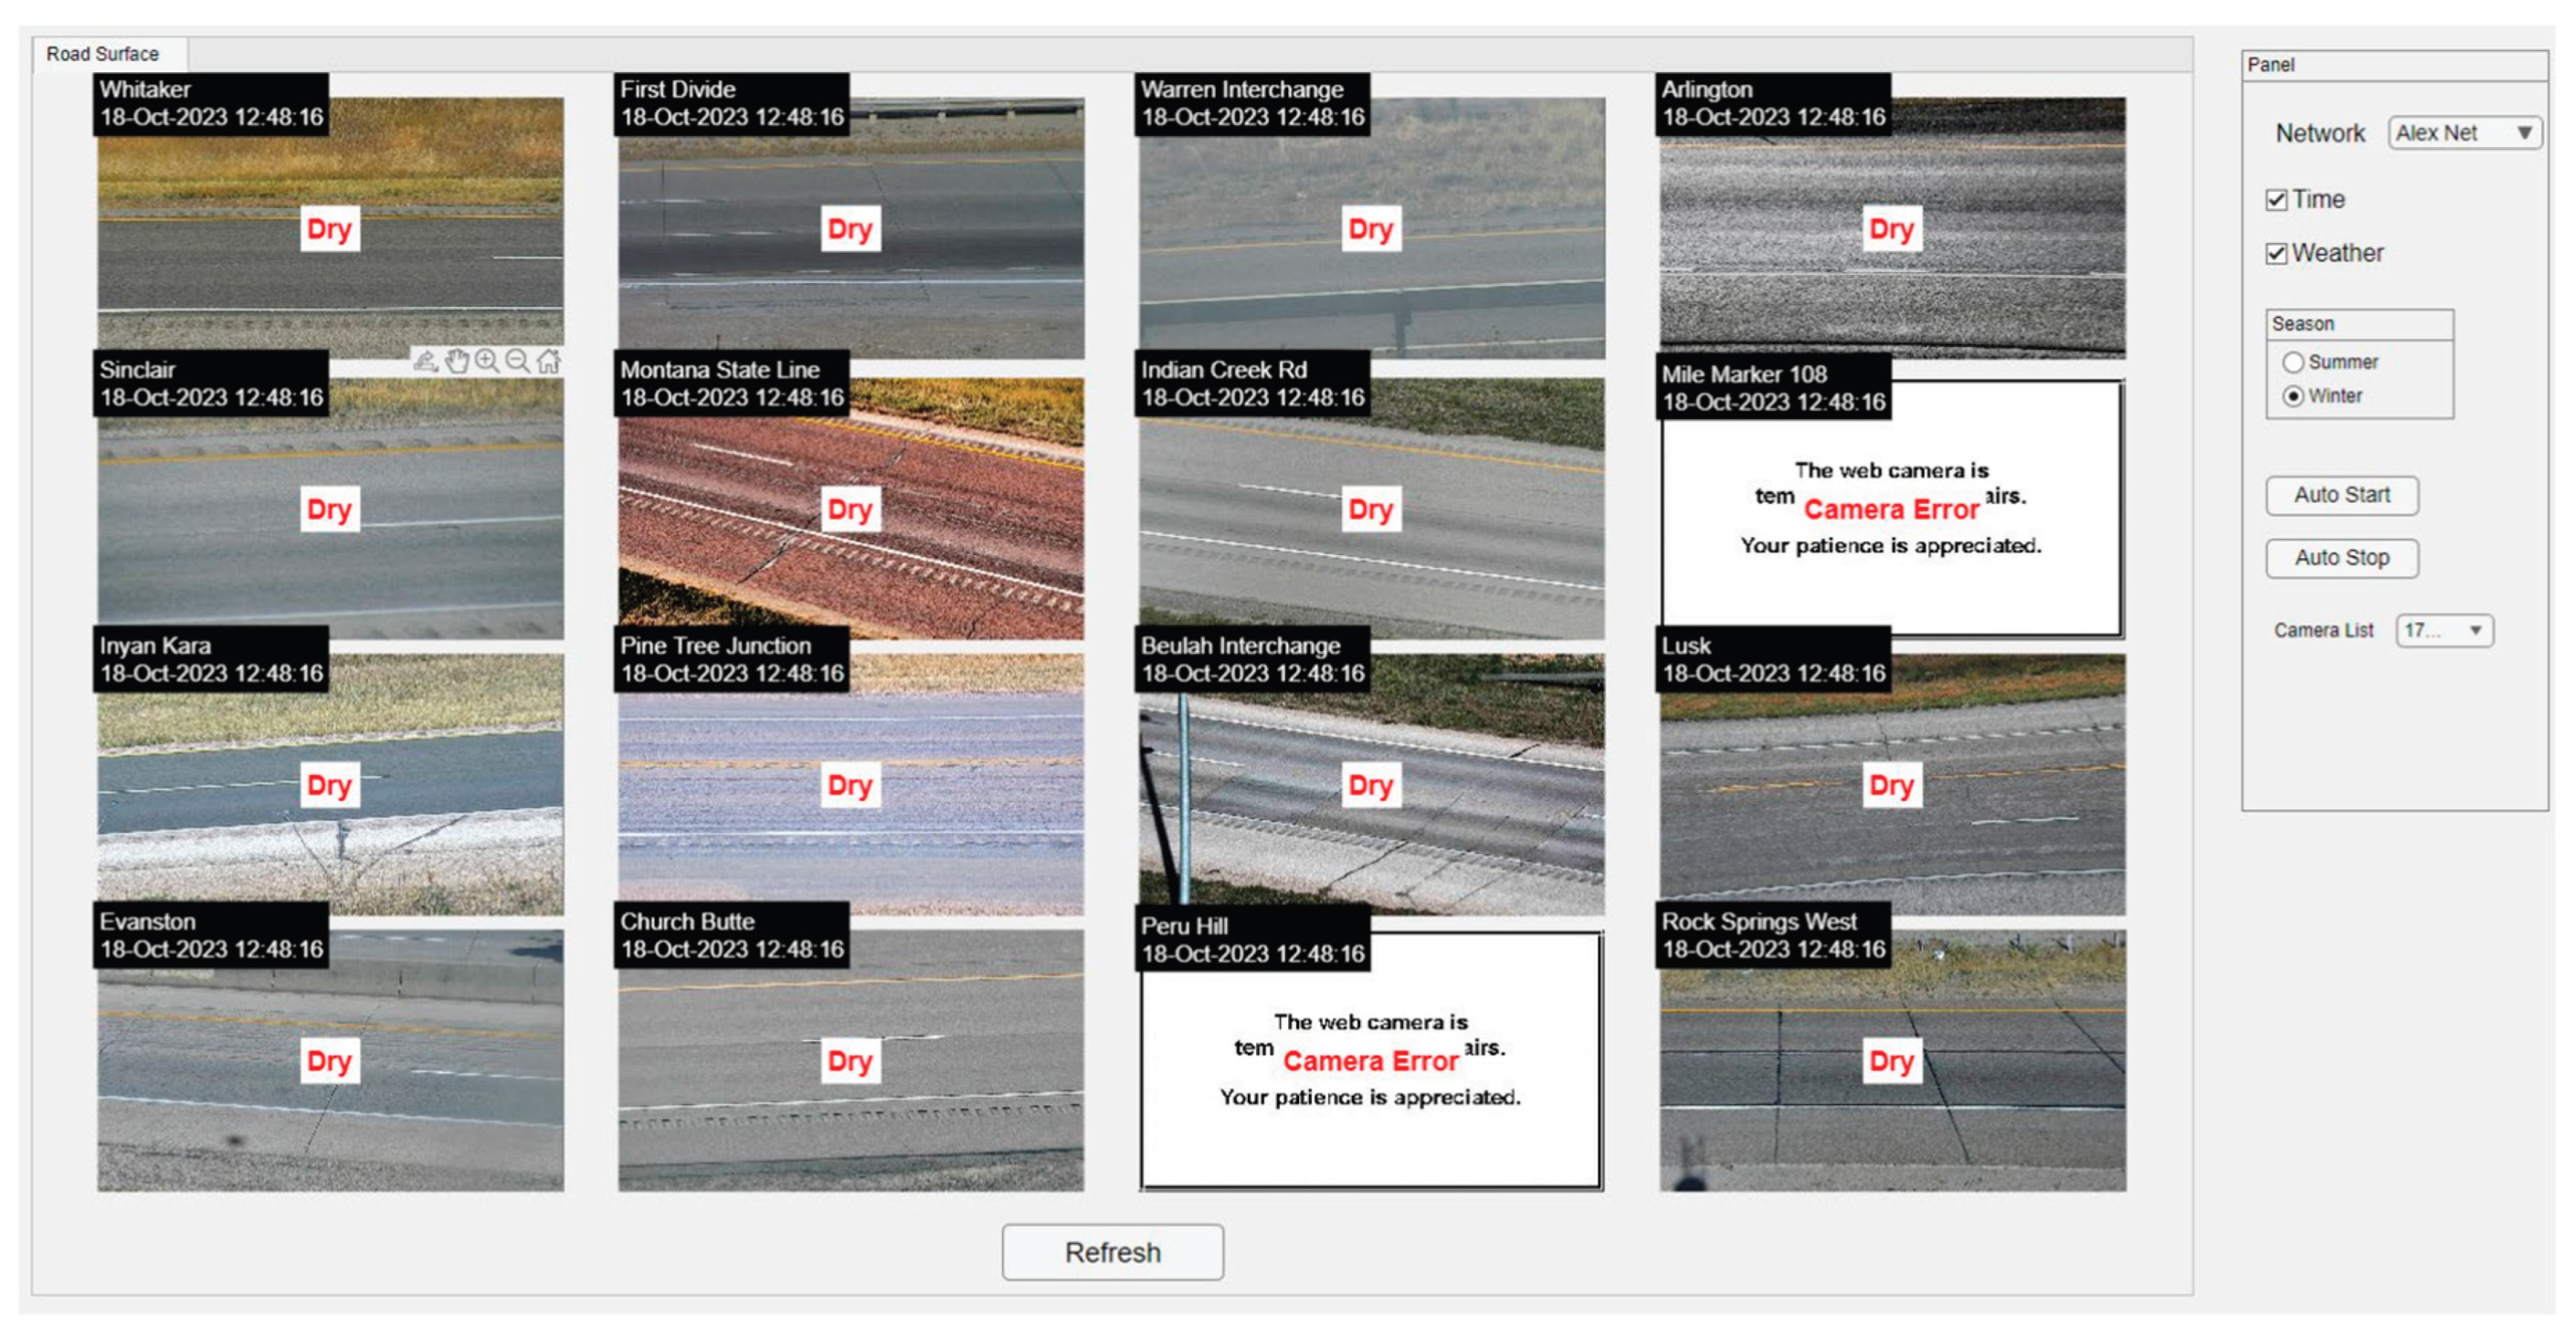

Table 1.
Surface Condition Detection Criteria During Image Annotation.
| Categories | Criteria | |
|---|---|---|
| Blowing Snow |
|
|
| No Blowing Snow | Dry |
|
| Slushy |
|
|
| Snow Covered |
|
|
| Snow Patched |
|
|
Table 2.
The properties of the convolutional neural networks utilized in the study.
| Network | Depth | Image Input Size (Pixels) |
|---|---|---|
| AlexNet | 8 | 227 x 227 |
| SqueezeNet | 18 | 227 x 227 |
| ShuffleNet | 50 | 224 x 224 |
| ResNet18 | 18 | 224 x 224 |
| GoogleNet | 22 | 224 x 224 |
| ResNet50 | 50 | 224 x 224 |
Table 3.
Performance comparison of the deep learning networks for surface condition detection (Dataset 1).
Table 3.
Performance comparison of the deep learning networks for surface condition detection (Dataset 1).
| Network | Accuracy | Recall | Specificity | Precision | F1-score | Training Time (mins) | Relative Training Time | ||
| Validation | Testing | ||||||||
| DATASET 1 | AlexNet | 97.50% | 97.56% | 97.62% | 97.50% | 97.50% | 97.56% | 31:56 | 1 |
| SqueezeNet | 95.08% | 95.88% | 95.76% | 95.99% | 96.00% | 95.88% | 48:02 | 1.5 | |
| ShuffleNet | 96.17% | 95.13% | 95.70% | 94.57% | 94.50% | 95.09% | 610:30 | 19.1 | |
| ResNet18 | 97.34% | 96.88% | 97.35% | 96.41% | 96.38% | 96.86% | 202:40 | 6.3 | |
| GoogleNet | 96.48% | 96.00% | 94.12% | 98.04% | 98.13% | 96.08% | 332:14 | 10.4 | |
| ResNet50 | 97.27% | 97.88% | 97.76% | 97.99% | 98.00% | 97.88% | 1366:49 | 42.7 | |
Table 5.
Performance comparison of the deep learning networks for the surface condition detection (Dataset 2).
Table 5.
Performance comparison of the deep learning networks for the surface condition detection (Dataset 2).
| Network | Accuracy | Categories | Recall | Specificity | Precision | F1-score | Training Time (mins) | Relative Training Time | ||
| Validation | Testing | |||||||||
| DATASET 2 | AlexNet | 96.44% | 95.88% | Blowing Snow | 95.13% | 99.44% | 97.69% | 96.39% | 561:36 | 3.9 |
| Dry | 99.63% | 99.88% | 99.50% | 99.56% | ||||||
| Slushy | 97.25% | 97.28% | 89.94% | 93.45% | ||||||
| Snow Covered | 98.63% | 99.31% | 97.29% | 97.95% | ||||||
| Snow Patched | 88.75% | 98.94% | 95.43% | 91.97% | ||||||
| SqueezeNet | 92.25% | 93.33% | Blowing Snow | 95.88% | 98.13% | 92.74% | 94.28% | 144:01 | 1 | |
| Dry | 97.75% | 99.09% | 96.42% | 97.08% | ||||||
| Slushy | 84.00% | 99.28% | 96.69% | 89.90% | ||||||
| Snow Covered | 98.25% | 98.69% | 94.93% | 96.56% | ||||||
| Snow Patched | 90.75% | 96.47% | 86.53% | 88.59% | ||||||
| ShuffleNet | 93.06% | 93.78% | Blowing Snow | 93.00% | 98.88% | 95.38% | 94.18% | 843:50 | 5.9 | |
| Dry | 98.63% | 99.72% | 98.87% | 98.75% | ||||||
| Slushy | 90.75% | 98.06% | 92.13% | 91.44% | ||||||
| Snow Covered | 97.00% | 99.06% | 96.28% | 96.64% | ||||||
| Snow Patched | 89.50% | 96.50% | 86.47% | 87.96% | ||||||
| ResNet18 | 96.66% | 96.10% | Blowing Snow | 94.25% | 99.44% | 97.67% | 95.93% | 1957:28 | 13.6 | |
| Dry | 98.88% | 99.81% | 99.25% | 99.06% | ||||||
| Slushy | 95.75% | 98.72% | 94.92% | 95.33% | ||||||
| Snow Covered | 98.38% | 99.03% | 96.21% | 97.28% | ||||||
| Snow Patched | 93.25% | 98.13% | 92.56% | 92.90% | ||||||
| GoogleNet | 94.72% | 94.10% | Blowing Snow | 93.75% | 99.16% | 96.53% | 95.12% | 1556:48 | 10.8 | |
| Dry | 99.13% | 99.81% | 99.25% | 99.19% | ||||||
| Slushy | 92.50% | 97.50% | 90.24% | 91.36% | ||||||
| Snow Covered | 96.25% | 99.13% | 96.49% | 96.37% | ||||||
| Snow Patched | 88.88% | 97.03% | 88.21% | 88.54% | ||||||
| ResNet50 | 96.94% | 96.05% | Blowing Snow | 95.00% | 99.09% | 96.32% | 95.66% | 1962:46 | 13.6 | |
| Dry | 99.38% | 99.78% | 99.13% | 99.25% | ||||||
| Slushy | 96.50% | 98.59% | 94.49% | 95.49% | ||||||
| Snow Covered | 97.38% | 99.44% | 97.74% | 97.56% | ||||||
| Snow Patched | 92.00% | 98.16% | 92.58% | 92.29% | ||||||
Table 5.
Performance comparison of the proposed deep learning model with the traditional machine learning models (Dataset 1).
Table 5.
Performance comparison of the proposed deep learning model with the traditional machine learning models (Dataset 1).
| Model | Accuracy | Recall | Specificity | Precision | F1-score | |
| DATASET 1 | CART | 63.44% | 75.75% | 52.10% | 59.29% | 66.51% |
| KNN | 87.50% | 91.79% | 83.55% | 83.71% | 87.56% | |
| SVM | 87.38% | 89.96% | 84.99% | 84.66% | 87.23% | |
| RF | 89.69% | 92.05% | 87.52% | 87.16% | 89.54% | |
| XGBoost | 87.38% | 90.48% | 84.51% | 84.33% | 87.30% | |
| GB | 80.81% | 84.75% | 77.19% | 77.38% | 80.90% | |
| NB | 63.81% | 59.97% | 67.35% | 62.84% | 61.37% | |
| ResNet50 | 97.88% | 97.76% | 97.99% | 98.00% | 97.88% | |
Table 6.
Performance comparison of the proposed deep learning model with the traditional machine learning models (Dataset 2).
Table 6.
Performance comparison of the proposed deep learning model with the traditional machine learning models (Dataset 2).
| Model | Accuracy | Categories | Recall | Specificity | Precision | F1-score | |
| DATASET 2 | CART | 41.30% | Blowing Snow | 0.00% | 100.00% | 0.00% | 0.00% |
| Dry | 64.70% | 81.46% | 46.44% | 54.07% | |||
| Slushy | 83.53% | 49.00% | 27.92% | 41.85% | |||
| Snow Covered | 63.52% | 96.77% | 82.72% | 71.86% | |||
| Snow Patched | 0.00% | 100.00% | 0.00% | 0.00% | |||
| KNN | 86.15% | Blowing Snow | 82.27% | 96.77% | 86.64% | 84.40% | |
| Dry | 93.97% | 96.82% | 88.00% | 90.89% | |||
| Slushy | 78.69% | 96.38% | 83.73% | 81.13% | |||
| Snow Covered | 92.98% | 97.51% | 90.11% | 91.53% | |||
| Snow Patched | 82.92% | 95.19% | 82.14% | 82.53% | |||
| SVM | 82.73% | Blowing Snow | 81.77% | 96.46% | 85.46% | 83.57% | |
| Dry | 90.08% | 96.75% | 87.33% | 88.68% | |||
| Slushy | 77.25% | 92.67% | 71.38% | 74.20% | |||
| Snow Covered | 91.45% | 98.07% | 92.04% | 91.75% | |||
| Snow Patched | 73.55% | 94.46% | 77.99% | 75.70% | |||
| RF | 86.45% | Blowing Snow | 86.45% | 96.30% | 85.61% | 86.03% | |
| Dry | 90.70% | 96.79% | 87.52% | 89.08% | |||
| Slushy | 82.22% | 95.36% | 80.74% | 81.48% | |||
| Snow Covered | 91.84% | 98.20% | 92.54% | 92.19% | |||
| Snow Patched | 81.26% | 96.42% | 85.84% | 83.49% | |||
| XGBoost | 83.55% | Blowing Snow | 82.76% | 95.42% | 82.15% | 82.45% | |
| Dry | 89.70% | 97.03% | 88.26% | 88.97% | |||
| Slushy | 77.65% | 94.03% | 75.48% | 76.55% | |||
| Snow Covered | 92.86% | 97.98% | 91.80% | 92.33% | |||
| Snow Patched | 75.21% | 94.96% | 79.95% | 77.51% | |||
| GB | 73.85% | Blowing Snow | 69.58% | 92.72% | 70.89% | 70.23% | |
| Dry | 83.17% | 94.26% | 78.25% | 80.63% | |||
| Slushy | 65.10% | 91.72% | 65.01% | 65.06% | |||
| Snow Covered | 85.97% | 96.77% | 86.63% | 86.30% | |||
| Snow Patched | 65.84% | 91.83% | 68.27% | 67.03% | |||
| NB | 52.53% | Blowing Snow | 38.30% | 86.92% | 42.72% | 40.39% | |
| Dry | 56.78% | 90.32% | 59.32% | 58.02% | |||
| Slushy | 65.36% | 78.61% | 41.95% | 51.10% | |||
| Snow Covered | 73.21% | 94.90% | 77.78% | 75.43% | |||
| Snow Patched | 31.32% | 89.99% | 45.52% | 37.10% | |||
| ResNet18 | 96.10% | Blowing Snow | 94.25% | 99.44% | 97.67% | 95.93% | |
| Dry | 98.88% | 99.81% | 99.25% | 99.06% | |||
| Slushy | 95.75% | 98.72% | 94.92% | 95.33% | |||
| Snow Covered | 98.38% | 99.03% | 96.21% | 97.28% | |||
| Snow Patched | 93.25% | 98.13% | 92.56% | 92.90% | |||
Disclaimer/Publisher’s Note: The statements, opinions and data contained in all publications are solely those of the individual author(s) and contributor(s) and not of MDPI and/or the editor(s). MDPI and/or the editor(s) disclaim responsibility for any injury to people or property resulting from any ideas, methods, instructions or products referred to in the content. |
© 2026 by the authors. Licensee MDPI, Basel, Switzerland. This article is an open access article distributed under the terms and conditions of the Creative Commons Attribution (CC BY) license (http://creativecommons.org/licenses/by/4.0/).
Copyright: This open access article is published under a Creative Commons CC BY 4.0 license, which permit the free download, distribution, and reuse, provided that the author and preprint are cited in any reuse.


