1. Introduction
According to latest World Health Organization (WHO) public road networks are the lifeblood of modern societies, playing a crucial role for goods and people transportation, which is fundamental for trading, commerce and tourism. At the same time, they are the enablers for easy access to jobs, education, healthcare and social activities, both in urban or country regions. The status of road safety is crucial: harsh weather conditions can accelerate road degradation, and time the volume of traffic grows, even the heavy traffic one, thus requiring frequent repairs, any fault in maintenance could lead to severe incident outcomes with death and injury worldwide. The latest report (2023) states about 1.19 million people die each year as a result of road traffic crashes [
1]. This paper explores a novel approach to traffic sign and road damage detection using advanced deep learning techniques, to feed a Road Management System to be utilized by a Public Municipality. This work is in progress within the Molise CTE research project, funded by the Italian Minister of the Economic Growth (MIMIT), with the aim to leverage the best emerging technologies such as Cloud Computing, High Performance Computing, Artificial Intelligence, AR/VR to develop and demonstrate state of the art solution in the Smart City environment. The paper is structured as follows.
Section 2 introduces a Literature Review, with description of more recent trends in research about the topic, then
Section 3 provides a detailed description of the proposed solution, including information on the supporting cloud infrastructure.
Section 4 gives a description of Computational Experiments with relevant metrics, giving evidence of the effectiveness of the proposed solution.
Section 5 provides a description of Challenges and Solutions, while
Section 6 gives latest updates on the Integration of the solution with Municipal Maintenance Applications. Finally,
Section 7 describes further improvements under development, the benefits and exploitation opportunities, and concludes the paper.
2. Literature Review
The detection and classification of traffic signs and road damage are vital components of intelligent transportation systems. Recent advancements in deep learning have significantly enhanced the capabilities of these systems, making them more accurate and efficient. This literature review explores various methods and approaches used in traffic sign detection, classification, and road damage detection, with a particular focus on the use of YOLO architecture and Convolutional Neural Networks (CNNs).
2.1. Traffic Sign Detection and Classification
2.1.1. Seminal Papers
Early research laid the groundwork for the development of automated traffic sign detection and classification systems. These foundational works utilized various machine learning techniques that have since evolved into more advanced deep learning methods. An influential paper by Maldonado-Bascon et al. introduces an automatic road-sign detection and recognition system utilizing Support Vector Machines (SVMs). The system improves driver-assistance by effectively detecting and recognizing various road sign shapes through a combination of color segmentation, linear SVM-based shape classification, and Gaussian-kernel SVM recognition. The approach exhibits high success rates and robustness against transformations and occlusions [
2]. Another notable paper by Fang, Chen, and Fuh outlines a method for road sign detection and tracking using neural networks and Kalman filters. This system leverages neural networks to extract color and shape features and employs Kalman filters to track the detected signs through image sequences, maintaining robust performance under diverse environmental conditions [
3].
2.1.2. YOLO Architecture
The YOLO (You Only Look Once) architecture has emerged as a popular choice for object detection tasks due to its real-time processing capabilities and high accuracy. Several studies have demonstrated the effectiveness of YOLO in traffic sign detection. For instance, Yang and Zhang (2020) compared the performance of YOLOv4 and YOLOv3, finding that YOLOv4 significantly improved detection accuracy on a dataset of Chinese traffic signs [
4]. Similarly, Zhang (2023) showed that YOLOv3 outperformed R-CNN algorithms in terms of speed and accuracy for traffic sign detection [
5].
2.1.3. Enhancements in YOLO
Recent enhancements in YOLO include the development of lightweight models such as Sign-YOLO, which integrates the Coordinate Attention (CA) module and High-BiFPN to improve feature extraction and multi-scale semantic information fusion. This model achieved significant improvements in precision, recall, and detection speed on the CCTSDB2021 dataset [
6]. Another example is the PVF-YOLO model, which uses Omni-Dimensional Convolution (ODconv) and Large Kernel Attention (LKA) to enhance detection accuracy and speed [
7].
2.1.4. Traffic Sign Classification
After detection, traffic signs need to be classified into specific categories. Convolutional Neural Networks (CNNs) have been widely used for this purpose due to their strong feature extraction capabilities. Ciresan et al. (2012) employed a CNN-based approach to classify German traffic signs, achieving state-of-the-art results [
8]. Additionally, improved YOLO models like TSR-YOLO have incorporated advanced modules to enhance accuracy in complex scenarios [
9].
2.1.5. Traffic Sign Damage Classification
To the best of our knowledge, only two papers address traffic sign damage classification comprehensively. Ana Trpkovic, Milica Selmic, and Sreten Jevremovic (2021) developed a CNN model to identify and classify damaged and vandalized traffic signs [
10]. Another significant contribution is by J. N. Acilo et al. (2018), who presented a study titled ”Traffic Sign Integrity Analysis Using Deep Learning.” This research employed transfer learning with the ResNet-50 architecture to classify the compliance and physical degradation status of traffic signs, achieving high accuracy [
11].
2.1.6. Generative AI
In this section, we describe the application of Generative Artificial Intelligence (Generative AI) for creating synthetic data to balance the dataset of damaged traffic signs. We utilized Generative Adversarial Networks (GANs), specifically the Deep Convolutional GAN (DCGAN), to generate realistic images of damaged traffic signs. This approach allowed us to address the dataset imbalance issue, improving the performance of the sign recognition model. Previous studies have demonstrated the effectiveness of synthetic data generated by GANs in enhancing the accuracy of traffic sign recognition models [
20].
2.2. Road Damage Detection
2.2.1. Dataset Utilization
Public datasets such as Mappilary and the Road Damage Detection (RDD) dataset provide comprehensive collections of annotated images for training and evaluating models. These datasets cover various types of road damage, including potholes, cracks, and surface wear, facilitating the development of robust detection models.
2.2.2. Deep Learning Approaches
Deep learning approaches, particularly those using CNNs and YOLO architectures, have shown significant advancements in road damage detection. Zhang et al. (2018) employed a deep CNN model to detect road cracks from images, achieving high precision and recall rates [
12]. Similarly, Maeda et al. (2018) applied YOLO to detect multiple types of road damage, demonstrating the model’s effectiveness in real-world scenarios [
13].
2.3. GPS Data
2.3.1. Integration of GPS Data
M. Strutu, G. Stamatescu, and D. Popescu (2013) introduced a mobile sensor network- based system for monitoring road surfaces, incorporating 3D accelerometers, GPS, and video modules. Their research demonstrated the effectiveness of integrating multiple sensors for comprehensive road monitoring [
14]. Similarly, M. Perttunen et al. (2011) developed a system for detecting road surface anomalies using accelerometers and GPS readings from mobile phones. Their pattern recognition system showcased the potential of mobile devices in monitoring road conditions effectively [
15]. Furthermore, R. Tarun and B. P. Esther (2023) created an affordable road sign detection system utilizing a Raspberry Pi and GPS. Their system achieved high detection precision and demonstrated efficient real-time operation [
16].
2.4. Additional Insights from Recent Advances
Recent advances in traffic sign recognition have explored a variety of machine learning and deep learning techniques. Lim et al. (2023) provided a comprehensive overview of these advancements, highlighting the importance of preprocessing techniques, feature extraction methods, classification techniques, and the use of diverse datasets to address the challenges posed by different geographical regions, complex backgrounds, and varying illumination conditions [
17].
Key contributions from recent studies include:
A comprehensive review of state-of-the-art traffic sign recognition work, categorizing studies into conventional machine learning and deep learning approaches.
Discussion of widely adopted traffic sign recognition datasets, their challenges, and limitations, as well as future research prospects in this field.
Emphasis on the importance of diverse datasets for improving model generalization and robustness.
2.5. Summary
The detection and classification of traffic signs and road damage using deep learning techniques, particularly YOLO and CNNs, have shown significant advancements. The integration of GPS data enriches time series analysis with spatial information, improving the ability to monitor and predict road conditions. For example, by combining GPS data with sensor readings, it is possible to identify specific patterns related to certain routes or road conditions that influence wear and tear. This approach enables the implementation of more accurate predictive maintenance strategies, allowing interventions before failures occur [
21]. This literature review highlights the state- of-the-art methods and approaches, underscoring the potential of these technologies in improving road safety and maintenance.
3. Methodology
3.1. First Datasets
Mapillary
Mapillary Vistas Dataset is a large-scale street-level imagery dataset designed for train- ing and evaluating semantic segmentation models. This dataset is highly diverse, covering a wide range of environments, lighting conditions, and geographical locations. It includes various types of road signs, objects, and infrastructure commonly found in urban, sub- urban, and rural areas. The dataset is particularly useful for developing and testing algorithms for autonomous driving and urban planning applications [
18].
Classes: 401
Images: 41,906
Size: 32.8 GB
The dataset is split into training and validation sets, with 80% of the images used for training and 20% reserved for validation.
RDD 2022
The Road Damage Detection (RDD) 2022 dataset focuses on identifying and classifying different types of road surface damages. This dataset includes annotated images of road damage from various countries, making it a valuable resource for training machine learning models aimed at improving road maintenance and safety. The primary goal of using this dataset is to detect and classify road damages such as cracks, potholes, and other surface irregularities [
19].
Classes: 4
Images: 34,007
Size: 9.6 GB
Similar to the Mapillary dataset, the RDD 2022 dataset is also divided into an 80% training set and a 20% validation set. This split ensures that the models can be trained effectively while also being evaluated on a separate set of images to test their performance and generalization capabilities.
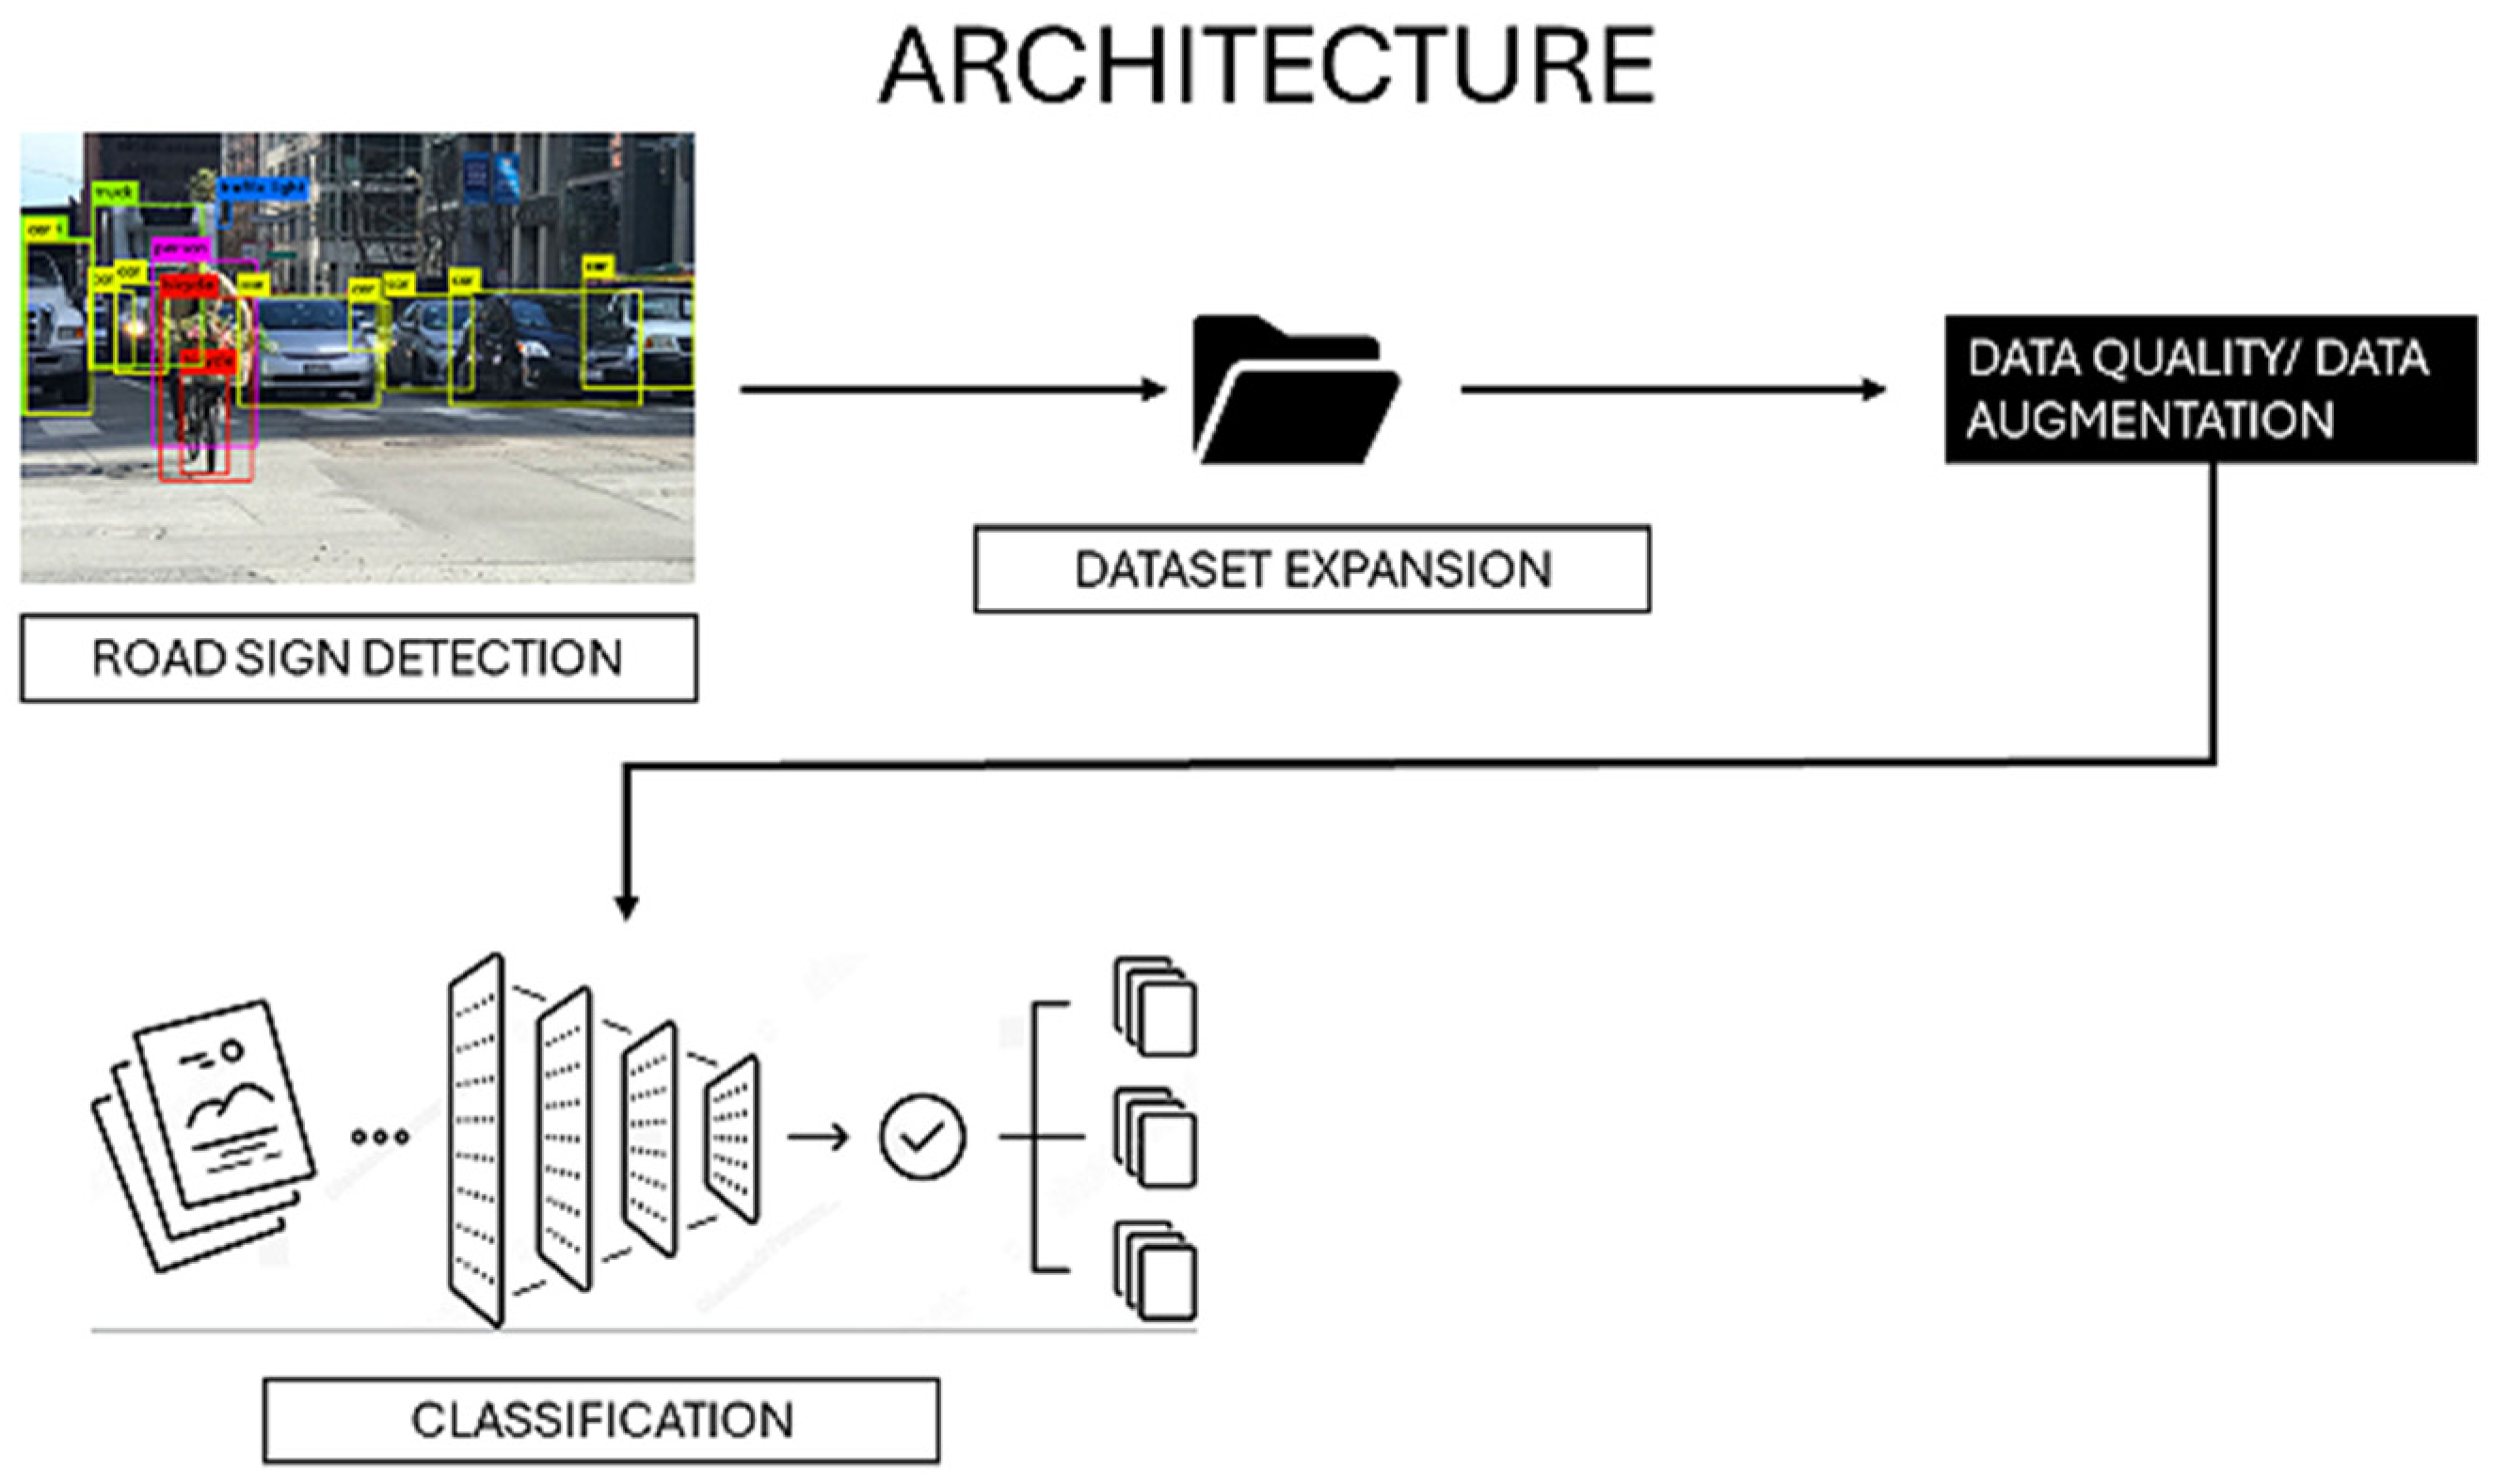
A comprehensive representation of the architecture for the road sign detection and classification system is depicted in
Figure 1. For road damage, detection alone is sufficient, as these are already considered anomalies; therefore, the Yolo model is adequate.
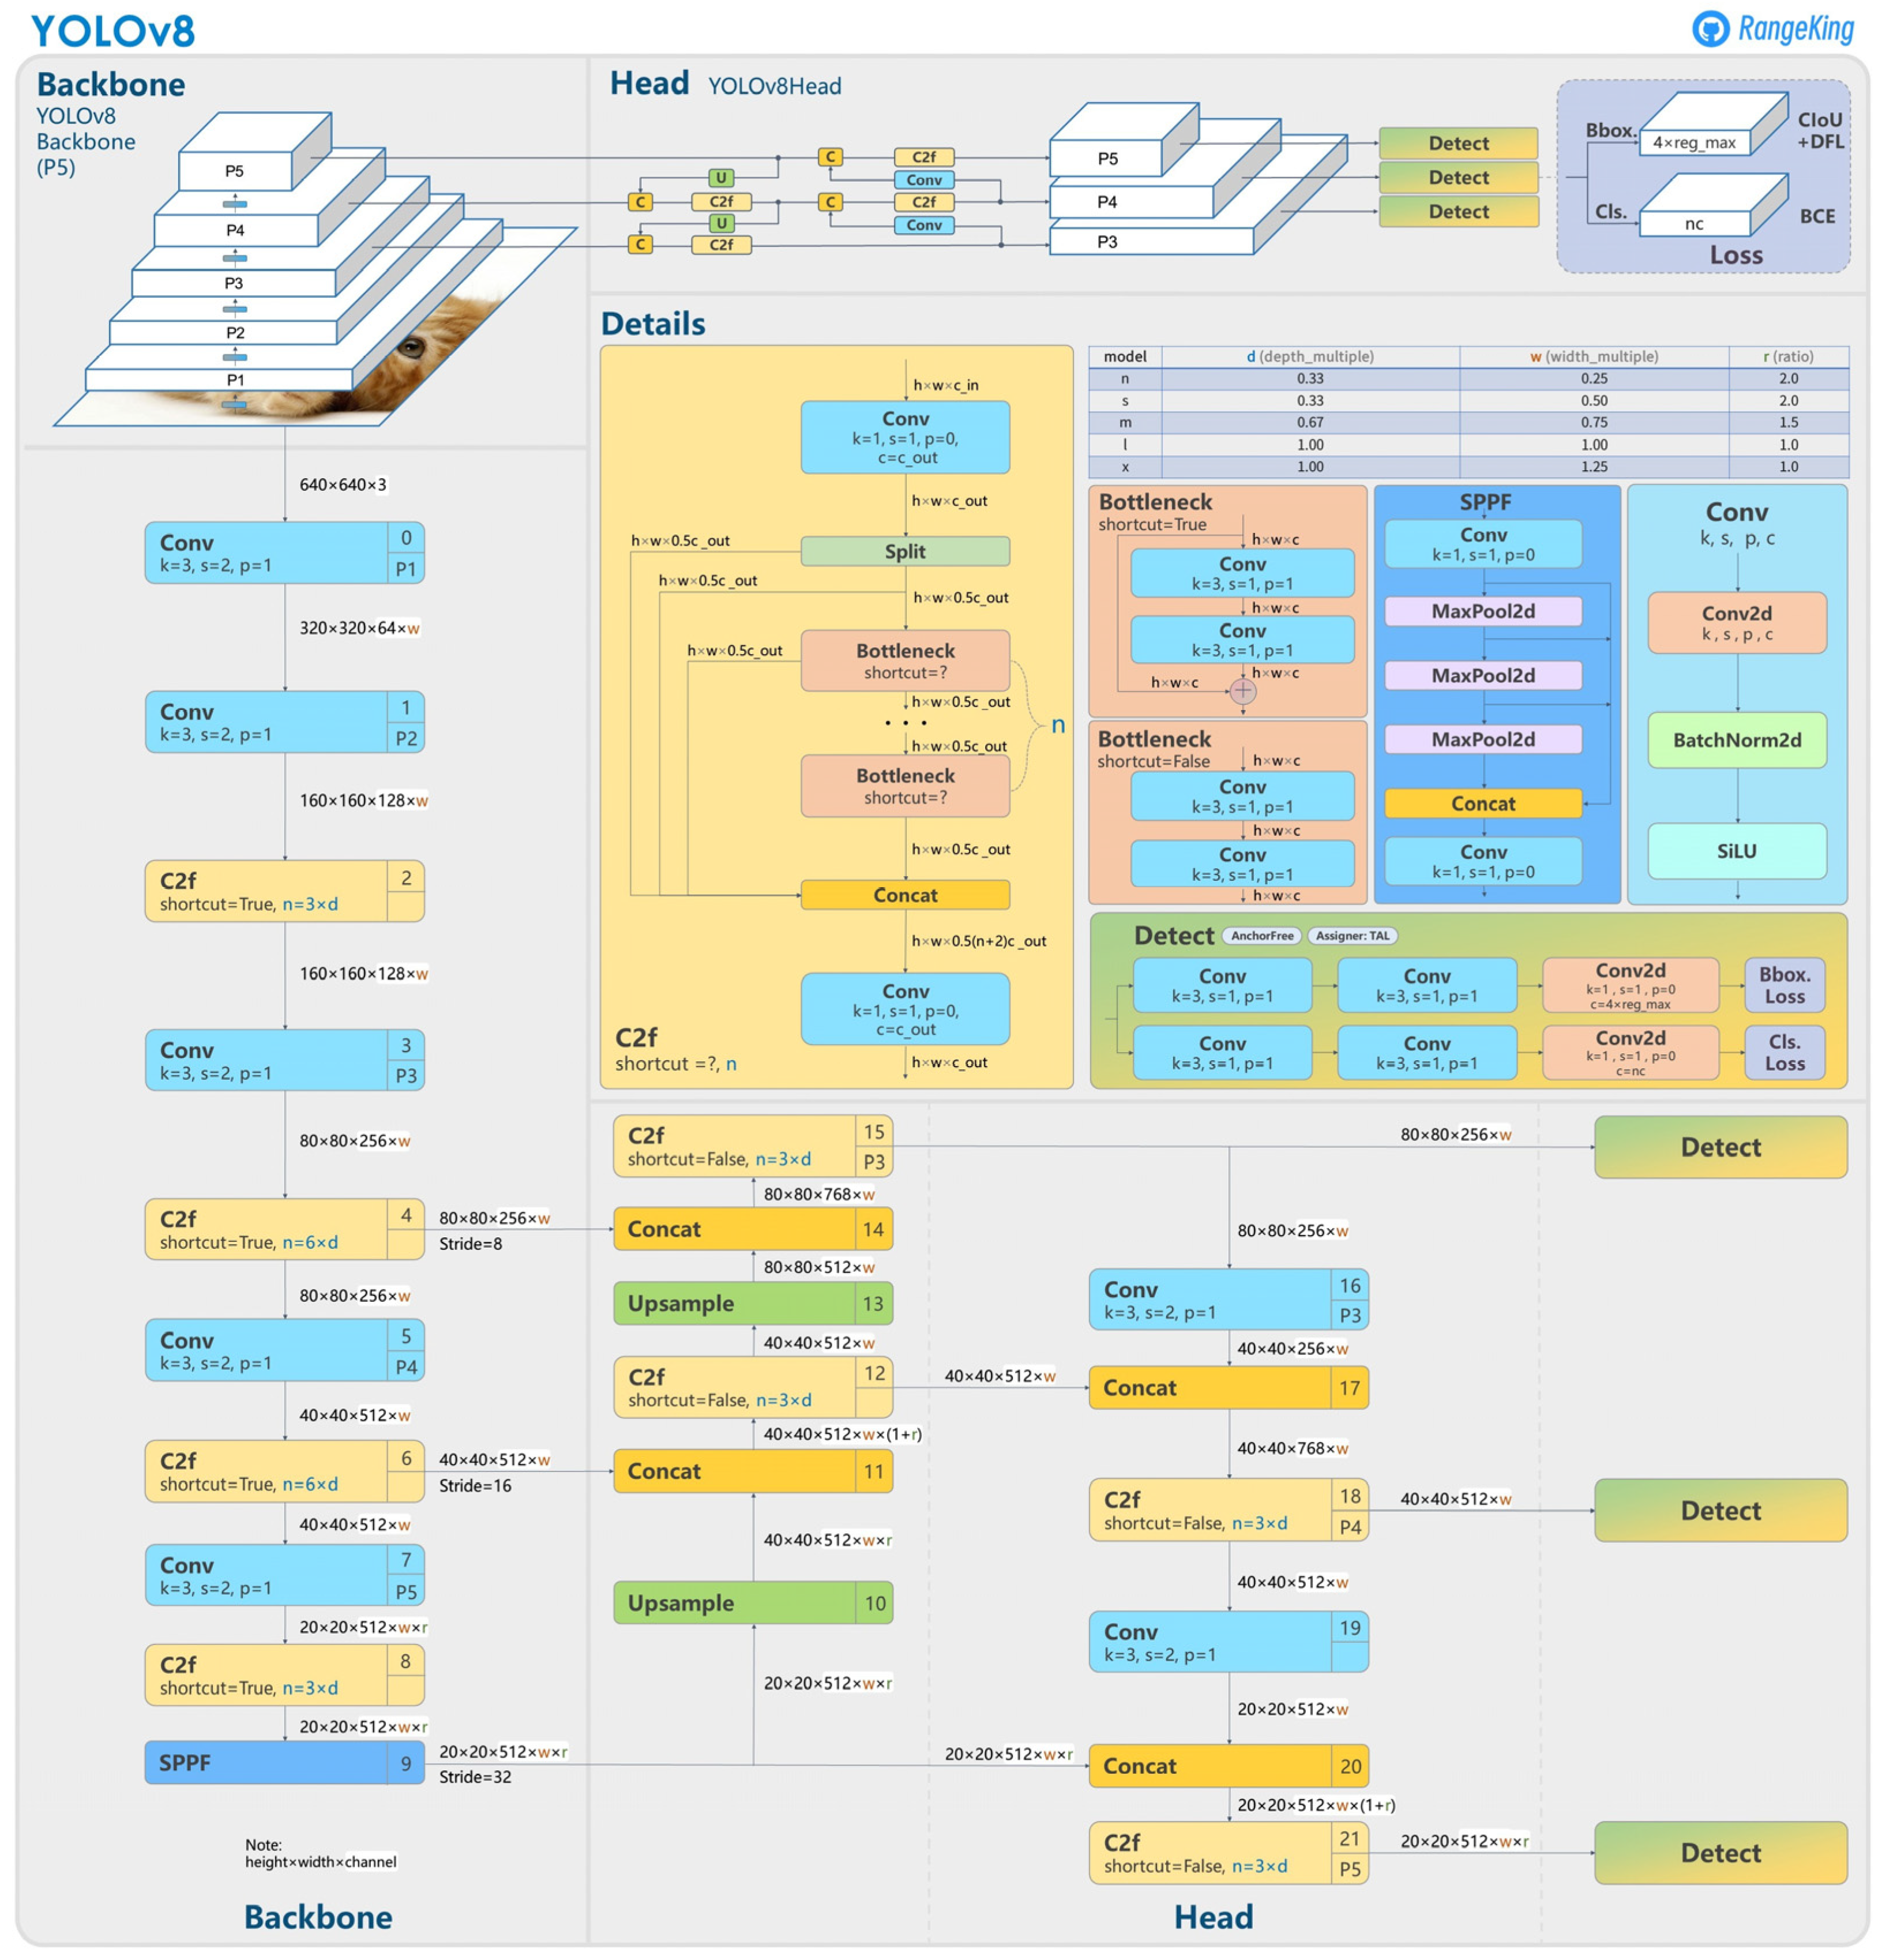
The structure of YOLOv8 is illustrated in
Figure 2. Please refer to this figure for a detailed understanding of the model architecture.
3.2. First Phase
Before training the YOLO architectures, data manipulation is essential to ensure opti mal performance and accuracy. The data manipulation techniques include the following:
Data Augmentation: This involves applying various transformations to the train- ing images, such as rotations, scaling, flipping, and color adjustments. These techniques help to increase the diversity of the training data and make the model more robust to different conditions.
Normalization: Image pixel values are scaled to a standard range, typically be- tween 0 and 1, to ensure uniformity and improve the convergence of the modelduring training.
Label Smoothing: This technique is used to reduce overfitting by softening the hard labels in the training data, making the model less confident in its predictions and improving generalization.
Anchor Box Calculation: Custom anchor boxes are computed based on the dataset to improve the detection accuracy of the YOLO model, especially for objects of various sizes.
YOLOv8s for Road Surface Damages Detection
YOLOv8s is a specific architecture within the YOLO (You Only Look Once) family, optimized for real-time object detection with a balance between speed and accuracy. It is particularly suitable for detecting road surface damages due to its efficient design.
Pretrained: Yes
Epochs: 160
Image Size: 640
Patience: 100
Cache: RAM
Device: GPU
Batch Size: 64
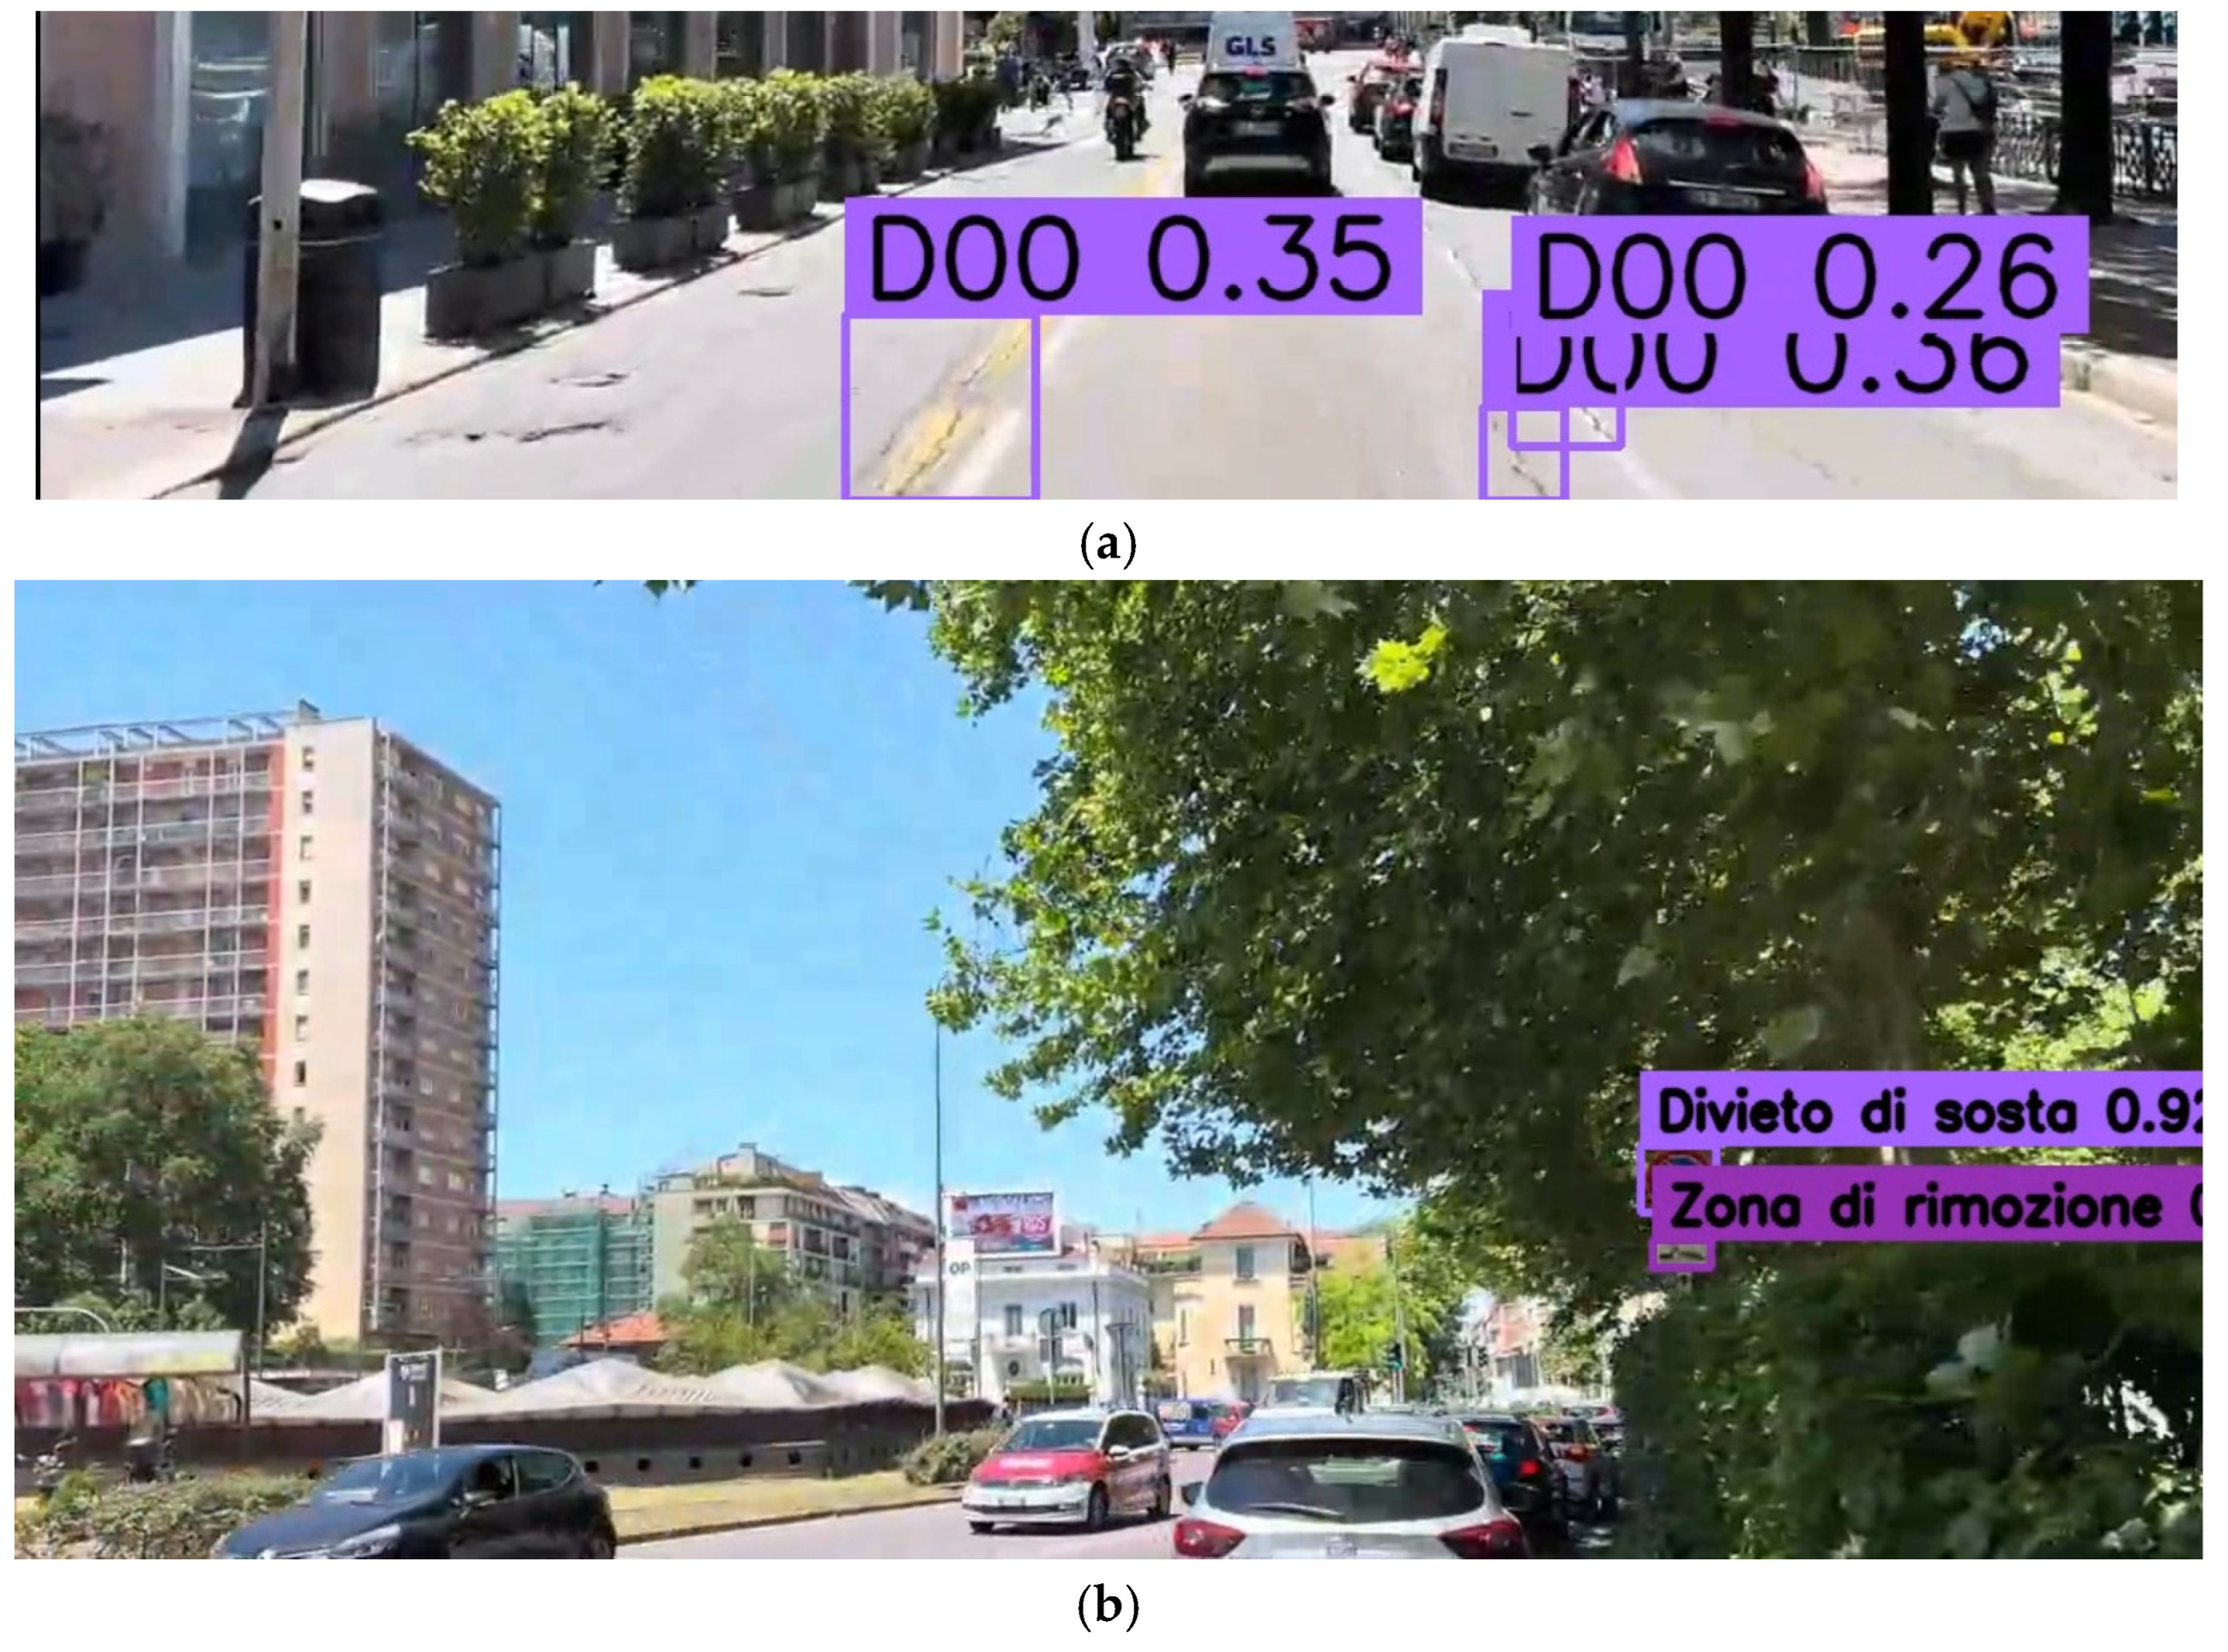
An example of a Road Damage detection is shown in
Figure 3a.
YOLOv8x for Road Signs Detection
YOLOv8x is a larger and more powerful version of the YOLO architecture, designed for detecting objects with higher precision and accuracy. This makes it well-suited for the detailed task of road signs detection.
Pretrained: Yes
Epochs: 100
Image Size: 640
Patience: 100
Cache: RAM
Device: GPU
Batch Size: Auto
3.3. First Step
Once the YOLO model was trained, we needed to build a dataset for the classification of road signs. To achieve this, we took videos recorded with a dashcam on the road and processed them with YOLO, which cropped the road signs from the frames. The cropped signs were then labeled as damaged or not damaged based on the following criteria:
Signs covered with spray-painted graffiti
Signs covered with stickers
Bent or physically damaged signs
Rusty signs
The resulting dataset, in preliminary tests, is unbalanced, with 6025 damaged and 34315 not damaged signs. To address this imbalance, we employed two advanced techniques:
Focal Loss: This loss function is designed to handle class imbalance by assigning more weight to hard-to-classify examples, reducing the impact of easily classified examples, and improving model performance on imbalanced data.
Cutout Regularization: This technique involves randomly removing sections of the image during training. It helps improve model robustness and prevent overfitting, thereby enhancing the model’s ability to generalize to new data.
These techniques allow us to effectively manage the dataset imbalance and improve the accuracy of classifying damaged and undamaged road signs.
3.4. Second Step
In this phase, we enhanced our Convolutional Neural Network (CNN) by integrating attention mechanisms to improve the classification of road signs as damaged or not dam- aged. The CNN architecture and training process, with these modifications, are described as follows:
The enhanced CNN model includes the following layers and mechanisms:
Input Layer: Accepts images of size 128x128x3 (height, width, color channels).
-
Convolutional Layers with Attention:
- –
Three convolutional blocks, each with a 2D convolutional layer followed by
Batch Normalization and ReLU activation.
- –
Channel Attention module in each block to focus on the most relevant feature channels.
- –
Spatial Attention module in each block to emphasize the most important spatial regions.
- –
Max-Pooling layer after each attention-enhanced convolutional block to reduce the spatial dimensions.
The model was compiled using the Adam optimizer and the Focal Loss function, which is particularly effective for handling class imbalance by assigning more weight to hard- to-classify examples.
3.4.1. Attention Mechanisms
Channel Attention: Enhances feature maps by focusing on significant channels, allowing the model to emphasize important features such as small damages or scratches.
Spatial Attention: Highlights crucial spatial regions in the image, improving the model’s ability to detect subtle anomalies on road signs.
3.4.2. Data Augmentation and Regularization
To further improve the model’s robustness and generalization capability, we applied extensive data augmentation techniques, including:
Horizontal and vertical flips.
Random rotations, width and height shifts.
Shear and zoom transformations.
Additionally, Cutout regularization was implemented by randomly masking sections of the input images during training to enhance the model’s robustness to occlusions and partial visibility of the signs.
3.4.3. Training and Evaluation
The training process involved:
Training the model for 10 epochs with a batch size of 32.
Using an 80-20 split for training and validation data to ensure a balanced evaluation.
Employing a learning rate reduction technique with the ReduceLROnPlateau call- back, which decreased the learning rate by a factor of 0.5 if the validation accuracy did not improve for 3 consecutive epochs.
Saving the best-performing model during training based on validation accuracy using the ModelCheckpoint callback.
An example of a Traffic Sign detection is shown in
Figure 3b.
CNN
The final evaluation on the validation set showed a 90% accuracy of the CNN architecture. The introduction of attention mechanisms significantly enhanced the model’s ability to distinguish between damaged and non-damaged signs, particularly in challenging cases involving minor damages or occlusions.
3.5. Gen AI
StableDiffusion is a generative AI-based approach designed to mitigate the class imbalance in our dataset (6025 images of damaged traffic signs and 34315 of non-damaged ones). Specifically, we fine-tuned a Stable Diffusion model with images of healthy and damaged traffic signs to generate 18,000 synthetic images, effectively tripling the size of the damaged class. This approach improved the model’s ability to correctly recognize and classify damaged signs.
Stable Diffusion v2.1 was chosen for its superior text-to-image and image-to-image generation capabilities, allowing fine-grained control over the appearance of synthetic traffic signs.
The model was conditioned both on existing traffic sign images (image-to-image generation) and textual descriptions of damage types, allowing fine-tuned control over the output.
Contrastive Loss ensures that generated damaged and non-damaged traffic signs have distinct features, improving discrimination in classification tasks; Perceptual Loss (LPIPS) ensures generated images remain visually realistic and consistent with real-world traffic signs.
Damage Types: Graffiti, rust, stickers, physical deformations, fading
4. Computational Experiments
4.1. Computational Characteristics
The training of the YOLO models was conducted using Google Colab, leveraging the NVIDIA Tesla T4 GPU. Google Colab provides a high-performance computing environ- ment suitable for deep learning tasks. The key specifications of the hardware used are as follows:
-
GPU: NVIDIA Tesla T4
- –
CUDA Cores: 2560
- –
Tensor Cores: 320
- –
GPU Memory: 16 GB GDDR6
- –
Memory Bandwidth: 320 GB/s
- –
Performance: Up to 8.1 TFLOPS (FP32)
-
CPU: Intel(R) Xeon(R) CPU
- –
vCPUs: 2 (Base Frequency: 2.3 GHz)
− RAM: 12.7 GB available in the Colab environment
− Disk: 100 GB available storage
For the CNN, training was performed on Reevo servers with the following specifications:
The combination of these computational resources provided a robust environment for training and validating the deep learning models, enabling efficient processing of large datasets and complex computations required for road sign detection and classification.
4.2. Metrics for Performance Evaluation
To evaluate the performance of the YOLOv8x model for road sign detection, we analyzed several key metrics, including accuracy, box loss, and object loss. These metrics provide insights into the model’s effectiveness in detecting and classifying road signs accurately.
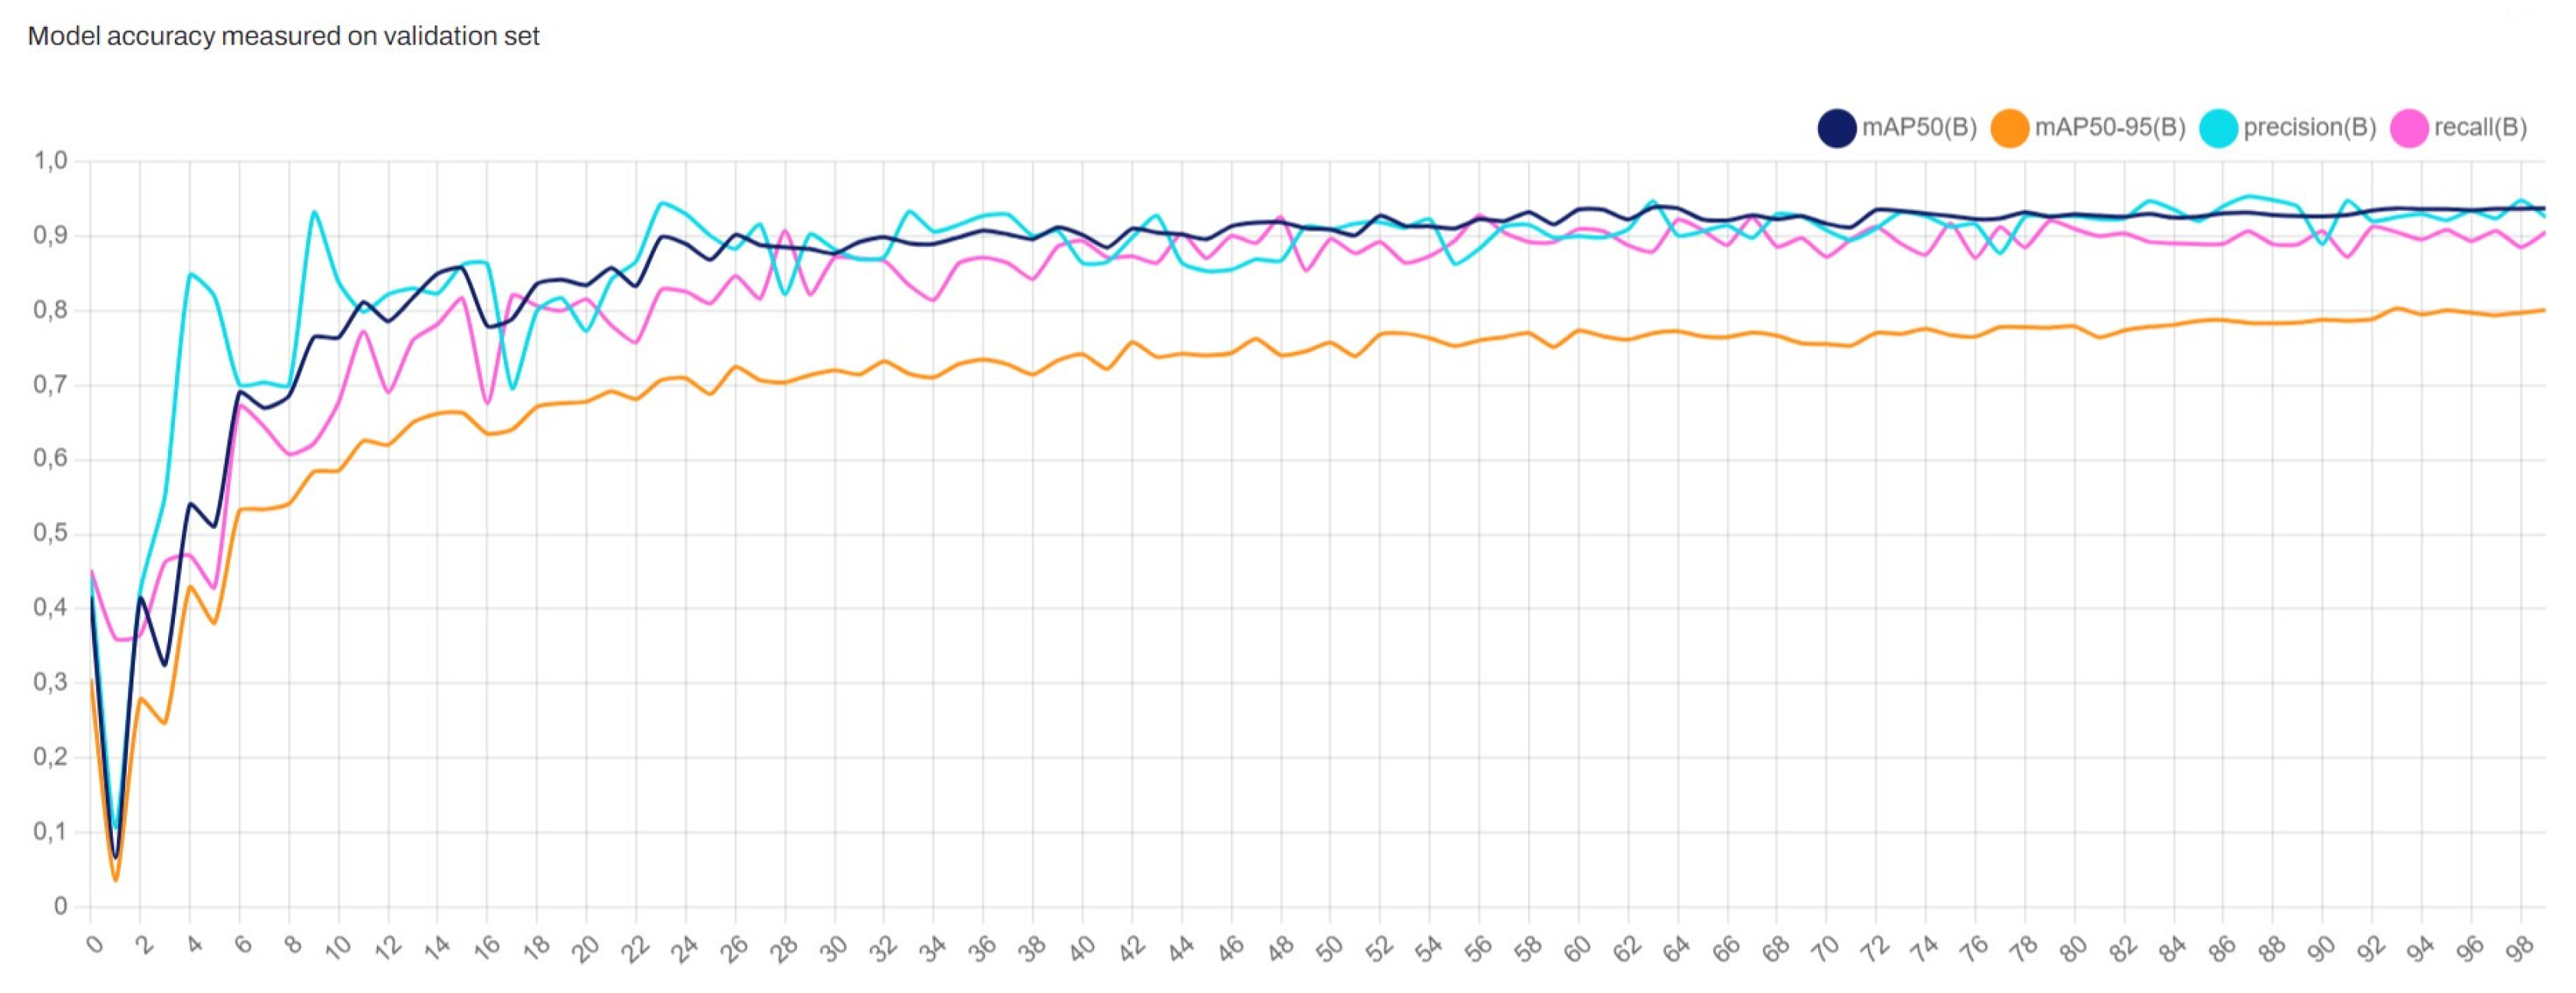
4.2.1. YOLOv8x Accuracy
Figure 4 shows the accuracy of the YOLOv8x model over the training epochs. The accuracy metric includes the mean Average Precision (mAP) at different Intersection over Union (IoU) thresholds and other performance metrics such as precision and recall. Specifically, we track:
mAP50: Mean Average Precision at 50% IoU threshold.
mAP50-95: Mean Average Precision averaged over IoU thresholds from 50
Precision: The ratio of true positive detections to the total number of positive detections (true positives + false positives).
Recall: The ratio of true positive detections to the total number of actual positives (true positives + false negatives).
The graph indicates the following trends:
The mAP50 metric (blue line) shows a steady improvement, stabilizing around 0.9, indicating a high level of accuracy for the model in detecting objects with a 50% IoU threshold.
The mAP50-95 metric (orange line) improves gradually, reflecting the model’s performance across a wider range of IoU thresholds. It stabilizes around 0.7, show- casing the model’s robustness in varying detection conditions.
Precision (cyan line) shows fluctuations but generally trends upwards, indicating improvements in the model’s ability to reduce false positives over time.
Recall (magenta line) also improves and stabilizes around 0.8, demonstrating the model’s effectiveness in capturing most of the actual positive instances.
Overall, these metrics collectively provide a comprehensive overview of the YOLOv8x model’s performance in detecting and classifying road signs. The continuous improvement in accuracy metrics throughout the training process indicates the model’s effectiveness and robustness in handling the task of road sign detection.
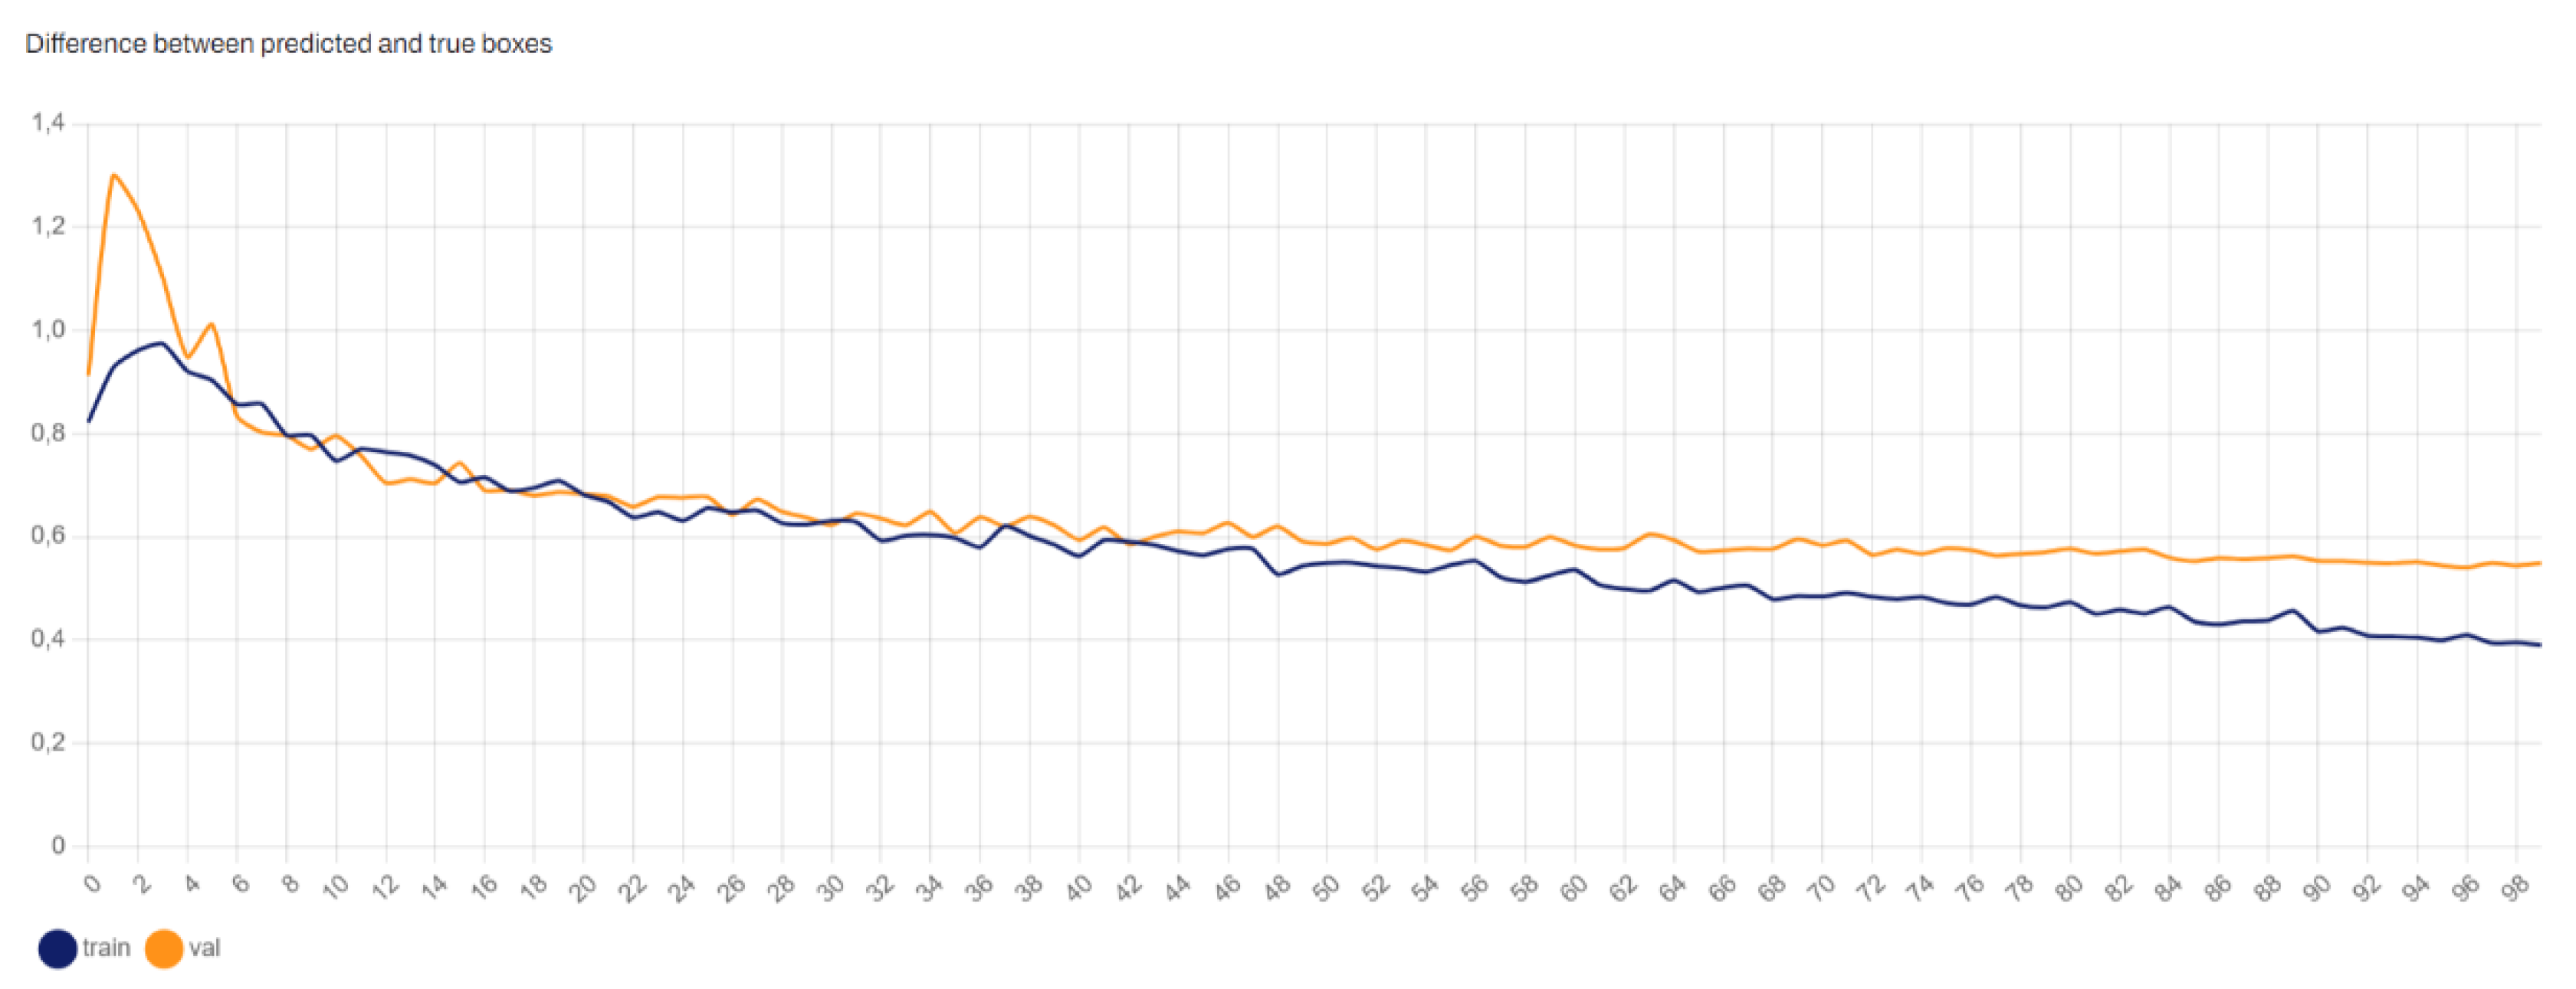
4.2.2. YOLOv8x Box Loss
Figure 5 illustrates the box loss during training. Box loss measures the error in predicting the bounding boxes for detected objects. It is a crucial metric for object detection models as it directly affects the precision of the detected objects’ locations. Lower box loss values indicate more accurate predictions of the bounding box coordinates.
The graph shows that the box loss decreases significantly during the initial epochs and stabilizes over time, indicating that the model is learning to accurately predict the bounding box locations of the road signs.
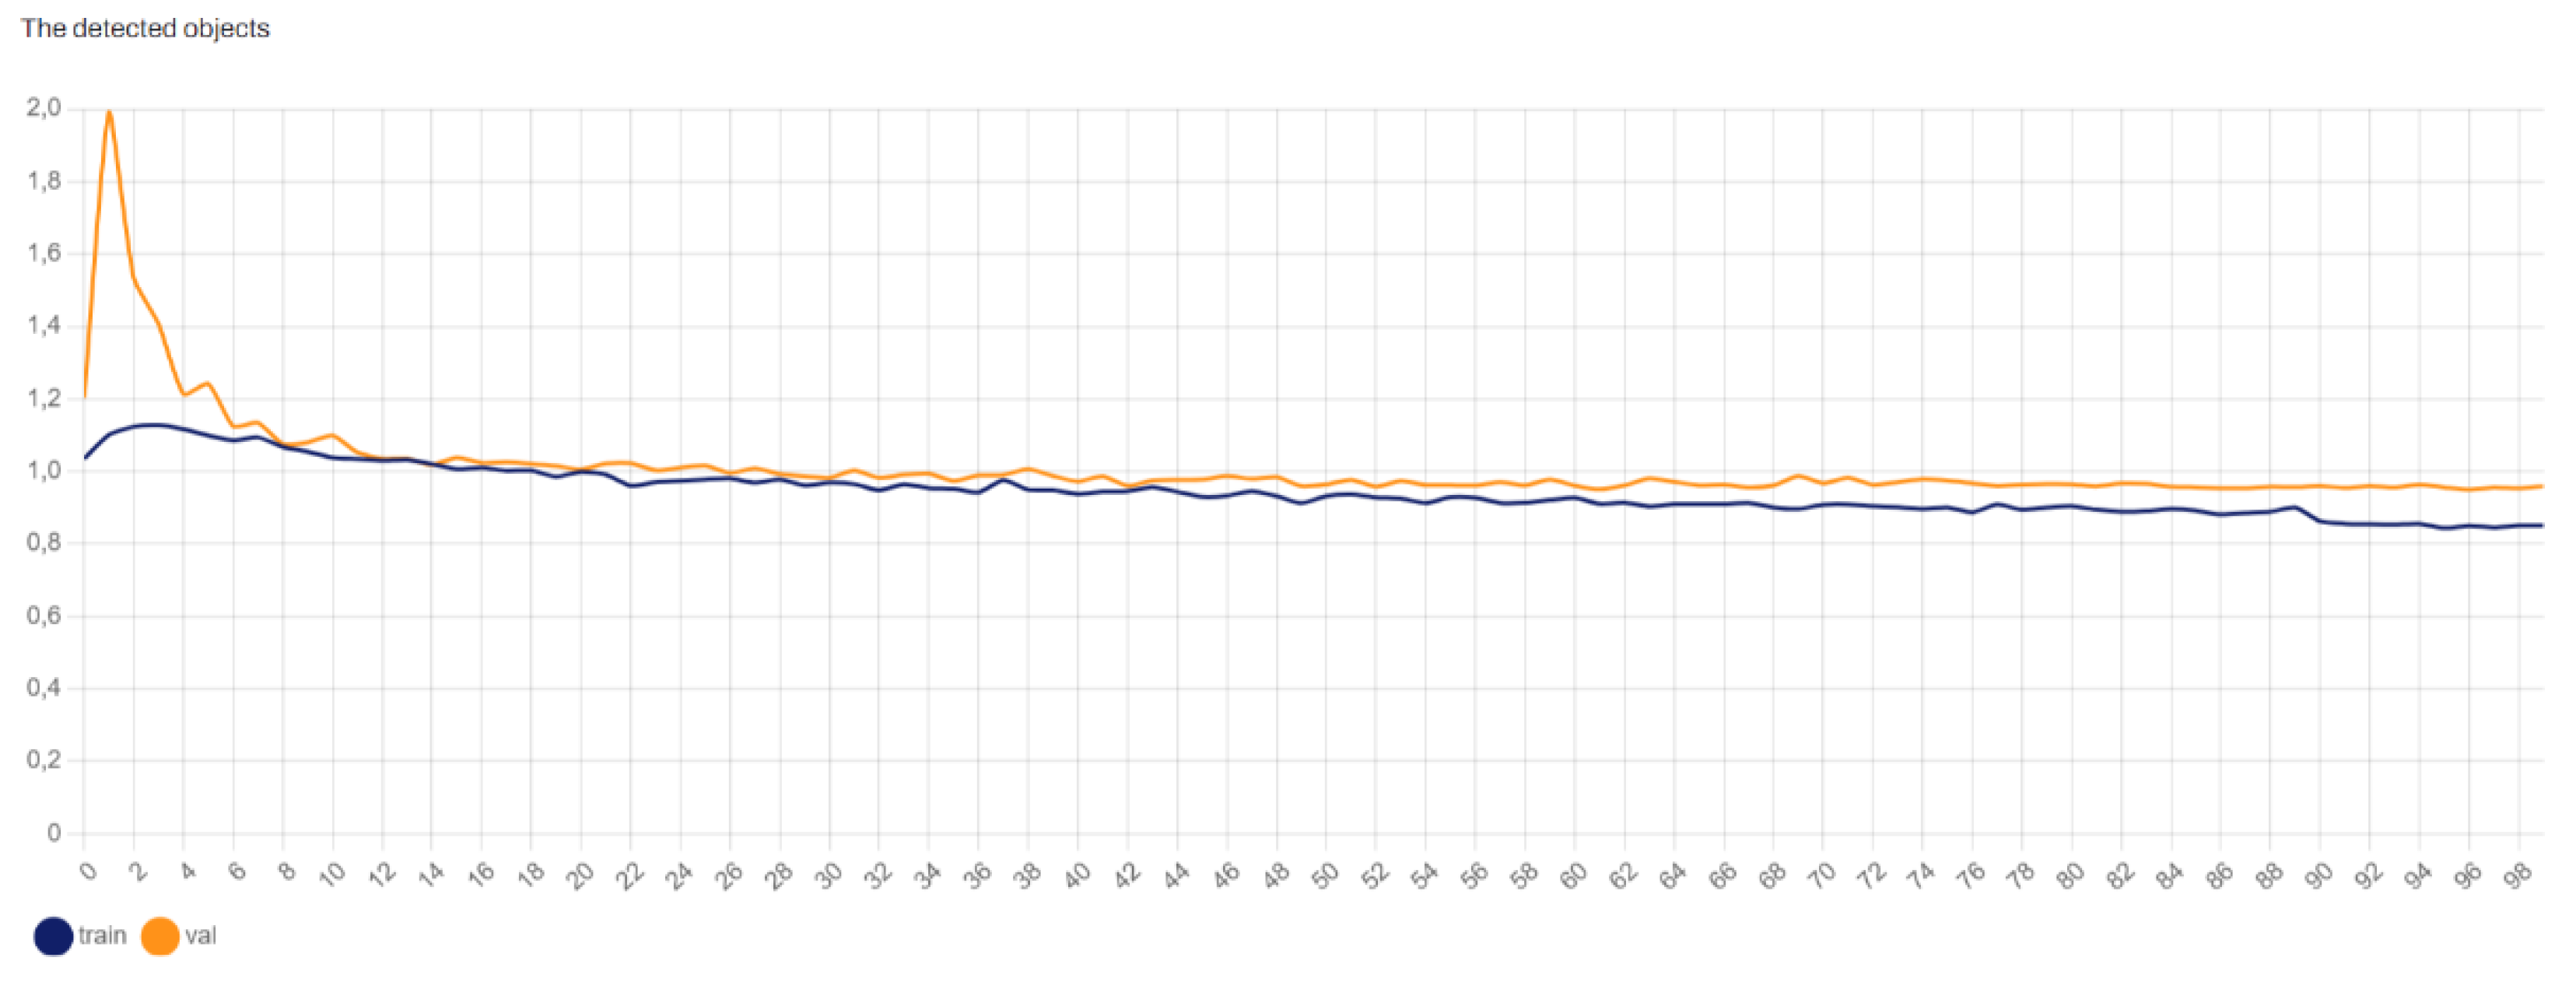
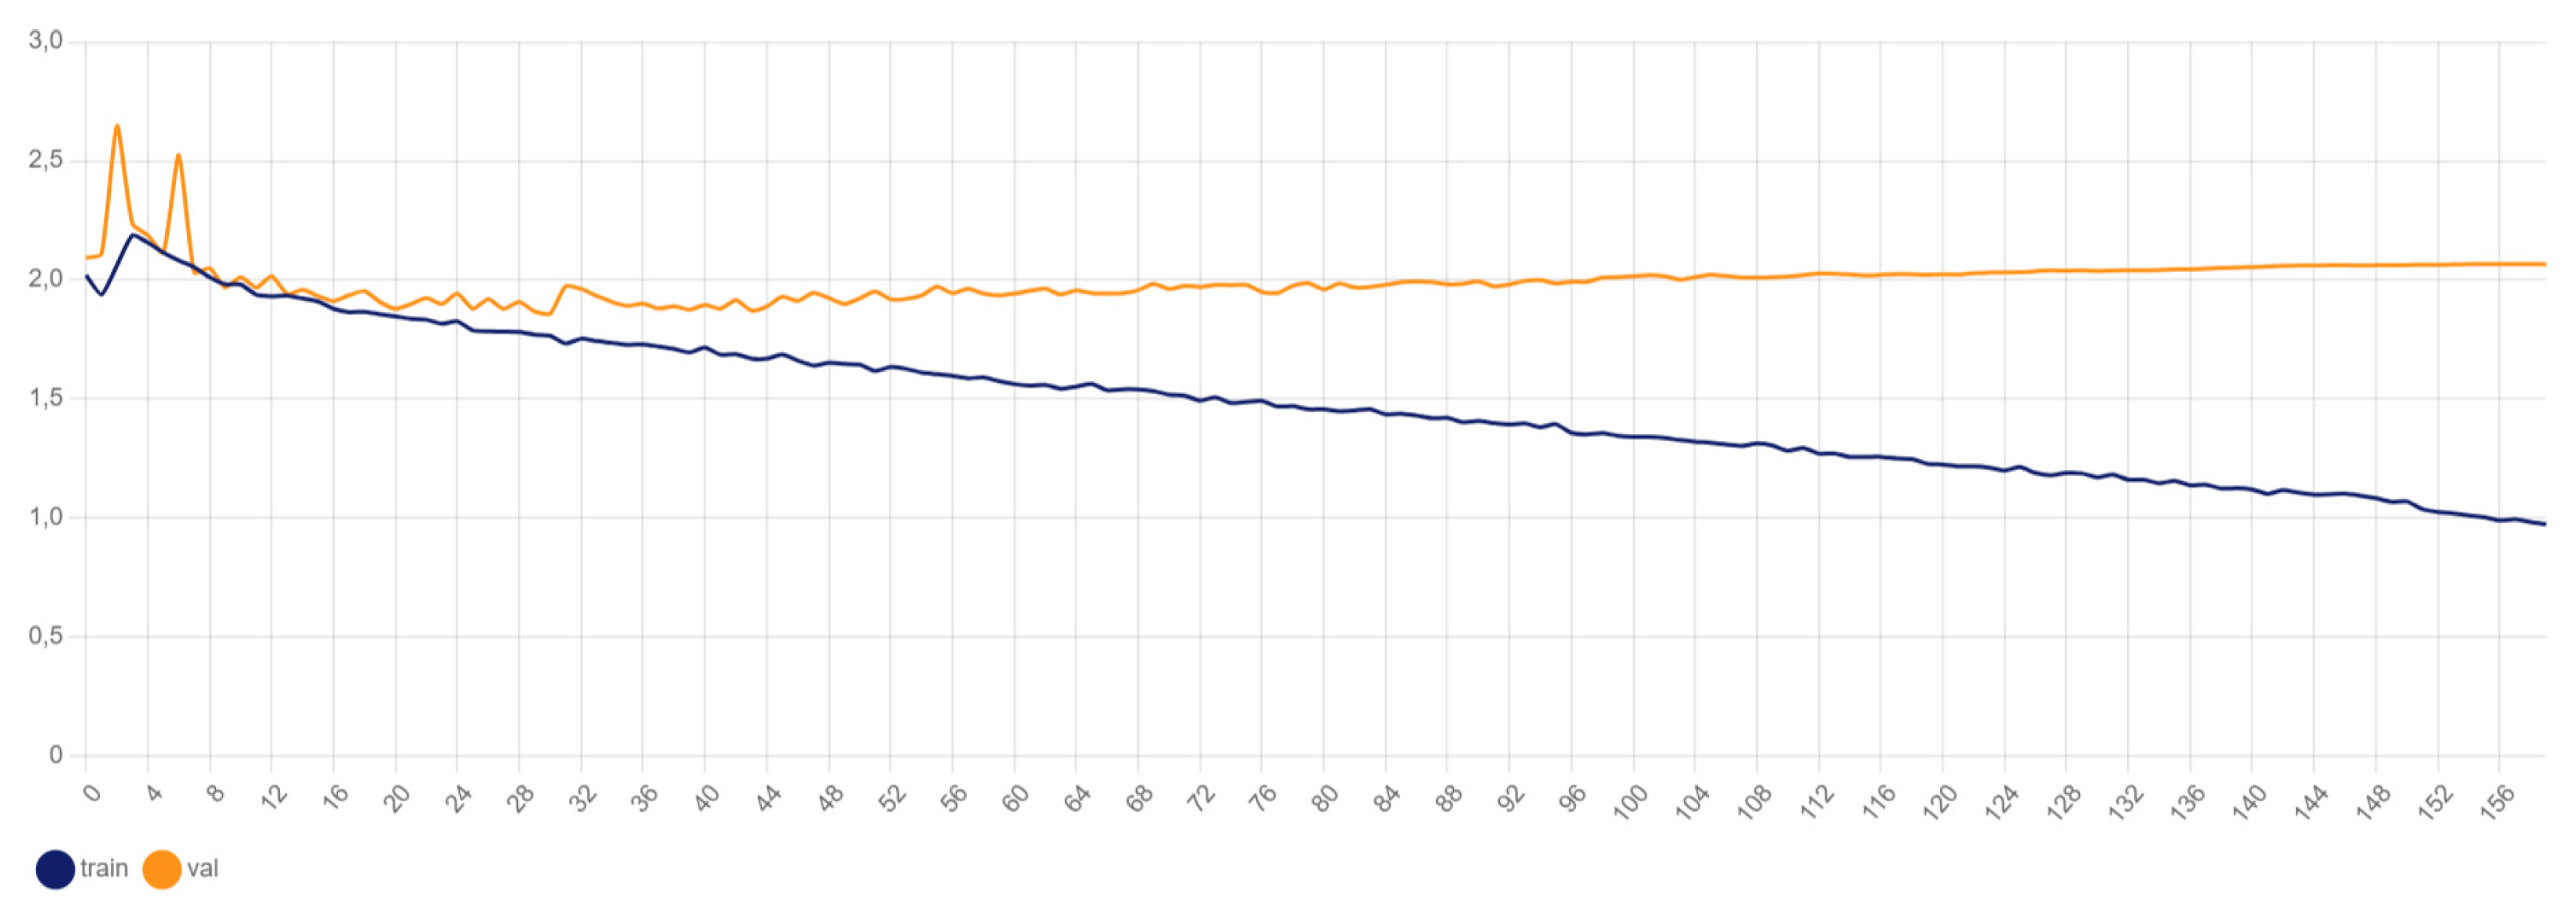
4.2.3. YOLOv8x Object Loss
Figure 6 presents the object loss over the training epochs. Object loss evaluates the error in classifying whether a particular region in the image contains an object of interest. Lower object loss values reflect the model’s enhanced capability to distinguish between objects and the background, leading to more reliable detections.
The graph indicates that the object loss decreases rapidly during the initial epochs and then gradually stabilizes, suggesting that the model becomes increasingly proficient at distinguishing between road signs and background noise as training progresses.
These metrics collectively provide a comprehensive overview of the YOLOv8x model’s performance in detecting and classifying road signs. The continuous improvement in ac- curacy and reduction in both box and object loss throughout the training process indicate the model’s effectiveness and robustness in handling the task of road sign detection.
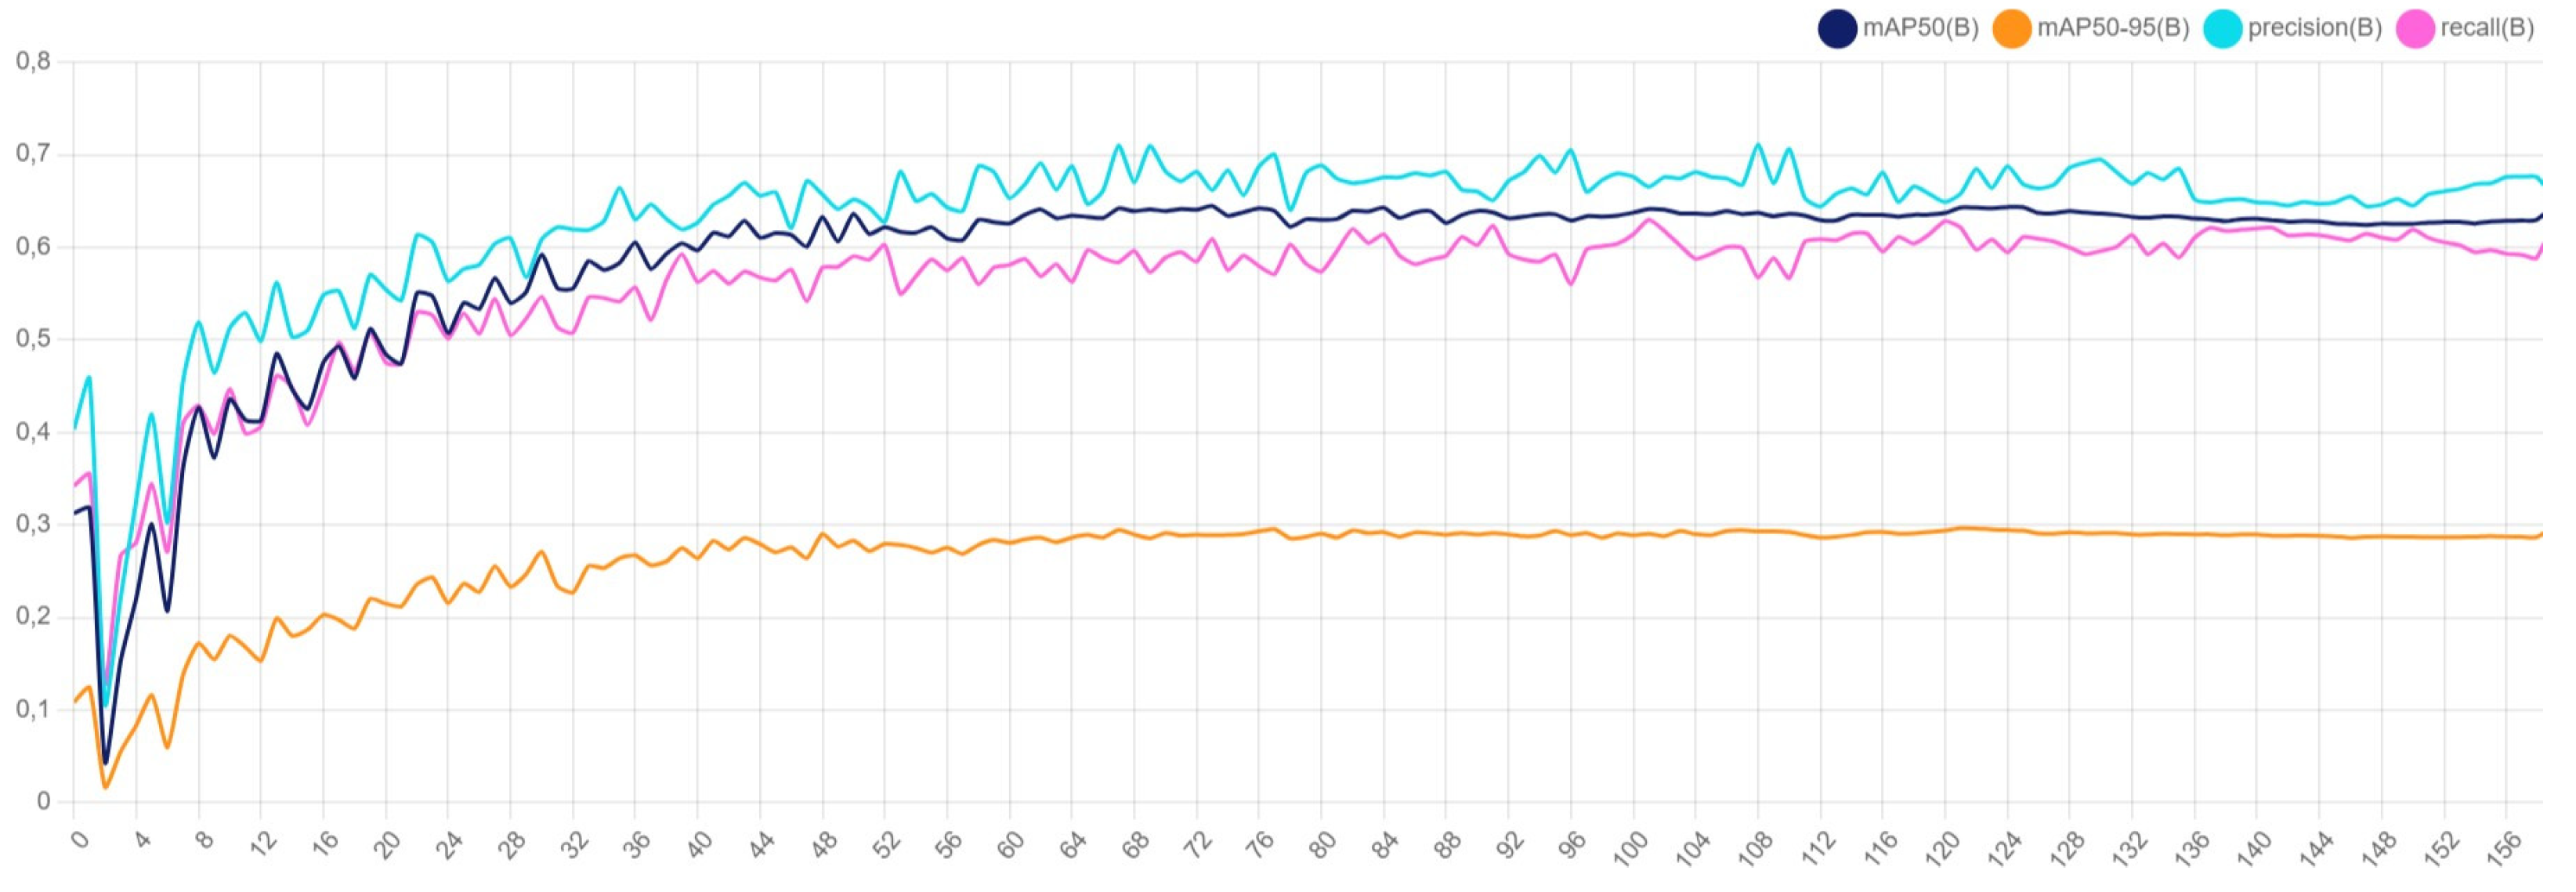
A similar analysis applies to YOLOv8s, which is used for detecting road surface damages. The following observations were made:
Accuracy: The accuracy metrics for YOLOv8s, as shown in
Figure 7, indicate steady improvement over epochs, with metrics such as mAP50, mAP50-95, precision, and recall showing consistent performance gains.
Box Loss: As shown in
Figure 8, the box loss decreases over time, indicating improved precision in predicting the bounding box locations for road damages.
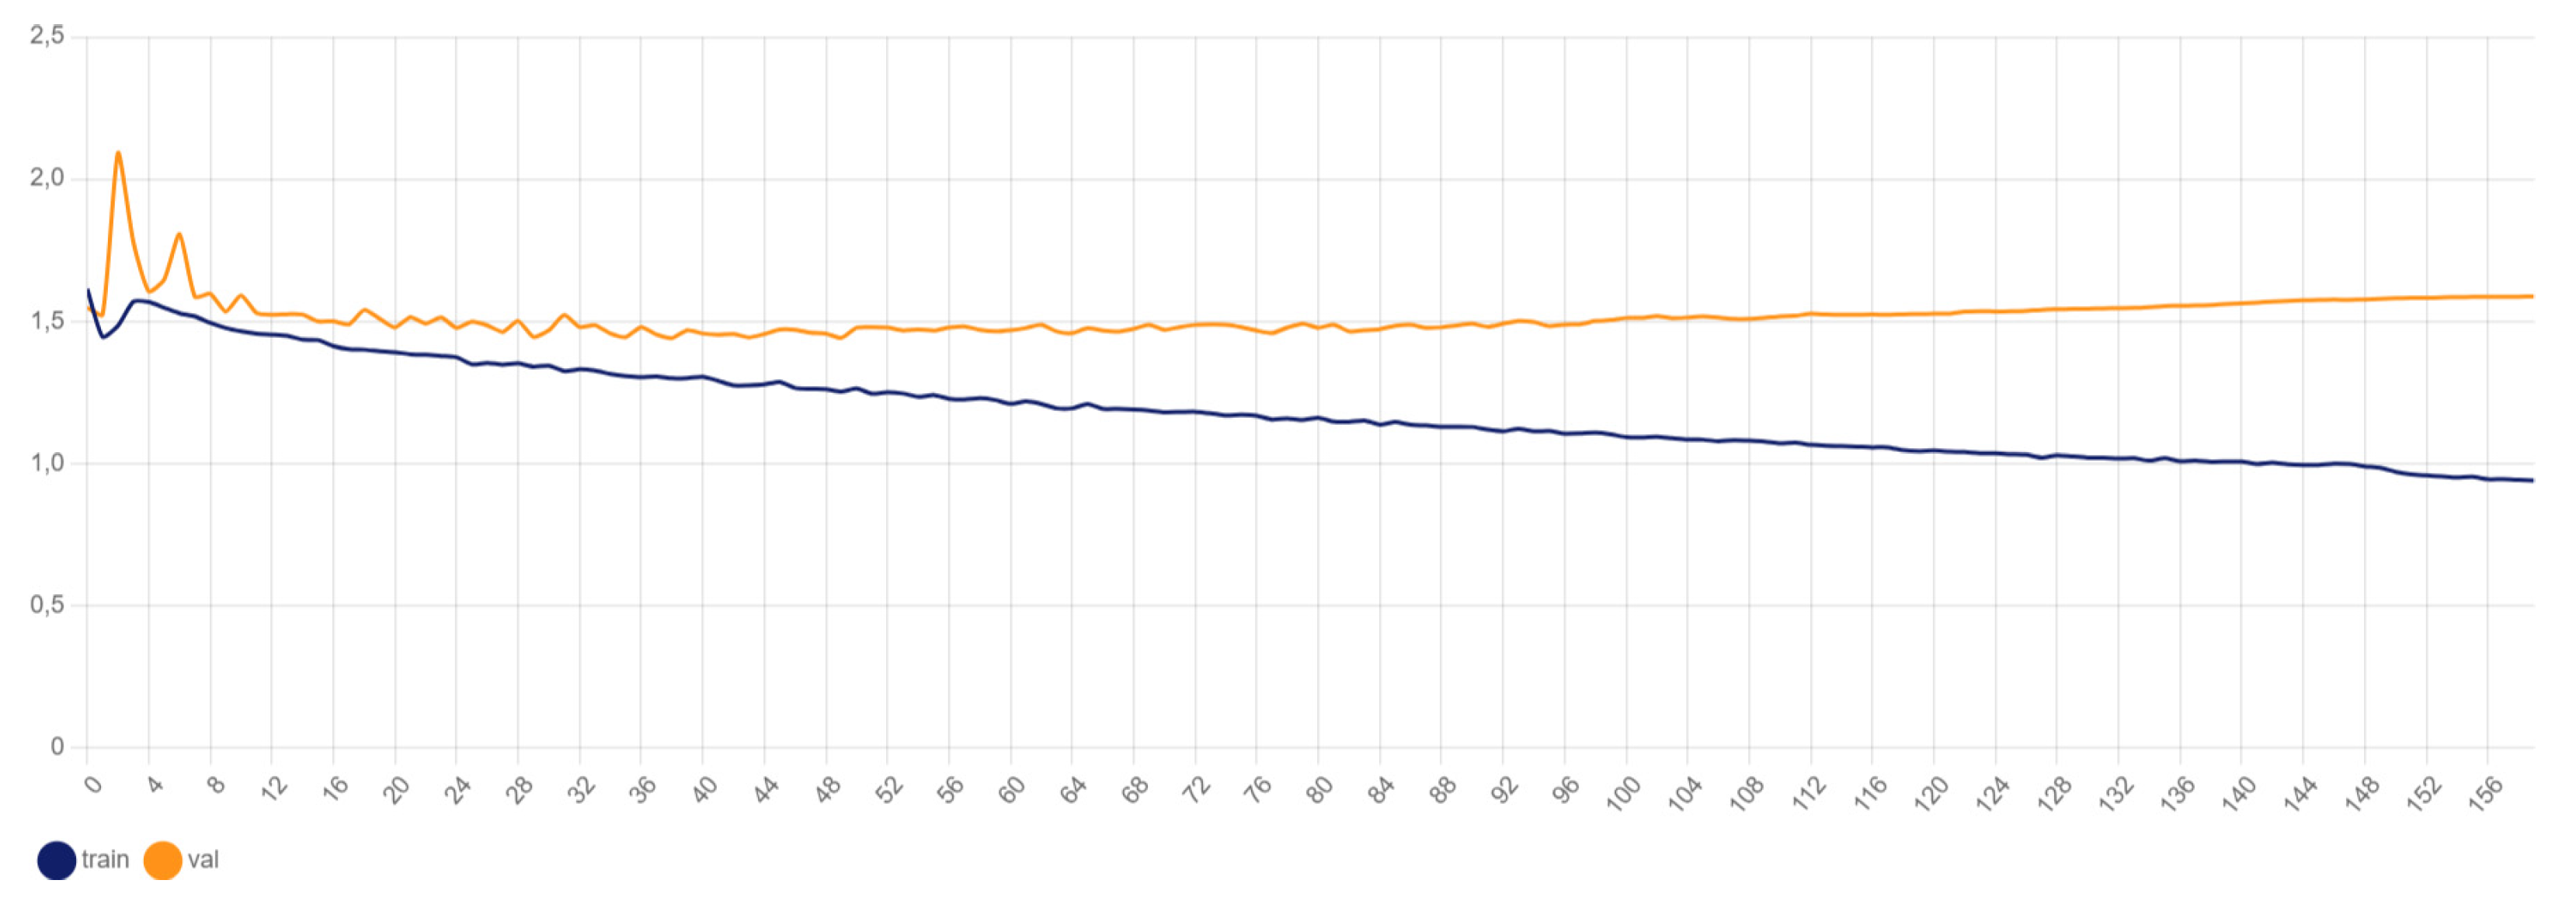
Object Loss: The object loss, depicted in
Figure 9, shows a downward trend, demonstrating enhanced capability in distinguishing between damaged and undamaged road surfaces.
These metrics collectively illustrate that YOLOv8s is effective in detecting and classifying road surface damages, showing consistent improvement in accuracy and a reduction in both box and object loss across the training epochs.
4.2.4. CNN
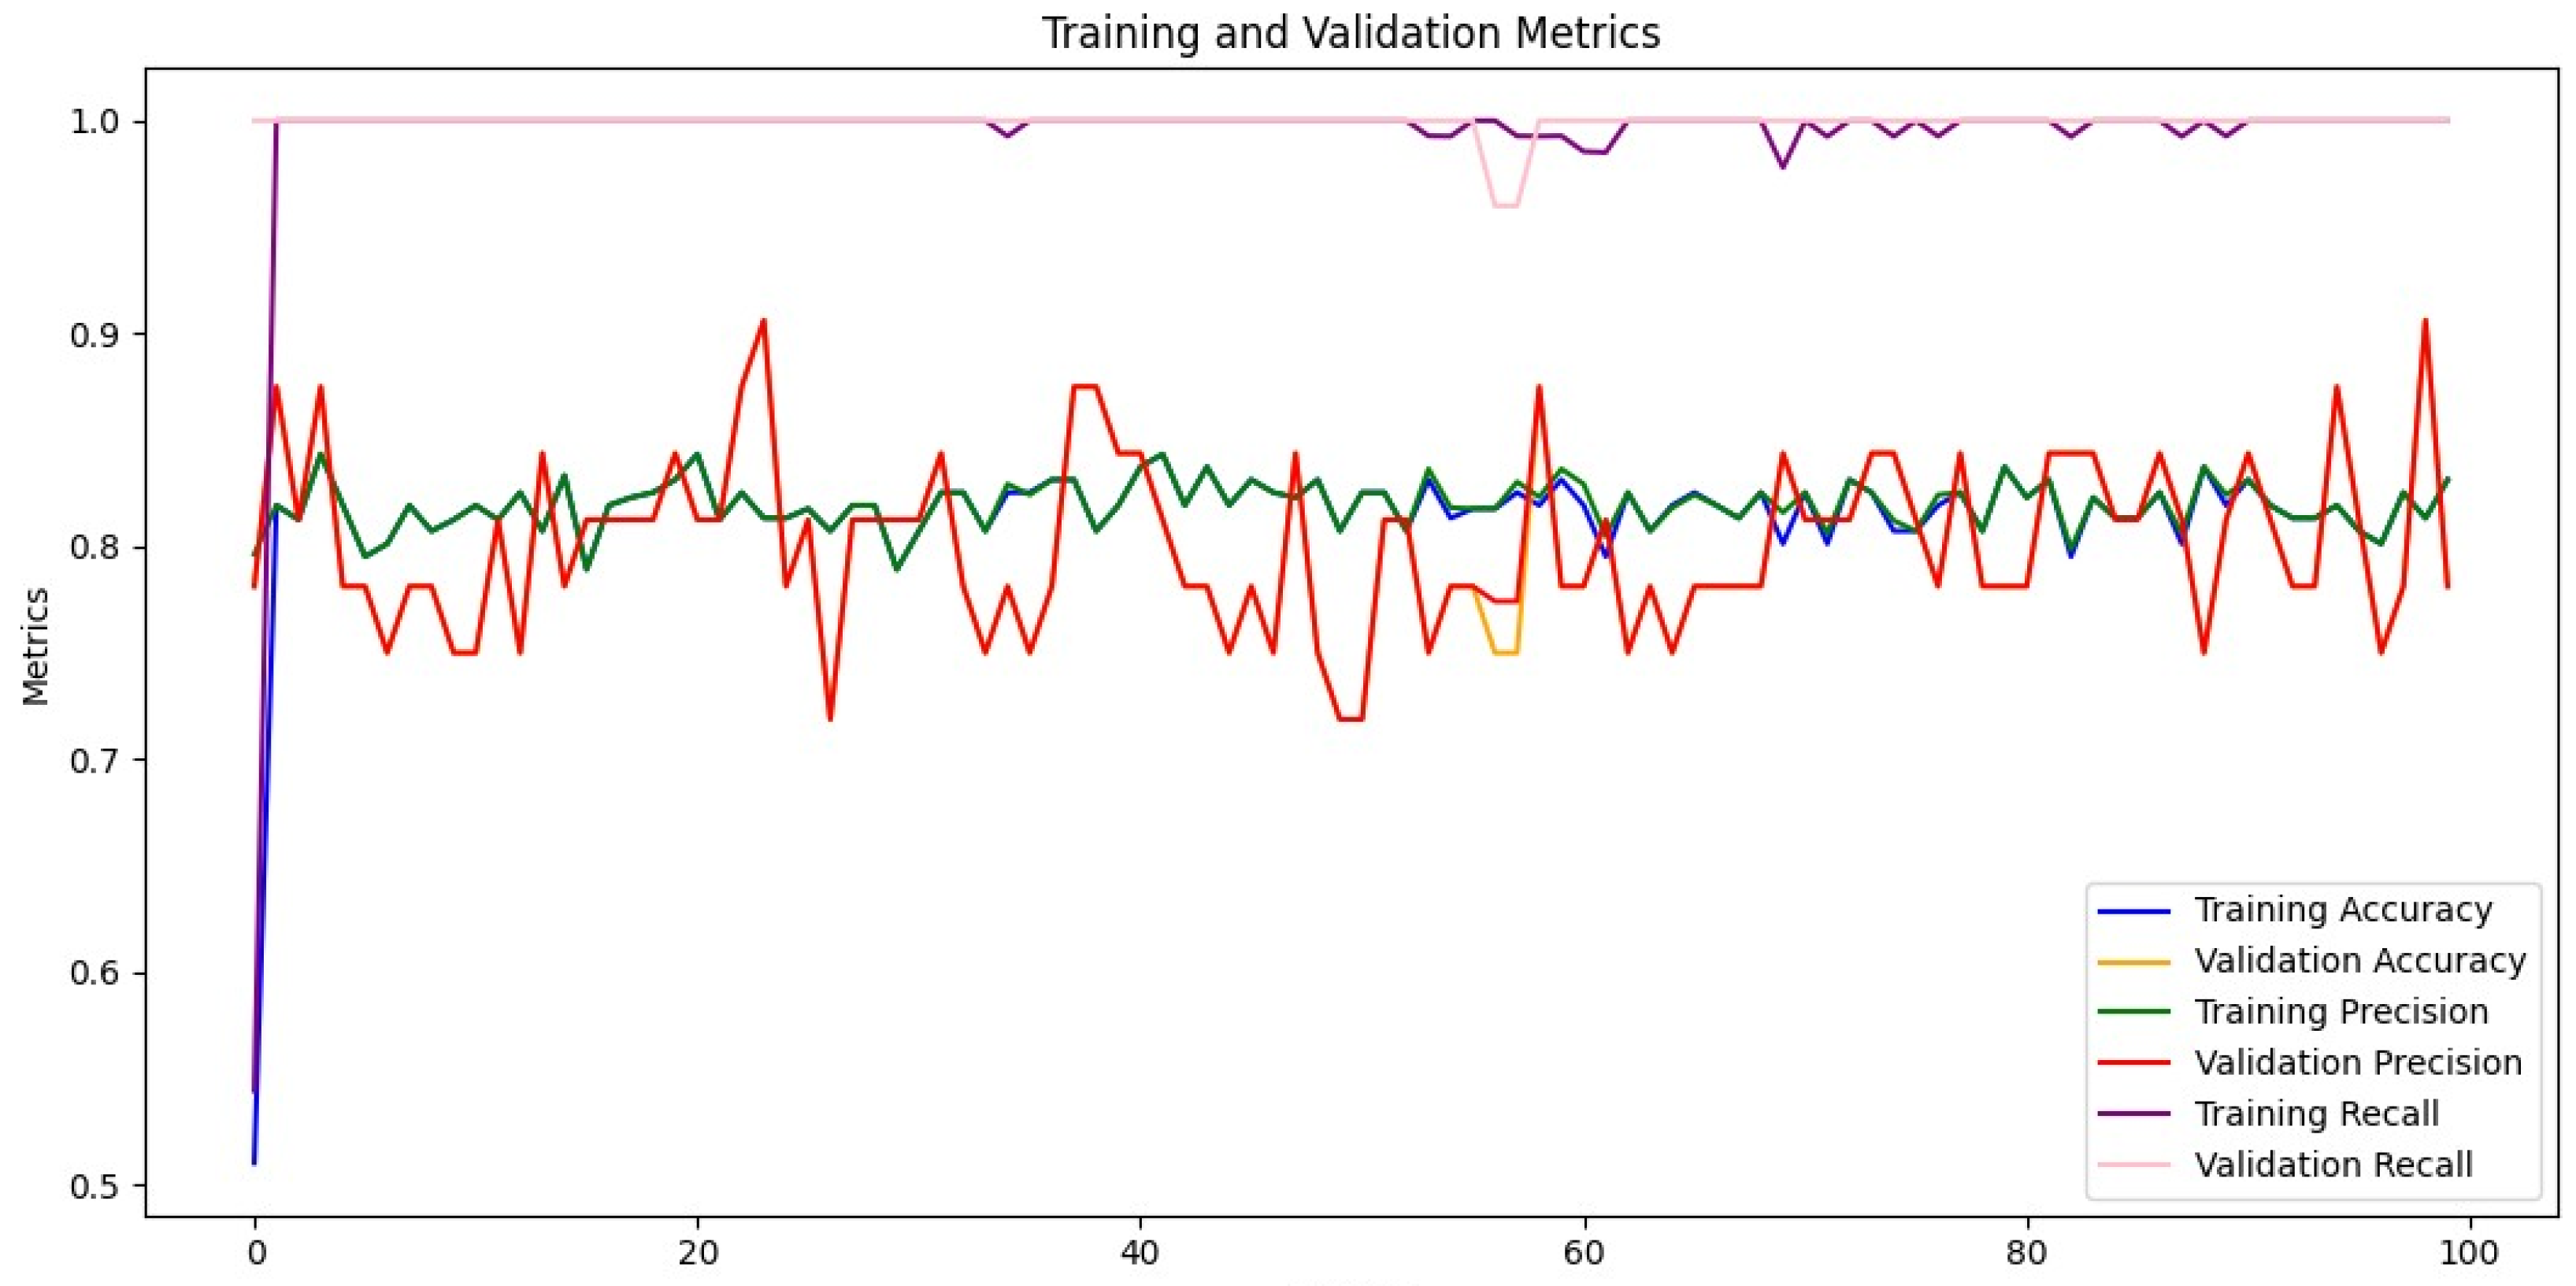
Graph 10 indicates the following trends:
High Training Accuracy and Precision: The training accuracy metric (blue line) starts low and increases rapidly within the first few epochs. After the initial increase, the accuracy stabilizes around a high value, indicating that the model is effectively learning the training data and making correct predictions and positive identifications. Training precision (green line) remains relatively high, though it fluctuates, suggesting some variability in the learning process regarding positive predictions.
Validation Metrics: The validation accuracy metric (orange line) starts low and increases over the first few epochs, stabilizing at a value slightly lower than the training accuracy. This indicates that the model is generalizing reasonably well to the validation set without overfitting too much. Validation precision (red line) exhibits significant fluctuation throughout the epochs, likely due to dataset imbal ance and its limited size, which is understandable in this preliminary testing phase. Both training and validation recall (purple and pink lines, respectively) are high and fairly stable, indicating that the model is effectively identifying positive instances with minimal false negatives.
Potential Overfitting: There is a slight indication of overfitting due to the gap between training and validation precision. This overfitting is likely attributable to the small size and imbalance of the of this preliminary phase, as other influencing factors such as model complexity, data augmentation, and hyperparameter tuning (e.g., regularization, epochs) have been appropriately addressed.
5. Challenges and Solutions
During the design and implementation of our system, several challenges were encountered and addressed effectively:
5.1. Class Imbalance
The dataset showed a strong imbalance with most images classified as ”not damaged”. This was managed by implementing the Focal Loss function, which helps to down-weight the loss assigned to well-classified examples, thus focusing more on the difficult, minority class. We also applied CutOut data augmentation to enhance the robustness of the model.
5.2. Detail Recognition
Distinguishing between damaged and non-damaged signs often required identifying subtle details such as small stickers or scratches. To address this, we incorporated Attention mechanisms (Spatial and Channel Attention) within the CNN architecture, enabling the model to focus on regions of interest within each image.
5.3. Environmental Variability
The images varied significantly in terms of lighting conditions, angles, and weather. To counteract this, we applied extensive data augmentation techniques such as rotations, shifts, and brightness variations, and included a diverse set of images in the dataset to improve model generalization.
5.4. Overfitting
During training, signs of overfitting were observed. To mitigate this, we employed Dropout layers and BatchNormalization, and implemented early stopping based on validation performance to prevent the model from memorizing the training data.
5.5. Computational Resources
Training deep learning models on large datasets requires significant computational power. We leveraged High Performance Computing (HPC) and Cloud resources to accelerate the training process, making use of powerful GPUs and distributed computing.
6. Integration with Municipal Maintenance Applications
6.1. Georeferencing and GIS Integration
The developed software can be seamlessly integrated into a mobile application tailored for municipal maintenance operators. Through this application, maintenance teams can access real-time information on road and traffic sign anomalies detected by the system. The key feature of the application is the use of georeferencing to display layers of defective road surfaces and traffic signs on a GIS map, allowing for immediate visualization and action planning. Our approach combines top-down and bottom-up strategies. In addition to centralized monitoring, we encourage citizen reports, which contribute to the dataset of damaged traffic signs through a mobile application. These reports help balance the dataset classes and improve the accuracy and precision metrics of the convolutional neural network (CNN) through a continuous training process.
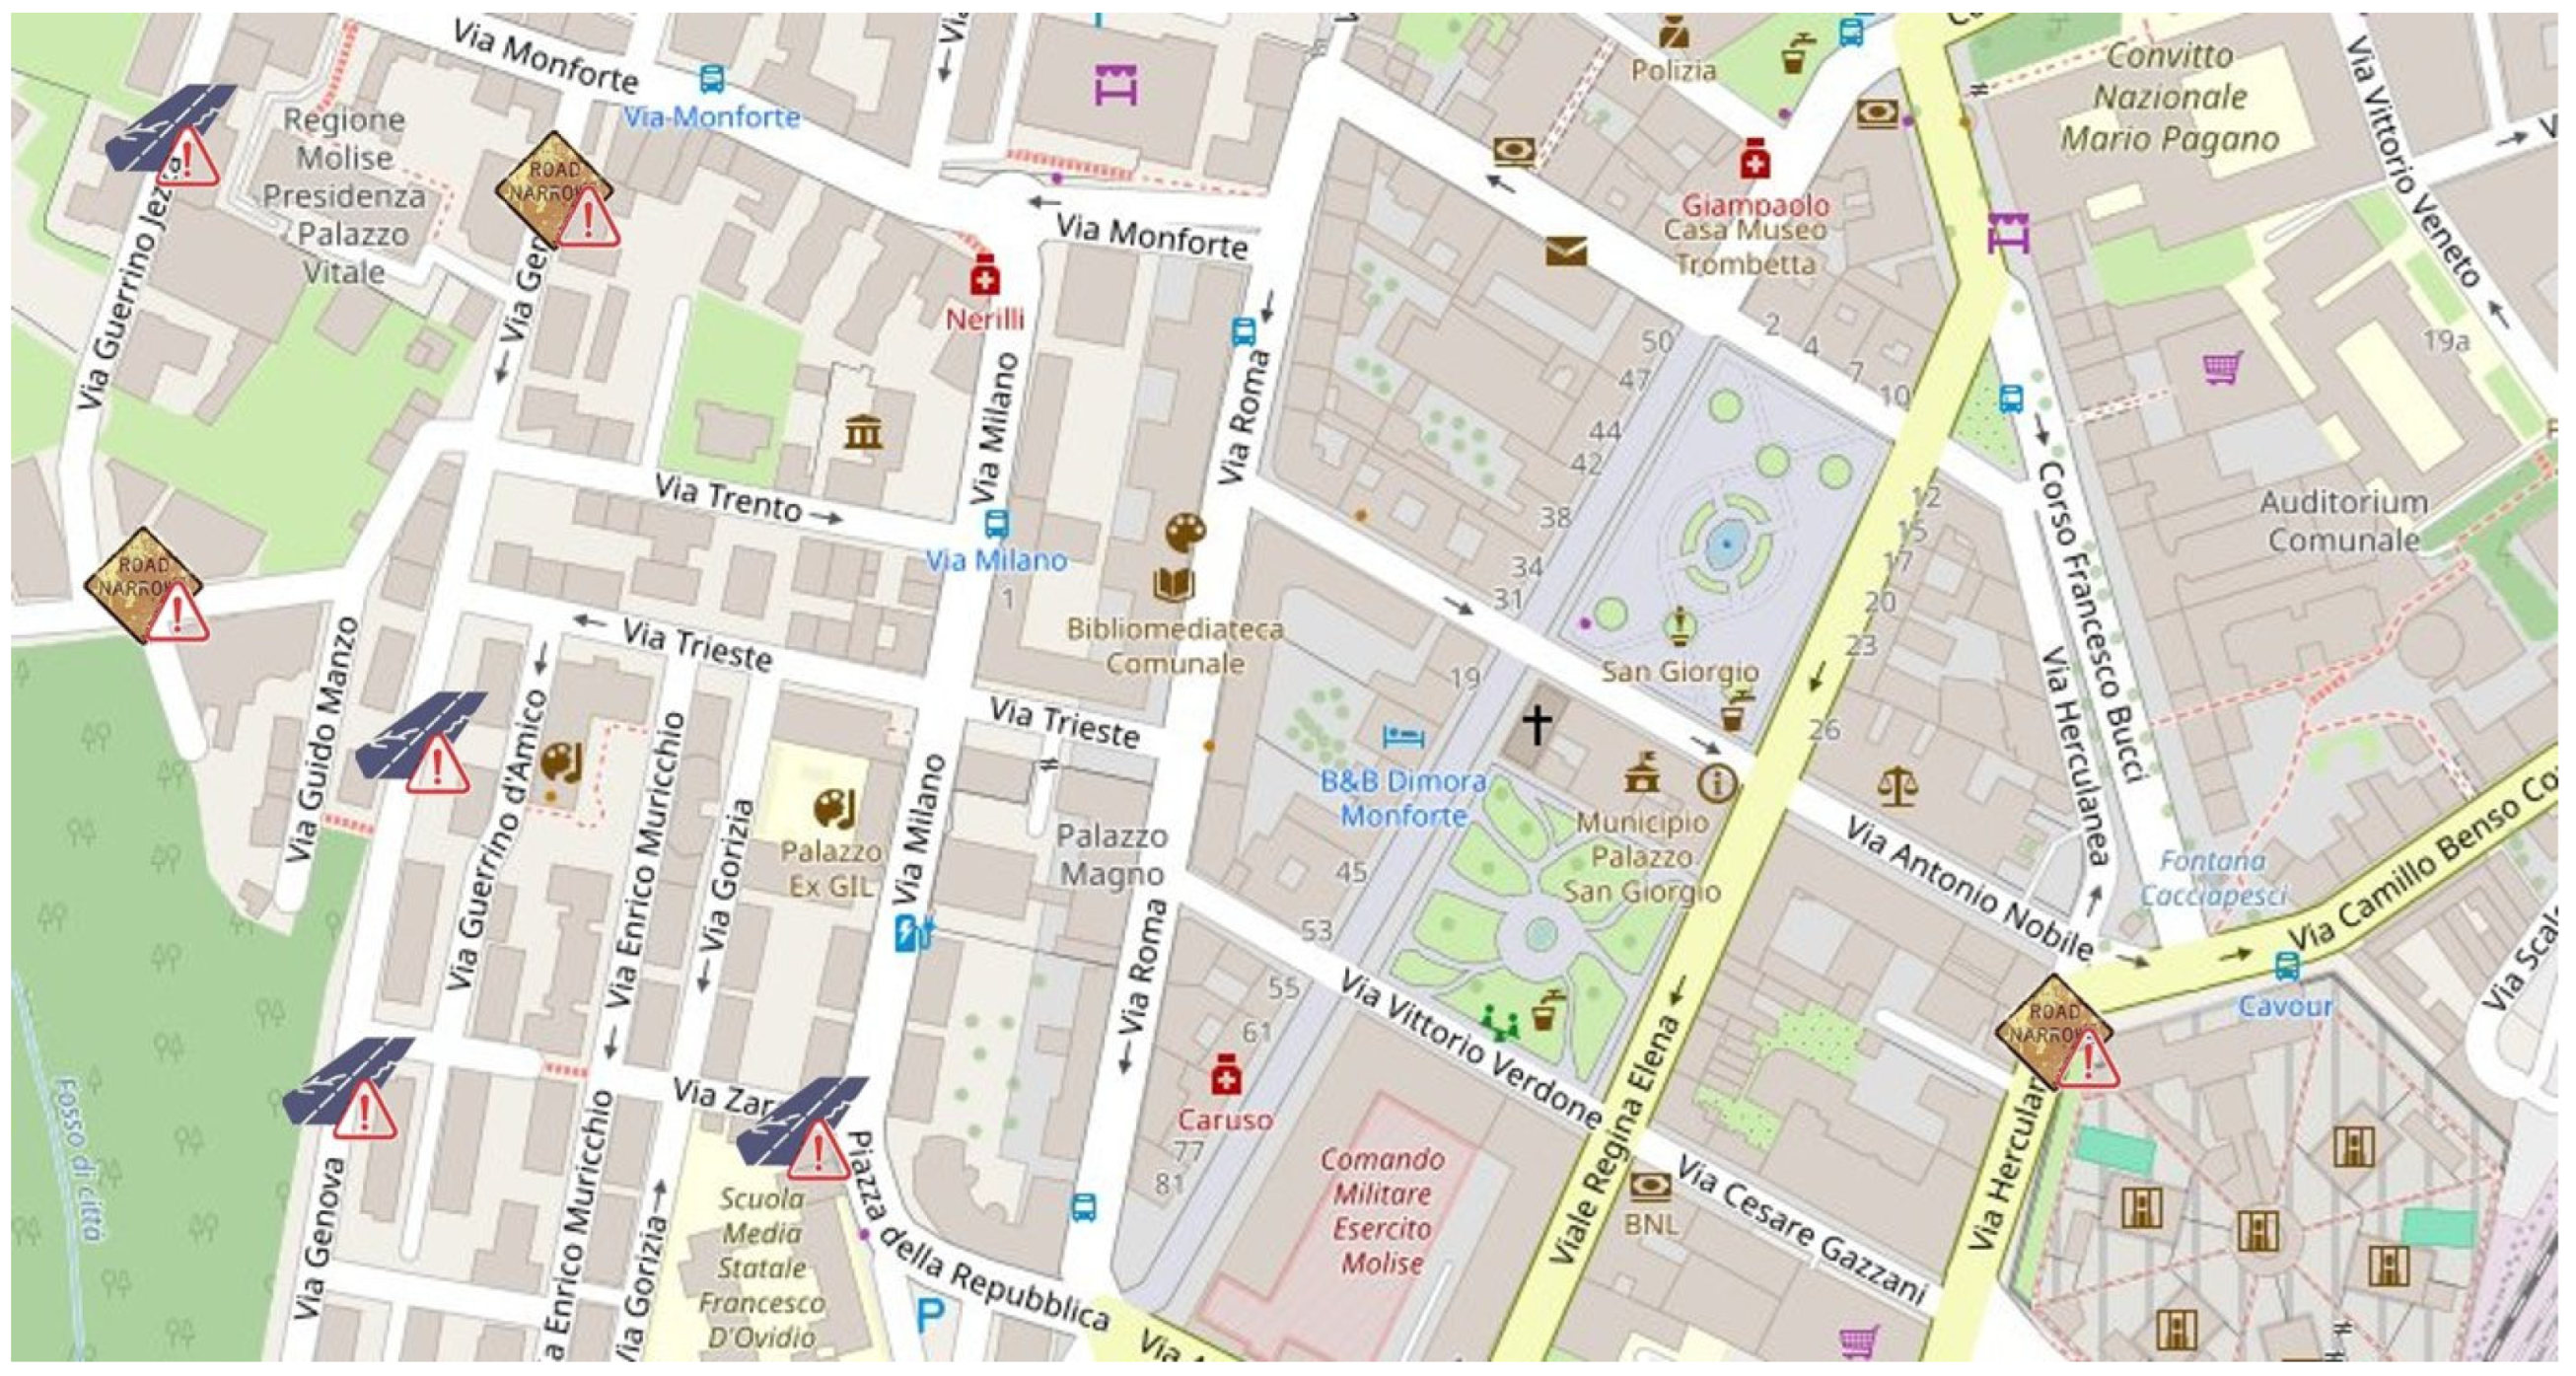
6.2. User Interface for Maintenance Operators
The application interface is designed to be intuitive, enabling users to filter anomalies by type (e.g., potholes, damaged signs). As shown in
Figure 11, the dashboard displays icons for different types of anomalies:
Road Damage: Potholes, cracks, and other surface issues.
Traffic Sign Damage: Defaced, rusty, or obstructed signs.
Each icon on the map provides detailed information about the anomaly, including its exact location, description, and images captured by the detection system.
6.3. Scalability and Replicability
The solution is designed to be easily replicable across municipalities of different sizes and implemented on smartphones. By leveraging cloud computing and scalable data storage, the system can manage large volumes of data and provide real-time updates to maintenance teams. This adaptability makes it suitable for application in any urban area, allowing municipalities to efficiently monitor and maintain their road infrastructure. Users can submit reports of damaged traffic signs, including GPS location and an image of the sign. This information is used to update the dataset in real time and prioritize maintenance interventions, ensuring a timely and efficient response.
6.4. Future Developments
Future iterations of the application will include additional features such as predictive maintenance algorithms, which will analyze historical data to forecast potential road and traffic sign issues before they occur. This will enable municipalities to transition from reactive to proactive maintenance strategies, reducing costs and improving road safety.
7. Conclusions
In this study, we successfully developed and trained YOLO models for road sign detection and CNN models for classifying road signs as damaged or not damaged. Our approach utilized data augmentation and cutout regularization techniques to improve the robustness and generalization of our models. The computational experiments conducted on Google Colab and Reevo servers demonstrated the effectiveness of our methods in handling large datasets and complex computations.
For future work, we propose the following extensions to enhance the capabilities and applications of our models:
Incorporating Retroreflectivity Factors: To further refine the classification of road signs, we plan to include retroreflectivity factors in our analysis. This involves detecting and classifying faded or discolored signs, which can significantly impact road safety. Developing models that can identify such signs will be crucial for timely maintenance and replacement.
Leveraging Generative AI for Data Labeling: The process of manually labeling large datasets is time-consuming and prone to human error. By employing generative AI techniques, we can automate the labeling process, thereby reducing the time and effort required. This will also enable us to handle larger datasets more efficiently.
By implementing these extensions, we aim to improve the accuracy and reliability of road sign detection and classification systems. This will contribute to better road safety and maintenance practices, ultimately benefiting road users and maintenance authorities.
Author Contributions
Conceptualization, D.M., A.S.; methodology, D.M., A.S., V.L.; validation, D.M., V.L.; formal analysis, D.M.; software, D.M.; writing—original draft preparation, D.M., A.S. and G.B.; writing—review and editing, D.M., A.S., V.L. and G.B.; supervision, A.S. All authors have read and agreed to the published version of the manuscript.
Funding
This research was funded by the Molise CTE Project, funded by MIMIT (FSC 2014- 2020), grant #D33B22000060001.
Data Availability Statement
All relevant data are included in the paper.
Acknowledgments
We would like to extend our gratitude to the project coordinators and funding bodies for their support and resources, which were instrumental in the successful completion of this research
Conflicts of Interest
The authors declare no conflicts of interest.
References
- W. H. Organization, “Road safety.” https://www.who.int/health-topics/road-safety.
- S. Maldonado-Bascon, S. Lafuente-Arroyo, P. Gil-Jimenez, H. Gomez-Moreno, and F. Lopez-Ferreras, “Road-sign detection and recognition based on support vector machines,” IEEE transactions on intelligent transportation systems, vol. 8, no. 2, pp. 264–278, 2007. [CrossRef]
- C. Fang, S.-W. Chen, and C. Fuh, “Road-sign detection and tracking,” IEEE Trans. Veh. Technol., vol. 52, pp. 1329–1341, 2003. [CrossRef]
- W. Yang and W. Zhang, “Real-time traffic signs detection based on yolo network model,” in 2020 International Conference on Cyber-Enabled Distributed Computing and Knowledge Discovery (CyberC), pp. 354–357, IEEE, 2020.
- X. Zhang, “Traffic sign detection based on yolo v3,” in 2023 IEEE 3rd International Conference on Power, Electronics and Computer Applications (ICPECA), pp. 1044– 1048, IEEE, 2023.
- W. Song and S. A. Suandi, “Sign-yolo: A novel lightweight detection model for chinese traffic sign,” IEEE Access, vol. 11, pp. 113941–113951, 2023.
- T. Xu, L. Ren, T. Shi, Y. Gao, J.-B. Ding, and R.-C. Jin, “Traffic sign detection algorithm based on improved yolox,” Information Technology and Control, 2023.
- D. C. Ciresan, U. Meier, J. Masci, and J. Schmidhuber, “Multi-column deep neural networks for traffic sign classification,” in 2012 IEEE Conference on Computer Vision and Pattern Recognition, pp. 3642–3649, IEEE, 2012.
- W. Song and S. A. Suandi, “Tsr-yolo: A chinese traffic sign recognition algorithm for intelligent vehicles in complex scenes,” Sensors (Basel, Switzerland), 2023. [CrossRef]
- A. Trpkovic, M. Selmic, and S. Jevremovic, “Model for the identification and classification of partially damaged and vandalized traffic signs,” KSCE Journal of Civil Engineering, vol. 25, 07 2021. [CrossRef]
- N. Acilo, A. G. S. D. Cruz, M. K. L. Kaw, M. D. Mabanta, V. G. G. Pineda, and E. A. Roxas, “Traffic sign integrity analysis using deep learning,” 2018 IEEE 14th International Colloquium on Signal Processing Its Applications (CSPA), pp. 107– 112, 2018.
- A. Zhang, K.C. Wang, B. Li, E. Yang, X. Dai, Y. Peng, Y. Fei, Y. Liu, J. Q. Li, and C. Chen, “Automated pixel-level pavement crack detection on 3d asphalt sur-faces using a deep-learning network,” Computer-Aided Civil and Infrastructure Engineering, vol. 32, no. 10, pp. 805–819, 2017. [CrossRef]
- H. Maeda, Y. Sekimoto, T. Seto, T. Kashiyama, and H. Omata, “Road damage detection using deep neural networks with images captured through a smartphone,” in 2018 IEEE International Conference on Big Data (Big Data), pp. 5207–5212, IEEE, 2018.
- M. Strutu, G. Stamatescu, and D. Popescu, “A mobile sensor network based road surface monitoring system,” 2013 17th International Conference on System Theory, Control and Computing (ICSTCC), pp. 630–634, 2013.
- M. Perttunen, O. Mazhelis, F. Cong, M. Kauppila, T. Leppanen, J. Kantola, J. Collin, S. Pirttikangas, J. Haverinen, T. Ristaniemi, and J. Riekki, “Distributed road surface condition monitoring using mobile phones,” pp. 64–78, 2011.
- R. Tarun and B. P. Esther, “Real-time regional road sign detection and identification using raspberry pi,” 2023 International Conference on Networking and Communications (ICNWC), pp. 1–5, 2023.
- X. R. Lim, C. P. Lee, K. M. Lim, T. S. Ong, A. Alqahtani, and M. Ali, “Recent advances in traffic sign recognition: Approaches and datasets,” Sensors, vol. 23, no. 10, p. 4674, 2023. [CrossRef]
- Neuhold, G., Ollmann, T., Rota Bulo, S., & Kontschieder, P. (2017). The Mapillary Vistas Dataset for Semantic Understanding of Street Scenes. In Proceedings of the IEEE International Conference on Computer Vision (ICCV) (pp. 4990-4999). [CrossRef]
- D. Arya, H. Maeda, and S. K. Ghosh, “RDD2022: A Multi-National Image Dataset for Automatic Road Damage Detection,” Geoscience Data Journal, 2022. [CrossRef]
- Dewi, Christine & Chen, Rung-Ching & Liu, Yan-Ting & Tai, Shao-Kuo. (2021). Synthetic Data generation using DCGAN for improved traffic sign recognition. Neural Computing and Applications. 34. 1-16. [CrossRef]
- Pensa, D. (2017). Integration of GPS Data into Predictive Models for Tyre Maintenance (Master’s thesis, Politecnico di Milano). Retrieved from https://www.politesi.polimi.it/retrieve/a81cb05c-7f41-616b-e053-1605fe0a889a/tesi.pdf.
|
Disclaimer/Publisher’s Note: The statements, opinions and data contained in all publications are solely those of the individual author(s) and contributor(s) and not of MDPI and/or the editor(s). MDPI and/or the editor(s) disclaim responsibility for any injury to people or property resulting from any ideas, methods, instructions or products referred to in the content. |
© 2025 by the authors. Licensee MDPI, Basel, Switzerland. This article is an open access article distributed under the terms and conditions of the Creative Commons Attribution (CC BY) license (http://creativecommons.org/licenses/by/4.0/).