Submitted:
13 July 2025
Posted:
21 July 2025
You are already at the latest version
Abstract
Transport infrastructure faces threats from rapid urbanization, effects from climate change, and decay of current infrastructure, thus forcing the implementation of efficient, precise, and scalable approaches to inventory and condition monitoring of assets. This paper provides an overview of best practices across a number of U.S. State Departments of Transportation (DOTs) regarding the application of artificial intelligence (AI) and emerging technological solutions for transportation asset management. The book routinely categorizes various transport infrastructure like pavement, bridges, traffic signals, sign supports, pavement markings, roadway lighting, and highway buildings with common as well as state-level approaches. There is a detailed examination of conventional manual and cutting-edge automated data collection processes with emphasis on LiDAR, drones (UAVs), mobile mapping systems, automated data collection vehicles (ADCVs), GIS platforms, photogrammetry, and remote sensing technology. Specific focus is on innovative AI applications such as automated sign detection, analysis of pavement distress, and predictive maintenance through deep learning algorithms. By leveraging learnings from successful implementations by Connecticut DOT, Utah DOT, Vermont Agency of Transportation, and many more, this overview explores how state-of-the-art AI-based solutions significantly enhance accuracy, reduce costs, and facilitate proactive infrastructure management. The synthesized findings summarize long-lasting patterns, ongoing difficulties, and future avenues while providing a systematic framework meant to inform state and global transport authorities to adopt more smart, sustainable, and resilient approaches to infrastructure asset maintenance.
Keywords:
transportation asset management
; automated data collection
; predictive maintenance
; artificial intelligence
; geographic information systems (GIS)
1. Introduction
Effective management of transport infrastructure is essential to enable mobility, economic prosperity, and safety in the face of increasing urbanization, climate change, and asset aging. As infrastructure demand rises, traditional asset inventory and condition monitoring solutions become increasingly insufficient. State Departments of Transportation (DOTs) are thus turning their eyes to new, scalable, and data-driven solutions to enhance their asset management practices, with significant emphasis on the use of Artificial Intelligence (AI) and other cutting-edge technologies.
The Transportation Asset Management Plans (TAMPs) that are required by the Moving Ahead for Progress in the 21st Century Act (MAP-21) are an important tool that state Departments of Transportation (DOTs) use to sustain asset integrity and improve performance on the National Highway System (NHS). Yet, the usefulness of such plans significantly relies on the existence of statewide, comprehensive, and reliable inventories that are needed to inform maintenance decisions and forecast future long-range financial needs. To meet the increasing need for accurate asset inventories, state DOTs have considered applying innovative, cost-efficient, and effective data collection techniques.
This research combines current knowledge and practices in asset condition measurement and data collection technologies, with a focus on manual and automated techniques. It describes a variety of transportation facilities including pavement, bridges, traffic signals, sign structures, pavement markings, road lighting, and highway buildings, and it describes technologies such as LiDAR (Light Detection and Ranging), drones (UAVs), multisensor mobile mapping systems, automated data collection vehicles (ADCVs), Geographic Information Systems (GIS), photogrammetry, and remote sensing.
Through the provision of comprehensive case studies across various State DOTs like Connecticut, Utah, Vermont, and others, this paper outlines actual implementations, challenges, and accomplishments encountered in the adoption of such advanced tools. Particular attention is given to AI-driven approaches like automated sign detection, predictive maintenance models, and pavement distress evaluations, illustrating how these technologies can enhance accuracy, reduce the cost, and allow proactive infrastructure management. This broad review provides critical recommendations and frameworks that transport organizations can adopt all over the globe to develop more intelligent, sustainable, and resilient transport asset management systems.
2. Information Synthesis and Literature Review
2.1. Asset Name Classification
When defining and classifying transportation assets, the state DOTs use various terms and classes to organize their asset management data. Below is an examination of how the state DOTs classify the primary assets, which include Pavement, Bridges, Traffic Signals, Sign Supports, Pavement Markings, Roadway Illumination, and Highway Buildings. This examination has understanding of similarities and differences in terms to help develop a common asset management framework.
2.1.1. Pavement
Pavement is a road infrastructure component with roots in being the main surface upon which automobiles travel and facilitating efficient and safe travel. Typically, pavement consists of asphalt or concrete and serves to improve trafficability, impacting transportability, and enhance mobility on highways. As such, many Department of Transportation (DOT) entities classify it into a distinct asset category. Such classification provides avenues to monitor, maintain, and upgrade selectively to achieve optimal surface condition, structural soundness, and durability to damage from environmental and load effects, thus highlighting its importance.
DOTs are increasingly using sophisticated methods of data collection to enable accurate pavement condition assessments. For example, the California Department of Transportation, or sometimes called Caltrans, uses Automated Pavement Condition Surveys (APCS) with laser technology and high-definition image acquisition to achieve detailed evaluations of numerous factors, such as roughness, cracking, rutting, and surface distress. Such a methodology facilitates precise tracking of pavement condition over a period in order to enable efficient targeted maintenance strategies that extend the asset life and improve road safety. Pavement subcategories also form part of the asset management systems in certain states, for example, Pavement Markings and Retroreflectivity, that are key in enabling drivers to obtain requisite information and sight, especially under low-light conditions.
2.1.2. Bridges
Bridges are important transportation infrastructure elements enabling the safe passage of vehicles, pedestrians, and goods over natural or artificial obstacles such as rivers, roads, and railroads. Legally defined in federal law, a bridge is a structure having an opening of more than 20 feet, measured along the centerline of the roadway, which allows traffic or other moving loads to cross an obstruction. This definition includes structures having multiple pipes or boxes with a spacing between them less than half of the smaller opening so as to preserve the structural integrity and continuous operation of the transportation system (23 CFR § 650.305).
Bridges are identified as unique assets due to their complex characteristics, high financial stakes, and vital roles in public safety. To enable effective maintenance and monitoring, state DOTs are increasingly adopting sophisticated technologies, such as LIDAR, GIS mapping, and structural health monitoring (SHM) systems designed to recognize problems like cracks, corrosion, or deformation.
For example, the New York State Department of Transportation (NYSDOT) uses its Enterprise Asset Management System (EAMS) to record bridge conditions and manage maintenance activities (NYSDOT, 2020). By integrating these technologies into a formal asset management framework, agencies improve their capability for real-time monitoring of bridge conditions, schedule required repairs, and extend the operational life of these critical infrastructures.
2.1.3. Traffic Signals
Traffic control signals, also referred to as traffic signals, are critical devices on highways that alter directions for users of the highways to either stop or advance. Such signals regulate movement of diverse traffic, from pedestrians, cyclists, animals, and vehicles, and facilitate safe and smooth movement through intersections (Manual on Uniform Traffic Control Devices [MUTCD], 2023).
Traffic signals are an important control device that assists in the regulation of vehicle and pedestrian traffic on roads at intersections and other strategic points. Their role in safe and effective movement of traffic makes them an asset to transportation agencies. DOTs often incorporate traffic signals into Intelligent Transportation Systems (ITS) by leveraging such technologies as signal timing optimization, Global Positioning System (GPS)-based location tracking, and automatic performance monitoring. The Indiana Department of Transportation (INDOT), for example, has traffic signals in its asset management program, employing real-time monitoring systems to track signal performance and modify timing based on traffic conditions.
2.1.4. Sign Supports
Sign supports are structural components designed to hold traffic signs securely in place, consisting typically of a vertical post and additional stiffeners as required to mount the sign panel. Common types of sign support include wood posts, U-channel steel posts, square or round tube steel posts, and I-beam steel posts, each tailored for specific signage needs and structural resilience (Code of Federal Regulations, 2024). These supports are strategically designed to provide breakaway or yielding characteristics in the event of vehicle impact, especially for installations within the clear zone—areas adjacent to roadways where obstacles can pose a hazard to errant vehicles (FHWA Office of Safety, 2024).
Wooden posts, often chosen for their affordable qualities, are produced in sizes from 4 x 4 inches to larger 6 x 8 inches. Heavy posts require drilled holes to allow for a breakaway system. Similarly, U-channel steel posts, which are usually not heavier than 3 pounds per foot, are directly set into the earth, thus encouraging versatility and easy replacement should a collision occur. Square steel tubes, which are commonly perforated for improved versatility, as well as I-beam steel posts, commonly used for larger panels, include various breakaway designs intended to mitigate the consequences of impact-related dangers. For instance, I-beam posts have standard slip bases that allow the post to safely release when impacted, thus enabling cars to drive underneath the sign when hit.
The Connecticut Department of Transportation (CTDOT) defines a sign support as a structure consisting of horizontal units, posts, vertical attachments, and foundations, all supporting sign panels or variable message signs at a location. Sign panels that are above the sign support are considered parts of the general sign asset (Connecticut Department of Transportation, 2022).
All supports of roadside signs that are in the clear zones must comply with the breakaway requirements of the U.S. Department of Transportation, Federal Highway Administration, through the breakaway standards of the National Cooperative Highway Research Program (NCHRP) Report 350, or, as a substitute, must be shielded by a barrier or a crash cushion when compliance with these breakaway requirements is not achievable (FHWA Office of Safety, 2024). For easy safe separation and repair, breakaway devices, such as slip couplings or base sleeves, are used. Design principles are discussed further in companion materials such as A Guide to Small Sign Support Hardware.
2.1.5. Pavement Markings
Pavement markings are an essential component of transport infrastructure, providing critical instructions to road users regarding lane usage, direction of traffic flow, and road conditions. The Federal Highway Administration (FHWA) defines pavement markings as lines, symbols, and markers on the roadway that inform drivers which part of the road to drive on, where passing is allowed, and of any hazards or conditions ahead on the road (FHWA, 2002).
Figure 1.
Pavement Markings Connecticut Department of Transportation.
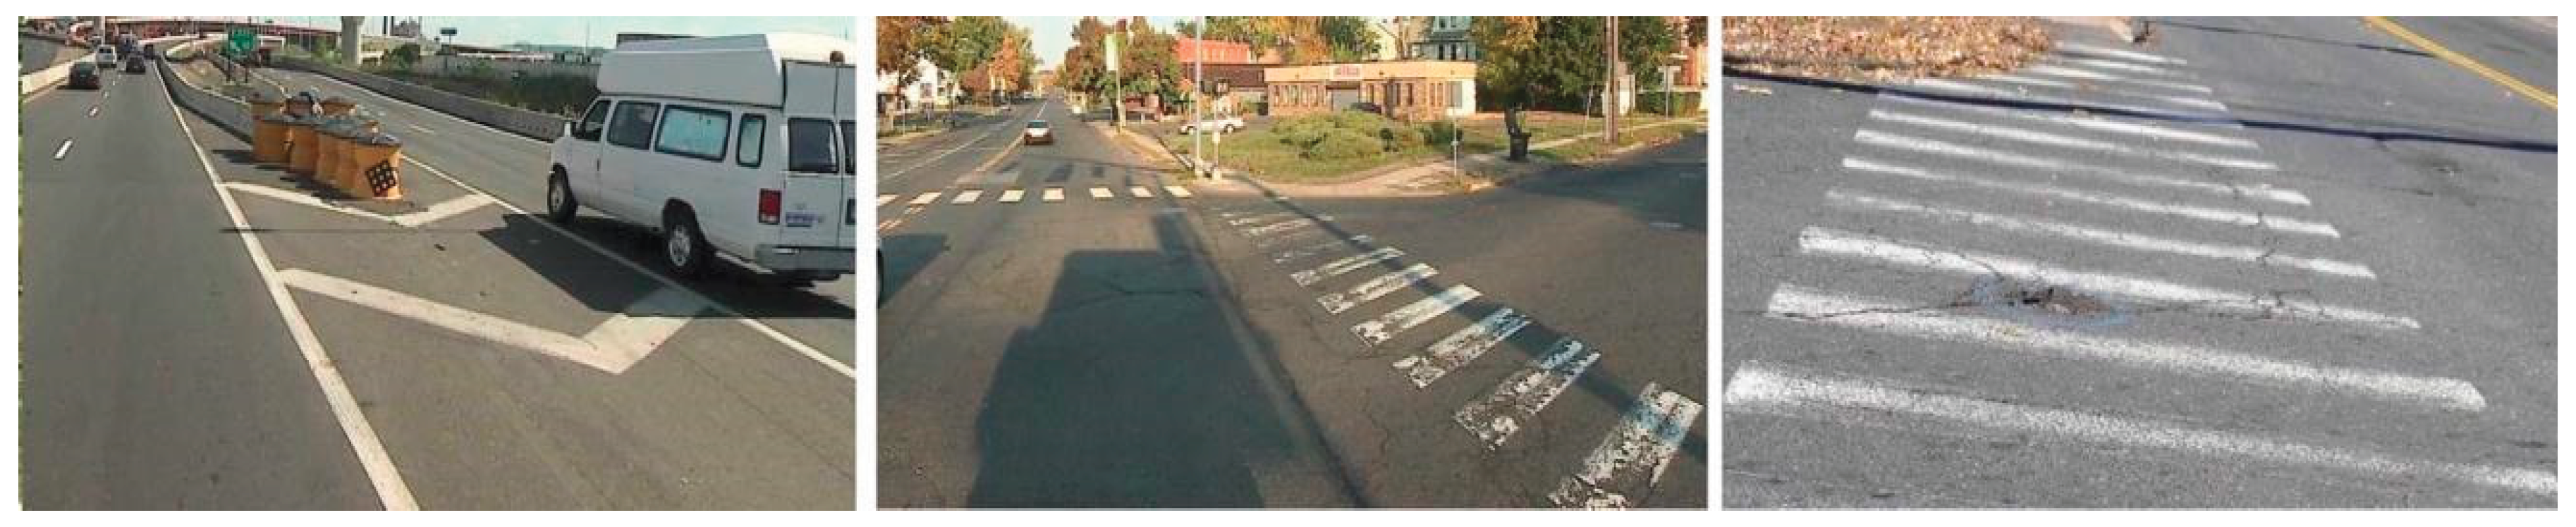
For instance, yellow lines divide traffic flow moving in opposite directions: a solid yellow line prohibits passing, while a dashed yellow line permits passing. White lines separate lanes moving in the same direction; a double white line restricts lane changing, and a dashed white line allows lane changing. Symbols, including diamonds, are employed to identify high-occupancy vehicle (HOV) lanes, and bicycle symbols are utilized to indicate lanes solely for the use of bicyclists. Additionally, arrows specify permitted or required movements, while rows of solid triangles and other indicators warn drivers of potential hazards, such as yield points or speed humps (FHWA, 2002).
Standards for the application and design of pavement markings are established in the Manual on Uniform Traffic Control Devices (MUTCD) and the Standard Highway Signs Book. Both of these AASHTO-endorsed books give marking standards in terms of visibility, retroreflectivity, and durability to meet states’ uniformity requirements. Retroreflectivity, or rather a main factor, is a measure of how well pavement markings return light to road users in order to provide better nighttime or bad-weather visibility. Most states Departments of Transportation have high priorities for having high retroreflectance levels, especially in high traffic areas, as part of their safety-driven asset management processes (FHWA, 2002).
CTDOT pavement marking categories are divided into two groups: line striping, which is measured in linear feet; and symbols and legends (arrows, crosswalks, etc.), which is measured in square feet. Both types of pavement markings can be installed as water-based or epoxy. For line striping, a newer application method utilized is in-laid epoxy markings (CTDOT, 2022).
In their asset management practices, Caltrans and Utah DOT incorporate pavement markings into their overall pavement and safety asset management processes. This allows for easy monitoring, timely maintenance, and effective resource allocation. For the state DOTs, the implementation of AI-based technologies has the potential to provide real-time monitoring of pavement marking conditions, enabling proactive maintenance and adherence to MUTCD standards.
2.1.6. Roadway Illumination
Roadway illumination, commonly known as road lighting, forms an indispensable part of the transportation infrastructure, meant to enhance visibility and bolster the security of road users. Well-designed and properly executed lighting installations enable drivers, pedestrians, and cyclists to rapidly assess road conditions, thus reducing the risk of accidents, mostly at night and at dangerous points such as intersections. Studies have shown that effective roadway lighting can effectively reduce the number of nighttime collisions involving highways and cities, particularly intersections, where the risk of accidents increases as a result of complex interactions of road users.
The Federal Highway Administration (FHWA) highlights the importance of lighting as a highly effective safety measure, which proved that effective lighting can save lives when properly applied. A case study used in Florida provided guidelines intended for a balance between safety and economic viability through an analysis of appropriate lighting levels relative to roadway geometry and traffic conditions (FHWA, 2014). Such guidelines provide practitioners with necessary parameters to maintain the safety benefit of road lighting while addressing budgetary restraints.
The collection of data related to road lighting commonly uses advanced mobile mapping systems and photometric sensors that measure key parameters such as luminance, uniformity, and the condition of lighting installations. Using these technologies, road authorities can confirm the effective operation of lighting installations and ensure the delivery of sufficient lighting, which forms the bedrock of road safety.
The incorporation of artificial intelligence-driven systems can help improve roadway lighting management considerably, facilitating predictive maintenance that identifies potential outages before the event itself. The prophetic management strategy, apart from increasing public safety through improved light, would foster energy efficiency, thus reducing costs of operation and the environmental impact for the benefit of agencies.
2.1.7. Highway Buildings
Highway buildings encompass facilities like maintenance depots, equipment storage, and administrative offices that facilitate transportation operations. Though they are not part of the roadway infrastructure, highway buildings are essential to support day-to-day functions, housing personnel, equipment, and operational technology. Agencies like the Vermont Agency of Transportation (VTrans) track highway buildings in their asset inventories, evaluating condition relative to age, structural integrity, and usage requirements. CTDOT defines a building as a relatively permanent structure to house persons or property. Highway buildings are needed to support the overall maintenance and operation of the highway system. They vary dramatically in size, function and cost so they are grouped into tier and sub-tiers to be managed effectively (CTDOT, 2022).
Maintenance of highway facilities would typically include regular inspection and condition assessments, with data stored in an integrated asset management system. For DOTs, integration of AI-based building assessment tools would allow them to better target their repairs and resource allocation by forecasting building maintenance needs based on historical data and use experience. By optimizing the maintenance of these support facilities, agencies can have its operating infrastructure strong and cost-effective in the long term.
Generally, highway building would require continuous condition monitoring and inspection, and data would be kept in a combined asset management system. For the DOTs, use of AI-based building valuation software might enable them to prioritize repairs more efficiently and make more efficient use of resources through prediction of building maintenance requirements from past experience and usage trends. By optimizing the upkeep of the infrastructures supporting more, the agencies become more capable of maintaining their infrastructure sustained strong and economically feasible in the long term.
2.2. Asset Condition Collection Methods
There are many technologies available for collecting asset data, from pen and paper, to geospatially enabled electronic forms and cutting-edge technology, such as machine learning. In 2018, the United States Department of Transportation (USDOT) published a Strategic Plan.1 The Plan included goals that address safety, infrastructure, innovation, and accountability within the Federal Highway Administration (FHWA). At the same time, FHWA has promoted the use of GIS among State DOTs to more efficiently manage the country’s transportation system and achieve the Department’s strategic goals. With a wide range of uses, applications of GIS can support all four of FHWA’s strategic goals. Asset management collection tools for field data specifically target three of the goals: infrastructure, innovation, and accountability. Field data collection techniques have matured to the point where they are reliable enough to be fully integrated into the workflow of transportation agencies across the country. The case studies detailed in this report focus on innovations that foster more efficient business practices in support of maintaining the infrastructure for which the agencies are responsible.
2.3. Types of Technologies Utilized for Collecting Data on Asset Conditions
Asset condition data collection falls within two broad modes: manual and automated. Manual data collection practices are typically carried out by human examination and recording, whereas automatic ones employ high-level technology to come up with faster and accurate decisions. Both are instrumental in asset management for transport authorities to enable the longevity and functionality of infrastructure assets.
Manual data collection entails traditional practices such as site visits, visual inspections, and windshield surveys. Such practices entail field personnel manually assessing the condition of assets such as traffic signs, traffic signals, and pavement markings. One of the most common tools used during manual inspections is the retro-reflectometer, which measures the retro-reflectivity of pavement markings and traffic signs to determine whether they meet safety standards (Koonce, et al., 2008). Apart from that, manual data is more likely recorded by using GPS-equipped mobile devices wherein field personnel capture the location of specific assets and their condition by means of forms and images, an activity that remains practiced in some state DOTs (Fisher et al., 2012). Automated systems are more and more utilized to boost the speed, accuracy, and efficiency of asset data collection. Technologies such as LiDAR (Light Detection and Ranging) are utilized by several state DOTs to generate high accuracy roadway infrastructure spatial mapping. Terrestrial and mobile LiDAR systems scan pavement, bridges, and roadside features and capture millions of data points within a short time (Levi et al., 2015)
The Automated Data Collection Vehicles (ADCVs) are now ubiquitous in pavement and traffic signal condition data collection. They are equipped with high-definition cameras, laser sensors, and a GPS system to facilitate simultaneous visual and sensor-based information gathering for assets like pavement markings, roadway lighting, and traffic signals. For example, Caltrans uses the Automated Pavement Condition Survey (APCS) system, which utilizes high-definition cameras and lasers to assess pavement condition and collect data on surface distress, rutting, and cracking (California DOT, 2021).
Another commonly used technology is GIS-based data management systems, which are able to collect and analyze the acquired data. The systems are able to map asset conditions on a map and perform spatial analysis, facilitating better maintenance and asset prioritization decision-making. For instance, New York State Department of Transportation (NYSDOT) uses an Enterprise Asset Management System (EAMS) linked to a geospatial data warehouse to maintain a mapped inventory of such critical assets as signs, traffic signals, and roadside features, with a single statewide overview of asset condition (NYSDOT, 2021).Another commonly used technology is GIS-based data management systems, which enable the integration and analysis of collected data. These systems allow agencies to visualize asset conditions on a map and perform spatial analysis, facilitating better decision-making regarding maintenance and asset prioritization. For instance, New York State’s Department of Transportation (NYSDOT) utilizes an Enterprise Asset Management System (EAMS) linked to a geospatial data warehouse to maintain a mapped inventory of critical assets like signs, traffic signals, and roadside features, providing a comprehensive view of asset conditions across the state (NYSDOT, 2021).
Multisensory Mobile Mapping Platforms integrate multiple types of sensors like LiDAR, cameras, and GPS to collect accurate information on asset conditions. Multisensory Mobile Mapping Platforms are particularly useful for data collection for advanced and linear assets like roadway lighting, overhead signs, and signal supports with high accuracy and full coverage (WisDOT, 2019).
Manual and automated approaches each bring distinct benefits, prompting transportation agencies to frequently combine both for comprehensive asset data collection. While manual inspections offer nuanced, expert evaluations of complex or hard-to-reach assets, automated techniques support broad, frequent assessments that boost efficiency and scale. Table 1 outlines the technologies employed by various state agencies, marked with a "1" when used and left blank if not.

Table 1.
Technologies Utilized for Collecting Data on Asset Conditions.
| State Transportation Agency | GPS | Lidar Airborne | Lidar Terrestrial | Unmanned Aerial Vehicles | Mobile Devices | Multisensor Mobile Mapping | Photogram Metric Processes | Photolog | ADVCs | GIS | Remote Sensing |
|---|---|---|---|---|---|---|---|---|---|---|---|
| Alabama | 1 | 1 | 1 | 1 | 1 | ||||||
| Hawaii | 1 | 1 | 1 | ||||||||
| Iowa | 1 | 1 | 1 | ||||||||
| Kansas | 1 | 1 | 1 | 1 | 1 | ||||||
| Minnesota | 1 | 1 | 1 | 1 | 1 | 1 | |||||
| Mississippi | 1 | 1 | 1 | ||||||||
| New Hampshire | 1 | 1 | |||||||||
| New York | 1 | 1 | 1 | 1 | 1 | ||||||
| North Carolina | 1 | 1 | 1 | 1 | |||||||
| Utah | 1 | 1 | 1 | 1 | 1 | 1 | |||||
| Virginia | 1 | 1 | 1 | ||||||||
| Texas | 1 | 1 | 1 | 1 | 1 | 1 | |||||
| Wisconsin | 1 | 1 | |||||||||
| Washington | 1 | 1 | 1 | 1 | |||||||
| California | 1 | 1 | 1 | 1 | 1 | ||||||
| Connecticut | 1 | 1 | 1 | 1 | 1 |
2.3.1. Global Positioning System (GPS)
Global Positioning System (GPS) technology is essential for transportation asset management, providing accurate spatial data that enhances the monitoring and upkeep of infrastructure. GPS is used to geospatially map assets, allowing departments to integrate asset data within Geographic Information Systems (GIS) for comprehensive analysis, visualization, and strategic planning. The precise location data captured through GPS helps agencies like the Connecticut Department of Transportation (CTDOT) manage asset conditions effectively and plan for necessary maintenance actions.
For instance, CTDOT uses GPS to locate and track both sign supports and highway buildings within their asset management framework. Sign support data collection involves GPS tagging for each asset, allowing inspectors to record condition data on signs and illumination, structure, foundation, and traffic safety features. These assets are then geospatially represented within the Asset Web Application for Real-time Infrastructure (AWARI), a system designed for real-time tracking and management of asset locations (Connecticut Department of Transportation, 2022).
Similarly, CTDOT employs GPS for highway buildings, where each building’s location is represented by a single GPS point within AWARI. In 2017-2018, CTDOT developed an inspection program with consultant inspectors to evaluate the condition of highway buildings. This inspection program covered all buildings, except for Tier 4, unless there was an ongoing project for renovation, replacement, or decommissioning. Each site has been outlined by a polygon for potential integration with ATLAS 2.0, CTDOT’s upcoming system for spatial data management. While the interval for building inspections has not been formally set, GPS-based location data ensures that condition updates are accurately represented in AWARI and Core-CT, a system for financial reporting. CTDOT is exploring the implementation of a Facilities Management System to streamline data collection through electronic work orders, enabling a longer inspection interval of up to 10 years, thereby optimizing resource allocation and inspection efficiency (Connecticut Department of Transportation, 2022).
2.3.2. Laser Scanning/LiDAR (Light Detection and Ranging)
Laser scanning or LiDAR technology is used to measure the road surface condition, detecting issues like roughness, rutting, and cracks. It can also be used for mapping surrounding assets like guardrails, signs, and trees. A laser emits light pulses that bounce back to the sensor after hitting the road surface. The time taken for the light to return is measured, and this information is used to create detailed 3D models of the road surface.
2.3.3. Drones (Unmanned Aerial Vehicles - UAVs)
Drones are used for aerial surveys of road networks. They provide a quick way to assess large areas, capturing images of road damage and other infrastructure such as bridges and culverts. Drones are equipped with high-resolution cameras or LiDAR sensors to fly over road networks and capture data. This data is processed to generate high-resolution maps and 3D models for visual inspection and analysis.
2.3.4. Mobile Devices
Mobile devices, such as smartphones and tablets, have become powerful tools for data collection due to their portability, sensors, and connectivity. These devices enable users to gather, store, and transmit a wide variety of data, from geographic information and environmental measurements to survey responses and multimedia content. Here’s how mobile devices work in data collection.
With the advancement of today’s technology world, each mobile device has been integrated with various advanced sensors and other features, which will help in better data collection and usability for any application. This is just a general overview of the key functionalities:
- a.
- GPS for Location Data: Mobile devices have GPS (Global Positioning System) chips that provide precise geographic coordinates. This is used in mapping, navigation, and location-based studies, such as environmental monitoring or tracking field workers.
- b.
- Accelerometer and Gyroscope: These sensors detect movement and orientation. They are used in applications that monitor physical activity, such as fitness apps, or for safety purposes in industrial settings.
- c.
- Camera and Microphone: Cameras capture photos and videos, while microphones record audio. This is useful for documenting visual or auditory observations, taking survey videos, or collecting photographic evidence in fieldwork.
- d.
- Touchscreen Input: The touchscreen enables users to enter text, make selections, or draw on maps and images. This is helpful in surveys, form entries, or annotating field data.
- e.
- Connectivity (Wi-Fi, Bluetooth, Cellular): Wireless connections allow mobile devices to sync with other devices, upload data to cloud servers, or connect to IoT (Internet of Things) devices for additional data sources.
2.3.5. Multisensor Mobile Mapping Platforms
Multi-sensor mobile mapping systems are designed to capture geospatial information through a combination of various sensors mounted on mobile vehicles, such as vans, drones, and ships. These systems utilize technologies including cameras, LiDAR, GPS, and inertial measurement units to generate accurate, georeferenced data sets. These platforms are typically used in applications like surveying, urban planning, environmental monitoring, and autonomous navigation, and they combine various sensor technologies, including:
- LiDAR (Light Detection and Ranging): LiDAR sensors generate highly accurate 3D point clouds, mapping objects, terrain, and infrastructure with precision.
- Cameras (Optical or 360°): High-resolution cameras capture visual imagery, which helps in creating photorealistic maps, capturing street details, and aligning 3D data with actual visuals.
- GNSS (Global Navigation Satellite Systems): Provides location data by using satellites to pinpoint the platform’s geographic position, ensuring that all data is georeferenced accurately.
- IMU (Inertial Measurement Unit): IMUs detect and track changes in movement and orientation, providing stability to the mapping system by compensating for vehicle motion and vibration.
- Radar Sensors: Sometimes included to supplement LiDAR and cameras, radar sensors can provide additional distance data, especially useful in low-visibility situations like fog or rain.
- Software Suite: A data processing and visualization platform is essential for integrating data from all these sensors, processing point clouds, stitching images, and converting data into useful geospatial information
2.3.6. Photogram Metric Processes
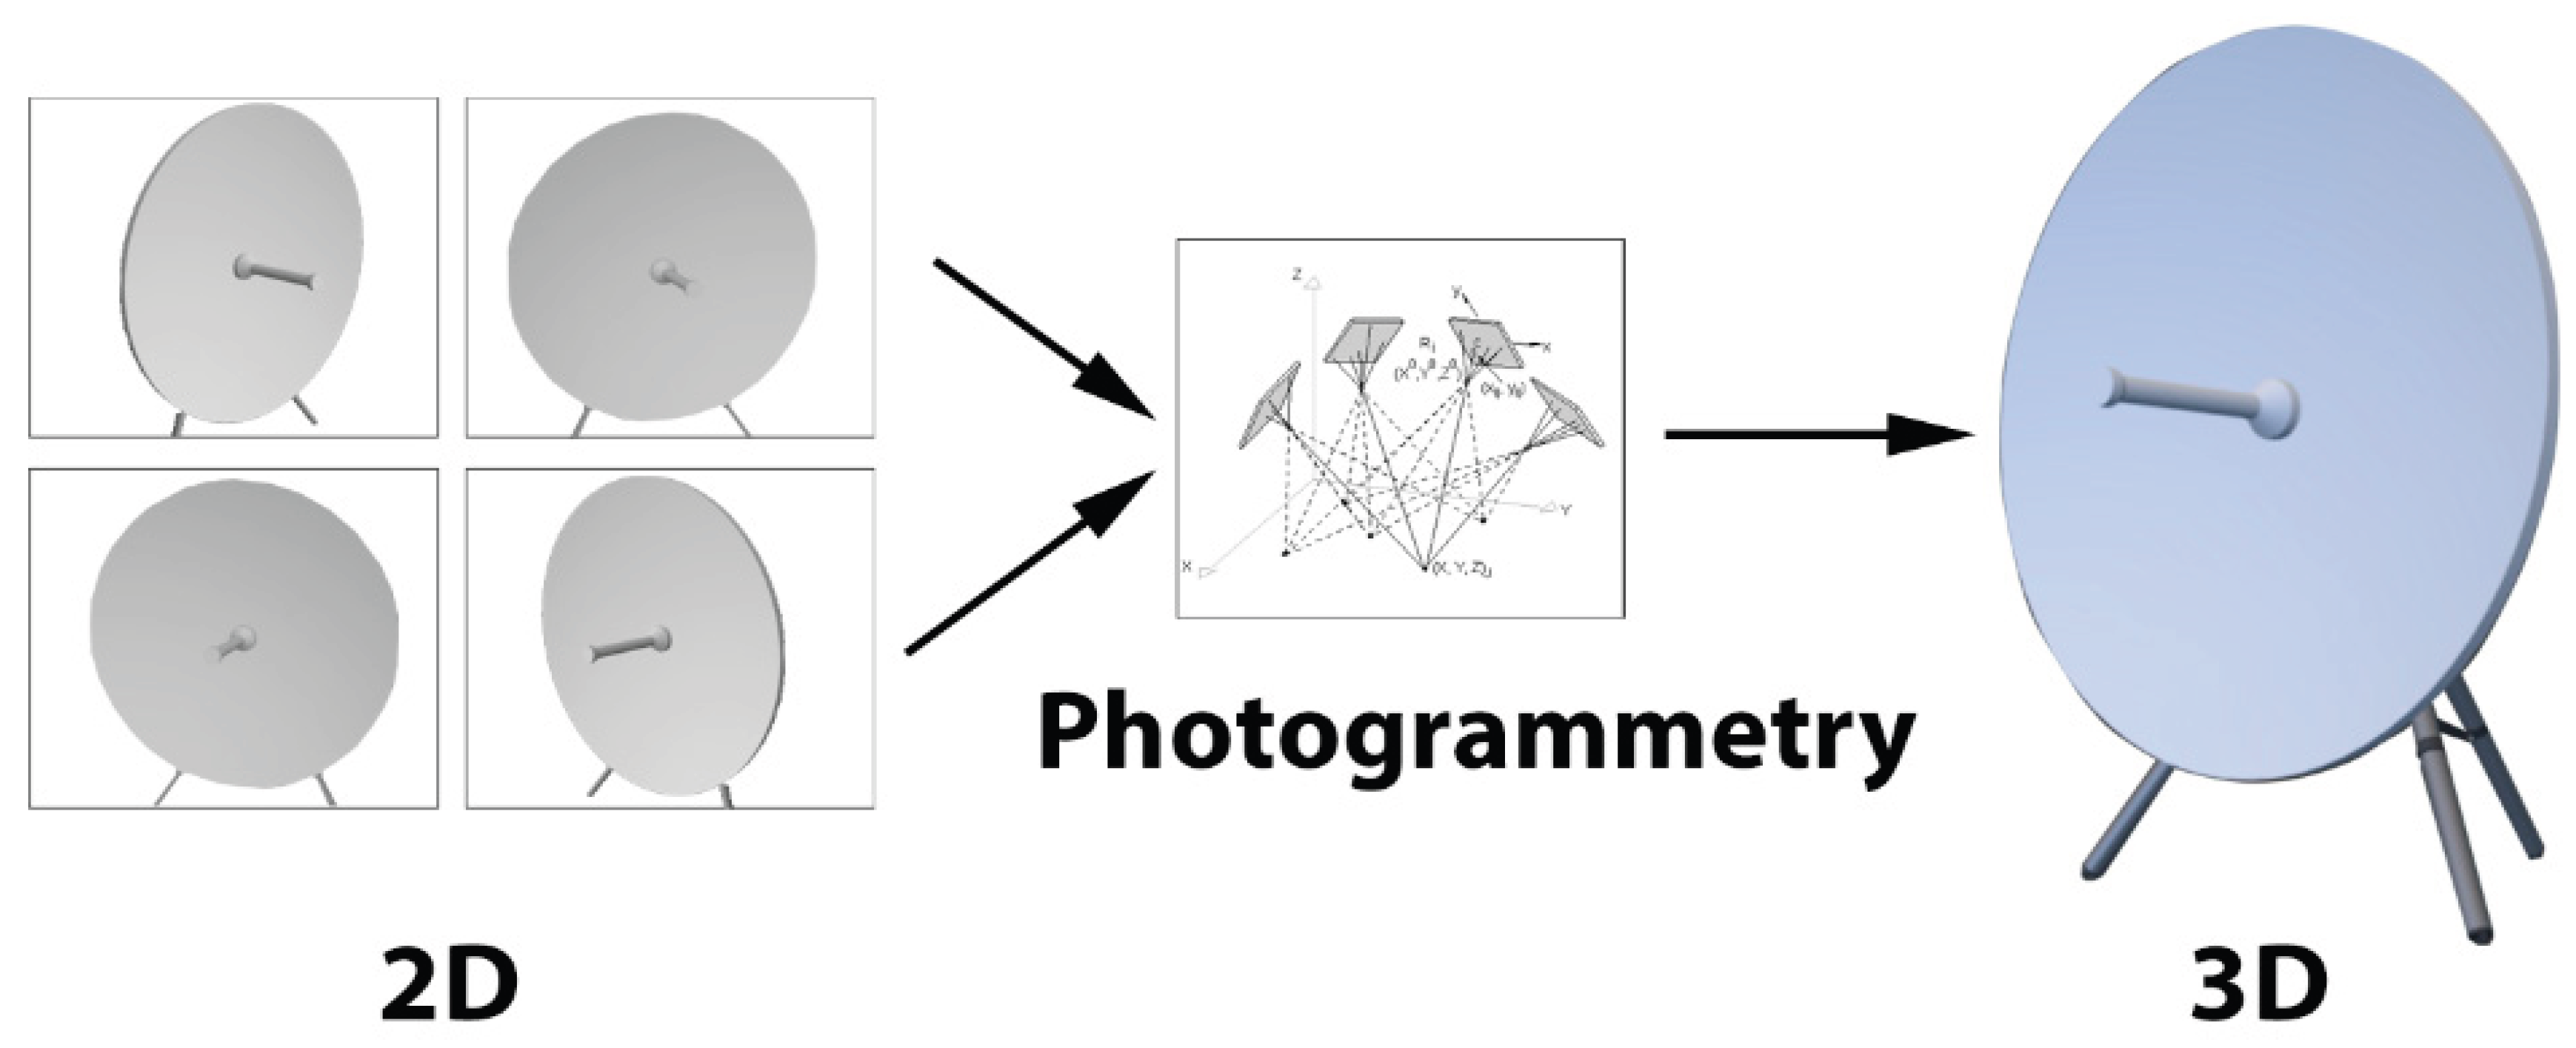
The purpose of photogrammetry is to extract accurate 3D information and measurements from 2D photographs, allowing users to create realistic and measurable models of objects, spaces, and landscapes. Here are the main purposes and applications across various fields:
- Topographic Mapping: Photogrammetry is used to create detailed, accurate maps of terrain and landscapes, particularly for large areas like cities or natural sites.
- Geospatial Data: It provides precise location data that helps in creating Geographic Information System (GIS) maps for urban planning, agriculture, forestry, and land management.
- Building Documentation: Photogrammetry captures existing structures in 3D, aiding in building inspections, renovations, and restorations.
- Site Monitoring: Construction sites can be tracked over time, allowing engineers to check progress and ensure compliance with design specifications.
- Quality Control: Photogrammetry helps inspect manufactured parts, ensuring they meet design specifications and quality standards.
Figure 2.
Photogrammetry.
2.3.7. Photolog
Photolog is a technology that involves capturing sequential images or video footage along roadways, enabling a comprehensive visual record of transportation assets. This method supports asset managers by providing up-to-date visual documentation, which is crucial for monitoring asset conditions and identifying maintenance needs. For example, the Connecticut Department of Transportation (CTDOT) used Photolog images to establish its sign inventory in 2013, capturing the precise locations of signs throughout the state. The collected Photolog data was initially managed in Excel spreadsheets, then published in ArcGIS to provide a visual snapshot of the sign assets. This visual documentation assists CTDOT in tracking changes to the sign inventory, supporting effective asset management practices. Photolog also has potential applications for other assets, such as pavement markings, where baseline inventory data could be established and maintained through image capture. This approach not only enhances data accuracy but also streamlines data retrieval and review, providing a valuable resource for ongoing asset condition assessments (Connecticut Department of Transportation, 2022).
In 2013, CTDOT leveraged Photolog to create a comprehensive inventory of signs throughout the state, precisely capturing each sign’s location. Initially stored in Excel, this data was later published in ArcGIS, allowing CTDOT to visually track and manage sign assets with enhanced accuracy and efficiency (Connecticut Department of Transportation, 2022).
DigitalHIWAY, a system developed by CTDOT, is closely integrated with Photolog technology and expands its utility by using high-definition images from photolog-equipped vehicles to build a comprehensive visual inventory of Connecticut’s roadways. DigitalHIWAY not only captures images at regular intervals but also pairs them with GPS data, providing precise geospatial references for each image. This system supports infrastructure assessment, safety evaluations, and asset management by allowing various CTDOT offices and other state agencies to access and analyze current roadway conditions. Through a centralized client-server architecture, DigitalHIWAY distributes these images to municipalities and external agencies, enabling rapid retrieval of visual records for informed decision-making across departments (Connecticut Department of Transportation, 2008; Overturf, 2016).
Figure 3.
CTDOT’s Photolog Van.
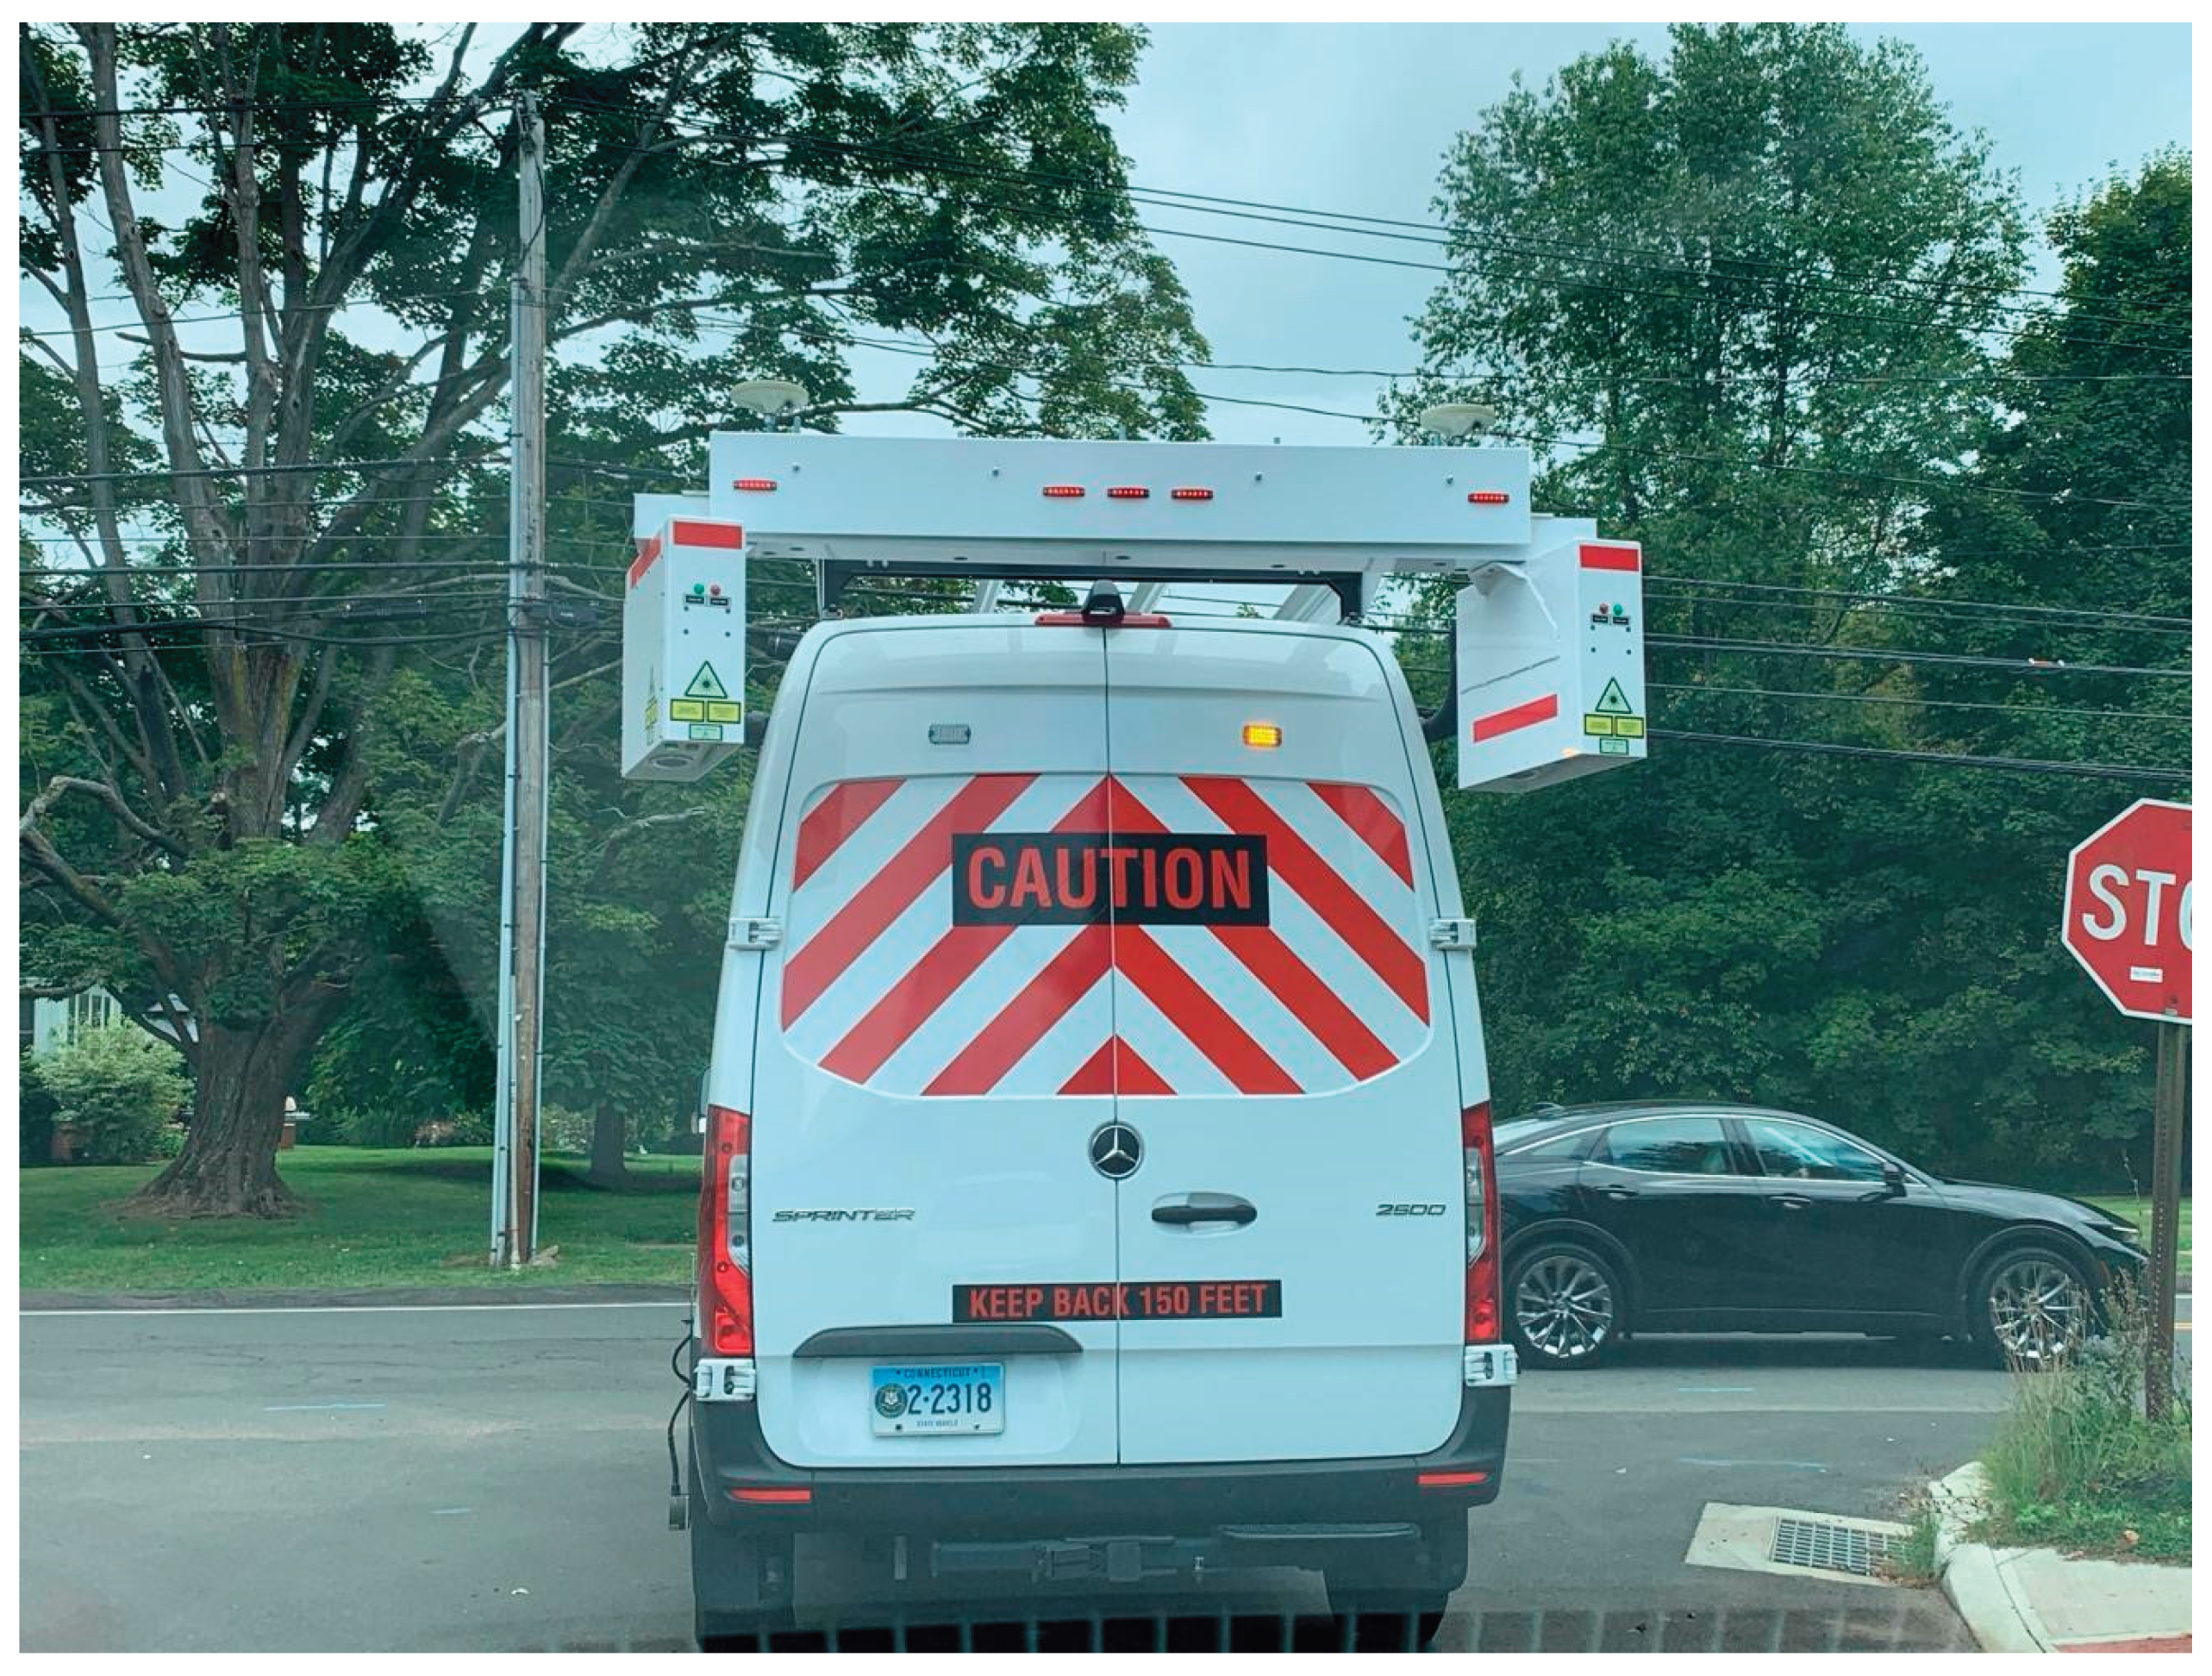
DigitalHIWAY is closely linked with photolog technology as it utilizes high-definition images captured through photolog-equipped vehicles to provide a comprehensive visual inventory of Connecticut’s roadways. The integration of GPS data with these images enables precise geospatial referencing, making DigitalHIWAY an invaluable tool for infrastructure assessment and asset management within ConnDOT. This photolog technology facilitates timely and accurate roadway condition monitoring, supporting data-driven decisions across various departments (Connecticut Department of Transportation, 2008; Overturf, 2016).
2.3.8. Automated Data Collection Vehicles (ADCVs)
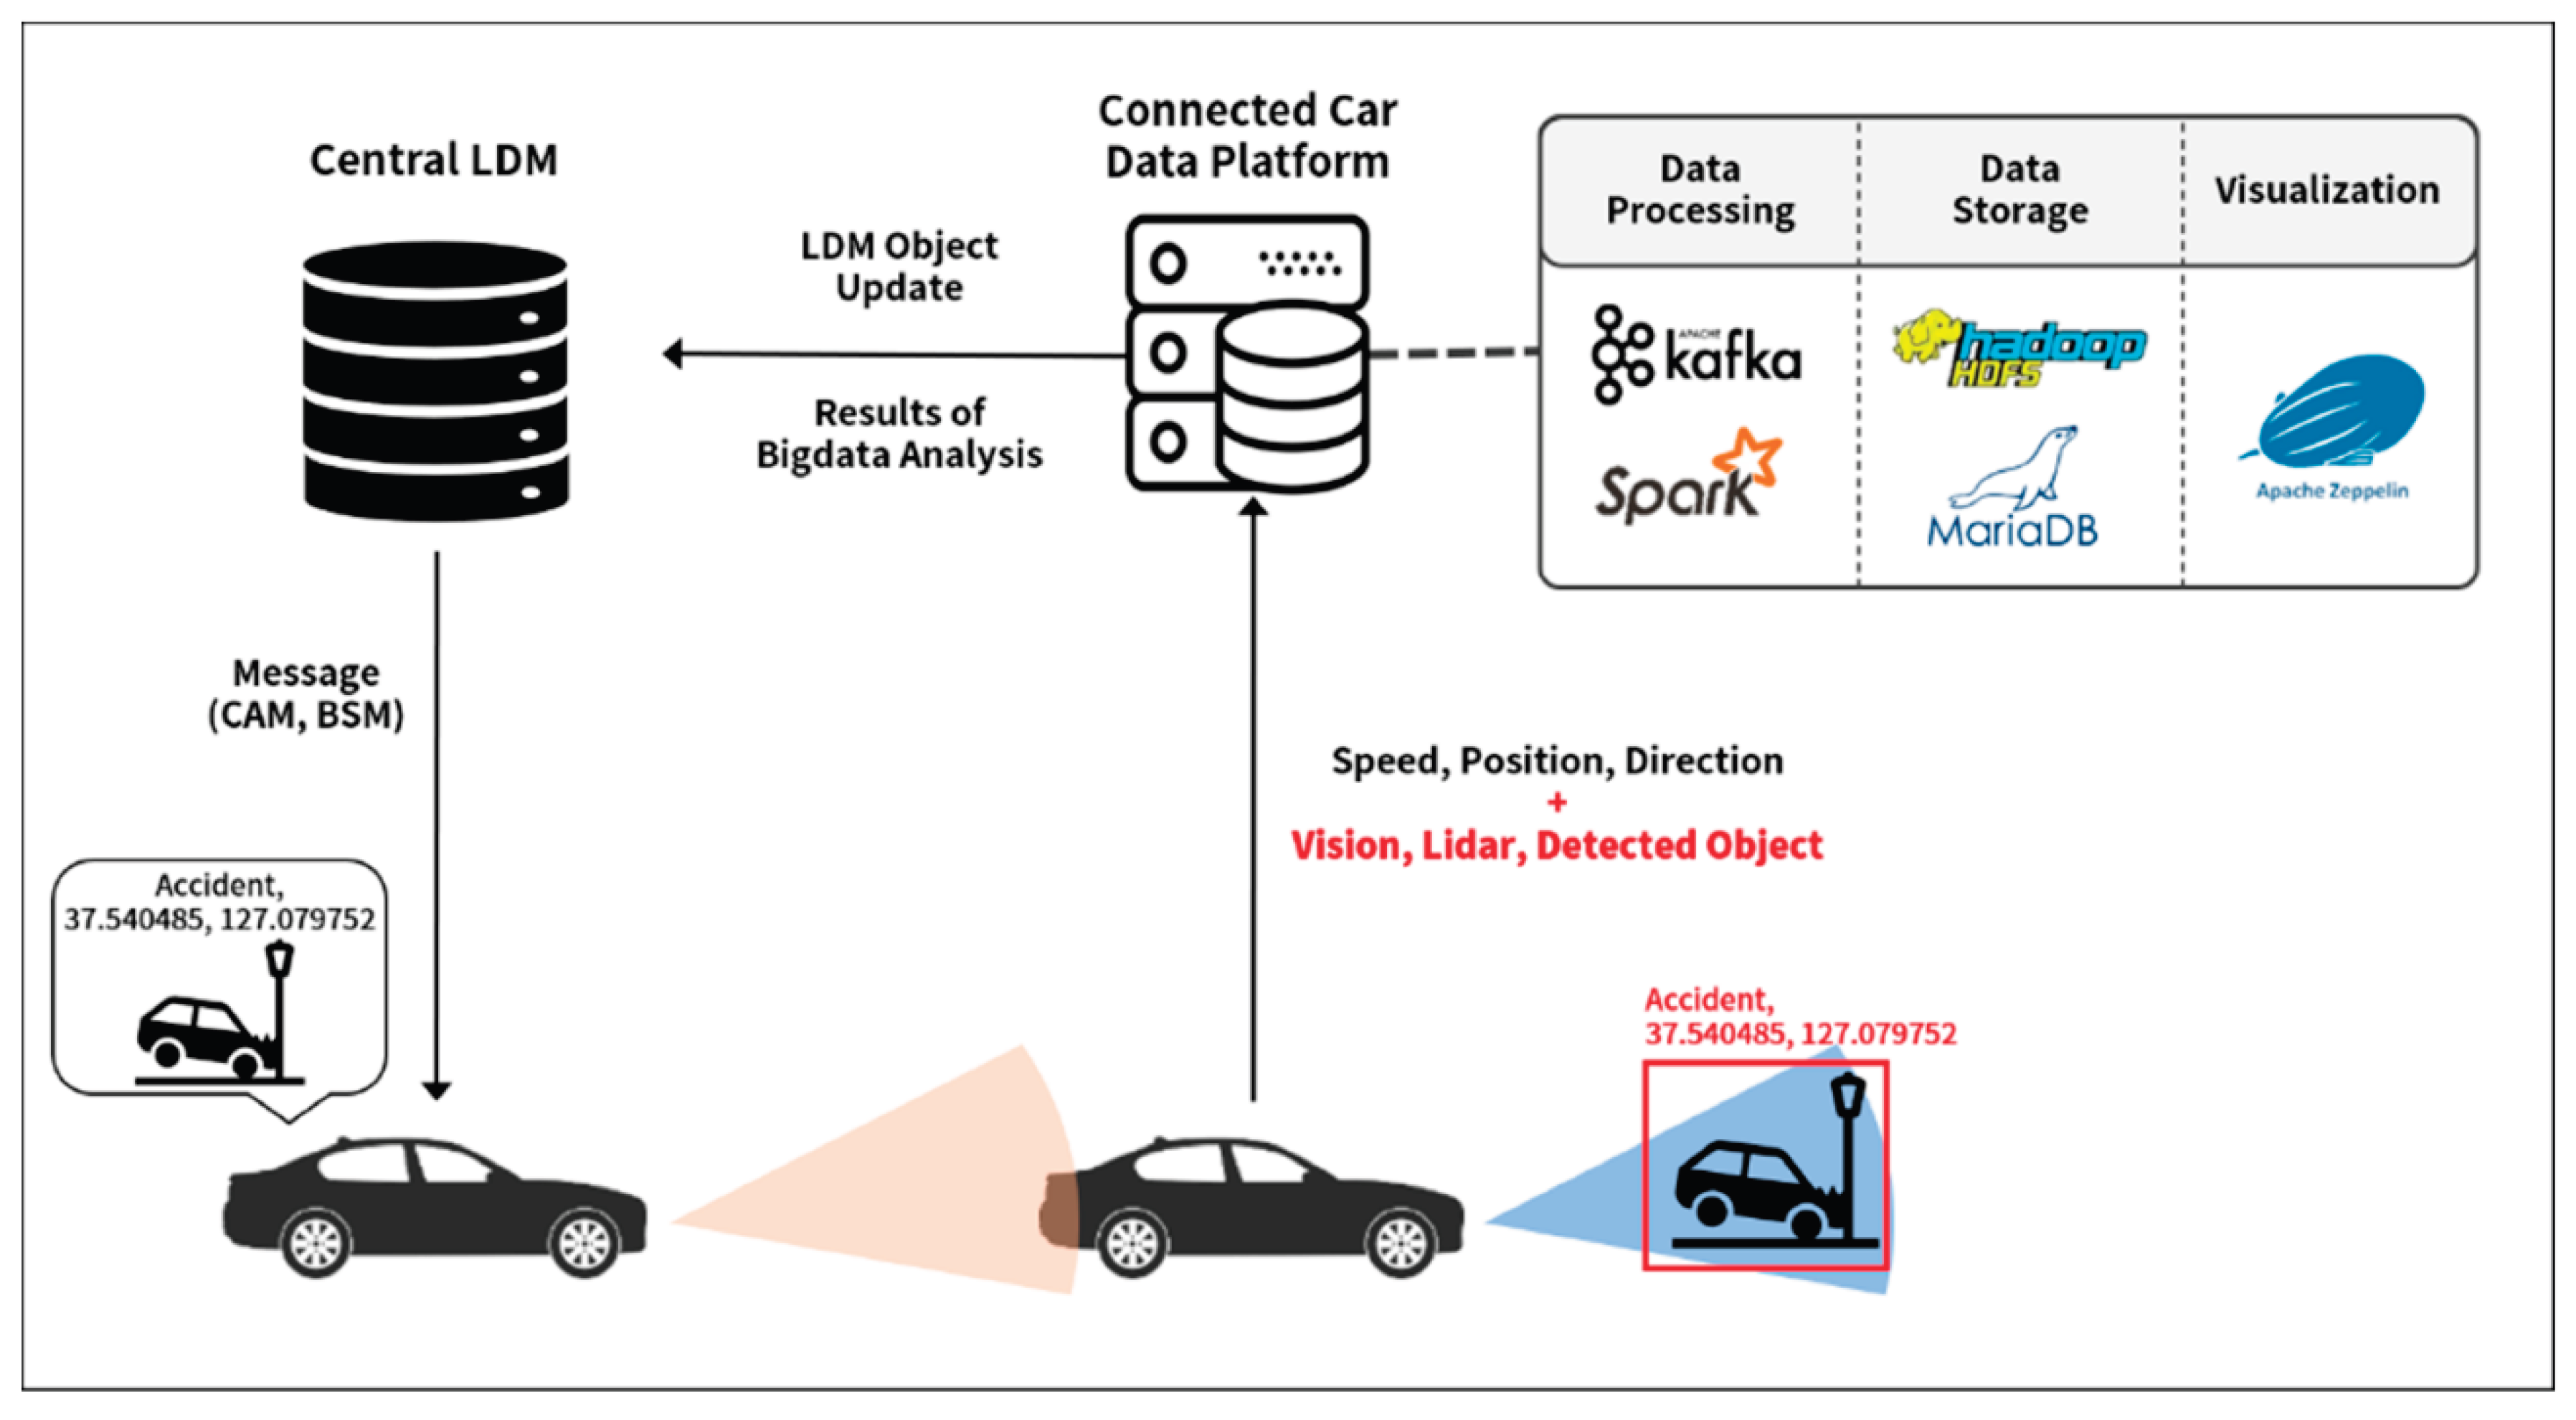
Automated Data Collection Vehicles (ADCVs) are unmanned vehicles equipped with sensors, cameras, and other technologies to gather data autonomously. These vehicles can operate on land, in the air, or underwater, depending on the type of environment they’re designed for. ADCVs are widely used in various industries for mapping, surveillance, monitoring, and inspection.
Figure 4.
Automated Data Collection Vehicle (ADCVs).
- a.
- Objective Definition: The first step involves defining the mission’s objectives, such as mapping a location, monitoring an area, or inspecting a structure.
- b.
- Pre-programming Routes: Operators pre-set the vehicle’s route or mission path using mapping software or autonomous planning systems. For some vehicles, especially in complex environments, artificial intelligence (AI) helps optimize the path.
- c.
- Sensor Selection and Calibration: The specific sensors (e.g., cameras, LiDAR, sonar) are selected and calibrated based on the type of data needed and environmental conditions
- d.
- Autonomous Navigation: ADCVs use GPS, inertial measurement units (IMU), and sometimes Simultaneous Localization and Mapping (SLAM) algorithms to navigate and avoid obstacles in real-time.
- e.
- Terrain Adaptation: Ground-based vehicles use radar, ultrasonic sensors, or LiDAR for obstacle detection and terrain adaptation. Aerial and marine vehicles may rely on depth sensors, sonar, or altitude sensors.
- f.
- Real-Time Adjustment: AI and machine learning algorithms help the vehicle adapt to unexpected conditions (e.g., obstacles, weather changes) to stay on course or find a new path if necessary.
2.3.9. Geospatial Information Systems (GIS)
Geospatial Information Systems (GIS) enable transportation agencies to map, analyze, and manage data for various infrastructure assets in a spatial format. GIS integrates asset data with geographic information, providing a visual platform to display the locations and conditions of assets across the transportation network. CTDOT utilizes GIS for several critical assets, including roadway illumination, where a dedicated GIS layer maps the poles, lighting control cabinets, and conduit or circuit locations. This GIS layer was established in 2019 and is regularly updated as work is completed, ensuring that CTDOT’s asset data remains accurate and current. By using GIS, CTDOT can effectively monitor and manage the status of roadway illumination assets, supporting maintenance planning and efficient resource allocation. The spatial nature of GIS makes it a powerful tool for asset management, allowing agencies to visualize infrastructure data across wide geographical areas, identify patterns in asset conditions, and make data-driven decisions to enhance roadway safety and efficiency (Connecticut Department of Transportation, 2022).
2.3.10. Remote Sensing (Satellite Imagery)
Remote sensing satellite imagery is the collection and interpretation of data about the Earth’s surface using satellites equipped with sensors. These sensors capture images or measurements without direct contact with the area of interest, allowing for a comprehensive view from above. Satellite imagery is invaluable for monitoring environmental changes, mapping landscapes, tracking weather patterns, managing resources, and supporting various scientific and commercial applications.
Satellites are kept in specially designed orbits for certain uses. One of the most common is the geostationary orbit, whereby satellites would appear in a certain position in the sky unchanging from a specific point on Earth. By doing this, the satellite could constantly observe the same area. Geostationary satellites become very useful in regard to weather observations and applications. Polar orbits are similar, but satellites pass over the Earth’s poles. Polar-orbiting satellites can view the entire world over time. Since these satellites revisit the same area at regular time intervals, it enables one, therefore, to monitor over the whole globe and perform periodic imaging of targeted locations.
The orbital temporal resolution, or revisit time over the same spot, will depend on that satellite’s orbit, sensor type, mission purpose, and other factors. For instance, weather satellites can revisit a location every 15 minutes because that befits their mission of providing current data; other Earth observation satellites could have revisit times days to weeks apart depending on which operations take precedent.
2.4. Data Sources
2.4.1. Infrastructure-Related Datasets
2.4.1.1. Blyncsy
Blyncsy is an advanced technology platform designed to enhance roadway maintenance and asset inventory management by utilizing artificial intelligence (AI) and crowd-sourced imagery. The platform aids cities and state Departments of Transportation (DOTs) in automating the inspection and assessment of road conditions, thereby improving efficiency and safety while significantly reducing costs associated with traditional manual inspections.
Blyncsy employs AI-powered tools to automatically detect and analyze numerous roadway features, including:
- Pavement Conditions: It provides assessments of pavement quality and detects issues such as cracks and potholes.
- Road Striping Visibility: The technology evaluates the visibility and retroreflectivity of road markings to ensure they meet safety standards.
- Asset Inventory: Blyncsy helps maintain an up-to-date inventory of roadway assets such as signs, guardrails, and traffic signals, detecting damage or degradation in real-time.
- Crowd-Sourced Data Utilization: By harnessing data from over 800,000 vehicles, the platform delivers actionable insights quickly, often within 60 seconds of a vehicle passing.
The platform is designed to create safer and more efficient transportation networks, addressing the increasing demands for roadway management amid rising population and traffic demands.
Examples of US States Implementing Blyncsy Technology
- Hawaii: The Hawaii Department of Transportation utilizes Blyncsy’s services to enhance roadway safety and management.
- Texas: The North Central Texas Council of Governments, along with the City of Plano, has integrated Blyncsy’s technology to improve traffic management and roadway maintenance.
- New Jersey: The Port Authority of New York and New Jersey employs Blyncsy’s platform for managing roadway conditions and asset inventories efficiently.
- Through these implementations, Blyncsy demonstrates its effectiveness in helping state and local governments streamline their transportation infrastructure management efforts, ensuring safer roads for all users.
2.4.1.2. Trimble
Trimble Maps is a comprehensive suite of mapping solutions designed to support various applications, particularly in commercial vehicle routing, scheduling, and geospatial analytics. It specializes in providing high-quality map data and routing information tailored for different industries, such as transportation, logistics, and utilities. Here are the key features and functions of Trimble Maps:
- Commercial Vehicle Routing: Trimble Maps offers optimized routing specifically for commercial vehicles, considering factors like vehicle size, weight restrictions, and road regulations. This helps ensure compliance and efficiency in delivery operations.
- Scheduling and Visualization: The platform provides tools for scheduling resources and visualizing routes in a map-centric environment, enabling businesses to manage their fleet and logistics efficiently.
- Map Data and Analytics: Trimble Maps uses high-precision map data, built from a combination of satellite imagery and ground-based data collection, to deliver accurate and up-to-date mapping information. This data can inform key operational decisions for industries relying on geographic insights.
- API and Integration: The Trimble Maps platform supports the development of applications through its software development kits (SDKs) and application programming interfaces (APIs), allowing for customized integrations in various business environments.
Numerous states across the United States utilize Trimble Maps for its advanced features in transportation and logistics management. Here are examples of how some states use Trimble Maps solutions:
- California: Many transportation agencies in California leverage Trimble Maps for routing and managing commercial vehicle operations, particularly in urban environments like Los Angeles, where traffic congestion and compliance with local regulations are critical.
- Illinois: Trimble Maps is used by logistics companies in Illinois to enhance routing efficiency for deliveries in urban and suburban areas. The data helps to navigate complex road networks and optimize travel times, especially in metropolitan regions like Chicago.
- Florida: In Florida, Trimble Maps provides essential mapping solutions for local governments and utility companies. The platform’s routing and scheduling capabilities assist in managing service routes for field technicians and delivery vehicles across the state.
- Texas: Texas transportation authorities utilize Trimble Maps to improve the planning and execution of logistics operations, managing the state’s vast network of roads and highways effectively. Fleet operators also rely on Trimble’s routing tools to ensure compliance with state-specific regulations.
- Minnesota: Local municipalities in Minnesota have adopted Trimble Maps for managing snow removal and maintenance routes, leveraging optimized routing capabilities for enhanced public service efficiency during winter weather conditions
Trimble Maps is an integral tool for many states in the U.S., enhancing transportation logistics and operational efficiency across multiple sectors. Its advanced features and capabilities empower businesses and government agencies to make informed decisions based on accurate geographical data, ultimately leading to better service delivery and resource management.
2.4.2. Commercial Datasets
2.4.2.1. Waze
Waze is a community-driven navigation application that provides real-time traffic and road information, helping users to find the fastest routes to their destinations. It was created in 2009 and has gained popularity for its innovative use of crowd-sourced data, allowing drivers to report various road conditions and incidents, such as traffic jams, accidents, police presence, and obstacles on the road. The application utilizes this data to calculate the most efficient routes, adapting dynamically as conditions change.
The main features and functionalities of Waze include:
Real-Time Updates: Waze uses data gathered from its users to offer live updates on traffic conditions, helping drivers avoid congestion and find quicker routes to their destinations.
- Community Engagement: Waze encourages its users to contribute by reporting relevant information, which enhances the accuracy of the navigation system. Users can report traffic situations, accidents, police activity, and other relevant incidents instantly.
- Crowd-Sourced Navigation: The app collects data from a massive user base, allowing it to provide up-to-date routing information based on current traffic conditions.
- Customizable Features: Users can customize their navigation experience by choosing different voice prompts and accessing features like integration with music apps.
- Competitions and Rewards: Waze includes a gamification aspect where users earn points for using the app, reporting incidents, and contributing to map corrections, which adds a fun element to driving.
Waze is widely utilized across various states in the U.S. to improve traffic management and navigation. Some notable examples include:
- California: Waze has partnered with various cities in California to help manage traffic flows and optimize routing during major events.
- New York: Waze is actively used in New York City, where it assists in managing the dense traffic and provides real-time updates tailored for the urban environment.
- Florida: The Florida Department of Transportation collaborates with Waze to enhance traffic conditions by sharing data that helps optimize travel routes and reduce congestion.
- Texas: In Texas, Waze has been integrated into local transportation management systems, allowing cities to use real-time traffic data to inform drivers about road conditions.
Through these integrations, Waze demonstrates its effectiveness not only as a navigation tool but also as a resource for state transportation agencies aiming to improve road safety and efficiency.
2.4.2.2. INRIX
INRIX is a company that provides location-based data and software-as-a-service analytics, focusing on real-time and historical traffic conditions, road safety, and parking availability. The core functionality of INRIX includes its analytics applications that utilize connected vehicle data to assist transportation professionals in assessing and improving transportation systems and mitigating traffic congestion. INRIX Signal Analytics, for instance, is a cloud-based platform that offers insights and visualizations to optimize signalized roadways without the need for traditional road sensors. The platform helps in identifying and prioritizing intersection and corridor improvement projects, thus maximizing traffic flow performance.
INRIX is identified as a company that specializes in location-based data and analytics. Specifically, it offers software-as-a-service (SaaS) solutions that focus on:
- Real-time Traffic Conditions: Providing up-to-date information on traffic situations, which can assist drivers and transportation managers in making informed decisions about route choices.
- Historical Traffic Data: Offering insights into past traffic patterns which can be crucial for understanding trends and planning for future urban development and roadway improvements.
- Road Safety: Analyzing data related to accidents and roadway conditions to improve safety measures.
- Parking Availability: Assisting drivers in finding parking spaces through real-time availability data, which can reduce congestion caused by drivers searching for parking.
2.6.2.2.2. Some examples of states that utilize INRIX traffic data include:
California: INRIX provides data that helps in reducing traffic congestion and improving roadway management in California’s busy urban areas.
- Texas: Local transportation agencies in Texas leverage INRIX data to analyze traffic flows and optimize traffic signal timings, thereby improving efficiency in urban transport.
- Florida: Florida uses INRIX analytics to assess traffic patterns and make decisions about road safety and infrastructure improvements.
- Virginia: Transportation authorities in Virginia utilize INRIX data for real-time traffic management and long-term road planning.
- These states demonstrate the extensive application of INRIX’s data-driven solutions for optimizing transportation systems and enhancing safety across their roadways.
2.4.2.3. StreetLight
Streetlights are outdoor lighting fixtures installed along roads and pathways to illuminate public areas at night, enhancing visibility and safety for pedestrians and drivers. Their primary functions include:
- Improving Nighttime Visibility: Streetlights provide essential illumination, making it safer for vehicles and pedestrians to navigate streets after dark. This visibility helps to prevent accidents and reduces the risk of crime.
- Enhancing Public Safety: Well-lit streets can deter criminal activity by increasing visibility, thereby contributing to a sense of security for residents and visitors.
- Supporting Urban Infrastructure: Streetlights are integral to urban design and infrastructure, often designed to complement the aesthetic of public spaces while meeting functional requirements.
- Facilitating Outdoor Activities: By extending the usable hours of public spaces, streetlights allow for nighttime activities, such as walking, cycling, and outdoor events, thus enhancing community engagement.
Over the years, various types of streetlights have been adopted, including:
- Incandescent and Halogen Lamps: Initially popular for their warm glow but now largely phased out due to inefficiency.
- High-Intensity Discharge (HID) Lamps: Including mercury vapor and sodium vapor lamps, these provide bright illumination but have higher energy costs and environmental impacts.
- LED Lights: Increasingly favored for their energy efficiency, long lifespan, and low maintenance needs. Many cities are transitioning to LED technology as part of sustainability initiatives.
All U.S. states have advanced street lighting systems that enhance urban environments and improve safety.
- California: The state has made significant investments in converting traditional streetlights to energy-efficient LED lighting. Cities like Los Angeles have implemented extensive LED streetlight programs to reduce energy consumption and maintenance costs.
- New York: New York City employs a vast network of streetlights to provide safety in one of the busiest urban environments in the world. The city’s lighting initiatives also focus on smart streetlights that can adapt to traffic conditions.
- Florida: Florida has implemented various streetlight projects aimed at improving safety along major roads and highways. Many urban areas have upgraded to LED lighting to enhance visibility while promoting energy efficiency.
- Texas: Texas cities, such as Houston and Austin, have developed comprehensive street lighting systems that provide effective nighttime illumination. The state’s transportation agencies often use streetlight data to improve road safety.
- Virginia: The state has focused on improving street lighting in rural and urban areas to enhance safety. Virginia uses advanced lamp technologies, including LEDs, to provide better illumination while minimizing energy usage.
Streetlights play a vital role in urban planning, safety, and community functionality across the United States. Different states employ various types of streetlights, with many transitioning to more energy-efficient solutions like LEDs to promote sustainability and improve public safety.
2.4.2.4. Google Maps
Google Maps is a comprehensive web mapping service provided by Google that offers detailed geographical data, navigation assistance, and various location-based services. It is utilized widely across the globe for both personal and professional purposes. The platform includes features such as:
Maps and Satellite Imagery: Google Maps provides both traditional road maps and high-resolution satellite imagery, allowing users to view detailed landscapes and urban infrastructures.
Street View: This feature enables users to virtually navigate streets through panoramic images captured at ground level. It offers a unique perspective for exploring neighborhoods and landmarks.
Real-Time Navigation: Google Maps offers turn-by-turn navigation for various modes of transportation, including driving, walking, biking, and public transit. It updates routes in real-time based on traffic conditions, minimizing travel time.
Location Search and Reviews: Users can search for restaurants, businesses, parks, and other points of interest, along with accessing user-generated reviews and ratings. This feature aids in making informed decisions about where to visit.
Route Planning: The service allows users to plan routes by calculating the best paths based on distance, estimated time of arrival, and current traffic situations.
Google Maps is extensively used across all U.S. states, providing essential services for residents and tourists alike. Below are examples of some states where Google Maps is particularly impactful:
- California: In California, Google Maps is widely used for navigation in busy urban areas like Los Angeles and San Francisco. The state’s diverse geography is well represented in the platform, which is essential for both commuting and tourism.
- New York: Google Maps is indispensable in New York City, where it helps residents and tourists navigate the complex public transit system and congested streets. The app’s features such as real-time transit updates are crucial for travelers in the bustling city.
- Texas: In Texas, Google Maps aids drivers in navigating long distances between cities, as well as urban navigation in cities like Houston and Austin. Texas utilizes Google Maps for planning road trips and exploring its vast landscape.
- Florida: Florida residents and tourists use Google Maps extensively for navigating to attractions, beaches, and parks, particularly in tourist-heavy areas like Orlando and Miami. The service’s traffic updates help users avoid congestion during peak travel times.
- Illinois: In Illinois, Google Maps serves as a critical tool for navigating both urban environments like Chicago and rural areas. The platform provides information about local businesses and attractions, enhancing residents’ engagement with their communities.
Google Maps is an indispensable tool for millions of users in the United States, offering a wide range of functionalities that enhance navigation, exploration, and overall travel experiences. Its applications span across various states, significantly impacting urban planning, tourism, and daily commutes
2.4.2.5. Esri
Esri, a leader in geographic information system (GIS) technology, offers the ArcGIS platform, which is essential for transportation asset management across numerous state Departments of Transportation (DOTs) in the United States. ArcGIS provides powerful mapping and spatial data management capabilities, allowing agencies to visualize, analyze, and manage their infrastructure assets through real-time, location-based data. The platform’s ability to support detailed geospatial data enables DOTs to maintain comprehensive inventories of assets, monitor their conditions, and make data-driven decisions to optimize maintenance schedules, improve safety, and ensure long-term sustainability.
ArcGIS is highly versatile and integrates well with other data management systems, making it a valuable tool for various asset types, including pavements, signs, lighting, drainage culverts, and bridges. By offering interactive mapping, advanced analytics, and data integration capabilities, Esri’s platform enhances how DOTs manage infrastructure, allowing them to respond proactively to maintenance needs, track asset performance, and comply with federal and state reporting requirements. Furthermore, Esri’s mobile data collection integration enables field staff to update asset information in real-time, ensuring that DOTs have the most current data available for decision-making.
Esri, known for its powerful ArcGIS platform, plays a pivotal role in the geospatial management of transportation assets at the Connecticut Department of Transportation (CTDOT). Within the scope of the Transportation Asset Management Plan (TAMP), Esri’s ArcGIS provides critical mapping and data management services, enhancing visibility and allowing for spatial analysis of infrastructure assets such as signs, roadway illumination, and drainage culverts. The platform enables CTDOT to monitor, manage, and display assets with geospatial accuracy, fostering data-driven decision-making processes by offering a real-time visual representation of asset conditions and locations (Connecticut Department of Transportation, 2022).
Esri’s ArcGIS platform hosts detailed data on various assets, with comprehensive attributes for drainage culverts and signs that ensure assets are managed effectively:
- Drainage Culverts: The Esri platform maintains detailed records for each culvert asset, including attributes such as installation year, culvert type, project reference, and physical specifications (e.g., height, length, diameter). It also captures inspection data, including inspector name, inspection date, and condition ratings. These attributes are regularly updated to reflect the current state of the asset, aiding in consistent and proactive management.
-
Sign Attributes: The platform manages an extensive list of attributes for traffic signs, covering structural, geospatial, physical, and maintenance aspects. Key attributes include:
- ○
- Structural Information: Mounting type, number of posts, and positional data.
- ○
- Geospatial Coordinates: Including latitude, longitude, and route ID.
- ○
- Physical Specifications: Height, width, area, material, sheeting type, and panel thickness.
- ○
- Visual Elements: Background color, legend color, and specific sign legend.
- ○
- Maintenance and Fabrication Data: Manufacturer, installation date, and current maintenance status.
To organize sign data, Esri employs a two-layer structure: the Sign Assembly layer, which covers geospatial and structural details, and the Sign Panel layer, which holds specific signage information such as legend, colors, and dimensions. This parent-child layering enables streamlined asset management, allowing each sign assembly to contain multiple panels as needed.
Esri’s ArcGIS platform enhances CTDOT’s asset management capabilities through organized, layered views of asset data, allowing assets like signs and drainage culverts to be managed within individual, distinct layers. This setup is beneficial for real-time updates and maintenance tracking:
- Drainage Assets: Mapped and inspected drainage culverts are kept updated in the system, supporting predictive maintenance efforts. By allowing planners to view the state of each asset, CTDOT can proactively schedule repairs or replacements, maintaining assets in a state-of-good-repair.
- Sign Assets: Esri’s structured layers enable a comprehensive overview of signage across the transportation network. This setup simplifies data retrieval and analysis, where relationships between sign assemblies (support structures) and individual sign panels are clearly represented, aiding in maintenance, replacements, and condition assessments.
- Data Sources: Data within the Esri platform is sourced from multiple CTDOT internal divisions, consolidating comprehensive asset information. For drainage culverts, inspections and mappings are carried out by district engineers and staff, with updates made in real time. For signs, the Division of Traffic Engineering maintains and updates data, with information sourced from project work, service memos, or uploads via formatted spreadsheets.
While Esri’s platform provides robust functionality, there are areas for potential improvement in its application at CTDOT. Access to drainage culvert data, for example, could be expanded to allow more agency users to benefit from this information. Additionally, ensuring uniformity in inspection records, particularly in comments and mapping capabilities, is needed to enhance data quality and consistency.
The Esri platform is similarly employed by other state DOTs to support their transportation asset management practices:
- California DOT (Caltrans): Caltrans leverages Esri’s ArcGIS for managing a wide array of assets, including pavements, bridges, and ITS components. By providing real-time, location-based insights, Esri helps Caltrans with district-level planning and performance tracking, enabling efficient resource allocation and aligning with state and federal standards (California Department of Transportation, 2022).
- Utah DOT (UDOT): UDOT utilizes Esri’s ArcGIS for mapping and managing key assets, including pavement markings, signs, and lighting systems. Integration with mobile data collection systems allows UDOT to perform real-time updates in the field, thus ensuring data accuracy. This approach supports UDOT’s strategic goals of optimizing mobility and enhancing public safety (Utah Department of Transportation, 2023).
- New York DOT (NYSDOT): NYSDOT uses Esri’s GIS solutions within its Enterprise Asset Management System (EAMS) to manage infrastructure assets such as traffic signals, signs, and pavement markings. Esri’s geospatial capabilities help NYSDOT centralize asset information across departments, enabling comprehensive risk assessments, maintenance planning, and project prioritization (New York Department of Transportation, 2021).
Esri’s ArcGIS platform, widely utilized across various state DOTs, proves invaluable for supporting asset inventory, geospatial analysis, and data integration. Through ArcGIS, states like Connecticut, California, Utah, and New York achieve robust data management, resource allocation, and strategic planning in asset management. For TxDOT, implementing Esri’s ArcGIS platform could provide similar benefits, supporting centralized asset data management, enhanced spatial analysis, and performance-based decision-making processes.
2.4.2.6. AWARI by Bentley
AWARI (formerly InspectTech) is a commercial asset management and inspection software platform developed by Bentley Systems, a prominent provider of infrastructure management and engineering software. This platform is widely used by transportation departments, including the Connecticut Department of Transportation (CTDOT), to streamline asset inspections, manage inventory, and support informed decision-making for infrastructure maintenance and operations.
Customized specifically for CTDOT, AWARI consolidates information on multiple asset types, including bridges, sign supports, highway buildings, and traffic signals, into a centralized system, thereby replacing what was previously scattered across multiple repositories. AWARI not only maintains inventory data but also includes detailed inspection results, work recommendations, and maintenance history for each asset type.
AWARI serves as the authoritative database for several key assets within CTDOT’s portfolio, including bridges, sign supports, highway buildings, and traffic signals (specifically span poles and mast arms). Each asset type managed within AWARI has unique data requirements and inspection protocols, as follows:
- Bridges: Bridge data in AWARI is extensive, including federally required NBI data, custom inspection forms for different structural components, and bridge element data. Key inspection forms include Structure Inventory and Appraisal (BRI-19), Underwater Inspections (BRI-58), Fracture Critical Inspections, and other forms that document the health and characteristics of bridge components like decks, superstructures, substructures, and foundations. Additionally, AWARI supports bridge performance monitoring by tracking deterioration and helping CTDOT plan for proactive maintenance.
- Sign Supports: Sign supports are inspected on a cycle determined by their type (e.g., full span overhead, cantilever, bridge-mounted, or aluminum), with intervals of 2 to 6 years. Inspections cover components such as structure, foundation, traffic safety features, and signs & illumination. AWARI enables CTDOT to record geospatial data (GPS location) for each sign support, providing an accurate spatial representation for asset management and safety assessments.
- Traffic Signal Components: AWARI manages condition data for span poles and mast arms associated with traffic signals. Custom forms capture essential details such as structural integrity, foundation condition, and overall condition, enabling CTDOT to systematically monitor the health of these traffic signal components and prioritize repairs.
- Highway Buildings: During the 2017/2018 inspection program, CTDOT used AWARI to conduct its first comprehensive assessment of highway buildings. Custom inspection forms capture data across several dimensions, such as architectural structure, mechanical systems, plumbing, and electrical systems. Each building is represented by a GPS location, and site boundaries are mapped as polygons, which may be integrated into ATLAS 2.0 for future analysis. AWARI facilitates condition scoring for each building, which helps prioritize maintenance and modernization efforts.
2.4.3. Satellite Imagery
Satellite imagery encompasses images of Earth collected by imaging satellites operated by various governments and businesses around the world. These images, also referred to as Earth observation imagery or spaceborne photography, have a wide range of applications, making them valuable tools in multiple fields.
2.4.4. Lidar Data
LiDAR (Light Detection and Ranging) data is a critical technology that employs laser light to measure distances and produce precise, three-dimensional information about the Earth’s surface and object characteristics. This remote sensing method has various applications, from mapping and surveying to environmental monitoring and infrastructure development.
2.4.5. Traffic Cameras
Traffic cameras play a vital role in modern traffic management and law enforcement. These devices are used to monitor vehicle movements and enhance road safety by capturing real-time images and video of road conditions and traffic violations.
2.4.6. GPS
GPS, or Global Positioning System, is a satellite-based radio navigation system that provides accurate geolocation and time information to users worldwide. It has become an essential tool in various sectors, enabling a broad range of applications, from navigation and mapping to time synchronization in telecommunications and emergency response.
2.5. Practices in State DOTs
2.5.1. Texas Department of Transportation (TxDOT)
The Texas Department of Transportation (TxDOT) has developed a comprehensive approach to asset management outlined in its 2022 Transportation Asset Management Plan (TAMP), which serves as a 10-year strategic framework for managing the state’s extensive network of pavements and bridges. With 201,225 lane miles of roadways and 34,865 bridges under its ownership, TxDOT oversees the largest system of pavements and bridges in the United States, accommodating over 185.8 billion vehicle miles annually (2022 Transportation Asset Management Plan, June 2022). Given Texas’s role as the nation’s second-largest economy, the sustainability of its transportation infrastructure is critical to supporting the growing demands for population mobility, vehicle traffic, and freight movement across the state.
Currently, TxDOT’s TAMP focuses exclusively on pavements and bridges, prioritizing their maintenance to ensure a state-of-good-repair (SOGR). Maintaining these assets in optimal condition is essential to prevent increased transportation costs for individuals and freight, which would arise if pavements and bridges fell below SOGR standards (2022 Transportation Asset Management Plan, June 2022). While TxDOT’s TAMP presently includes only pavements and bridges, other state DOTs have recognized the value of expanding their asset inventories to include additional assets such as traffic signals, sign supports, pavement markings, and highway buildings. Incorporating these assets is seen as a way to enhance roadway safety and integrity, utilizing various data sources to inform procurement and maintenance decisions more effectively.
2.5.1.1. Pavement and Bridge Management
TxDOT employs a structured approach to manage pavement and bridge assets, grounded in detailed, multi-year planning. Each district within TxDOT is responsible for developing Four-Year Pavement and Bridge Plans, which prioritize maintenance and improvement projects based on asset condition assessments and projected needs. These plans allow districts to align their activities with TxDOT’s statewide goals, fostering consistency in asset conditions across Texas’s expansive transportation network. The planning process emphasizes preventive maintenance, targeting early interventions that prolong asset life and reduce long-term costs (TxDOT, 2022).
For bridge assets, TxDOT leverages AASHTOWare Bridge Management (BrM), an advanced tool designed for lifecycle planning, project prioritization, and budgeting. BrM enables TxDOT bridge managers to forecast maintenance and rehabilitation needs accurately, helping to optimize decision-making. The tool’s configuration for TxDOT allows it to integrate predictive analytics for bridge health, assisting managers in addressing structural deficiencies before they escalate. The use of BrM exemplifies TxDOT’s commitment to data-driven asset management, as it provides the ability to simulate budget scenarios and assess the impact of different funding levels on bridge conditions over time.
2.5.1.2. Pavement Management Plan (PMP)
The Pavement Management Plan (PMP) is another cornerstone of TxDOT’s asset management framework. This tool integrates both preventive and rehabilitation treatments to maintain pavements in a State of Good Repair (SOGR). By employing predictive analytics, TxDOT can assess pavement conditions and anticipate deterioration trends, enabling proactive maintenance scheduling. The PMP’s structured approach allows TxDOT to adapt its maintenance strategies based on asset conditions, traffic demands, and funding availability, ensuring that pavement assets are maintained cost-effectively and reliably.
2.5.1.3. Risks and Expanding Data-Driven Decision Making
A significant component of TxDOT’s TAMP is risk management. The plan identifies potential risks to infrastructure operation, including natural hazards, increased freight demands, and evolving technological requirements. TxDOT’s TAM framework emphasizes continuous monitoring and updating of asset condition data, supporting the agency’s preparedness for these risks. Through this framework, TxDOT can proactively plan for potential infrastructure disruptions, ensuring minimal impact on transportation services. The agency’s approach highlights the importance of data integration across various assets, making data-driven decision-making an essential aspect of effective asset management (2022 Transportation Asset Management Plan, June 2022).
2.5.1.4. Future Directions and Potential Expansion of Asset Categories
TxDOT acknowledges the benefits of potentially expanding its asset inventory to include additional categories, following the example of other state DOTs. Adding assets such as traffic signals, sign supports, pavement markings, and highway buildings could allow TxDOT to manage these components more effectively within a TAM framework. Such an expansion would enable TxDOT to leverage diverse data sources for more informed decisions, thereby enhancing safety, performance, and cost-efficiency in asset management.
In summary, TxDOT’s 2022 TAMP exemplifies a structured and data-driven approach to asset management, focusing on the maintenance and preservation of critical infrastructure. By continuously refining its asset management practices and aligning with both state and federal guidelines, TxDOT aims to uphold its commitment to safe, efficient, and resilient transportation infrastructure across Texas.
2.5.2. District DOT (DDOT)
Approximately six years ago, a series of news stories drew attention to a pattern of unfair ticketing brought on by Washington, D.C.’s many confusing or contradictory parking signs. As a result, DDOT’s Research Chief Information Officer (RCIO) made correcting these signs a high priority. At that time, sign management was a paper-based process and DDOT lacked an accurate, comprehensive sign dataset that would allow staff to identify conflicting signs. Because signs are a complex asset with over 2,000 unique types, DDOT’s Information Technology department conducted market research to identify a potential solution. The ideal solution would leverage GIS and integrate with the DDOT linear referencing system (LRS). It soon became clear that no off-the-shelf geospatial solution could help them inventory and correct sign conflicts. DDOT’s group of five full-time GIS staff and two software developers, one full-time and one contractor, undertook the task of developing Signworks, a custom LRS-driven approach to sign asset management and parking analysis.
Signworks is composed of two applications, an inventory manager application and a request application. The inventory manager application allows users to view sign data by clicking on a map and, for authorized users, to edit or correct the sign’s data. The request application allows an authorized user to create a request for any type of change to a DDOT sign. The applications are designed to help everyone involved in sign management by standardizing the cycle of sign management, from creating a new sign request to maintaining or changing an existing sign. Combined, the two applications will allow DDOT to develop a comprehensive, standardized, and authoritative sign inventory and ensure that all future signs are compliant with agency standards. Currently, Signworks is a browser-based asset tool; however, DDOT plans to make the tool a mobile application for field data collection in the future.
Figure 5.
DDOT Signwork.
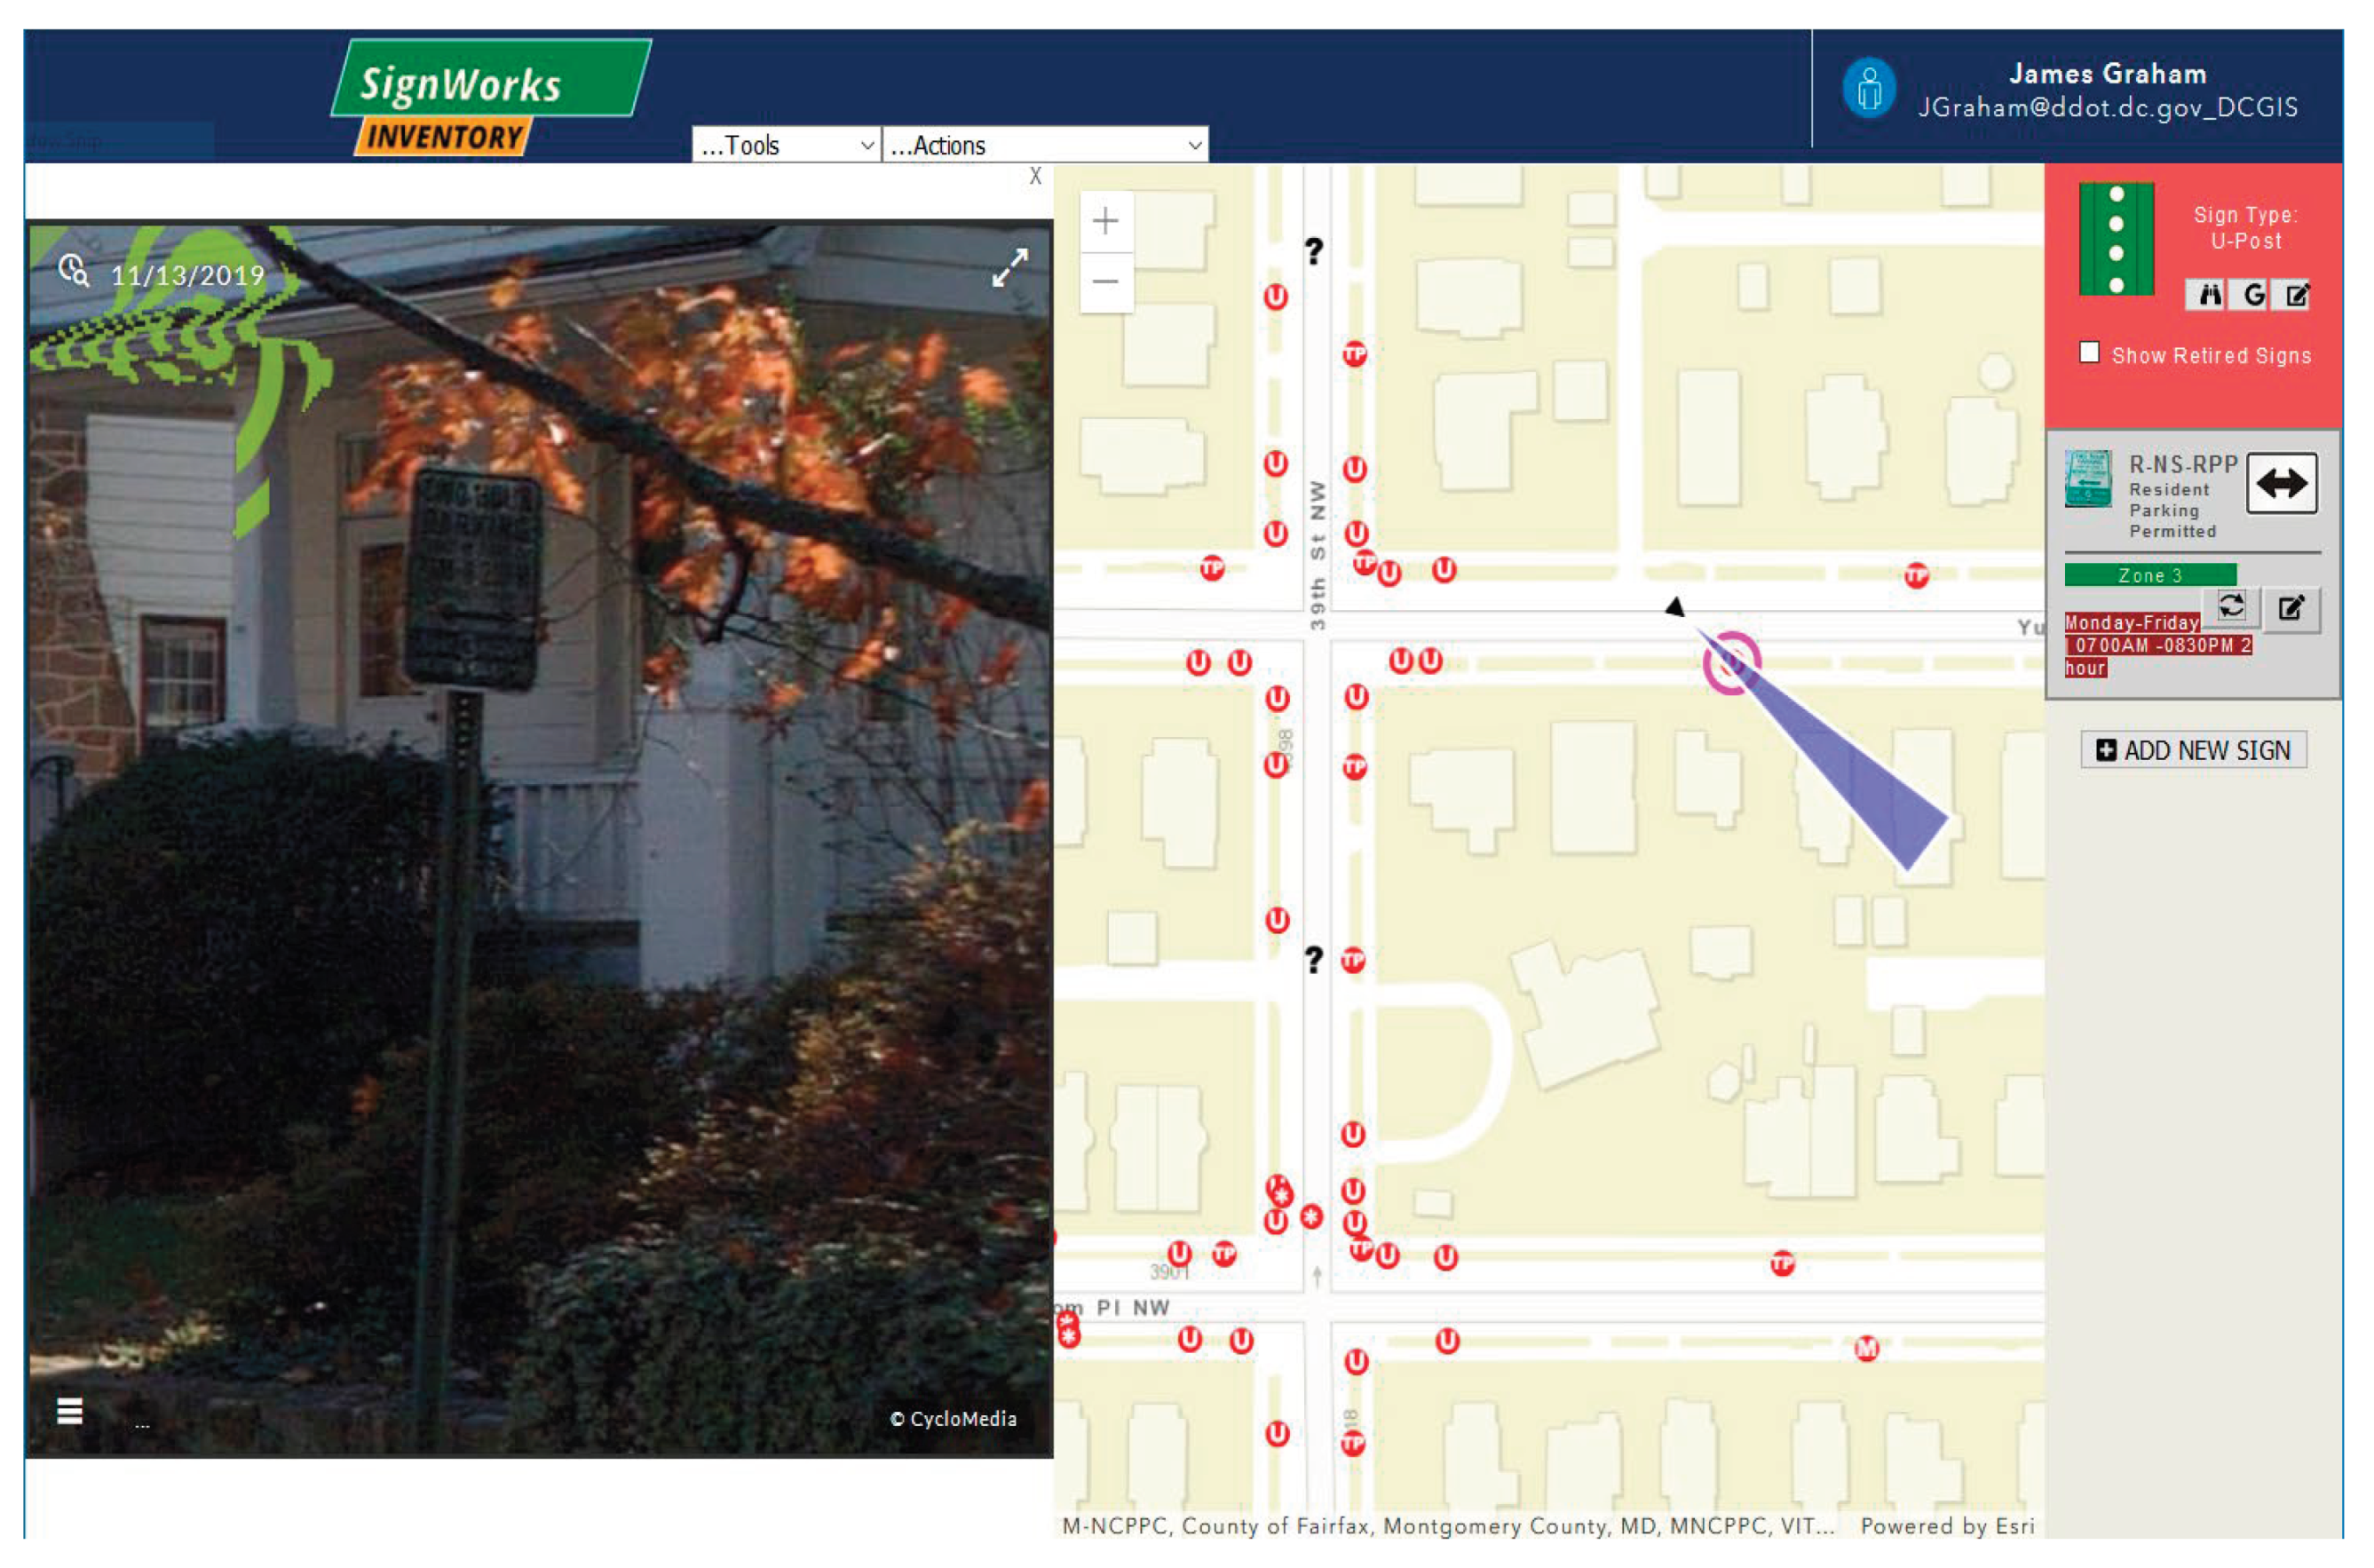
The Signworks inventory manager allows users to see the location of a street sign and click on it to see an image and description of the sign. Source: DDOT. Over the course of developing Signworks, the project team identified several technical challenges. One of the major technical challenges was the need for custom programming to work between various application programming interfaces (APIs), including Esri’s Javascript and Location Referencing API and Cyclomedia’s API for querying street view imagery. Developing an appropriate database structure proved another challenge, as the database had to store more than 2,000 unique sign types for use in both the request application and the inventory manager application.
The development team encountered organizational challenges as well. The IT department supports the entire agency, which puts it in an ideal position to see agency wide problems such as a lack of a standardized, data-centric workflow and update process for signs. However, migrating staff to Signworks remains a challenge. Paper-based systems, though inefficient, offer maximum flexibility when things get complicated—especially when installing or maintaining signs. From the field installer’s vantage point, it is difficult to see the agency-wide problems that a paper-centric system has caused. Some users have also expressed skepticism about adopting new technology, and managers are wary of adopting a new system that alters the way they evaluate and manage their team. Despite these challenges, the IT department has made significant progress through clearly communicating the individual and agency-wide benefits of Signworks to both individual users and agency leadership.
An important takeaway from this project is the importance of including stakeholders in the design and planning process. After an initial request from field installation teams, IT began developing the tool on their own, which may have led to more resistance in the adoption phase than if users had been continually involved in prototyping the tool. Furthermore, the development and adoption process would have benefited from a permanent champion in DDOT’s leadership to see the project through to completion. Despite these challenges, overall DDOT has identified Signworks as a success. DDOT staff found that Signworks saves time in the sign management process.
2.5.3. Utah DOT (UDOT)
The Transportation Asset Management (TAM) process is dynamic, requiring cost-effective ways to keep data current. Traditionally, UDOT uses Mobile LiDAR every two years, but Aerial LiDAR offers a faster, more efficient alternative, especially in areas with significant changes, like post-construction zones. Aerial LiDAR collects data in days instead of months, providing a unique perspective that uncovers features like bridges and culverts, which might be hidden from ground-based platforms.
A project by Utah State University demonstrated that Aerial LiDAR is not only faster but also provides sufficient point density for most highway assets. The key advantage is its ability to detect hidden features from a broader viewpoint. However, to maximize accuracy, combining data from multiple sources—like Aerial LiDAR and high-resolution aerial imagery—is crucial. This data fusion approach compensates for the limitations of individual methods, offering both elevation and visual data to improve asset identification.
Despite some limitations, such as difficulty identifying small features like speed limit signs due to sparse data points, the combination of automated feature extraction and aerial techniques proved highly effective for large-scale applications. Moving forward, integrating Unmanned Aerial Vehicle (UAV) technology and automated workflows can enhance future data collection efforts, providing a comprehensive approach for highway maintenance and asset management.
Figure 6.
Bridges (left) and Culverts (right) in an airborne LiDAR data.
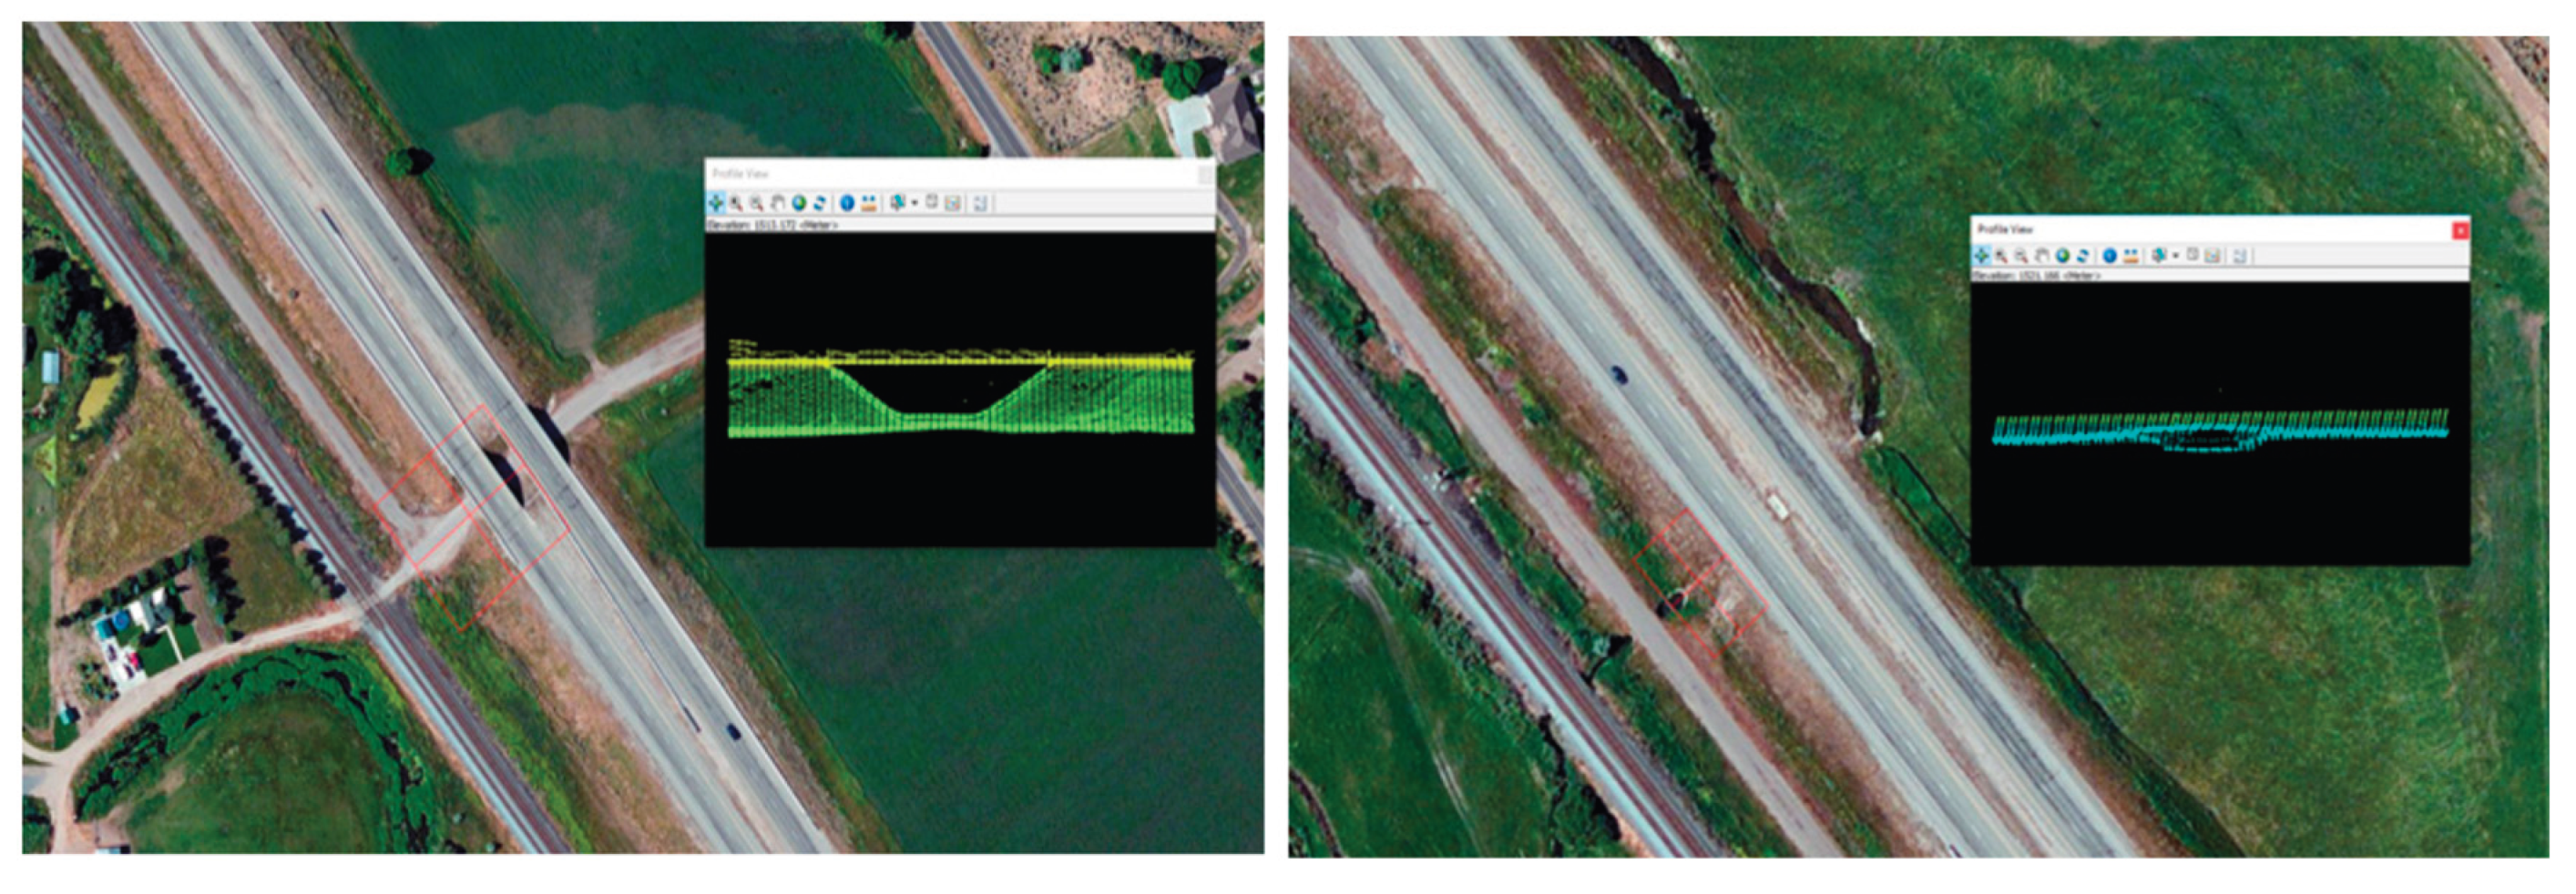
UDOT utilizes Esri’s ArcGIS for the mapping and management of key assets, including pavement markings, signs, and lighting systems. ArcGIS supports UDOT’s data-driven asset condition assessment by layering information on asset locations, conditions, and usage patterns. This platform’s integration with UDOT’s mobile data collection systems allows field staff to update asset information directly into the GIS in real-time, improving the accuracy and timeliness of data updates. UDOT’s use of Esri technology contributes to its strategic goals of optimizing mobility and achieving zero fatalities by ensuring critical infrastructure is adequately maintained (Utah Department of Transportation, 2023).
2.5.4. California DOT (Caltrans)
California’s Transportation Asset Management (TAM) system aims to efficiently manage the state’s extensive infrastructure by ensuring the condition and performance of critical assets through data-driven decision-making processes.
The California Transportation Commission has identified 20 asset classes for management by Caltrans, categorized into primary and supplementary assets. These assets include pavement, bridges, culverts, Intelligent Transportation Systems (ITS) elements, overhead signs, pump houses, closed circuit television (CCTV) cameras, weigh-in-motion scales, highway barriers, bridge barriers, roadside rest facilities, park and ride facilities, highway lighting, highway signs, sidewalks, traffic management centers, equipment shops, labs, maintenance stations, and office buildings.
Caltrans is also responsible for maintaining two overlapping highway systems: the State Highway System (SHS) and the National Highway System (NHS). The SHS includes state-owned assets, while the NHS encompasses both state and locally owned infrastructure, including highways managed by cities, counties, toll authorities, and federal agencies. Caltrans updates the TAM plan every four years and aligns it with the State Highway System Management Plan (SHSMP). This continuous cycle ensures that the performance gap analysis and investment strategies are aligned with district-level performance plans across 12 Caltrans districts.
California DOT (Caltrans) employs Esri’s ArcGIS platform as part of its comprehensive Transportation Asset Management Plan (TAMP), particularly to manage and display geospatial information for a wide array of assets, including pavements, bridges, and Intelligent Transportation Systems (ITS). Caltrans uses ArcGIS to facilitate real-time, location-based insights into its infrastructure assets, which enables district-level planning and performance tracking. This geospatial capability enhances Caltrans’ approach to lifecycle cost analysis and enables them to allocate resources more effectively to meet federal and state performance standards (California Department of Transportation, 2022).
Figure 7.
Automated Road and Pavement Condition Survey Van.
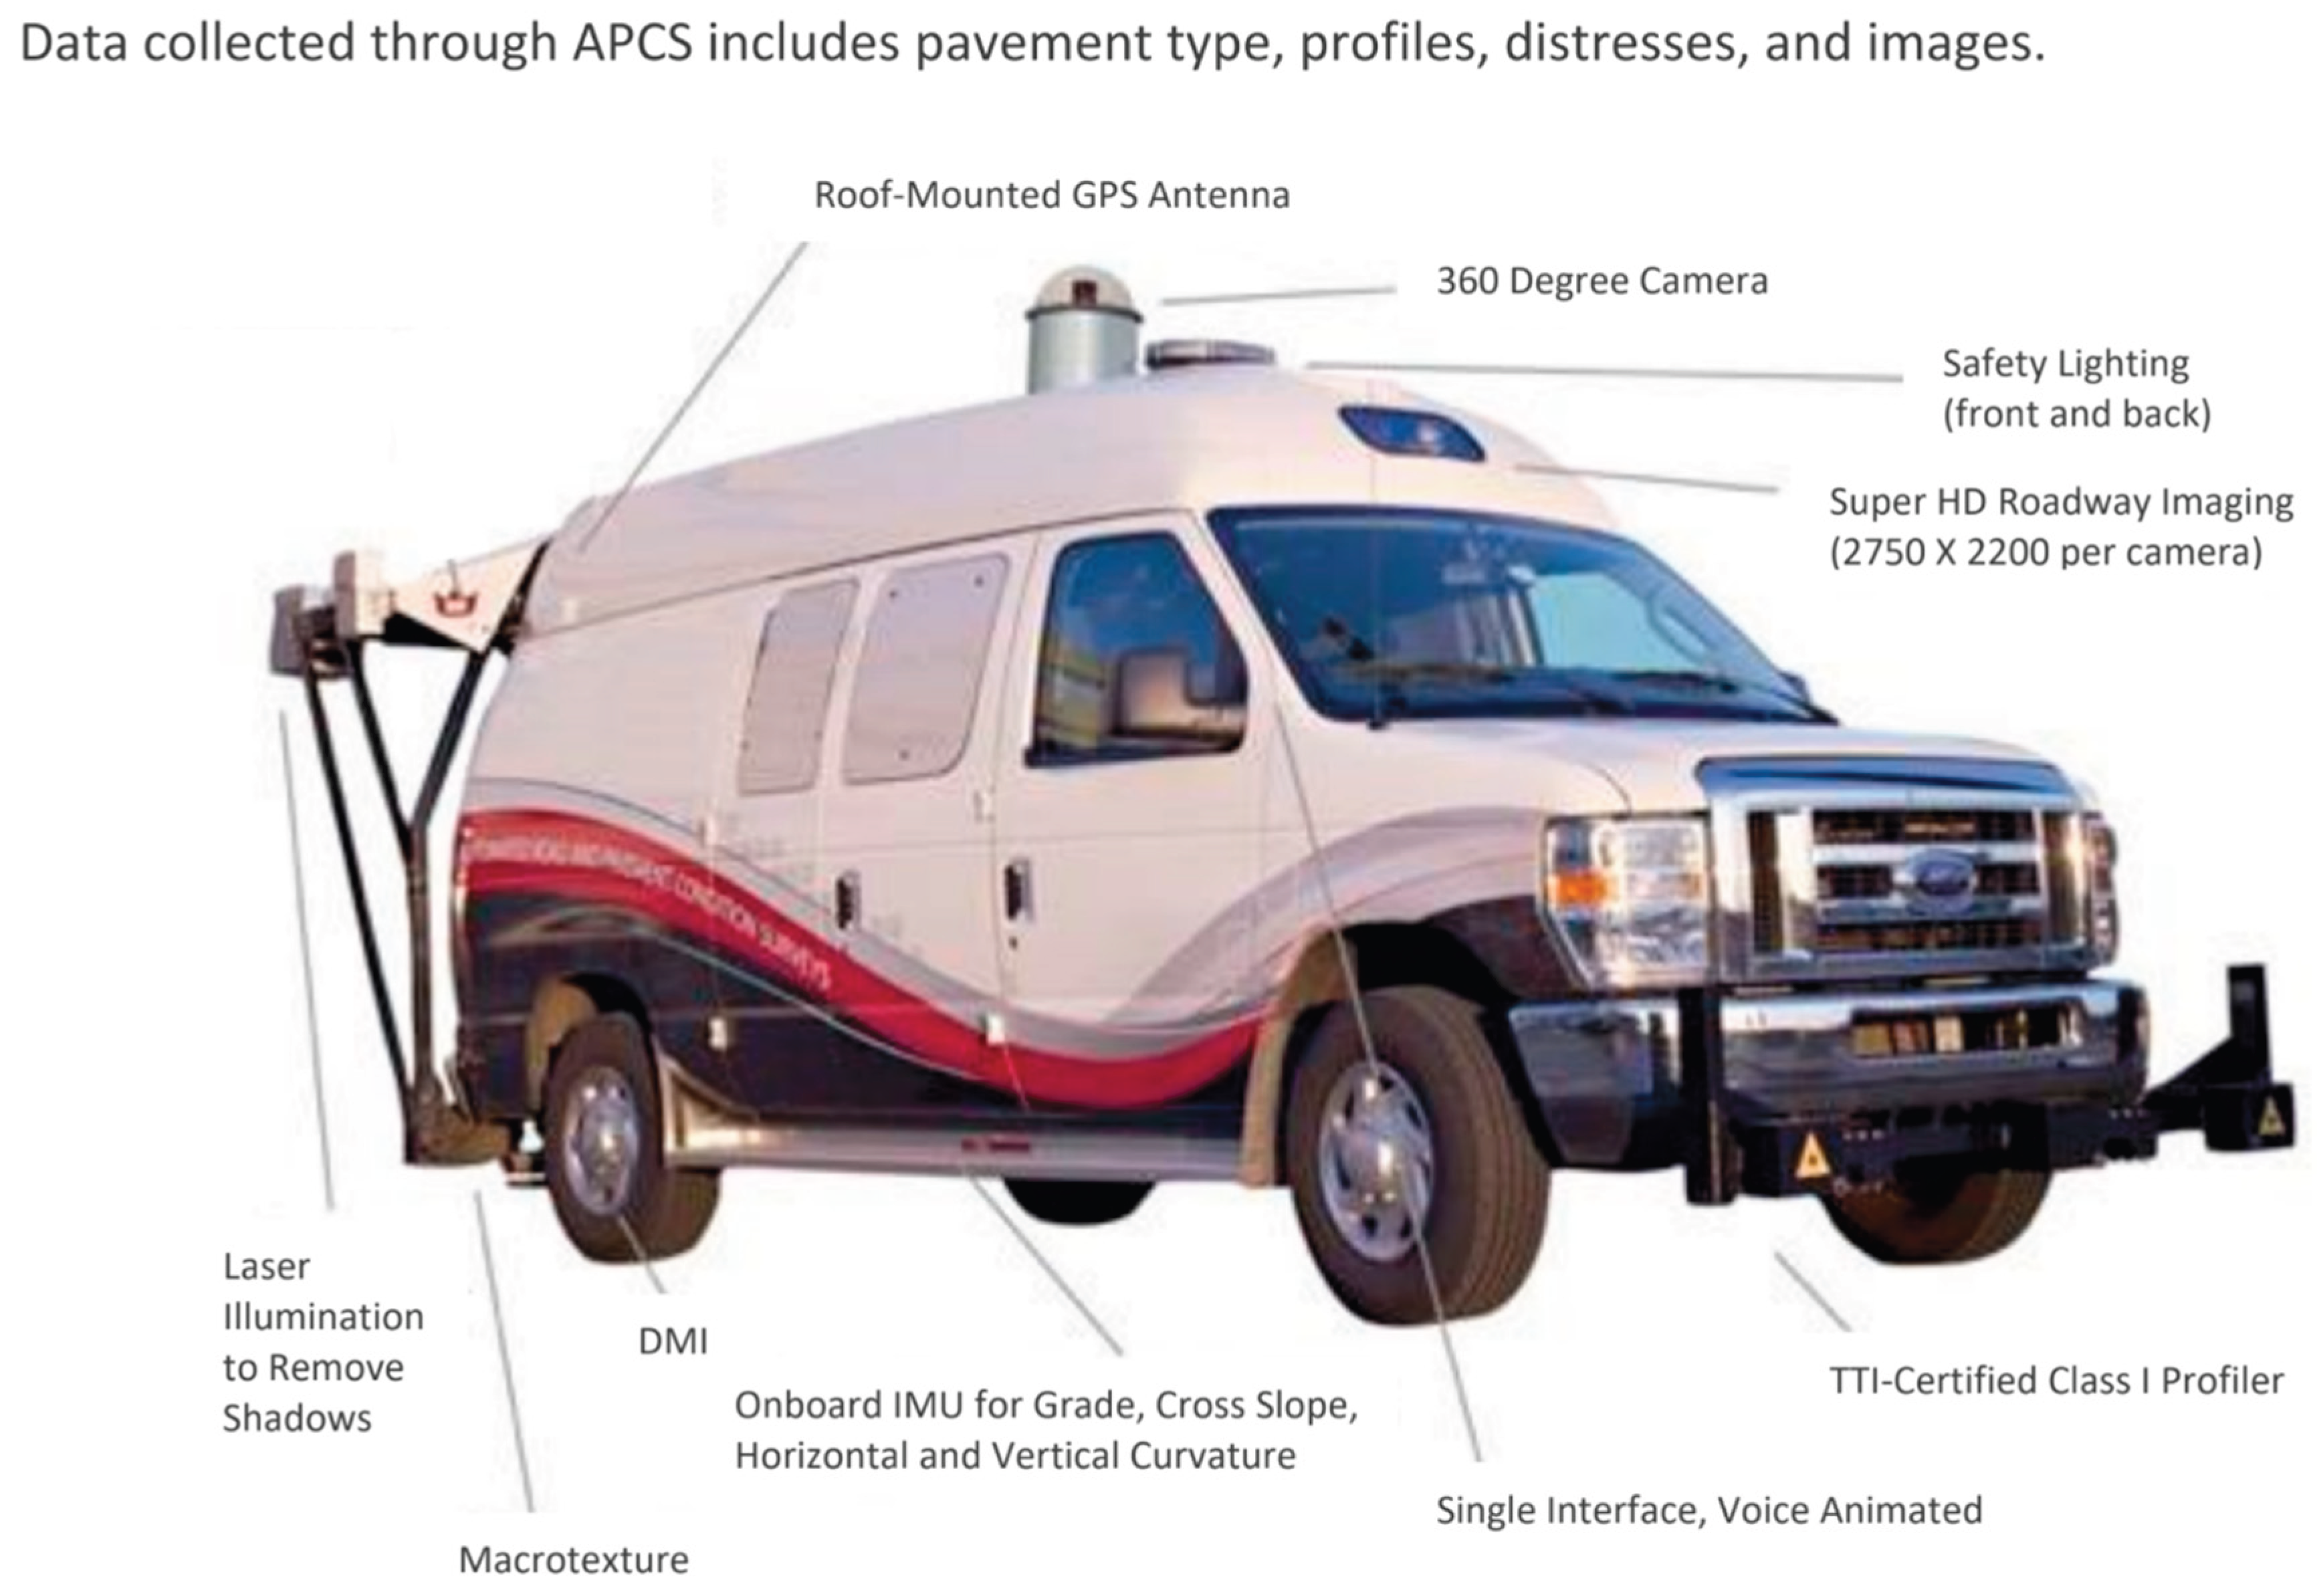
2.5.5. New York State (NYSDOT)
NYSDOT has implemented an EAMS suite of applications including Structures Manager, Structures Analyst, Pavement Analyst, Roadway Inventory System, Portfolio Analyst, and a Maintenance Management System. The Enterprise Asset Management System (EAMS) is built on one common linear referencing system and is linked to the Department’s geospatial data warehouse. The warehouse is the system of record for the inventory of the most critical secondary assets including point and linear drainage, guiderail, and signs. By having a fully mapped inventory of pavements, bridges, and secondary assets, all maintenance activities can be recorded against these individual assets, enabling the generation of work histories for these assets. The warehouse also provides key source data for the agency’s Maps and Apps portal, which is an agency-wide library of geospatially based applications that make these data widely available through this system of engagement. Other advancements made to support managing the State’s bridge and pavement assets over the past 5 years include:
- Implementation of the capital program portfolio management system, or OPPM tool.
-
Enhancement of the EAMS Software to include:
- ○
- Enhancement of bridge management.
- ○
- Enhancement of pavement management.
- ○
- Maintenance management.
- ○
- Portfolio analysis (cross-asset trade-off).
-
Implementation of a new roadway inventory module, including:
- ○
- Smart entry engine to reduce data entry effort.
- ○
- Straight line diagramming tool.
- ○
- New data warehouse to include secondary assets.
- ○
- Allowance for dual carriageways.
- Inventory collection of ancillary assets visible from the roadway.
As the types and number of assets included in the EAMS inventory continue to expand, NYSDOT will need to implement more efficient means of entering and accessing data. Currently, very detailed asset information is created in the form of computer aided design and drafting (CADD) files and electronic construction acceptance forms used to design and construct highway projects. Unfortunately, these data are not collected or stored in a way that can easily populate or update asset inventory and condition datasets. As a result, after an asset such as a new pavement or bridge is inspected for construction acceptance it is again inspected to collect asset management data. NYSDOT is working in cooperation with the FHWA and other States to develop and implement standards for connecting design, construction, and maintenance and maintenance data to asset management data. These standards will allow data to be collected once for the enterprise instead of requiring redundant data collection processes. This is expected to both reduce the level of effort for collecting data and improve the quality of the collected data.
2.5.6. Illinois DOT (IDOT)
IDOT collects condition data on interstate pavements annually and collects data on non-interstate pavements on a two-year cycle. The data is collected and processed by a vendor using an automated data collection vehicle, such as the vehicle shown in Figure 15.
Figure 8.
An automated data collection vehicle.
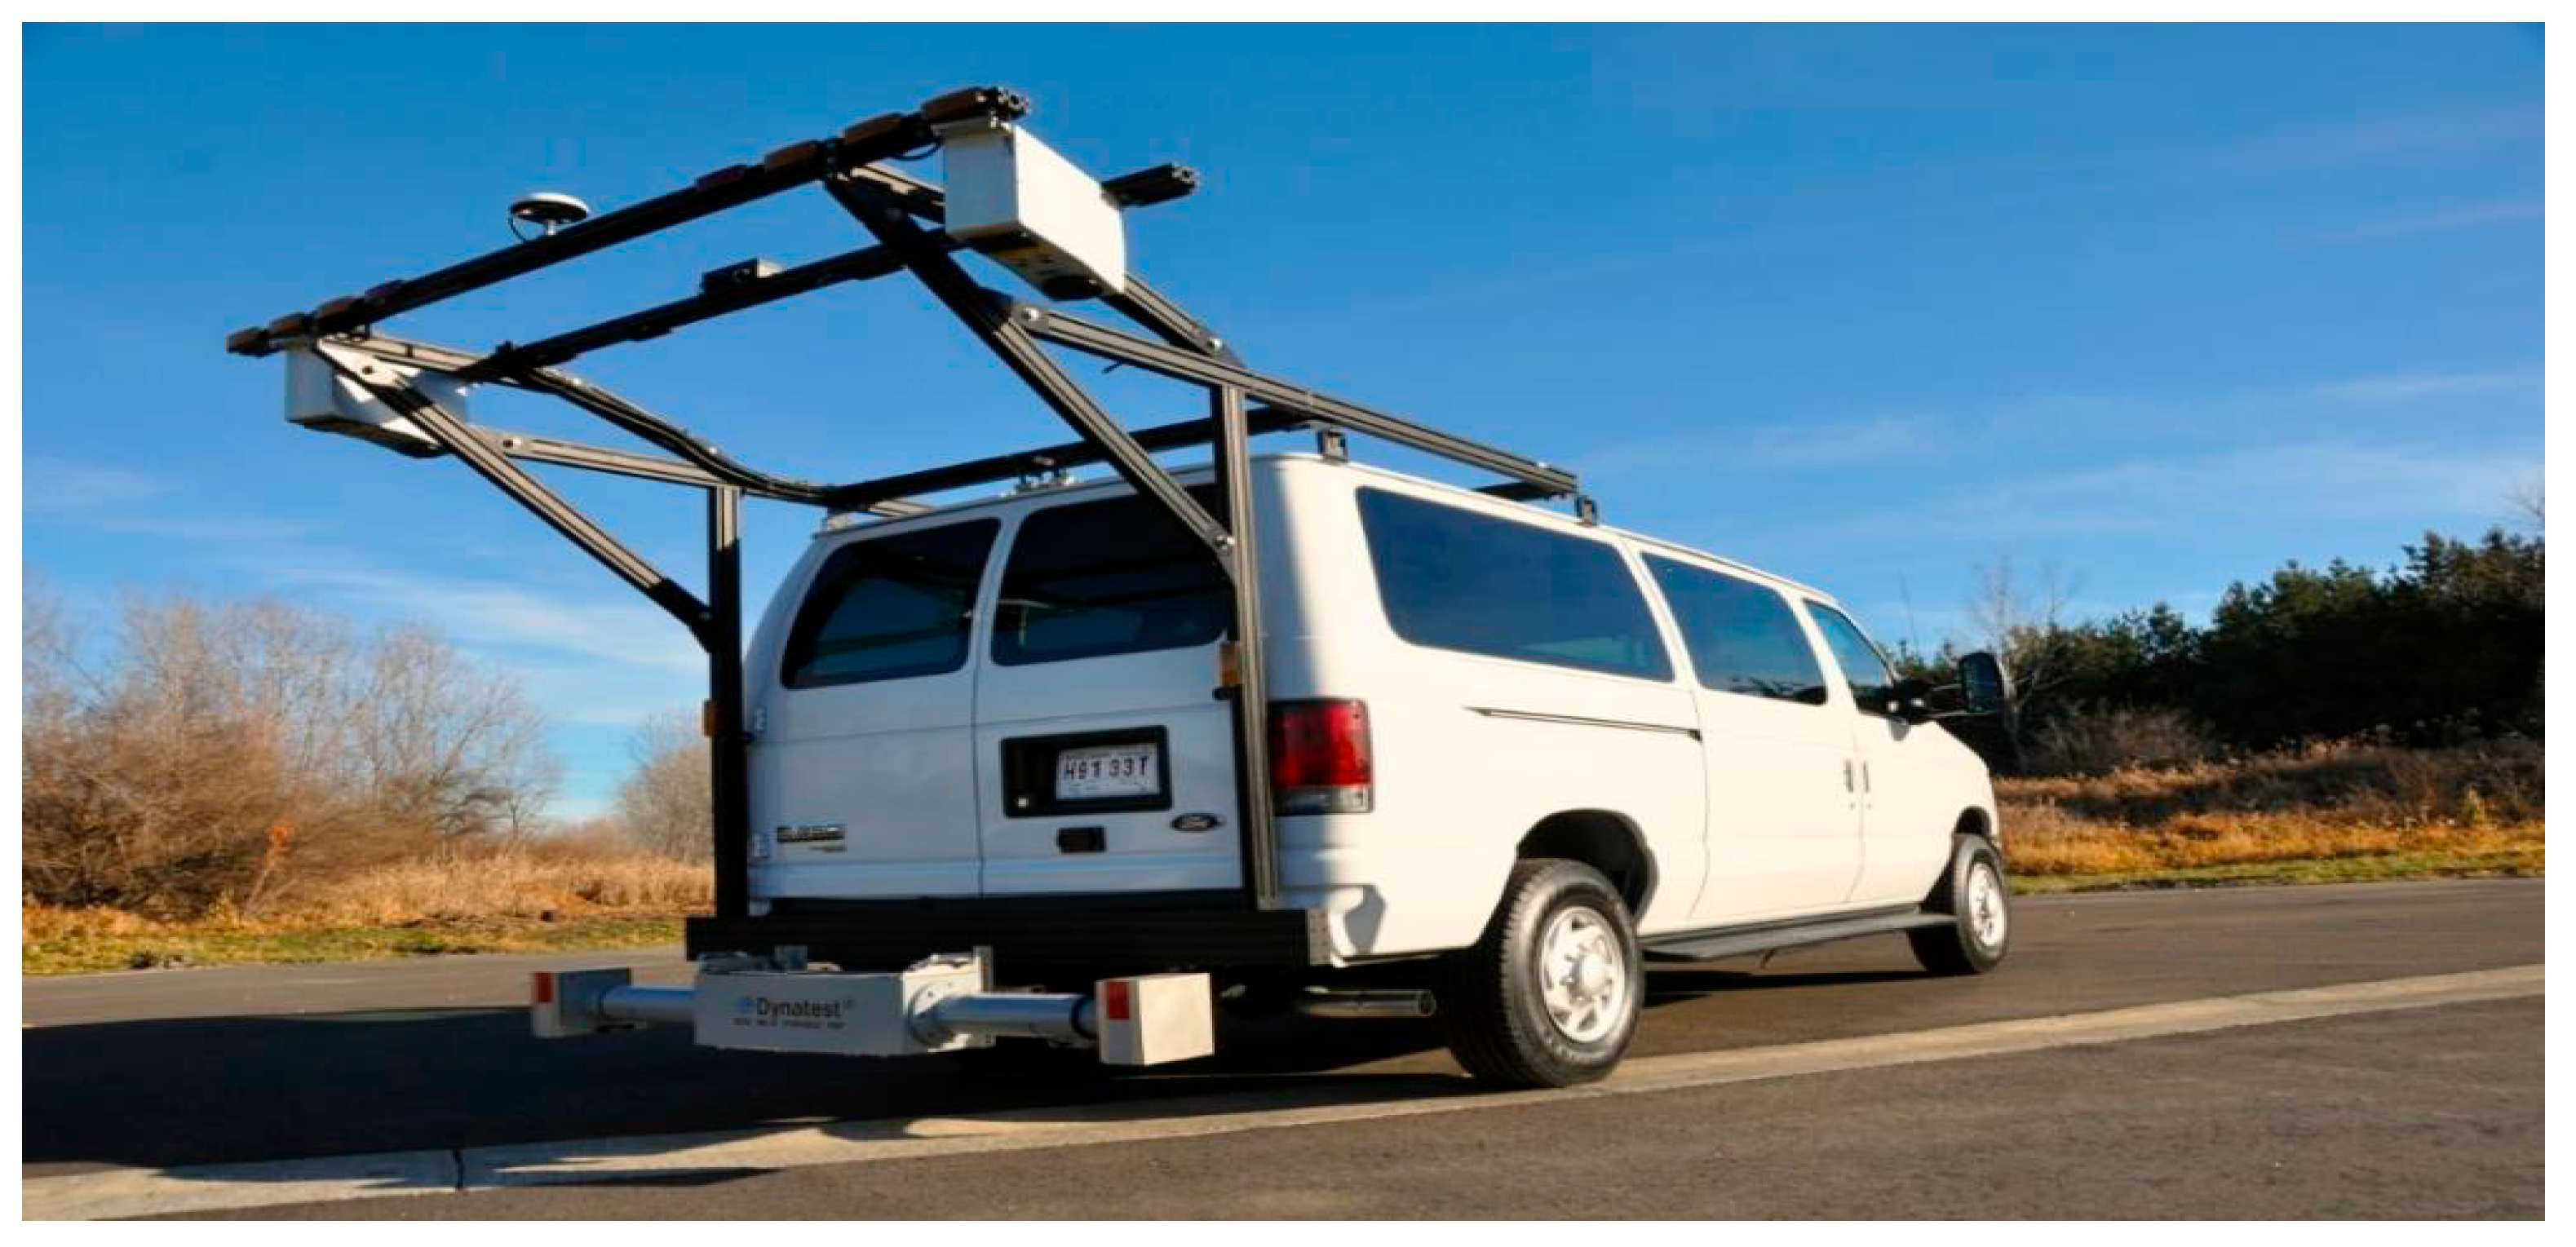
Pavement condition surveys are performed in each travel direction on divided highways and in one direction on all other routes. Forward-facing cameras and a laser crack measurement system are used to record pavement condition information and panoramic cameras provide visual references that are useful when viewing the images. In addition, lasers are used to collect sensor data to determine rutting, roughness, and faulting measurements. Personnel from each of the districts along with the Bureaus of Programming, Design and Environment, and Research, view the digital images of the pavement surface at workstations to identify predominant distresses, based on distress type, amount, and severity. The sensor data and distress data are combined to determine a Condition Rating Survey (CRS) value ranging from 1.0 to 9.0, with a 9.0 representing a newly constructed or resurfaced pavement and a 1.0 representing a failed pavement. In addition to collecting CRS ratings on the state-maintained system, IDOT also collects images and rates of any locally-maintained roadways on the NHS on a two-year cycle.
The Illinois Tollway also uses the CRS procedure to rate the condition of its pavement network. The Illinois Tollway contracts with a vendor to conduct CRS inspections annually. The Illinois Tollway utilizes this information as supporting documentation for a comprehensive Pavement Management Plan that is used to program pavement maintenance, rehabilitation, repair, and replacement programs. The Pavement Management Plan is updated biennially to incorporate inspection results and construction projects.
IDOT is required to report pavement condition information to the FHWA on the NHS each year as part of the FHWA’s Highway Performance Monitoring System (HPMS). IDOT recognizes that not all local units of government have the resources to collect and report the federally-required NHS pavement performance metrics. With this in mind, IDOT has assumed the responsibility for collecting the federal performance metrics on all NHS pavements, regardless of jurisdiction.
The pavement condition information required by the FHWA differs from the CRS procedure in terms of the types of distress rated and the way the information is used to report pavement conditions. Fortunately, IDOT’s automated data collection process provides sufficient information to allow the Department to extract the HPMS data in addition to the CRS ratings. IDOT is currently working with the vendor to improve methods for processing the data in accordance with the HPMS data format for the required submittals.
2.5.7. Iowa DOT
The Iowa Department of Transportation (DOT) has long been a leader in collecting transportation data, including traffic volumes, lane width, and sufficiency ratings. Historically, this data was managed through custom systems like the Geographic Information Management System (GIMS), which utilized the latitude and longitude of public roadways for linear referencing. However, GIMS was complex and required desktop access.
In a move to enhance user experience, Iowa DOT has transitioned to the Roadway Asset Management System (RAMS), a mobile-friendly, web-based platform. Built on ESRI’s Roads and Highways GIS product, RAMS provides a more user-friendly interface, allowing any Iowa DOT employee with internet access to view, analyze, and manage data in the field.
RAMS offers flexibility by integrating various datasets for analysis. For example, deer kill data can be merged with crash and lighting data to inform decisions like adding new lights instead of just signs. The new system automates updates, ensuring that changes to one dataset are reflected across all others, which eliminates the manual updating required by GIMS. RAMS also incorporates tools like Road Analyzer™, enabling users to view data in straight-line, street view, or map formats, making data analysis more comprehensive and efficient.
2.5.8. Indiana DOT (INDOT)
Spurred by the FAST Act, INDOT recognized the need to improve its inventory of culverts, which number approximately 75,000 statewide. Their previous methods were fragmented, using various tools and data stored in multiple formats. To address this, INDOT adopted Esri’s Collector and Survey123, mobile-friendly applications that enabled field workers to collect accurate data and seamlessly integrate it into the agency’s broader Geographic Information System (GIS).
Figure 9.
INDOT’s Drainage Assets Viewer application.
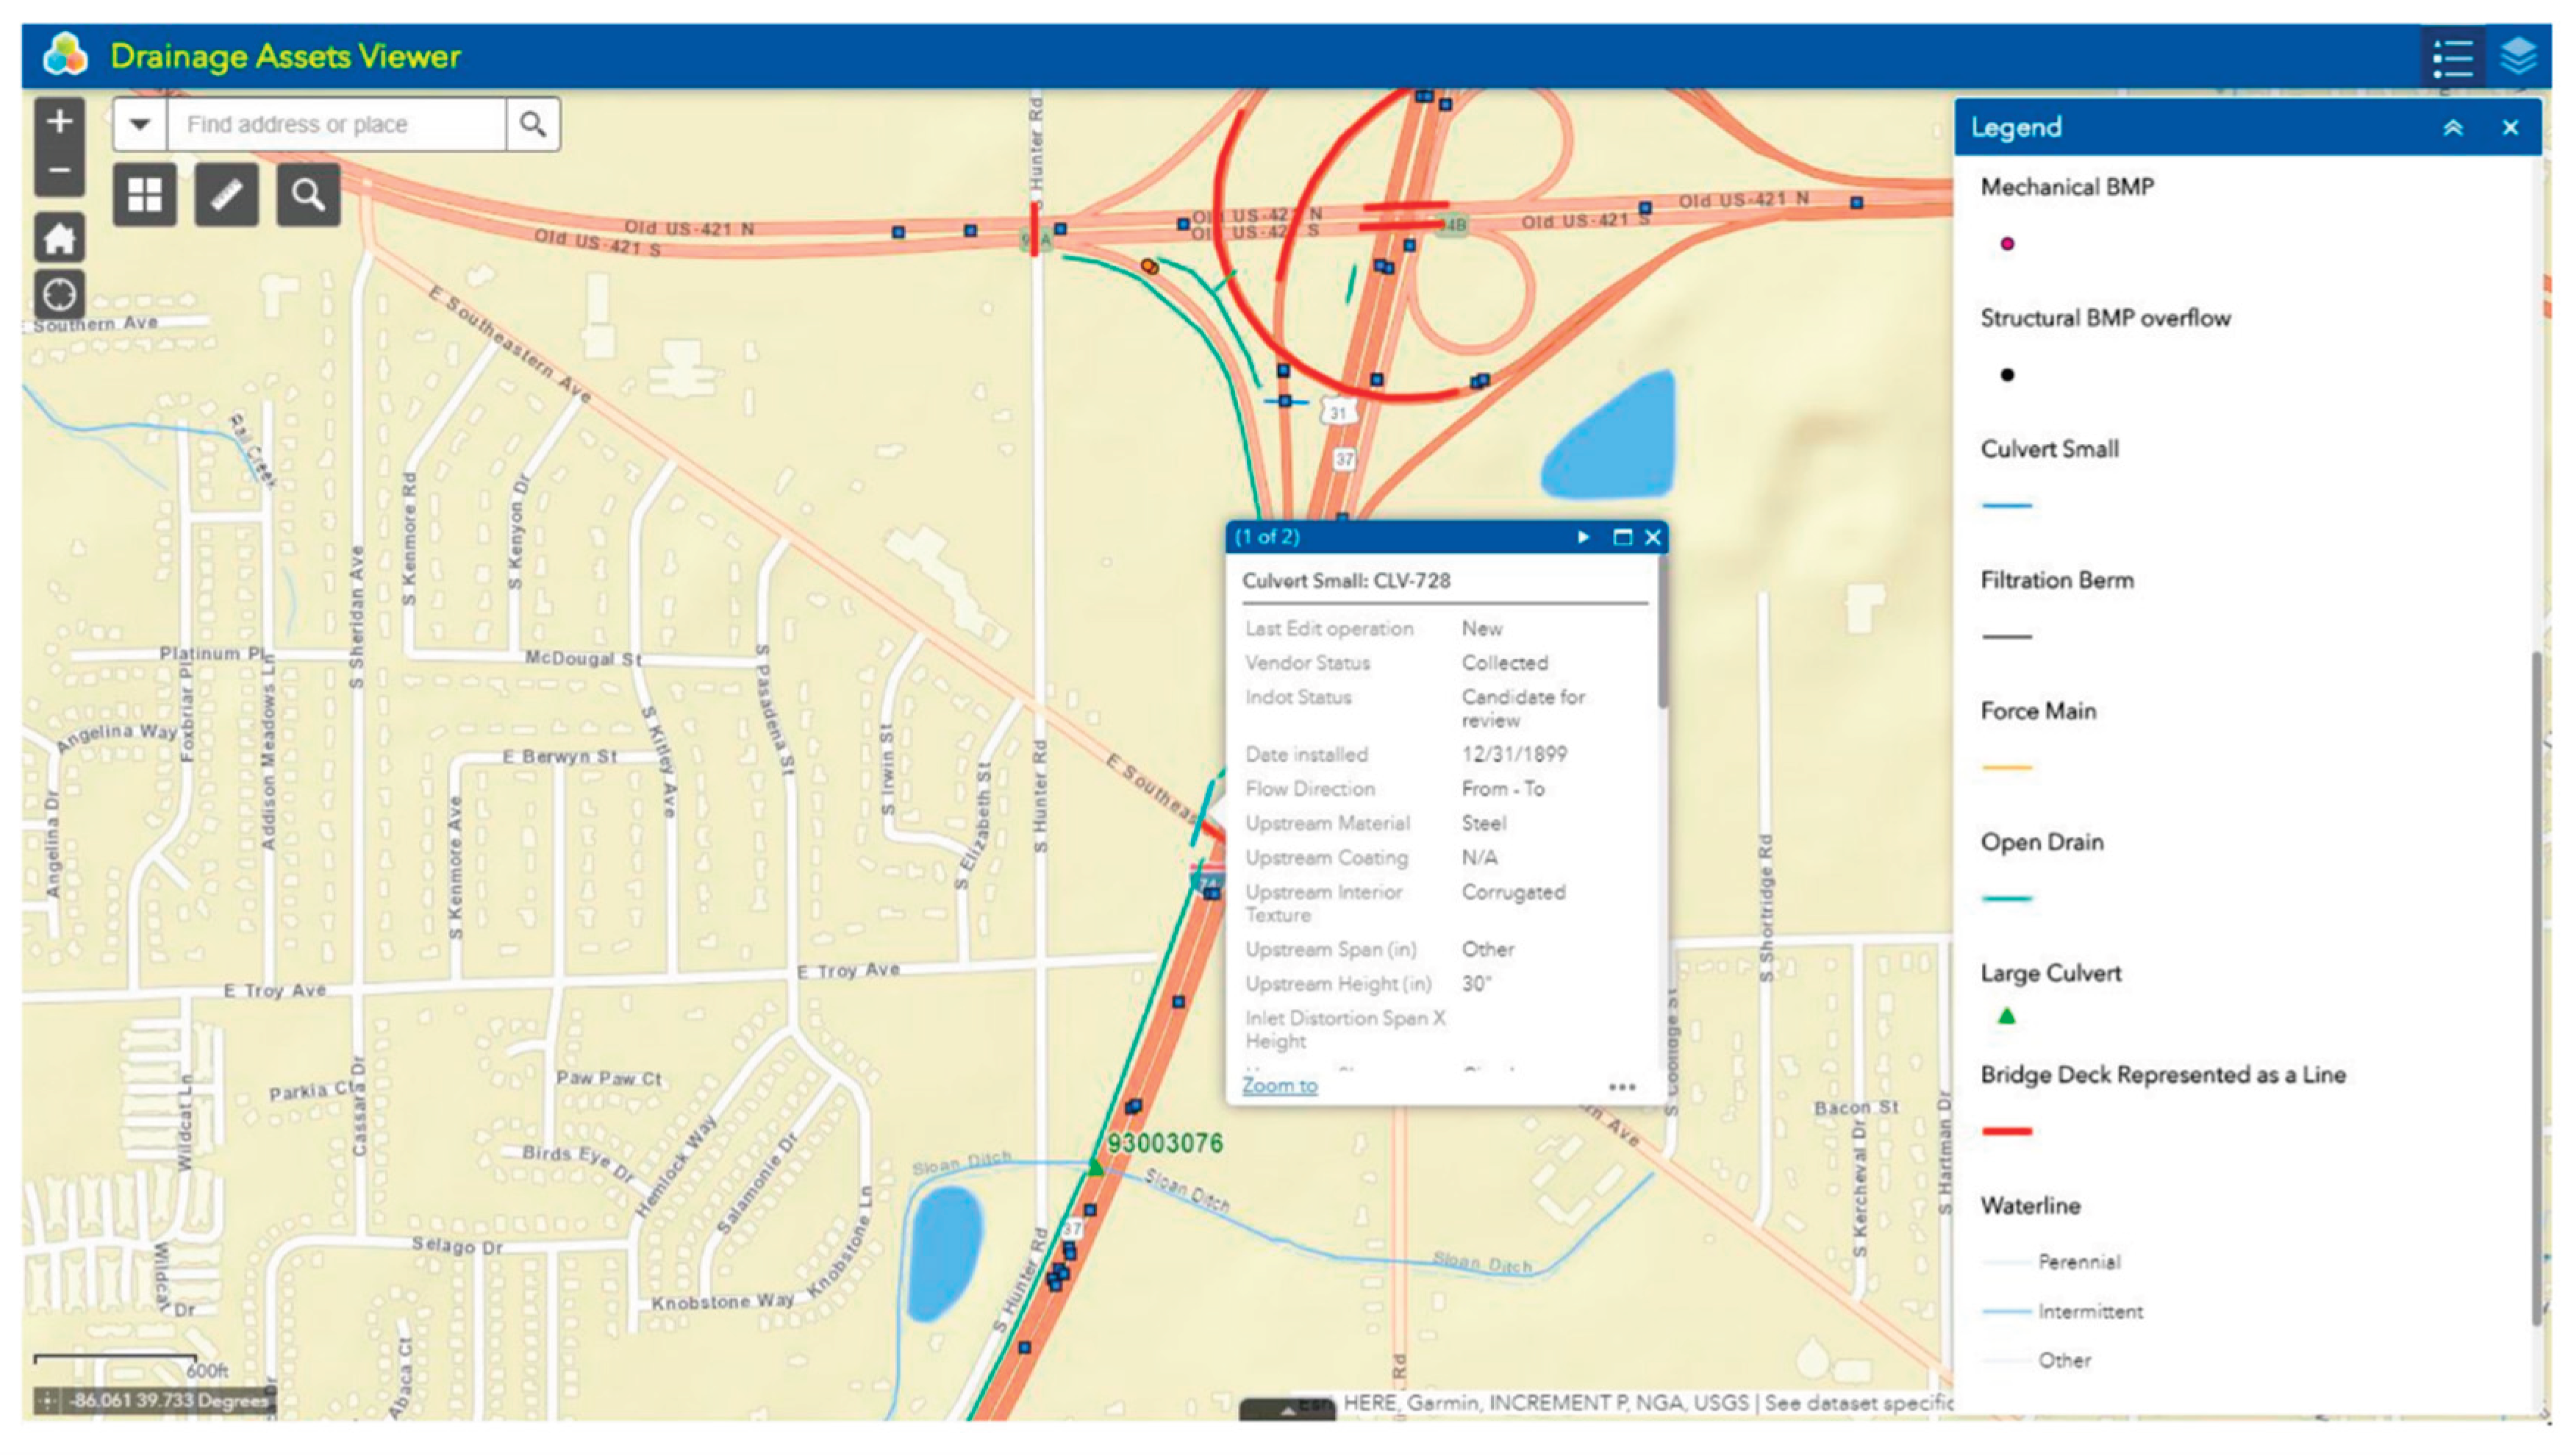
Despite initial challenges such as inconsistent cellular connectivity and issues with cloud-based data migration, INDOT’s move toward standardized data collection has proven successful. The agency now uses these tools to collect data not only on culverts but also on other assets, leading to a more comprehensive and accurate asset management system.
2.5.9. Vermont Agency of Transportation (VTrans)
The Vermont Agency of Transportation (VTrans) has adopted innovative technological approaches to improve its transportation asset management plan, particularly for managing traffic sign inventory. Situated within VTrans’ Asset Management Bureau, the Data Services section is tasked with overseeing inventory and condition data for over 100,000 transportation assets. Historically, sign data was managed manually, relying on a dedicated employee to update the database using project plans. This method was time-consuming, leading to outdated records, which impacted several divisions within VTrans, including corridor management, maintenance operations, and traffic safety investigations.
To address these limitations, VTrans collaborated with the University of Vermont’s (UVM) Vermont Artificial Intelligence Lab to explore a deep learning solution for automating sign detection and geolocation. By using right-of-way imagery captured by an Automated Road Analyzer (ARAN) vehicle, which assigns geographical coordinates to each image, VTrans and UVM developed an artificial intelligence system that can detect, classify, and locate traffic signs based on the Manual of Uniform Traffic Control Devices (MUTCD) code. This project leverages machine learning to automatically recognize various sign types, overcoming manual data entry bottlenecks and providing a more current and accurate inventory. The system assigns confidence levels to each sign detection, flagging instances with low confidence for manual review to ensure data reliability.
Figure 10.
VTrans’s automated sign detection process.
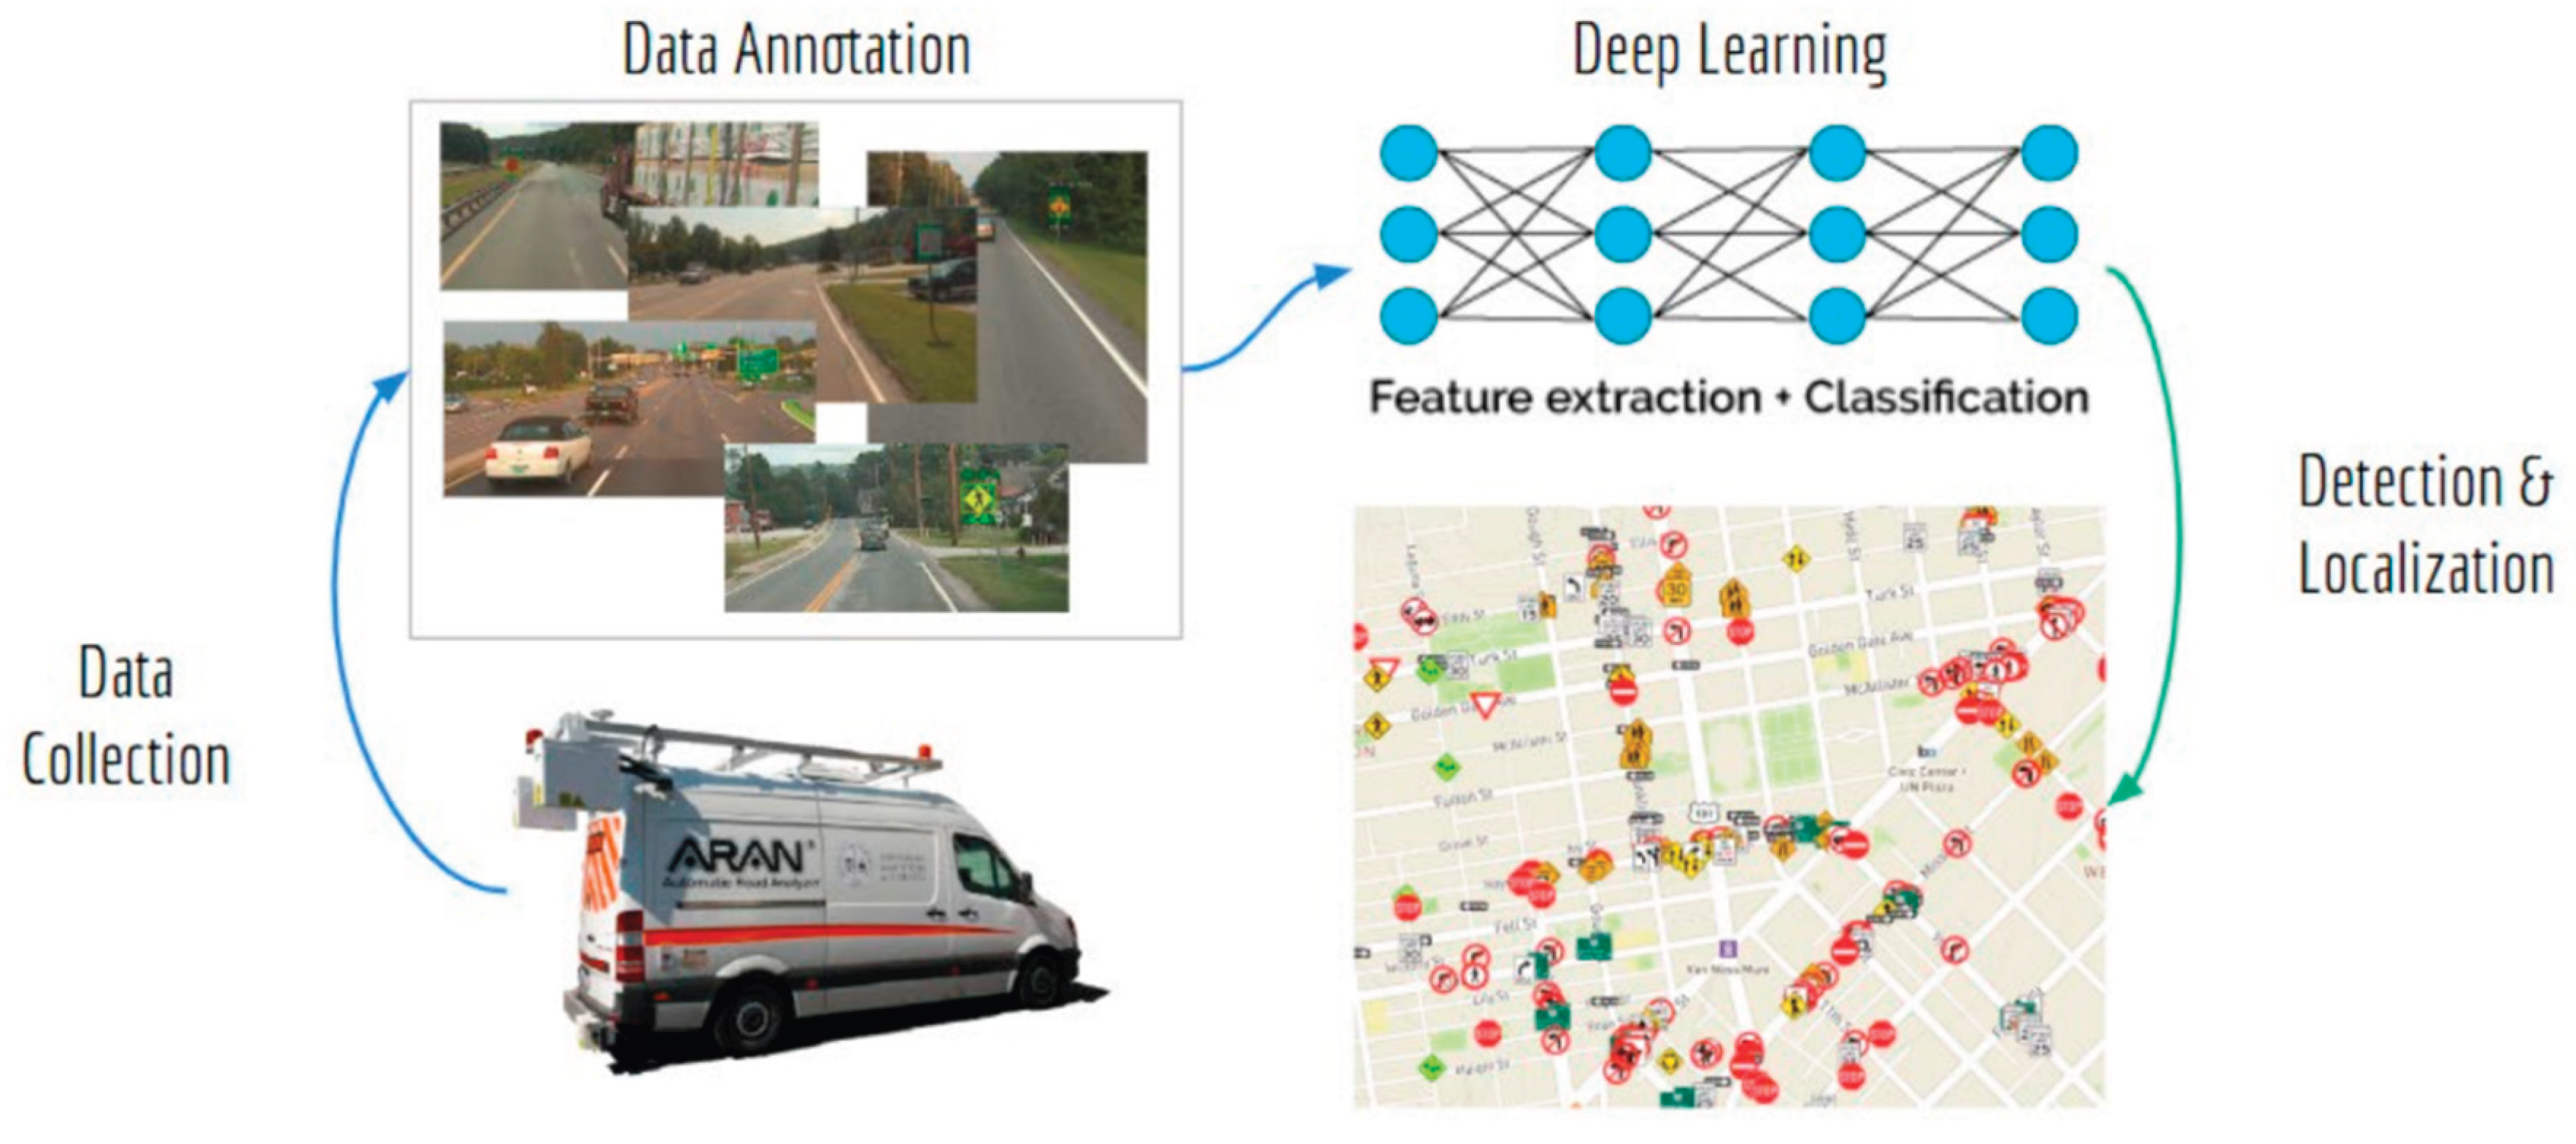
Despite the potential of this deep learning approach, VTrans encountered several technical challenges. For rare or obstructed signs, the algorithm struggled due to a lack of sufficient training images. Additionally, detecting sign changes over time, such as relocations due to construction, posed difficulties for the system. Processing the vast amount of image data also proved time-intensive, with each collection cycle taking around six months to complete, meaning the database lags by at least a year. To address these issues, the development team focused on improving annotation techniques and designing the system to flag low-confidence detections for further review.
Another complexity in VTrans’s project was the diverse needs of its stakeholders, ranging from detailed sign-specific data required by safety analysts to higher-level data summaries needed by corridor planners. Through stakeholder engagement, VTrans tailored the database to accommodate varying levels of data granularity, aiming to balance specificity with ease of update. Additionally, the team explored ways to enrich the machine-learning model with existing data sources, thereby reducing the attributes that needed to be detected.
This project exemplifies the value of partnerships in asset management innovation. By collaborating with UVM’s research team, VTrans benefited from academic expertise in AI, which facilitated a more sophisticated approach to data collection and management than was previously possible. VTrans’s experience highlights key takeaways for other agencies: a partnership with a research institution can be instrumental in handling complex technical challenges, and for future initiatives, simpler assets may be more feasible as pilots for machine learning applications.
Overall, VTrans’s exploration into AI-based traffic sign inventory management demonstrates both the potential and challenges of using advanced technologies for asset management. While there remain some concerns about data quality and timeliness, the new system represents a substantial improvement over manual methods, providing a foundation for ongoing refinement and future scalability in transportation asset management practices.
2.5.10. Connecticut DOT (CTDOT)
The 2022 Connecticut Department of Transportation (CTDOT) Transportation Asset Management Plan (TAMP) highlights the state’s comprehensive approach to managing its transportation infrastructure assets. It extends beyond federally mandated NHS assets by including additional categories like traffic signals, signs, sign supports, pavement markings, highway buildings, roadway illumination, retaining walls, drainage culverts, and Intelligent Transportation Systems (ITS) devices. This inclusion of a broader range of assets is intended to enhance data collection and support strategic decision-making for maintaining the state’s extensive transportation network asset management practices emphasize key principles, including inventory and condition assessment, performance management, life cycle planning, risk assessment, and strategic investment planning. This approach ensures that assets are managed cost-effectively and remain in a state of good repair (SOGR). For instance, CTDOT employs life cycle planning to optimize maintenance costs over the life of each asset, addressing deterioration rates and treatment needs, which is integral to extending asset longevity and reducing lifecycle costs.
For asset categories managed by CTDOT, there are 2,786 traffic signals, 246,657 signs covering approximately 2,354,178 square feet, and 1,653 sign supports. The state’s pavement markings include 97 million linear feet of pavement lines and 3.4 million square feet of pavement symbols, while roadway illumination assets comprise 23,472 light fixtures and 207 light systems. Additionally, CTDOT oversees 508 highway buildings, 891 retaining walls, 20,235 drainage culverts, and 545 ITS devices. This extensive inclusion of asset types within the TAMP is designed to strengthen CTDOT’s ability to effectively allocate resources and support long-term asset maintenance (Connecticut Department of Transportation, 2022).
Figure 11.
Highway Assets in the CTDOT TAMP.
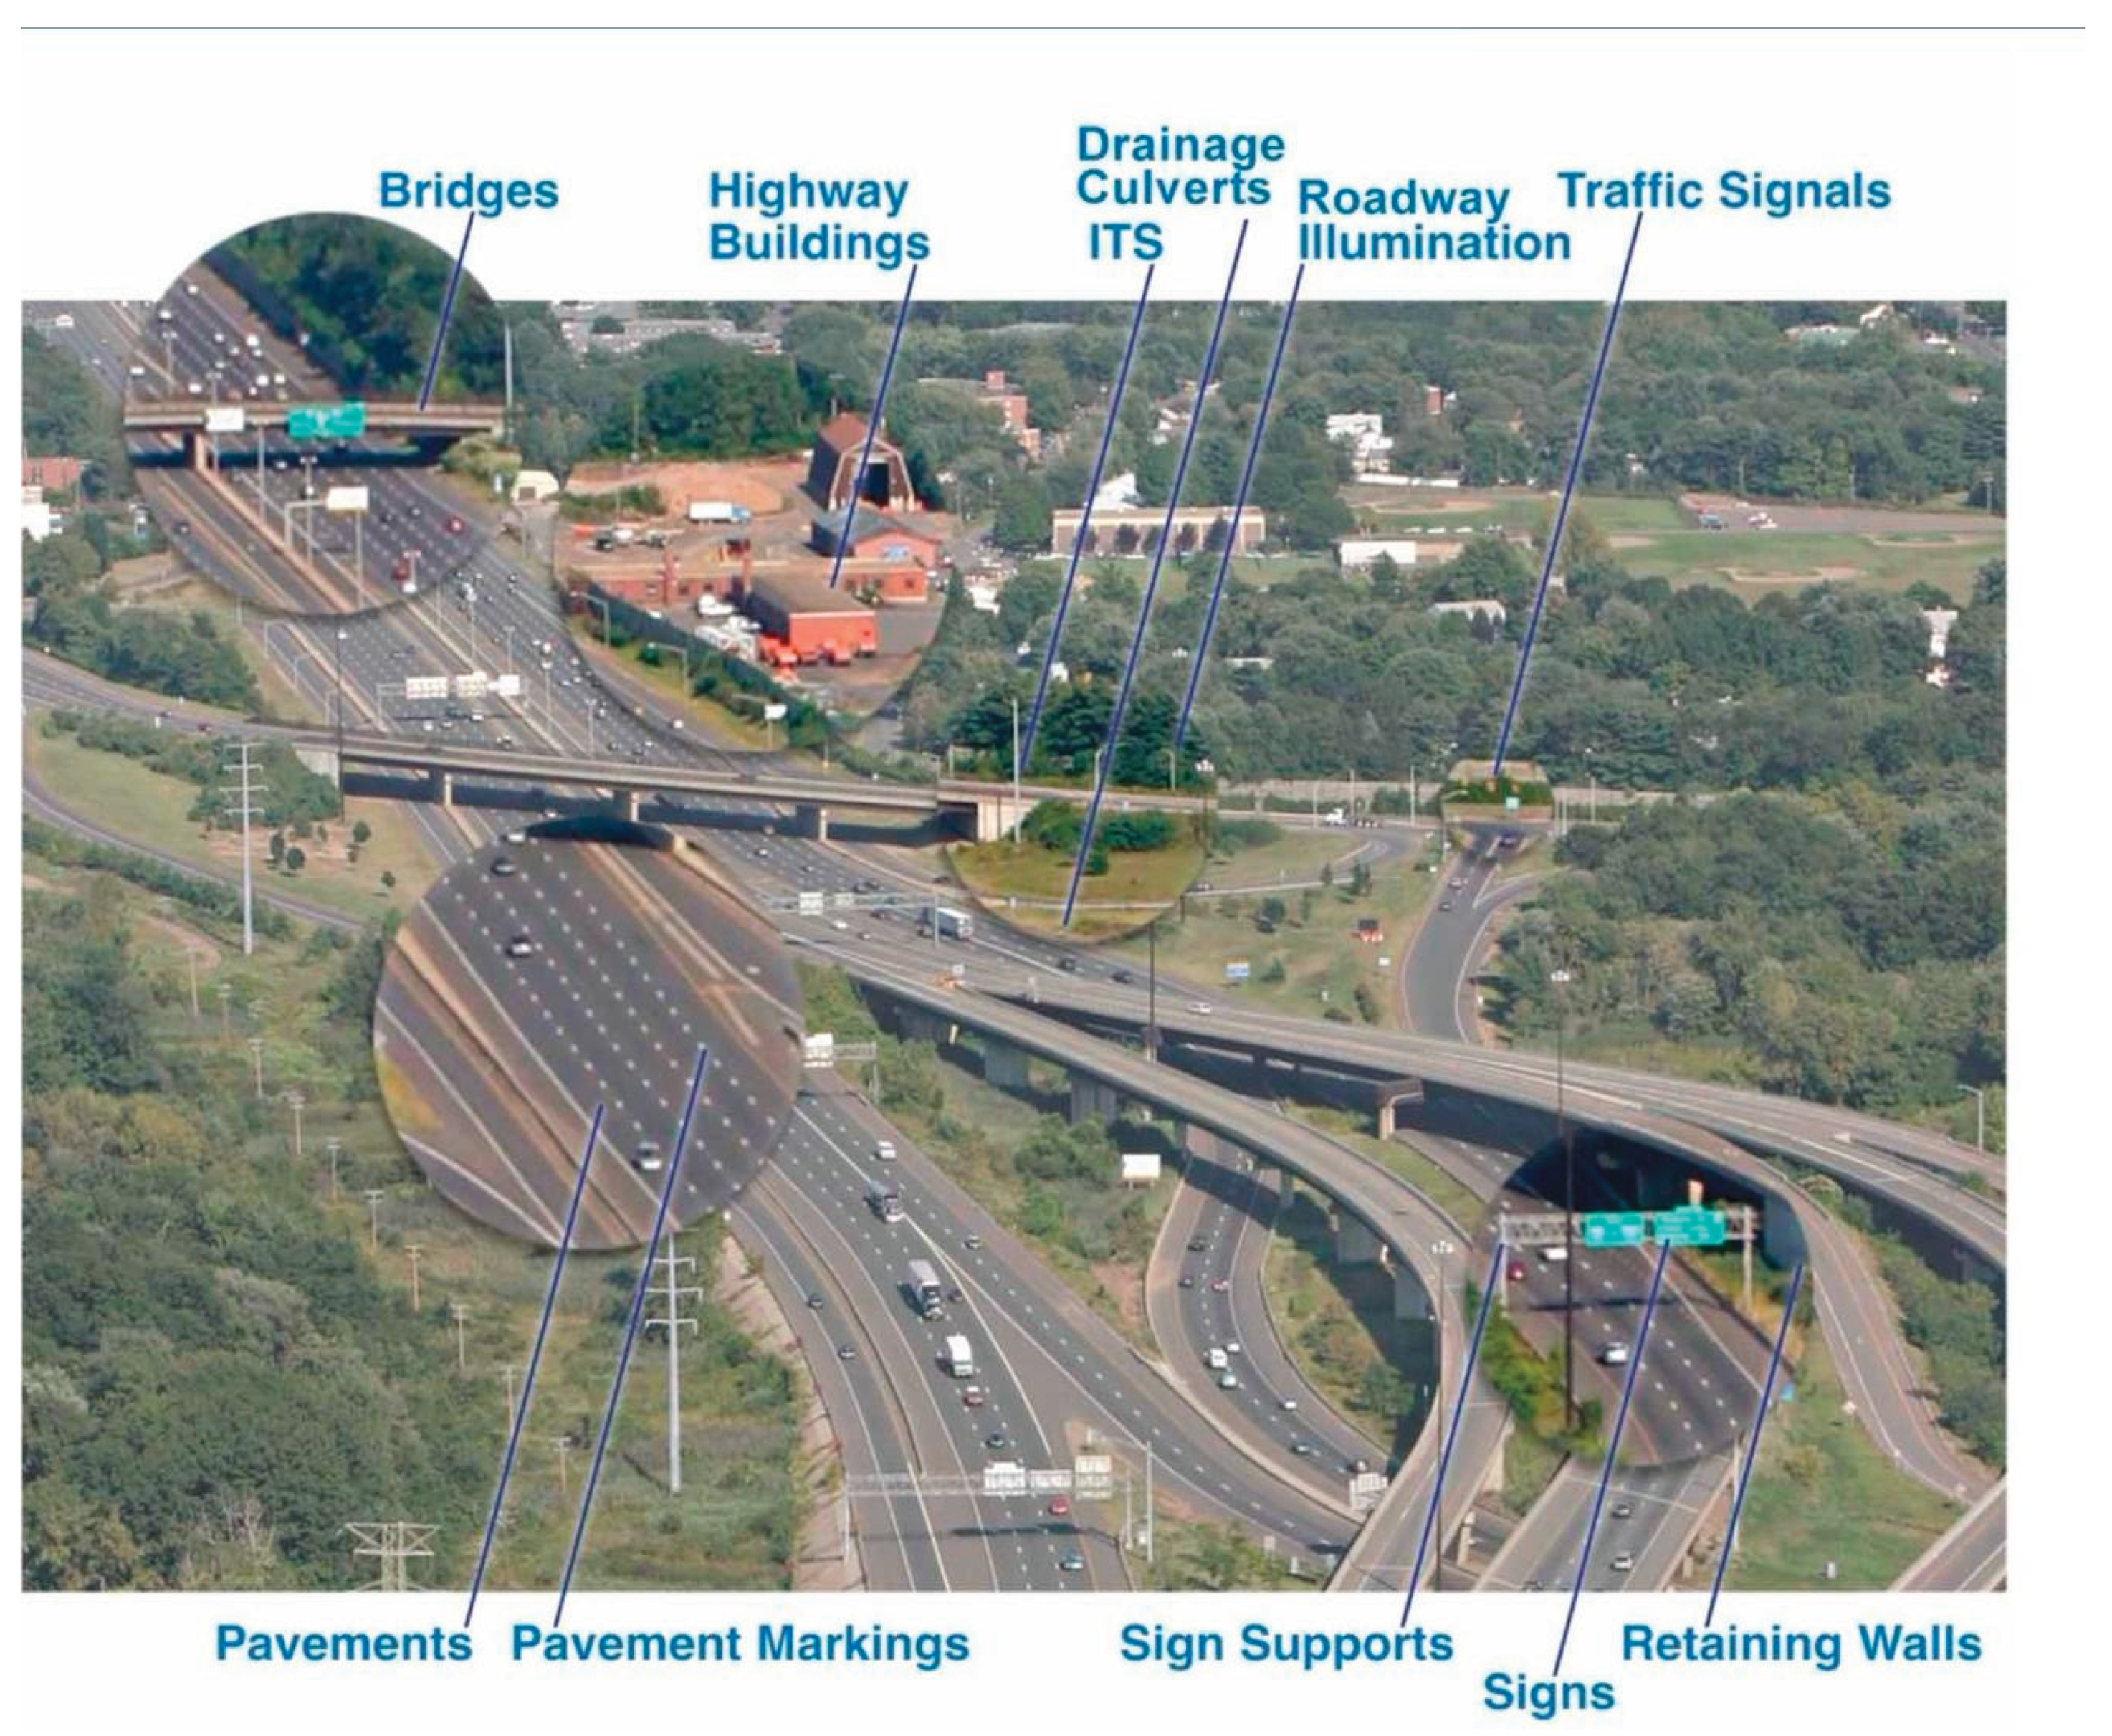
To evaluate and report on the condition of these assets, CTDOT employs a detailed performance assessment system. Table 2 of the TAMP summarizes the inventory and condition of eleven key asset classes managed by CTDOT, using performance criteria for “good,” “fair,” and “poor” conditions. For bridges, CTDOT aligns with federal criteria, applying standards consistent with those reported to the National Bridge Inventory (NBI). Pavement conditions are assessed using the CTDOT Pavement Condition Index, which is detailed in the TAMP on Page 2-14. Currently, federal criteria for the remaining assets are not defined, so CTDOT uses state-level standards for performance assessment. This TAMP relies on bridge data reported by CTDOT to the NBI and NHS pavement data submitted to the Highway Performance Management System (HPMS) for the NHS inventory and condition values, ensuring alignment with both state and federal reporting systems (CTDOT, 2022).
Table 2.
Inventory and Conditions for CTDOT-Maintained Assets in the TAMP (CTDOT, 2022).
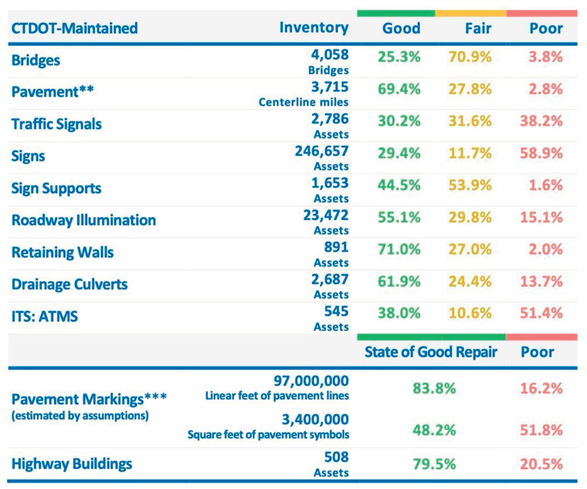 |
The Transportation Asset Management (TAM) Information Management Systems section provides an overview of the essential systems that the Connecticut Department of Transportation (CTDOT) uses to manage asset and project-related data. These systems are integral to how CTDOT collects, analyzes, manages, and stores asset condition and inventory data, ensuring that critical infrastructure information is accurate and accessible for effective decision-making. Table 3 outlines the Connecticut TAM assets and highlights the systems used to manage each type of asset, offering a comprehensive view of how data management supports CTDOT’s objectives.
Key systems such as AWARI, dTIMS, Exor, and ESRI hold and maintain inventory and condition data for various assets, while DigitalHIWAY provides a complete repository of right-of-way images for the state highway system. Asset condition predictions are modeled using dTIMS for critical assets like bridges and pavement, while simpler estimation methods (e.g., spreadsheets) are employed for other assets. Project-specific data are tracked within the Composite Project Database (CPD) and COMPASS, and maintenance activities are logged in the Maintenance Management System (MMS). Additional tools, like ESRI Collector, are being considered for potential future TAMP expansions. Centralized systems such as the Transportation Enterprise Database (TED) aggregate data from multiple sources, allowing for integrated analysis, reporting, and compliance with federal requirements for National Bridge Inventory (NBI) and Highway Performance Monitoring System (HPMS) submittals. This structured approach to asset information management enables CTDOT to monitor asset conditions proactively, support lifecycle planning, and streamline regulatory reporting.
Table 3.
TAM Information Management Systems.
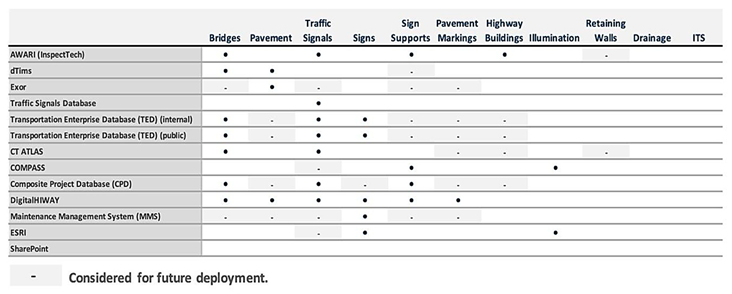 |
The Connecticut Department of Transportation (CTDOT) leverages a suite of data management tools to enhance its asset management practices. These tools form the backbone of CTDOT’s Transportation Asset Management Plan (TAMP), allowing the agency to monitor, maintain, and make informed decisions regarding its vast network of assets. One of the core systems within this suite is the Transportation Enterprise Database (TED), which integrates data from multiple sources and supports CTDOT’s data governance initiatives. Through this comprehensive system, CTDOT is able to establish a unified view of assets, improve the efficiency of maintenance activities, and ensure alignment with both federal and state performance requirements.
The Transportation Enterprise Database (TED) is CTDOT’s centralized, internal data warehouse, tailored to support comprehensive transportation safety and asset management data. In 2021, TED was transformed from a SQL Server data warehouse to an Esri ArcSDE database, integrated within an ArcGIS Enterprise Portal framework. This transition, accompanied by governance and change management processes, is part of an ongoing effort to establish TED as a reliable and accessible resource for CTDOT’s data needs. The overarching goal for TED is to evolve into a system that offers "an accessible transportation safety and asset data enterprise system where authoritative data sets are managed by data stewards and formatted for consumption and analysis in a manner that allows stakeholders to use tools that are both effective and meet their business needs, including rich metadata for each data layer" (Connecticut Department of Transportation, 2022).
The TED Development Group, which meets weekly, oversees TED’s continuous development and provides governance. Initially focused on safety data and analysis, the group has expanded its purview to encompass asset management needs as well. Key responsibilities include:
- Coordinating data management activities and maintaining a robust data business plan.
- Overseeing data-related issues and procurement of data management software.
- Developing FHWA-compliant data capture plans, such as for the Model Inventory of Roadway Elements (MIRE).
- Reporting and making recommendations to CTDOT’s Data Governance Council.
Workgroups within the TED Development Group focus on various aspects of data and analysis, ensuring the TED system meets CTDOT’s evolving needs. TED includes an array of critical datasets, such as:
- Road Network and Linear Attribution: Information on state and local road networks, including NHS, functional classifications, and lane data.
- Projects and Assets: Details on ongoing and completed projects, bridge data, and traffic signal control areas.
- Safety Data: Comprehensive crash and collision analysis records.
- Land and Survey Data: Rights of way, monuments, and geodetic survey data.
- Reference Data: District boundaries, MPOs, urban areas, and other geospatial data points.
- Metadata: Detailed metadata for each dataset, essential for traceability and contextual understanding.
TED offers a high-level, geospatially linked platform for roadway, asset, and safety data, with tools for dashboard reporting, mapping, and data query. Through the Esri Portal, TED can support data stewards and external users by providing access to up-to-date data views, analytical tools, and rich geospatial representations. Additionally, TED’s integration with Esri’s Story Maps and custom dashboards enables user-friendly data visualization, supporting data-driven decisions and enhanced asset management.
To improve data integration, TED utilizes Feature Manipulation Engine (FME) by Safe Software, a leading tool in geospatial data integration. FME enables efficient data transformation, ensuring TED’s datasets are compatible across multiple formats and applications, enhancing TED’s interoperability and usability.
Data Sources and Updates: TED’s datasets are sourced from multiple authoritative systems, including:
- Exor: For road inventory and linear referencing.
- ATLAS: Provides geospatial data for roadway elements.
- CPD: Manages project-related data.
- AWARI: Stores data on bridges, sign supports, and highway buildings.
- CAS2 (Collision Analysis System): Advanced crash data analysis.
- Esri Data Layers: Base maps, town boundaries, legislative districts, etc.
Data from these sources is refreshed nightly, ensuring TED offers up-to-date and reliable information for decision-making (Connecticut Department of Transportation, 2022). TED is still evolving to meet CTDOT’s asset management requirements fully. Future improvements include:
- Enhanced Integration: Continued migration of asset management and geospatial data to the Esri Portal for seamless integration.
- Data Analytics and Visualization: Leveraging Commercial Off-The-Shelf (COTS) applications for advanced analytics.
- Alignment with Asset Management: Ensuring TED’s geospatial data fully supports CTDOT’s safety and asset management goals.
The TED system reflects CTDOT’s commitment to a data-centric approach in asset management, offering an advanced infrastructure that supports both asset and safety management goals. TED’s development aligns with best practices in data governance and management, setting a high standard for state-level transportation databases.
In requirements set forth by recent federal legislation, CTDOT’s TAMP also incorporates strategies to mitigate risks associated with extreme weather. This includes prioritizing asset resilience and integrating climate risk assessments within its investment strategies, particularly for assets vulnerable to coastal flooding and other weather impacts. The TAMP’s financial plan, backed by funding estimates, supports these resilience measures alongside core maintenance and improvement needs.
3. Summary
The report explores the adoption of various transportation asset management technologies by state Departments of Transportation (DOTs) to enhance data acquisition as well as incorporation of artificial intelligence in effective infrastructure management. Core technologies are LiDAR, photolog, multisensor mobile mapping systems, and automated data collection vehicles employed for accurate data acquisition related to assets like pavements, bridges, traffic signals, and more. GIS platforms, especially Esri’s ArcGIS, are frequently employed to manage data and analyze locations so that agencies can see the condition of assets and monitor them in real-time.
3.1. Methodology
The methodology was a combination of various sources of data. The data collection methods were manual updates such as in the case of VTrans’s initial plan based on sign inventories and automated collections with ARAN trucks and LiDAR scanning, which streamline data collection for extensive networks of assets. The study also incorporated machine learning algorithms for detection, classification, and geolocation of assets such as traffic signs, as developed in the partnership between UVM and VTrans collaboration. The project further utilized GIS-based data integration techniques to overlay multiple asset layers, facilitating a comprehensive view of infrastructure conditions and supporting strategic decision-making
Asset management practice involves evaluating multiple options to ascertain the most efficient and effective method of managing transportation infrastructure. This includes all aspects of asset management such as data collection, management practices, tools, documentation, analysis, and decision-making.
The research extended an initial survey conducted by Chad Baker (2020), titled Statewide Asset Data Collection and Management: Survey of Practice. The original survey gathered responses from 11 state Departments of Transportation (DOTs) and covered 10 transportation assets. To expand the scope of the research and address DOT’s needs, the paper incorporated additional asset categories, such as Traffic Signals, Sign Supports, and Roadway Illumination, into the study. They also increased the number of participating DOTs from 11 to 23, as shown in Table 4.
Table 4.
Core Asset Data Collected by Agencies.
| State | Pavement | Bridges | Traffic Signals | Sign Supports | Pavement Markings | Roadway Illumination | Highway Buildings |
|---|---|---|---|---|---|---|---|
| Alabama | Yes | Yes | No | No | No | No | No |
| Hawaii | Yes | Yes | No | No | Yes | No | No |
| Iowa | Yes | Yes | No | No | No | No | No |
| Kansas | Yes | Yes | No | No | No | No | No |
| Minnesota | Yes | Yes | No | No | Yes | No | No |
| Mississippi | Yes | Yes | No | No | No | No | No |
| New Hampshire | Yes | Yes | No | No | No | No | Yes |
| New York | Yes | Yes | Yes | Yes | Yes | No | No |
| North Carolina | Yes | Yes | No | No | No | No | No |
| Utah | Yes | Yes | Yes | Yes | Yes | No | Yes |
| Virginia | Yes | Yes | No | No | No | No | Yes |
| Texas | Yes | Yes | No | No | No | No | No |
| California | Yes | Yes | No | No | Yes | Yes | Yes |
| Wisconsin | Yes | Yes | No | No | Yes | No | No |
| Florida | Yes | Yes | No | No | Yes | No | No |
| Washington | Yes | Yes | Yes | No | Yes | Yes | No |
| Illinois | Yes | Yes | No | No | Yes | No | No |
| Delaware | Yes | Yes | No | No | Yes | Yes | No |
| DDOT | Yes | Yes | No | Yes | No | No | No |
| INDOT | Yes | Yes | No | Yes | No | No | No |
| VTrans | Yes | Yes | No | No | Yes | Yes | Yes |
| WisDOT | Yes | Yes | Yes | Yes | Yes | Yes | Yes |
| Connecticut | Yes | Yes | Yes | Yes | Yes | Yes | Yes |
3.2. Technologies Utilized
The project employed several key technologies to enhance the accuracy and efficiency of asset data collection and analysis. Geospatial Information Systems (GIS) were extensively used for mapping and managing asset data across multiple states. Digital platforms like Esri’s ArcGIS provided robust tools for geospatial analysis, supporting the layering of assets like traffic signals, roadway lighting, and pavement markings. Automated technologies, such as Light Detection and Ranging (LiDAR) and photolog imagery, were instrumental for capturing detailed asset images. Additionally, Vermont’s collaboration with UVM’s AI lab utilized deep learning models for the automated detection of traffic signs from right-of-way imagery, improving the efficiency of asset condition monitoring.
3.3. Data Source
The primary data sources for this project were derived from state Department of Transportation (DOT) asset management databases and platforms, third-party data providers, and academic partnerships. State agencies like Connecticut DOT (CTDOT), Utah DOT (UDOT), and Vermont Agency of Transportation (VTrans) provided access to their asset management databases and GIS platforms. In addition, the project examined third-party data sources, such as Blyncsy, for traffic signal and signage data, and leveraged partnerships with research institutions like the University of Vermont (UVM) for machine learning applications in asset detection. The transportation databases included information on the location, age, and condition of various assets, which formed the basis for data analysis.
3.4. Conclusion
The project highlights the importance of diverse data sources and advanced technologies in effective transportation asset management. The implementation of automated data collection systems, GIS systems, and machine learning models enabled more accurate and efficient asset management practice. The methods applied indicate how knowledge derived from data can contribute to enhanced maintenance scheduling and resource allocation.
Several state DOTs, including Connecticut, Vermont, Utah, and the District of Columbia, are among the leaders in taking advantage of these cutting-edge technologies. Connecticut Department of Transportation uses Esri’s ArcGIS together with DigitalHIWAY, a system that correlating photolog photos with GPS data to maintain an active, geospatially-referenced visual inventory of assets. This allows for efficient decision-making regarding maintenance and replacement of assets, allowing CTDOT to keep its asset database current and accessible. Similarly, UDOT applies GIS in conjunction with mobile data collection to provide timely updates of asset conditions, supporting UDOT’s vision for improved safety and mobility through data-driven practices.
Vermont Agency of Transportation also made history by collaborating with the University of Vermont’s AI laboratory to deploy deep learning models to identify and classify right-of-way photos as traffic signs. In addition to making asset inventory more effective, this AI project also minimizes challenges in data accuracy and timeliness, particularly for assets that should be updated frequently. Meanwhile, DDOT leverages similar GIS and photolog technologies to manage its urban infrastructure, fusing mobile and GIS-based systems to monitor traffic signals, signs, and roadway assets’ location and condition and thereby promoting urban mobility and safety.
For state DOTs, these examples underscore the benefits of integrating GIS and AI technologies for a more efficient and predictive approach to asset management. By leveraging systems like Esri’s ArcGIS for centralized data management and AI-driven image analysis for asset condition monitoring, agencies can enhance its capabilities in predictive maintenance and resource optimization. Implementing these proven technologies would align with leading industry practices, ensuring a sustainable and data-driven approach to infrastructure management.
References
- Federal Highway Administration (FHWA). (2002). Manual on Uniform Traffic Control Devices (MUTCD). U.S. Department of Transportation. https://mutcd.fhwa.dot.gov.
- U.S. Code of Federal Regulations. (2023). Title 23, Section 650.305 - Definitions. Retrieved from https://www.ecfr.gov/current/title-23/section-650.305.
- Federal Highway Administration. (2009). Manual on Uniform Traffic Control Devices (MUTCD), Chapter 4B - Traffic Control Signals—General.
- Federal Highway Administration. (n.d.). Breakaway Sign Supports. Retrieved from FHWA Office of Safety.
- Texas Department of Transportation. (2022). Transportation Asset Management Plan June 2022.
- Federal Highway Administration (FHWA). (2014). Lighting - A Proven Safety Countermeasure. Retrieved from https://safety.fhwa.dot.gov/roadway_dept/countermeasures/reduce_crash_severity/roadway_lighting/.
- Federal Highway Administration (FHWA). (2014). A Florida Case Study on a Proven Safety Countermeasure. Publication No. FHWA-HRT-14-050.
- Connecticut Department of Transportation. (2022). Transportation Asset Management Plan.
- Connecticut Department of Transportation. (2008). 2008 ConnDOT Photolog Program Overview.
- Overturf, B. J. (2016). New Technologies for Photolog Image and Data Acquisition: HDTV Image Acquisition, Distribution, and Utilization.
- Vermont Agency of Transportation. (2022). Asset Management Field Data Collection Tools.
- Chapter 5, Statewide Asset Data Collection and Management: Survey of Practice, 2022 http://www.ncsl.org/technology-and-communication/private-use-of-location-tracking-devices-state-statutes.
Disclaimer/Publisher’s Note: The statements, opinions and data contained in all publications are solely those of the individual author(s) and contributor(s) and not of MDPI and/or the editor(s). MDPI and/or the editor(s) disclaim responsibility for any injury to people or property resulting from any ideas, methods, instructions or products referred to in the content. |
© 2025 by the authors. Licensee MDPI, Basel, Switzerland. This article is an open access article distributed under the terms and conditions of the Creative Commons Attribution (CC BY) license (http://creativecommons.org/licenses/by/4.0/).
Copyright: This open access article is published under a Creative Commons CC BY 4.0 license, which permit the free download, distribution, and reuse, provided that the author and preprint are cited in any reuse.


