
Submitted:
21 November 2024
Posted:
22 November 2024
You are already at the latest version
Abstract
This research seeks to provide local governments with a comprehensive alternative for the proper maintenance of roads, focusing on the surface and functional evaluation of pavements. It compares conventional methods of the International Roughness Index (IRI) and the Pavement Condition Index (PCI) with novel methodologies that employ smart technologies. Road maintenance is essential for economic development, facilitating the circulation of services and resources. This re-search analyzes the efficiency of smart technologies in the maintenance of local roads in Arequipa, taking as a case study a 2 km section of the AR-780 highway in Polobaya. The International Roughness Indices (IRI) obtained through the Merlin Roughness Meter and the Roadroid application were compared, finding a minimum variation of 4.007% in the left lane and 8.5% in the right lane. Roadroid turned out to be 60 times faster than the conventional method, with a cost difference of 220.11 soles/km ($/ 57.92/km). Both methods classified the road condition (PSI) as GOOD, validating the accuracy of Roadroid. In addition, the Pavement Condition Index (PCI) was evaluated with conventional methods and a DJI Mavic 2 Pro drone, finding a variation of 6.89%. The cost difference between the methodologies was 1,047.73 soles/km ($/ 275.72/km), and the use of the drone proved to be 10 times faster than visual inspection. Finally, it can be said that this study contributes to closing the knowledge gap regarding the use of smart technologies for better pavement management on local roads, so that the actors in charge of the roads can make decisions based on science and this contributes to the well-being of the population.
Keywords:
Road Management
; Maintenance Road Management
; PCI
; IRI
; Local Roads
; Smart Road Maintenance
; Smart Technologies
1. Introduction
Road infrastructure is a fundamental pillar for the development and efficient functioning of global economies, facilitating the flow of goods, services, and resources between different regions. In this context, the proper maintenance of transportation routes, especially pavements, is crucial [1]. This process not only optimizes the comfort and safety of users but also preserves the functionality of the pavement, ensuring essential features such as skid resistance and a suitable appearance, while also reducing associated operational costs [2]. Consequently, it is imperative to design, build, and maintain road infrastructures appropriately, guaranteeing their long-term durability and safety [3].
In the specific case of Peru, despite global technological advancements, the country lacks an efficient monitoring system that allows for the accurate assessment of its infrastructure [4], including roadways. Some methodologies have been proposed to evaluate the condition of bridges [5,6,7], mainly in response to hydrological phenomena such as El Niño, which significantly affects infrastructure [8]. However, there is little literature on pavement conservation plans to properly prioritize maintenance and potential pavement redesign, which should occur periodically to monitor its condition and attempt to predict its future state [9]. This deficiency has significant repercussions, particularly in the economic realm, as it affects the durability of roads and increases associated operational costs [10].
Pavement evaluation provides essential information for both its design and management. Through this evaluation, it is possible to determine the necessary interventions to ensure proper functionality, whether through maintenance, rehabilitation, or reconstruction [11]. This process also allows for a more accurate estimation of the costs associated with the required interventions, thus optimizing planning and resource allocation [12].
In this research, two types of evaluations were conducted: functional and surface evaluations. The functional evaluation focuses on analyzing the International Roughness Index (IRI), which measures the smoothness of the pavement surface [2]. Knowing this index is crucial for defining conservation or rehabilitation actions, as surface irregularities not only affect vehicle performance but also increase pavement deformation, leading to higher rehabilitation and maintenance costs [13]. On the other hand, the surface evaluation is based on analyzing the Pavement Condition Index (PCI). Quantifying this index allows for efficient management of the necessary interventions for pavement treatment and maintenance, thereby ensuring its optimal conservation [14]. Both indices are essential for road evaluation, and their effectiveness is enhanced by using modern and low-cost techniques [15]. These tools enable efficient monitoring of pavement conditions, which optimizes municipal governments’ use of resources in infrastructure management. This approach is crucial for ensuring sustainable and effective road network maintenance [1].
Therefore, the aim of this research is to propose an approach for the implementation of smart technologies in the management of local road maintenance. It is worth noting that the responsibility for these roads falls on local governments or municipalities [16]. From this context, the research seeks to answer the question: What does the use of smart technologies for local road maintenance management involve? To address this question, five specific objectives have been defined:
- Determine the roughness value using the traditional Merlín Roughness Meter method (method commonly used in Peru because of its low cost, but it takes more time to collect the data) and compare it with Roadroid.
- Determine the pavement quality using the present serviceability index (PSI) with the Merlín Roughness Meter and Roadroid.
- Determine the PCI through a conventional failure inspection and compare it with an inspection using drones.
- Establish the intervention range for local roads based on the PCI obtained through visual failure inspections and drone flights.
- Evaluate the efficiency of using smart technologies in the management of local road maintenance.
The research is based on an exhaustive literature review, which is presented in Chapter 2, detailing the state of the art. Chapter 3 outlines the main research methods used, including the case study. Chapter 4 contains flow figures corresponding to the four methodologies employed to meet the specific objectives. Chapter 5 presents the results obtained during the research, while Chapter 6 is dedicated to discussing those results. Finally, Chapter 7 comprises the conclusions drawn from the study.
2. Background information
Table 1 outlines research backgrounds, the methods employed, and the relevance of each study to the case study.
Regarding the table above, it is noteworthy that several authors have used the Roadroid application in their research, making comparisons with various methodologies, such as the PCI method through visual inspection, the use of the Abakal application for android cellphones, the ROOGA equipment, and the laser profilometer. Each of these approaches aims to calculate the surface regularity of roads. The main differences between these studies lie in the type of roads analyzed (highways, roads, local roads, and urban streets), while a notable similarity is the high effectiveness reported for the Roadroid application. This finding represents a positive precedent for the present research, which seeks to identify smart technologies for the efficient management of road infrastructures.
Additionally, the table presents the evaluation of the Pavement Condition Index (PCI) using various methodologies, such as visual inspection and the use of advanced technology, specifically the DJI Phantom 4 drone. According to [15], the most notable difference between both techniques is that smart technology, represented by the drone, significantly reduces evaluation time while showing accuracy comparable to that of the conventional method. This finding is highly relevant to the present research, as it establishes a positive precedent in the search for efficient alternatives for the management of local roads.
3. Methodology
The research methodology includes methodological schemes, detailed below through four figures, which address the first four specific objectives, focusing on the case study of the AR-780 local road in Arequipa. The general data for the AR-780 road in Polobaya, Arequipa, are as follows: pavement type: flexible, length: 2 km, road width: 7.6 m. The price change from soles to dollars was considered with a value of 3.80 soles per dollar.
Figure 1, corresponding to the first flowchart, summarizes the methodology for determining the IRI (International Roughness Index) using the Merlin Roughness Meter. The procedure begins with calibrating the equipment by placing it on a horizontal surface and adjusting its support points until the pointer indicates 25. If it doesn’t, the lower bolts are adjusted until this is achieved. Then, two readings are taken: an initial one (Li) and another with a calibration block under the movable foot (Lf) to determine the correction factor. Three people are required: an operator, an assistant to record the readings and a spotter. The operator moves the equipment until the wheel completes one rotation (1.98 m), places it on its three support points, and records the pointer’s position in a field form, repeating the process until 200 consecutive readings are completed. The recording form has 20 rows and 10 columns, filled from top to bottom and left to right.
Figure 2, corresponding to the second flowchart, summarizes the methodology for determining the IRI (International Roughness Index) using the Roadroid application. The procedure begins by creating an account on the Roadroid website, where personal data and the phone’s IMEI are registered. The license can be free for educational purposes or purchased on the site. After registration, the phone is calibrated to ensure no data is lost. A mount for the phone must be installed on the vehicle’s windshield, ensuring a horizontal position without obstructions. To perform the IRI (International Roughness Index) diagnosis, the GPS and Wi-Fi or mobile data are activated. The app settings, such as vehicle type, are adjusted, and the phone is calibrated. Once calibrated, the diagnostic process begins by pressing the camera button, and the vehicle should move at 50 km/h. The data is uploaded to the Roadroid system using Wi-Fi. These can be viewed on a virtual map after 15-20 minutes, and reports can be generated and downloaded in formats like KML or TXT for analysis in programs like ArcGIS or Excel [22].
Figure 3, corresponding to the third flow chart, summarizes the procedure for measuring the PCI (Pavement Condition Index) through visual inspection. To calculate it, the failure data obtained during the on-site inspection according to the 19 specified failures is required. These values are then subjected to the following steps: the Deduct Value (DV) is calculated by recording the sum of each type of failure according to its severity and quantity. The density of the failures is then used to determine the deducted value for each type of damage. Next, the maximum allowable deducted values (m) are calculated using an equation that considers the maximum deducted value for each sampling unit. The total deducted value is adjusted using a correction curve, thus obtaining the maximum Corrected Deduct Value (CDV). Finally, the PCI is calculated by subtracting the maximum CDV from 100, which indicates the pavement’s condition. The PCI is classified according to various failures such as deformations, cracks, and erosion in the pavement [23].
Figure 4, corresponding to the fourth flow chart, summarizes the procedure for measuring the PCI (Pavement Condition Index) using the DJI Mavic 2 Pro drone, programmed via a mobile phone with the DJI PILOT app. The flight was conducted at 11 a.m. at an altitude of 50 meters to capture high-resolution images, taking photos every 2 seconds with a 70% overlap. A linear flight plan was generated, and the flight parameters, such as takeoff speed (15 m/s) and flight speed (5.5 m/s), were configured. The drone followed the programmed route, returning to the takeoff point for battery replacement three times. All information was stored in the drone’s memory and then processed using Agisoft Metashape software, where the images were imported, oriented in high quality, and a dense point cloud was created for the final analysis.
4. Results
4.1. International Roughness Index Evaluation
The Merlin Roughness Meter test was conducted on both lanes of a 2 km road section. Measurements began at kilometer marker 0+000 km and extended to 2+000 km, with records taken every 400 meters. On the right lane, readings were taken first on the right track and then on the left track, with a total of 200 readings per section. The same procedure was replicated on the left lane, maintaining the same interval and measurement methodology.
As for the evaluation using the Roadroid application, the analysis sections were also defined every 400 meters, with 200 continuous readings per lane. The data obtained was electronically processed, following the established methodology to segment the pavement into 5 evaluation sections for each lane and traffic direction. Since using the Roadroid app requires a license, an investigative request was made, resulting in the acquisition of a temporary free license.
4.1.1. IRI with Merlin Roughness Meter
Figure 5 shows the results for the IRI for the right lane evaluated using the Merlin Roughness Meter. The highest IRI value, 1.85, occurs in the section from 0+800 to 1+200.
Figure 6 shows the results for the IRI for the left lane evaluated using the Merlin Roughness Meter. The highest IRI value, 1.88, occurs in the section from 0+000 to 0+400.
4.1.2. IRI with the Roadroid Aplication
Figure 7 shows the results for the IRI for the right lane evaluated using the Roadroid app. The highest IRI value, 1.72, occurs in the section from 0+800 to 1+200.
Figure 8 shows the results for the IRI for the left lane evaluated using the Roadroid app. The highest IRI value, 1.60, occurs in the section from 0+800 to 1+200.
4.1.3. Comparison of IRI Using Merlin Roughness Meter and Roadroid
Table 3 shows that the average roughness value measured using the Merlin Roughness Meter for the right lane was 1.63 m/km, while for Roadroid it was 1.57 m/km, with an average variation of 4.007%. It can be concluded that there is a high correlation between the IRI with Merlin and the IRI with Roadroid found in the right lane. Table 4 shows that the average roughness value measured using the Merlin Roughness Meter for the left lane was 1.7 m/km, while for Roadroid it was 1.56 m/km, with an average variation of 8.7%. It can be concluded that there is a high correlation between the IRI with Merlin and the IRI with Roadroid found in the left lane.
It is concluded that using the Roadroid application yields results like those obtained with the Merlin method, making it a reliable option for monitoring road conditions.
Additionally, Figure 9 shows the scatter plot of IRI vs eIRI for the right lane data. The best-fit line to the point cloud with the origin point (0,0) is displayed, with the IRI with Merlin values on the “x” axis and IRI with Roadroid values on the “y” axis. A coefficient of determination (R²) of 0.9967 is obtained, indicating a high correlation (Figure 3).
Figure 10 shows a linear regression for the left lane data. The best-fit line to the point cloud with the origin point (0,0) is displayed, with the IRI values on the “x” axis and eIRI values on the “y” axis. A coefficient of determination (R²) of 0.998 is obtained, also indicating a high correlation.
4.1.4. Comparison of PSI (Present Serviceability Index) Using the Merlin Roughness Meter and Roadroid
The present serviceability index (PSI) is the capacity of the pavement to handle traffic. The serviceability index ranges from 1 (Terrible) to 5 (Excellent). With the IRI values already determined, the Present Serviceability Index of the pavement (PSI) is calculated, which represents the degree of comfort or safety perceived by the user when traveling on the road, also understood as a safety parameter. The Paterson equation is used to calculate the PSI: [24].
The PSI results using both devices for the right lane are shown in Table 43. For the right lane, employing the Merlin Roughness Meter, the quantitative PSI value was 3.72, categorized as GOOD on the qualitative scale. Using the Roadroid application, the quantitative PSI value was 3.76, also categorized as GOOD. The proximity of these values and their identical qualitative scale (GOOD) demonstrate a strong correlation between the PSI measurements for the right lane, with a maximum difference of 1.1% in their quantitative values.
The PSI results for both devices on the left lane are also shown (Table 4). For the left lane, the Merlin Roughness Meter yielded a quantitative value of 3.67, within the GOOD qualitative scale, while the Roadroid application gave a quantitative value of 3.77, also within the GOOD qualitative scale. These similar values and the identical qualitative scale (GOOD) demonstrate a good correlation between the PSI measurements for the left lane, with a maximum difference of 3% in their quantitative values.
4.1.5. Analysis of Unit Prices for Obtaining IRI with Roadroid and the Merlin Roughness Meter
For evaluating 1 km of the AR-780 road, there is a difference in unit costs. The cost for evaluating roughness with the Roadroid application is 681.29 Peruvian soles ($/ 179.29), compared to 901.40 Peruvian soles for the Merlin Roughness Meter, resulting in a positive profitability margin of 24.42%.

Table 6.
Unit price to obtain IRI with Roadroid.
| Item | Specification | Unit | Quantity | Unit Price | Subtotal |
|---|---|---|---|---|---|
| Labor | |||||
| Civil Engineer (specialist) | Hh | 2.00 | 500.00 | 1000.00 | |
| Vehicle | |||||
| Medium car rental | Day | 1.00 | 356.00 | 356.00 | |
| Gasoline | |||||
| 84 octanes | GL | 0.07 | 13.86 | 0.91 | |
| Equipment | |||||
| Android cell phone | Day | 1.00 | 2.47 | 2.47 | |
| Annual license for 1 user per day of use | Day | 1.00 | 3.19 | 3.19 | |
| TOTAL | 1362.57 | ||||
| UP (Soles/Km) | S/ 681.29 | ||||
| UP (Dollar/Km) | $/ 179.29 |
Table 7.
Unit price to obtain IRI with the Merlin Roughness Tester.
| Item | Specification | Unit | Quantity | U.P. | Total |
|---|---|---|---|---|---|
| Field Work | Laborer (watchman) | Hh | 8 | 39.1 | 312.96 |
| Technician | Hh | 8 | 54.98 | 439.84 | |
| Field Work | Civil Engineer | Hh | 2 | 150 | 300 |
| Equipo | Merlin Roughness Tester | Day | 1 | 750 | 750 |
| TOTAL | 1802.80 | ||||
| UP (Soles/Km) | S/ 901.40 | ||||
| UP (Dollar/Km) | $/ 237.21 |
The Roadroid application’s performance is 1.08 km/min, as the vehicle traveled at an approximate speed of 75 km/h. In contrast, the traditional Merlin Roughness Meter has a performance of 1 km/h. This indicates that the data collection process using the Roadroid application is 60 times faster. Therefore, it is concluded that the use of the Roadroid application is not only more economical but also more cost-effective.
Figure 11 shows the Cost-Benefit analysis between these two methods, indicating that the Roadroid application is more efficient in terms of time and cost for measuring IRI over 1 kilometer of road, with a time of 1 minute and a cost of 681.29 peruvian soles per km ($/237.21), compared to 60 minutes and a cost of 901.4 soles per km using the Merlin Roughness Meter.
4.2. Pavement Condition Index (PCI) Evaluation
In the study conducted along 2 km of the AR-780 Polobaya road to evaluate the Pavement Condition Index (PCI) through visual inspection, 67 sample units were used. Each unit measured 30 m in length and 7.6 m in width, covering an area of 228 m², except for unit UM-67, which covered 152 m².
For the PCI evaluation using a drone, a DJI Mavic 2 Pro was employed, programmed with a mobile phone. The flight took place at 11 a.m., following the guidelines of the NTC 001–2015 standard [25]. A height of 50 meters was set, allowing high-resolution images to be captured without interference on the road. Photographs were taken every 2 seconds, with a 70% crosswise and lengthwise overlap, ensuring adequate image overlap to obtain enough homologous points. The drone’s software automatically calculated the number of points, the number of photos, and the flight time.
4.2.1. Comparison Between Pavement Condition Index (PCI) Using Visual Inspection and Drone Flight
In Figure 12, PCI data for each 30 m sample unit can be visualized using both methodologies and a bar graph also represents the average PCI value for both methodologies.
PCI methodology relates to a numerical scale with values from zero (0), for a failed pavement condition, to one hundred (100), for an excellent pavement condition according to ASTM 6433 [23].
In response to the values presented in the comparison of the PCI between both methodologies—through the conventional method of visual inspection of failures and via drone flight (DJI Mavic 2 Pro)—for the AR-780 road, the average PCI value through the conventional visual inspection method was 76.75, and for the DJI Mavic 2 Pro drone, it was 82.04, with an average variation of 6.89%.
Therefore, it can be concluded that the PCI measurement using the traditional method provides greater accuracy and detail since it is conducted in the field and yields better results for pavement failures compared to the method using the DJI Mavic 2 Pro drone.
4.2.2. Comparison Between the Pavement Condition Index (PCI) Using Visual Inspection and Drone Flight
In response to the values presented in the comparison of the intervention range between both methodologies—through the conventional method of visual inspection of failures and via drone flight (DJI Mavic 2 Pro)—for the AR-780 road, the PCI of the AR-780 local road was determined through conventional failure inspection, obtaining 50 sample units that require maintenance and 17 units that require rehabilitation (2, 7, 9, 10, 12, 17, 25, 32, 35, 36, 39, 40, 45, 49, 52, 54, and 56). Meanwhile, using the drone method for PCI, 62 sample units were found to require maintenance and 5 units to require rehabilitation. It is notable that both methods coincide with 5 sample units requiring rehabilitation intervention: UM-09, 10, 17, 39, and 40; and 50 sample units suggested maintenance intervention, with 12 sample units differing in their intervention range.
It can be concluded that PCI measurement using the traditional method provides greater accuracy and detail since it is conducted in the field and yields better results for pavement failures compared to the method using the DJI Mavic 2 Pro drone.
Figure 14.
PCI for both types of evaluation and their respective classification.
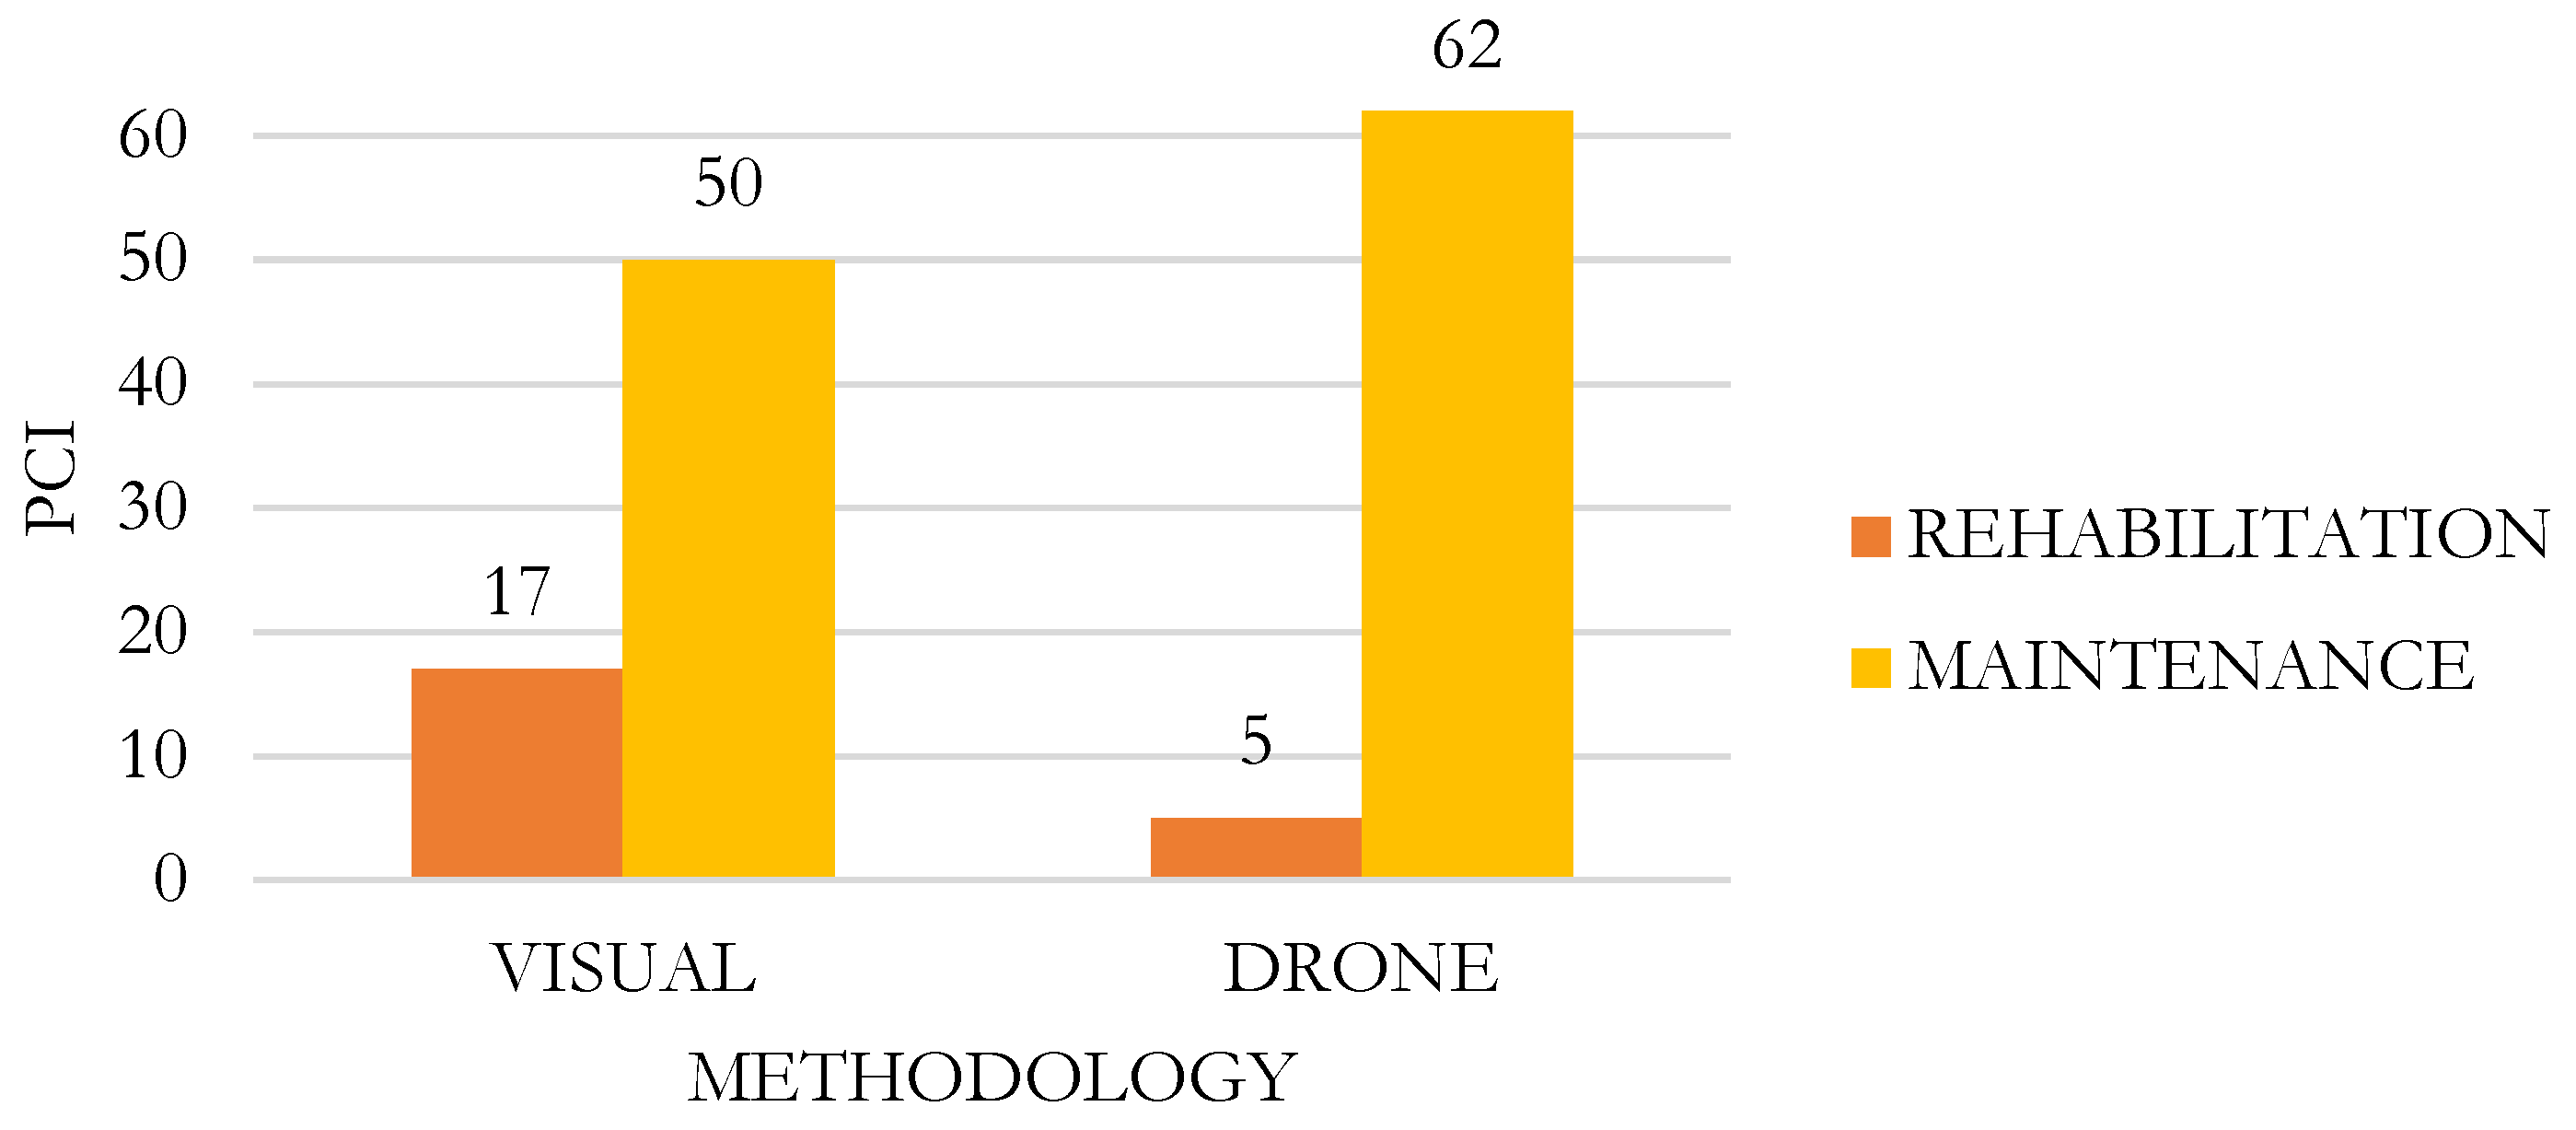
Table 8.
Intervention range for each methodology.
| TYPE OF EVALUATION | PCI | CLASSIFICATION |
|---|---|---|
| Conventional PCI Method | 76.75 | VERY GOOD |
| PCI Method using a drone | 82.04 | VERY GOOD |
4.2.3. Unit Price Analysis to Obtain PCI Using Drone Flight and Visual Inspection
Table 9 and Table 10 show the unit cost analysis for the PCI test through conventional visual inspection for 2 km, with a cost of 1,422.73 soles ($/ 374.40 dollars) per kilometer of road. In the next table, the price of the PCI test using a drone for 2 km is shown, with a cost per kilometer of 375 soles ($/ 98.68 dollars). Comparing both costs, a reduction of 73.6% is achieved using the drone evaluation method.
In Figure 15, a cost-benefit analysis between the traditional system and the method using a drone is observed, obtaining lower costs and time using a drone, which is 375 soles ($98.68 dollars) and 3 hours, compared to the traditional method, which is 1,422.73 soles ($374.40 dollars) and 30 hours.
4.3. Proposal for Maintenance Management on Local Roads
In proposing a maintenance management plan for local roads, it is worth mentioning that local governments are responsible for local roads. By applying Smart technologies, they can measure the IRI (International Roughness Index) and PCI (Pavement Condition Index) to get an overview of the roads needing maintenance and thus have information about the current functional condition of their roads and determine what type of maintenance is required.
In the department of Arequipa, there are 149.64 km of paved local roads managed by their respective local governments, according to the update of [26], which involve execution costs and operational expenses for their corresponding routine maintenance.
Therefore, this technical and economic proposal aims to intervene in local roads to facilitate and shorten the evaluation time and reduce costs.
By operating for the 149.64 km of local roads in the city of Arequipa at the unit cost for evaluating IRI obtained by the Roadroid method, the result is 101,947.68 soles. For the Merlin Roughness Meter method, the result is 134,885.50 soles, achieving savings of 32,937.82 soles with the Roadroid method, the equivalent in U.S. dollars is 8,667.85.
Also, by operating for the 149.64 km of all local roads in Arequipa at the unit cost to evaluate PCI, the total cost obtained is 202,897.32 soles using the conventional method and 56,115.00 soles using the drone method, generating savings of 146,782.32 soles (38,626.93 U.S. dollars) for the respective entity if this method is used.
5. Discussion
This research has considered it essential to divide the discussion into five key terms that reflect the relevance and scope of this study.
5.1. Roughness Indicator (IRI)
The IRI results obtained in this research present a moderate relationship compared to the findings of Castillo and Morales [27]. In this study, the IRI variation between the Merlin roughness meter and the Roadroid application ranges from 0% to 8.71%, while Castillo and Morales [27] report a difference of up to 27.5%. This discrepancy can be attributed to the conditions under which each study was conducted. Castillo’s research was carried out on a busy avenue, subject to factors such as variable speed, the presence of speed bumps, and fluctuations in traffic flow. In contrast, this research was conducted on a local road, free from such influences, which may have favored greater consistency in the IRI results.
5.2. Serviceability Indicator (PSI)
The PSI results in this research show a low correlation compared to those obtained by Mamani A. and Lozano R. [19]. In my study, the average PSI was 3.7 with both the Roadroid application and the Merlin roughness meter, while Mamani reported a PSI of 1.99. This suggests that the flexible pavement of the AR-780 local road is in better condition than that of Antúnez de Mayolo Avenue in Tacna. Additionally, the importance of comparing PSI data with a conventional method to ensure greater accuracy in the results is highlighted. In this regard, the Merlin roughness meter is a recommended method for such comparison.
5.3. Pavement Condition Indicator (PCI)
Compared to the research by Cubas [15], the Pavement Condition Index (PCI) results in this study show a high correlation. In this research, the conventional and drone-based PCI evaluations yielded results of 76.75 and 82.04, respectively, while Cubas [15] reported values of 59 for the conventional evaluation and 61 for the drone evaluation. These results reflect an agreement between both studies in that conventional visual inspection proves to be more accurate in evaluating the pavement condition PCI. This difference is because drones, in the context of this study, which require millimetric precision in the photogrammetry, do not provide the necessary accuracy on the z-axis.
5.4. Intervention Range Indicator
Compared to the research by Cubas [15], the Pavement Condition Index (PCI) results in this study show a high correlation. In this research, the PCI values obtained through conventional and drone methods indicate the need for intervention in the maintenance range. In contrast, the results of Cubas [15] suggest that both the conventional and drone-based evaluations correspond to an intervention range for rehabilitation and structural reinforcement. This suggests that the local road analyzed in this study requires corrective maintenance due to its incipient failures, while the avenue studied by Cubas [15] needs medium-term rehabilitation.
5.5. Maintenance Management Indicator
In this research, the evaluation using drones takes 3 hours, while the traditional method requires 30 hours to cover the entire study area. This demonstrates that the use of drones is approximately 10 times faster in terms of time. Regarding cost, the evaluation with drones incurs a cost of 375.00 soles per kilometer, compared to 1,422.73 soles per kilometer with the traditional method, representing a 73.64% reduction in costs. Therefore, drone inspection is significantly more economical than conventional visual inspection.
The research conducted by Colque [28] reports that the total drone usage time to evaluate two avenues was 4 hours, with a total cost of 4,650.25 soles.
In conclusion, both this research and that of Colque [28] show a significant reduction in costs and execution time when using drones for pavement evaluation.
6. Conclusions
This research determined the roughness value using the traditional Merlin Roughness Meter method and the Roadroid application. The average roughness value using the Merlin Roughness Meter test for the right lane was 1.63 m/km, and for Roadroid, it was 1.57 m/km, with an average variation of 4.007% and a correlation coefficient R² of 0.997. It can be concluded that there is a high relationship between the IRI and eIRI found in the right lane. The average roughness value using the Merlin Roughness Meter test for the left lane was 1.7 m/km, and for Roadroid, it was 1.56 m/km, with an average variation of 8.71% and a correlation coefficient R² of 0.998. It can be concluded that there is a high relationship between the IRI and eIRI found in the left lane. Therefore, it is concluded that using the Roadroid application provides results like those obtained with the Merlin method, making it a reliable option for monitoring road conditions.
The Present Serviceability Index (PSI) for the AR-780 road using the Merlin Roughness Meter test for the right lane had an average quantitative value of 3.72, and using the Roadroid application, it was 3.76, both falling within the qualitative scale of GOOD. The PSI value for the left lane using the Merlin Roughness Meter test had an average quantitative value of 3.67, and using the Roadroid application, it was 3.77, both falling within the qualitative scale of GOOD. It is concluded that the Roadroid application provides reliable data because the PSI values obtained are close to those obtained by the Merlin method, with a maximum difference of 3% in their quantitative values for the road under study.
The PCI value was determined using the conventional method of visual inspection of failures and through the flight of the DJI Mavic 2 Pro drone. The average PCI value using the conventional visual inspection method was 76.75, and for the DJI Mavic 2 Pro drone, it was 82.04, with an average variation of 6.89%. The PCI of the AR-780 local road was determined through a conventional failure inspection, obtaining 50 sample units that require maintenance and 17 units that require rehabilitation (2, 7, 9, 10, 12, 17, 25, 32, 35, 36, 39, 40, 45, 49, 52, 54, and 56). Using the drone method for PCI, 62 sample units were found to require maintenance and 5 units to require rehabilitation. It can be observed that in both methods, there is a coincidence in 5 sample units that require rehabilitation intervention: UM-09, 10, 17, 39, and 40; and 50 sample units suggest maintenance intervention, with 12 sample units not matching in their intervention range. Therefore, it can be concluded that the PCI measurement using the traditional method provides greater accuracy and detail, as it is conducted in the field and yields better results for pavement failures compared to the method used by the DJI Mavic 2 Pro drone. The results obtained by the drone can be optimized by complementing them with topographic leveling. The drone did not offer higher precision because it is not the appropriate equipment for z-axis measurement, which requires millimetric precision for this study.
The efficiency of the smart technologies used in this research for local road maintenance management was evaluated. In terms of time and cost when implementing the Roadroid application compared to the Merlin method, it was found that with the application, 1 km/min can be covered, while with the Merlin method, it is 1 km/h, indicating that the application is 60 times faster in data collection than the Merlin method. Regarding cost, with Roadroid, a Unit Price Analysis per kilometer of 681.29 soles ($/ 179.29) was obtained, and with the Merlin method, it was 901.40 soles ($/ 237.21), making the use of the Roadroid application more economical with a profitability percentage of 24.42%. Through the Cost-Benefit analysis, it is concluded that the Roadroid application is more efficient in terms of data collection time and costs, achieving similar precision in the results. As for PCI measurement on the road, using the drone, it takes 3 hours for data collection and analysis time, and with the traditional method, it takes 30 hours for the entire study area, indicating that the use of drones is 10 times faster in terms of data collection and analysis time. Regarding cost, with the drone, a Unit Price Analysis per kilometer of 375.00 soles ($/ 98.68) was obtained, and with the traditional method, it was 1422.73 soles ($/ 374.40), making it more economical with a profitability percentage of 73.64%. Through the Cost-Benefit analysis, it is concluded that the use of drones is more efficient in terms of data collection and analysis time and in costs. However, the use of the traditional method to obtain the PCI of the road is more accurate than that obtained by the drone.
7. Limitations and Future Line of Research
7.1. Reasearch Limitations
Among the limitations of the Roadroid application, it must be considered that it depends on external factors such as: speed of travel, traffic, number of singularities (potholes, breakwaters), distance between singularities, geometry of the road under study and elements outside the road surface such as branches, small stones and others that may be on the roadway. Also, the use of the application requires a constant minimum speed of displacement, which in sharp curves can cause risk of accidents.
As for the limitations in the use of the drone, it does not allow millimeter measurements in the z-axis, however, it shows results close to those of the field inspection. Regarding its use, it is recommended to make a previous evaluation of the area and the schedule in which the equipment is going to be flown, since the presence of flora such as large trees produces shadows on the evaluated road, which does not allow a correct evaluation.
7.2. Future Line of Research
In this research focused on local roads, the road under study is a remote road with little traffic, however, if you want to apply the methodology in another road with different conditions, it should be taken into account that its effectiveness and efficiency may vary if they are busy roads or roads with many potholes and curves and if it has excessive vegetation this may prevent the observation of the road and prevent the use of this type of technology. This research gives rise to future investigations that wish to explore this phenomenon such as: Interviewing the road maintenance area to evaluate the implementation of drones in the road maintenance procedure, use of these technologies in important and high traffic roads in a city and comparison of different applications and equipment such as drones to evaluate their effectiveness and costs in the results.
Author Contributions
“Conceptualization, L.F.J.G., R.G.T. and A.J.E.V.; methodology, L.F.J.G., R.G.T. and A.J.E.V.; software, L.F.J.G.; validation, L.F.J.G.; formal analysis, L.F.J.G.; investigation, L.F.J.G.; resources, L.F.J.G.; data curation, L.F.J.G; writing—original draft preparation, L.F.J.G.; writing—review and editing, L.F.J.G., R.G.T. and A.J.E.V.; visualization, L.F.J.G.; supervision, L.F.J.G., R.G.T. and A.J.E.V.; project administration, L.F.J.G. All authors have read and agreed to the published version of the manuscript.”
Funding
“This research received no external funding”.
Data Availability Statement
The findings of this research are supported by the data available from the corresponding author, L.F.J.G., upon reasonable request.
Acknowledgments
The authors thank Manuel Luque Delgado for his unconditional support and constant motivation, Diego Gómez Quispe for his support during the formatting of the document, Alan Huarca Pulcha for his constant revision and suggestions, and Universidad Católica de Santa María for providing useful insight and assistance with the research reported, particularly the research group DROP.
Conflicts of Interest
“The authors declare no conflicts of interest.”
References
- Cruz Toribio, J.; Gutiérrez Lázares, J. Cálculo del índice de condición del pavimento con imágenes del vehículo aéreo no tripulado. Universidad de Ingeniería, Lima, Perú, 2018.
- Scholotjes, M.R.; Visser, A.; Bennet, C. EVALUATION OF A SMARTPHONE ROUGHNESS METER. 2014.
- Llapasi. La importancia del matenimiento de las carreteras. Available online: https://llapasi.com/sin-categoria/la-importancia-del-mantenimiento-de-las-carreteras/ (accessed on 13 septiembre 2024).
- Espinoza Vigil, A.J.; Carhart, N.J. Local infrastructure governance in Peru: a systems thinking appraisal. Infrastructure Asset Management 2024, 11, 145-160. [CrossRef]
- Ccanccapa Puma, J.; Hidalgo Valdivia, A.V.; Espinoza Vigil, A.J.; Booker, J. Preserving Heritage Riverine Bridges: A Hydrological Approach to the Case Study of the Grau Bridge in Peru. Heritage 2024, 7, 3350-3371.
- Espinoza Vigil, A.J.; Booker, J. Hydrological Vulnerability Assessment of Riverine Bridges: The Bajo Grau Bridge Case Study. Water 2023, 15, 846.
- Huarca Pulcha, A.; Espinoza Vigil, A.J.; Booker, J. Prioritizing Riverine Bridge Interventions: A Hydrological and Multidimensional Approach. Designs 2023, 7, 117.
- Espinoza Vigil, A.J.; Booker, J.D. Building national disaster resilience: assessment of ENSO-driven disasters in Peru. International Journal of Disaster Resilience in the Built Environment 2023, 14, 423-433. [CrossRef]
- Sánchez, J.C. Evaluación del estado del pavimento de la Av. Ramón Castilla, Chulucanas, mediante el método PCI. Universidad de Piura, Piura, Perú, 2017.
- ECOASFALT. Consecuencias del asfalto en mal estado de conservación. Available online: https://www.ecoasfalt.es/consecuencias-del-asfalto-en-mal-estado-de-conservacion/ (accessed on 13 Septiembre 2024).
- Velásquez, J.C. Caracterización y análisis del método ROADROID en la obtención del índice de rugosidad internacional (IRI) para la gestión de pavimentos. Universidad Nacional de Ingeniería, Lima, Perú, 2021.
- Arianto, T.; Suprapto, M.; Syafi’i. Pavement Condition Assessment Using IRI from Roadroid and Surface Distress Index Method on National Road in Sumenep Regency. Engineering 2018, 8.
- Oblitas Gastelo, B.E.; Medina Cardozo, I.I.; Paredes Asalde, C.R. Índice de regularidad internacional e índice de condición de pavimento para definir niveles de serviciabilidad de pavimentos. 2021, 18, 2-3. [CrossRef]
- Sarabia, W. Evaluación de fallas superficiales del pavimento flexible por el método PCI y empleo del Dron, Carretera Covadonga – Mollepata, Ayacucho. Universidad César Vallejo, Ayacucho, Perú, 2021.
- Cubas, J. Uso de un dron para optimizar la evaluación superficial del pavimento flexible por el método PCI en la Av. Los Conquistadores, distrito de San Isidro, Lima. Universidad Privada del norte, Lima, Perú, 2021.
- Perú, G.d. Clasificador de Rutas del Sistema Nacional de Carreteras - SINAC. 2008.
- Putra, D.A.; Suprapto, M. Assessment of the road based on PCI and IRI roadroid measurement. MATEC Web Conf. 2018, 195, 04006.
- Mozo Barrantes, W.V.; Quispe Mendoza, A.J. Evaluación superficial de la condición y serviciabilidad del pavimento flexible por el método pavement condition index (PCI) y ROADROID en el circuito humedal Lucre-Huacarpay. Universidad Andina del Cusco, Cusco, Perú, 2019.
- Mamani A., D.E.; Lozano R., J.L. Evaluación de la rugosidad en el pavimento utilizando teléfonos inteligentes para mejorar la transitabilidad vehicular en la Av. Antúnez de Mayolo, distrito Gregorio Albarracín Lanchipa, Tacna. Universidad Privada de Tacna, Tacna-Perú, 2021.
- Almenara, C. Aplicación de telefonos inteligentes para determinar la rugosidad de pavimentos urbanos en Lima. Pontificia Universidad Católica del Perú., Lima, Perú, 2015.
- A. Gabbar, H.; Chahid, A.; U. Isham, M.; Grover, S.; Singh, K.P.; Elgazzar, K.; Mousa, A.; Ouda, H. HAIS: Highways Automated-Inspection System. Technologies 2023, 11, 1-3.
- Roadriod. Available online: https://www.roadroid.com/map (accessed on 13 septiembre 2024).
- International, A. ASTM D6433-20. Standard Practice for Roads and Parking Lots Pavement Condition Index Surveys 2023. [CrossRef]
- Carey, W.; Irick, P. The Pavement Serviceability-Performance concept. National Academic of Science-National Research Council (U.S.). Highway Research Board 1960, 40-58. [CrossRef]
- Ministerio de Transportes y Comunicaciones. Norma Técnica Complementaria. 2015.
- Perú, G.d. Convenio de Gestion para la ejecucion del mantenimiento rutinario de vías vecinales entre provias descentralizado y la municipalidad provincial de Arequipa. 2023.
- Castillo, R.; Morales, Y. Optimización de la evaluación funcional del pavimento flexible mediante el software roadroid y el método merlón de la Av. prolongación Iquitos-Lince-Lima-2022. Universidad Privada del Norte, Lima, Perú, 2023.
- Colque, J. Aplicación del método PCI en pavimentos fléxibles empleando drones. Universidad Peruana los Andes, Huancayo, Perú, 2023.
Figure 1.
Flowchart of the Rugosimeter Merlin Equipment method for determining the IRI.
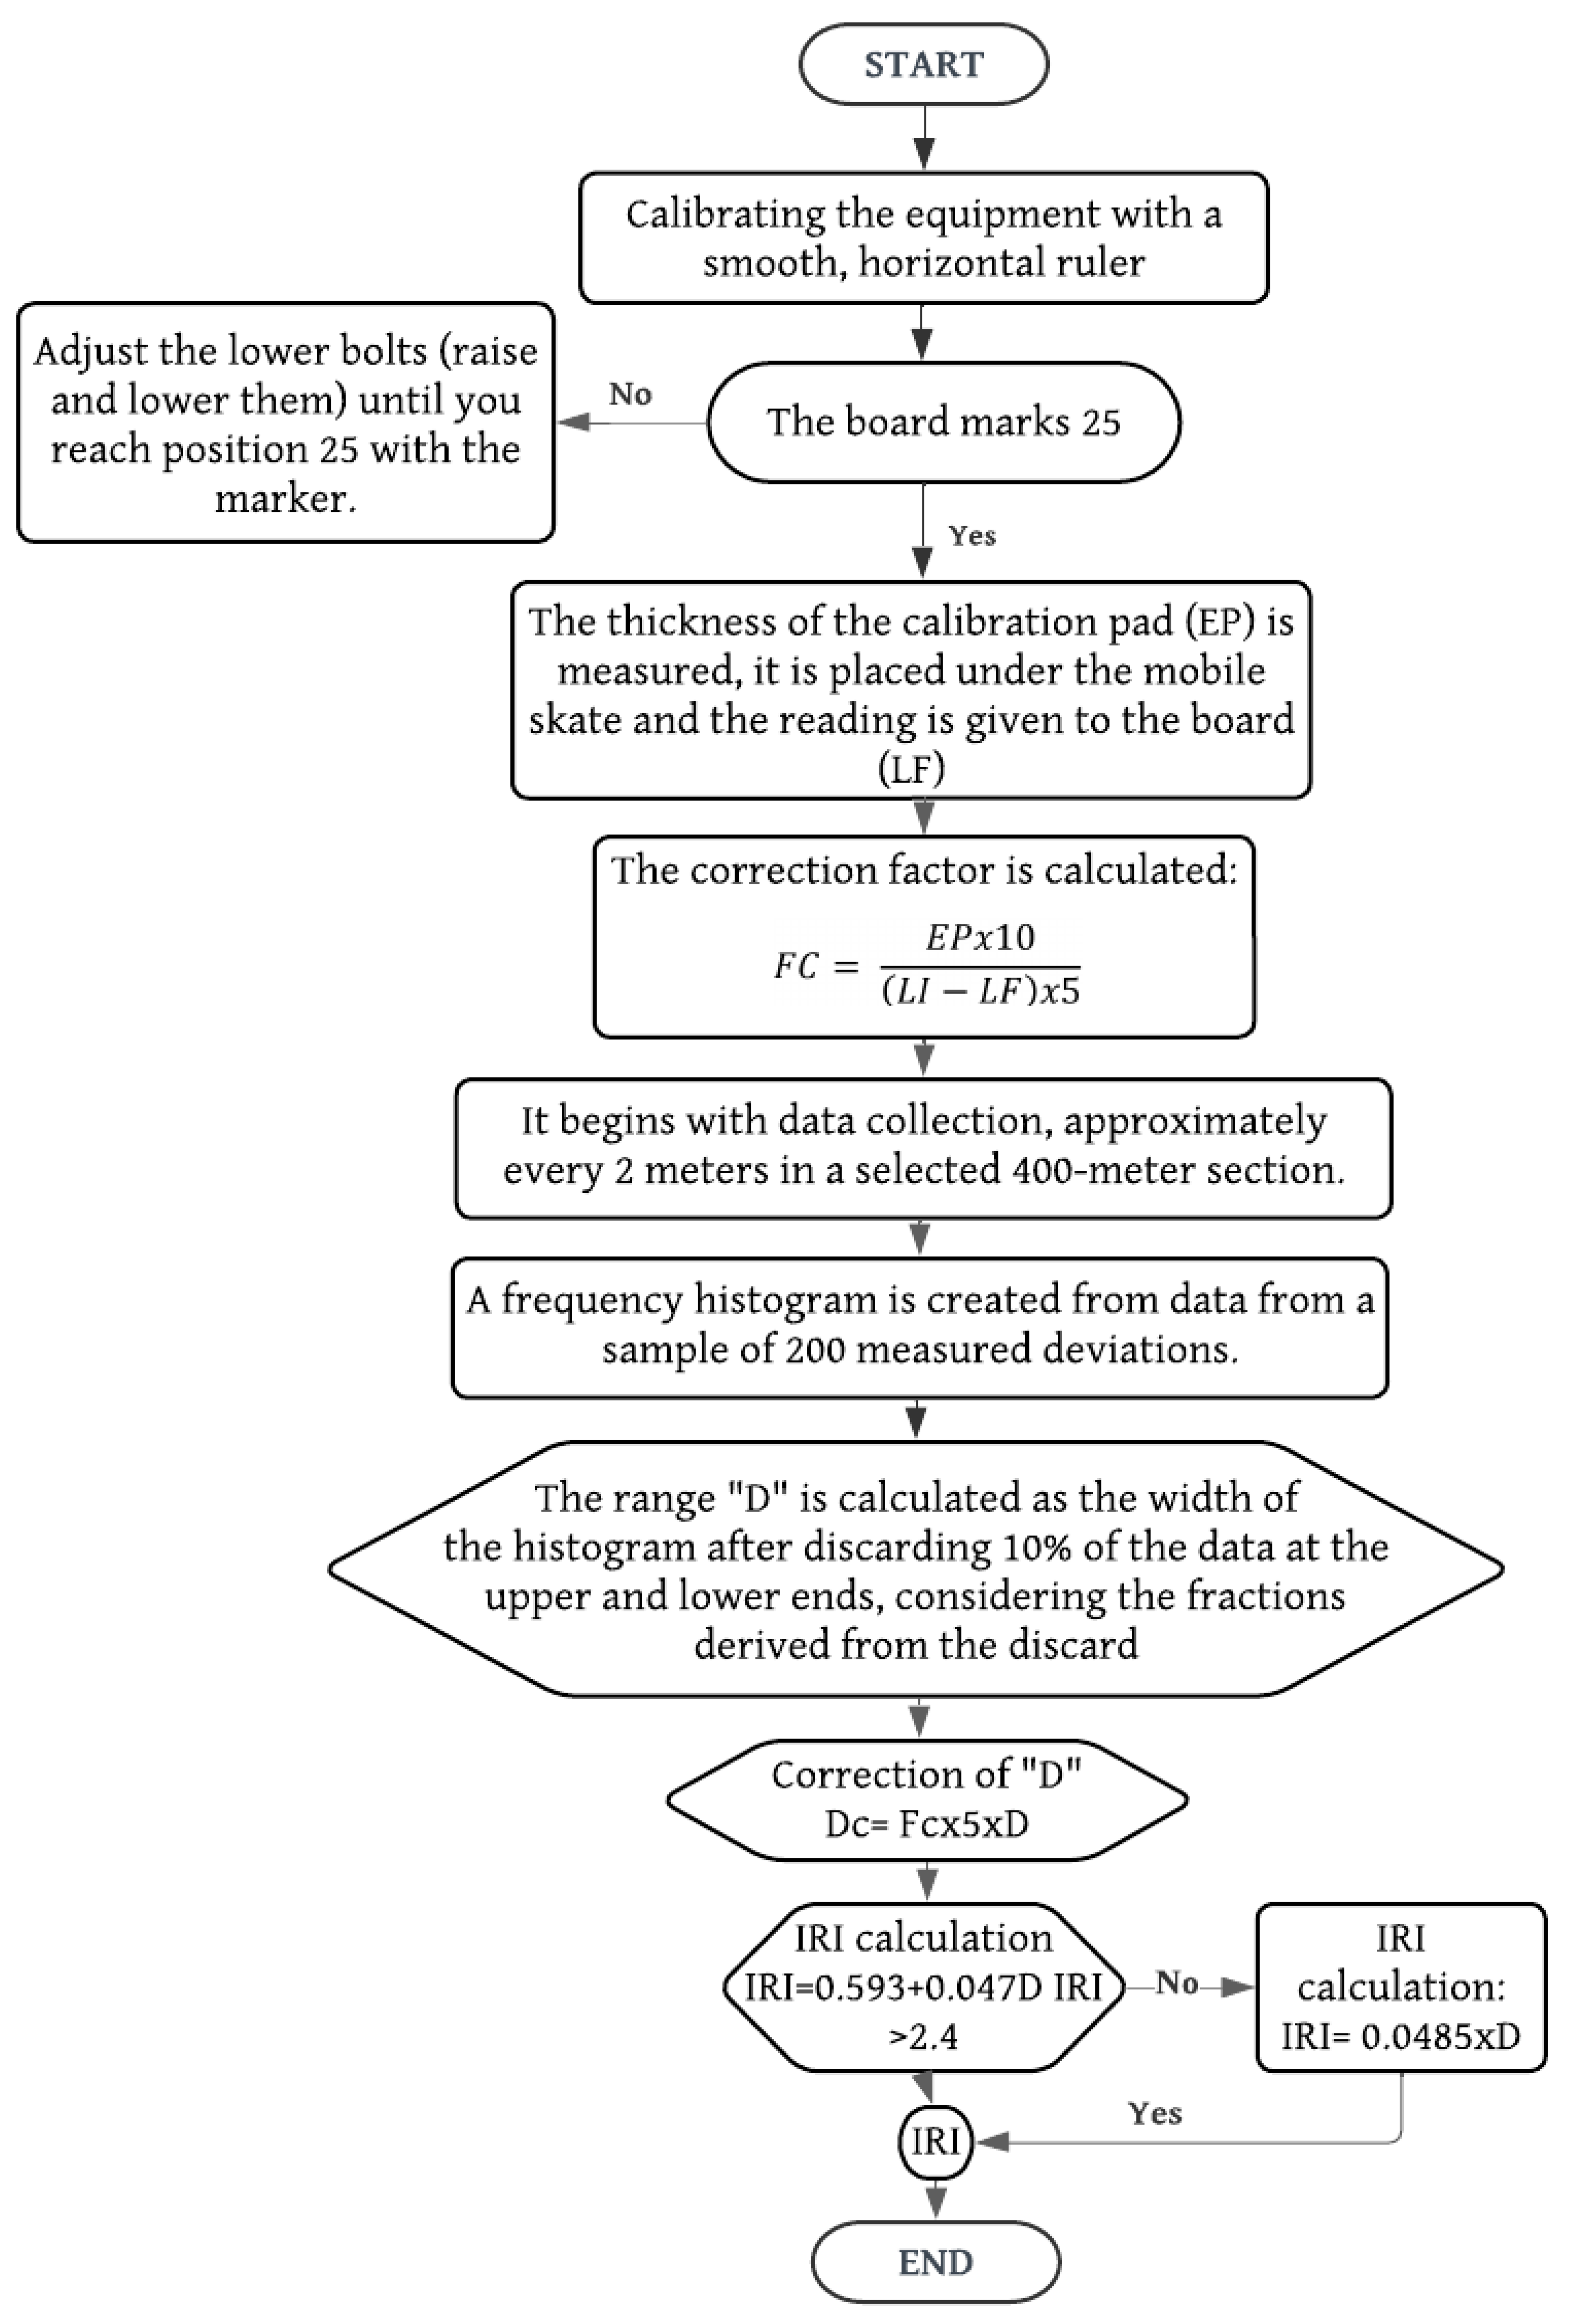
Figure 2.
Flowchart of the Roadroid method for determining the IRI.
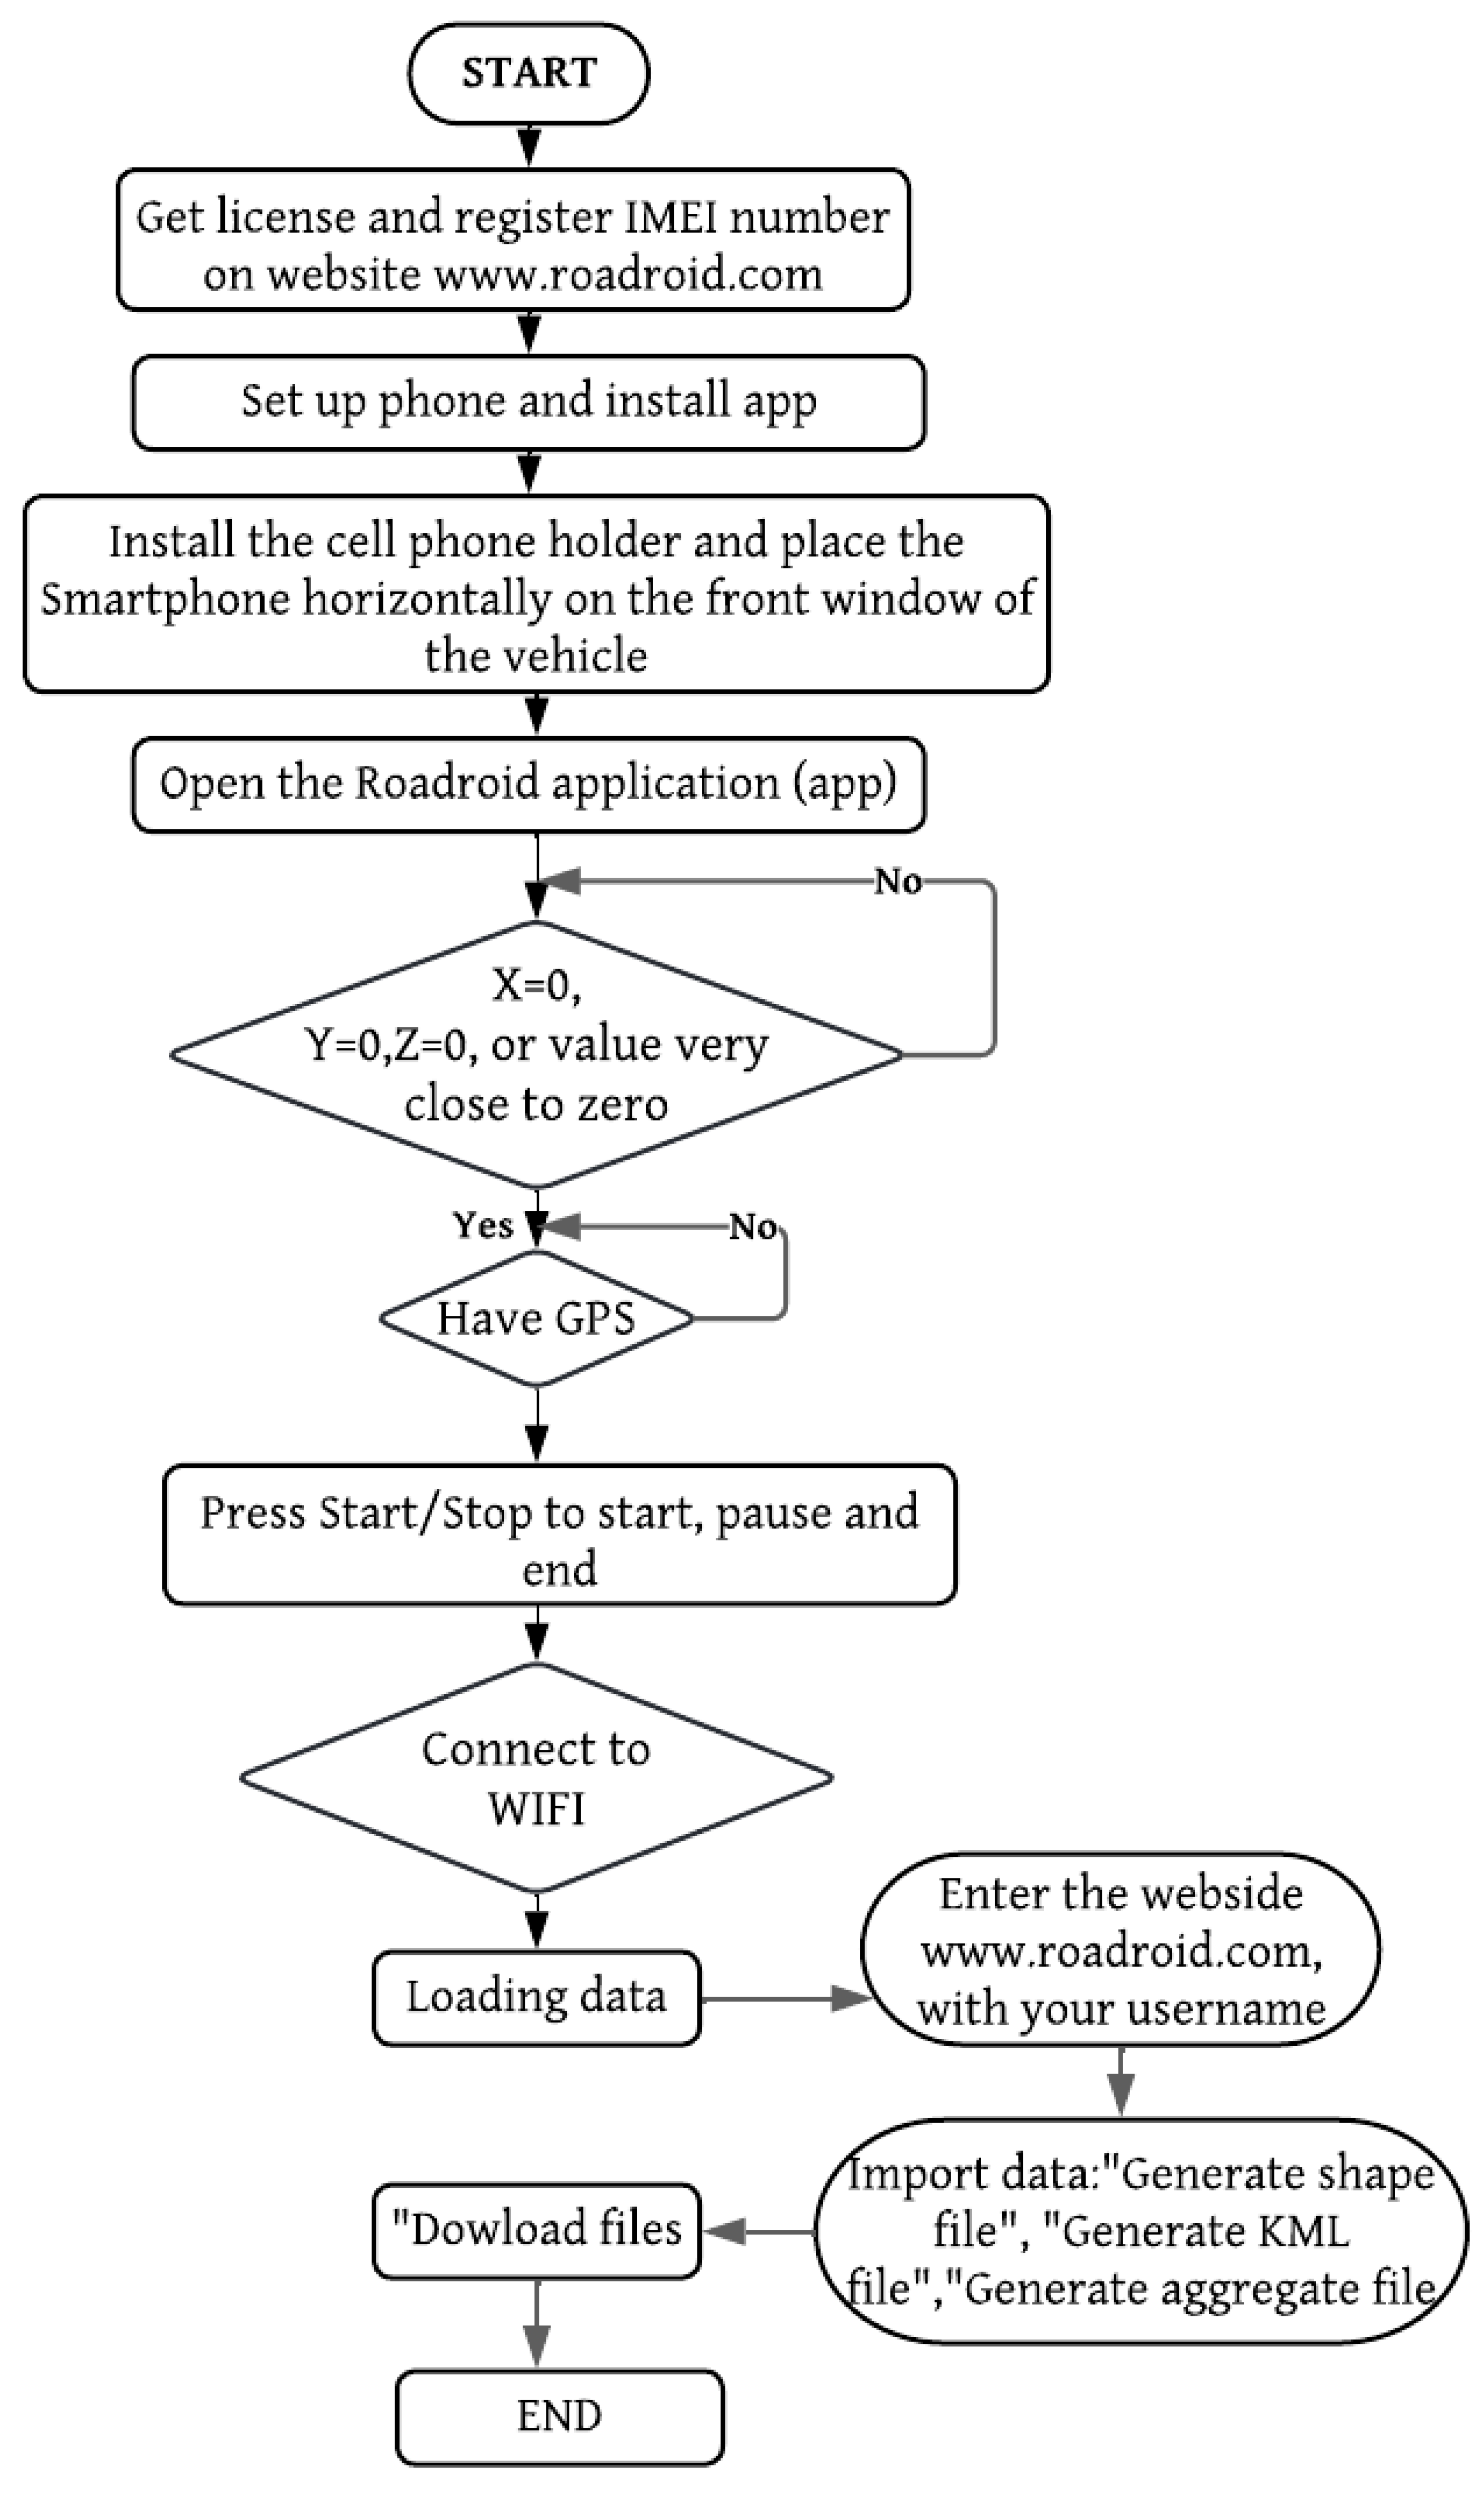
Figure 3.
Procedure for measuring PCI (Pavement Condition Index) by visual inspection.
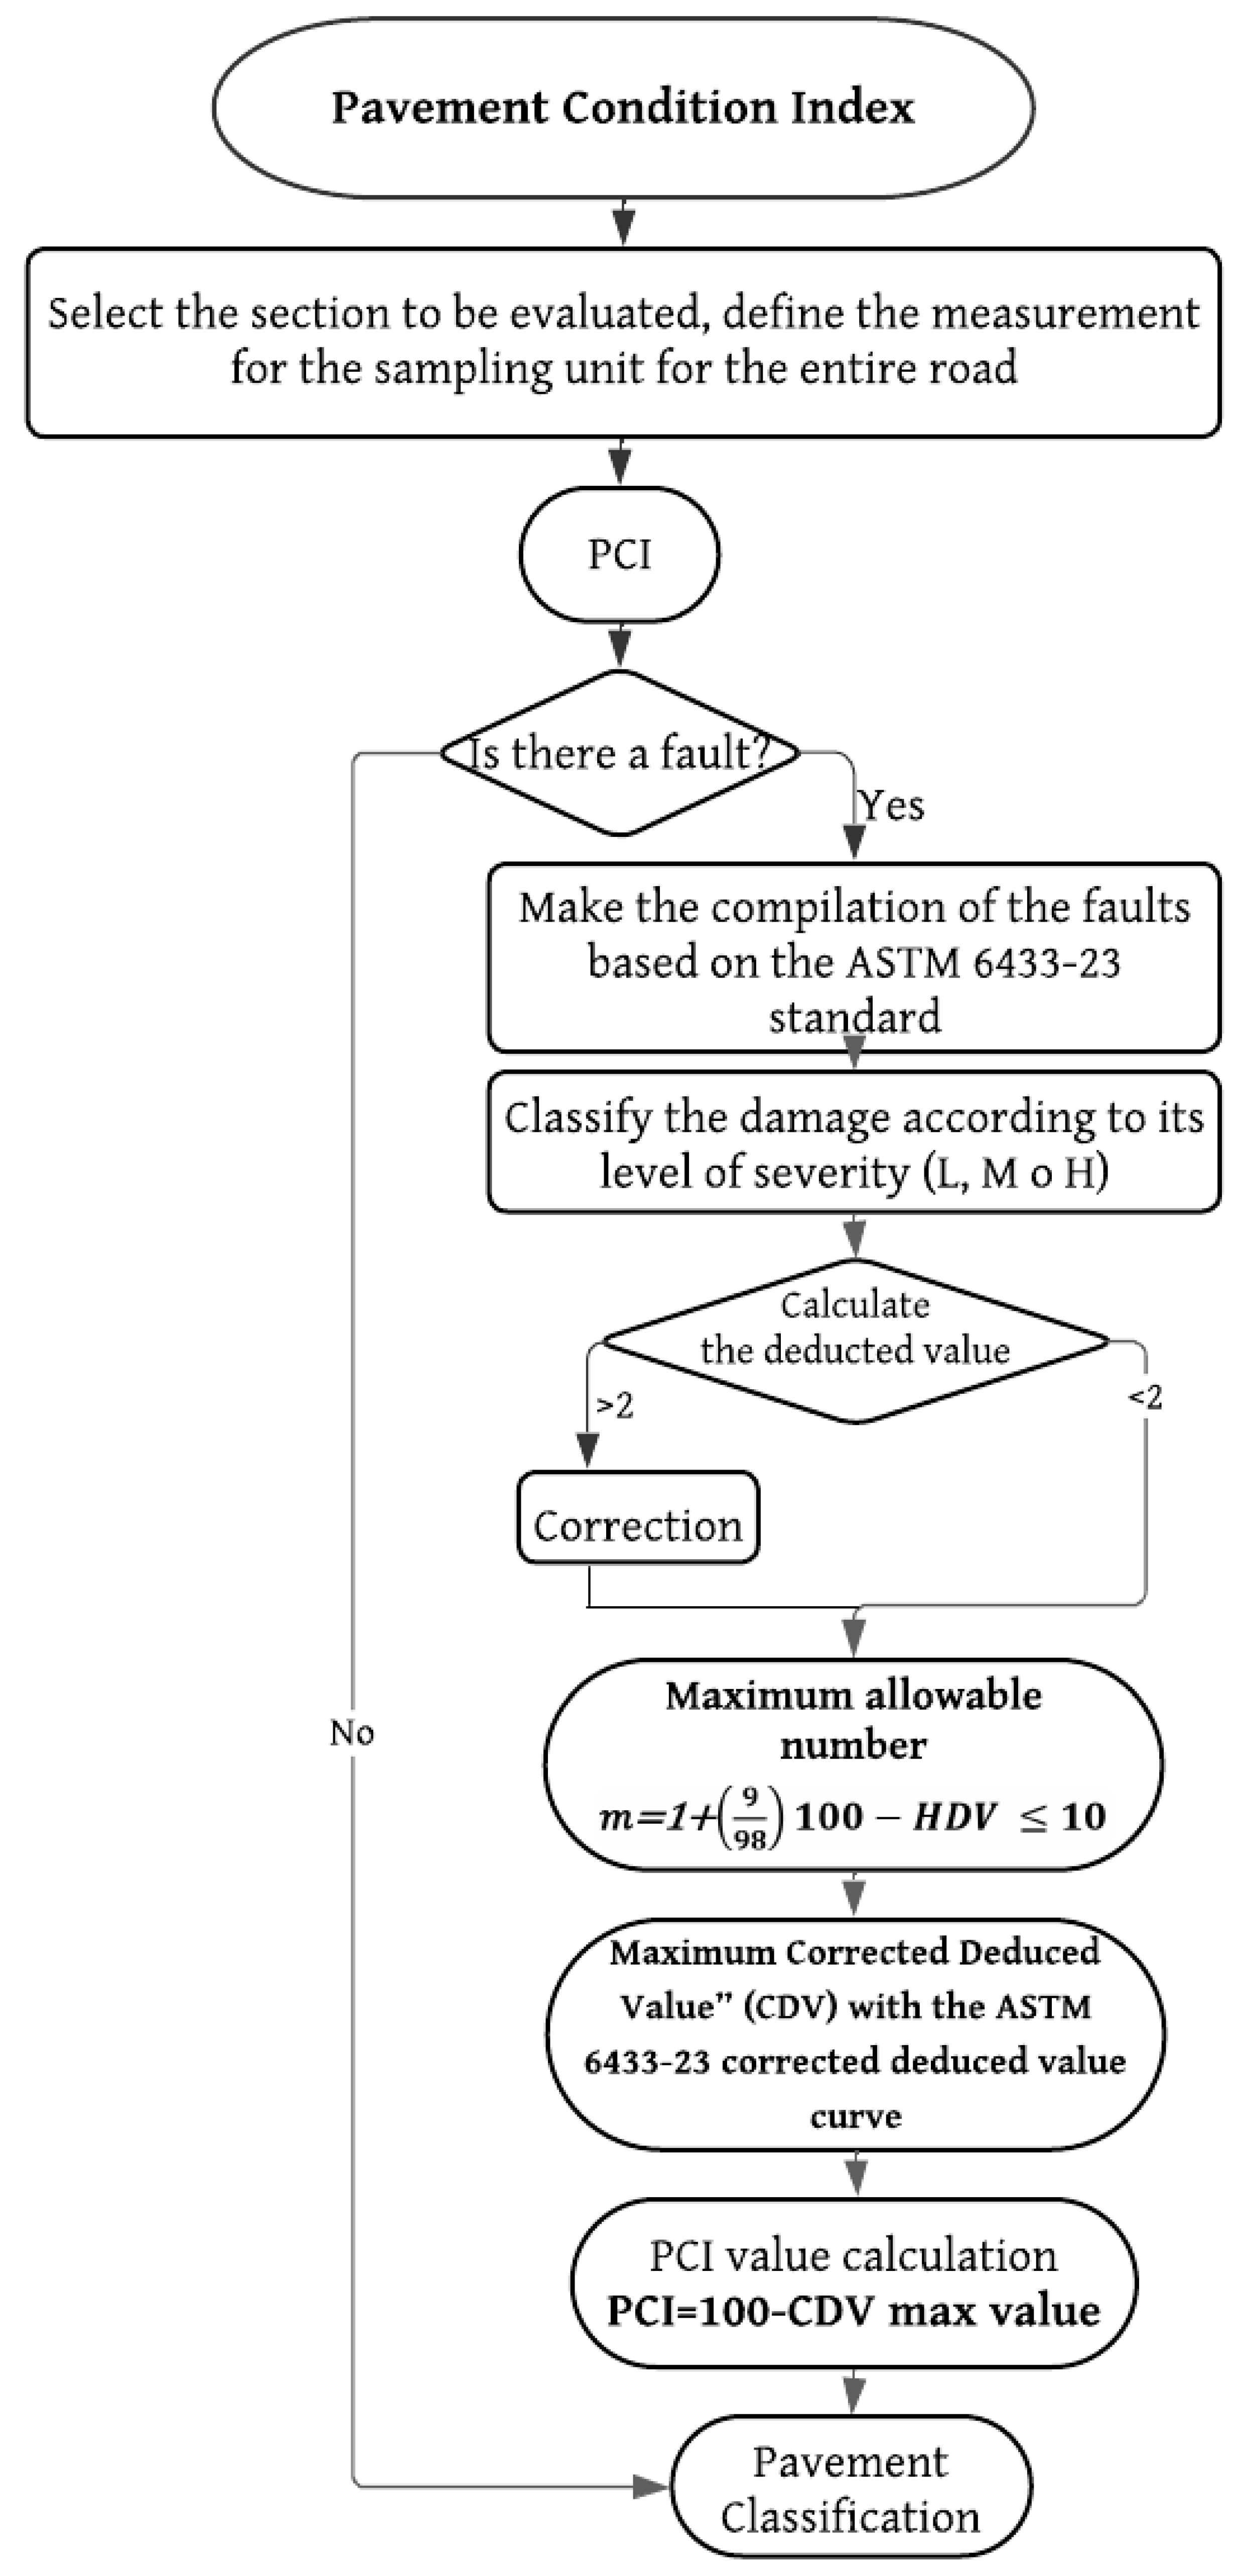
Figure 4.
PCI (Pavement Condition Index) evaluation by flying the DJI Mavic 2 pro Drone.
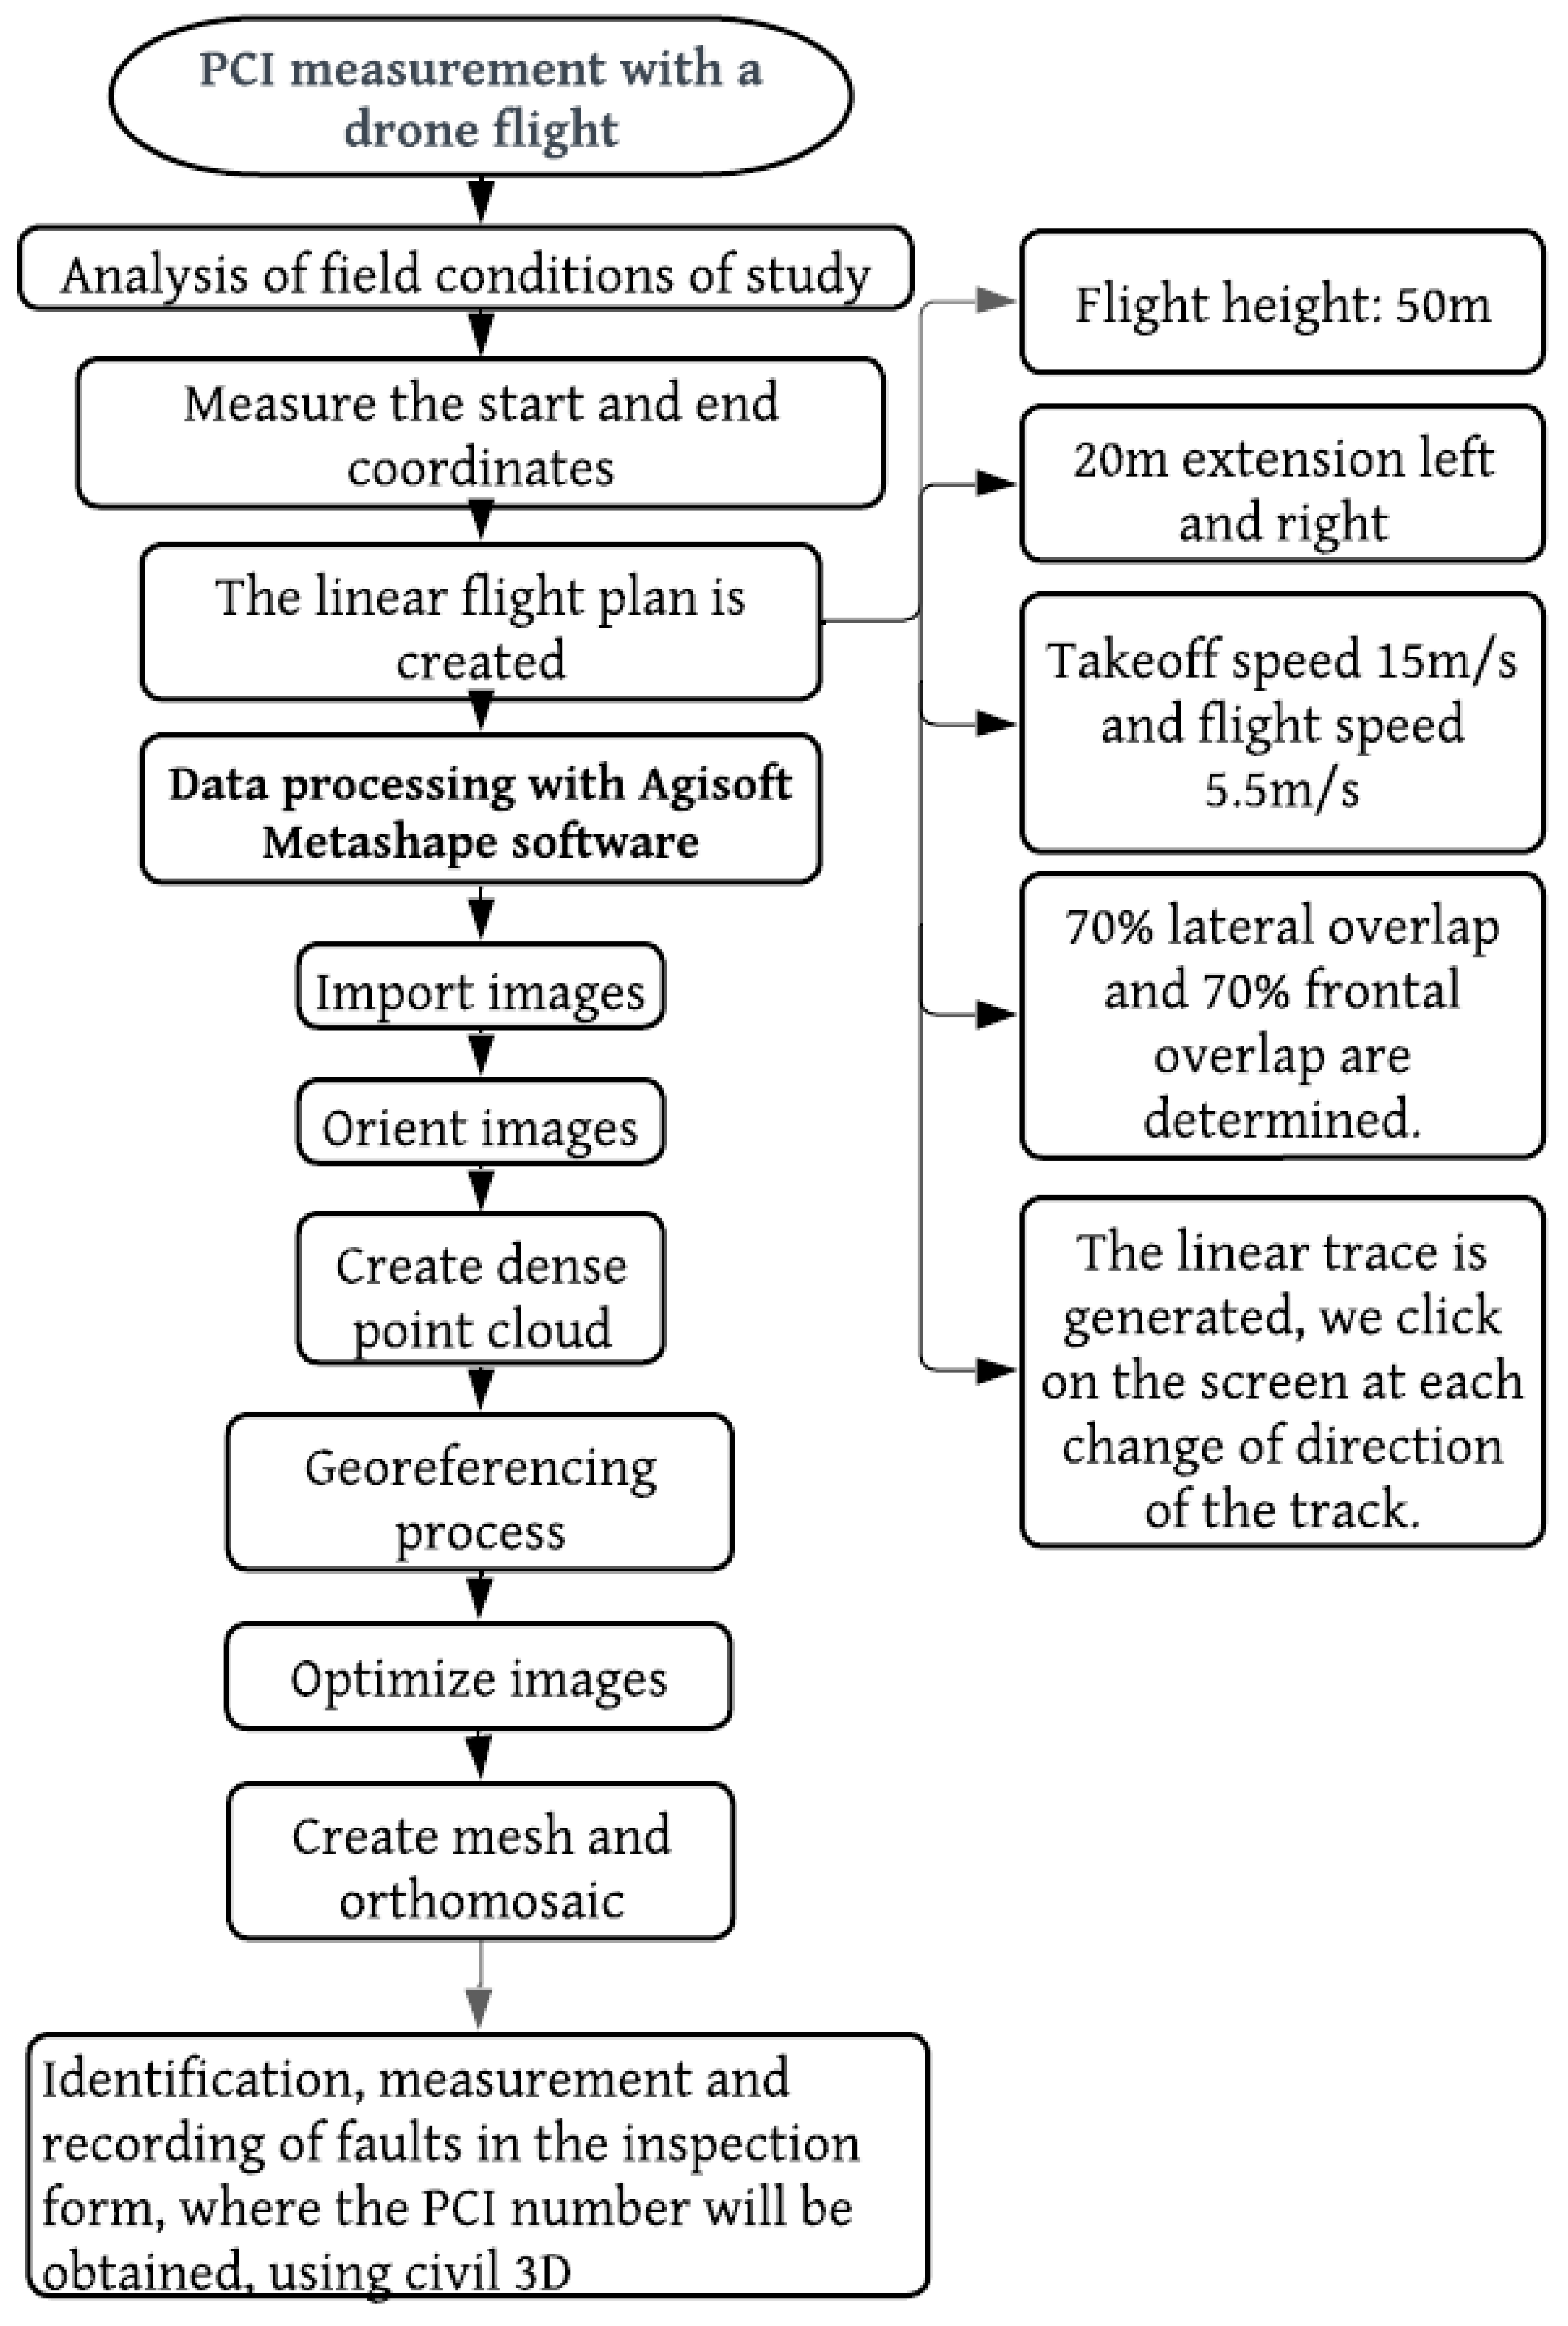
Figure 5.
IRI right lane Merlin roughness tester.
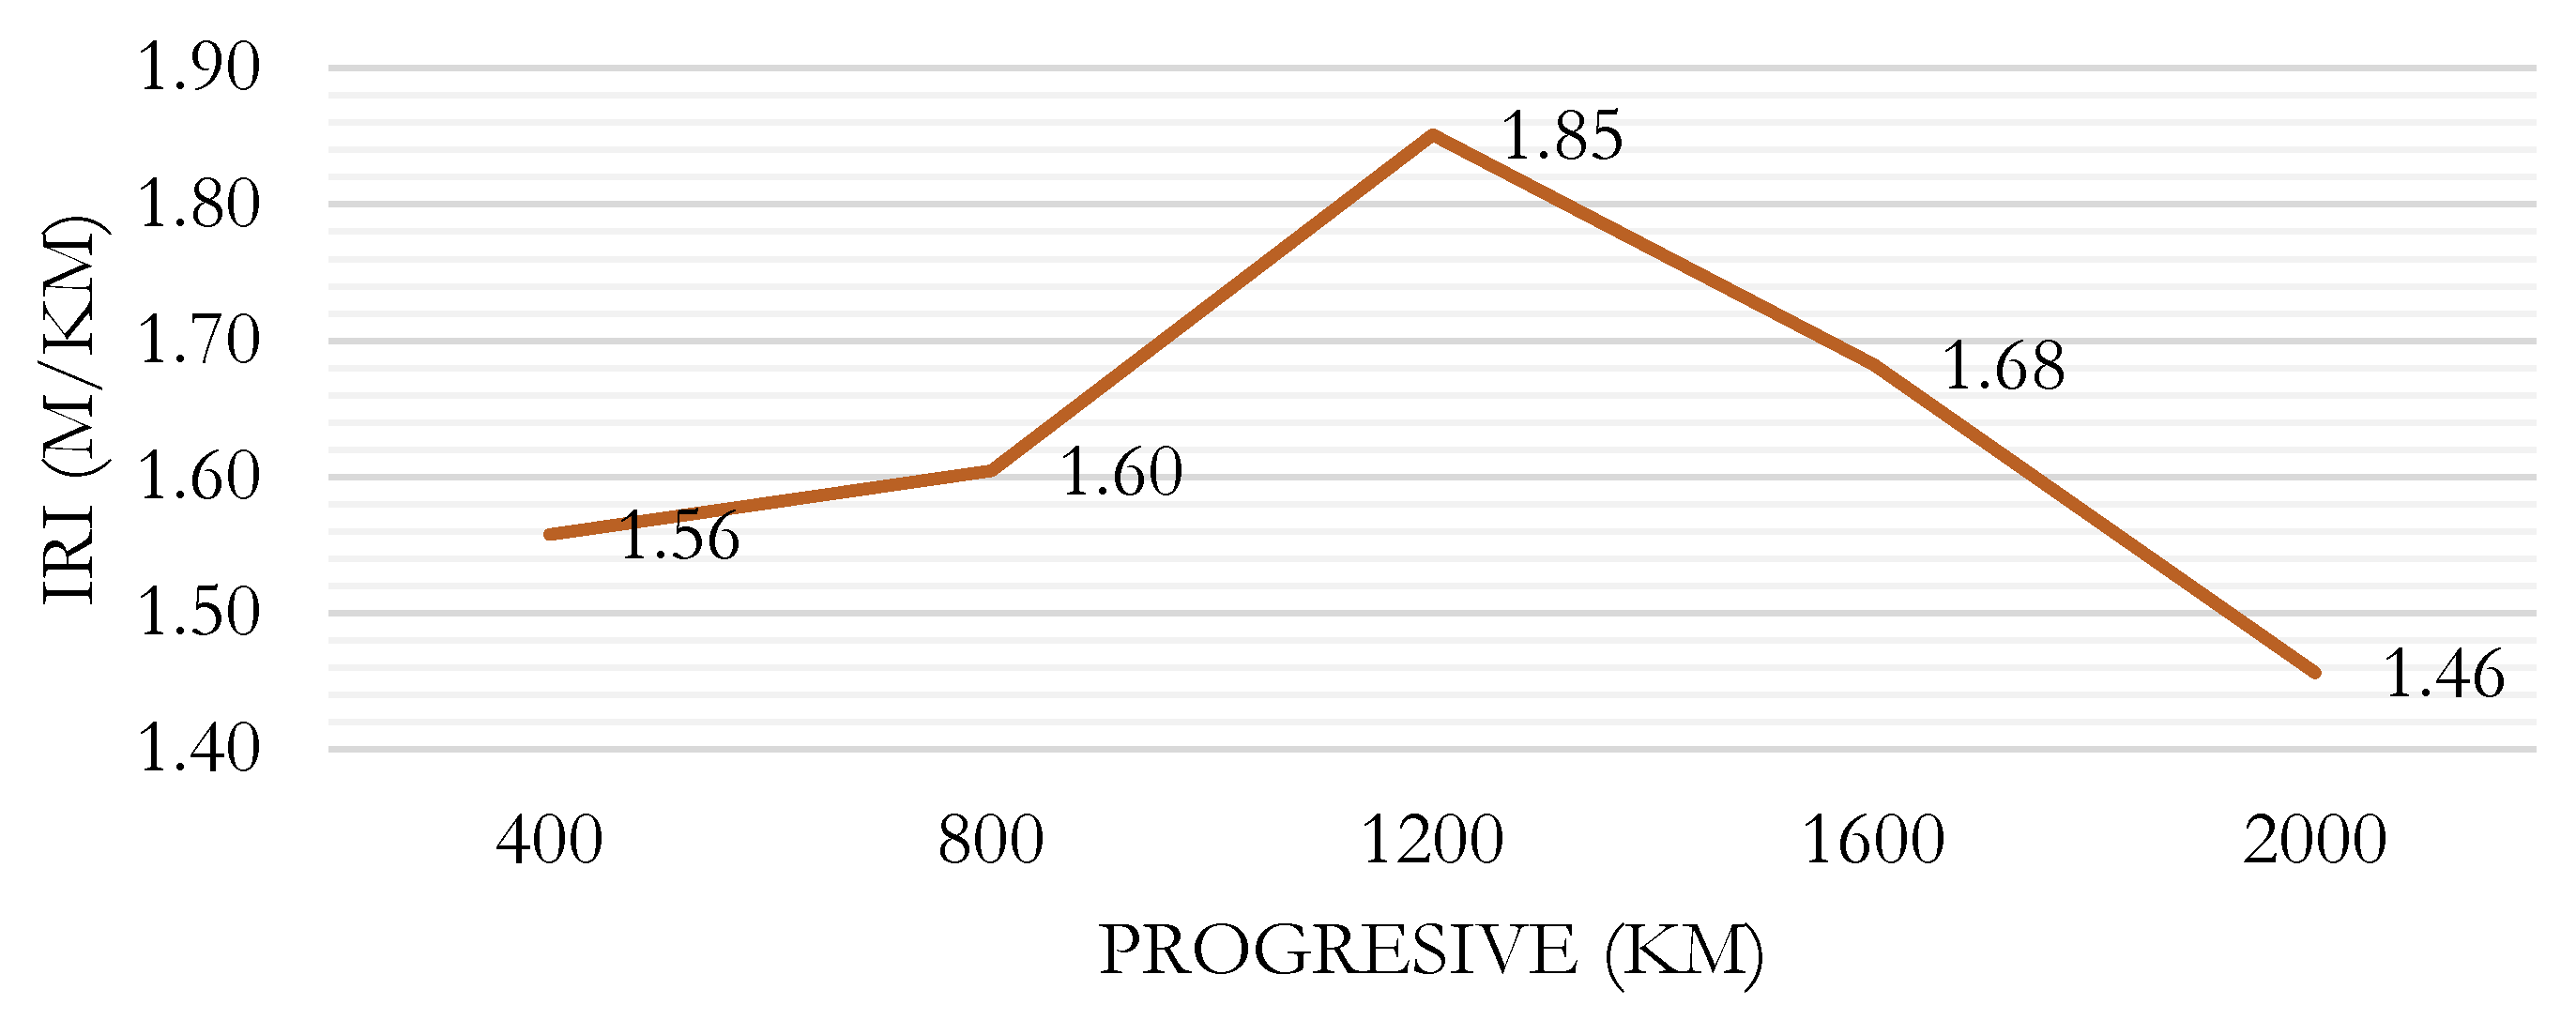
Figure 6.
IRI left lane Merlin roughness tester.
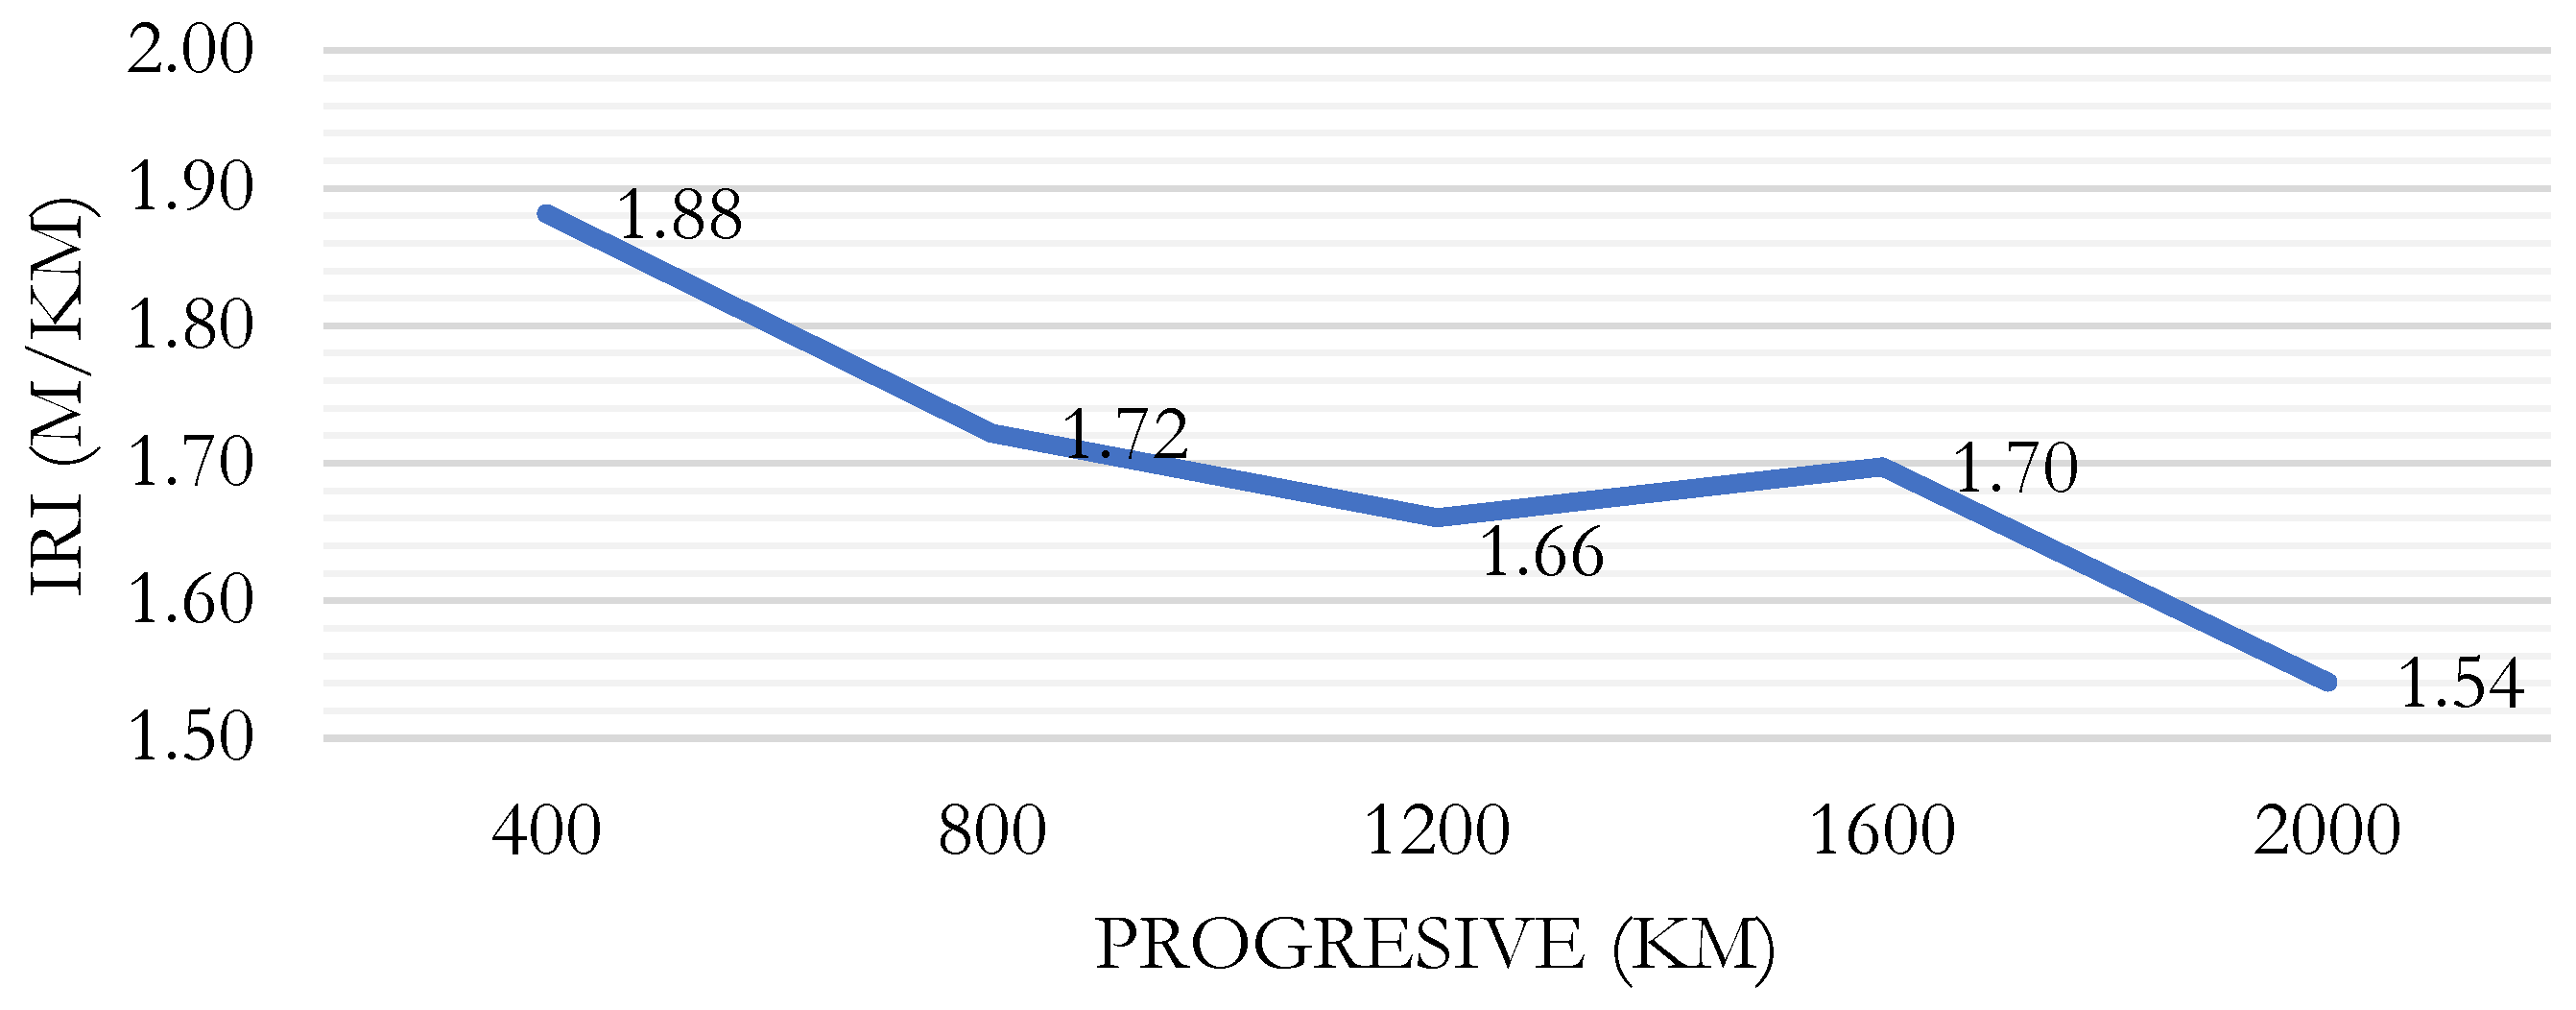
Figure 7.
IRI right lane using ROADROID.
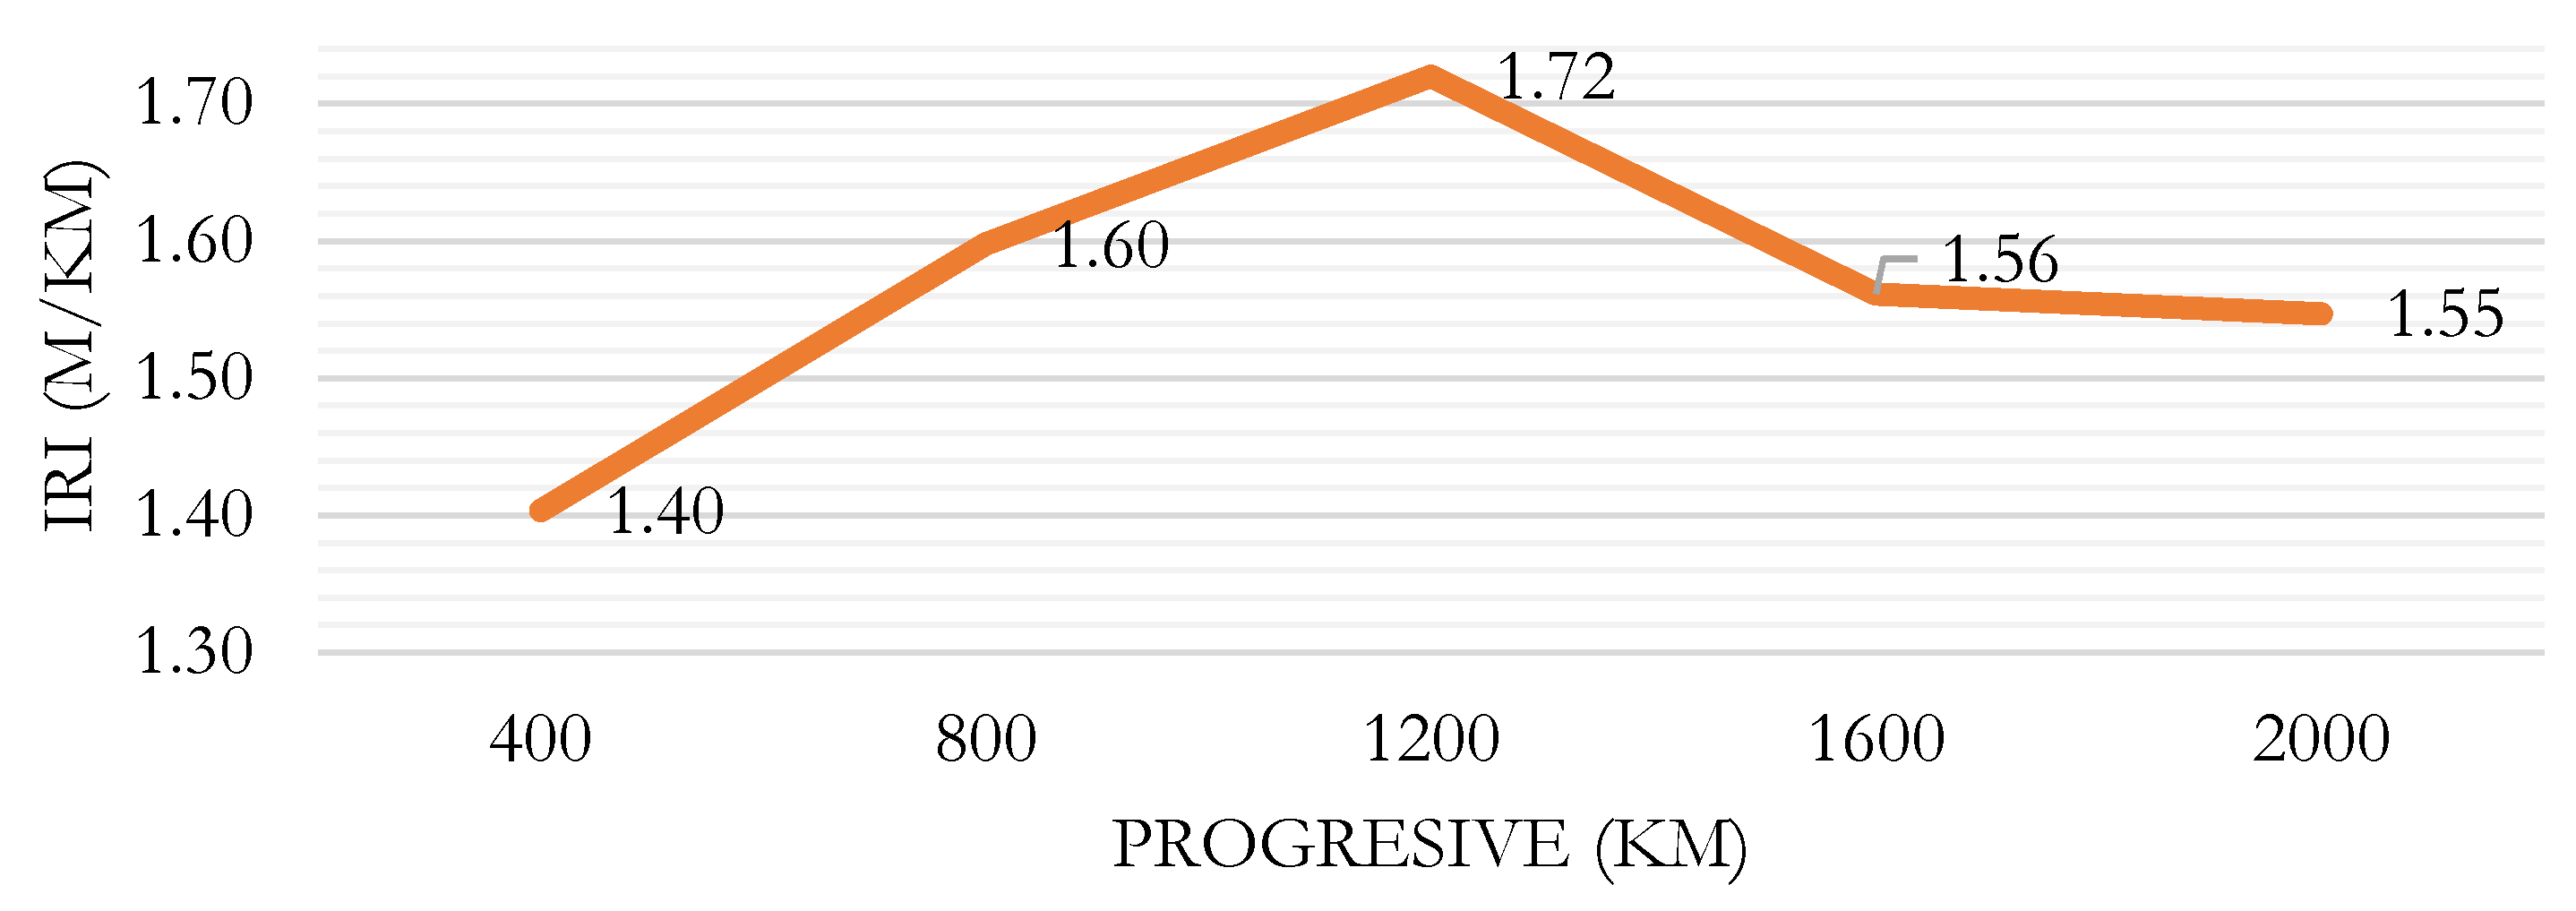
Figure 8.
IRI left lane using ROADROID.
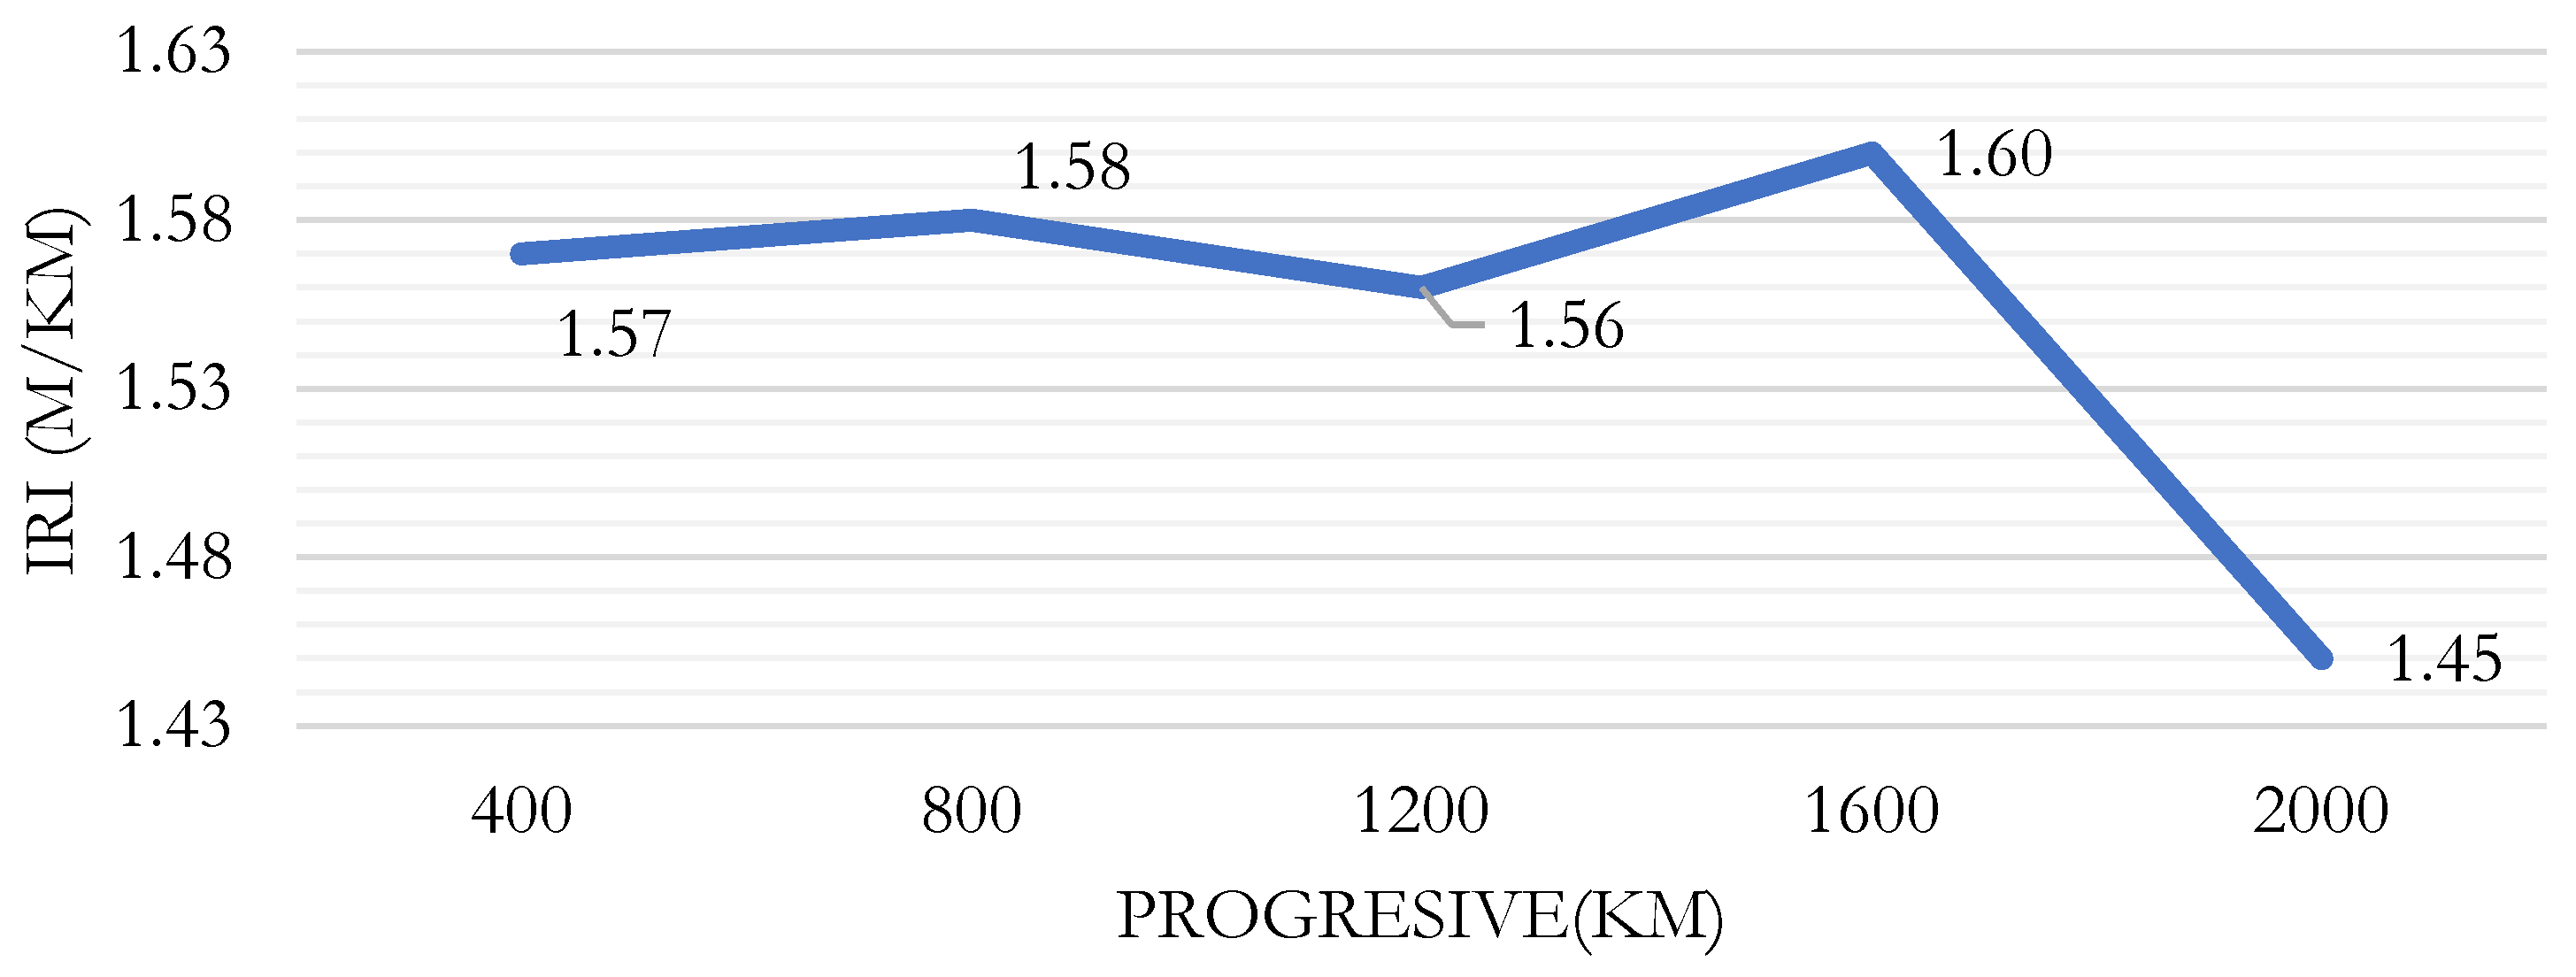
Figure 9.
IRI vs IRI dispersion table – Right Lane.
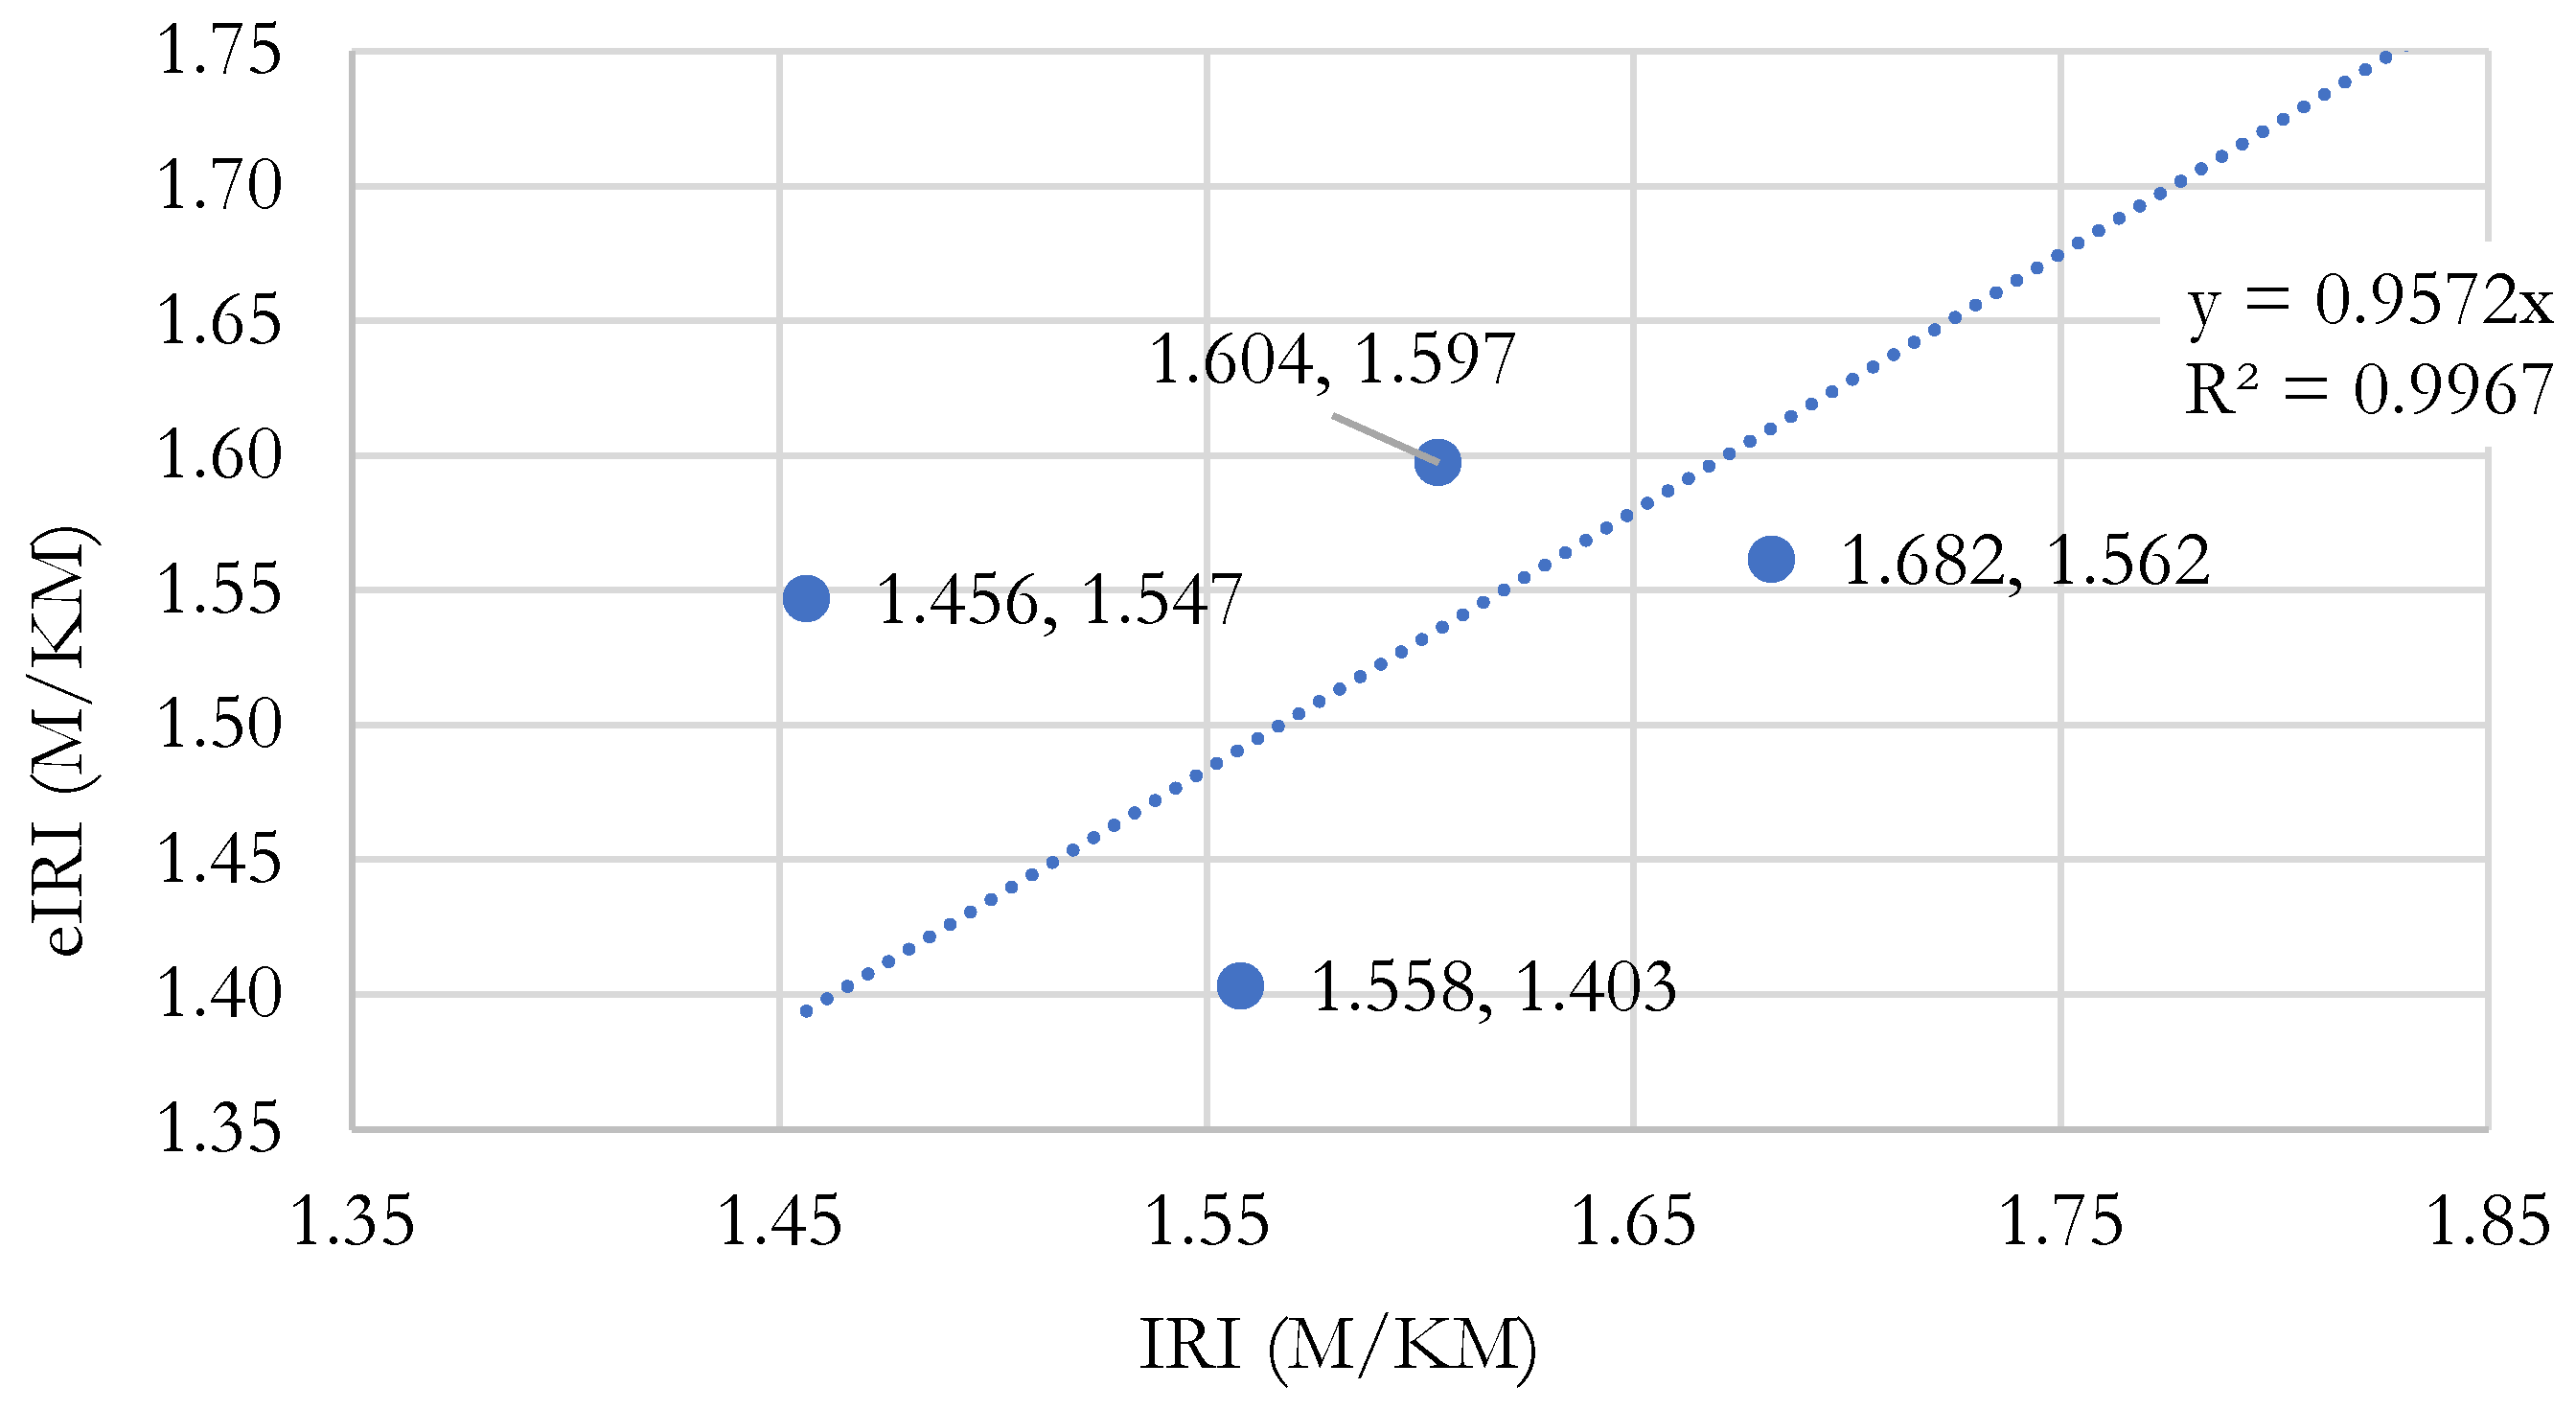
Figure 10.
IRI vs IRI dispersion table – Left Lane.
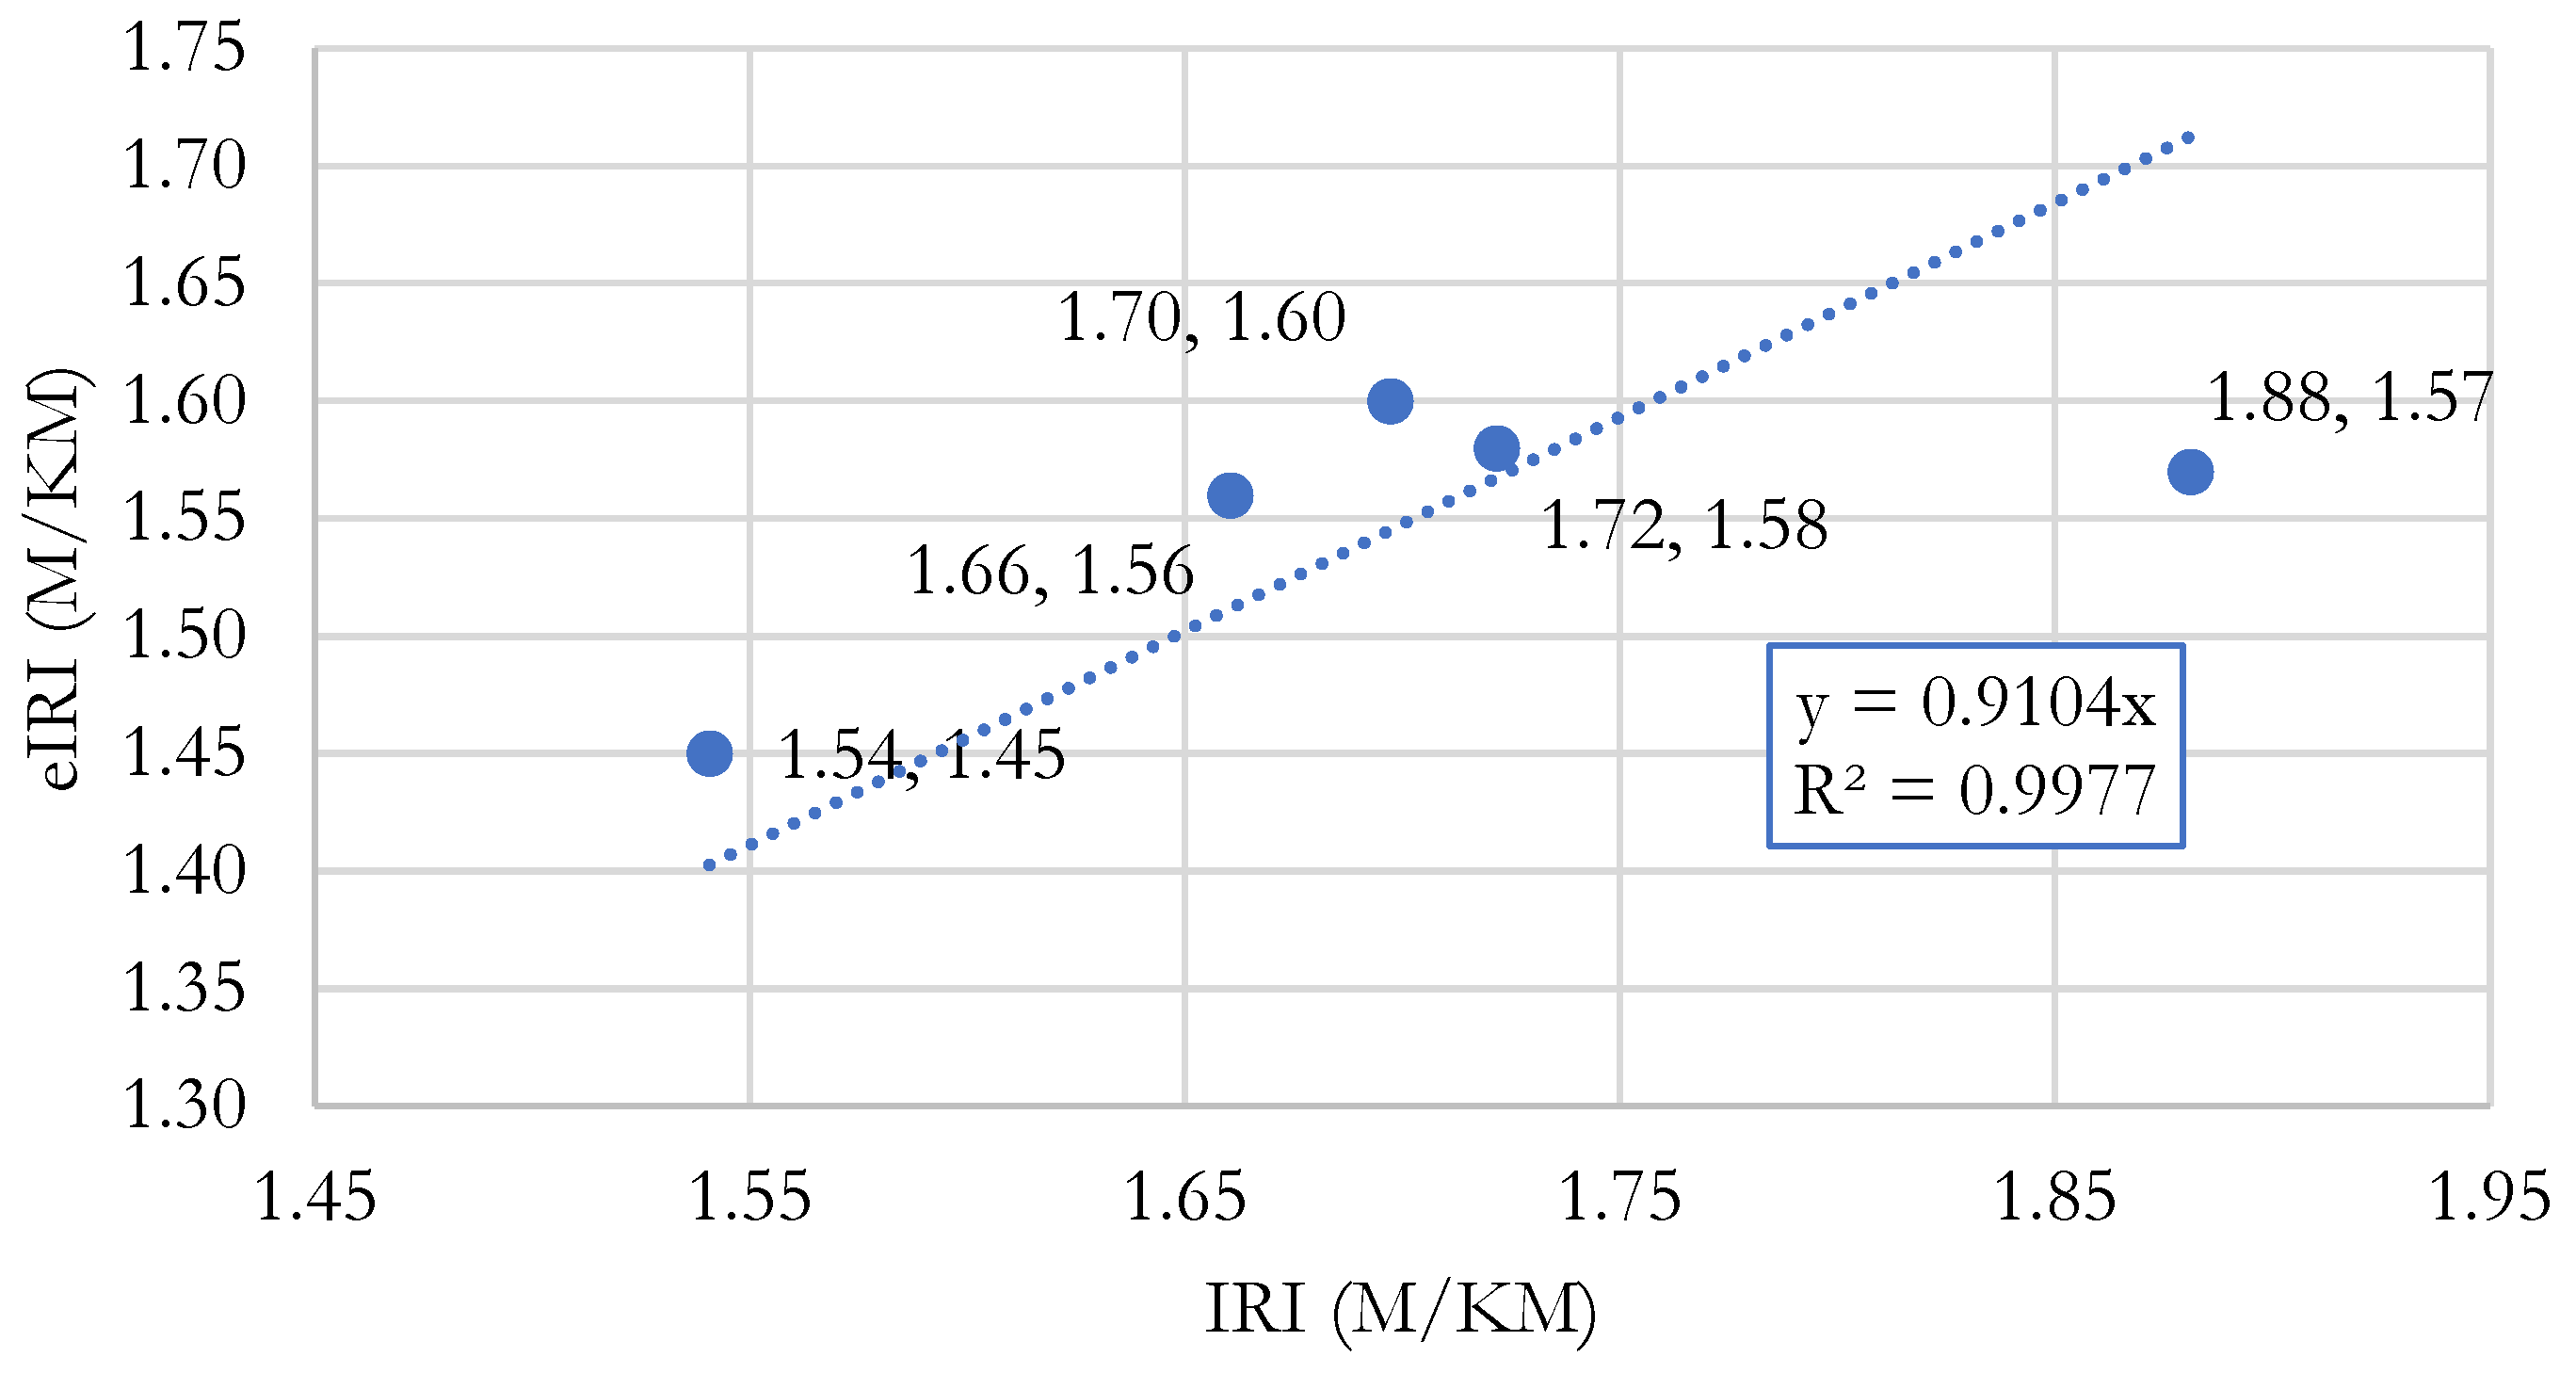
Figure 11.
Cost Benefit in time between the Merlin test and Roadroid.
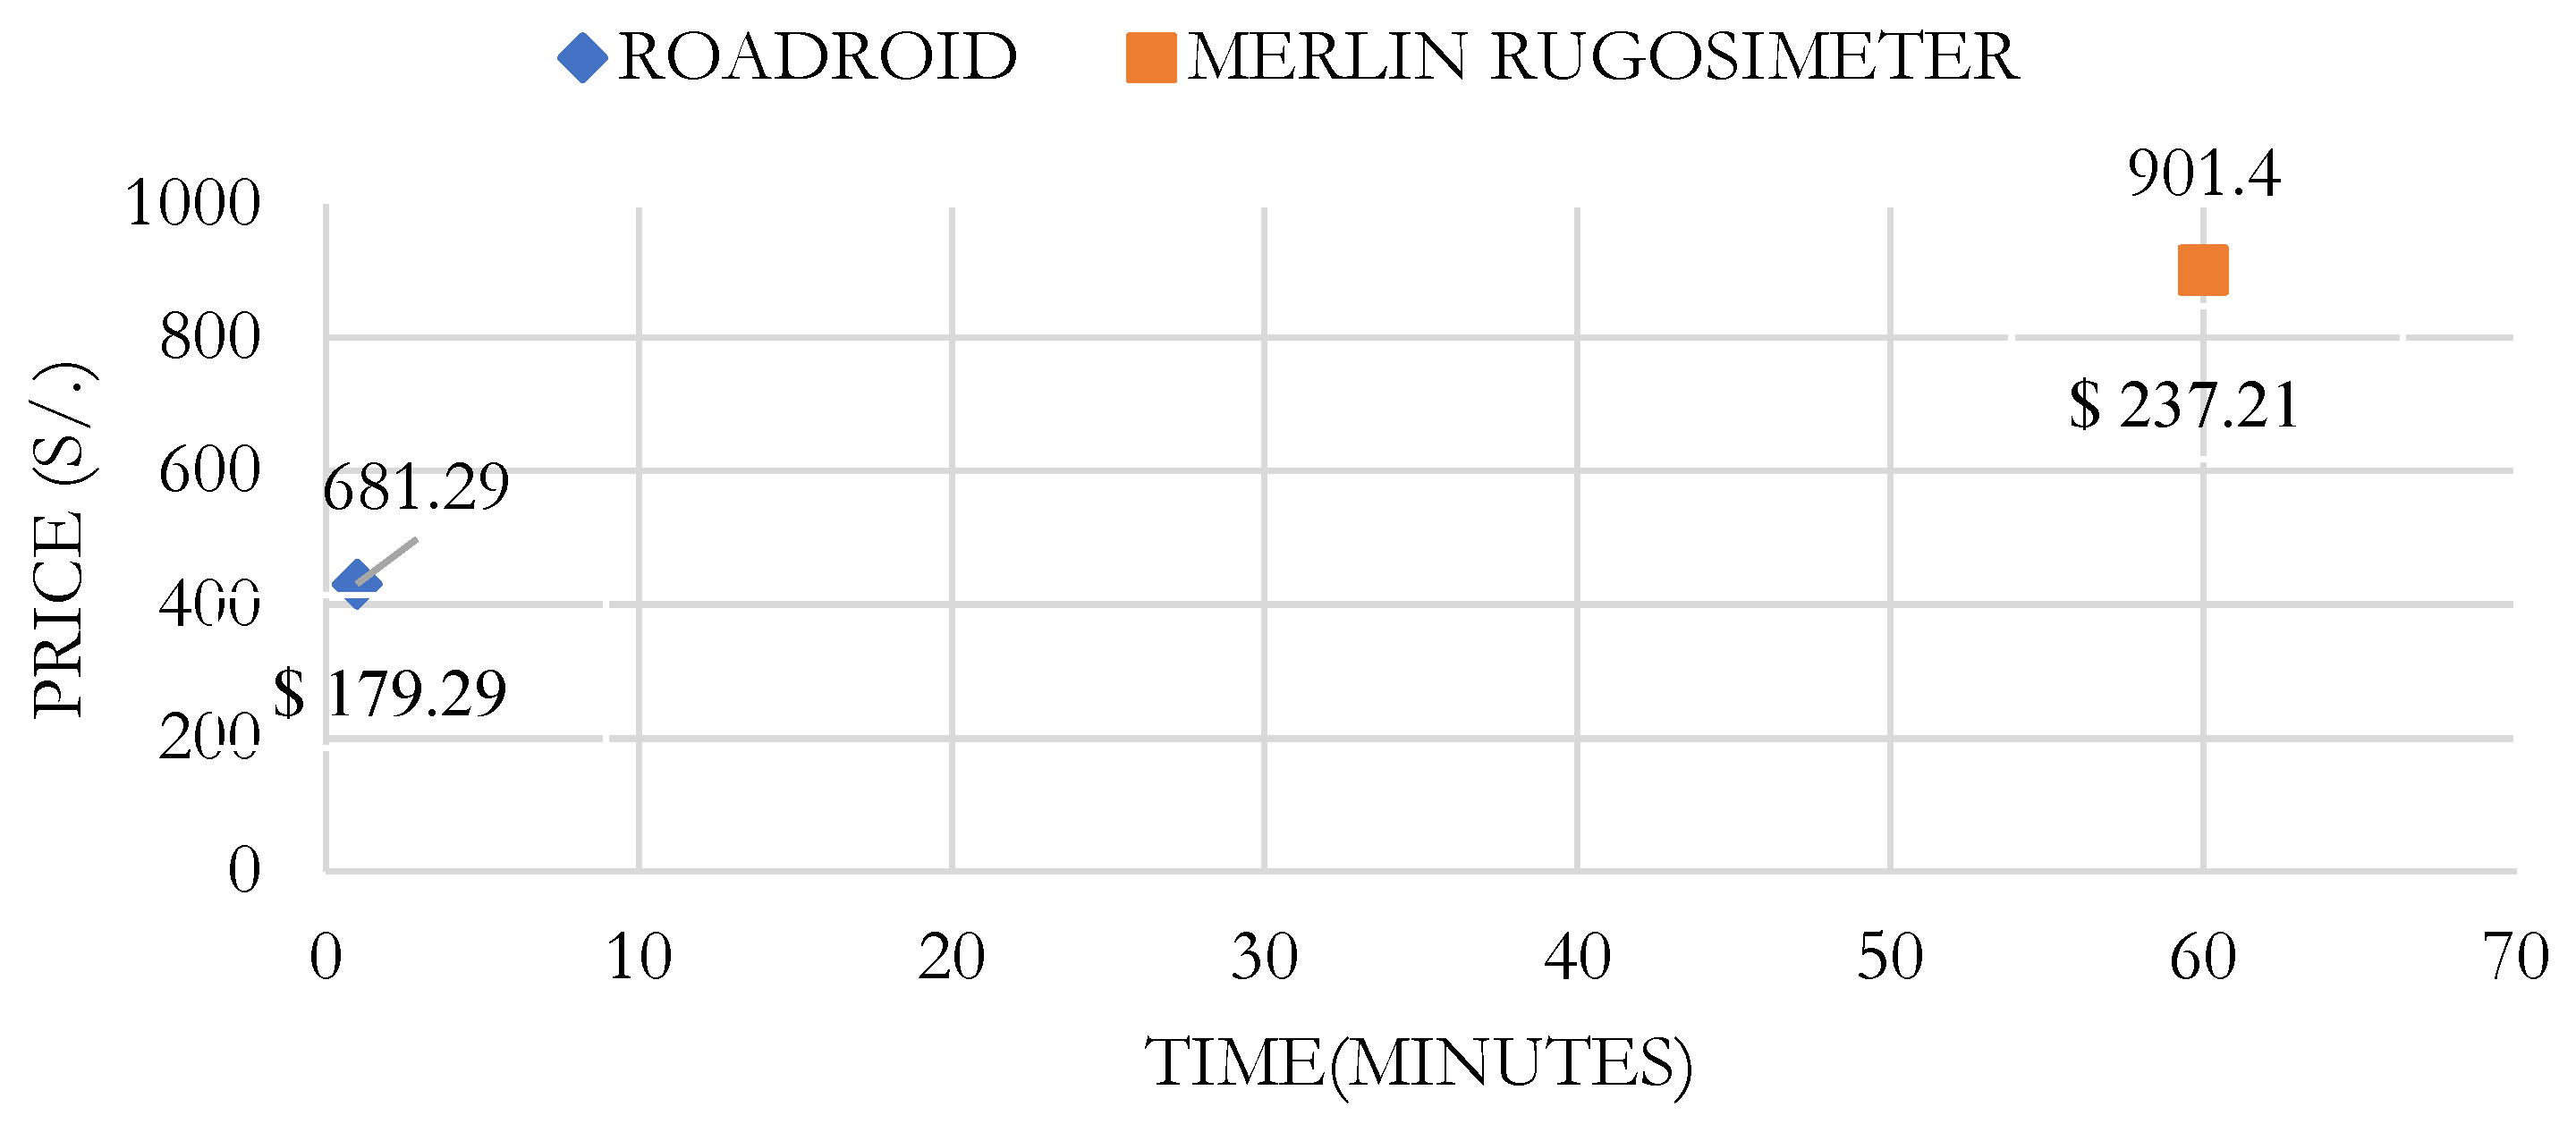
Figure 12.
PCI values calculated for both methodologies.
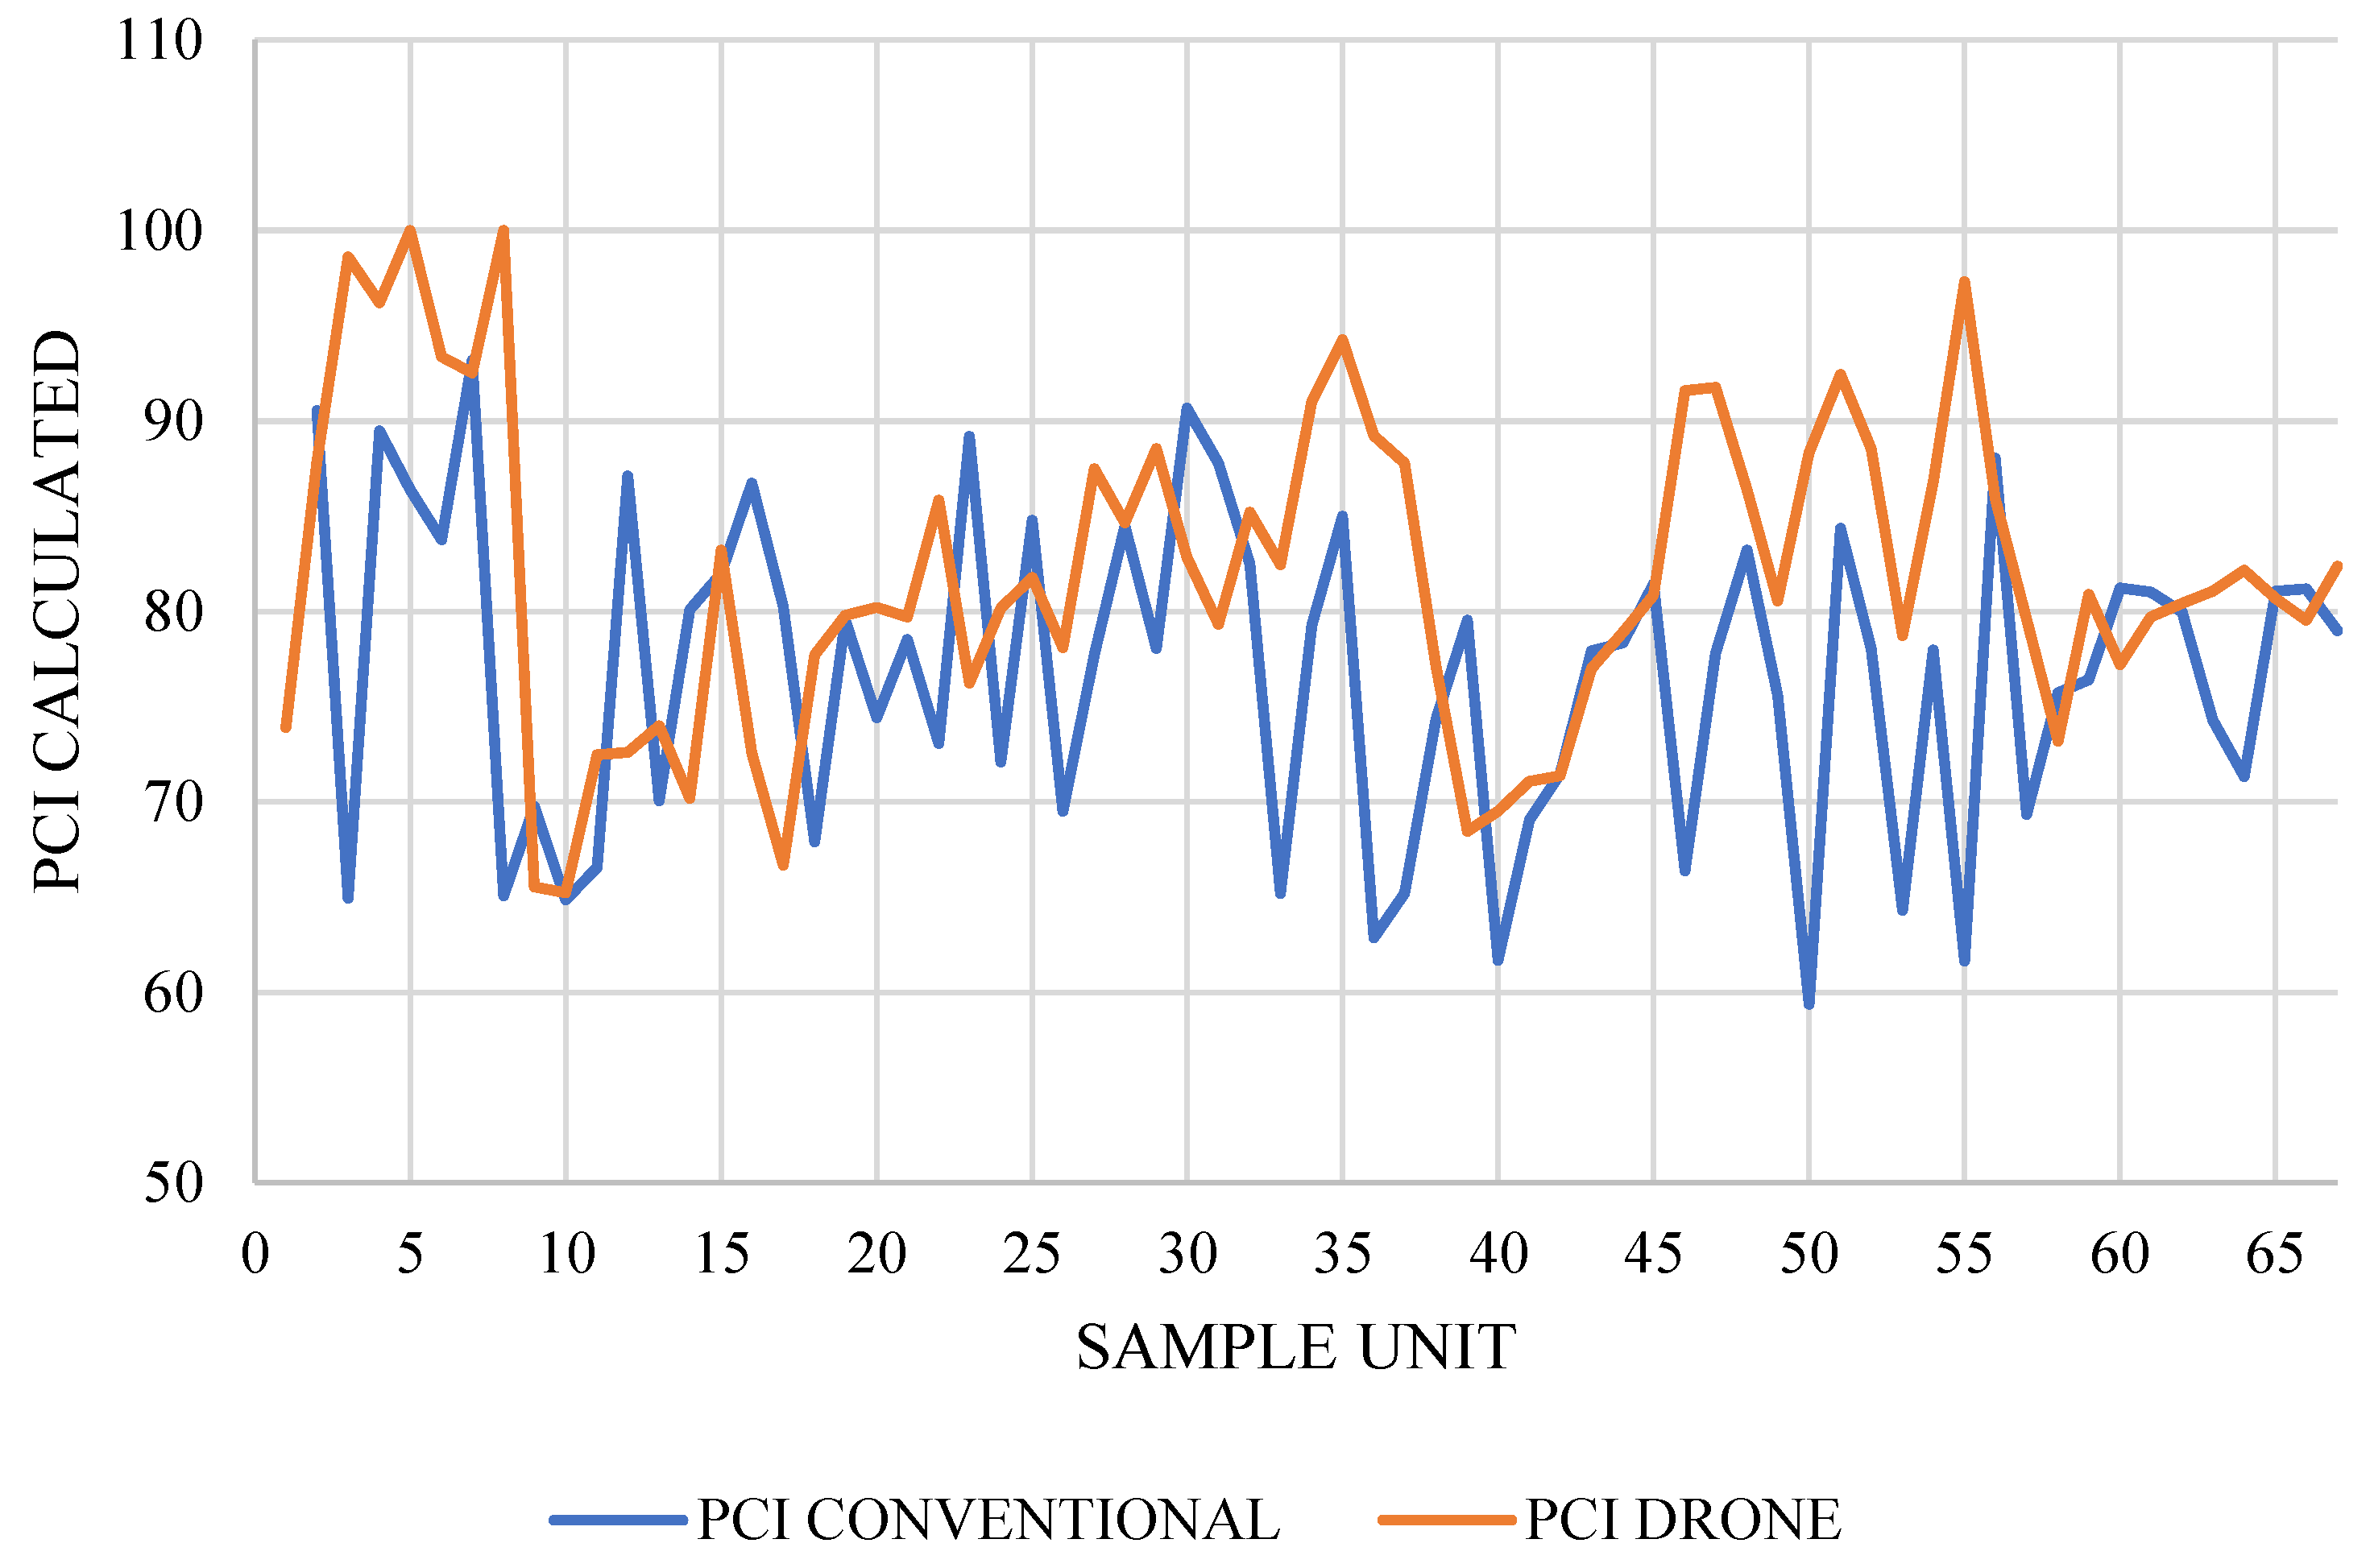
Figure 13.
PCI values calculated for both methodologies.
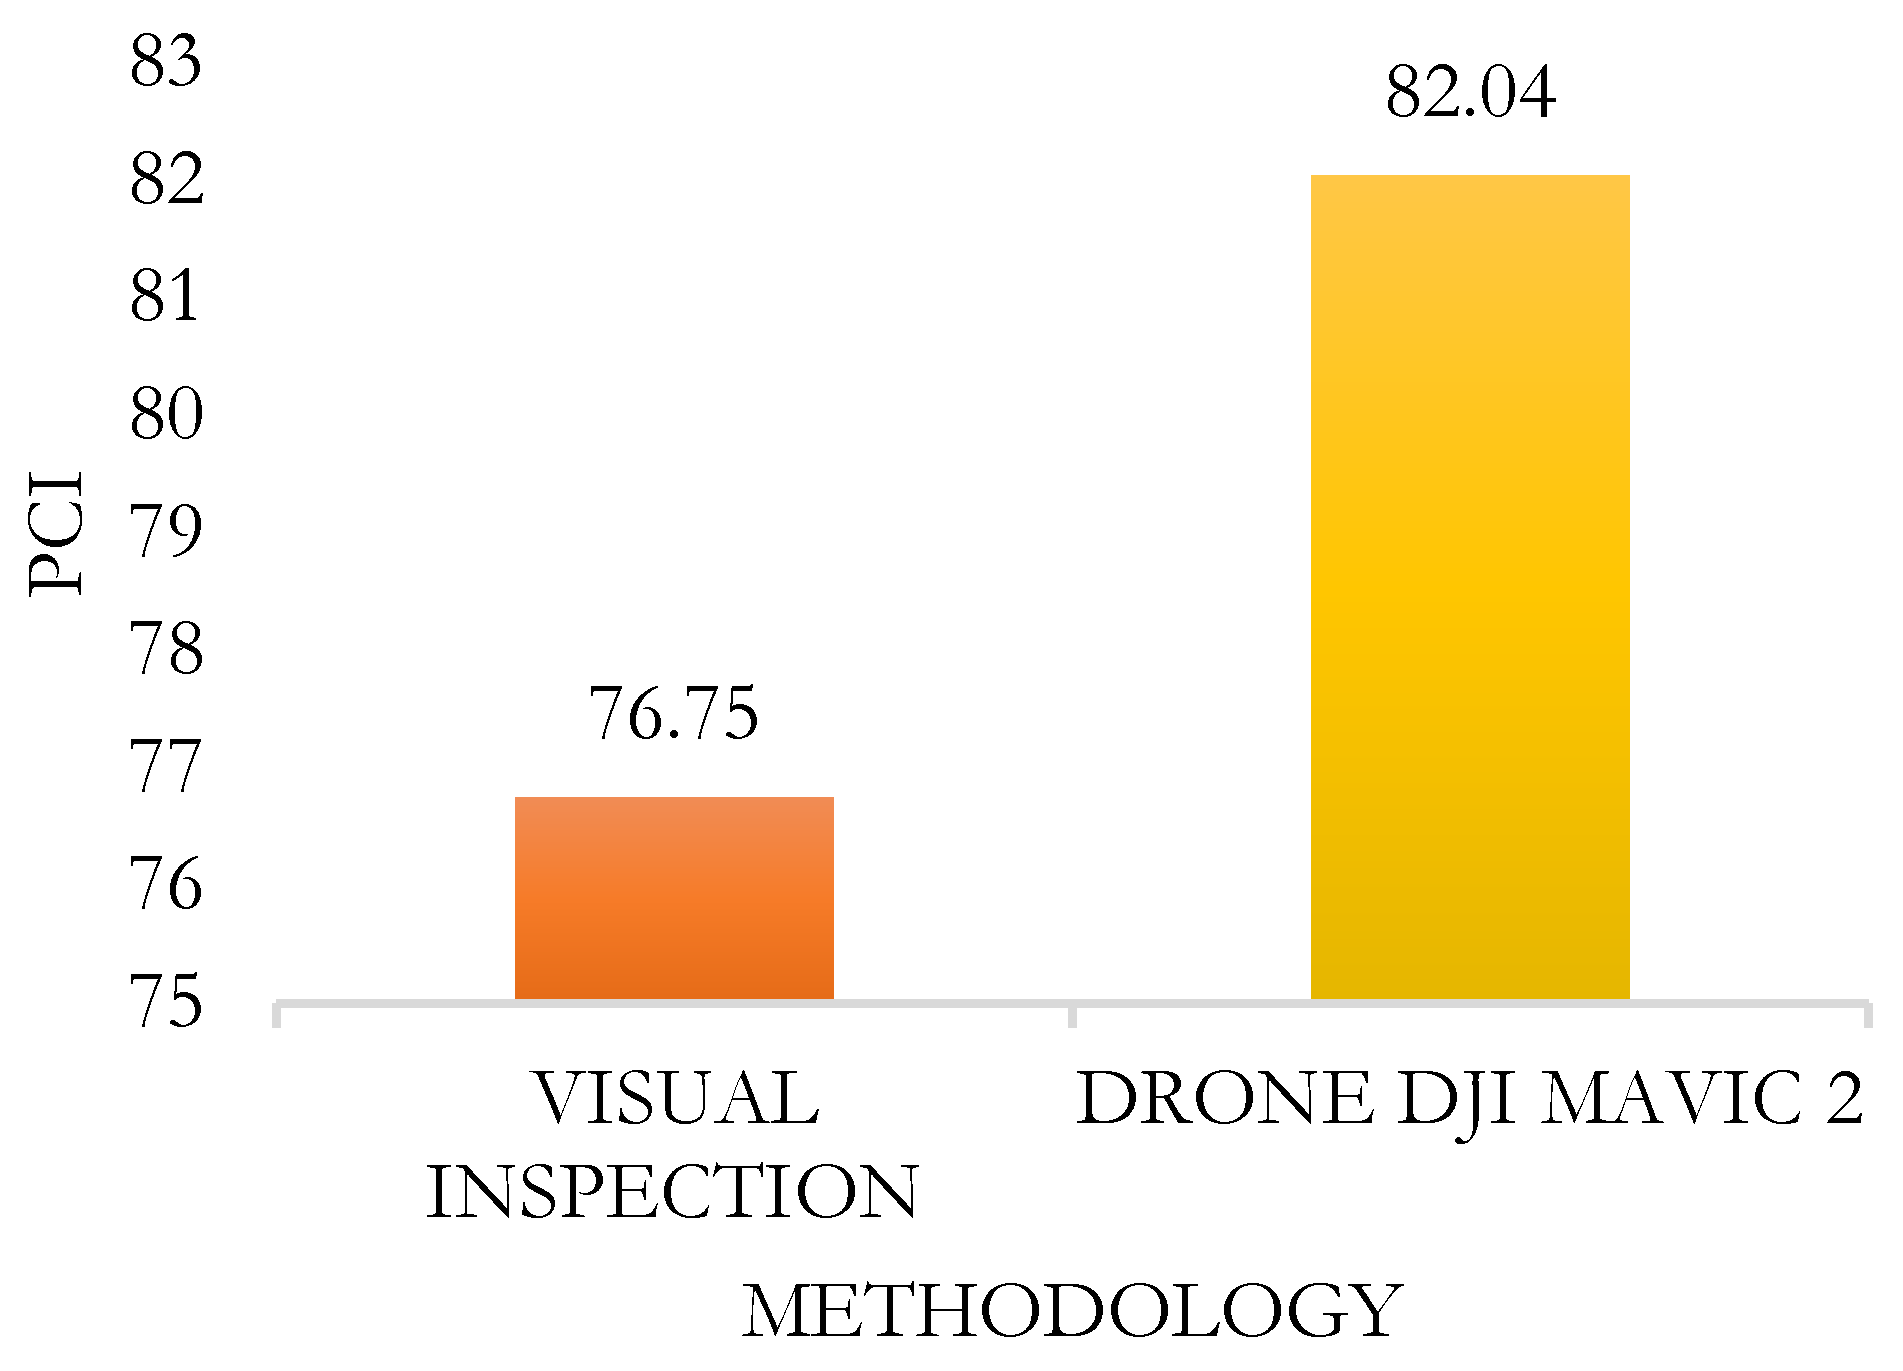
Figure 15.
Cost-benefit analysis between the traditional system and the method using drones.
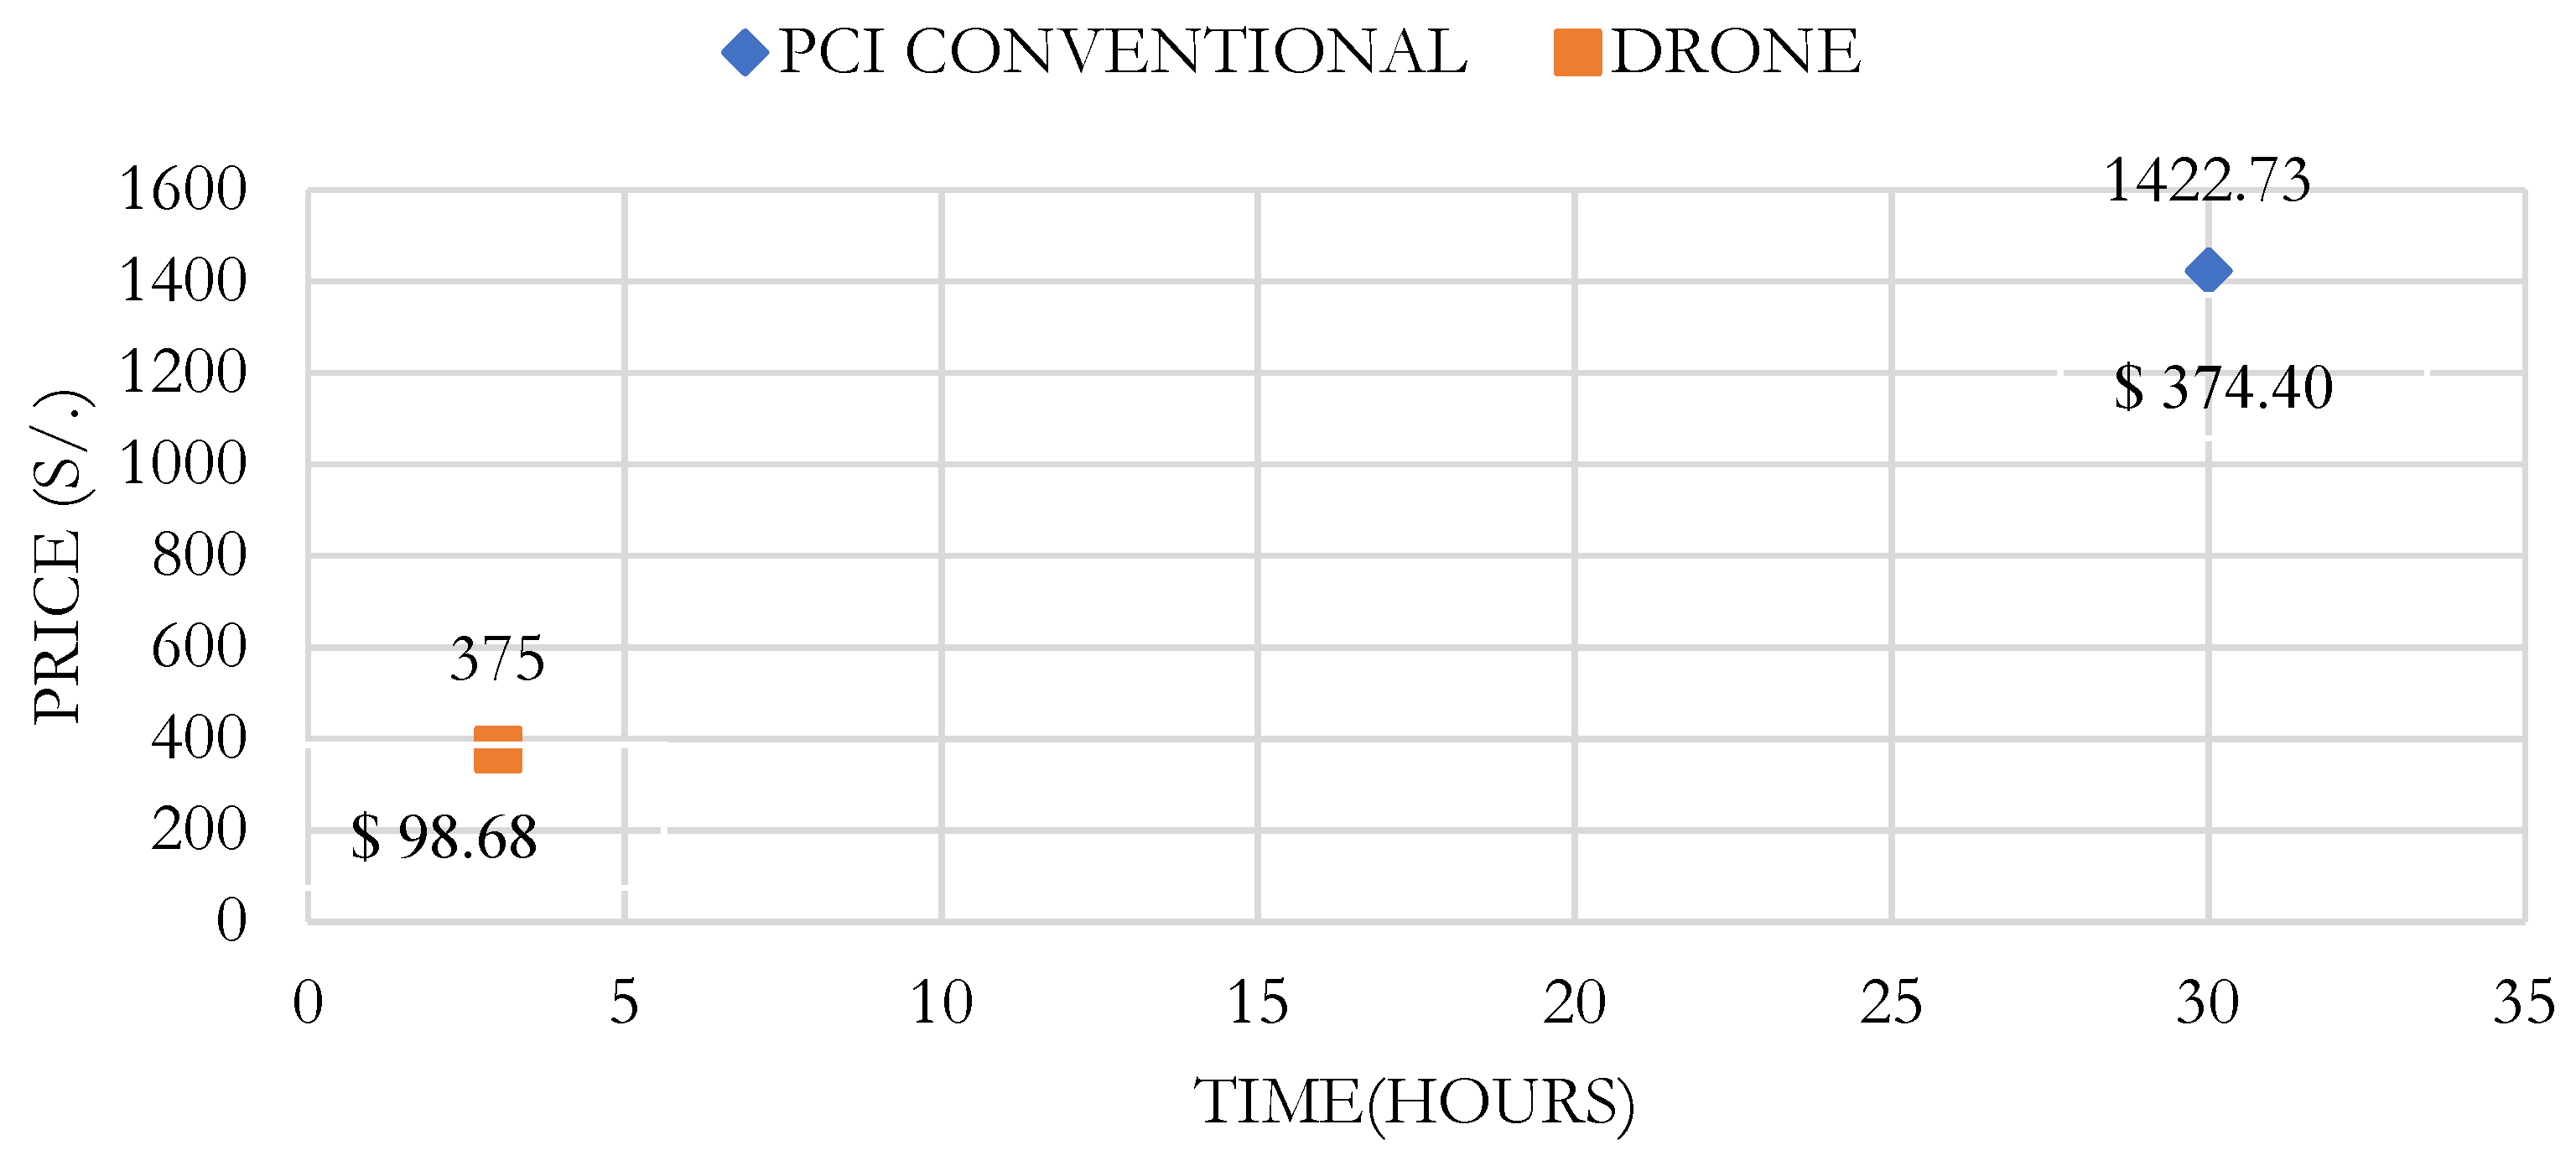
Table 1.
Research background.
| ID | AUTHOR | YEAR | RESEARCH METHODS | RELEVANCE | CASE STUDY |
|---|---|---|---|---|---|
| A1 | [12] | 2018 | Roadroid | IRI value obtained, and SDI value determined. | Jenderal Sudirman Kalianget Road - Indonesia |
| A2 | [17] | 2018 | Roadroid and Visual Inspection for PCI | Correlation of pavement PCI with IRI. | Magetan District Road – Indonesia. |
| A3 | [18] | 2019 | Roadroid and Visual Inspection for PCI | Determine PCI and serviceability level. | Lucre-Huacarpay Avenue – Peru. |
| A4 | [19] | 2021 | Abakal and Roadroid | Calculate IRI and PSI. | Antunez de Mayolo Avenue – Peru. |
| A5 | [14] | 2021 | Roadroid and ROOGA equipment | Compare IRI using the application and ROOGA equipment with leveling. | Covadonga Road, Ayacucho. |
| A6 | [15] | 2021 | DJI Phantom 4 Pro V2.0 Drone | Determine PCI. | Los Conquistadores Avenue, Lima. |
| A7 | [11] | 2021 | Laser profilometer and Roadroid | Compare IRI and PSI. | Concession No. 3: Mocupe, Lambayeque. |
| A8 | [20] | 2022 | Roadroid and Merlin Roughness Meter Method | Compare IRI and PSI with their respective correlation coefficients. | Prolongation Iquitos Avenue, Javier Prado Avenue, and Petit Thouars Avenue, Lima. |
| A9 | [1] | 2019 | Drone and Visual Inspection | Compare PCI between both methodologies. | Separadora Industrial Avenue, blocks 8-10, Ate, Lima – Peru. |
| A10 | [9] | 2017 | Visual Inspection | Calculate PCI and provide maintenance proposals. | Ramón Castilla Avenue, Chulucanas, Piura. |
| A10 | [13] | 2021 | Systematic Literature Review | Evaluate the efficiency of PCI and IRI for assessing serviceability through various studies. | Literature review of different indexed articles. |
| A11 | [21] | 2023 | Systematic Literature Review | Evaluate current trends in the implementation of smart technologies for road construction and maintenance. | Literature review of different indexed articles. |
Table 2.
Comparative table between the IRI results with both teams – Right Lane.
| Progression | MERLIN | ROADROID | ||
|---|---|---|---|---|
| Start | End | IRI | IRI | Variation |
| (Km) | (Km) | (m/Km) | (m/Km) | (%) |
| 0+000 | 0+400 | 1.558 | 1.403 | 9.949 |
| 0+400 | 0+800 | 1.604 | 1.597 | 0.422 |
| 0+800 | 1+200 | 1.851 | 1.716 | 7.282 |
| 1+200 | 1+600 | 1.682 | 1.562 | 7.174 |
| 1+600 | 2+000 | 1.456 | 1.547 | 6.222 |
| Average | 1.630 | 1.565 | 4.007 | |
Table 3.
Comparative table between the IRI results with both teams – Left Lane.
| Progression | MERLIN | ROADROID | ||
| Start | End | IRI | IRI | Variation |
| (Km) | (Km) | (m/Km) | (m/Km) | (%) |
| 0+000 | 0+400 | 1.88 | 1.57 | 16.53 |
| 0+400 | 0+800 | 1.72 | 1.58 | 8.22 |
| 0+800 | 1+200 | 1.66 | 1.56 | 6.05 |
| 1+200 | 1+600 | 1.70 | 1.60 | 5.72 |
| 1+600 | 2+000 | 1.54 | 1.45 | 5.89 |
| Average | 1.700 | 1.552 | 8.71 | |
Table 4.
Comparative table between the PSI results with both teams – Right Lane.
| PROGRESSION | MERLIN | ROADROID | SERVICEABILITY | |||||
| START | END | IRI | IRI | VALUE | SCALE | SCALE | ||
| (Km) | (Km) | (m/Km) | (m/Km) | PSI- MERLIN | PSI- ROADROID | (-) | (-) | |
| 0+000 | 0+400 | 1.56 | 1.40 | 3.77 | 3.87 | GOOD | GOOD | |
| 0+400 | 0+800 | 1.60 | 1.60 | 3.74 | 3.74 | GOOD | GOOD | |
| 0+800 | 1+200 | 1.85 | 1.72 | 3.57 | 3.66 | GOOD | GOOD | |
| 1+200 | 1+600 | 1.68 | 1.56 | 3.68 | 3.76 | GOOD | GOOD | |
| 1+600 | 2+000 | 1.46 | 1.55 | 3.84 | 3.77 | GOOD | GOOD | |
| AVERAGE | 3.72 | 3.76 | GOOD | GOOD | ||||
Table 5.
Comparative table between the PSI results with both teams – Left Lane.
| PROGRESSION | MERLIN | ROADROID | SERVICEABILITY | ||||
| START | END | IRI | IRI | VALUE | SCALE | SCALE | |
| (Km) | (Km) | (m/Km) | (m/Km) | PSI- MERLIN | PSI- ROADROID | (-) | (-) |
| 0+000 | 0+400 | 1.88 | 1.57 | 3.55 | 3.76 | GOOD | GOOD |
| 0+400 | 0+800 | 1.72 | 1.58 | 3.66 | 3.75 | GOOD | GOOD |
| 0+800 | 1+200 | 1.66 | 1.56 | 3.70 | 3.77 | GOOD | GOOD |
| 1+200 | 1+600 | 1.70 | 1.60 | 3.67 | 3.74 | GOOD | GOOD |
| 1+600 | 2+000 | 1.54 | 1.45 | 3.78 | 3.84 | GOOD | GOOD |
| AVERAGE | 3.67 | 3.77 | GOOD | GOOD | |||
Table 9.
PCI measurement using conventional visual inspection for 2 km.
| PCI measurement service by conventional visual inspection for 2km | |||||
| Item | Specification | Unit | Quantity | U.P. | Subtotal |
| Labor | Civil Engineer (specialist) | Hh | 30 | 80.00 | 2400 |
| Assistant | Hh | 30 | 10.00 | 300 | |
| Materials | Spray | Und | 3 | 15.5 | 46.5 |
| Laminated board 0.60m x 0.80m | Und | 1 | 53 | 53 | |
| Whiteboard markers | Und | 3 | 3.6 | 10.8 | |
| 28” Safety cones | Und | 1 | 29.5 | 29.5 | |
| Equipment | 50 m measuring tape | Day | 1 | 2.47 | 2.47 |
| 8 m measuring tape | Day | 1 | 3.19 | 3.19 | |
| TOTAL | 2845.46 | ||||
| UP (Soles/Km) | S/ 1,422.73 | ||||
| UP (Dollar/Km) | $/ 374.40 | ||||
Table 10.
PCI measurement using the application for 2 km.
| Specification | Unit | Quantity | U.P. | Total |
|---|---|---|---|---|
| Civil Engineer (specialist) | hh | 3 | 116.67 | 350 |
| Assistant | hh | 3 | 16.67 | 50 |
| Mavic 2 Pro Drone | glb | 1 | 350 | 350 |
| Android Cell Phone | glb | 1 | 0 | |
| TOTAL | 750.00 | |||
| UP (Soles/Km) | S/ 375.00 | |||
| UP (Dollar/Km) | $/ 98.68 |
Disclaimer/Publisher’s Note: The statements, opinions and data contained in all publications are solely those of the individual author(s) and contributor(s) and not of MDPI and/or the editor(s). MDPI and/or the editor(s) disclaim responsibility for any injury to people or property resulting from any ideas, methods, instructions or products referred to in the content. |
© 2024 by the authors. Licensee MDPI, Basel, Switzerland. This article is an open access article distributed under the terms and conditions of the Creative Commons Attribution (CC BY) license (https://creativecommons.org/licenses/by/4.0/).
Copyright: This open access article is published under a Creative Commons CC BY 4.0 license, which permit the free download, distribution, and reuse, provided that the author and preprint are cited in any reuse.


