Research in Context
Evidence Before This Study
Previous studies have documented the rising prevalence of diabetes in the United States, with clear geographic variations at national, state, and county levels. Research focusing on Texas has identified specific “hotspots” of high prevalence, particularly along the South Texas border and in East Texas, where socioeconomic deprivation and limited healthcare access exacerbate metabolic risk. Urban studies have suggested that disparities exist within metropolitan areas, with ethnic minorities and low-income populations disproportionately affected. However, a systematic, longitudinal comparison of adult diabetes prevalence across multiple major metropolitan areas within Texas had not been conducted.
Added Value of This Study
This study provides a thirteen-year longitudinal assessment of adult diabetes prevalence across five major Texas metropolitan areas (Austin, Dallas, Fort Worth, Houston, and San Antonio) from 2011 to 2023. By leveraging BRFSS data, we quantified both statewide trends and intra-state urban disparities. Our analysis revealed a significant overall increase in diabetes prevalence of 1.2% per decade while highlighting substantial regional variation, with San Antonio exhibiting the highest mean prevalence and Austin with the lowest diabetes prevalence. These findings clarify the urban gradients of diabetes burden in Texas and provide city-level evidence that can guide targeted public health interventions.
Implications of All the Available Evidence
The findings underscore that urban diabetes prevalence in Texas is increasing statewide, yet the burden is unevenly distributed. San Antonio and Houston represent metropolitan areas with the highest prevalence, necessitating prioritized allocation of clinical and preventative resources, while Austin and Dallas, despite lower current rates, require proactive measures to prevent convergence with higher-burden cities. Our study highlights the importance of synchronized, statewide public health strategies that account for local urban disparities to address the broader metabolic crisis in Texas. These results provide an evidence-based foundation for policymakers to develop geographically targeted interventions, such as community-level nutritional programs, physical activity infrastructure, and healthcare accessibility initiatives.
Introduction
The adult prevalence of diabetes has reached critical levels in the United States, posing a significant threat to both individual health outcomes and the economic stability of the healthcare system. Within this national context, Texas serves as a focal point for the epidemic due to its large, diverse population and unique geographic health disparities, with rising concerns for metabolic risk factors [
1]. Research has consistently shown that the burden of chronic disease is not distributed equally across the state, as variations in urban infrastructure, food environments, and access to preventative care create distinct regional health profiles [
2]. The past two decades represent a timeframe of immense demographic and economic growth for the state of Texas [
3], yet this prosperity has been accompanied by a persistent rise in metabolic disorders. Understanding the nuances of these trends within major metropolitan urban areas is essential for developing targeted interventions and public health strategies.
Recent literature specifically focusing on Texas underscores a troubling trajectory in both urban and rural contexts. Studies examining Texas county-level data have identified “hotspots” of diabetes prevalence, particularly along the Texas-Mexico border and within areas of East Texas, where socioeconomic deprivation and limited healthcare infrastructure exacerbate metabolic risks [
4]. The researchers found that in this South Texas border community, the prevalence of diabetes was a staggering 28%, but nearly half of those cases were undiagnosed [
4]. Furthermore, research focusing on the Texas areas anchored by Houston, Dallas-Fort Worth, and San Antonio, suggests that while these areas lead the state in economic output, they also face significant internal disparities. For instance, studies have shown that despite regional growth, ethnic minorities in Texas urban centers continue to experience a disproportionately high age-adjusted prevalence of diabetes, often linked to neighborhood-level social determinants such as food desertification and lack of green space for physical activity [
5,
6].
The importance of analyzing metropolitan regions specifically lies in their role as hubs for both resource concentration and significant health inequities. While cities like Austin have gained a national reputation for health-conscious lifestyles and high socioeconomic status, other regions like San Antonio continue to grapple with high rates of obesity and limited access to affordable, nutritious food [
7,
8]. Previous longitudinal studies have indicated that while national trends are upward, the slope of these increases can vary significantly based on local policy and community-level factors [
4]. At the county level, longitudinal trends in Texas have shown that rural-urban divides are shifting; while rural counties historically held higher rates, the rapid urbanization of counties has led to a surge in diagnosed cases that mirrors or exceeds rural growth [
9]. This paper aims to quantify these variations by examining thirteen years of annual data to determine the gap in diabetes prevalence between five urban Texas metropolitan area that transcends local regional boundaries.
By identifying which regions are most at risk and characterizing the pace of diabetes growth, this study provides empirical evidence for state legislators and health departments to prioritize resource allocation. We hypothesis, that there is a significant difference in diabetes prevalence between the five major Texas metropolitan areas.
Methods
This population-based study utilizes open access adult (≥18+ years old) diabetes prevalence data from the Behavioral Risk Factor Surveillance System (BRFSS) throughout the period of 2011 to 2023. BRFSS is the nation’s premier system of health-related telephone surveys that collect state data about US residents regarding their health-related risk behaviors, chronic health conditions, and use of preventive services [
10]. The BRFSS also collected health outcomes data from few metropolitan areas across the US.
This study involved annual adult diabetes prevalence data for five urban metropolitan areas in Texas from 2011-2023. The five urban cities include Austin, Dallas, Fort Worth, Houston, and San Antonio. Within these five cities, the areas include as follows: Austin (Round Rock area), Dallas (Plano-Irving area), Fort Worth (Arlington area), Houston (The Woodlands-Sugar Land area), and San Antonio (New Braunfels area). Within these five areas, the survey asked the question, “have you ever been told by a doctor that you have diabetes?”. This study used responses of “Yes” to the question above, hence indicating that the adult has diabetes. Throughout the study period, a total of 10,598 adults as an aggregate of all five areas, responded “Yes” to having diabetes.
We used a One-Way Analysis of Variance (ANOVA) to determine if the mean diabetes prevalence rates differed significantly across the geographic urban areas. To ensure the validity of the ANOVA results, Bartlett’s test for equal variances was conducted to confirm that the variance of diabetes prevalence was consistent across all five regions, thereby satisfying the homoscedasticity assumption required for parametric testing. Then a simple linear regression was first employed to estimate the overall statewide trend, using the year as the primary independent variable. To delve deeper into regional differences in the rate of change, a linear interaction model was constructed. This model utilized an interaction term between the metropolitan area (coded as a categorical factor) and the year (treated as a continuous variable).
Finally, to clarify the specific nature of the regional disparities identified in the ANOVA, post-hoc pairwise comparisons were performed. Tukey’s Honestly Significant Difference (HSD) test was selected for this purpose because it provides a conservative adjustment for multiple comparisons, reducing the likelihood of committing a Type I error [
11]. This allowed us to pinpoint exactly which urban city pairs exhibited statistically significant differences in their health profiles. All statistical tests were conducted at a 95% confidence interval, with p-values less than 0.05 considered statistically significant. All figures and data analyses were conducted using STATA (version 15) and Microsoft Excel (version 2020).
Results
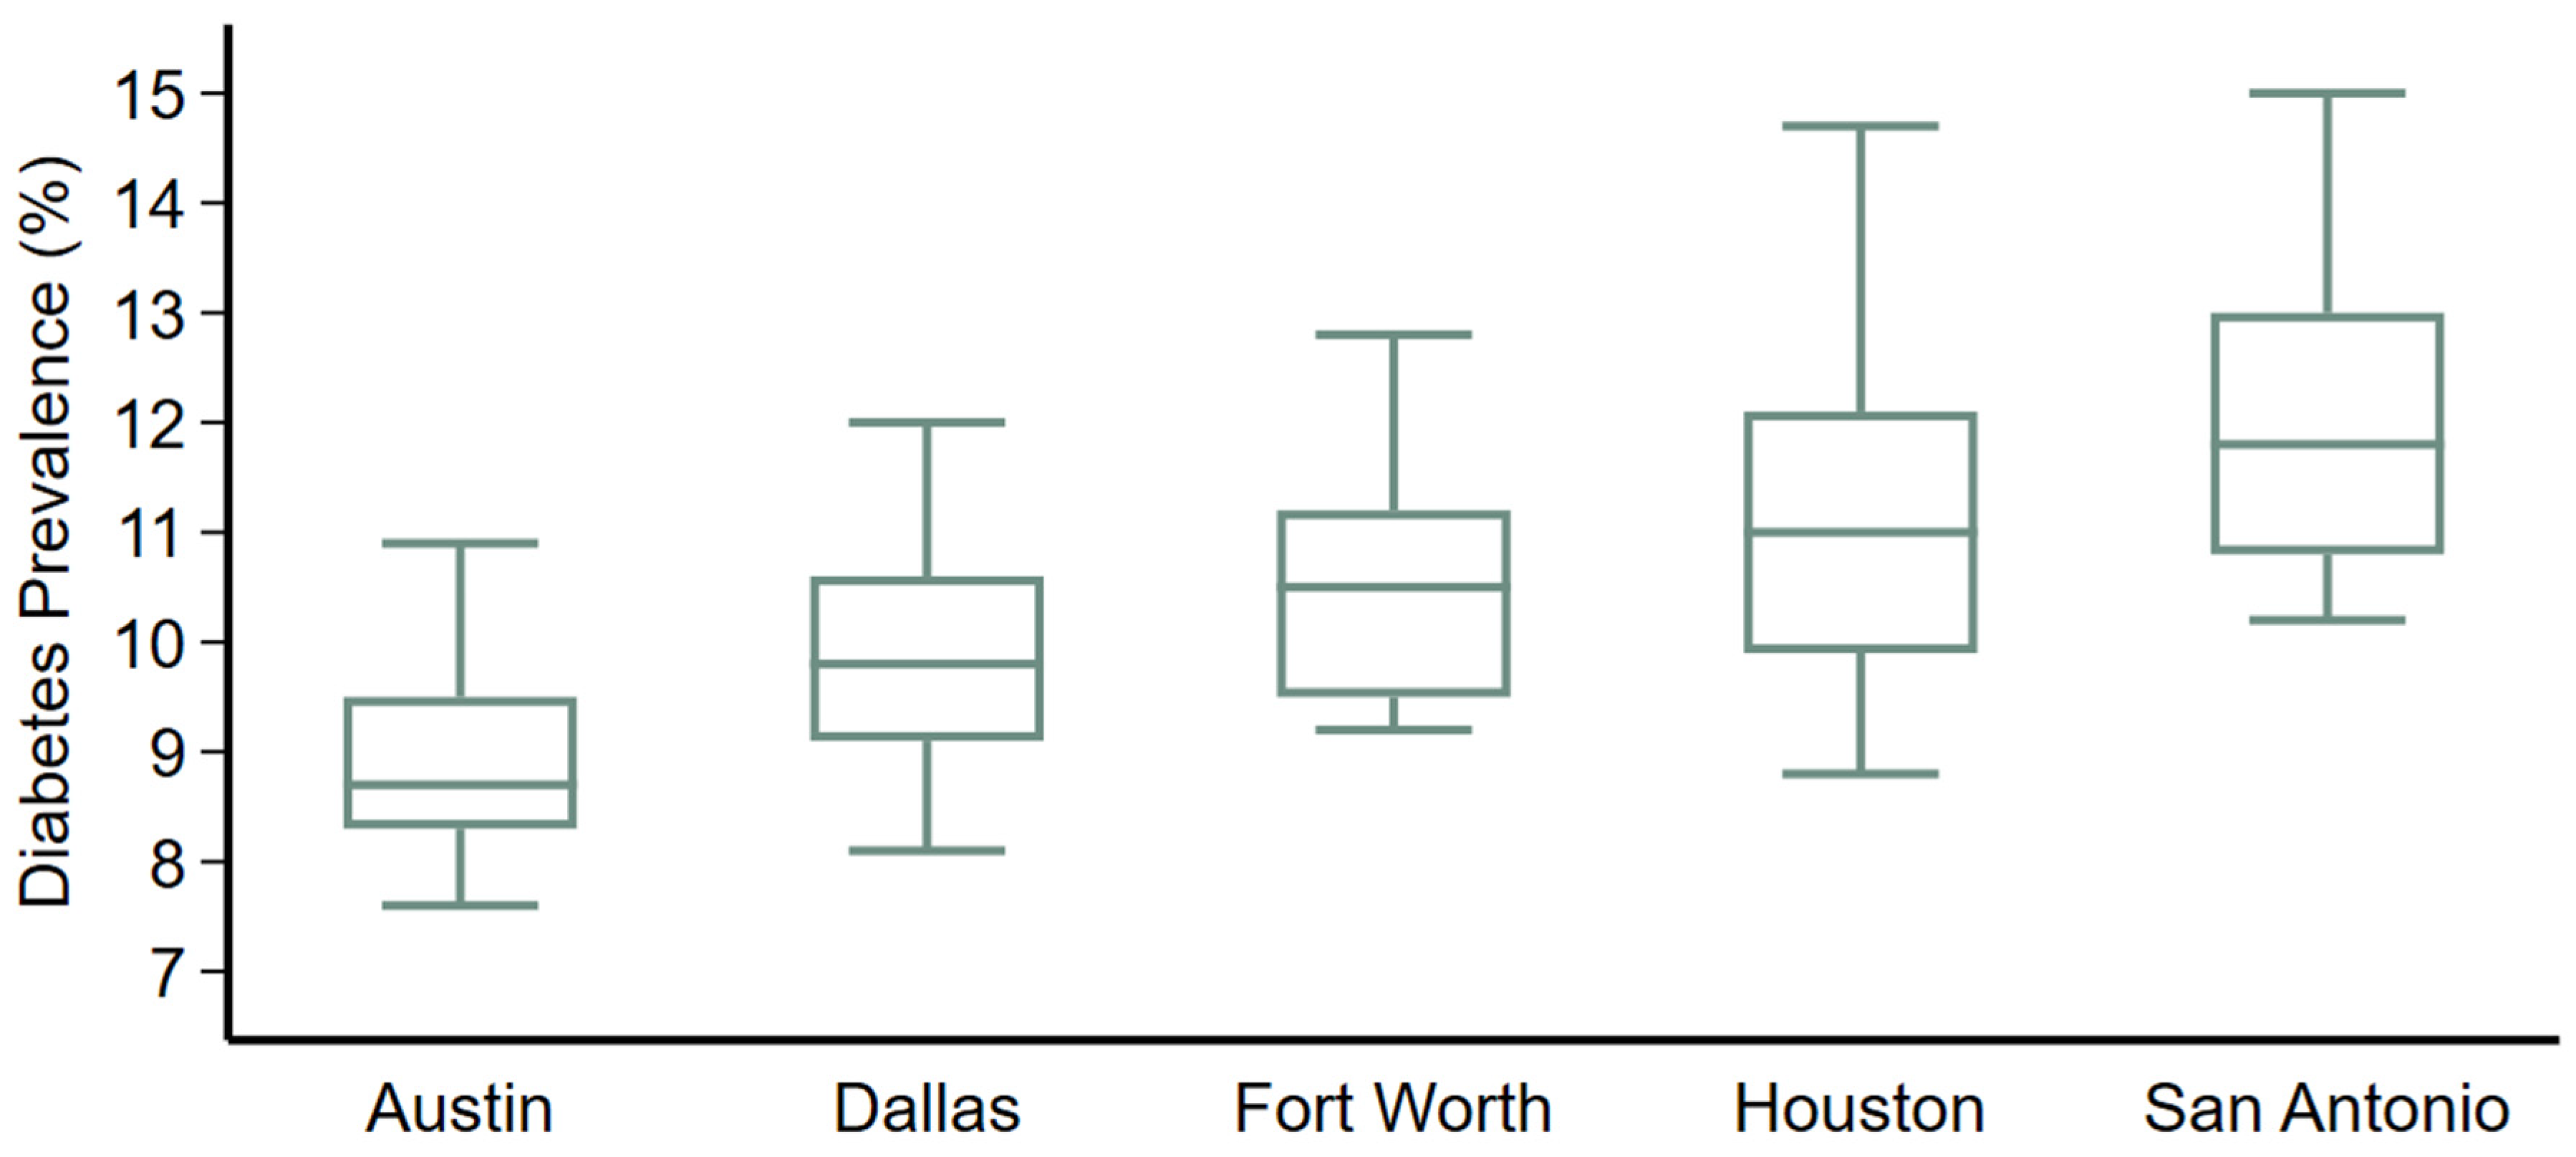
The statistical results offer a compelling view of the diabetes crisis in urban Texas, beginning with the confirmation of significant geographic variations. The ANOVA produced results, indicating that the differences in diabetes prevalence between the five metropolitan areas are highly significant (P<0.001). The descriptive summary reveals a hierarchy of health outcomes: the San Antonio region reported the highest mean prevalence at 12.1%, followed by Houston at 11.2%, Fort Worth at 10.6%, Dallas at 9.8%, and Austin at 9.0% (
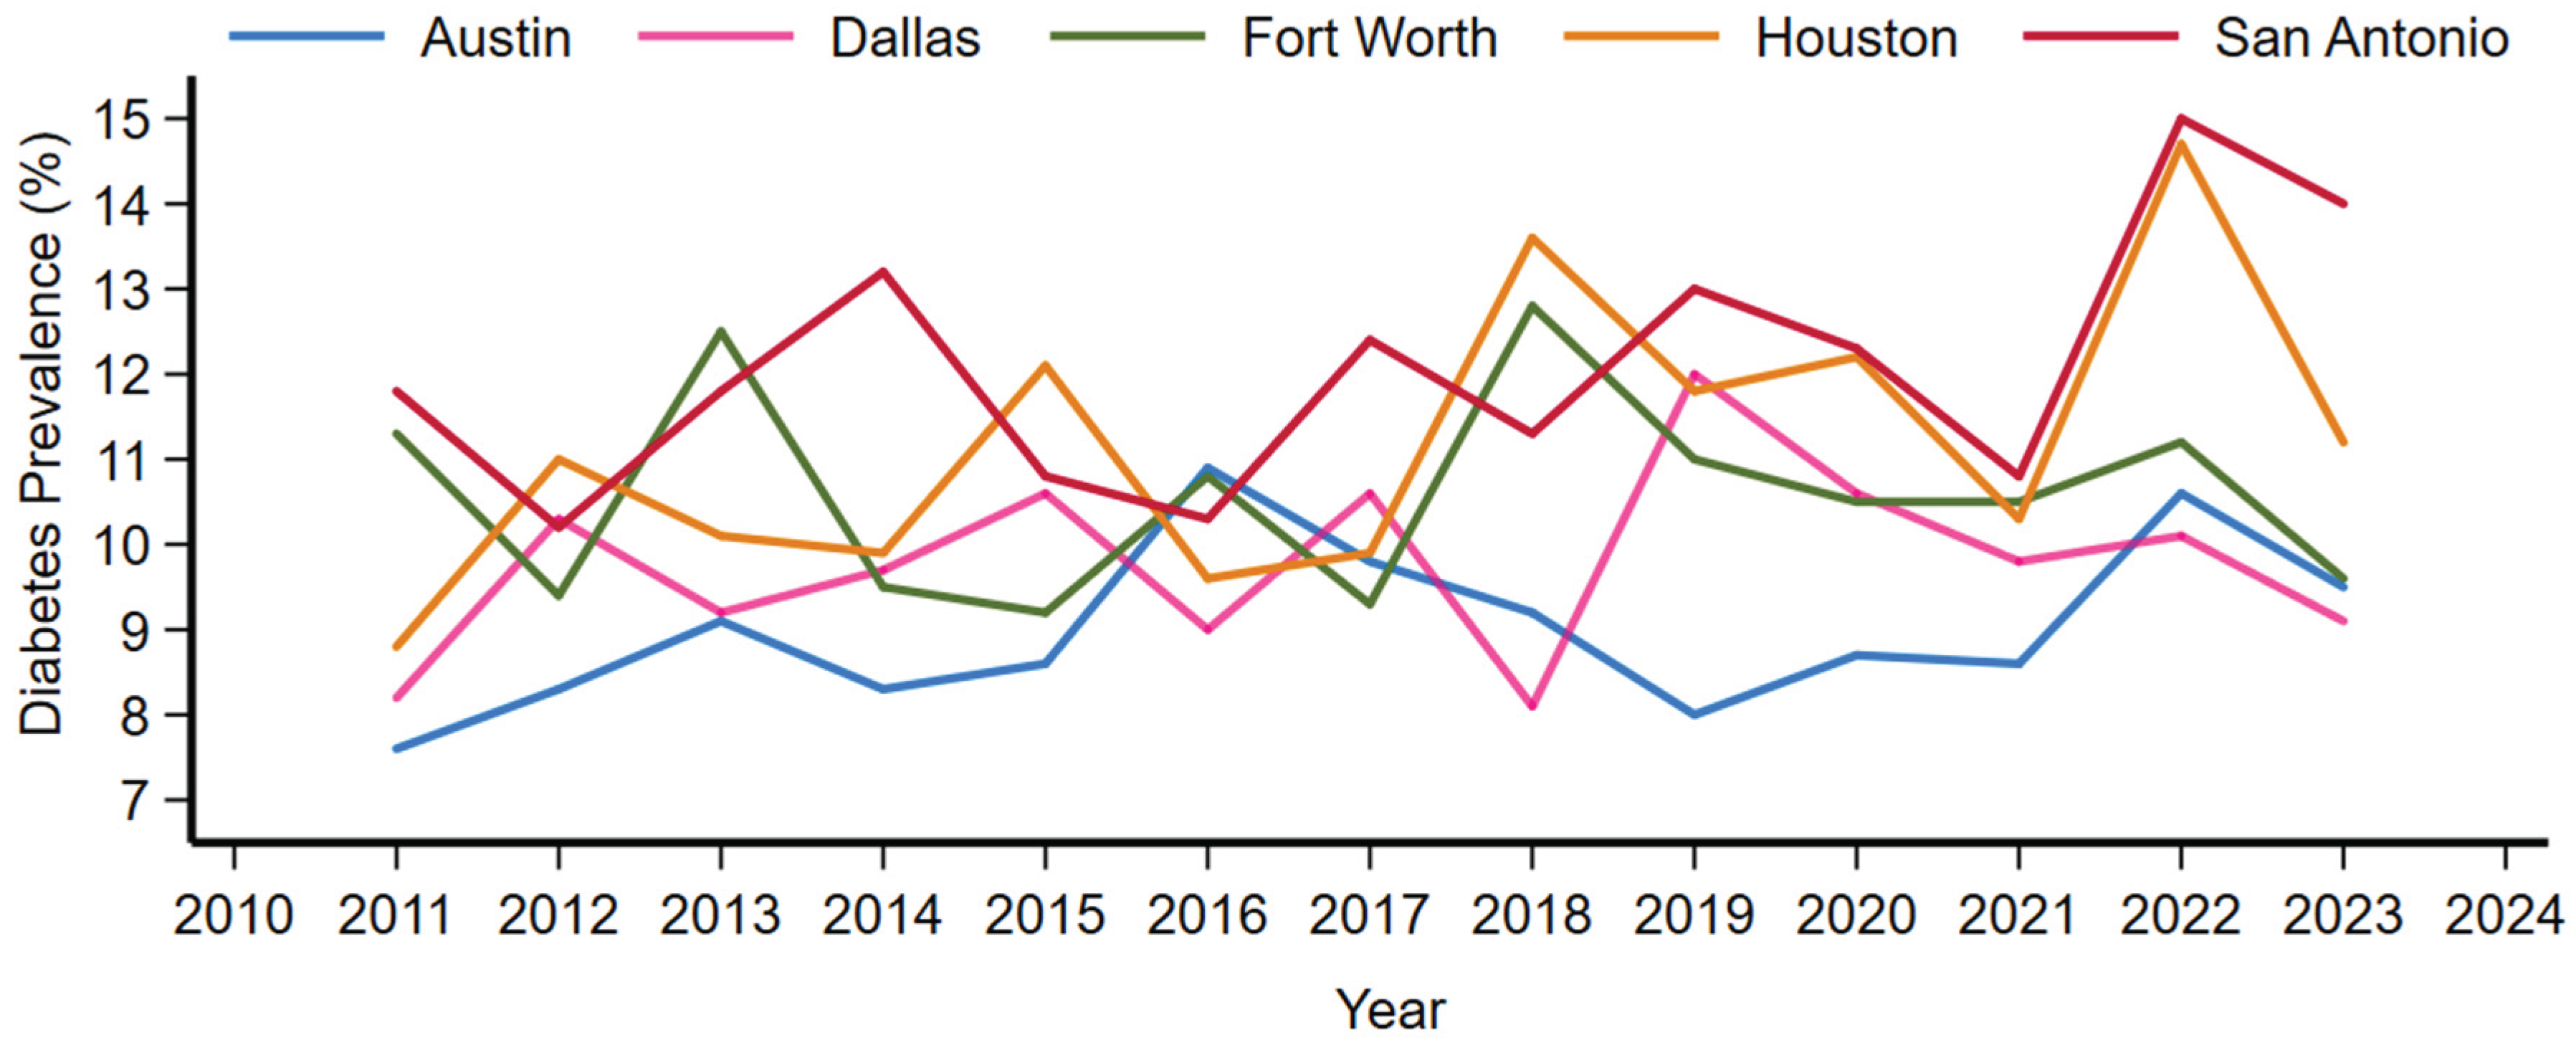
Figure 1). Bartlett’s test for equal variances resulted in a chi-squared value of 4.60 (P=0.33), which supports the use of ANOVA by confirming that the spread of data within each region is statistically similar. The time series by urban metropolitan regions are shown in
Figure 2.
Regarding the temporal change over the thirteen-year period, the simple linear regression model confirmed a significant upward trend for the state. The coefficient for the year variable was 0.12 (P=0.026), suggesting that on average, diabetes prevalence in these metropolitan areas increased by approximately 1.2% every decade. When the interaction model was applied to see if these trends differed by city, the model fit showed a high variance (R2=0.46, P<0.001). We also found that while the starting points for these cities are different, they are all rising at a statistically similar rate.
At an area-wise comparison, San Antonio showed a significantly higher prevalence when compared to Austin (difference = 3.05, 95% CI 1.62 to 4.49, P<0.001), summarized in
Table 1. Austin had significantly lower diabetes prevalence than Houston (difference = 2.15, 95% CI 0.72-3.59, P<0.001) and Fort Worth (difference = 1.57, 95% CI 0.13-3.0, P=0.025). However its not significantly lower in comparison to diabetes in Dallas (difference = 0.78, 95% CI -0.65 to 2.21, P=0.55). Other major differences occurred between San Antonio vs Dallas (difference=2.28, 95% CI 0.84-3.71, P<0.001) and San Antonio vs Fort Worth (difference=1.48, 95% CI 0.05-2.92, P=0.039).
These results highlight a clear geographic urban metropolitan gradient within Texas, where the southern and coastal metropolitan areas face a higher diabetes burden than the central and northern inland cities, even as the entire state trends toward higher prevalence.
Discussion
The analysis of diabetes prevalence across Texas metropolitan areas reveals a complex public health challenge characterized by persistent regional gaps and a steady statewide prevalence increase. These findings align with broader literature regarding the social determinants of health, as these metropolitan areas often report higher levels of income inequality and food insecurity compared to the Austin [
12]. San Antonio’s significantly higher prevalence may also be influenced by cultural and demographic factors unique to South Texas, where higher concentrations of populations at increased genetic and socioeconomic risk for Type 2 diabetes reside [
13,
14].
While Austin maintains a lower prevalence than its neighbouring cities, it is not immune to the statewide upward trend. This suggests that the statewide drivers, likely including an aging population, rising rates of sedentary behavior, and the ubiquity of high-calorie, low-nutrient food environments are exerting equal pressure across all Texas urban centers [
15]. Consequently, while San Antonio and Houston require the most immediate and intensive clinical resources, Austin and Dallas require proactive preventative strategies to ensure their currently lower rates do not eventually converge with those of the highest-burden cities [
16].
Given that the rate of increase is uniform across regions, a state-level policy intervention targeting food systems and physical activity infrastructure may be more effective than fragmented city-level programs [
17,
18]. However, the baseline disparities suggest that resource allocation must remain disproportionately focused on the San Antonio and Houston regions to address the existing in those communities [
19,
20].
Limitations of this research include the reliance on self-reported prevalence data, which often underestimates the true burden of disease due to undiagnosed cases [
21]. Other limitations include a recall bias, where some older adults with other comorbidities such as dementia may not be able to remember accurately if the physician has them diagnosed with diabetes. Furthermore, there may be sex, race, and ethnic differences among these five urban areas, which can imminent diversification in the results. Future research should incorporate clinical biomarkers, such as HbA1c levels, and examine the impact of specific municipal health policies enacted during the 2011-2023 period to determine if any local interventions successfully slowed the trend, even if not reflected in the current aggregate data.
Funding
This study did not receive any funding. No external funding was received for the conduct of this study, data collection, analysis, or manuscript preparation.
Contributor
Muhammad A Saeed; Led the administration and results interpretations, review of the final manuscript. Mohammad R Saeed; Contributed to interpreting the data and editing the manuscript. Xaviera Ayaz; Contributed to editing the manuscript. Haris Majeed; designed the study and conducted the analyses. All authors have read and approved the manuscript before submission.
Data sharing statement
All data is open access and provided in this manuscript.
Declaration of interests
We declare no competing interests.
References
- Yang M, Wang T. Neighborhood walkability and cardiometabolic disease in Texas. Sci Rep. 2025 Mar 19;15:9488.
- Gaskin DJ, Thorpe RJ, McGinty EE, Bower K, Rohde C, Young JH, et al. Disparities in diabetes: the nexus of race, poverty, and place. Am J Public Health. 2014 Nov;104(11):2147–55.
- Jones CI. The Past and Future of Economic Growth: A Semi-Endogenous Perspective. Annu Rev Econ. 2022 Aug 12;14(Volume 14, 2022):125–52.
- Fisher-Hoch SP, Vatcheva KP, Rahbar MH, McCormick JB. Undiagnosed Diabetes and Pre-Diabetes in Health Disparities. PLOS ONE. 2015 July 17;10(7):e0133135.
- Benoit SR, Hora I, Albright AL, Gregg EW. New directions in incidence and prevalence of diagnosed diabetes in the USA. BMJ Open Diabetes Res Care. 2019 May 28;7(1):e000657.
- Mier N, Medina AA, Ory MG. Mexican Americans With Type 2 Diabetes: Perspectives on Definitions, Motivators, and Programs of Physical Activity [Internet]. Vol. 4. 2007 [cited 2025 Dec 25]. Available from: https://stacks.cdc.gov.
- van den Berg A, Nielsen A, Akhavan N, Pulido CL, Basu S, Hussaini A, et al. Design and evaluation of a coalition-led obesity initiative to promote healthy eating and physical activity in low-income, ethnically diverse communities: the Go! Austin/Vamos! Austin initiative. Arch Public Health. 2019 May 29;77(1):25.
- Jiao J. Measuring Vulnerable Population’s Healthy and Unhealthy Food Access in Austin, Texas. AIMS Public Health. 2016 Sept 12;3(4):722–32.
- Cunningham SA, Patel SA, Beckles GL, Geiss LS, Mehta N, Xie H, et al. County-level contextual factors associated with diabetes incidence in the United States. Ann Epidemiol. 2018 Jan;28(1):20-25.e2.
- Laflamme DM, VanDerslice JA. Using the Behavioral Risk Factor Surveillance System (BRFSS) for Exposure Tracking: Experiences from Washington State. Environ Health Perspect. 2004 Oct;112(14):1428–33.
- Tukey JW. Comparing Individual Means in the Analysis of Variance. Biometrics. 1949;5(2):99–114.
- Gaskin DJ, Thorpe RJ, McGinty EE, Bower K, Rohde C, Young JH, et al. Disparities in diabetes: the nexus of race, poverty, and place. Am J Public Health. 2014 Nov;104(11):2147–55.
- Lorenzo C, Serrano-Rios M, Martinez-Larrad MT, Gabriel R, Williams K, Gonzalez-Villalpando C, et al. Was the Historic Contribution of Spain to the Mexican Gene Pool Partially Responsible for the Higher Prevalence of Type 2 Diabetes in Mexican-Origin Populations?: The Spanish Insulin Resistance Study Group, the San Antonio Heart Study, and the Mexico City Diabetes Study. Diabetes Care. 2001 Dec 1;24(12):2059–64.
- Haffner SM. Epidemiology of Type 2 Diabetes: Risk Factors. Diabetes Care. 1998 Dec 1;21(Supplement_3):C3–6.
- Menke A, Casagrande S, Geiss L, Cowie CC. Prevalence of and Trends in Diabetes Among Adults in the United States, 1988-2012. JAMA. 2015 Sept 8;314(10):1021–9.
- Siddiqui NJ, Morriss S. Moving Upstream to Achieve Better and Equitable Health in Texas.
- Muller M, Tagtow A, Roberts SL, MacDougall E. Aligning Food Systems Policies to Advance Public Health. J Hunger Environ Nutr. 2009 July;4(3–4):225–40.
- Sreedhara M, Goulding M, Valentine Goins K, Frisard C, Lemon SC. Healthy Eating and Physical Activity Policy, Systems, and Environmental Strategies: A Content Analysis of Community Health Improvement Plans. Front Public Health [Internet]. 2020 Dec 18 [cited 2025 Dec 25];8. Available from: https://www.frontiersin.org/journals/public-health/articles/10.3389/fpubh.2020.580175/full.
- Ramirez AG, Thompson IM, Vela L, editors. The South Texas Health Status Review: A Health Disparities Roadmap [Internet]. Cham (CH): Springer; 2013 [cited 2025 Dec 25]. Available from: http://www.ncbi.nlm.nih.gov/books/NBK543609/.
- Ekren E, Maleki S, Curran C, Watkins C, Villagran MM. Health differences between rural and non-rural Texas counties based on 2023 County Health Rankings. BMC Health Serv Res. 2025 Jan 2;25:2.
- St.Clair P, Gaudette É, Zhao H, Tysinger B, Seyedin R, Goldman DP. Using Self-Reports or Claims to Assess Disease Prevalence: It’s Complicated. Med Care. 2017 Aug;55(8):782–8.
|
Disclaimer/Publisher’s Note: The statements, opinions and data contained in all publications are solely those of the individual author(s) and contributor(s) and not of MDPI and/or the editor(s). MDPI and/or the editor(s) disclaim responsibility for any injury to people or property resulting from any ideas, methods, instructions or products referred to in the content. |
© 2026 by the authors. Licensee MDPI, Basel, Switzerland. This article is an open access article distributed under the terms and conditions of the Creative Commons Attribution (CC BY) license (http://creativecommons.org/licenses/by/4.0/).