
Submitted:
23 June 2025
Posted:
25 June 2025
You are already at the latest version
Abstract
Non-communicable diseases (NCD) are a leading cause of mortality globally, contributing significantly to the burden on healthcare systems. Understanding the spatiotemporal patterns of NCD mortality is crucial for identifying vulnerable populations and regions at high risk. Here, we evaluated the spatiotemporal patterns of NCD mortality in the Metropolitan Area of the Mexico Valley from 2000 to 2019 for five International Classification of Diseases Chapters (4, 5, 6, 9, 10) at two spatial scales: municipal level and metropolitan region. Mortality rates were calculated for the total population, and stratified by sex and age groups, at both spatial scales. In addition, relative risk (RR) of mortality was estimated to identify vulnerable population groups and regions with high risk of mortality. Mortality trends showed that circulatory system diseases (Chapter 9) are emerging as a concerning health issue, with a substantial number of municipalities showing increasing mortality trends, especially among older adults. Respiratory system diseases (Chapter 10), mental and behavioral disorders (Chapter 5) and nervous system diseases (Chapter 6) predominantly showed decreasing mortality trends. Endocrine, nutritional, and metabolic diseases (Chapter 4) showed a more complex pattern, with some age groups presenting increasing mortality trends. The RR showed that men and older age groups (≥35 years) exhibiting higher mortality risks. Temporal trend of RR allowed us to identify spatial mortality hotspots mainly in chapters related to circulatory, endocrine, and respiratory diseases. The spatiotemporal analysis highlights municipalities and vulnerable populations with consistently elevated mortality risk. These findings emphasize the need for monitoring NCD mortality patterns at both the municipal and metropolitan levels to address disparities and guide the implementation of health policies aimed at reducing mortality risk in vulnerable populations.
Keywords:
chronic diseases
; spatial epidemiology
; mortality hotspots
; non-communicable diseases
; health determinants
1. Introduction
Non-communicable diseases (NCD) are a leading global health concerns, accounting for approximately of 70% of deaths worldwide [1,2]. The growing burden of NCD is a major priority on the global health agenda, as they cause more deaths than all other causes combined [3]. NCD are conditions with no known causative agents, and generally are not transmissible from one person to another. They are usually chronic nature, with slow onset and lengthy progression, generating costs that go beyond health, perpetuating poverty and undermining quality of life [1,4,5]. The highest burden of NCD can be attributed to chronic diseases such as cardiovascular diseases, cancers, chronic respiratory illnesses, and diabetes [1,6].
Death rates from NCD are higher in low-income and middle-income countries, and, at least in high-income countries, among people with lower socioeconomic status [7,8,9], making NCD a significant barrier to reducing both global and national health inequalities [9,10]. During decades NCD were mainly a topic of high-income countries, nowadays they represent the main problem of the developing world. These trends reflect the growing societies, rapid unplanned urbanization and unhealthy behaviors [11]. Furthermore, NCDs affect productive age groups, and adults in low- and lower-middle-income countries had double risk of dying from an NCD compared with adults in high-income countries creating a vicious cycle of poverty and ill-health [12].
As a result of prioritizing NCD, target 3.4 of the Sustainable Development Goals (SDGs) was introduced to reduce the total NCD mortality rate by one third by 2030 [2]. This global commitment reflects the growing recognition of NCD as a major public health challenge, especially in low- and middle-income countries, where health systems are often ill-equipped to address their long-term burden [9]. Achieving this goal requires not only clinical interventions but also a comprehensive understanding of spatial and demographic disparities in NCD-related mortality.
NCD-related deaths impose a significant burden upon communities and health care systems. The challenge arises when the rate of health transition outpaces the development of health services [13]. Therefore, health planners and policymakers need to have a deep understanding of the epidemiological dynamics of NCD in order to implementing optimal allocations resources and provide appropriate health services. In line with global trends, Mexico has experienced a rise in the prevalence of NCD in recent years; from 2006 to 2016 the national prevalence of diabetes mellitus increased from 7.2 to 9.4%. Overweight and obesity prevalence has increased form 69.7% in 2006 to 72.5% in 2016 [14,15]. Health care costs associated with obesity-related NCDs are projected to reach US$1.2 billion by 2030 and US$1.7 billion by 2050 in Mexico [16]. Overall, health care service providers in Mexico are spending a significant proportion of their health expenditure on the financial burden of NCD [15]. Although measuring the spatial and temporal trends of NCD-related mortality is very important to improve the existing health care systems, a comprehensive estimate considering social and environment determinants is lacking in Mexico.
In this study, we aimed to assess the spatiotemporal patterns of mortality from non-communicable diseases in the Metropolitan Area of the Valley of Mexico (MAVM), the country’s most populous and economically significant region. Our analysis was conducted at two spatial scales: the municipal level and the entire metropolitan region. We integrated key health determinants—including age and sex—to identify vulnerable population groups and high-risk areas. By examining both local and regional trends over time, this study provides a comprehensive perspective on the burden of NCD, helping to inform evidence-based public health policies and targeted interventions across diverse demographic and geographic contexts within the region.
2. Materials and Methods
2.1. Study Area
The study area comprised the Metropolitan Area of Valley of Mexico (MAVM), which included 16 boroughs of Mexico City, 59 municipalities of State of Mexico, and one municipality of Hidalgo [17] (Figure 1). MAVM comprises an area of 7845 km2, where a total of 21.8 million peoples live [18]. Corresponds to the most important industrial and economic region of the country, and it constitutes one of the largest concentrations of population on the plane.
2.2. Mortality Data
Mortality data were obtained from open data portal of Ministry of Health of Mexico (http://www.dgis.salud.gob.mx/contenidos/basesdedatos/da_defunciones_gobmx.html) for the period 2000-2019. We selected records where cause of death was classified within five Chapters of the International Classification of Diseases, 10th Revision (ICD-10) [19]: Chapter 4 (Endocrine, Nutritional and Metabolic Diseases), Chapter 5 (Mental, Behavioral and Neurodevelopmental disorders), Chapter 6 (Disease of the Nervous System), Chapter 9 (Disease of the Circulatory System), Chapter 10 (Disease of Respiratory System). Data were filtered to include only deaths where the place of occurrence coincided with the individual’s place of residence, thereby ensuring that all cases belonged to residents within our study area.
2.3. Population Data
To facilitate a meaningful comparison of mortality for population groups and regions, we calculated mortality rates standardized per 100,000 inhabitants. These rates were estimated using sex- age- and municipality-specific demographic data. Annual population data spanning the period from 2000 to 2019 were obtained from the Consejo Nacional de Población (CONAPO) of Mexico [20].
2.4. Analisys Data
Deaths were categorized into 8 age groups with 10-year intervals, except the first and the last one (0–4, 5–14, 15–24, 25–34, 35–44, 45–54, 55–64, 65+). Mortality rates (MR) were calculated by dividing the number of deaths in each age group or sex by the total population, and then standardizing by 100,000 inhabitants:
where Di is the number of deaths for each age group or sex, and Pi is the total population by age or sex. Standardization was performed using population data from CONAPO, which included both total population and sex-specific data. This approach enabled consistent comparisons across municipalities, years, and population subgroups, providing a comprehensive analysis of mortality trends by sex, age group, and region.
2.4.1. Temporal Trends
To assess temporal trends in non-communicable disease mortality at the municipal level, we applied linear regression models to mortality rates over the period 2000 to 2019. For each municipality and disease type, a linear model was fitted with year as the predictor and mortality rate as the response variable. The resulting slope coefficient (β) was used to determine the direction and magnitude of the trend over time. Trends were classified into three categories: positive, negative, and no trend, based on the sign and statistical significance of the slope. A positive slope (β > 0.5 and p < 0.05) was classified as an increasing trend, a negative slope (β < –0.5 and p < 0.05) as a decreasing trend. Otherwise, the trend was labeled as no trend. The threshold was defined based on the scale of the rates (e.g., per 100,000 inhabitants) to ensure sensitivity to subtle but meaningful changes. This approach ensures that only statistically meaningful changes in mortality rates are classified as trends. The analysis was conducted at municpal level and at MAVM level by aggregating mortality and population data. For both spatial levels, mortality trends were analyzed for the total population, by sex (male and female), and by age groups.
2.4.2. Relative Risk Estimation by Age and Sex Groups
To assess demographic differences in mortality, we estimated relative risks (RR) by sex and age groups, using women and the 25-34 age group as reference categories. This approach allows the comparison of mortality patterns across demographic groups while accounting for population size differences [21,22,23].
Sex-specific relative risks were estimated annually as the ratio of men to women mortality rates (MR):
For age groups, relative risks for each year were calculated as the ratio of the mortality rate in a given age group to that in the reference 25_34 group:
Standard errors and 95% confidence intervals (CI) were estimated on the log scale assuming Poisson-distributed death counts [23]:
where D is the number of deaths in the target and reference groups. All RR values were visualized using line plots, with shaded ribbons indicating 95% confidence intervals. For age group analysis, the log scale was applied to the y-axis to enhance interpretability across widely varying RR magnitudes. For sex comparisons, both male and female RR values were shown side by side, facilitating a more nuanced understanding of sex-specific mortality trends
2.4.3. Relative Risk Estimation by Municipalities
To assess spatial variations in mortality risk, we estimated municipality-specific relative risk (RR) of mortality by using the mortality rate of MAVM as a rate of reference.
Standard errors and 95% confidence intervals (CI) were estimated on the log scale assuming Poisson-distributed death counts:
where Dmun is the number of deaths in each municipality and DMAVM is the total of detahs regsiter in the MAVM. RR and their corresponding 95% confidence intervals (CI) were calculated for each Chapter from 2000 to 2019. RR values were spatially maped by assigned to each municipality polygon its corresponding RR estimate. To highlight areas with elevated mortality risk, we visualized only municipalities with statistically significant high RR values, defined as those with RR > 1 and a lower confidence interval, CIL > 1. Additionally, we quantified the persistence of excess mortality risk by counting the number of years in which each municipality exhibited a statistically significant RR for each disease chapter. The resulting frequency maps reveal municipalities with consistently elevated mortality risks throughout the study period.
3. Results
Mortality data spanning the period from 2000 to 2019 were obtained for five major NCD chapters (Chapters 4, 5, 6, 9, and 10). A total of 747,131 deaths were recorded during the study period. Chapter 9 (Diseases of the circulatory system) accounted for the highest number of deaths (348,201), while Chapter 5 (Mental and behavioral disorders) had the lowest number. Overall, the majority of deaths occurred among individuals aged 35 years and older, and deaths were generally higher among men compared to women, with the exception of Chapter 9, where women exhibited a greater number of deaths, highlighting a distinct sex-specific pattern in circulatory system diseases. Additionally, for Chapter 10 (Diseases of the respiratory system), the 00-04 age group registered a notably high number of deaths, surpassed only by the 65+ age group, underscoring the particular vulnerability of young children to respiratory conditions (Table 1). Spatiotemporal mortality patterns at both the metropolitan and municipal levels for each NCD chapter are presented separately in the following sections.
3.1. Mortality by Non Comunicable Diseases at the Metropolitan Scale in the MAVM
3.1.1. Mortality Trends for the Total Population
Figure 2 shows the temporal trends in mortality rates (per 100,000 inhabitants) from 2000 to 2019 across the five analyzed disease Chapters. A statistically significant upward trend was observed in Chapter 4 and Chapter 9, with estimated slopes of β = 0.24 (R2 = 0.96, p = 7.5 × 10⁻¹⁴) and β = 0.40 (R2 = 0.96, p = 1.2 × 10⁻¹³), respectively. These results indicate a consistent and marked increase in mortality over the study period for these chapters. In contrast, Chapters 6 and 10 exhibited weaker yet statistically significant increases in mortality, with slopes of β = 0.01 (R2 = 0.57, p = 0.00013) and β = 0.03 (R2 = 0.45, p = 0.0013), respectively, suggesting a slower but steady upward trend. For Chapter 5, no statistically significant change was detected, as indicated by a slope of β = 0.00 (R2 = 0.15, p = 0.087), which suggests relative stability in mortality rates during the period analyzed.
3.1.2. Sex-Specific Mortality Trends
We analyzed temporal mortality trends by disease chapter, stratified by sex. Significant increasing trends (positive β) were observed in both sexes for Chapter 4 and Chapter 9, suggesting a growing burden of theses NCD in the region. In contrast, no clear trends were identified for Chapters 5, 6 and 10 in either sex. However, for Chapter 6, a slight upward shift was detected after 2010 in both men and women, possibly indicating emerging or under-recognized health challenges within this group. Notably, women exhibited higher mortality rates () than men () in Chapter 9. In the remaining chapters, men generally showed higher rates. A noteworthy temporal shift was observed in Chapter 4: while women initially had higher mortality rates (), male mortality () surpassed that of females after 2008 (Figure 3).
3.1.3. Age-Specific Mortality Trends
By analyzing age group-specific mortality trends, significant negative trends were found for older adults (65+) in Chapter 4 and Chapter 10, as well as for children aged 00–04 in Chapter 10. In contrast, Chapter 9 showed positive and statistically significant trends for the age groups 55–64 and 65+ (Table A1). For all disease Chapters, age groups above 35 years consistently exhibited the highest mortality rates, with individuals aged 65 and older being the most affected—reflecting the cumulative effect of chronic health conditions and increased physiological vulnerability in older adults. Notably, in Chapter 10, children aged 00–04 showed higher mortality rates than individuals aged 5 to 54, indicating a specific vulnerability at early ages that may be linked to congenital conditions, inadequate access to early medical care, or socioeconomic disparities (Figure 4).
3.2. Municipal-Level Trends in Non-Communicable Disease Mortality in the MAVM
3.2.1. Mortality Trends for the Total Population
Mapping mortality trends at the municipal level revealed spatial heterogeneity in the evolution of disease-specific mortality between 2000 and 2019. For the total population, no significant trends were detected for Chapters 5 and 6 in any municipality. In contrast, Chapters 4 and 9 exhibited the highest numbers of municipalities with significant increasing trends, with 52 and 45 municipalities, respectively, accounting for more than 50% of the municipalities in the MAVM. Notably, few municipalities exhibited decreasing trends for these disease chapters. Specifically, negative trends were observed in the Benito Juárez borough (Mexico City) and in Nextlalpan (State of Mexico) for Chapter 4, and in Acolman (State of Mexico) for Chapter 9
For Chapter 10, 11 municipalities showed significant positive trends, with nine located in Mexico City and two in the State of Mexico. These municipalities are concentrated in a region known for persistent poor air quality. Notably, the Cuauhtémoc borough (Mexico City), despite being located in the same area of poor air conditions, showed no significant trend. Additionally, 21 municipalities in the State of Mexico presented negative trends for Chapter 10, predominantly located at the periphery of the MAVM, representing the highest number of municipalities with decreasing mortality trends for any chapter (Figure 5). These results provide evidence of spatial heterogeneity in mortality trends within the MAVM over the last two decades.
3.2.2. Sex-Specific Mortality Trends
Temporal mortality trends, analyzed by sex and municipality, demonstrated significant heterogeneity across disease chapters. Notably, Chapter 4 showed widespread increasing mortality in 35 municipalities (12 in Mexico City, 23 in the State of Mexico) for both sexes, with an additional 19 municipalities exhibiting sex-specific increases (men: 12, women: 7). Decreasing trends in this chapter were infrequent and mainly observed in women (5 municipalities). Chapter 9 also displayed prevalent increasing trends in 40 municipalities (14 in Mexico City, 26 in the State of Mexico) for both sexes, alongside sex-specific increases suggesting potential male vulnerability in 8 municipalities and female vulnerability in 2.
In contrast, Chapter 10 was dominated by decreasing mortality trends across 23 municipalities (both sexes: 8, men only: 9, women only: 6). 15 municipalities showed increasing trends in Chapter 10 (both sexes: 10, men: 2, women: 3). Mortality in Chapters 5 and 6 remained with no trends in all municipalities. In summary, increasing trends were more characteristic for endocrine and circulatory diseases, while respiratory diseases showed more decreasing trends. Mental and nervous system disorders exhibited no significant temporal changes (Figure 6). The presence of sex-specific trends in several municipalities underscores the importance of considering gender in understanding mortality vulnerabilities.
3.2.3. Age-Specific Mortality Trends
Temporal trends in mortality at the municipal level, stratified by age group and disease chapter, revealed heterogeneous patterns. By counting the number of municipalities with positive or negative trends, we found that for Chapter 4, young children (00–04 years) predominantly exhibited negative trends. However, a substantial number of municipalities among age groups above 25 years displayed more positive than negative trends. For Chapter 5, a predominantly negative trend in mortality was observed across all age groups. Similarly, for Chapter 6, mortality trends were primarily negative across most age groups.
In Chapter 9, we observed a higher proportion of municipalities with positive mortality trends, mainly among individuals aged 65 years and older. In contrast, Chapter 10 exhibited predominantly negative mortality trends across nearly all age groups, suggesting a general decrease in respiratory disease mortality across most municipalities. It is noteworthy that 00–04 age group had the highest number of municipalities exhibiting negative mortality trends (Figure 7).
In summary, mortality trends varied across disease categories and age groups. Endocrine, nutritional, and metabolic diseases (Chapter 4) exhibited a mixed pattern, with younger groups generally showing positive trends, but declines emerging among adults aged 55 and older years. Mental and behavioral disorders (Chapter 5), diseases of the nervous system (Chapter 6) and respiratory system diseases (Chapter 10) predominantly showed declining mortality trends across all age groups. In contrast, diseases of the circulatory system (Chapter 9) exhibited a concerning pattern of increasing mortality, particularly among older adults (Figure 7).
3.3. Relative Risk Trends in Non-Communicable Disease Mortality in the ZMVM
3.3.1. Sex-Specific Relative Risk of Mortality over Time
The analysis of relative risk (RR) by sex consistently indicated that men had a higher risk of mortality across most disease chapters. An exception was Chapter 9, where women exhibited a higher mortality risk. However, over the study period, we observed a general decreasing trend in relative risk among women, whereas for men, the relative risk showed an increasing tendency. Furthermore, in Chapter 4, a shift in mortality risk between sexes was noted from 2007, where men surpassed women in mortality risk, coupled with a sustained positive trend in mortality due to these conditions (Figure 8)
3.3.2. Age-Specific Relative Risk (RR) of Mortality over Time
The temporal trends of the log-transformed relative risk of mortality (relative to the 25-34 age group) by disease chapters are presented in Figure 9, stratified by age group (00-04, 05-14, 15-24, 35-44, 45-54, 55-64, and 65+ years). In 00–04 age group, higher RR values were observed for Chapters 4, 6 and 10, although with a decreasing trend over time. For 05-14, 15-24 age groups, we found a not significant RR for any disease chapter, indicating that their mortality rates are lower than 25-34 reference group. Conversely, older groups (>34) exhibit higher RR values for the most disease chapters, indicating that they have higher mortality rates than reference group. The 35-44 45-54, and 55-64 age groups showed high RR values for Chapters 4 and 9. In 65+ age group we found high RR values for Chapters 4, 9 and 10. In all age groups Chapter 6 consistently exhibit the lowest RR values.
The analysis reveals significant heterogeneity in the relative risk of mortality across age groups and disease chapters over time. Younger age groups (especially 00-14) generally exhibit lower relative risks compared to the 25-34 reference group for most disease chapters. As age increases, the relative risk of mortality generally rises across all considered disease categories, with diseases of the circulatory system (Chapter 9) consistently showing the highest relative risk in older adults. The temporal trends vary by age group and disease chapter, suggesting complex interactions between age, cause of death, and time.
3.3.3. Municipality-Specific Relative Risk (RR) of Mortality over Time
To identify spatial patterns of elevated mortality risk, we computed the number of years in which each municipality showed a statistically significant relative risk (RR > 1, CIL > 1) for each disease chapter between 2000 and 2019. The resulting frequency map reveals municipalities exhibited high frequencies of significant RR, indicating persistent excess mortality risk over the study period. These hotspots were particularly concentrated in Mexico City for Chapters 4, 6, 9 and 10. In Figure 10 are labelled the municipalities that had between 15 to 20 years with significant RR. In contrast, for Chapter 6, municipalities showed few (<10) or no years with significant RR, suggesting relatively lower-than-expected mortality risk. This spatial and temporal aggregation provides a summary view of municipalities with recurrent mortality inequalities and highlights priority areas for further investigation and potential intervention.
4. Discussion
Ore results provide evidence of spatiotemporal patterns in NCD mortality trends within the MAVM over the last two decades at two spatial scales and for the total population and stratified by sex and age groups. At MAVM level, we found that the main trend for all NCD chapters is to increase mortality rates through our time period study, which is in line with global trends reported in low- and middle-income countries undergoing demographic and epidemiological transitions, suggesting a growing burden of non-communicable diseases [24,25]. A strong positive trend was observed mainly for endocrine and metabolic disease (Chapters 4) and diseases of the circulatory system (Chaper 9), where population lifestyles, obesity, hypertension can be important causes associated to this increase[25,26]. This pattern is consistent with increasing rates of cardiovascular mortality reported in urban areas of Latin America [26], where Mexico has stood out for the increase in mortality from these conditions [27].
For Chapters 6 (Diseases of the nervous system) and 10 (Diseases of the respiratory system) we noted a moderate upward trend, which is related to some places and population groups, for which mortality rates are decreasing, as we seen next. However, the absolute number of people affected by these conditions are increased. For Chapter 6 there is an increase of 75% from 2000 t0 2019, whereas for Chapter 10 the increased was 45%; which may reflect growing and ageing populations, or possibly linked to environmental stressors [24]. For Chapter 10, which includes chronic respiratory conditions, the positive trend in mortality could be influenced by exposure to poor air quality episodes like higher levels of particulate matter (PM), and gaseous pollutants (ozone, nitrogen dioxide, and sulphur dioxide) [28], which remain high in many municipalities within the Metropolitan Area of Mexico Valley [29].
In contrast, the lack of significant change in Chapter 5 (Mental and behavioral disorders) could be reflect to underreporting, diagnostic limitations or the chronic and often non-lethal nature of many psychiatric conditions. The relatively low R2 (0.15) suggests high interannual variability and possible data noise, however, there is an increase of 25% of deaths from 2000 to 2019. It may reflect a lack of progress in diagnosis, care access, or data capture for these diseases, which have historically been underprioritized in public health agendas [30,31]. These findings emphasize the importance of tailored public health strategies. Targeted prevention and early detection efforts for metabolic and circulatory diseases appear especially urgent, while further investigation into rising trends in neurological and respiratory conditions is warranted.
By analyzed temporal mortality trends by ICD-10 Chapters, stratified by sex, strong positive trends were observed for both sexes for Chapters 4 and 9, according with the overall pattern observed at population level. Notably, women exhibited consistently higher mortality rates than men in Chapter 9, but these differences are mainly due to deaths in older women (65+), similar to recent observations of cardiovascular disease patterns among older women in other countries [32,33,34,35]. However, toward recent years (after 2017) this difference is reducing by negative tendency observed in RR for women and positive increases of RR in men. RR values for 2018 and 2019 are closed to 1. On the other hand, a marked shift was detected in Chapter 4, where men mortality rates surpassed those of women after 2009. This change could be a result of complex interplay between environmental and behavioral factors, exposure to metabolic risk factors among men, reduced healthcare engagement, or sex-specific differences in access to early diagnosis and treatment [36]. These requires further investigation in future research.
In contrast, no clear temporal trends were identified for Chapters 5 (Mental and behavioral disorders), 6 (Diseases of the nervous system), and 10 (Diseases of the respiratory system) in either sex. Nonetheless, a slight upward trend was observed in Chapter 6 after 2010 for both men and women, which could indicate increasing exposure to neurotoxic environmental pollutants [37,38] or extreme environmental temperatures [39,40]. These findings underscore the dynamic nature of mortality trends and the importance of incorporating sex-disaggregated and disease-specific analyses in public health surveillance. Moreover, the influence of social determinants—such as access to healthcare, socioeconomic status, and environmental exposures—should be considered when interpreting these patterns and designing targeted interventions [41,42].
By stratifying population data by age groups, we noted that age groups over 25 years exhibited the highest mortality rates, with individuals aged 65 and older experiencing the greatest burden. This pattern is consistent with the accumulation of chronic health conditions and increased vulnerability among older adults, highlighting the need for sustained preventive and clinical care in this demographic. However, a notable exception was observed in Chapter 10, where children aged 0–4 years had higher mortality rates than those aged between 5 to 54 years. This early-life vulnerability may be attributed to congenital disorders, nutritional deficiencies, limited access to timely healthcare, or the compounded effects of poverty and environmental exposures. These findings emphasize the importance of addressing social determinants of health across the life course, and particularly the need for early-childhood interventions in underserved communities toward improving early-life health outcomes, especially in respiratory disease [43]. These results reinforce the need to strengthen policies aligned with the Programa Sectorial de Salud 2020–2024 of Mexico, which prioritizes reducing mortality among vulnerable populations—including children and older adults—through improved access to quality healthcare, early diagnosis, and targeted public health strategies [44].
The spatiotemporal dynamics of significant relative risk highlight persistent inequalities in mortality across municipalities. The aggregation of municipalities consistently exhibiting a relative risk (RR) greater than 1 throughout the entire period likely reveals those that experienced sustained structural or environmental conditions contributing to elevated mortality risks from 2000 to 2019 By highlighting municipalities with 15 or more years of high RR values, we identified four spatiotemporal mortality hotspots for ICD-10 Chapters 4, 6, 9, and 10, primarily located in Mexico City. The boroughs that stand out in these hotspots are Gustavo A. Madero, present in all four, and Cuauhtémoc and Miguel Hidalgo, each present in three. Additionally, these boroughs showed positive trends in mortality rates, suggesting a critical need for targeted public health interventions in these identified hotspots.
The persistence of elevated RR in certain municipalities suggests the presence of entrenched determinants like poverty, pollution, or chronic underinvestment in health services [45]. These findings underscore the need for geographically targeted public health interventions and long-term policies that address the structural determinants of health. Furthermore, the clustering of high-risk municipalities across time and disease types indicates that regional strategies may be more effective than isolated municipal efforts [46]. Understanding the spatial persistence of mortality risk not only informs risk prevention and resource allocation but also reflects broader social inequities, reinforcing the importance of equity-focused health policies.
While our analysis offers a detailed spatial and temporal characterization of mortality trends in the Mexico City Metropolitan Area (MAVM), it’s important to acknowledge a few limitations. Firstly, the accuracy of mortality data relies heavily on death certificates; potential misclassification of causes of death could introduce bias, especially concerning chronic diseases. Secondly, analyzing data at the municipal level might mask inequalities within those municipalities. Despite these limitations, our findings provide crucial insights into the spatial disparities in mortality dynamics, offering significant implications for public health planning. Identifying municipalities with increasing mortality trends identifies areas where disease prevention and control efforts are urgently needed. Furthermore, the persistence of high mortality rates in central urban areas highlights the complex interplay between environmental exposures, social vulnerability, and health outcomes. This understanding is vital for developing targeted and effective public health strategies.
5. Conclusions
Our study provides compelling evidence of significant spatial heterogeneity in mortality trends within the Mexico City Metropolitan Area (MAVM) over the past two decades. We found considerable variation in mortality trends across different ICD-10 Chapters, as well as among sex and age groups within each Chapter. Diseases of the circulatory system (Chapter 9) emerged as a particularly concerning area, with a substantial number of municipalities showing increasing mortality trends, especially among older adults. These findings are crucial for identifying specific geographical areas and population subgroups where mortality is either rising or declining. This detailed understanding can directly inform targeted public health interventions and guide future research efforts. From a policy perspective, our results underscore an urgent need for interventions focused on the most affected municipalities, particularly for ICD-10 Chapters 4, 9, and 10. By pinpointing these high-priority areas, public health initiatives can be more effectively designed and implemented to address the unique health challenges of the MAVM.
Author Contributions
Conceptualization, CG-S.; methodology, CG-S KG-G and OG-S.; formal analysis, CG-S and KG-G.; data curation, OG-S and KG-G.; writing—original draft preparation, CG-S.; writing—review and editing, CG-S and KG-G; visualization, KG-G. and OG-S; project administration, CG-S; funding acquisition, CG-S. All authors have read and agreed to the published version of the manuscript.
Funding
This research was funded by Secretaría de Educación, Ciencia, Tecnología e Innovación de la Ciudad De México (SECTEI), grant number SECTEI/134/2024. The APC was funded by SECTEI/134/2024.
Institutional Review Board Statement
Not applicable.
Informed Consent Statement
Not applicable.
Data Availability Statement
The original data presented in the study are openly available in the General Directorate of Epidemiology repository, [http://www.dgis.salud.gob.mx/contenidos/basesdedatos/da_defunciones_gobmx.html, accessed on 17 November 2024].
Conflicts of Interest
The authors declare no conflicts of interest.
Abbreviations
The following abbreviations are used in this manuscript:
| MAVM | Metropolitan Area of Mexico Valley |
| NCD | Non-communicable diseases |
| MR | Mortality rate |
| Average of mortality rates | |
| CI | confidence interval |
| RR | relative risk |
Appendix A

Table A1.
Temporal mortality rate trends for each age group by ICD-10 Chapter.
| Average Mortality Rate (2000-2019) |
Slope | p-value | Trend | |
|---|---|---|---|---|
| Chapter 4 (Endocrine, Nutritional and Metabolic Diseases) | ||||
| 00_04 | 4.6 | -0.300 | 0.0000 | No trend |
| 05_14 | 0.5 | -0.008 | 0.1310 | No trend |
| 15_24 | 1.3 | 0.006 | 0.3045 | No trend |
| 25_34 | 4.3 | 0.046 | 0.0060 | No trend |
| 35_44 | 15.9 | 0.330 | 0.0000 | No trend |
| 45_54 | 60.0 | 0.495 | 0.0000 | No trend |
| 55_64 | 176.4 | 0.444 | 0.0834 | No trend |
| 65+ | 607.6 | -0.844 | 0.4783 | No trend |
| Chapter 5 (Mental, Behavioral and Neurodevelopmental disorders) | ||||
| 00_04 | 0.1 | 0.004 | 0.3106 | No trend |
| 05_14 | 0.1 | 0.008 | 0.4461 | No trend |
| 15_24 | 0.2 | 0.002 | 0.9606 | No trend |
| 25_34 | 1.0 | -0.015 | 0.7101 | No trend |
| 35_44 | 2.4 | -0.013 | 0.7904 | No trend |
| 45_54 | 3.5 | -0.070 | 0.3693 | No trend |
| 55_64 | 4.2 | 0.002 | 0.1542 | No trend |
| 65+ | 14.2 | 0.004 | 0.3790 | No trend |
| Chapter 6 (Disease of the Nervous System) | ||||
| 00_04 | 3.3 | -0.022 | 0.0598 | No trend |
| 05_14 | 1.5 | 0.013 | 0.1052 | No trend |
| 15_24 | 2.6 | 0.041 | 0.0013 | No trend |
| 25_34 | 2.3 | 0.002 | 0.8179 | No trend |
| 35_44 | 3.0 | 0.041 | 0.0131 | No trend |
| 45_54 | 4.3 | 0.042 | 0.0187 | No trend |
| 55_64 | 6.8 | 0.088 | 0.0018 | No trend |
| 65+ | 34.5 | -0.174 | 0.2724 | No trend |
| Chapter 9 (Disease of the Circulatory System) | ||||
| 00_04 | 1.9 | 0.027 | 0.2819 | No trend |
| 05_14 | 0.4 | 0.012 | 0.1136 | No trend |
| 15_24 | 2.5 | 0.060 | 0.0001 | No trend |
| 25_34 | 6.1 | 0.099 | 0.0000 | No trend |
| 35_44 | 16.2 | 0.279 | 0.0000 | No trend |
| 45_54 | 47.0 | 0.287 | 0.0019 | No trend |
| 55_64 | 128.1 | 0.573 | 0.0032 | Positive |
| 65+ | 1034.6 | 3.114 | 0.0054 | Positive |
| Chapter 10 (Disease of Respiratory System) | ||||
| 00_04 | 30.1 | -2.526 | 0.0000 | Negative |
| 05_14 | 0.8 | -0.024 | 0.0317 | No trend |
| 15_24 | 1.4 | -0.010 | 0.2832 | No trend |
| 25_34 | 2.7 | 0.027 | 0.1787 | No trend |
| 35_44 | 5.0 | 0.071 | 0.0616 | No trend |
| 45_54 | 10.9 | 0.111 | 0.0259 | No trend |
| 55_64 | 31.2 | 0.119 | 0.3199 | No trend |
| 65+ | 326.6 | -2.364 | 0.0000 | Negative |
References
- World Health Organization Noncommunicable Diseases Country Profiles 2018; Geneva: World Health Organization, 2018.
- Bennett, J.E.; Stevens, G.A.; Mathers, C.D.; Bonita, R.; Rehm, J.; Kruk, M.E.; Riley, L.M.; Dain, K.; Kengne, A.P.; Chalkidou, K.; et al. NCD Countdown 2030: Worldwide Trends in Non-Communicable Disease Mortality and Progress towards Sustainable Development Goal Target 3.4. The Lancet 2018, 392, 1072–1088. [Google Scholar] [CrossRef]
- Girum, T.; Mesfin, D.; Bedewi, J.; Shewangizaw, M. The Burden of Noncommunicable Diseases in Ethiopia, 2000–2016: Analysis of Evidence from Global Burden of Disease Study 2016 and Global Health Estimates 2016. Int J Chronic Dis 2020, 2020, 1–10. [Google Scholar] [CrossRef] [PubMed]
- Tuoane-Nkhasi, M.; van Eeden, A. Spatial Patterns and Correlates of Mortality Due to Selected Non-Communicable Diseases among Adults in South Africa, 2011. GeoJournal 2017, 82, 1005–1034. [Google Scholar] [CrossRef]
- Bloom, D.E.; Cafiero, E.T.; Jané-Llopis, E.; Abrahams-Gessel, S.; Bloom, L.R.; Fathima, S.; Feigl, A.B.; Gaziano, T.; Mowafi, M.; Pandya, A.; et al. The Global Economic Burden of Non-Communicable Diseases. 2011.
- Capizzi, S.; De Waure, C.; Boccia, S. Global Burden and Health Trends of Non-Communicable Diseases. In A Systematic Review of Key Issues in Public Health; Springer International Publishing, 2015; pp. 19–32 ISBN 9783319136202.
- Roth, G.A.; Abate, D.; Abate, K.H.; Abay, S.M.; Abbafati, C.; Abbasi, N.; Abbastabar, H.; Abd-Allah, F.; Abdela, J.; Abdelalim, A.; et al. Global, Regional, and National Age-Sex-Specific Mortality for 282 Causes of Death in 195 Countries and Territories, 1980–2017: A Systematic Analysis for the Global Burden of Disease Study 2017. The Lancet 2018, 392, 1736–1788. [Google Scholar] [CrossRef] [PubMed]
- Ezzati, M.; Pearson-Stuttard, J.; Bennett, J.E.; Mathers, C.D. Acting on Non-Communicable Diseases in Low- and Middle-Income Tropical Countries. Nature 2018, 559, 507–516. [Google Scholar] [CrossRef]
- Niessen, L.W.; Mohan, D.; Akuoku, J.K.; Mirelman, A.J.; Ahmed, S.; Koehlmoos, T.P.; Trujillo, A.; Khan, J.; Peters, D.H. Tackling Socioeconomic Inequalities and Non-Communicable Diseases in Low-Income and Middle-Income Countries under the Sustainable Development Agenda. The Lancet 2018, 391, 2036–2046. [Google Scholar] [CrossRef] [PubMed]
- Sommer, I.; Griebler, U.; Mahlknecht, P.; Thaler, K.; Bouskill, K.; Gartlehner, G.; Mendis, S. Socioeconomic Inequalities in Non-Communicable Diseases and Their Risk Factors: An Overview of Systematic Reviews. BMC Public Health 2015, 15. [Google Scholar] [CrossRef]
- Wagner, K.H.; Brath, H. A Global View on the Development of Non Communicable Diseases. Prev Med (Baltim) 2012, 54. [Google Scholar] [CrossRef]
- Girum, T.; Mesfin, D.; Bedewi, J.; Shewangizaw, M. The Burden of Noncommunicable Diseases in Ethiopia, 2000–2016: Analysis of Evidence from Global Burden of Disease Study 2016 and Global Health Estimates 2016. Int J Chronic Dis 2020, 2020, 1–10. [Google Scholar] [CrossRef]
- Shadmani, F.K.; Farzadfar, F.; Larijani, B.; Mirzaei, M.; Haghdoost, A.A. Trend and Projection of Mortality Rate Due to Non-Communicable Diseases in Iran: A Modeling Study. PLoS One 2019, 14. [Google Scholar] [CrossRef]
- Aceves, B.; Ingram, M.; Nieto, C.; de Zapien, J.G.; Rosales, C. Non-Communicable Disease Prevention in Mexico: Policies, Programs and Regulations. Health Promot Int 2021, 35, 409–421. [Google Scholar] [CrossRef]
- Barquera, S.; Campos-Nonato, I.; Hernández-Barrera, L. Prevalencia de Obesidad En Adultos Mexicanos, ENSANUT 2012. Salud Publica Mex 2013, 55, 151. [Google Scholar] [CrossRef]
- Rtveladze, K.; Marsh, T.; Barquera, S.; Sanchez Romero, L.M. aria; Levy, D.; Melendez, G.; Webber, L.; Kilpi, F.; McPherson, K.; Brown, M. Obesity Prevalence in Mexico: Impact on Health and Economic Burden. Public Health Nutr 2014, 17, 233–239. [Google Scholar] [CrossRef] [PubMed]
- Secretaría de Desarrollo Agrario Territorial y Urbano Sistema Urbano Nacional 2018; Mexico, 2018;
- Instituto Nacional de Estadística y Geografía Censo de Población y Vivienda 2020; Mexico, 2020;
- Centers for Medicare & Medicaid Services & National Center for Health Statistics ICD-10-CM Official Guidelines for Coding and Reporting FY 2024 (Updated April 1, 2024); U.S. Department of Health and Human Services, 2024;
- Consejo Nacional de Población Población de Los Municipios 1990-2040 (Bases de Datos); CONAPO. México, 2024;
- Lemaitre, M.; Carrat, F. Comparative Age Distribution of Influenza Morbidity and Mortality during Seasonal Influenza Epidemics and the 2009 H1N1 Pandemic. BMC Infect Dis 2010, 10, 162. [Google Scholar] [CrossRef]
- Sorenson, S.B. Gender Disparities in Injury Mortality: Consistent, Persistent, and Larger than You’d Think. Am J Public Health 2011, 101. [Google Scholar] [CrossRef] [PubMed]
- Morris, J.A.; Gardner, M.J. Calculating Confidence Intervals for Relative Risks (Odds Ratios) and Standardised Ratios and Rates. Br Med J 1988, 296. [Google Scholar] [CrossRef]
- Feigin, V.L.; Nichols, E.; Alam, T.; Bannick, M.S.; Beghi, E.; Blake, N.; Culpepper, W.J.; Dorsey, E.R.; Elbaz, A.; Ellenbogen, R.G.; et al. Global, Regional, and National Burden of Neurological Disorders, 1990–2016: A Systematic Analysis for the Global Burden of Disease Study 2016. Lancet Neurol 2019, 18, 459–480. [Google Scholar] [CrossRef]
- Taheri Soodejani, M. Non-Communicable Diseases in the World over the Past Century: A Secondary Data Analysis. Front Public Health 2024, 12. [Google Scholar] [CrossRef]
- Paiva, A.S.S.; Bilal, U.; Andrade, R.F.S.; Neto, C.C.C.; de Sousa Filho, J.F.; Santos, G.F.; Barreto, M.L.; Rodriguez, D.A.; Mullachery, P.; Sanchez, B.; et al. Scaling of Cardiovascular Risk Factors in 230 Latin American Cities. Sci Rep 2025, 15. [Google Scholar] [CrossRef]
- Bilal, U.; de Castro, C.P.; Alfaro, T.; Barrientos-Gutierrez, T.; Barreto, M.L.; Leveau, C.M.; Martinez-Folgar, K.; Miranda, J.J.; Montes, F.; Mullachery, P.; et al. Scaling of Mortality in 742 Metropolitan Areas of the Americas. Sci Adv 2021, 7, 6325. [Google Scholar] [CrossRef]
- Guarnieri, M.; Balmes, J.R. Outdoor Air Pollution and Asthma. The Lancet 2014, 383, 1581–1592. [Google Scholar] [CrossRef] [PubMed]
- Raga, G.B.; Baumgardner, D.; Castro, T.; Martínez-Arroyo, A.; Navarro-González, R. Mexico City Air Quality: A Qualitative Review of Gas and Aerosol Measurements (1960–2000). Atmos Environ 2001, 35, 4041–4058. [Google Scholar] [CrossRef]
- Patel, V.; Chisholm, D.; Parikh, R.; Charlson, F.J.; Degenhardt, L.; Dua, T.; Ferrari, A.J.; Hyman, S.; Laxminarayan, R.; Levin, C.; et al. Addressing the Burden of Mental, Neurological, and Substance Use Disorders: Key Messages from Disease Control Priorities, 3rd Edition. The Lancet 2016, 387, 1672–1685. [Google Scholar] [CrossRef]
- Mahomed, F. Addressing the Problem of Severe Underinvestment in Mental Health and Well-Being from a Human Rights Perspective. Health Hum Rights 2020, 22, 35–49. [Google Scholar]
- Bots, S.H.; Peters, S.A.E.; Woodward, M.; Sanne, D.; Peters, A.E. Sex Differences in Coronary Heart Disease and Stroke Mortality: A Global Assessment of the Effect of Ageing between 1980 and 2010. BMJ Glob Health 2017, 2, 298. [Google Scholar] [CrossRef]
- Mikkola, T.S.; Gissler, M.; Merikukka, M.; Tuomikoski, P.; Ylikorkala, O. Sex Differences in Age-Related Cardiovascular Mortality. PLoS One 2013, 8. [Google Scholar] [CrossRef]
- Li, J.; Pandian, V.; Davidson, P.M.; Song, Y.; Chen, N.; Fong, D.Y.T. Burden and Attributable Risk Factors of Non-Communicable Diseases and Subtypes in 204 Countries and Territories, 1990–2021: A Systematic Analysis for the Global Burden of Disease Study 2021. International Journal of Surgery 2025, 111, 2385–2397. [Google Scholar] [CrossRef] [PubMed]
- Roth, G.A.; Johnson, C.; Abajobir, A.; Abd-Allah, F.; Abera, S.F.; Abyu, G.; Ahmed, M.; Aksut, B.; Alam, T.; Alam, K.; et al. Global, Regional, and National Burden of Cardiovascular Diseases for 10 Causes, 1990 to 2015. J Am Coll Cardiol 2017, 70, 1–25. [Google Scholar] [CrossRef]
- Stanaway, J.D.; Afshin, A.; Gakidou, E.; Lim, S.S.; Abate, D.; Abate, K.H.; Abbafati, C.; Abbasi, N.; Abbastabar, H.; Abd-Allah, F.; et al. Global, Regional, and National Comparative Risk Assessment of 84 Behavioural, Environmental and Occupational, and Metabolic Risks or Clusters of Risks for 195 Countries and Territories, 1990–2017: A Systematic Analysis for the Global Burden of Disease Study 2017. The Lancet 2018, 392, 1923–1994. [Google Scholar] [CrossRef]
- Grandjean, P.; Landrigan, P.J. Neurobehavioural Effects of Developmental Toxicity. Lancet Neurol 2014, 13, 330–338. [Google Scholar] [CrossRef]
- Fuller, R.; Landrigan, P.J.; Balakrishnan, K.; Bathan, G.; Bose-O’Reilly, S.; Brauer, M.; Caravanos, J.; Chiles, T.; Cohen, A.; Corra, L.; et al. Pollution and Health: A Progress Update. Lancet Planet Health 2022, 6, e535–e547. [Google Scholar] [CrossRef] [PubMed]
- Su, X.; Song, H.; Cheng, Y.; Yao, X.; Li, Y. The Mortality Burden of Nervous System Diseases Attributed to Ambient Temperature: A Multi-City Study in China. Science of the Total Environment 2021, 800. [Google Scholar] [CrossRef] [PubMed]
- Lin, S.Y.; Ng, C.F.S.; Kim, Y.; Htay, Z.W.; Cao, A.Q.; Pan, R.; Hashizume, M. Ambient Temperature and Nervous System Diseases-Related Mortality in Japan from 2010 to 2019: A Time-Stratified Case-Crossover Analysis. Science of The Total Environment 2023, 867, 161464. [Google Scholar] [CrossRef] [PubMed]
- Vogel, B.; Acevedo, M.; Appelman, Y.; Bairey Merz, C.N.; Chieffo, A.; Figtree, G.A.; Guerrero, M.; Kunadian, V.; Lam, C.S.P.; Maas, A.H.E.M.; et al. The Lancet Women and Cardiovascular Disease Commission: Reducing the Global Burden by 2030. The Lancet 2021, 397, 2385–2438. [Google Scholar] [CrossRef]
- Diez Roux, A. V. Conceptual Approaches to the Study of Health Disparities. In Proceedings of the Annual Review of Public Health; April 21 2012; Vol. 33; pp. 41–58. [Google Scholar]
- Argumedo, G.; Cruz-Casarrubias, C.A.; Bonvecchio-Arenas, A.; Jáuregui, A.; Saavedra-Romero, A.; Martínez-Montañez, O.G.; Meléndez-Irigoyen, M.T.; Karam-Araujo, R.; Uribe-Carvajal, R.; Olvera, A.; et al. Towards the Design of Healthy Living, a New Curriculum for Basic Education in Mexico. Salud Publica Mex 2023, 65, 82–92. [Google Scholar] [CrossRef]
- Secretaría de Salud Programa Sectorial Derivado Del Plan Nacional de Desarrollo 2019-2024. Diario Oficial de la Federación. 2020.
- Cacciatore, S.; Mao, S.; Nuñez, M.V.; Massaro, C.; Spadafora, L.; Bernardi, M.; Perone, F.; Sabouret, P.; Biondi-Zoccai, G.; Banach, M.; et al. Urban Health Inequities and Healthy Longevity: Traditional and Emerging Risk Factors across the Cities and Policy Implications. Aging Clin Exp Res 2025, 37. [Google Scholar] [CrossRef]
- Cummins, S.; Curtis, S.; Diez-Roux, A. V.; Macintyre, S. Understanding and Representing “place” in Health Research: A Relational Approach. Soc Sci Med 2007, 65, 1825–1838. [Google Scholar] [CrossRef]
Figure 1.
Map of the Metropolitan Area of the Mexico Valley, showing the boundaries of municipalities included in the study.
Figure 1.
Map of the Metropolitan Area of the Mexico Valley, showing the boundaries of municipalities included in the study.
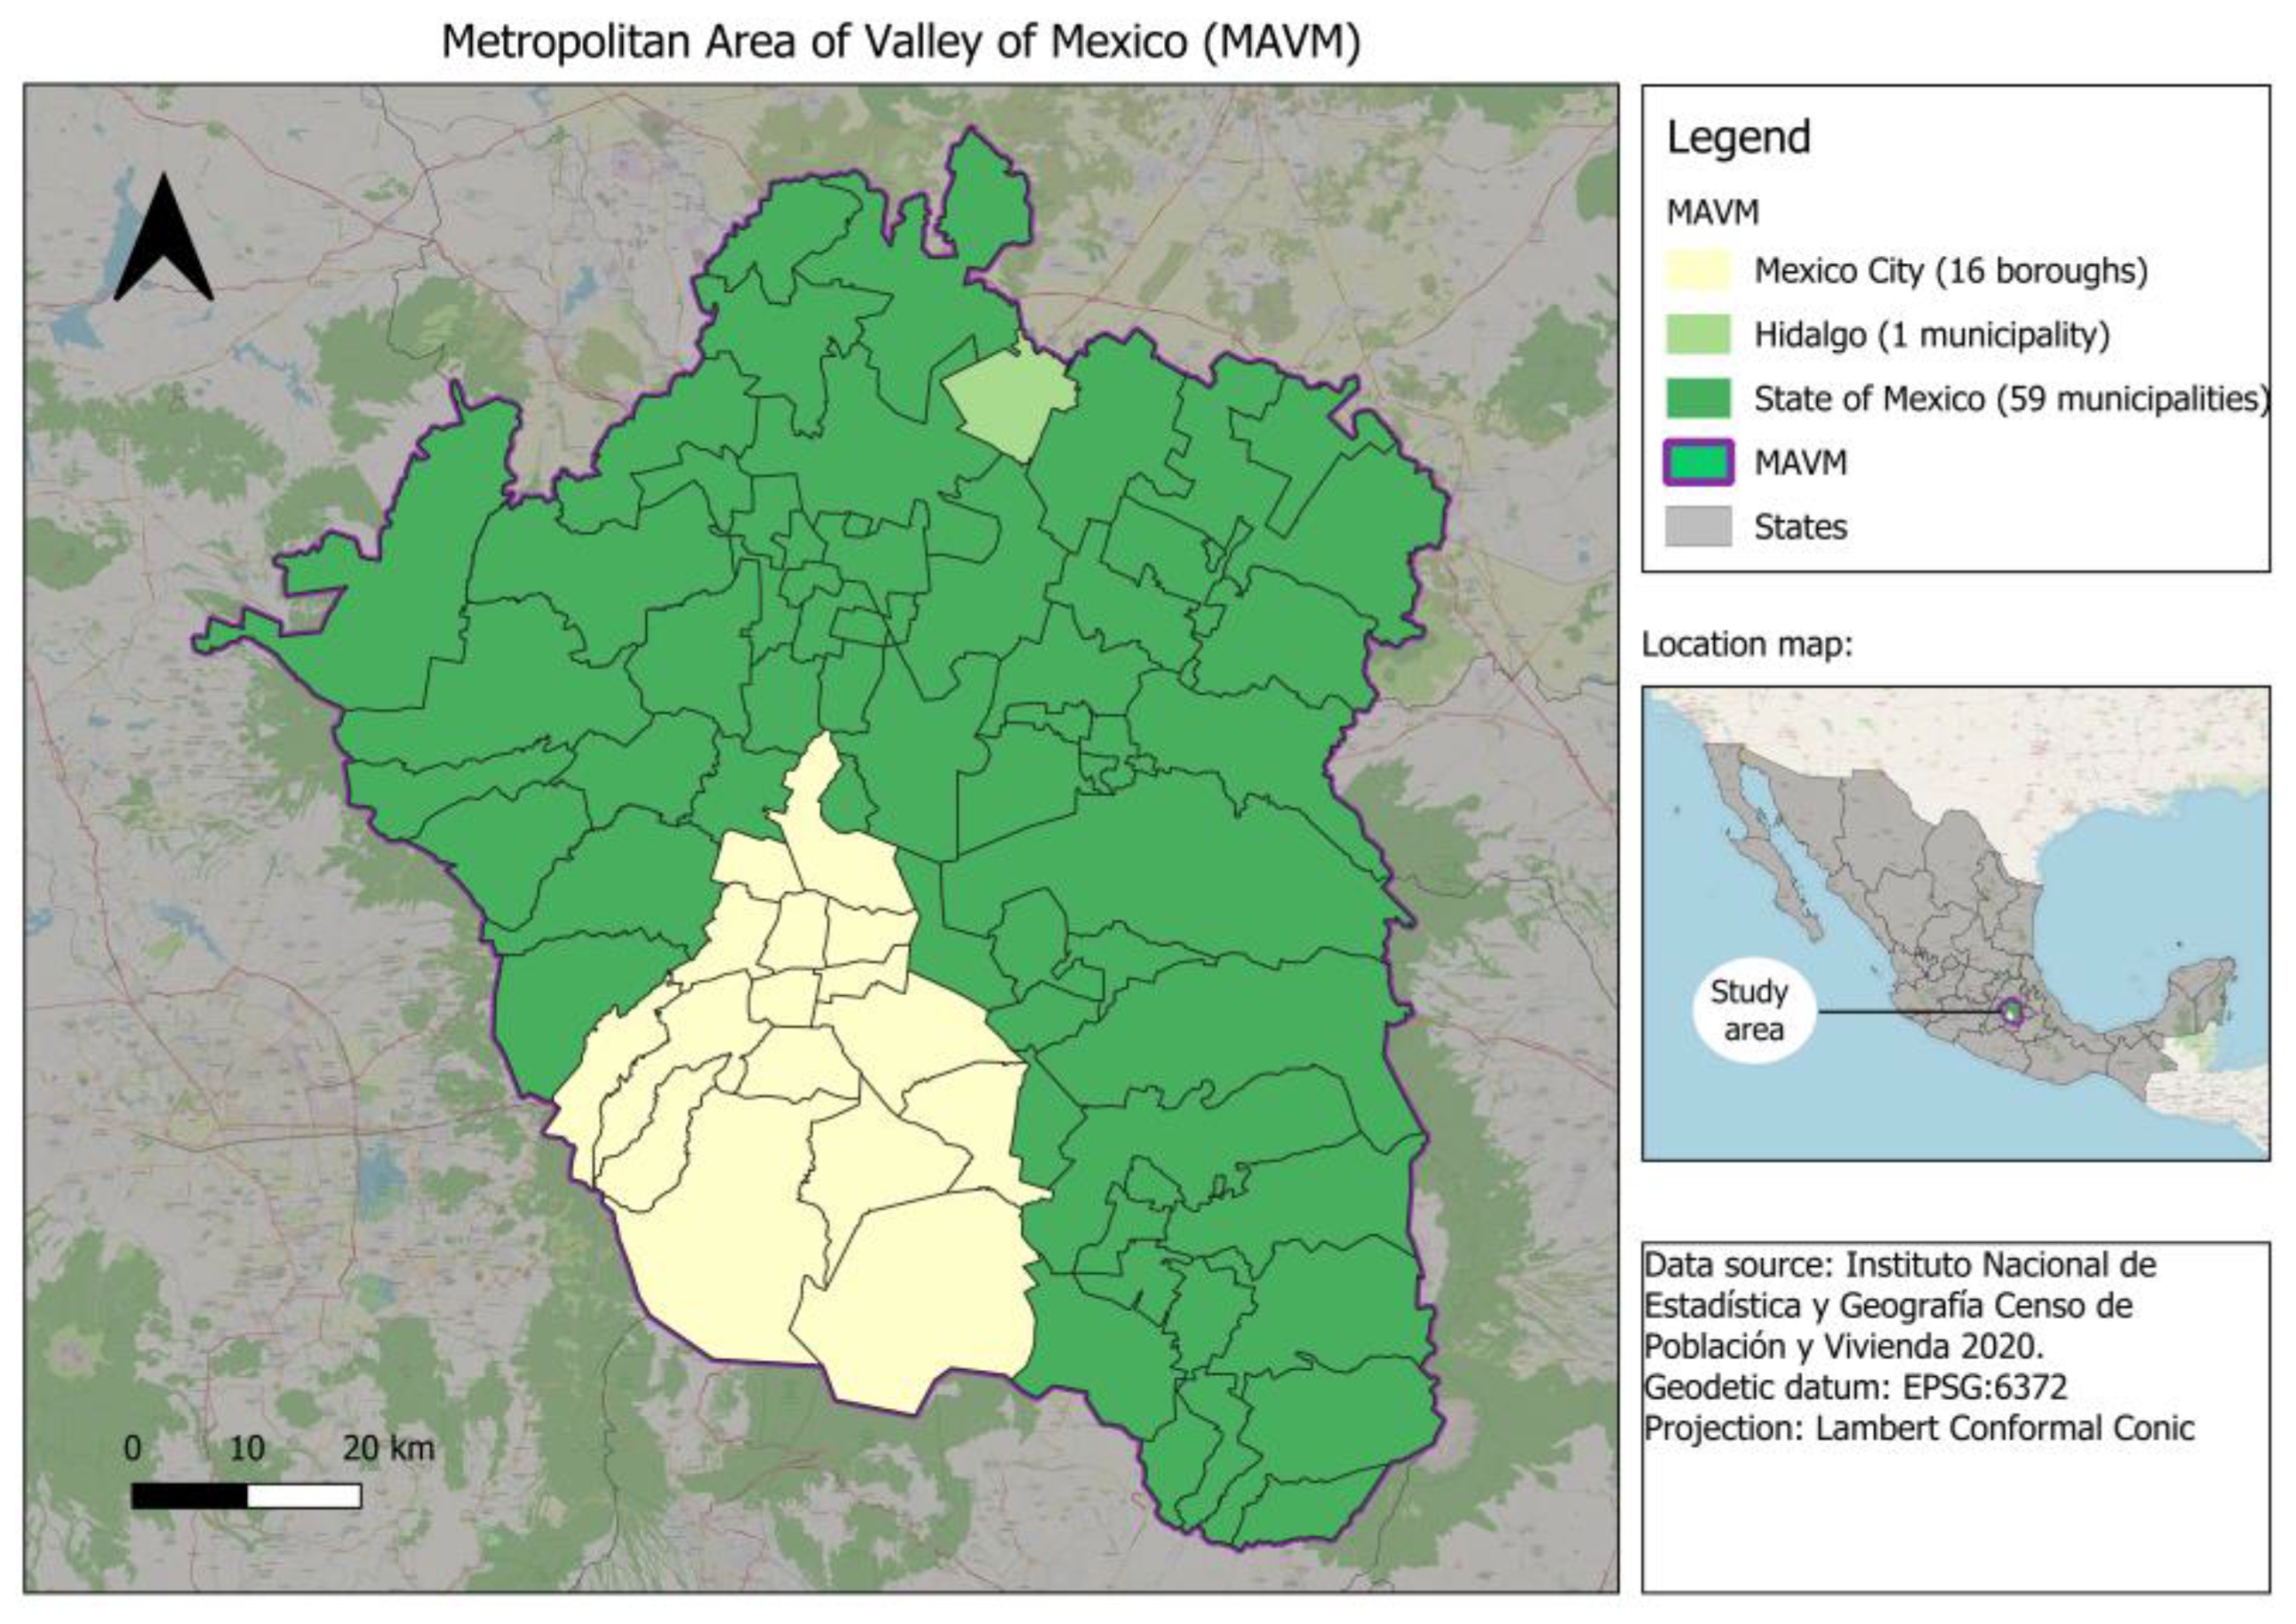
Figure 2.
Temporal trends in mortality rates (per 100,000 inhabitants) for non-communicable diseases in the MAVM between 2000 and 2019. Chapter 4 (Endocrine, Nutritional and Metabolic Diseases), Chapter 5 (Mental, Behavioral and Neurodevelopmental disorders), Chapter 6 (Disease of the Nervous System), Chapter 9 (Disease of the Circulatory System), Chapter 10 (Disease of Respiratory System).
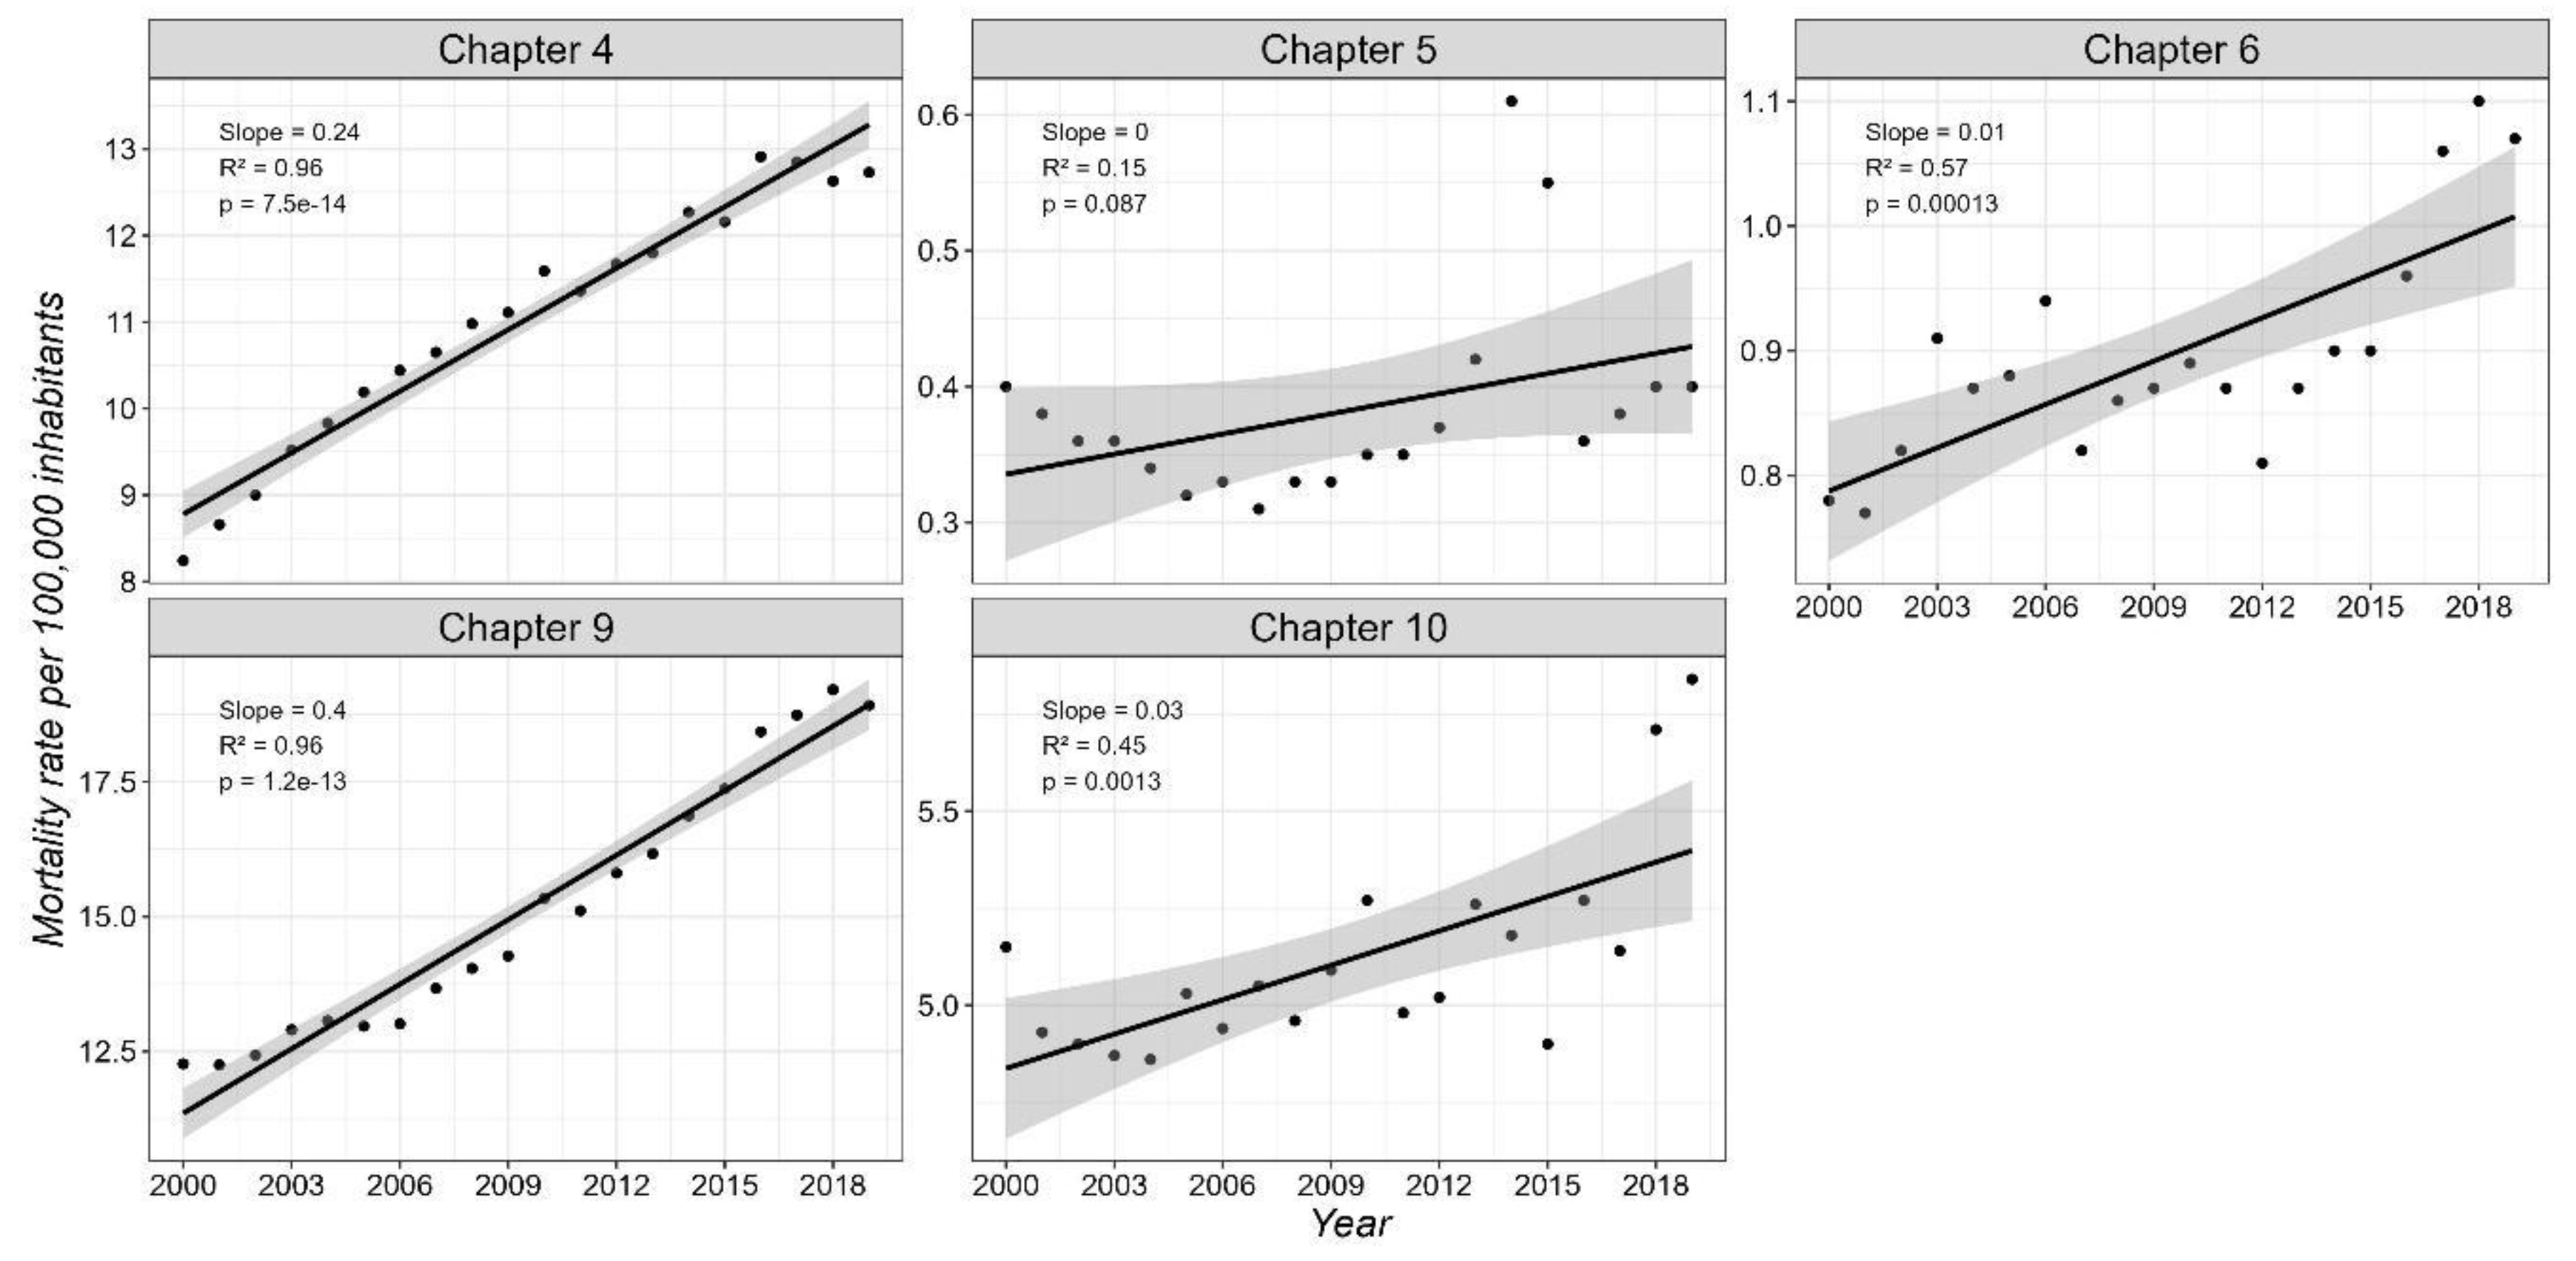
Figure 3.
Temporal trends in mortality rates (per 100,000 inhabitants) by sex for non-communicable diseases in the MAVM between 2000 and 2019. Chapter 4 (Endocrine, Nutritional and Metabolic Diseases), Chapter 5 (Mental, Behavioral and Neurodevelopmental disorders), Chapter 6 (Disease of the Nervous System), Chapter 9 (Disease of the Circulatory System), Chapter 10 (Disease of Respiratory System.
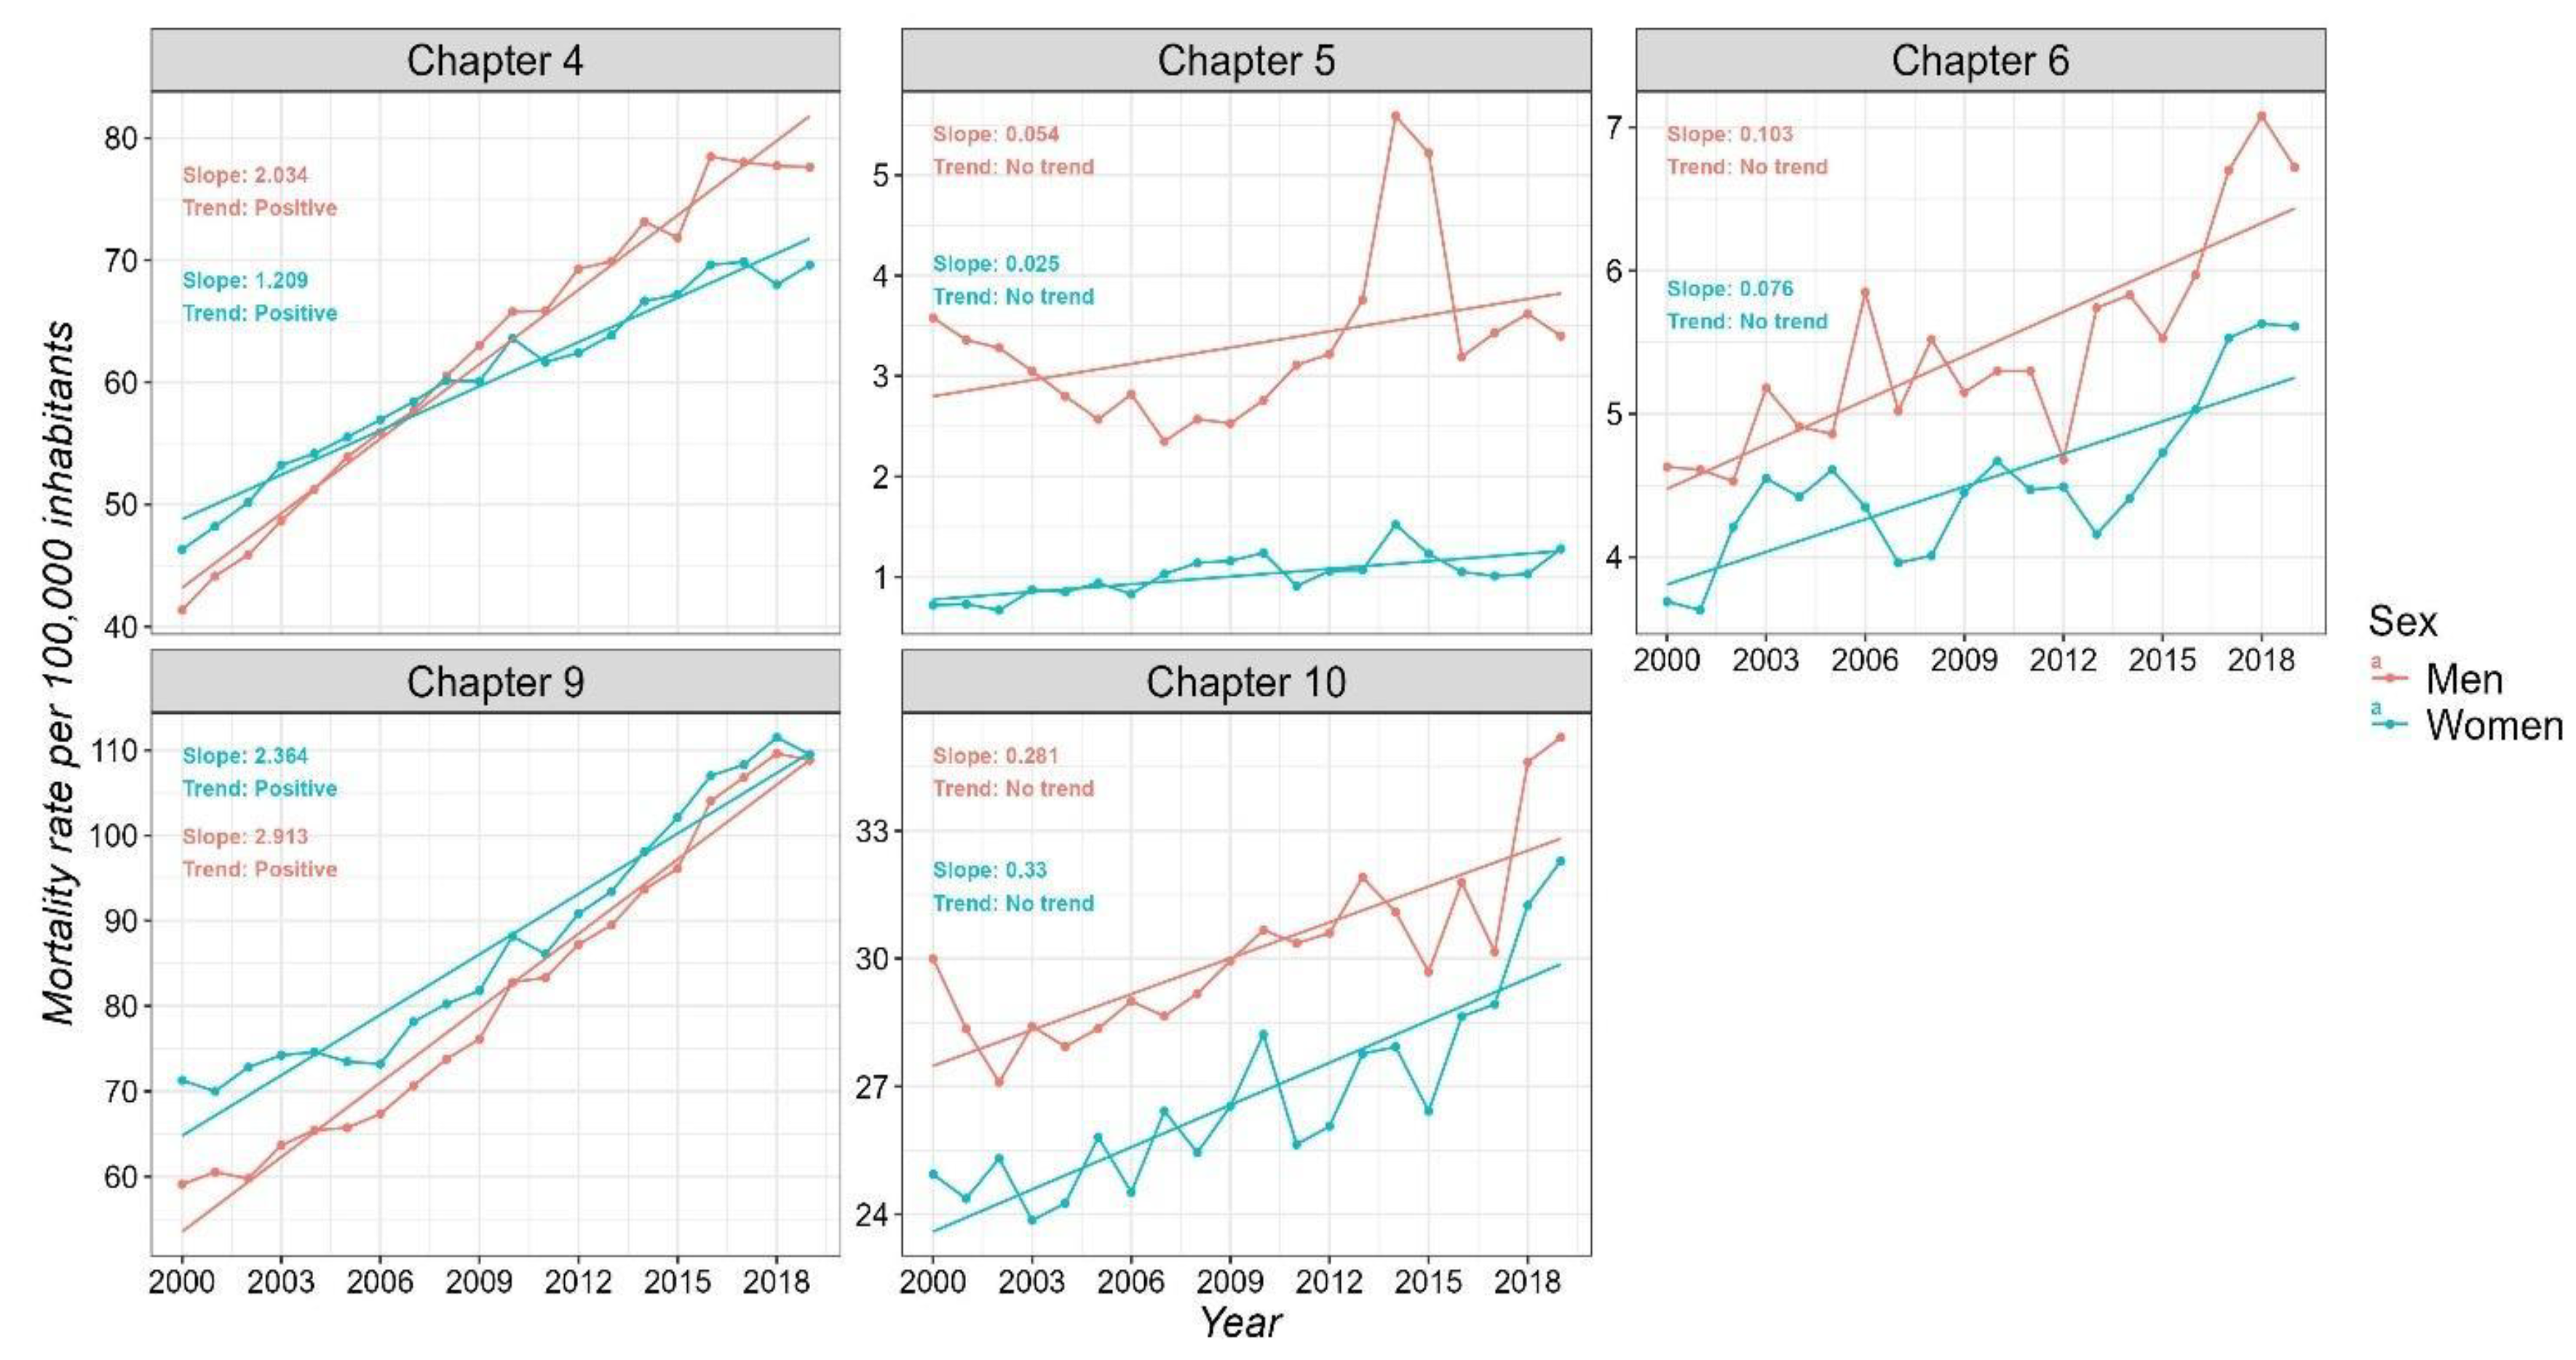
Figure 4.
Temporal trends in mortality rates (per 100,000 inhabitants) by age groups for non-communicable diseases in the MAVM between 2000 and 2019. Chapter 4 (Endocrine, Nutritional and Metabolic Diseases), Chapter 5 (Mental, Behavioral and Neurodevelopmental disorders), Chapter 6 (Disease of the Nervous System), Chapter 9 (Disease of the Circulatory System), Chapter 10 (Disease of Respiratory System.
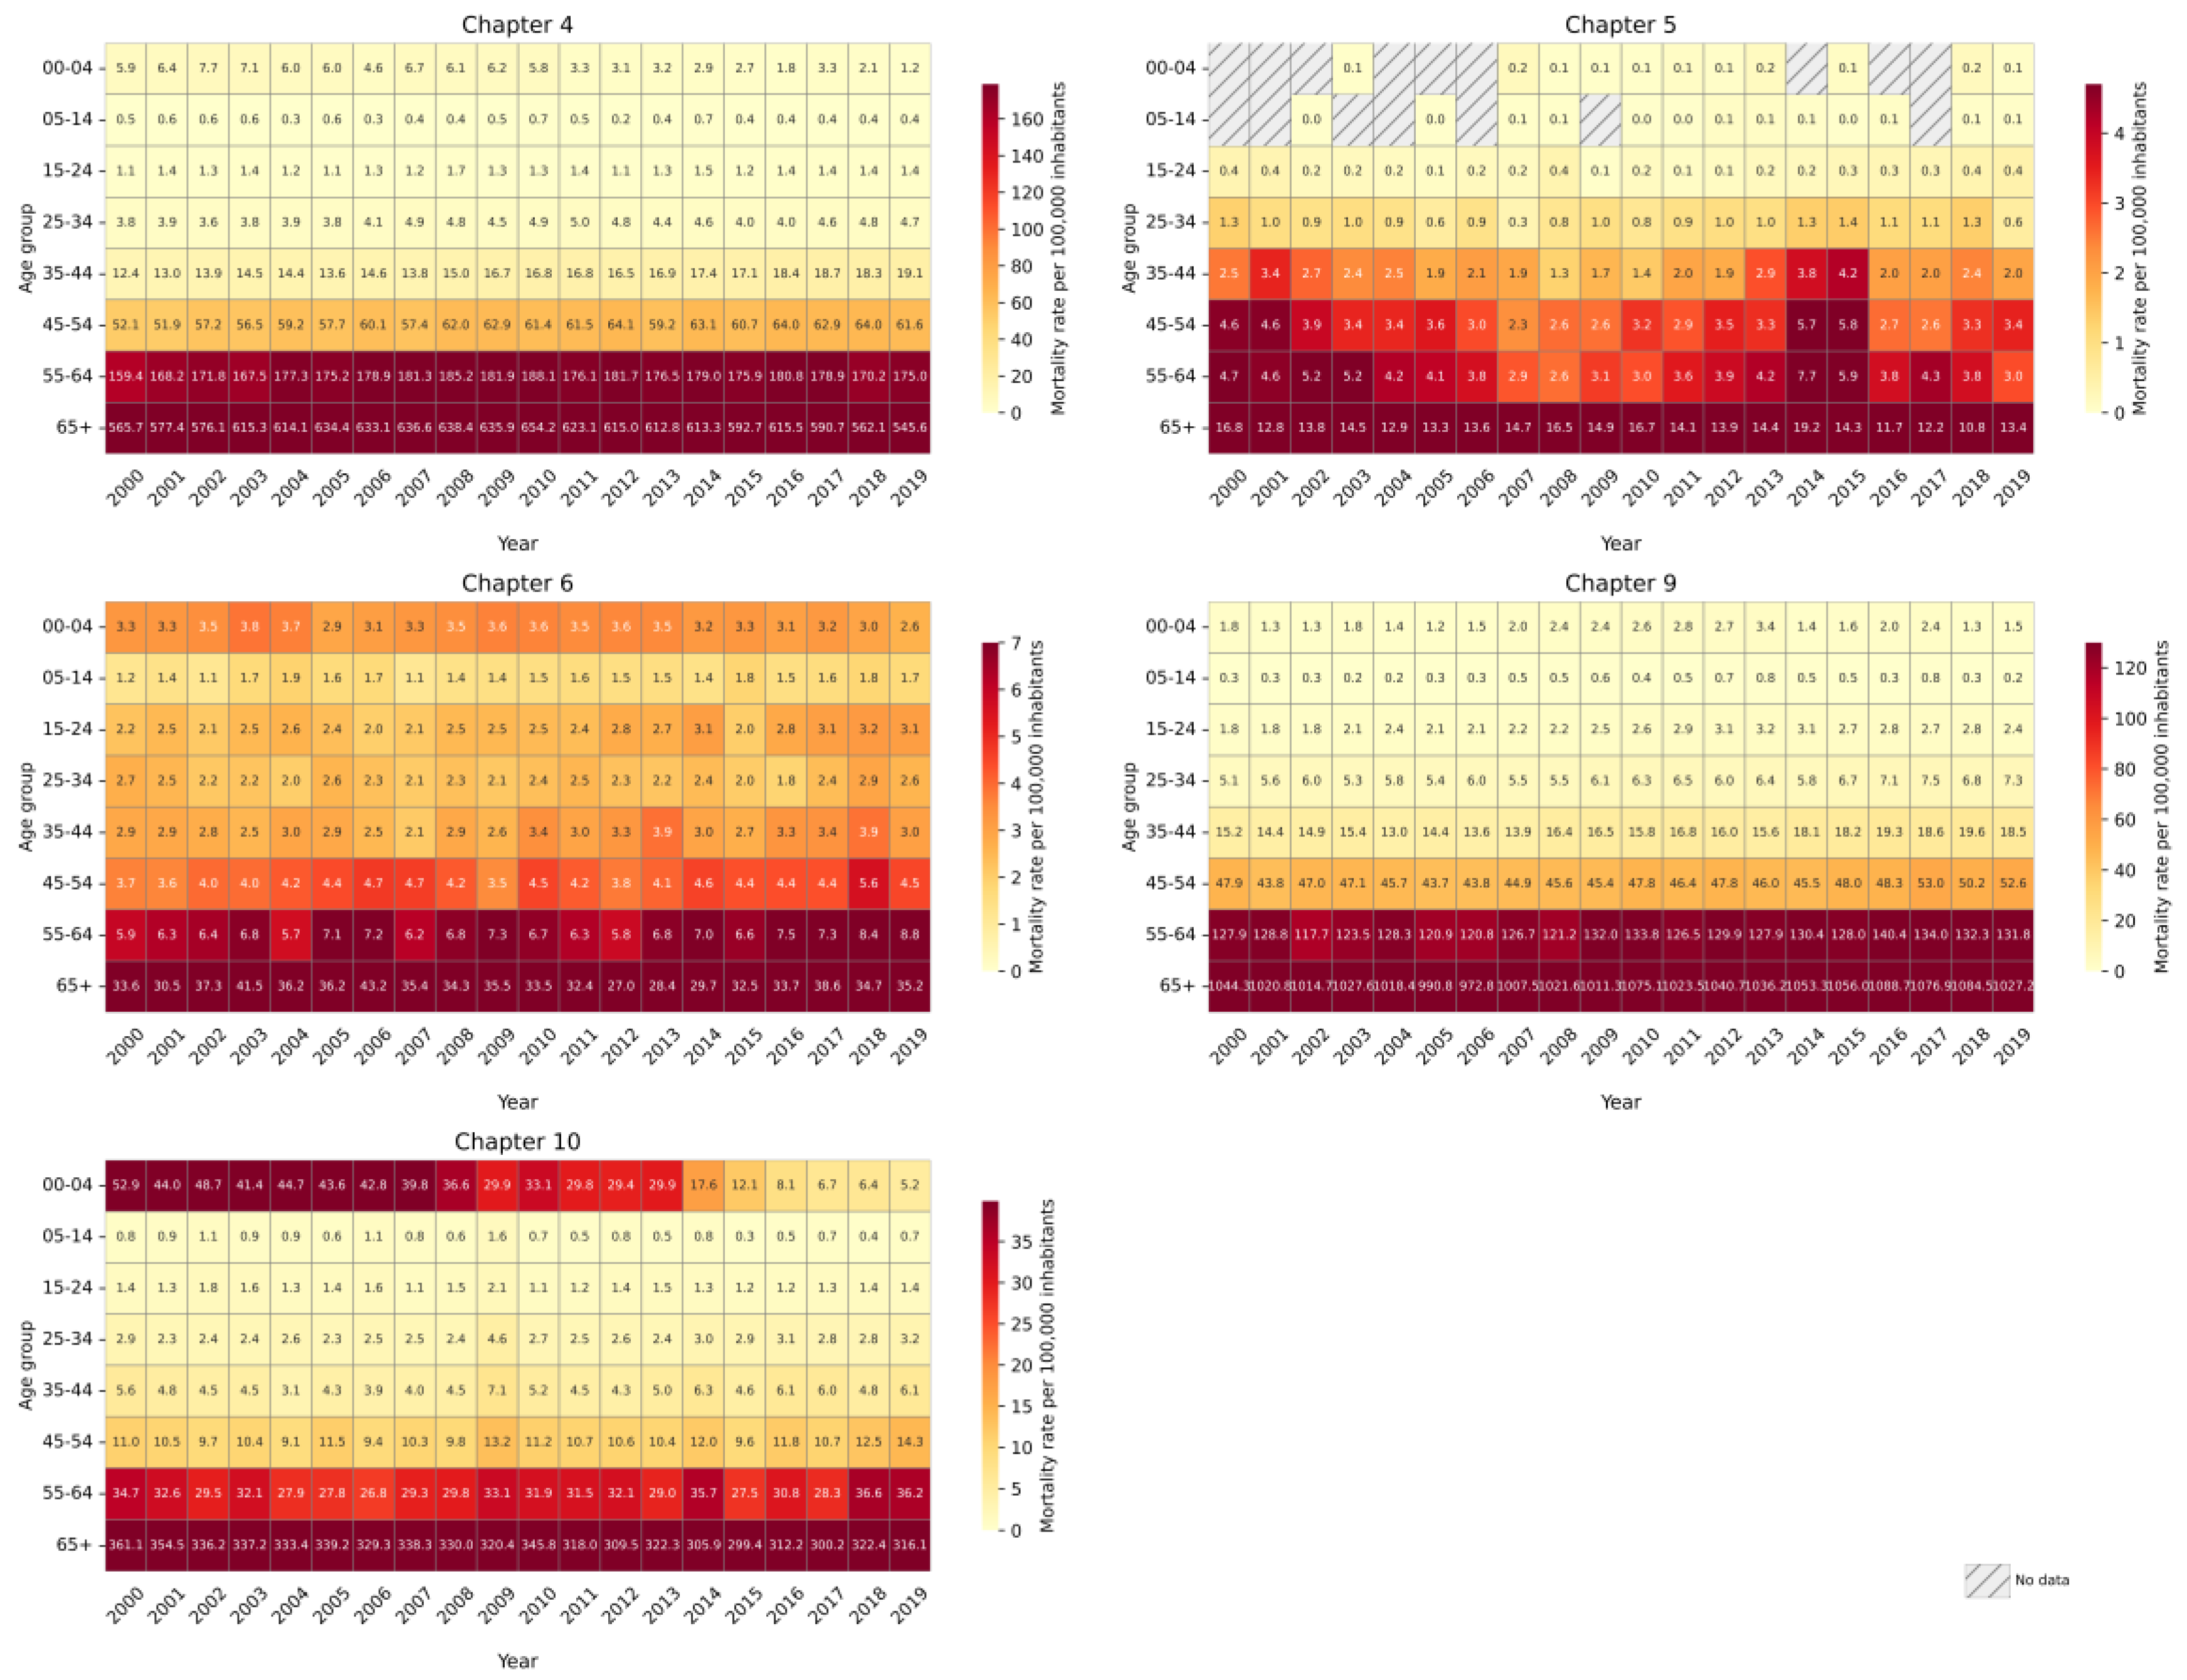
Figure 5.
Trends in non-communicable disease mortality across municipalities of MAVM for the total population. Chapter 4 (Endocrine, Nutritional and Metabolic Diseases), Chapter 5 (Mental, Behavioral and Neurodevelopmental disorders), Chapter 6 (Disease of the Nervous System), Chapter 9 (Disease of the Circulatory System), Chapter 10 (Disease of Respiratory System).
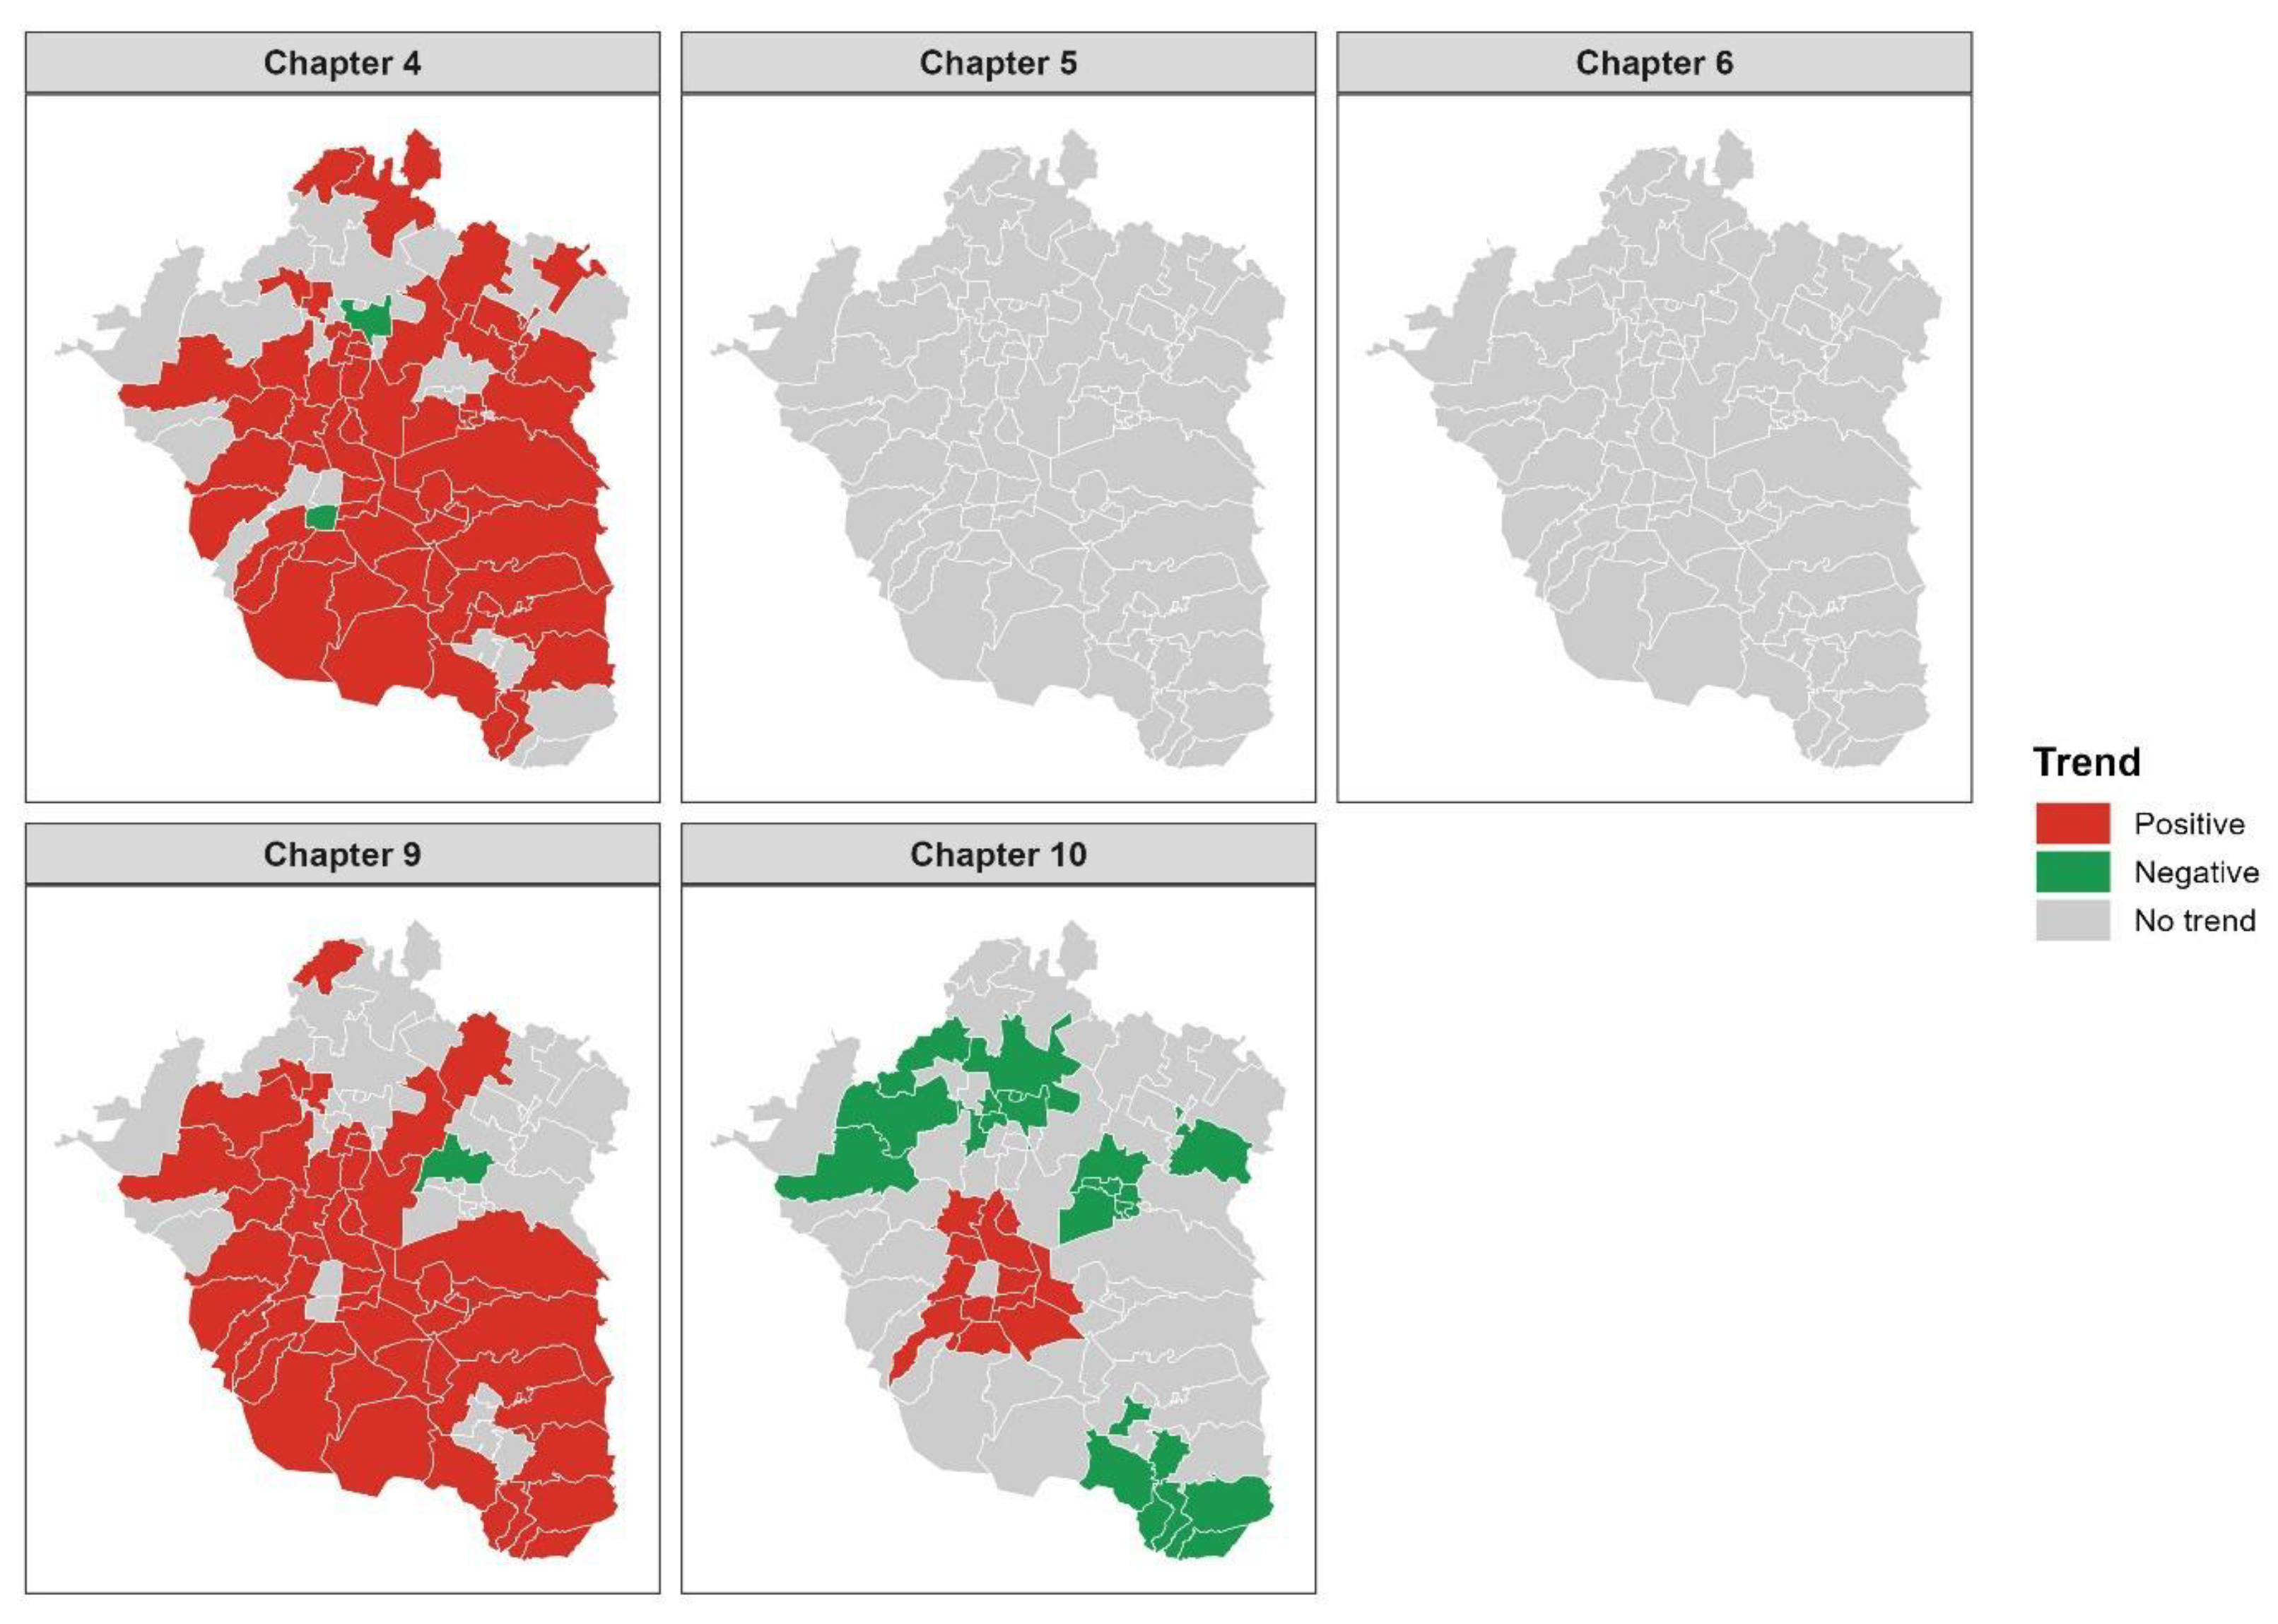
Figure 6.
Spatial distribution of mortality trends by sex in the MAVM at municipal level (2000–2019). Chapter 4 (Endocrine, Nutritional and Metabolic Diseases), Chapter 5 (Mental, Behavioral and Neurodevelopmental disorders), Chapter 6 (Disease of the Nervous System), Chapter 9 (Disease of the Circulatory System), Chapter 10 (Disease of Respiratory System).
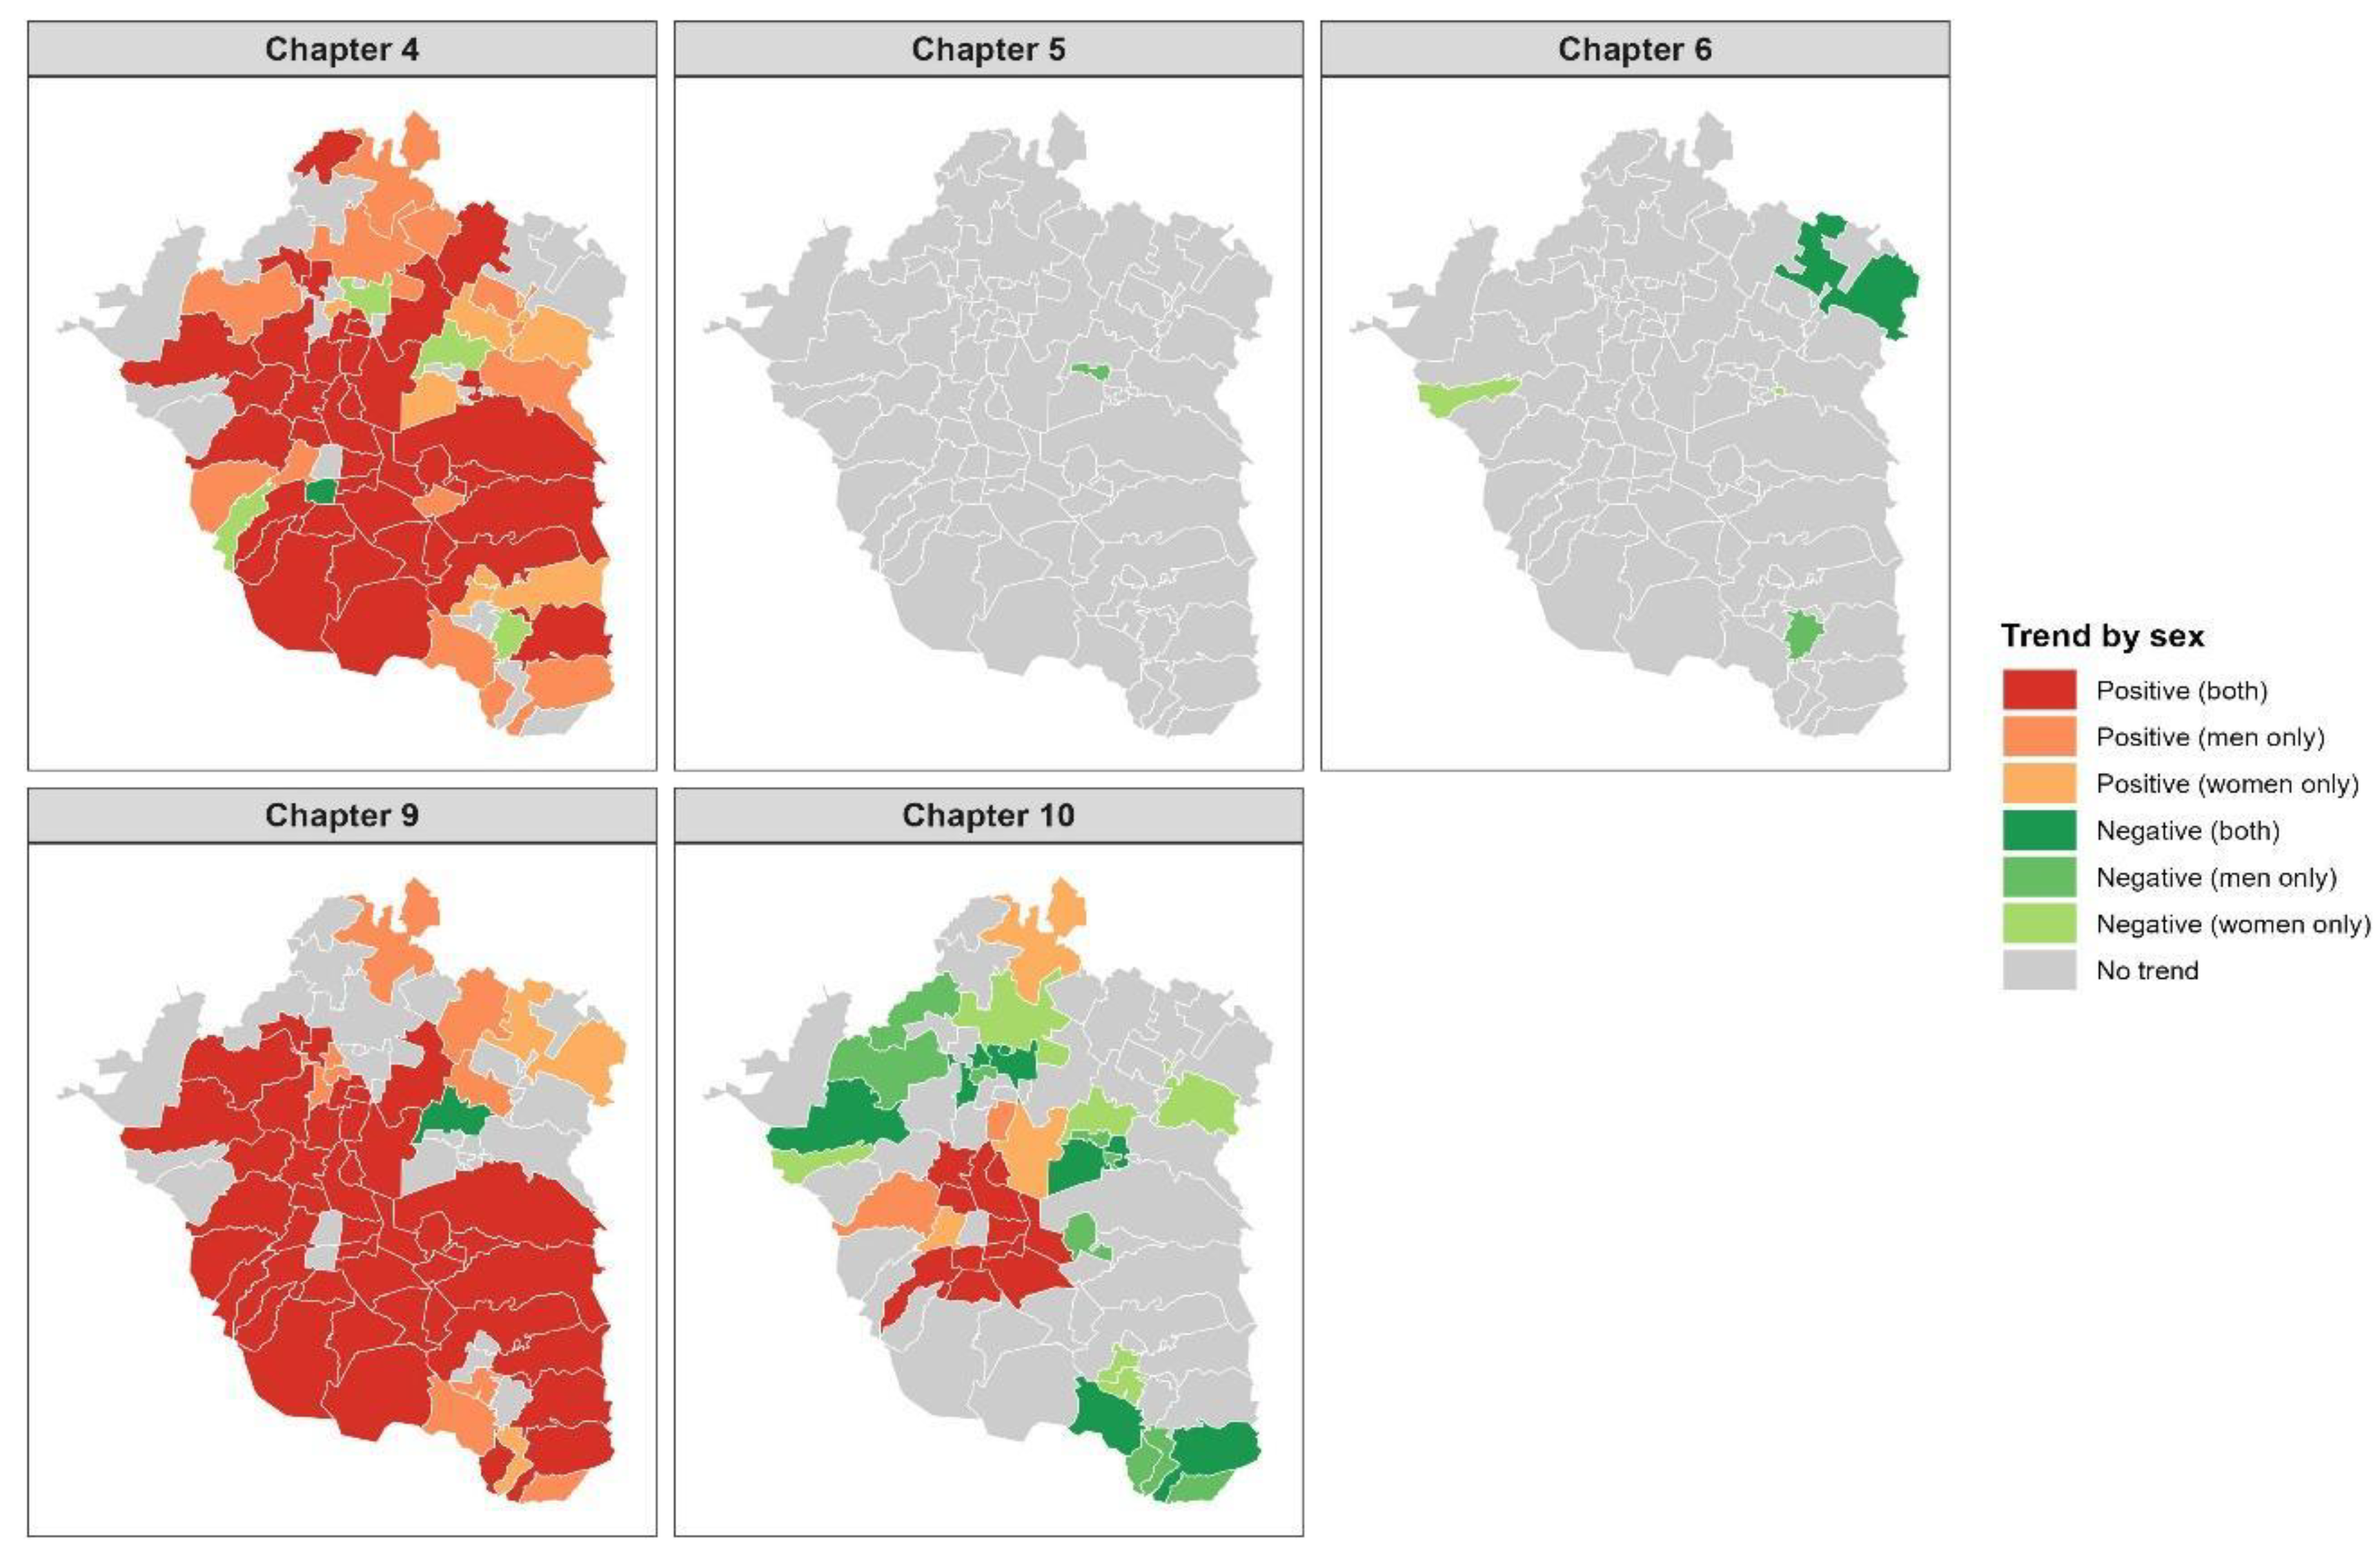
Figure 7.
Temporal trends in mortality at the municipal level, stratified by age group and ICD-10 disease chapter. Chapter 4 (Endocrine, Nutritional and Metabolic Diseases), Chapter 5 (Mental, Behavioral and Neurodevelopmental disorders), Chapter 6 (Disease of the Nervous System), Chapter 9 (Disease of the Circulatory System), Chapter 10 (Disease of Respiratory System.
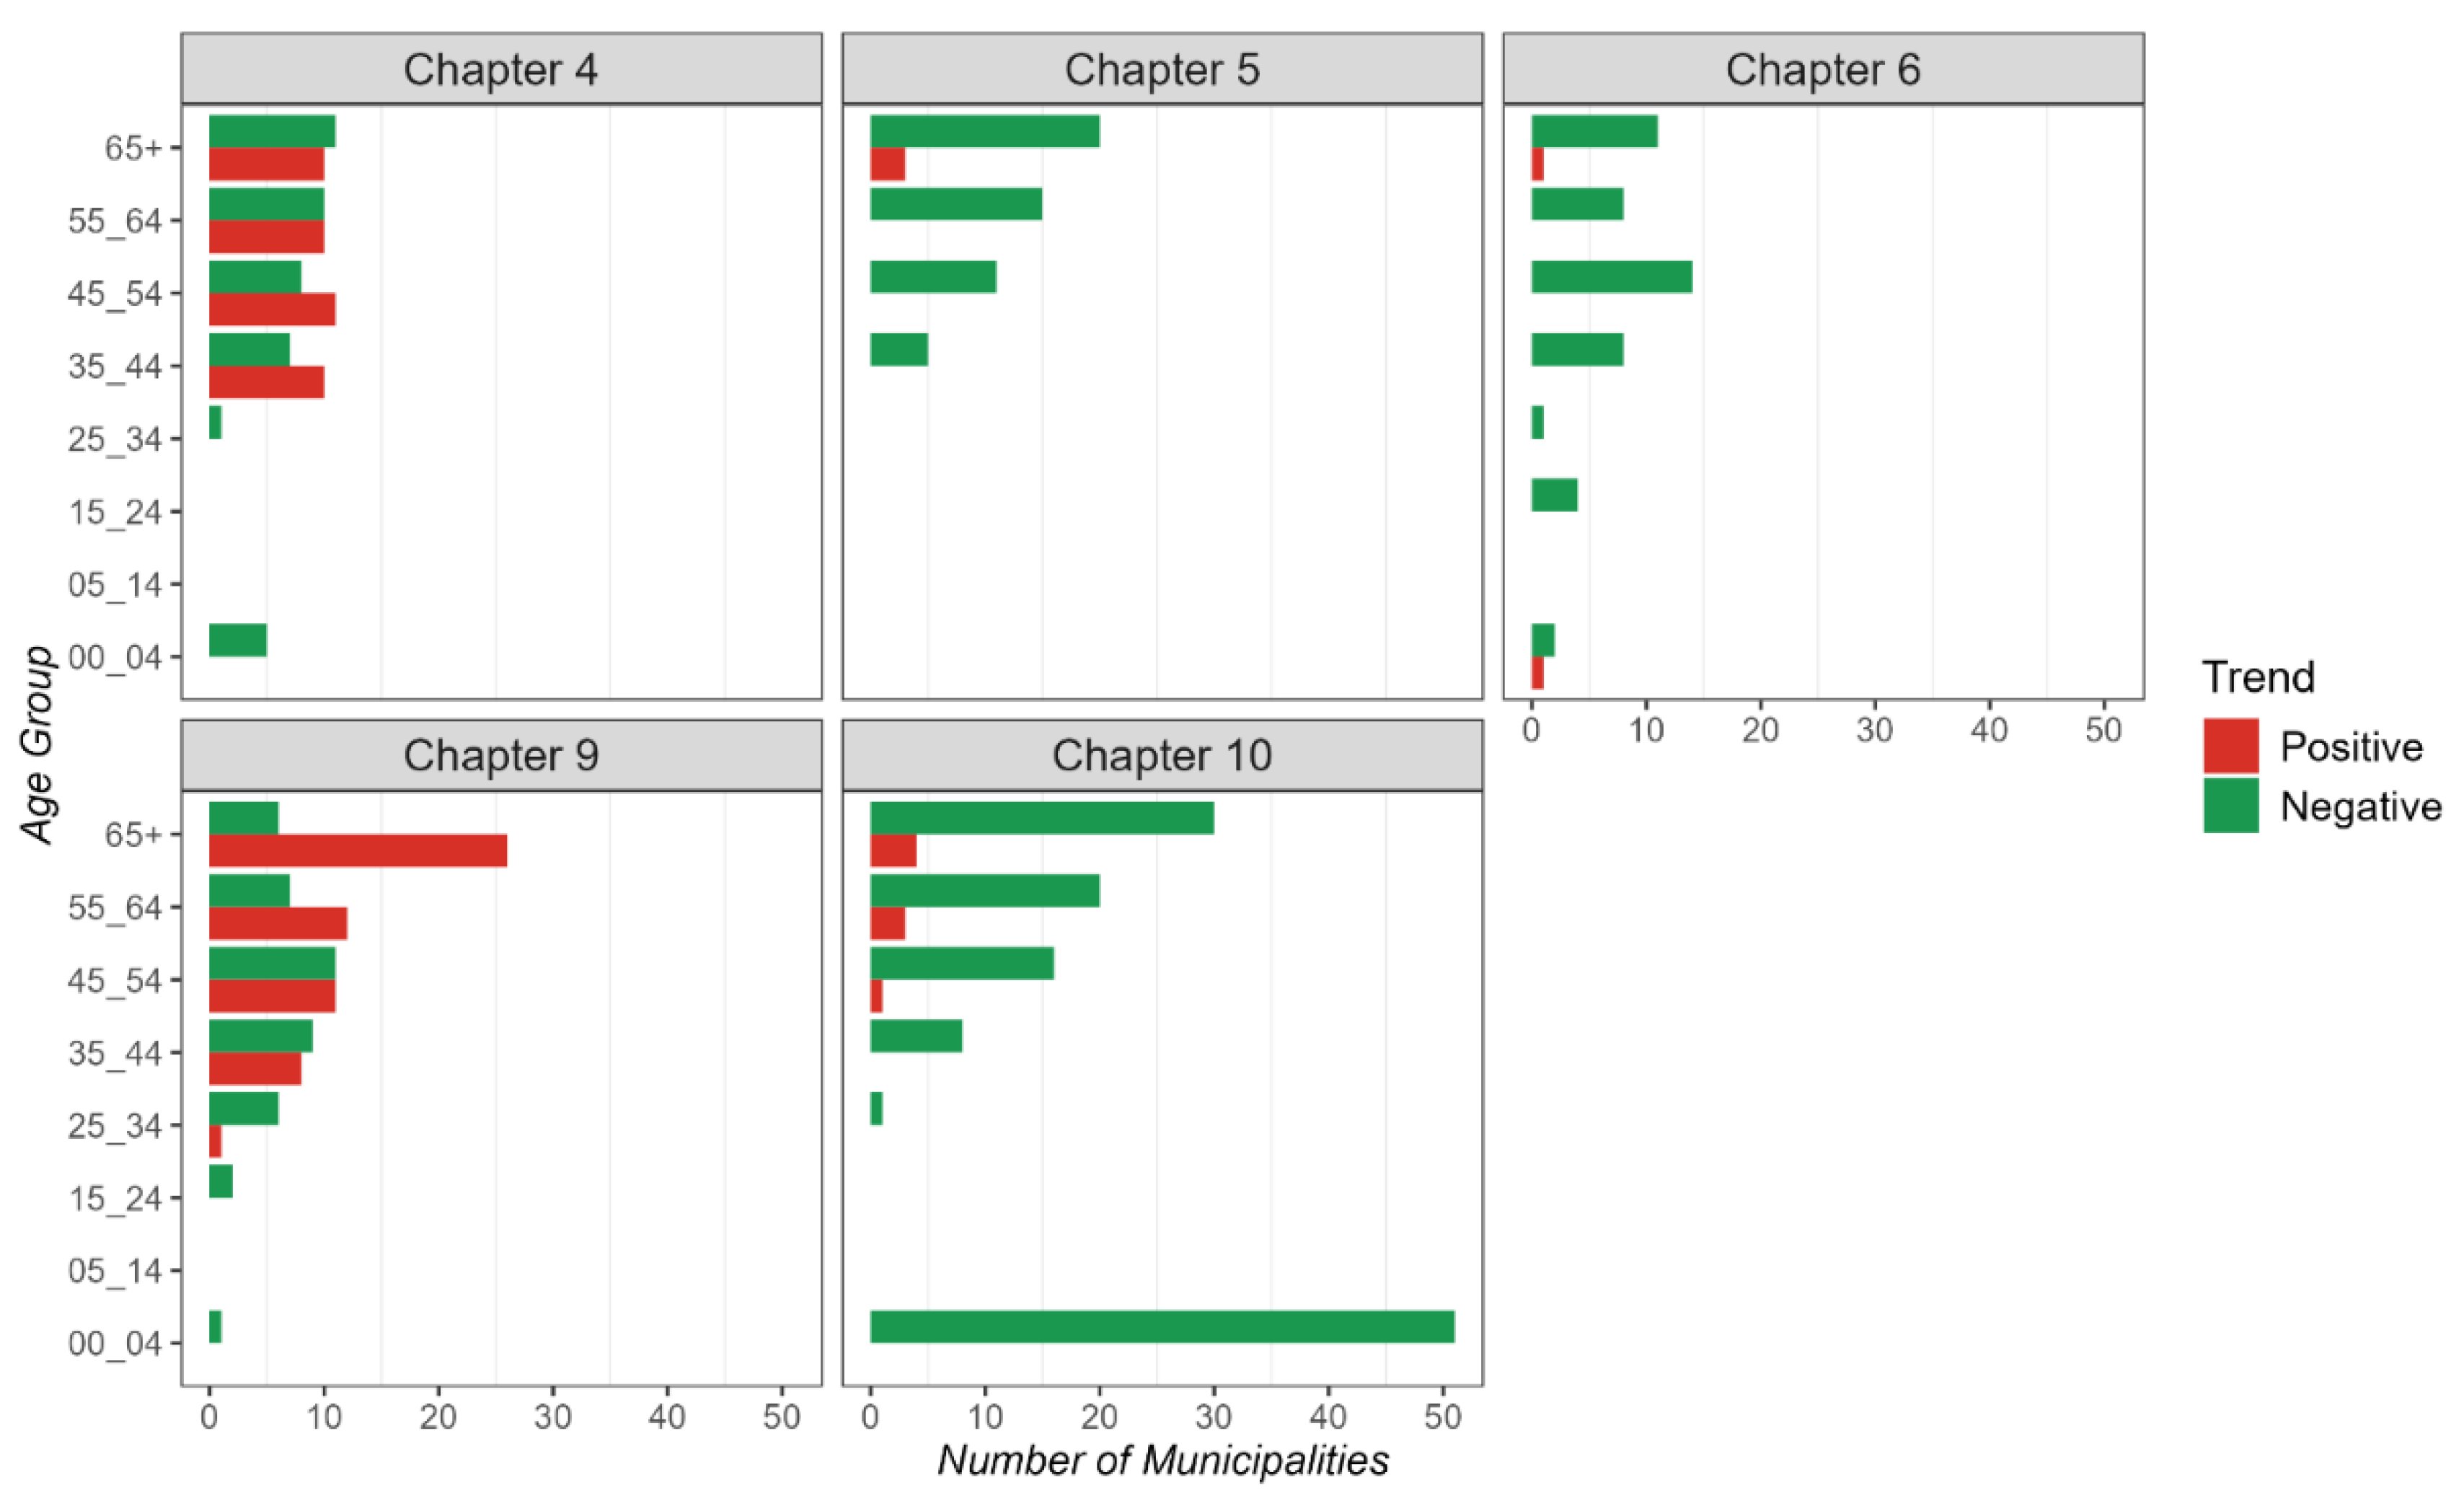
Figure 8.
Temporal trends of relative mortality risk by sex for non-communicable diseases in the MAVM Area between 2000 and 2019. Chapter 4: Endocrine, Nutritional and Metabolic Diseases, Chapter 5: Mental, Behavioral and Neurodevelopmental disorders, Chapter 6: Disease of the Nervous System, Chapter 9: Disease of the Circulatory System, Chapter 10: Disease of Respiratory System.
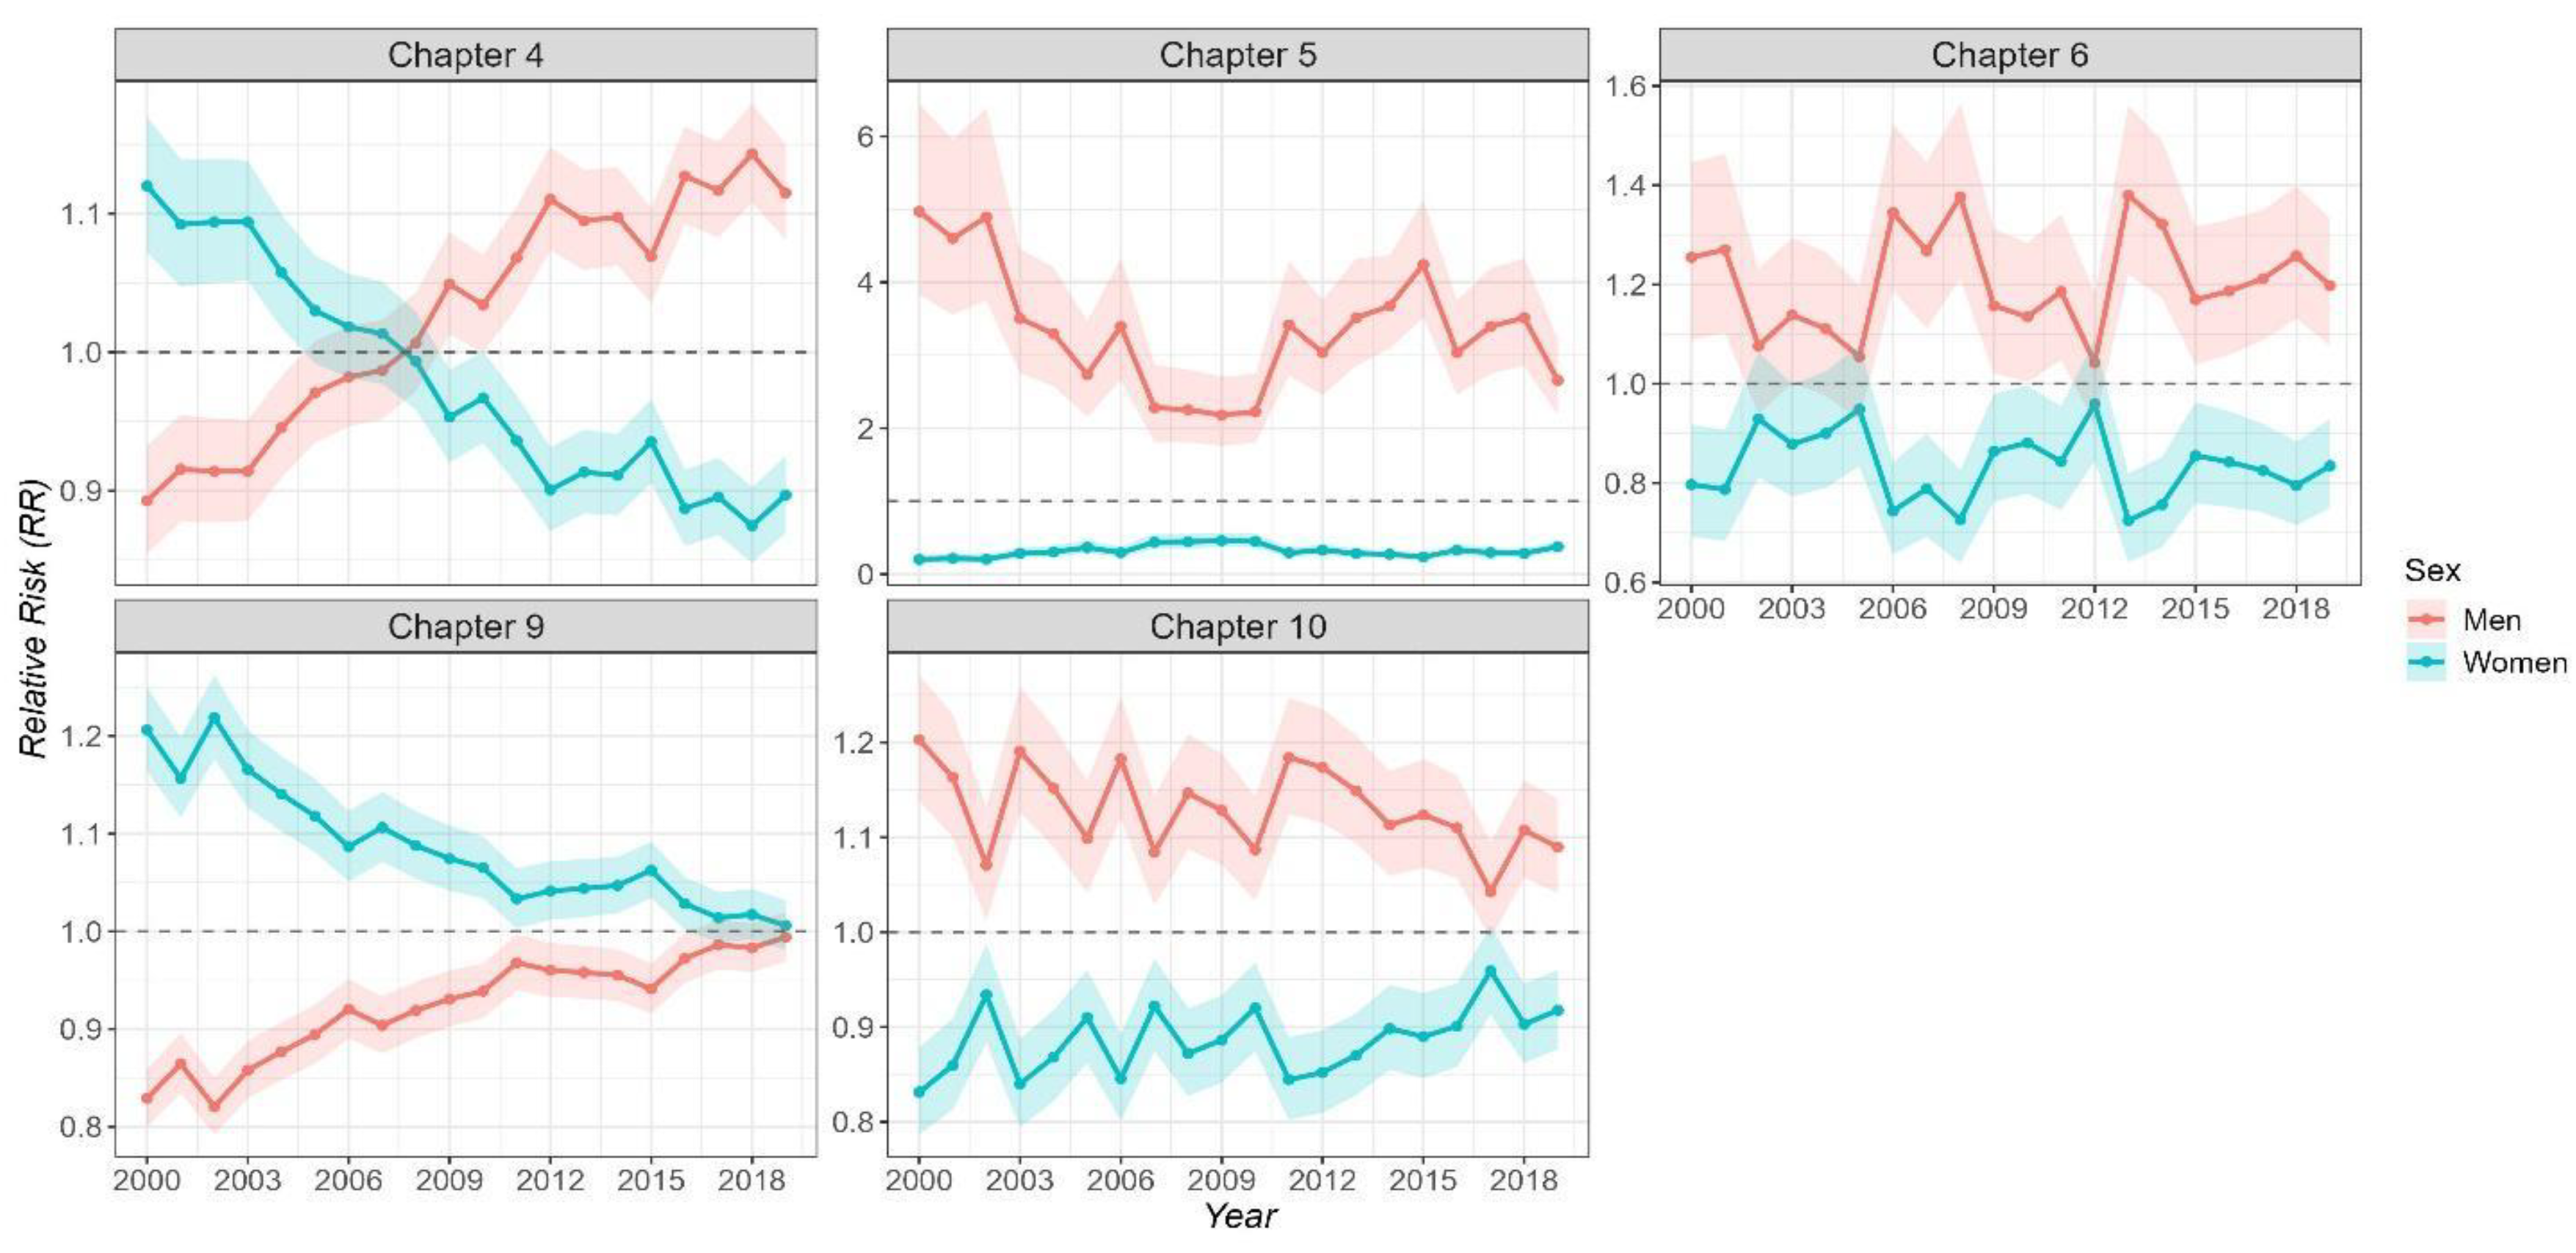
Figure 9.
Temporal trends of log-transformed relative mortality risk across ICD-10 disease chapters by age group.
Figure 9.
Temporal trends of log-transformed relative mortality risk across ICD-10 disease chapters by age group.
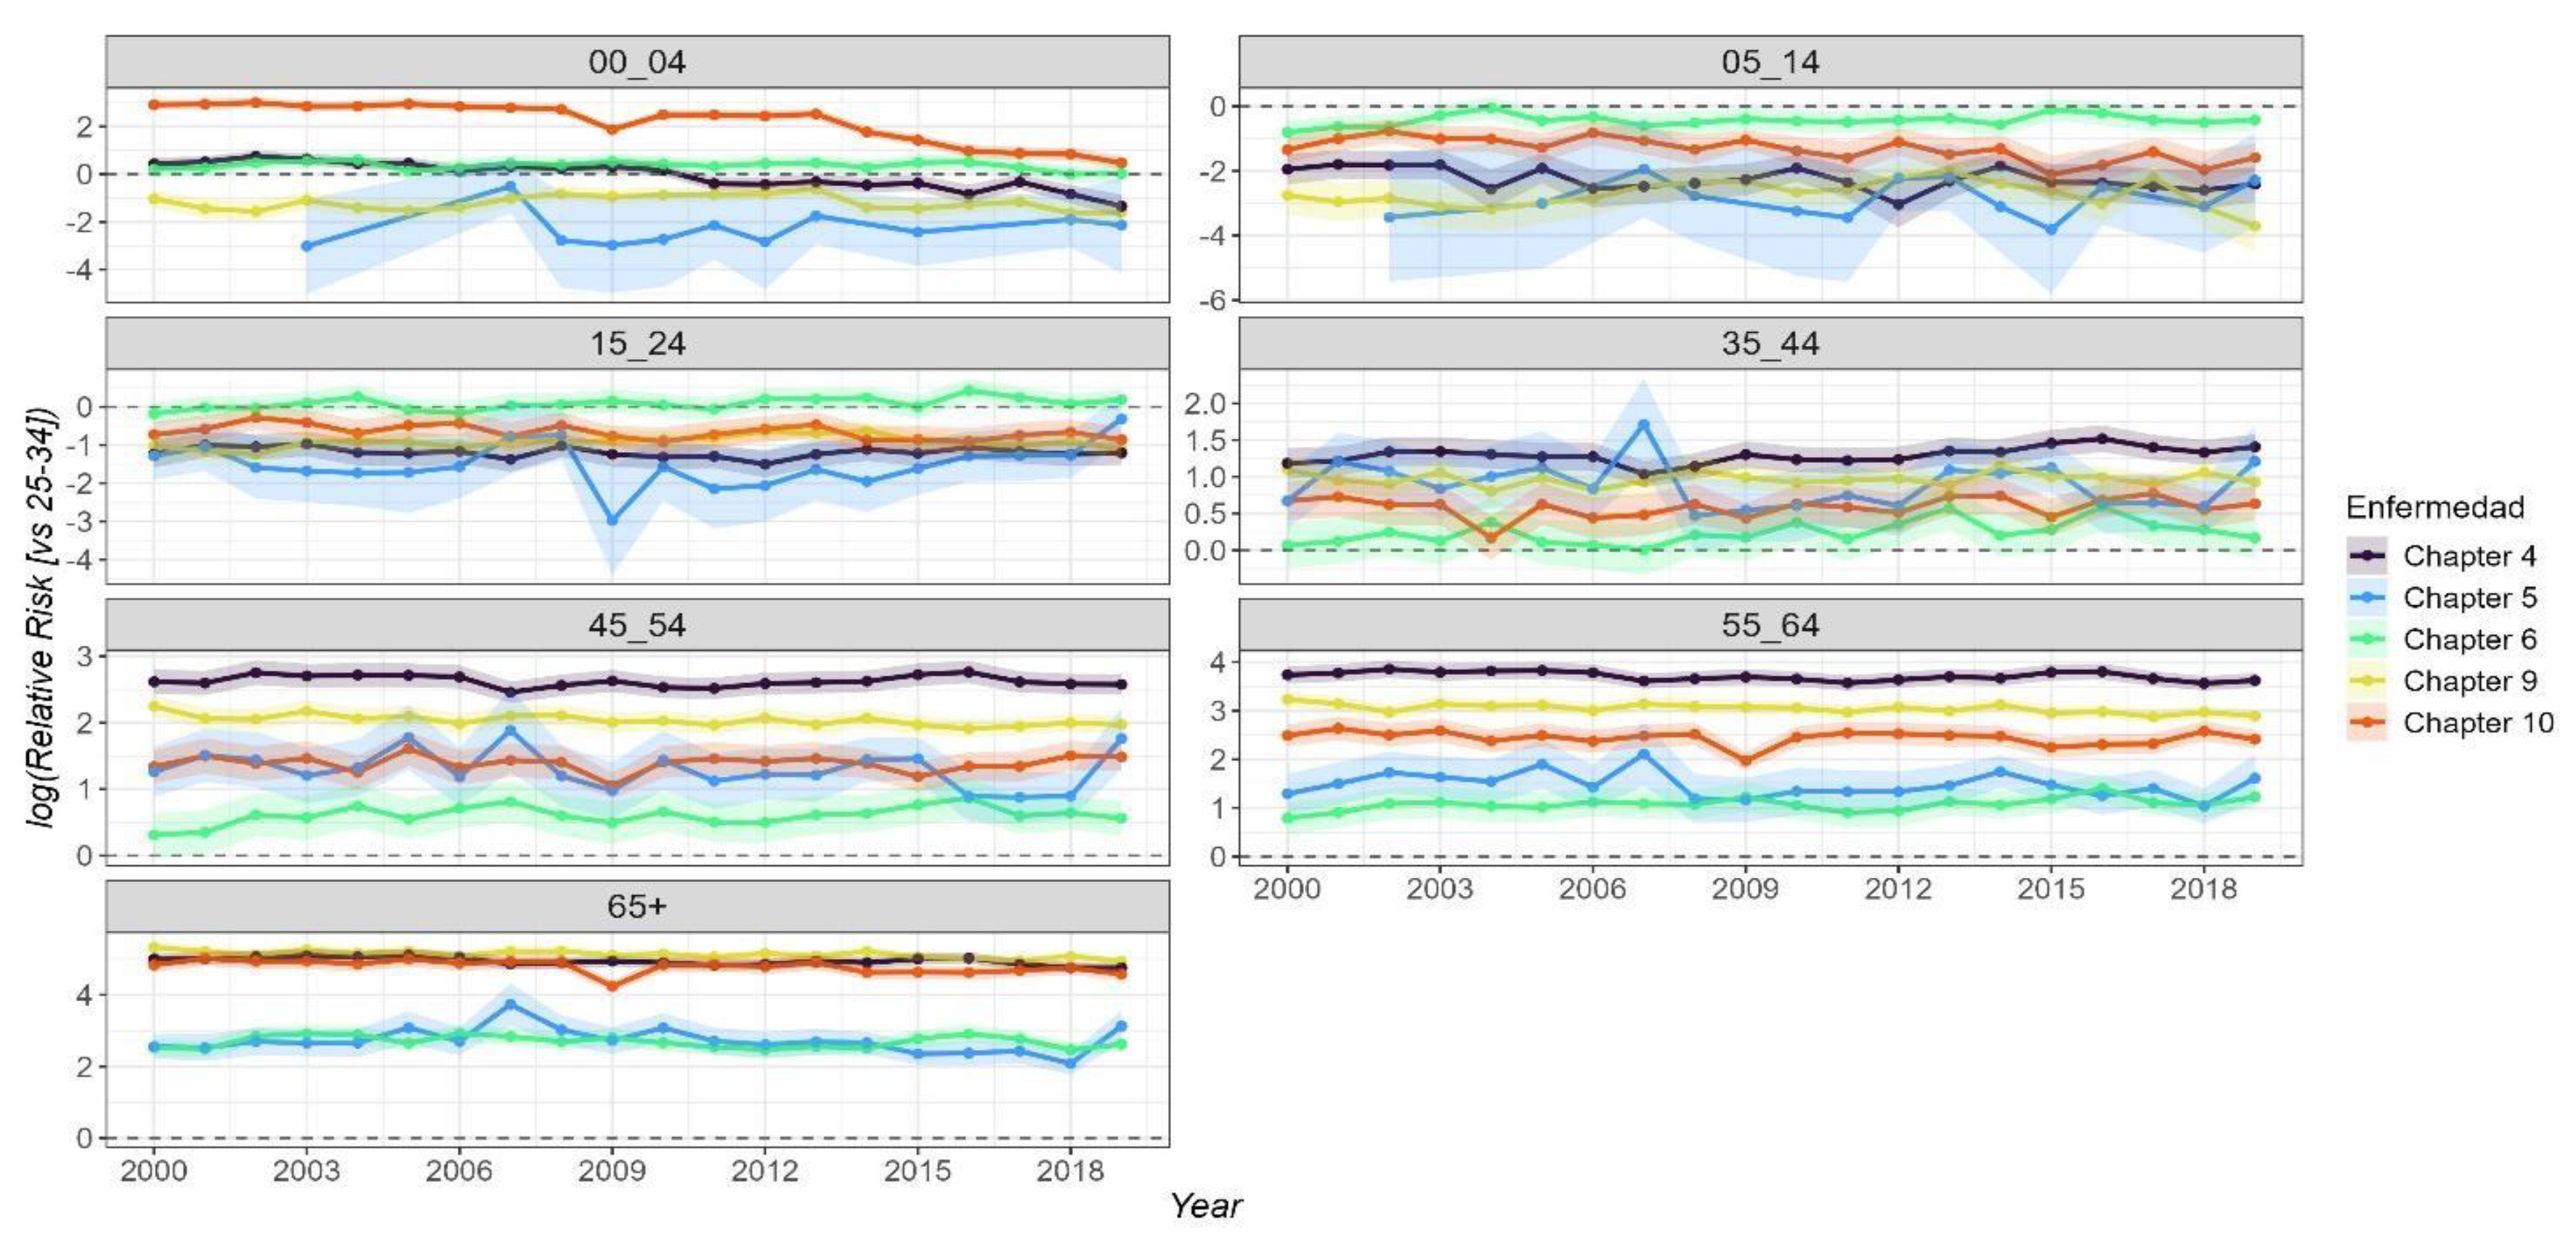
Figure 10.
Temporal frequency of statistically significant relative risk (RR) of mortality from non-communicable diseases across municipalities in the MAVM region, 2000–2019. Labels indicate municipalities with significant RR in 15 or more years. Chapter 4: Endocrine, Nutritional and Metabolic Diseases, Chapter 5: Mental, Behavioral and Neurodevelopmental disorders, Chapter 6: Disease of the Nervous System, Chapter 9: Disease of the Circulatory System, Chapter 10: Disease of Respiratory System.
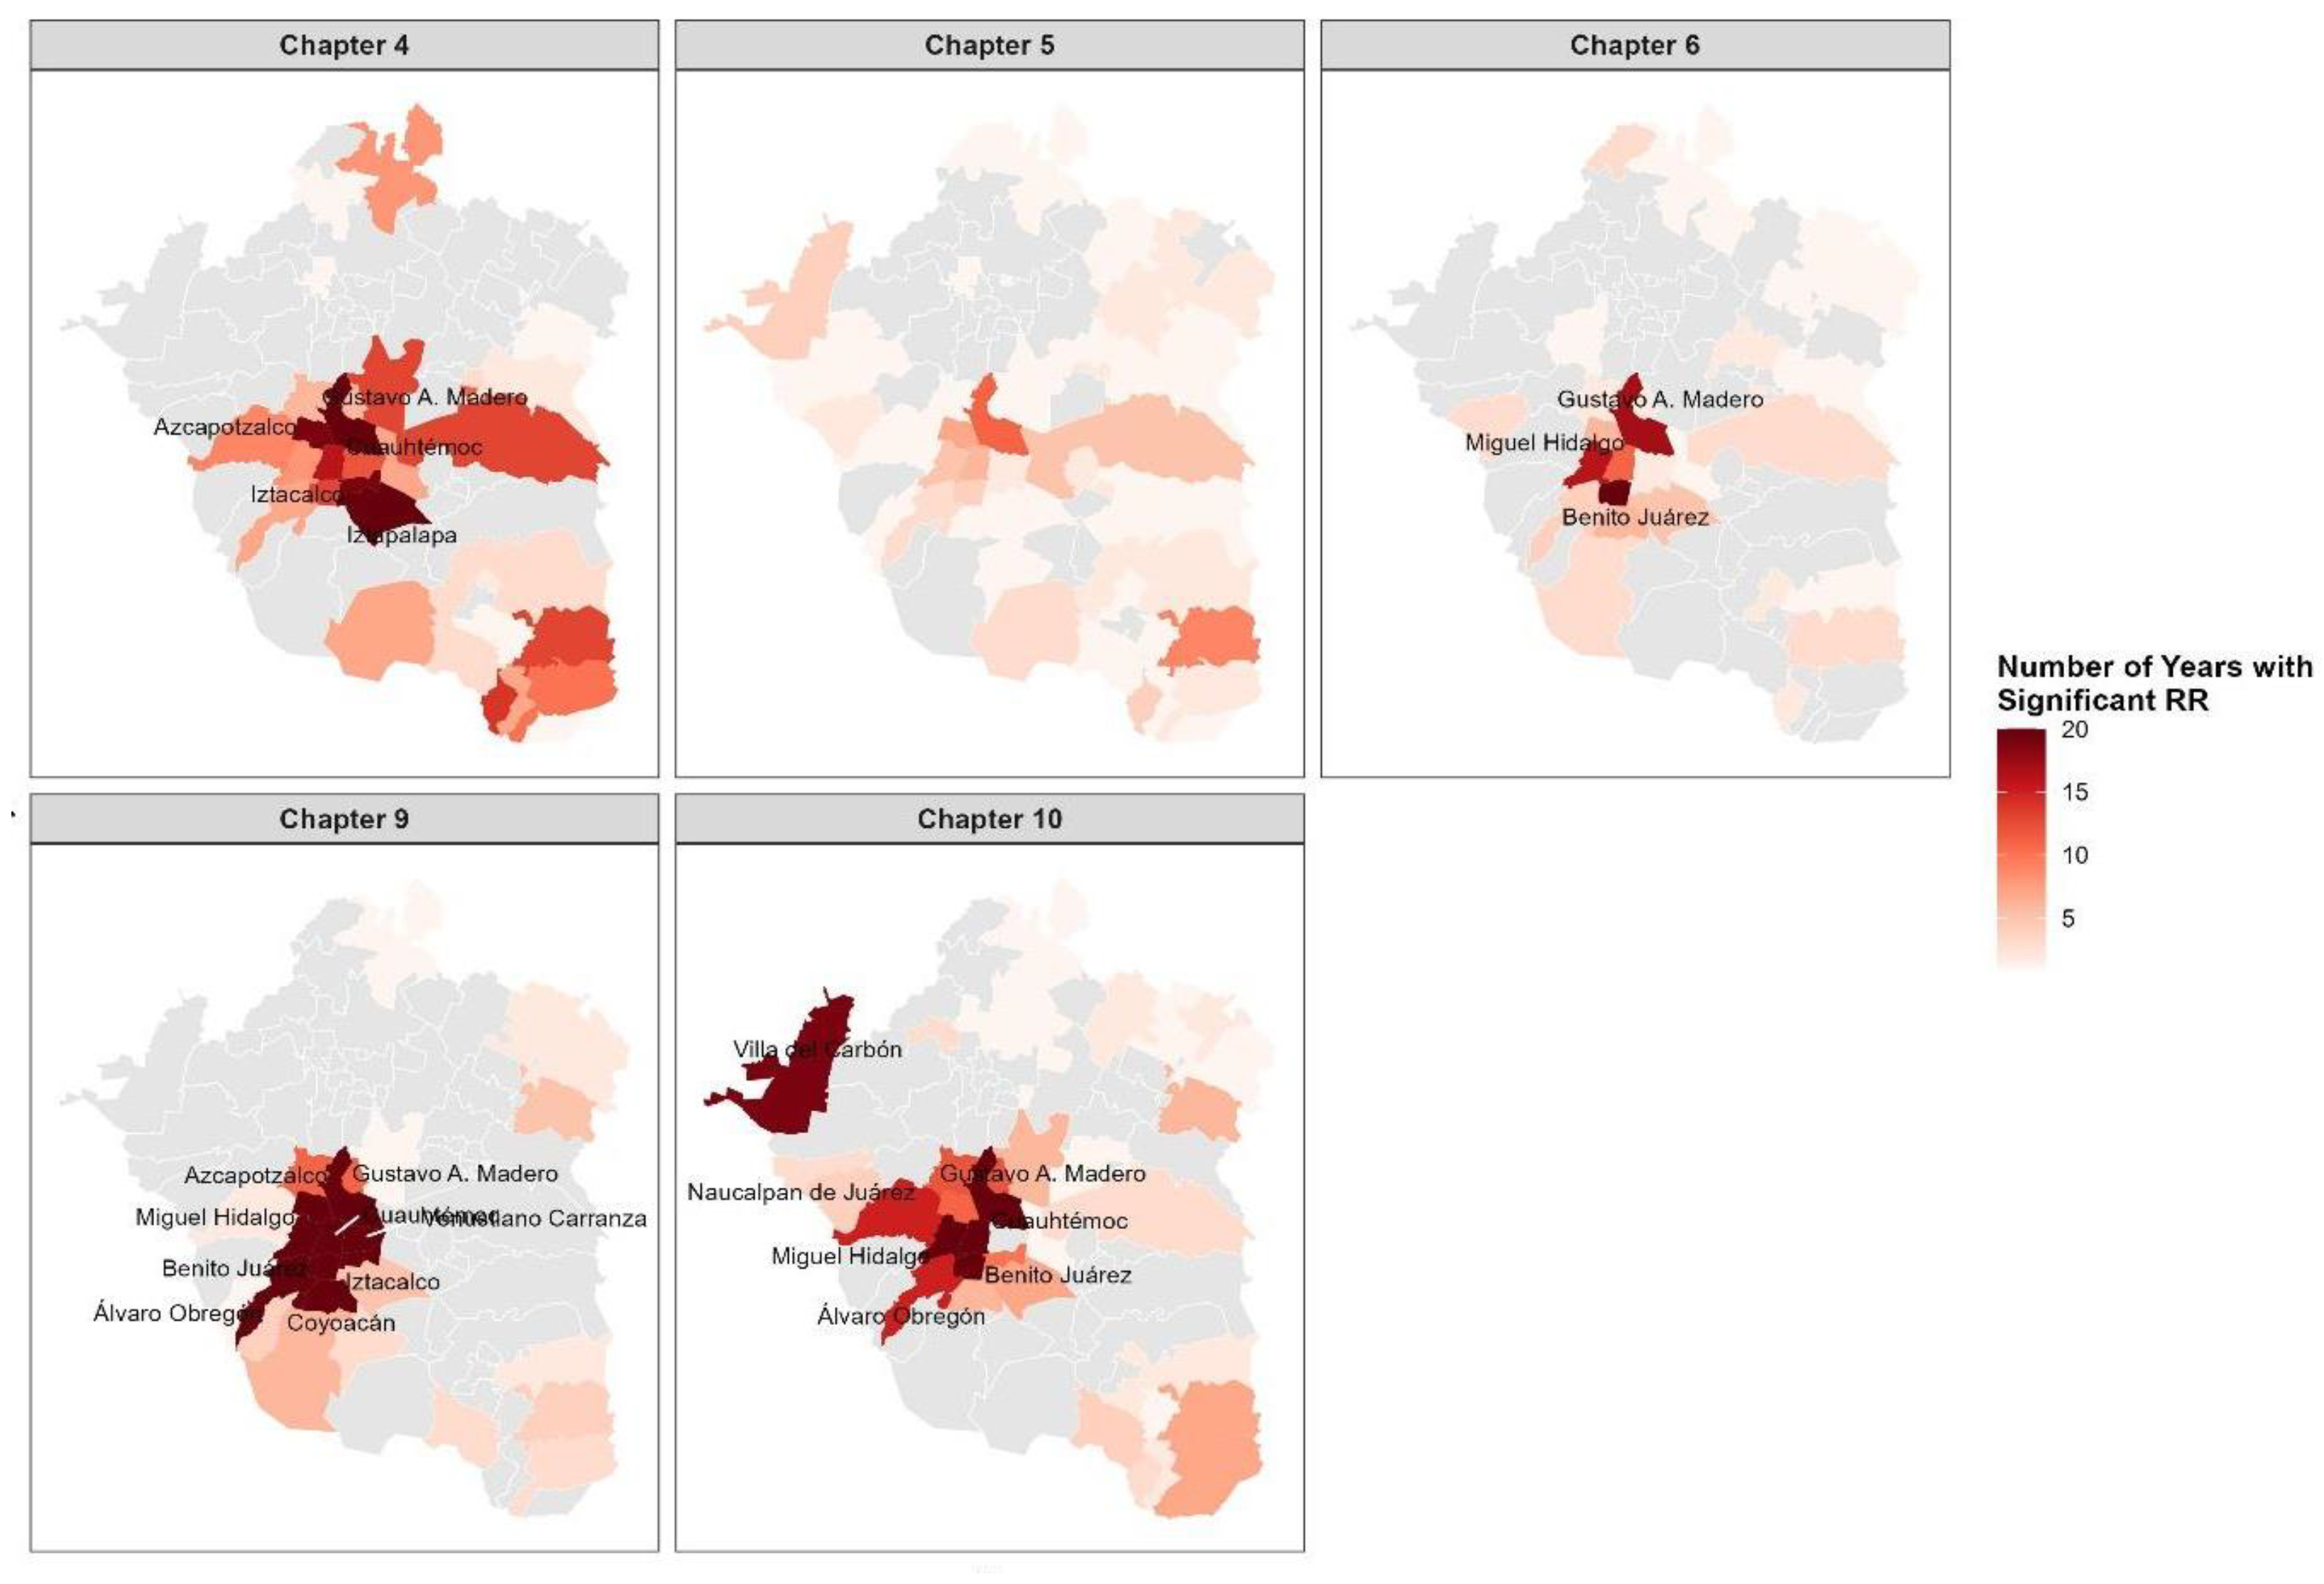
Table 1.
Total deaths recorded between 2000 and 2019 for five NCD chapters in the Metropolitan Area of Mexico Valley, stratified by sex and age group.
Table 1.
Total deaths recorded between 2000 and 2019 for five NCD chapters in the Metropolitan Area of Mexico Valley, stratified by sex and age group.
| Cumulative deaths from 2000 to 2019 | |||||||
| Sex | Age group | Chapter 4 | Chapter 5 | Chapter 6 | Chapter 9 | Chapter 10 | Total |
| Men | 00-04 | 937 | 12 | 675 | 376 | 6365 | 8365 |
| 05-14 | 177 | 16 | 624 | 171 | 301 | 1289 | |
| 15-24 | 519 | 135 | 1285 | 1185 | 638 | 3762 | |
| 25-34 | 1916 | 618 | 972 | 2923 | 1344 | 7773 | |
| 35-44 | 6114 | 1313 | 1054 | 6547 | 1908 | 16936 | |
| 45-54 | 16500 | 1457 | 1060 | 13618 | 2926 | 35561 | |
| 55-64 | 28239 | 1079 | 1130 | 22913 | 5222 | 58583 | |
| 65+ | 70865 | 1977 | 4099 | 115163 | 41363 | 233467 | |
| Women | 00-04 | 743 | 8 | 507 | 309 | 4709 | 6276 |
| 05-14 | 160 | 10 | 465 | 143 | 254 | 1032 | |
| 15-24 | 457 | 35 | 601 | 643 | 407 | 2143 | |
| 25-34 | 1093 | 54 | 645 | 1341 | 560 | 3693 | |
| 35-44 | 3325 | 72 | 712 | 3058 | 1026 | 8193 | |
| 45-54 | 10580 | 114 | 869 | 7561 | 2013 | 21137 | |
| 55-64 | 23120 | 134 | 891 | 14509 | 3879 | 42533 | |
| 65+ | 88320 | 1733 | 4906 | 157741 | 43688 | 296388 | |
| TOTAL | 253065 | 8767 | 20495 | 348201 | 116603 | 747131 | |
Chapter 4: Endocrine, Nutritional and Metabolic Diseases, Chapter 5: Mental, Behavioral and Neurodevelopmental disorders, Chapter 6: Disease of the Nervous System, Chapter 9: Disease of the Circulatory System, Chapter 10: Disease of Respiratory System.
Disclaimer/Publisher’s Note: The statements, opinions and data contained in all publications are solely those of the individual author(s) and contributor(s) and not of MDPI and/or the editor(s). MDPI and/or the editor(s) disclaim responsibility for any injury to people or property resulting from any ideas, methods, instructions or products referred to in the content. |
© 2025 by the authors. Licensee MDPI, Basel, Switzerland. This article is an open access article distributed under the terms and conditions of the Creative Commons Attribution (CC BY) license (http://creativecommons.org/licenses/by/4.0/).
Copyright: This open access article is published under a Creative Commons CC BY 4.0 license, which permit the free download, distribution, and reuse, provided that the author and preprint are cited in any reuse.


