Introduction
Diabetes Mellitus (DM) is a metabolic disorder associated with elevated blood sugar levels and subsequent insulin-related issues. DM can damage both macro and microvasculature, causing complications that impact various body parts, including the kidneys [
1]. Diabetic kidney disease is a highly prevalent complication of diabetes mellitus, often resulting in chronic kidney disease and end-stage renal disease [
2]. The progression of this condition is influenced by factors such as obesity, hypertension, poor glycemic control, and the complex interplay of genetic, environmental, and lifestyle factors [
3,
4]. In the United States (U.S.), diabetic nephropathy is the leading cause of renal disease, contributing significantly to morbidity and mortality in affected individuals, with a prevalence between 20% and 40% among diabetic patients [
5]. Approximately 7% of the U.S. population has DM [
6], and renal failure is listed as the cause of death in 6-12% of adults with DM. The incidence of renal diseases has increased significantly in the diabetic population as compared to the nondiabetic population [
7]. The prevalence of diabetic nephropathy remains a strong predictor of morbidity and mortality in diabetic patients [
8]; hence, understanding the factors contributing to mortality becomes paramount for public health interventions and policy-making. The present study aims to examine the US mortality trend among adults attributable to diabetic nephropathy over the past two decades, from 1999 to 2020. We use advanced statistics to analyze population data and study the link between DM-related renal complications and mortality while accounting for other factors. The results of our study will guide targeted interventions to reduce diabetic nephropathy-related mortality among the adult population in the US.
Methods
Data Source
The Centre for Disease Control and Prevention Wide-Ranging Online Data for Epidemiologic Research (CDC WONDER) database was used to collect data from death certificates [
9]. The study analyzed death incidents of adults secondary to diabetes-related renal complications between 1999 and 2020 utilizing the International Classification of Diseases, and Related Health Problems 10
th version (ICD-10) codes
E10.2, E11.2, E12.2, E13.2, and E14.2 [
10]. The study looked at death records from the Multiple Cause-of-Death Public Use registry to find the incidence of diabetes-related renal complications. Renal complications of diabetes were listed as a contributing factor or as the primary cause of death in these cases. The research did not require permission from a regional institutional review board since it relied on deidentified public use data provided by the government. The STROBE standards for reporting observational research were followed in this study [
11].
Data Abstraction
The population number, year, place of death, demographic features, geographical breakdown, state-specific statistics, and distinction between urban and rural areas are all included in the dataset. The location of death consists of various places, including hospitals, houses, hospices, nursing homes, and long-term care institutions. The term "demographics" refers to information on gender, age, race, and ethnicity. Following are the categories for race and ethnicity: White, Black/African American, Latino, American Indians/Alaska Natives, and Asian/Pacific Islanders.
According to the National Centre for Health Statics Urban-Rural Classification Scheme, The population was divided into urban areas (which included large metropolitan areas with a population of 1 million or more, as well as medium/small metropolitan areas with a population ranging from 50,000 to 999,999), rural areas (with a population of less than 50,000), and other counties in the 2013 U.S. Census [
12]. Additionally, the Northeast, Midwest, South, and West regions are categorized into four distinct geographical groups according to standards set by the U.S. Census Bureau [
13].
Statistical Analysis
We analyzed the mortality rate per 100,000 individuals for both unadjusted and age-adjusted data across the period from 1999 to 2020 to investigate regional trends in mortality related to acute renal failure. These rates were divided into categories based on year, gender, race/ethnicity, state, and urban/rural status. The crude mortality rates were determined by dividing the total number of Acute renal failure deaths by the corresponding U.S. population each year [
14].
Age-adjusted mortality rates (AAMR) were calculated by standardizing diabetes-related renal complications death in the United States in 2000 [
15]. The annual percent change (APC) and its associated 95% confidence interval (CI) in age-adjusted mortality rates (AAMR) were calculated using the
Join-Point Regression Program (Version 5.0.2, National Cancer Institute) [
16]. This study was carried out to analyze annual changes in diabetes-related renal complications mortality at the national level [
17]. This approach utilizes log-linear regression models to detect meaningful alterations in age-adjusted mortality rates (AAMR). The APCs were classified as increasing or decreasing if the slope reflecting changes in mortality differed substantially from zero, as assessed by two-tailed t-testing [
18]. A significance level of P<0.05 was used to establish statistical significance. Additionally, a sensitivity analysis was conducted for fatalities of diabetes-related renal complications
("E10.2, E11.2, E12.2, E13.2, E14.2"), which was identified as the primary cause of death.
Results
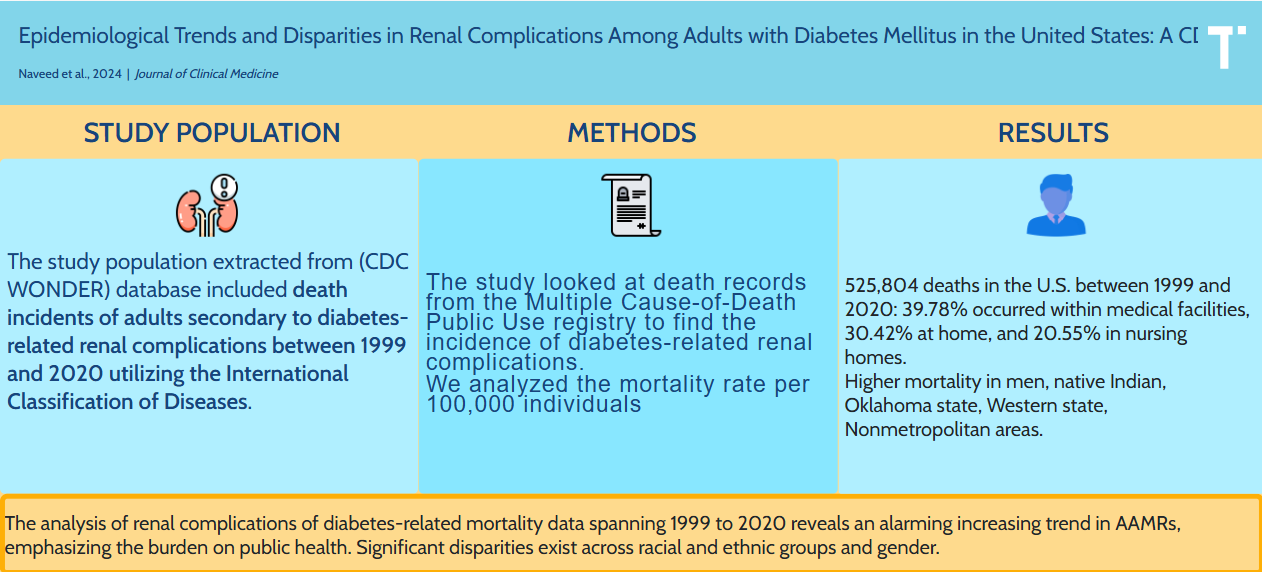
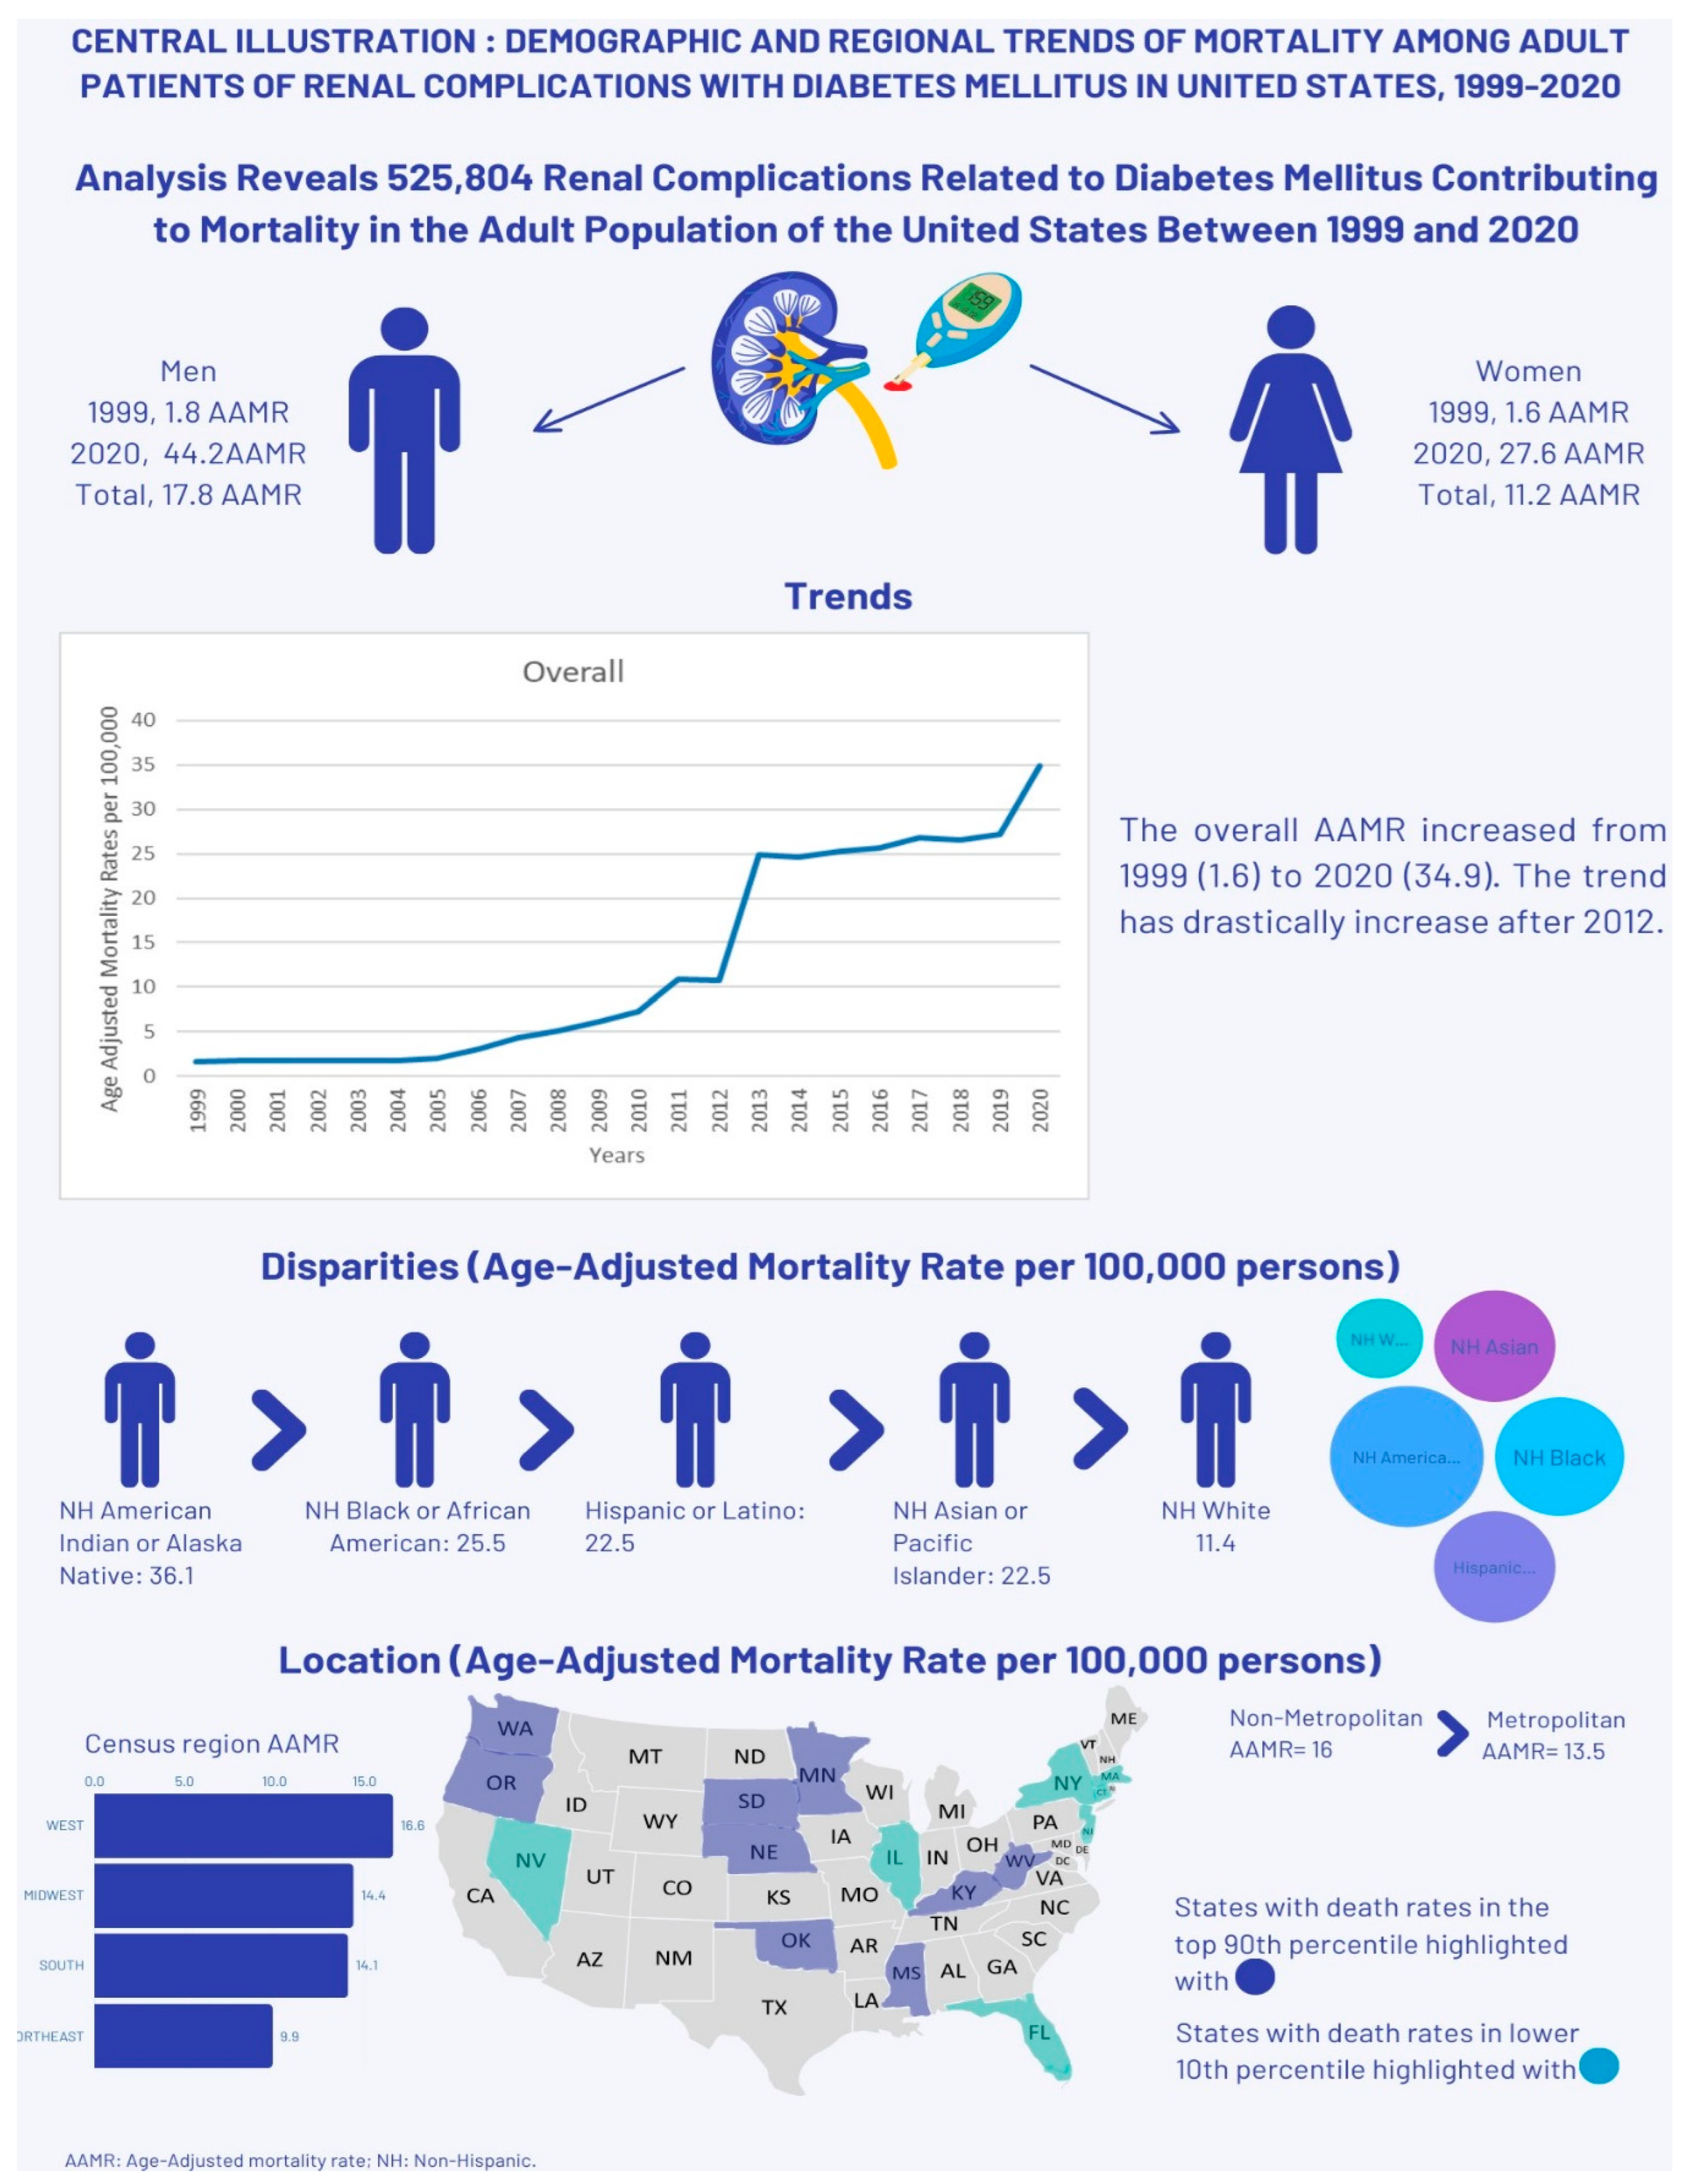
Diabetes-related renal complications in adult patients caused a total of 525,804 deaths in the U.S. between 1999 and 2020 (Supplementary Table 1). Of these, 39.78% occurred within medical facilities, 30.42% at home, 20.55% in nursing homes/long-term care facilities, 5.72% in hospices, and 3.42% at other places (
Supplementary Table S2).
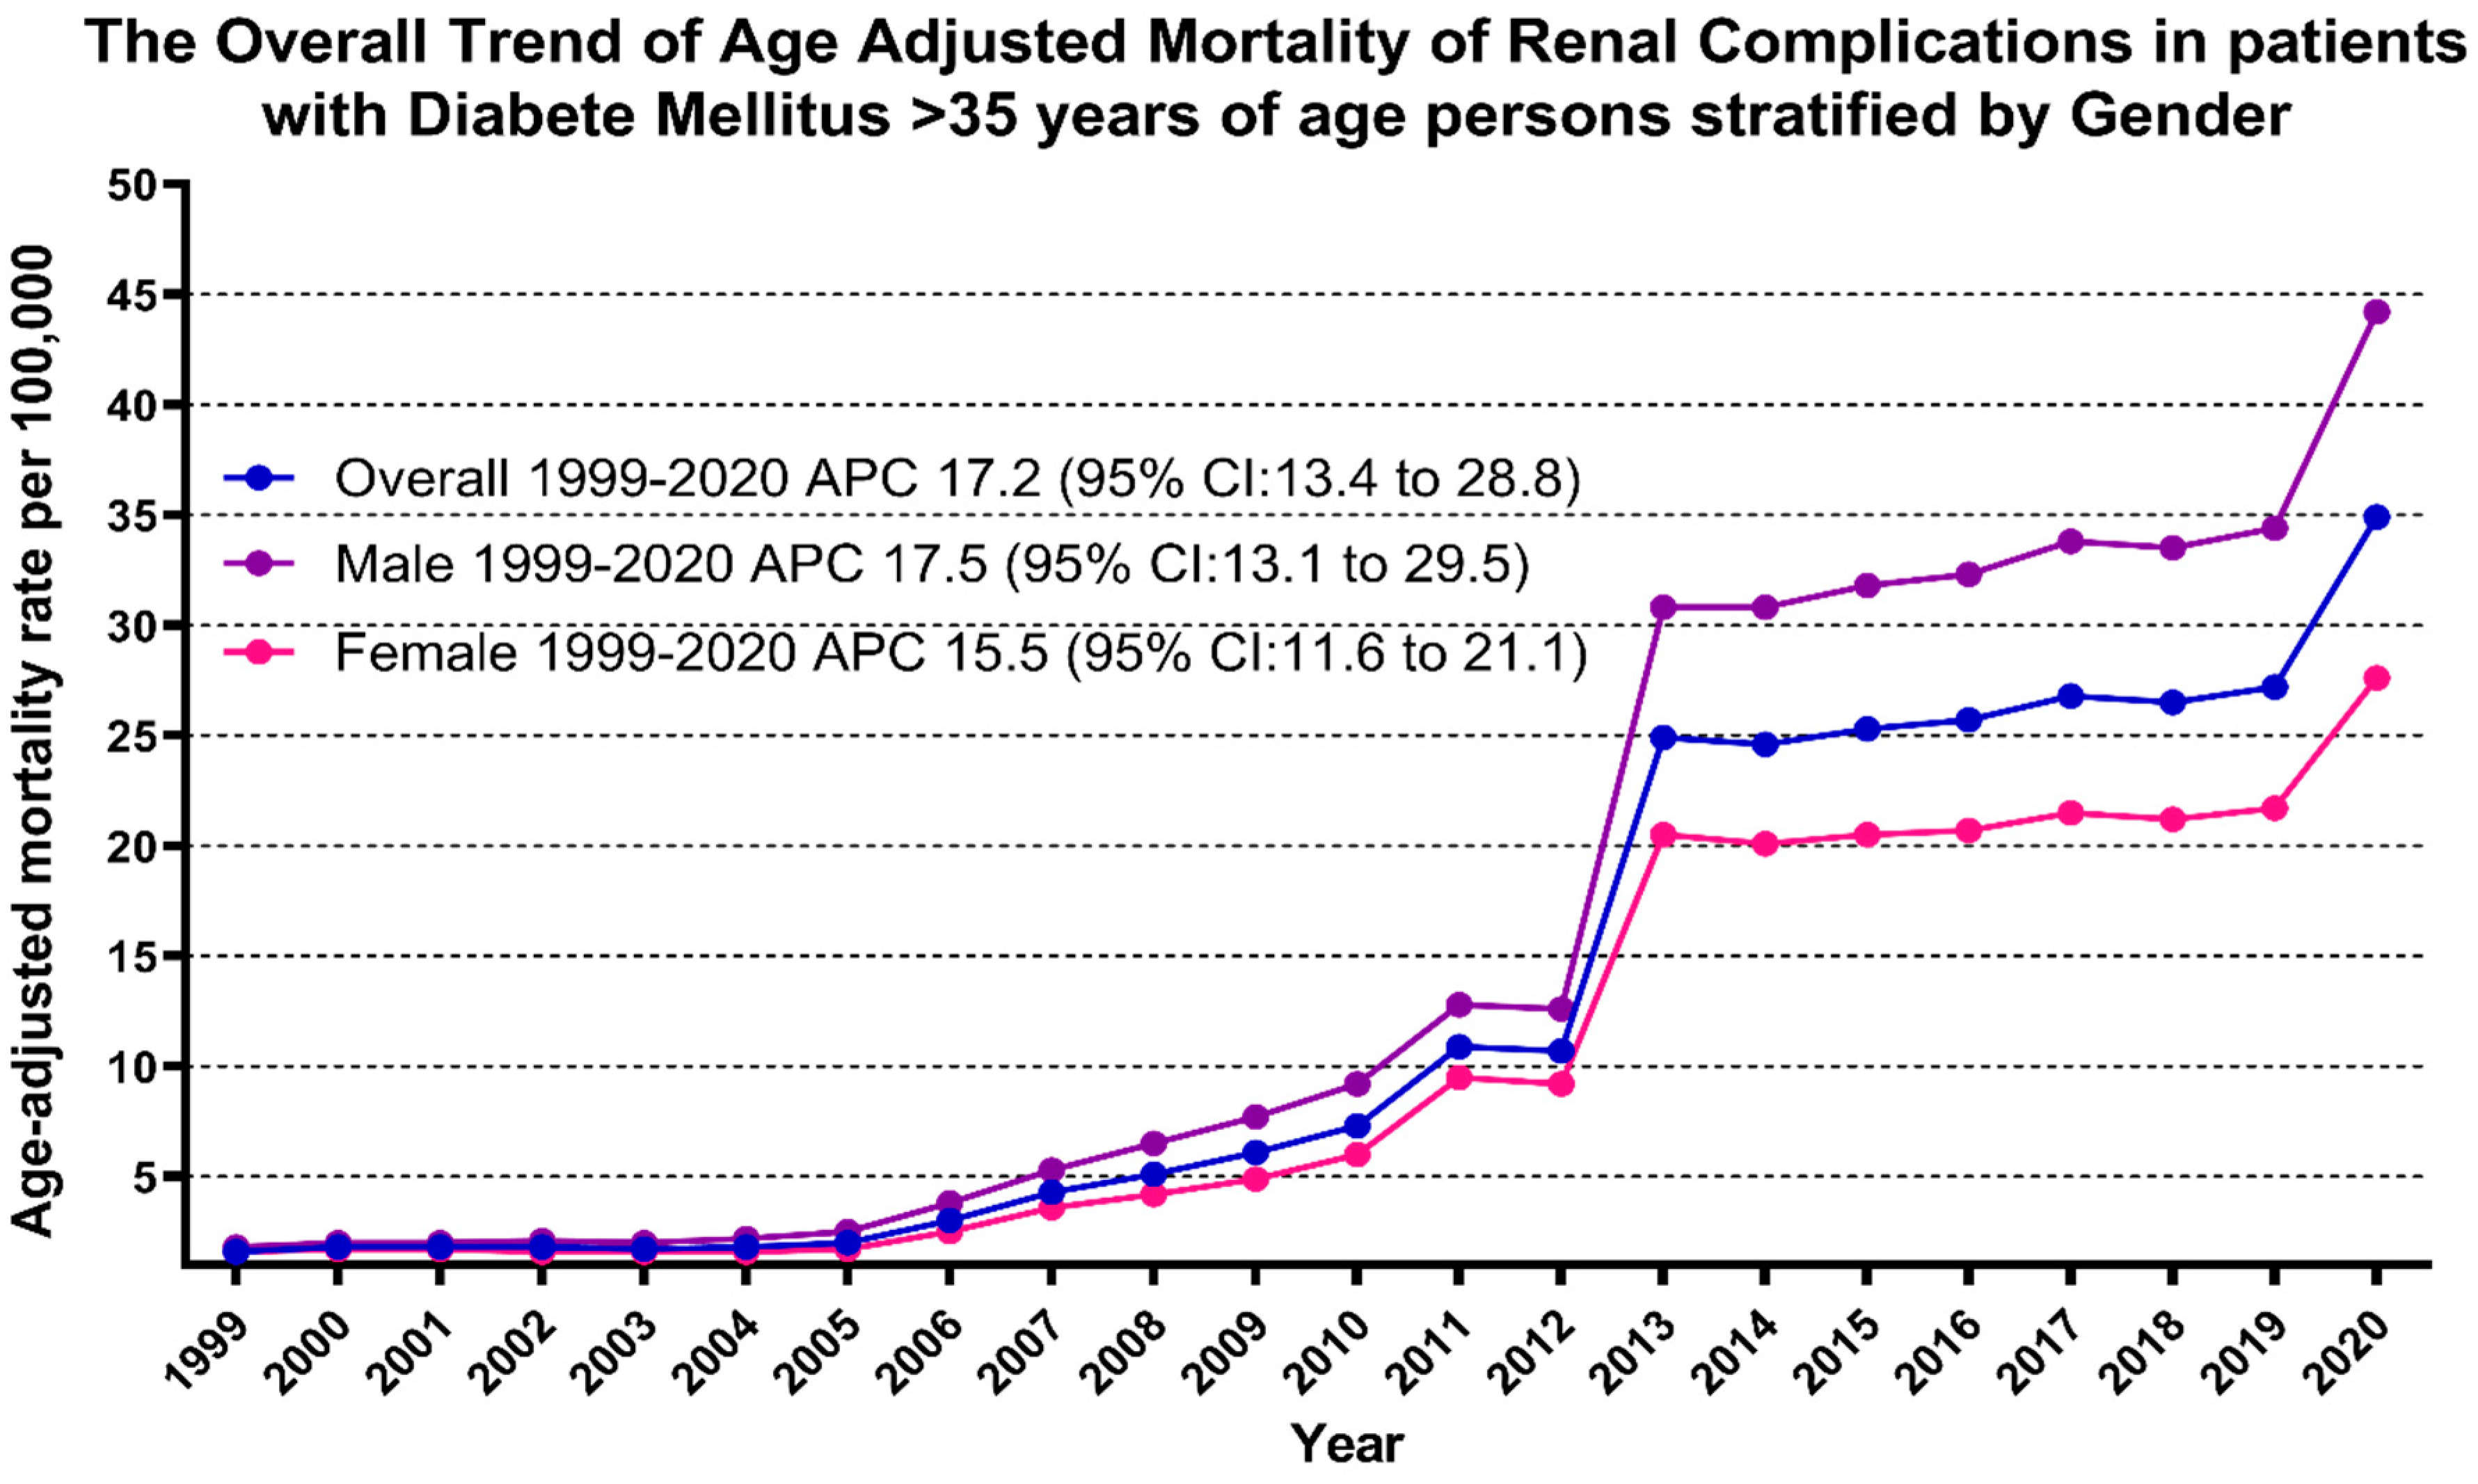
AAMR exhibited a consistent upward trend from 1999 until the study's conclusion in 2020. Specifically, AAMR for renal-related deaths among adult diabetic patients started at 1.6 in 1999 and surged significantly to 34.9 by the conclusion of the study period in 2020 (AAPC: 17.23; 95% CI: 13.35-28.79). AAMR slightly increased from 1999 to 2010 (APC: 16.69; 95% CI: -33.79-165.4) followed by a marked increase from 2010 to 2013 (APC: 55.08; 95% CI: 4.27-72.62), slightly increasing from 2013 to 2018 (APC: 1.56; 95% CI: -4.03-53.29) and then it again increased dramatically from 2018 to 2020 (APC: 13.71; 95% CI: 3.95-20.90) (
Figure 1,
Supplementary Tables S3 and S4).
Adult men had consistently higher AAMR than adult women throughout the study period (overall AAMR men: 17.8, 95% CI: 17.7-17.9; women: 11.2, 95% CI: 11.1-11.2). In 1999, the AAMR for adult men was 1.8, which steadily increased to 9.2 in 2010 (APC: 17.77; 95% CI: -36.74-99.34), followed by a dramatic increase to 30.8 in 2013 (APC: 48.95; 95% CI: -1.52-65.02), then again steadily increased until the end of the study in 2020 to 44.2 (APC: 5.89; 95% CI: 1.02-16.18). For adult women, the AAMR in 1999 was 1.6, which steadily increased to 6 in 2010 (APC: 15.62; 95% CI: -25.63-27.41), followed by a dramatic increase to 20.5 in 2013 (APC: 52.10; 95% CI: 31.49-68.29), then again steadily increased until the end of the study in 2020 to 27.6 (APC: 2.60; 95% CI: 0.27-4.69). The AAMR for adult men and women in 1999 was 1.6 and 1.8, respectively, which increased to 27.6 and 44.2 in 2020 (Men: AAPC: 17.54, 95% CI: 13.09-29.53; Women: AAPC: 15.55, 95% CI: 13.35-21.10) (
Figure 1,
Supplementary Tables S3 and S4).
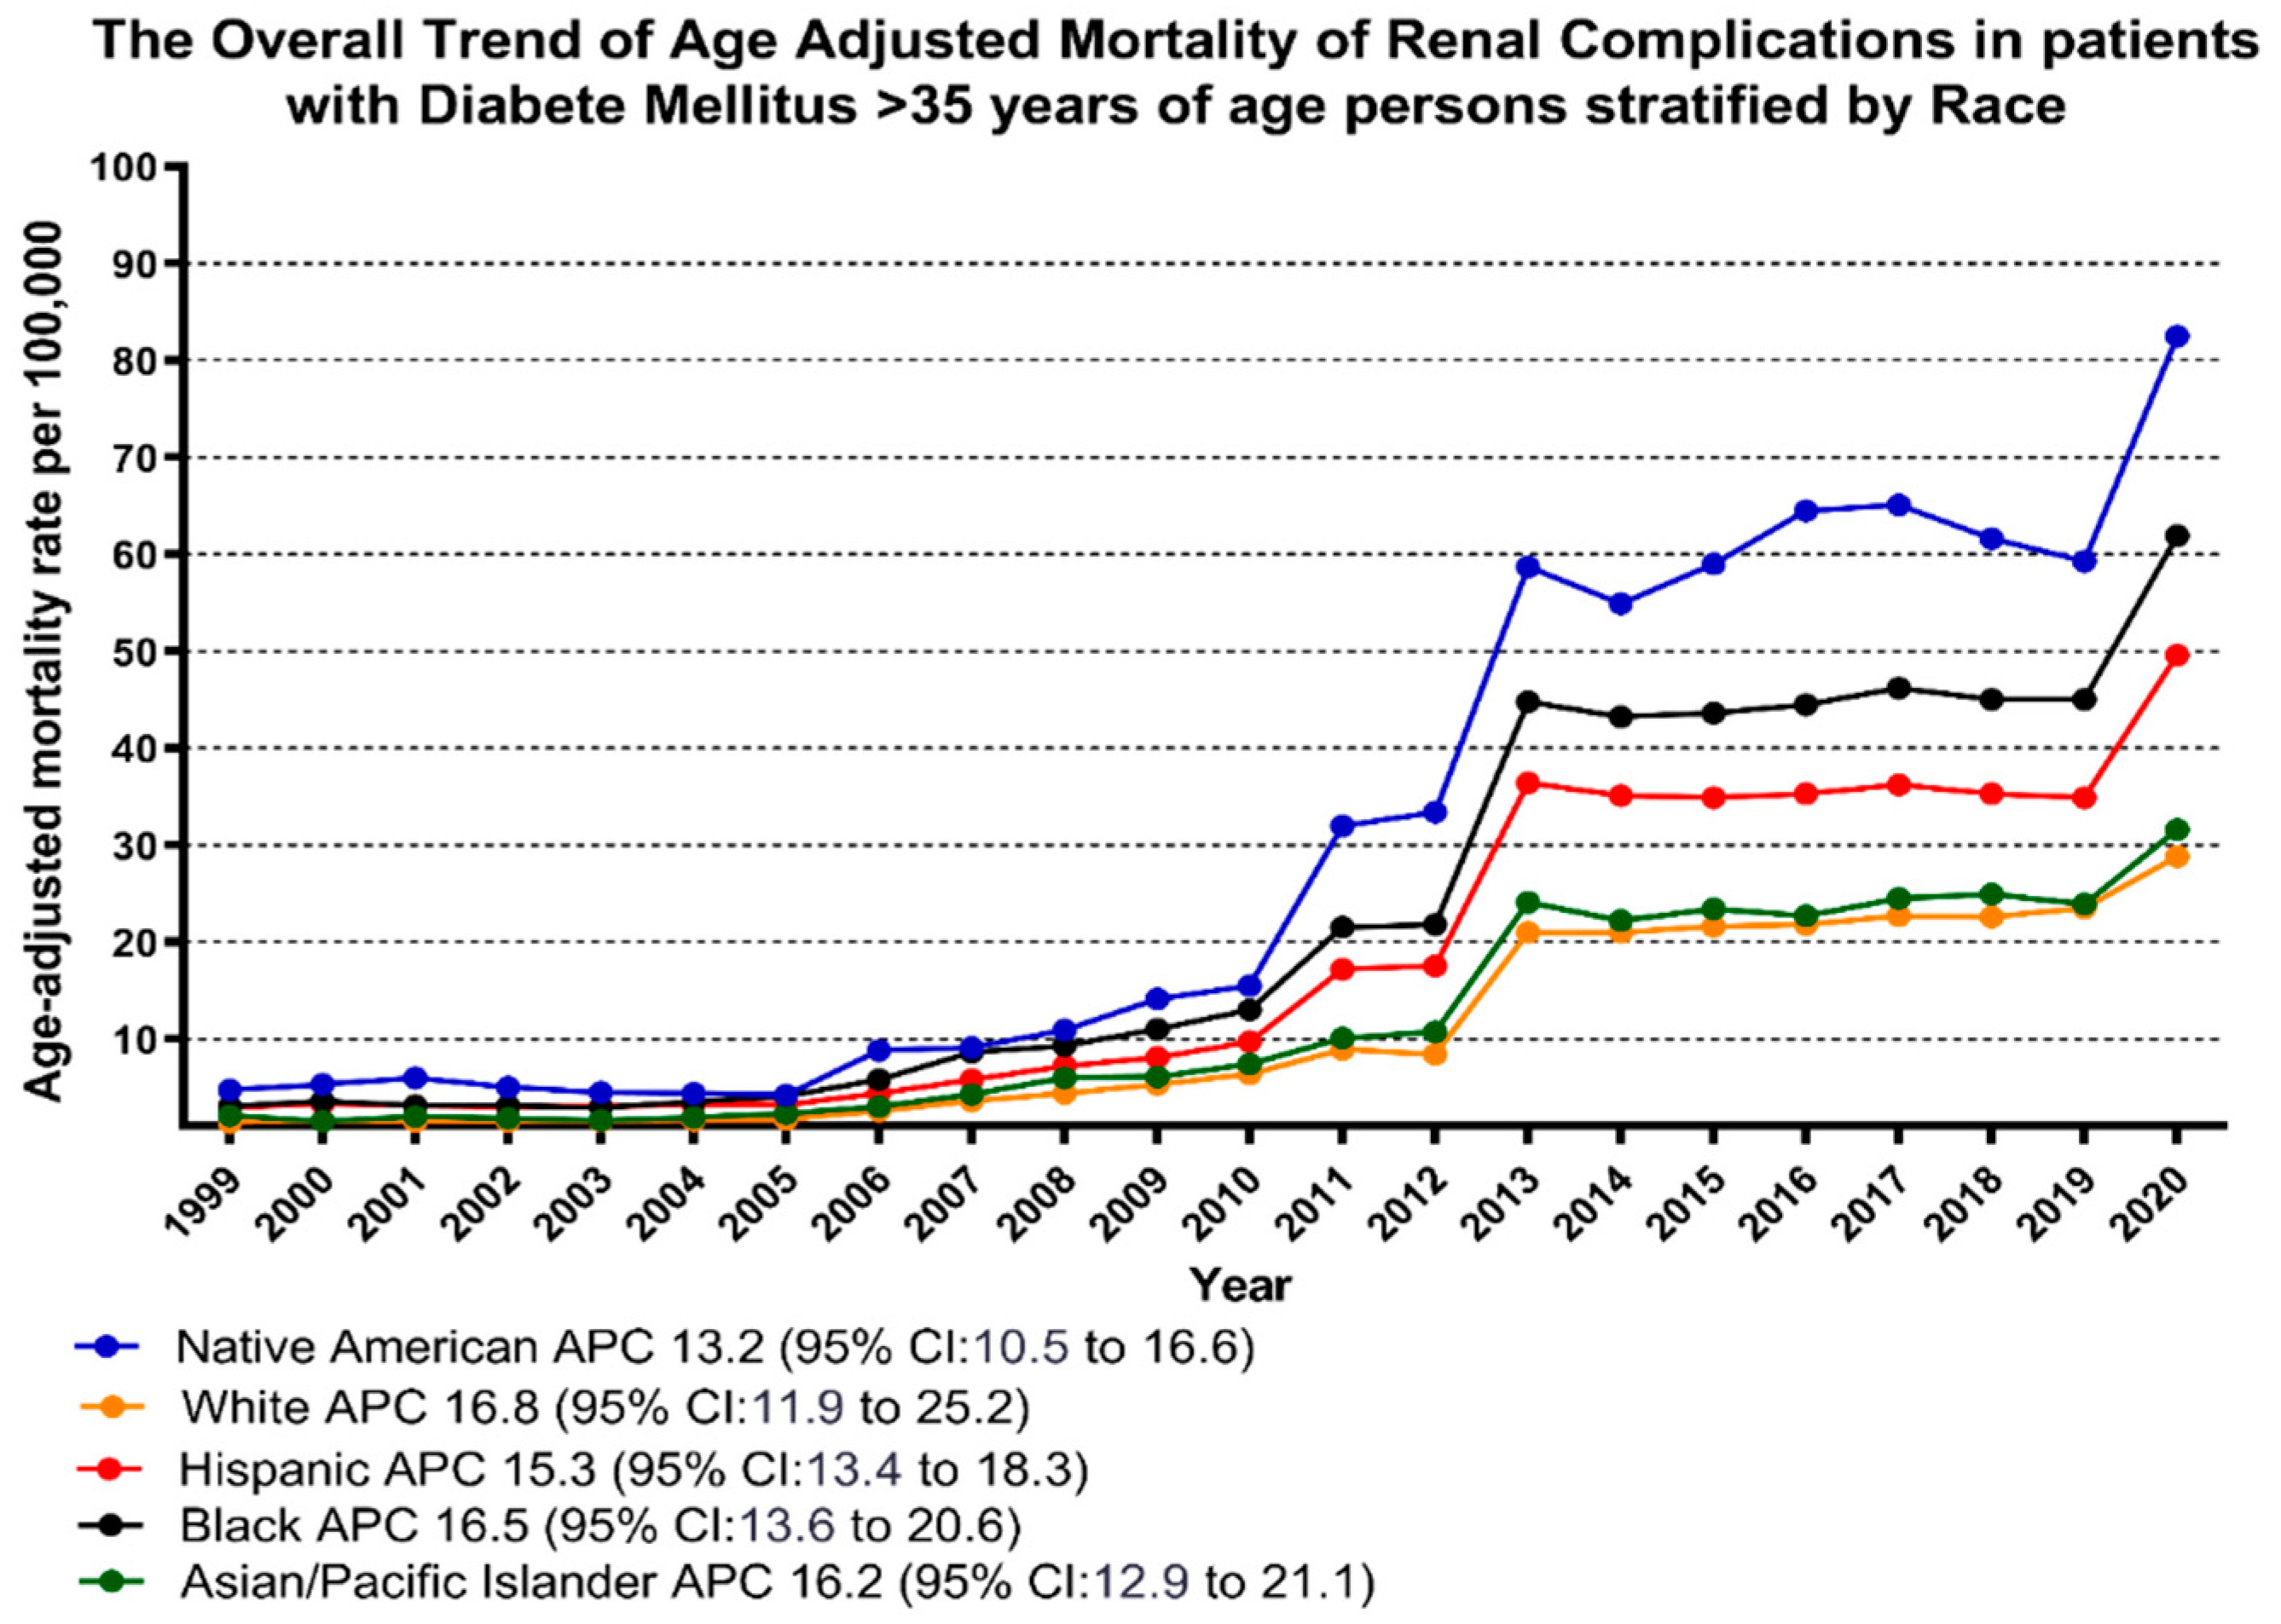
When stratified by race/ethnicity, AAMR was highest among American Indian/Alaska Native, followed by Black/African American, Hispanic, Asian/Pacific Islander, and White populations (overall AAMR American Indian/Alaska Native: 36.1, 95% CI: 35.2-36.9; Black/African American: 25.5, 95% CI: 25.3-25.7; Hispanic: 22.5, 95% CI: 22.4-22.7; Asian/Pacific Islander: 15.4, 95% CI: 15.2-15.6; White: 11.4, 95% CI: 11.4-11.5 )
The AAMR of American Indian/Alaska Natives slightly decreased from 1999 to 2005 (APC: -2.79; 95% CI: -30.45-12.84), followed by a significant increase from 2005 to 2013 (APC: 35.91; 95% CI: 29.51-55.89), and then steadily increased from 2013 to 2020 (APC: 4.73; 95% CI: 1.78-7.60).
The AAMR trend of Black/African American, Asian/Pacific Islander, and White followed the same pattern, progressively increasing from 1999 to 2010 (Black/African American: APC: 17.48; 95% CI: -16.02-26.89; Asian/Pacific Islander: APC: 16.85; 95% CI: -22.56-28.84; White: APC: 16.74; 95% CI: -40.94-35.73), followed by a dramatic increase from 2010 to 2013 (Black/African American: APC: 47.73; 95% CI: 25.1-63.27; Asian/Pacific Islander: APC: 45.58; 95% CI: 2.88-60.93; White: APC: 51.76; 95% CI: 6.27-70.78), and then again followed by a slight increase from 2013 until the end of the study in 2020 (Black/African American: APC: 3.91; 95% CI: 0.26-7; Asian/Pacific Islander: APC: 4.57; 95% CI: 0.79-9.22; White: APC: 4.42; 95% CI: 2.08-7.06).
The AAMR of Hispanics/Latinos steadily increased from 1999 to 2009 (APC: 11.18; 95% CI: -1.32-9.22), followed by a massive increase from 2009 to 2013 (APC: 50.33; 95% CI: 28.09-70.14), then gradually decreased from 2013 to 2018 (APC: -0.47; 95% CI: 7.71-11.91), and finally increased again progressively from 2018 to 2020 (APC: 17.16; 95% CI: 5.35-26.04). (
Figure 2,
Supplementary Tables S3 and S5).
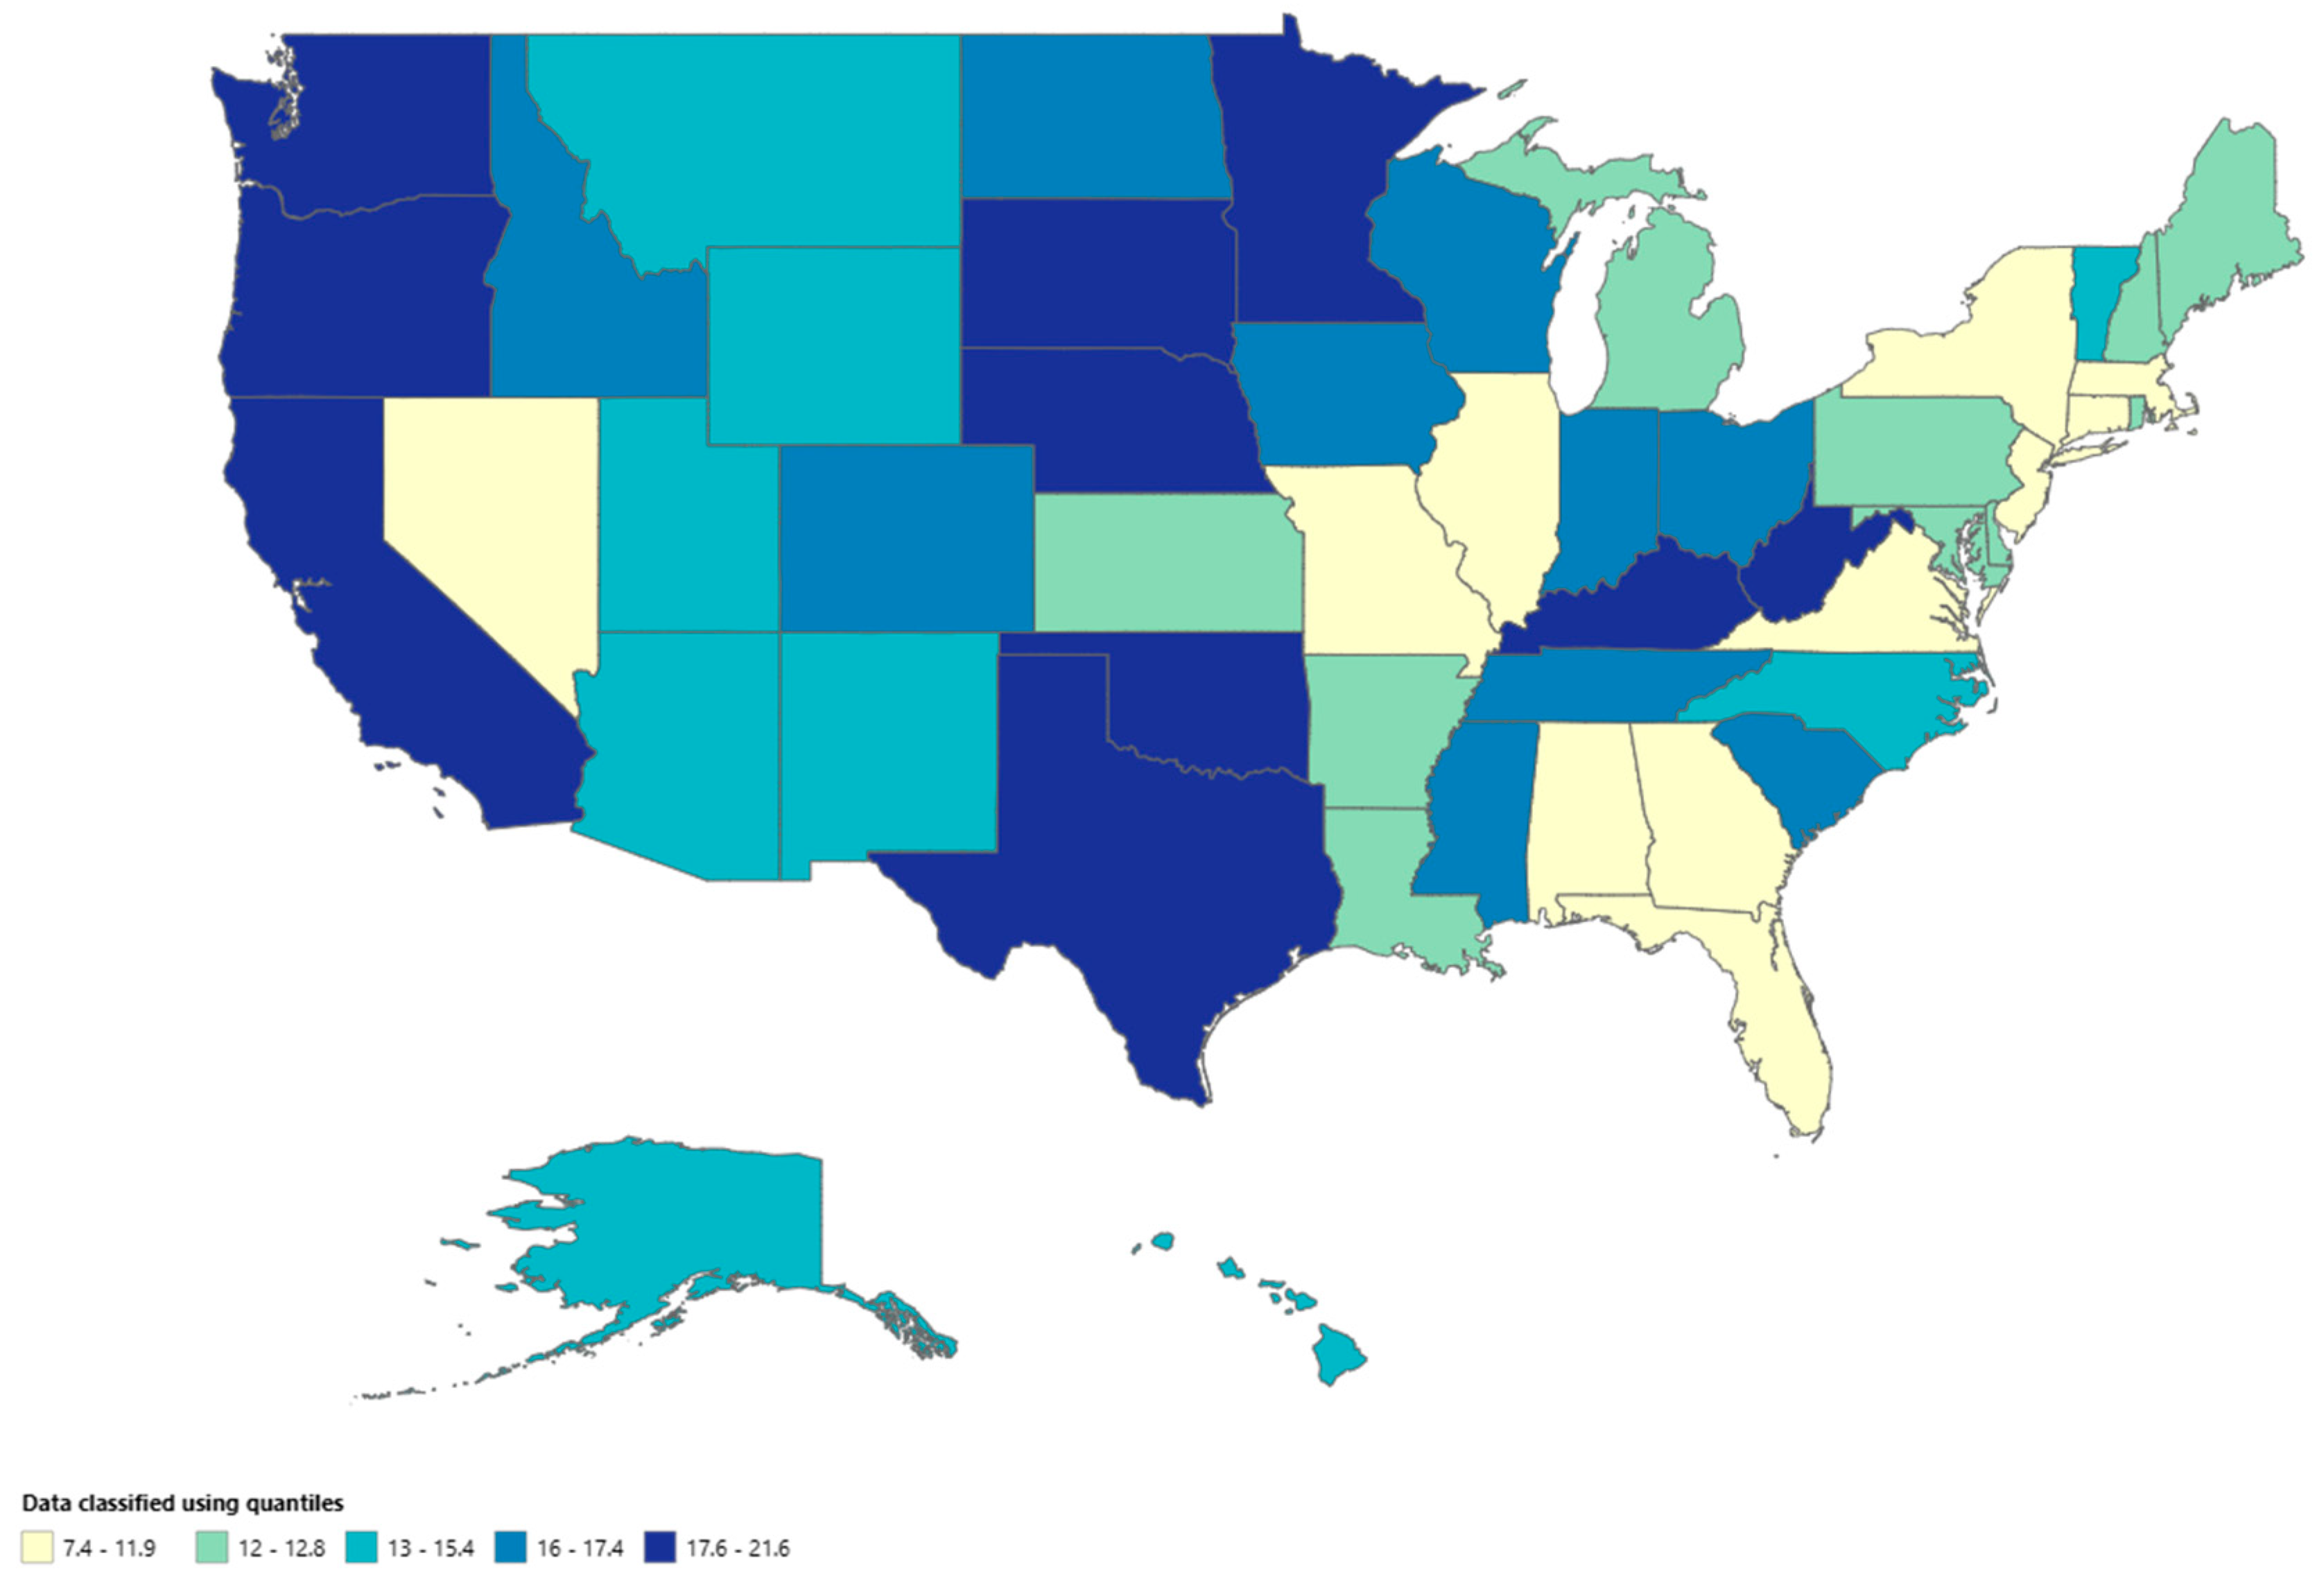
A significant difference in AAMR was observed in different states, with the AAMR ranging from 21.2 (95% CI: 20.8-21.7) in Oklahoma to 7 (95% CI: 6.8-7.3) in Connecticut. States falling into the top 90th percentile were Kentucky, Minnesota, Mississippi, Nebraska, Oklahoma, Oregon, South Dakota, Washington, and West Virginia, which had approximately two times the AAMR compared to states that fell into the lower 10th percentile, namely, Connecticut, Florida, Illinois, Massachusetts, Nevada, New Jersey and New York (
Figure 3,
Supplementary Table S6).
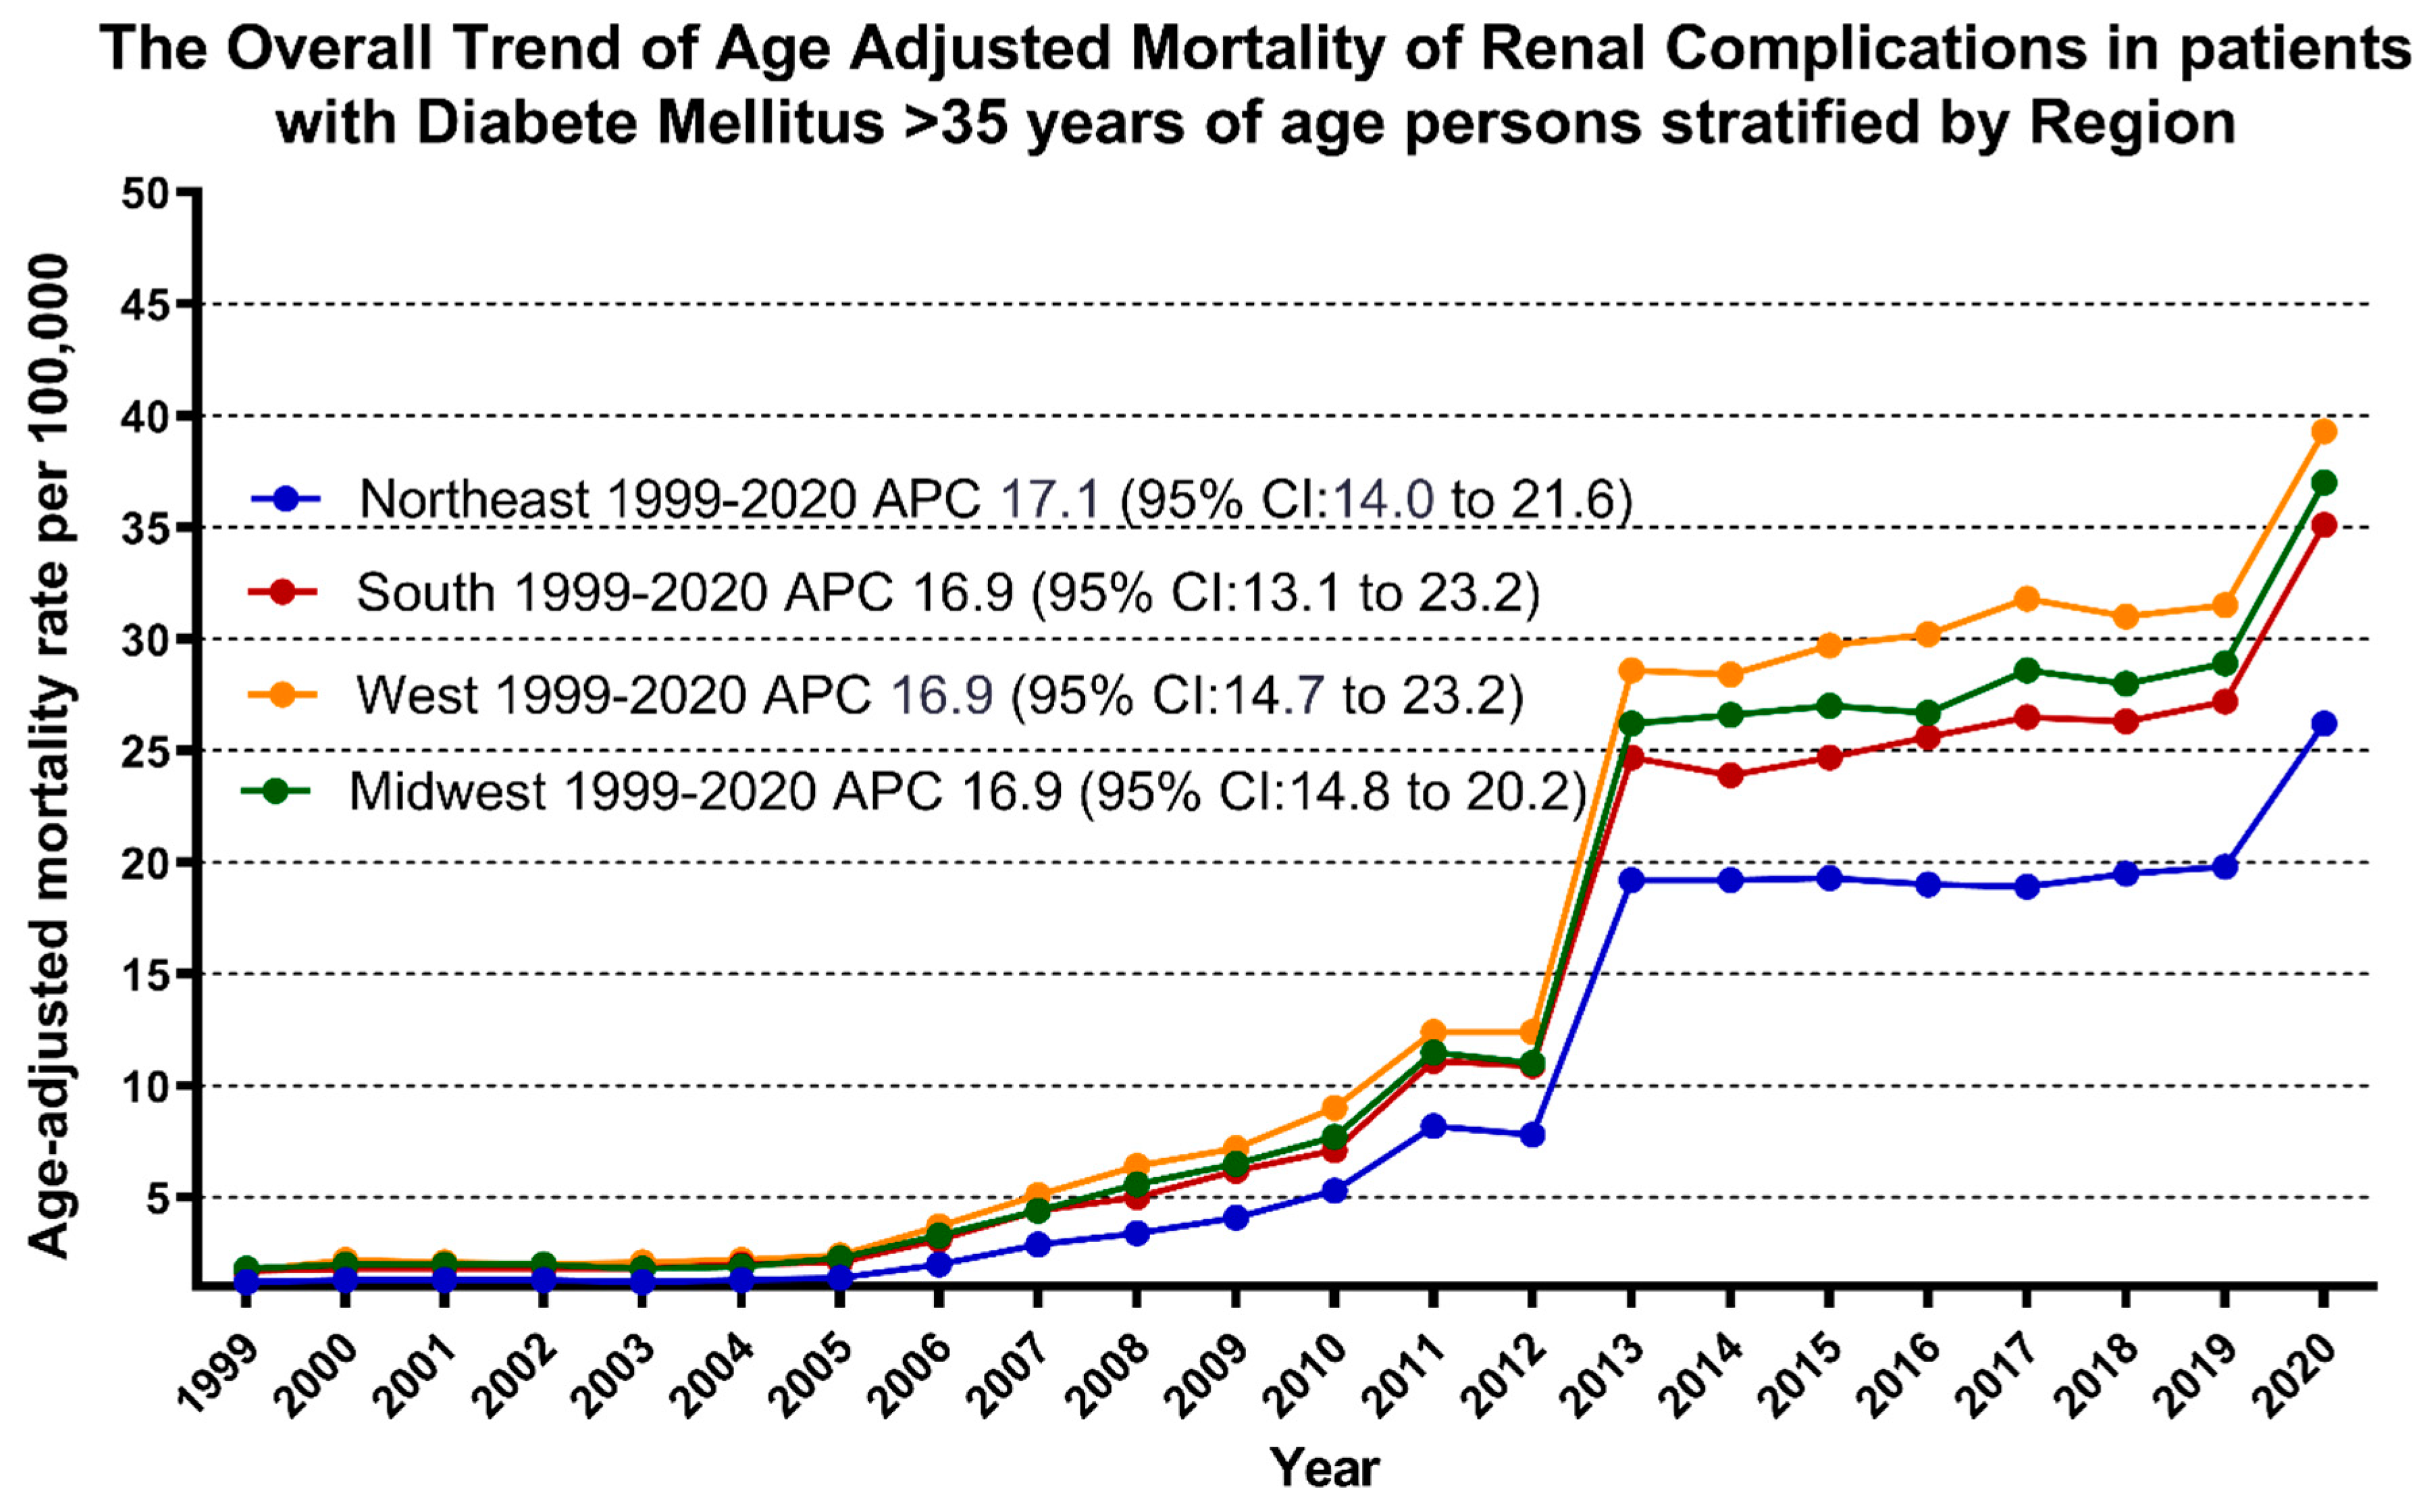
On average, throughout the study period, the highest mortality was observed in the Western (AAMR: 16.6; 95% CI: 16.5-16.7), followed by the Midwestern region (AAMR: 14.4; 95% CI: 14.314.4), Southern (AAMR: 14.1; 95% CI: 14-14.2), and Northeastern regions (AAMR: 9.9; 95% CI: 9.8-10) (
Figure 4,
Supplementary Table S7).
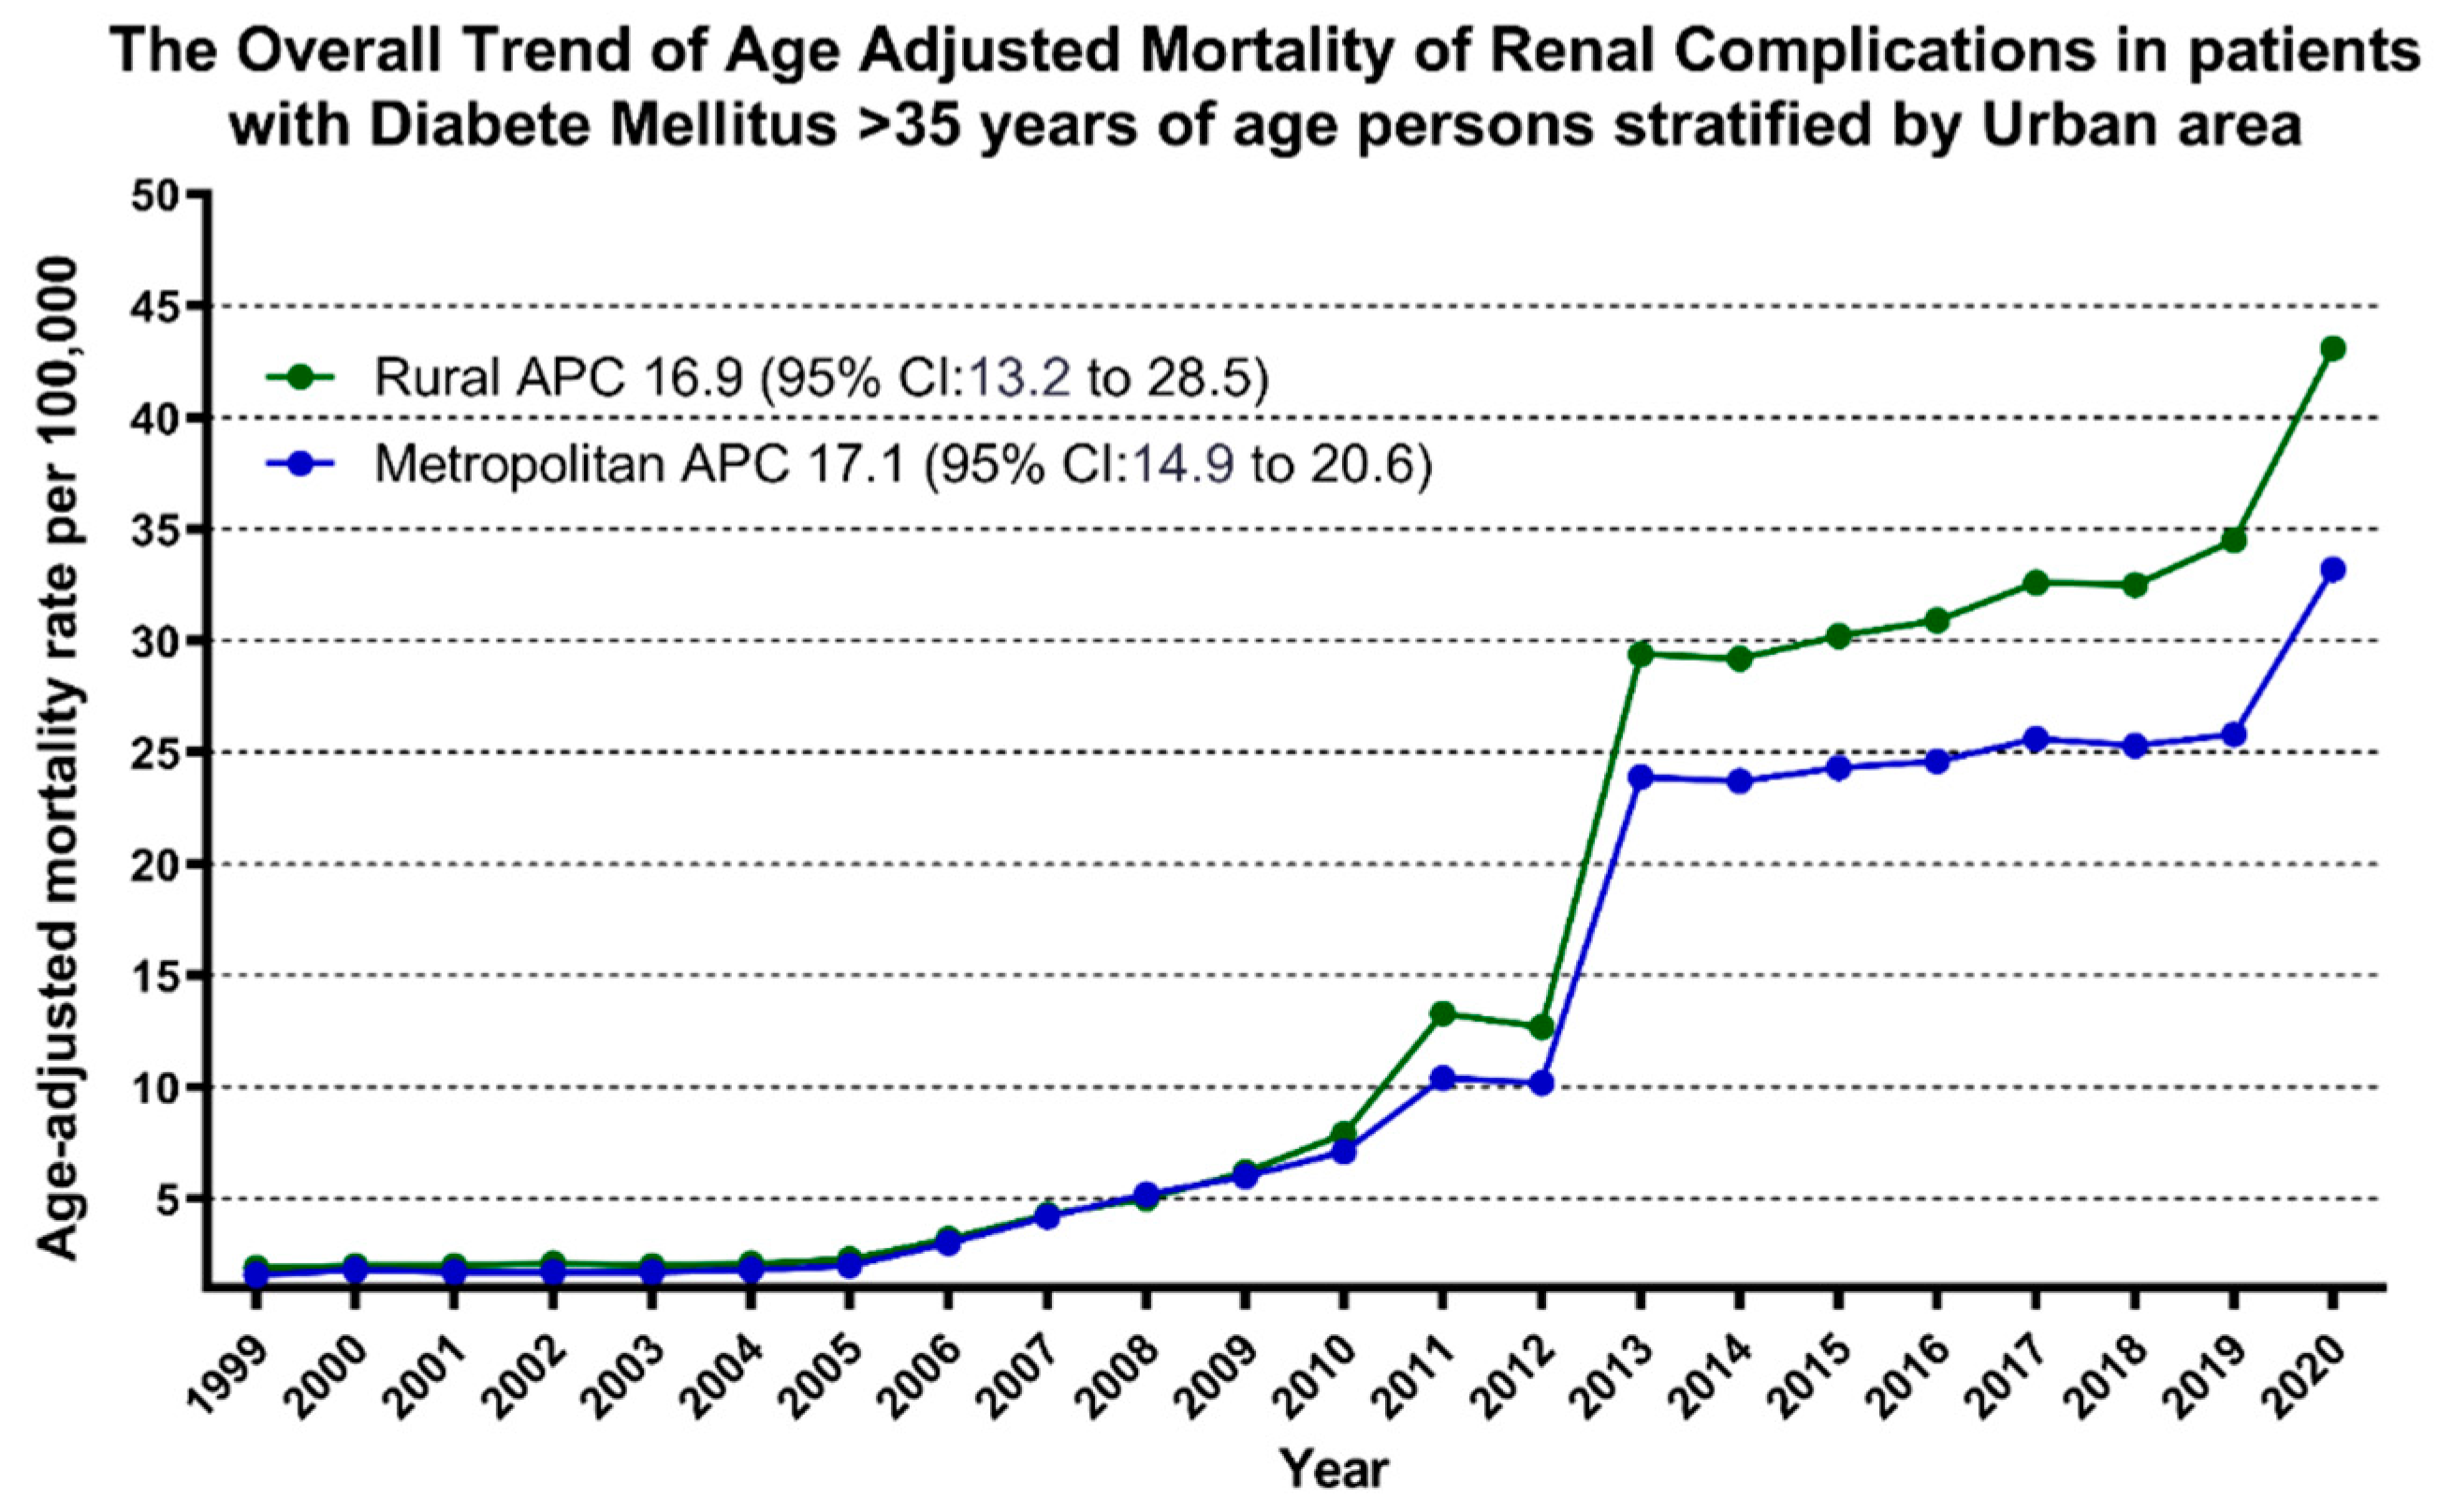
Nonmetropolitan areas had consistently higher AAMR than metropolitan areas throughout the study period, with an overall AAMR of 16 (95% CI: 15.9-16.1) and 13.5 (95% CI: 13.4-13.5), respectively. AAMR of nonmetropolitan steadily ascended from 1999 to 2009 (APC: 14.80, 95% CI: -5.31-22.87), followed by a dramatic increase from 2009 to 2013 (APC: 47.93, 95% CI: 34.62-67.98), and then slightly increased from 2013 till the end of the study in 2020 (APC: 5.41, 95% CI: 2.46-8.19). Similarly, the AAMR of metropolitan areas steadily ascended from 1999 to 2010 (APC: 16.23, 95% CI: -34.35-192.1), followed by a dramatic increase from 2010 to 2013 (APC: 54.49, 95% CI: 1.78-72.14), followed by a slight increase from 2013 to 2018(APC: 1.40, 95% CI: -4.32-55.78), and then again significantly increased from 2018 to 2020 (APC: 13.48, 95% CI: 3.47-20.85) (
Figure 5,
Supplementary Tables S3 and S8).
Discussion
The results of our study offer valuable insights into the evolving trends of mortality associated with renal complications among diabetic patients in the United States through the past two decades, from 1999 to 2020. Previous research examining mortality trends linked to diabetic nephropathy has similarly pointed towards an increase in mortality rates [
19]. We analyzed national mortality data to explain patterns, disparities, and potential contributing factors to guide preventive strategies and improve clinical management for this vulnerable population.
Our analysis demonstrates that a total of 525,804 deaths in the U.S. were attributed to diabetes-related renal complications from 1999 to 2020, primarily within medical facilities (39.78%). Annual trends showed a significant increase in AAMR from 1.6 in 1999 to 34.9 by the conclusion of the study period 2020, with fluctuations over the years. Men consistently exhibited higher AAMR compared to women throughout the study period. AAMR varied across racial/ethnic groups, with the highest rate among the American Indian/Alaska Native population. Geographically, significant differences in AAMR were evident among states and regions, with Western states and nonmetropolitan areas consistently showing higher AAMR rates throughout the study period.
AAMR exhibited a consistent upward trend from 1999 until the study's conclusion in 2020. The overall AAMR for diabetes-related renal complications slightly increased from 1999 to 2010, followed by a marked increase from 2010 to 2013, from 2013 to 2018, and then it significantly increased from 2018 to 2020. The continuous upward trend in AAMR likely stems from a complex interplay of factors, including the increasing disease prevalence, longer disease duration, suboptimal glycemic control, presence of comorbidities, healthcare access, and quality issues, as well as environmental and lifestyle factors [
20].
The analysis revealed a consistent pattern of higher AAMR among males than females throughout the study period. This gender disparity may be due to inherent biological elements, behavioral factors, healthcare utilization, and occupational exposure. Additionally, men tend to engage in more hazardous behavior, such as unhealthy dietary habits and higher rates of smoking and alcohol consumption, which can exacerbate the progression of diabetes and its complications [
21].
Moreover, significant disparities in AAMR were observed across racial and ethnic groups, with American Indian/Alaska Native and white populations having the highest and lowest AAMR, respectively. The average life expectancy in the United States for American Indians is 72.8 years old, which is 6.9 years lower than that for white Americans [
22]. These disparities may be influenced by genetic predispositions, cultural factors, and historical trauma, which may affect health behaviors and healthcare utilization, alongside socioeconomic disparities that encompass limited healthcare access and lower socioeconomic status. These factors are linked to a higher prevalence of health issues such as diabetes and a lower likelihood of rehabilitation success [
23]. Moreover, higher rates of comorbidities within these communities, such as obesity and hypertension, contribute to the increased burden of diabetic complications. Research consistently shows that American Indian children and adolescents have a higher prevalence of overweight and obesity compared to their white counterparts [
24,
25,
26].
In addition, we also observed significant geographical variations in AAMR, with the Western region having the highest-burden compared to other U.S. regions, and it may occur because of macro social determinants of health [
27]. The western region of the U.S., especially in rural areas, faces significant challenges in accessing quality healthcare [
28,
29]. These challenges are exacerbated by economic instability, leading to higher poverty rates and an aging population [
27]. Factors such as distance to healthcare facilities and overall satisfaction with care can influence the preference for a particular healthcare source [
30].
Nonmetropolitan areas consistently recorded higher AAMR than metropolitan areas over the study period. This trend can be attributed to several interrelated factors. Firstly, nonmetropolitan regions often face limited access to healthcare resources, including fewer hospitals, specialists, and medical services [
31]. Consequently, residents may experience delays in receiving essential medical treatment, leading to adverse health outcomes and, ultimately, higher mortality rates. Secondly, nonmetropolitan areas frequently grapple with health disparities stemming from socioeconomic factors such as poverty, lower education levels, and a higher prevalence of unhealthy behaviors like smoking and poor diet choices [
32]. These disparities contribute to a higher burden of chronic diseases and overall worse health outcomes in these areas. Additionally, nonmetropolitan populations tend to be older, as younger individuals often migrate to urban centers in search of opportunities [
33]. The aging population is with increased risk of age-related health issues, contributing to increased mortality rates. Environmental factors, such as exposure to pollution from agricultural activities or limited access to clean water sources, can also exacerbate health challenges in nonmetropolitan areas [
34].
Moreover, the shortage of healthcare providers and lack of infrastructure contribute to inadequate healthcare delivery and management of health conditions. Lastly, unhealthy lifestyle choices such as substance abuse and a sedentary lifestyle are more prevalent in nonmetropolitan regions, further compounding the health risks faced by residents [
36,
37]. Addressing these complex challenges requires comprehensive strategies that encompass improving healthcare access, socioeconomic conditions, public health interventions, and infrastructure development tailored to the unique needs of the nonmetropolitan communities.
Our study shows significant disparities in AAMR due to renal complications of diabetes across different states, ranging from 7 in Connecticut to 21.2 in Oklahoma. Several factors contribute to these disparities. Access to healthcare stands out as a critical determinant, with states offering better access to specialized clinics and timely screenings likely experiencing lower mortality rates [
38]. Socioeconomic factors such as income, education, and insurance coverage further exacerbate these differences, as individuals with higher socioeconomic status often have better access to resources and healthcare services. Cultural values, dietary habits, and lifestyle choices also influence outcomes, with states embracing healthier habits potentially experiencing lower mortality rates [
39]. Addressing these multifaceted factors through targeted interventions and policies is crucial to narrowing the gap in AAMR due to diabetes-related renal complications across different states and improving outcomes among individuals with diabetes nationwide.
Limitations
The study faced several limitations that merit attention. Firstly, it relied primarily on the CDC WONDER database, which records death certificates but may have inaccuracies or omissions. Moreover, the study exclusively focused on individuals aged 35 and above, potentially overlooking variations in younger age groups. Interpretation of trends may have been influenced by unaccounted factors, introducing biases in the conclusions. Moreover, the lack of clinical data, such as specific biomarkers, treatment methods, lab results, or therapeutic approaches, made it challenging to comprehend the increase in fatalities. The lack of detailed subgroup analyses for different occurrences of diabetes-related renal complications resulted in a knowledge gap, hindering the identification of underlying causes for rising death rates. Lastly, socioeconomic factors, influence on health outcomes, and data on medical treatments were not considered.
Conclusion
The analysis of renal complications of diabetes-related mortality data spanning 1999 to 2020 reveals an alarming increasing trend in AAMRs, emphasizing the burden on public health. Significant disparities exist across racial and ethnic groups and gender. The highest AAMR was observed in American Indian/Alaska Natives and men, respectively. Additionally, geographic differences play an impact, as seen with the consistently higher AAMR observed in non-metropolitan and Western states. Thus, it is imperative to implement focused interventions and enhance healthcare accessibility to alleviate the burden of renal complications associated with diabetes and enhance overall health outcomes nationwide.
Supplementary Materials
The following supporting information can be downloaded at the website of this paper posted on Preprints.org.
Author Contributions
All authors of this Article (paper) have directly participated in the planning, execution, or analysis of this study.
Ethics approval and consent to participate
not applicable.
Consent for Publication
All authors consent for the publication.
Availability of Data and Materials
available upon request.
Competing Interests
none.
Abbreviation List
| APC |
Annual Percentage Change |
| AAPC |
Average Annual Percentage Change |
| AAMR |
Age-adjusted mortality rate |
| CDC |
WONDER Centers for Disease Control and Prevention Wide-Ranging Online Data for Epidemiologic Research |
| CI |
Confidence interval |
| ICD |
International Classification of Disease |
| HHD |
Hypertensive heart disease |
| IRB |
Institutional Review Board |
| NH |
non-Hispanic |
| STROBE |
Strengthening the Reporting of Observational Studies in Epidemiology |
| US |
United States |
References
- "(7) (PDF) Pathophysiology of secondary complications of diabetes mellitus." Accessed: Mar. 24, 2024. [Online]. Available: https://www.researchgate.net/publication/290455800_Pathophysiology_of_secondary_complications_of_diabetes_mellitus.
- S. John, "Complication in diabetic nephropathy," Diabetes Metab. Syndr., vol. 10, no. 4, pp. 247–249, 2016. [CrossRef]
- C. Maric and J. E. Hall, "Obesity, metabolic syndrome and diabetic nephropathy," Contrib. Nephrol., vol. 170, pp. 28–35, 2011. [CrossRef]
- N. Papadopoulou-Marketou, S. A. Paschou, N. Marketos, S. Adamidi, S. Adamidis, and C. Kanaka-Gantenbein, "Diabetic nephropathy in type 1 diabetes," Minerva Med., vol. 109, no. 3, pp. 218–228, Jun. 2018. [CrossRef]
- A. Kowalski, A. Krikorian, and E. V. Lerma, "Diabetes and chronic kidney disease," Dis.--Mon. D.M., vol. 61, no. 9, pp. 378–386, Sep. 2015. [CrossRef]
- J. Hahr and M. E. Molitch, "Diabetes, cardiovascular risk and nephropathy," Cardiol. Clin., vol. 28, no. 3, pp. 467–475, Aug. 2010. [CrossRef]
- "Diabetic Nephropathy | Semantic Scholar." Accessed: Mar. 24, 2024. [Online]. Available: https://www.semanticscholar.org/topic/Diabetic-Nephropathy/18382.
- "National trends in the treatment of diabetic nephropathy in the United States - Ajiboye - 2017 - Journal of Clinical Pharmacy and Therapeutics - Wiley Online Library." Accessed: Mar. 24, 2024. [Online]. Available: https://onlinelibrary.wiley.com/doi/abs/10.1111/jcpt.12516.
- "CDC WONDER." Accessed: Mar. 24, 2024. [Online]. Available: https://wonder.cdc.gov/.
- “ICD-10 Version:2019.” Accessed: Mar. 24, 2024. [Online]. Available: https://icd.who.int/browse10/2019/en.
- S. Cuschieri, "The STROBE guidelines," Saudi J. Anaesth., vol. 13, no. Suppl 1, pp. S31–S34, Apr. 2019. [CrossRef]
- "Data Access - Urban Rural Classification Scheme for Counties." Accessed: Mar. 24, 2024. [Online]. Available: https://www.cdc.gov/nchs/data_access/urban_rural.htm.
- "Census.gov." Accessed: Mar. 24, 2024. [Online]. Available: https://www.census.gov/.
- "Mortality Mapping Help - Section 3.1 | WISQARS | Injury Center | CDC." Accessed: Mar. 24, 2024. [Online]. Available: https://www.cdc.gov/injury/wisqars/mapping_help/crude_rate.html.
- Accessed: Mar. 24, 2024. [Online]. Available: https://health.mo.gov/data/mica/CDP_MICA/AARate.html.
- "Joinpoint Regression Program." Accessed: Mar. 24, 2024. [Online]. Available: https://surveillance.cancer.gov/joinpoint/.
- R. N. Anderson and H. M. Rosenberg, "Age standardization of death rates: implementation of the year 2000 standard," Natl. Vital Stat. Rep. Cent. Dis. Control Prev. Natl. Cent. Health Stat. Natl. Vital Stat. Syst., vol. 47, no. 3, pp. 1–16, 20, Oct. 1998.
- "What Is a Two-Tailed Test? Definition and Example," Investopedia. Accessed: Mar. 24, 2024. [Online]. Available: https://www.investopedia.com/terms/t/two-tailed-test.asp.
- J. N. Harvey, "Trends in the prevalence of diabetic nephropathy in type 1 and type 2 diabetes," Curr. Opin. Nephrol. Hypertens., vol. 12, no. 3, pp. 317–322, May 2003. [CrossRef]
- P. Shrestha and L. Ghimire, "A Review about the Effect of Life style Modification on Diabetes and Quality of Life," Glob. J. Health Sci., vol. 4, no. 6, pp. 185–190, Nov. 2012. [CrossRef]
- "Prospective study of cigarette smoking, alcohol use, and the risk of diabetes in men. - PMC." Accessed: Mar. 24, 2024. [Online]. Available: https://www.ncbi.nlm.nih.gov/pmc/articles/PMC2548937/.
- J. Dankovchik, M. J. Hoopes, V. Warren-Mears, and E. Knaster, "Disparities in Life Expectancy of Pacific Northwest American Indians and Alaska Natives: Analysis of Linkage-Corrected Life Tables," Public Health Rep., vol. 130, no. 1, pp. 71–80, 2015.
- S. A. Mohammed, "The dynamic interplay between low socioeconomic status and diabetes for urban American Indians," Fam. Community Health, vol. 34, no. 3, pp. 211–220, 2011. [CrossRef]
- M. Ness, D. T. Barradas, J. Irving, and S. E. Manning, "Correlates of overweight and obesity among American Indian/Alaska Native and Non-Hispanic White children and adolescents: National Survey of Children's Health, 2007," Matern. Child Health J., vol. 16 Suppl 2, no. 0 2, pp. 268–277, Dec. 2012. [CrossRef]
- "Overweight and Obesity Among North American Indian Infants, Children, and Youth - PMC." Accessed: Mar. 24, 2024. [Online]. Available: https://www.ncbi.nlm.nih.gov/pmc/articles/PMC3514018/.
- E. Zephier, J. H. Himes, M. Story, and X. Zhou, "Increasing prevalences of overweight and obesity in Northern Plains American Indian children," Arch. Pediatr. Adolesc. Med., vol. 160, no. 1, pp. 34–39, Jan. 2006. [CrossRef]
- T. F. Borders, L. A. Aday, and K. T. Xu, "Factors associated with health-related quality of life among an older population in a largely rural western region," J. Rural Health Off. J. Am. Rural Health Assoc. Natl. Rural Health Care Assoc., vol. 20, no. 1, pp. 67–75, 2004. [CrossRef]
- K. Reavy, "The impact of recession on the health care of rural citizens in the northwest United States," Rural Remote Health, vol. 9, no. 3, p. 1270, 2009.
- "Predictors of Access to Healthcare: What Matters to Rural Appalachians? - PMC." Accessed: Mar. 24, 2024. [Online]. Available: https://www.ncbi.nlm.nih.gov/pmc/articles/PMC4776991/.
- "Access to health care in rural western New York State - PubMed." Accessed: Mar. 24, 2024. [Online]. Available: https://pubmed.ncbi.nlm.nih.gov/1488200/.
- E. Merwin, A. Snyder, and E. Katz, "Differential access to quality rural healthcare: professional and policy challenges," Fam. Community Health, vol. 29, no. 3, pp. 186–194, 2006. [CrossRef]
- K. Fiscella and D. R. Williams, "Health disparities based on socioeconomic inequities: implications for urban health care," Acad. Med. J. Assoc. Am. Med. Coll., vol. 79, no. 12, pp. 1139–1147, Dec. 2004. [CrossRef]
- "Hillman and Rothman - Movement of non-metropolitan youth towards the cit.pdf." Accessed: Mar. 24, 2024. [Online]. Available: https://research.acer.edu.au/cgi/viewcontent.cgi?article=1053&context=lsay_research.
- E. C. Wells et al., "Meeting the Water and Sanitation Challenges of Underbounded Communities in the U.S," Environ. Sci. Technol., vol. 56, no. 16, pp. 11180–11188, Aug. 2022. [CrossRef]
- T. F. Borders and H. Wen, "Illicit Drug and Opioid Use Disorders among Non-Metropolitan Residents".
- V. Carson, R. J. Iannotti, W. Pickett, and I. Janssen, "Urban and rural differences in sedentary behavior among American and Canadian youth," Health Place, vol. 17, no. 4, pp. 920–928, Jul. 2011. [CrossRef]
- E. Park, "[A comparative study of youth health risk behaviors by region: focused on metropolitan areas, medium sized and small city areas, and rural areas]," J. Korean Acad. Nurs., vol. 40, no. 1, pp. 14–23, Feb. 2010. [CrossRef]
- G. Gong, S. G. Phillips, C. Hudson, D. Curti, and B. U. Philips, "Higher U.S. Rural Mortality Rates Linked To Socioeconomic Status, Physician Shortages, And Lack Of Health Insurance," Health Aff. Proj. Hope, vol. 38, no. 12, pp. 2003–2010, Dec. 2019. [CrossRef]
- "U.S. state policy contexts and mortality of working-age adults | PLOS ONE." Accessed: Mar. 24, 2024. [Online]. Available: https://journals.plos.org/plosone/article?id=10.1371/journal.pone.0275466.
|
Disclaimer/Publisher’s Note: The statements, opinions and data contained in all publications are solely those of the individual author(s) and contributor(s) and not of MDPI and/or the editor(s). MDPI and/or the editor(s) disclaim responsibility for any injury to people or property resulting from any ideas, methods, instructions or products referred to in the content. |
© 2024 by the authors. Licensee MDPI, Basel, Switzerland. This article is an open access article distributed under the terms and conditions of the Creative Commons Attribution (CC BY) license (https://creativecommons.org/licenses/by/4.0/).