
Submitted:
09 November 2024
Posted:
11 November 2024
You are already at the latest version
Abstract
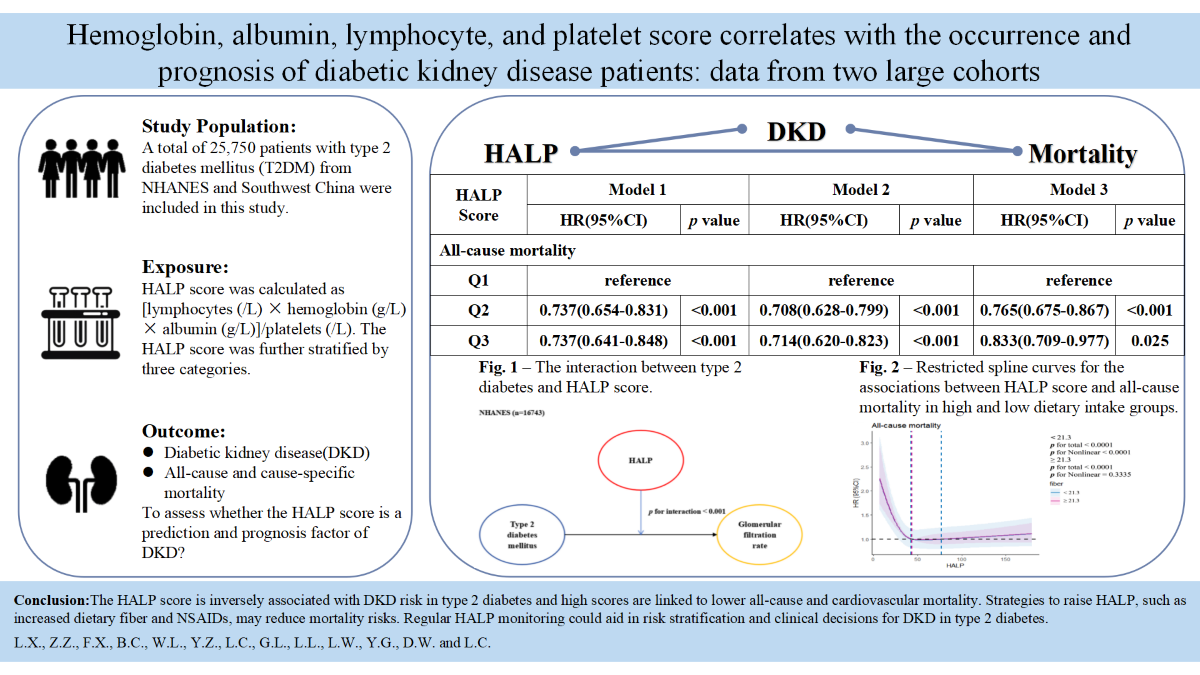
This study is intended to explore the relationship between the HALP score and the incidence as well as mortality of DKD in type 2 diabetes. We also evaluated whether reversing the HALP score could reduce mortality outcomes. This study included 25,750 type 2 diabetes patients from NHANES (1999–2018) and Southwest China (2013–2022). HALP score was calculated as [hemoglobin (g/L) × albumin (g/L)×lymphocytes (/L)]/platelets (/L). DKD was diagnosed based on ACR ≥30 mg/g and/or eGFR <60 mL/min/1.73m². The relationship between HALP score and DKD was explored using logistic regression model, and Cox regression models were used to evaluate its association with all-cause and cause-specific mortality. Subgroup analyses explored the effects of dietary fiber intake and NSAIDs use on HALP score and mortality. Higher HALP score were significantly associated with a lower risk of DKD (NHANES, HR 0.502; Southwest China, HR 0.528) in an antagonist manner. Additionally, higher HALP score was related to decreased all-cause (HR 0.765, p <0.001) and CVD-related mortality(HR 0.667, p <0.001).We also discovered the same outcome in DKD patients with low dietary fiber intake (HR 0.695, p <0.001) or NSAIDs use (HR 0.733, p <0.001). The magnitude of associations was not materially altered in any of the sensitivity analyses. High HALP score was independently associated with risk of DKD and its all-cause and cardiovascular mortality. Regular HALP monitoring could aid in risk stratification and clinical decisions for DKD in type 2 diabetes.
Keywords:
1. Introduction
2. Materials and Methods
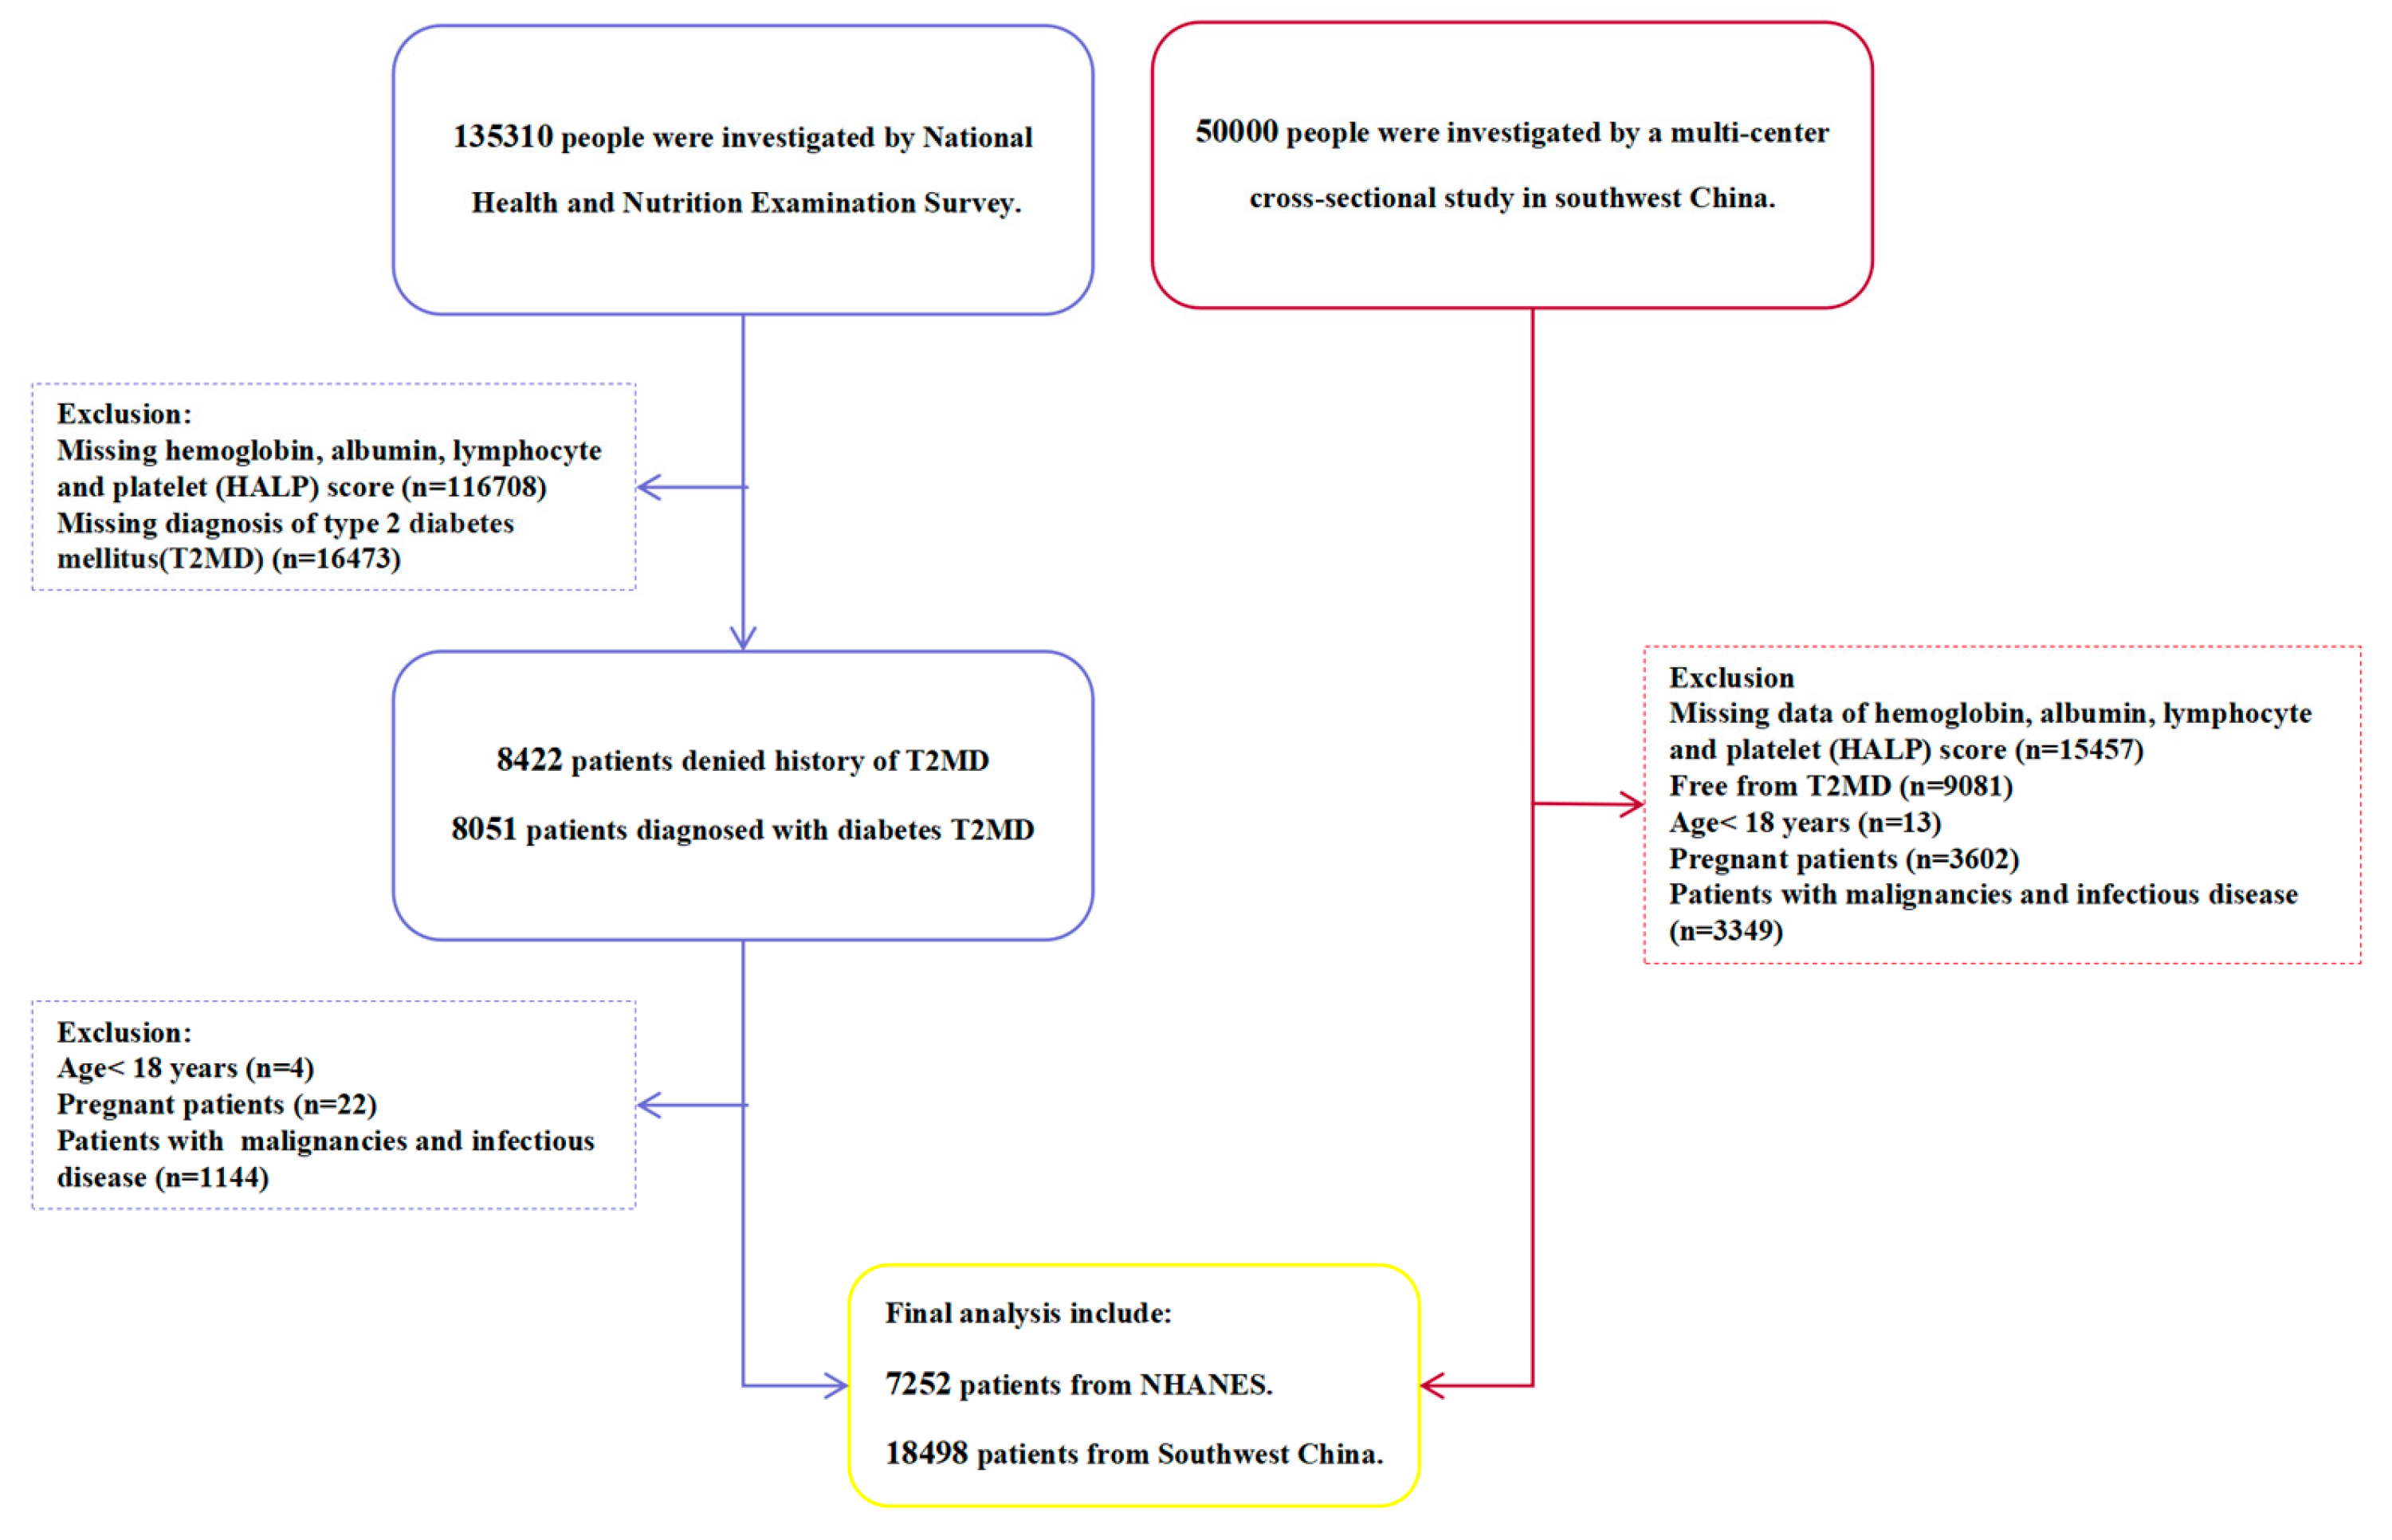
2.1. Study Population
2.2. Ascertainment of Outcomes
2.3. Assessment of Exposure
2.4. Assessment of Covariates
2.5. Statistical Analyses
2.6. Sensitivity Analyses
3. Results
3.1. Baseline Characteristics
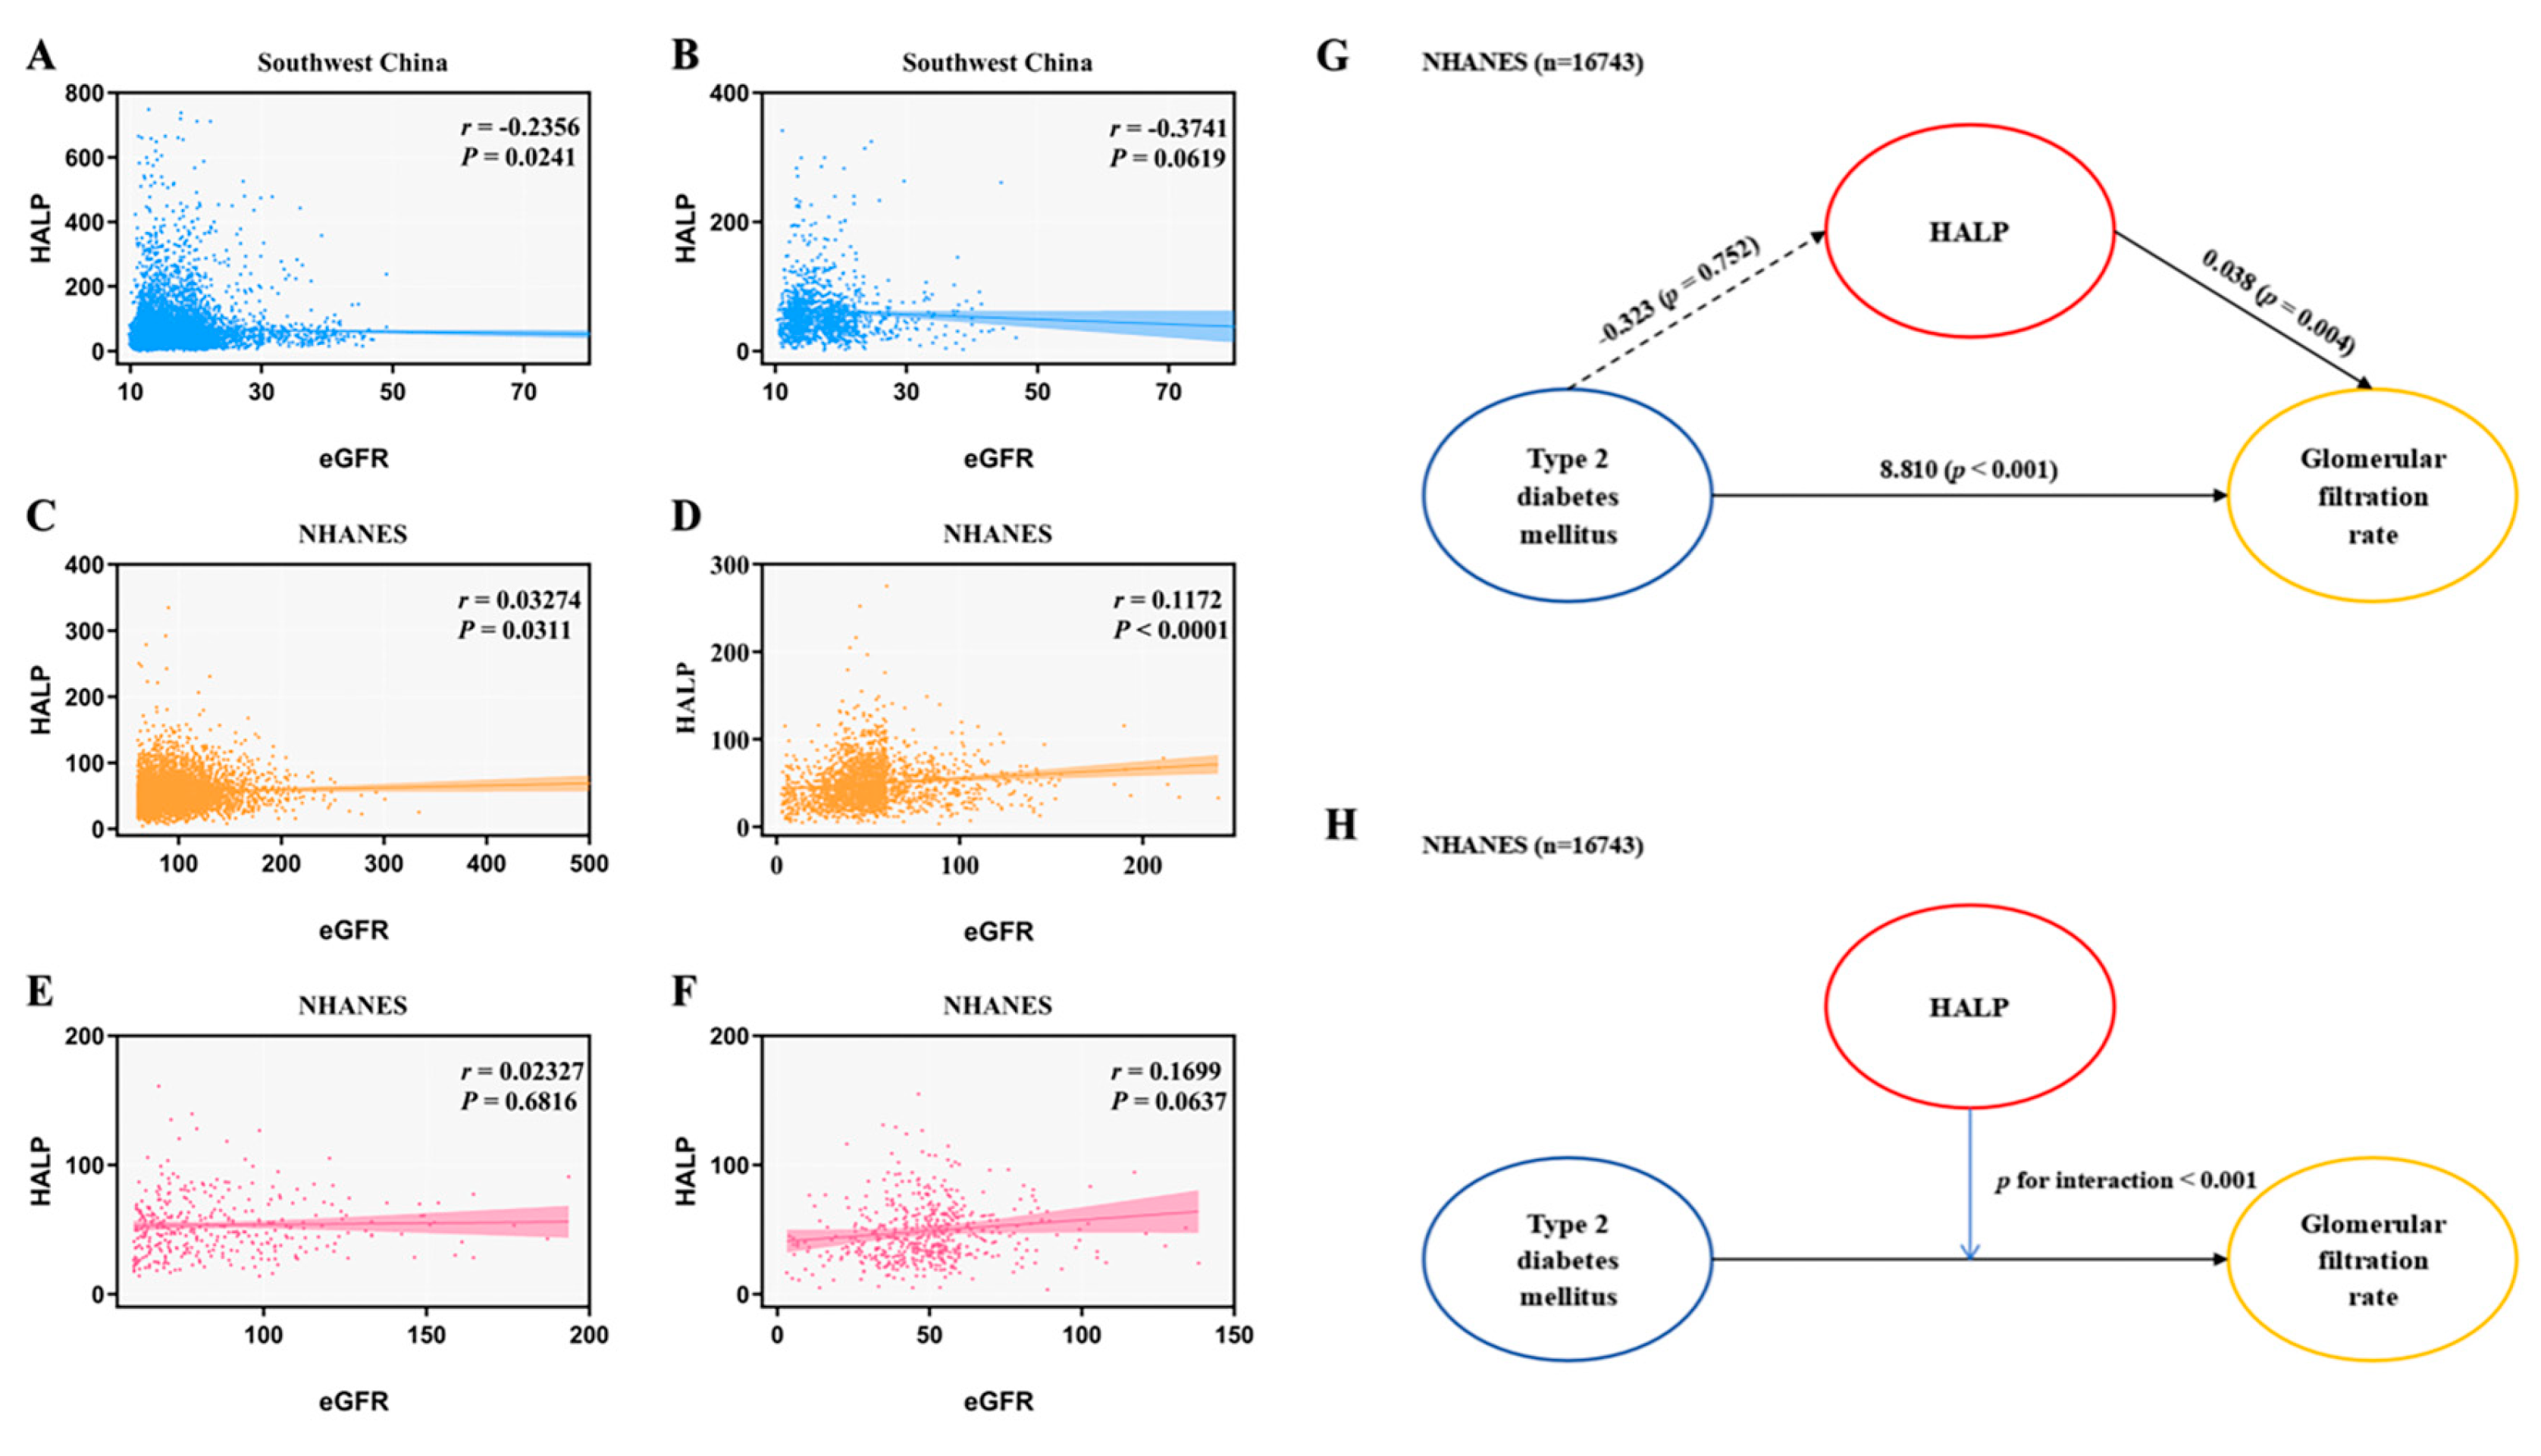
3.2. HALP Score and Risk of DKD in Type 2 Diabetes
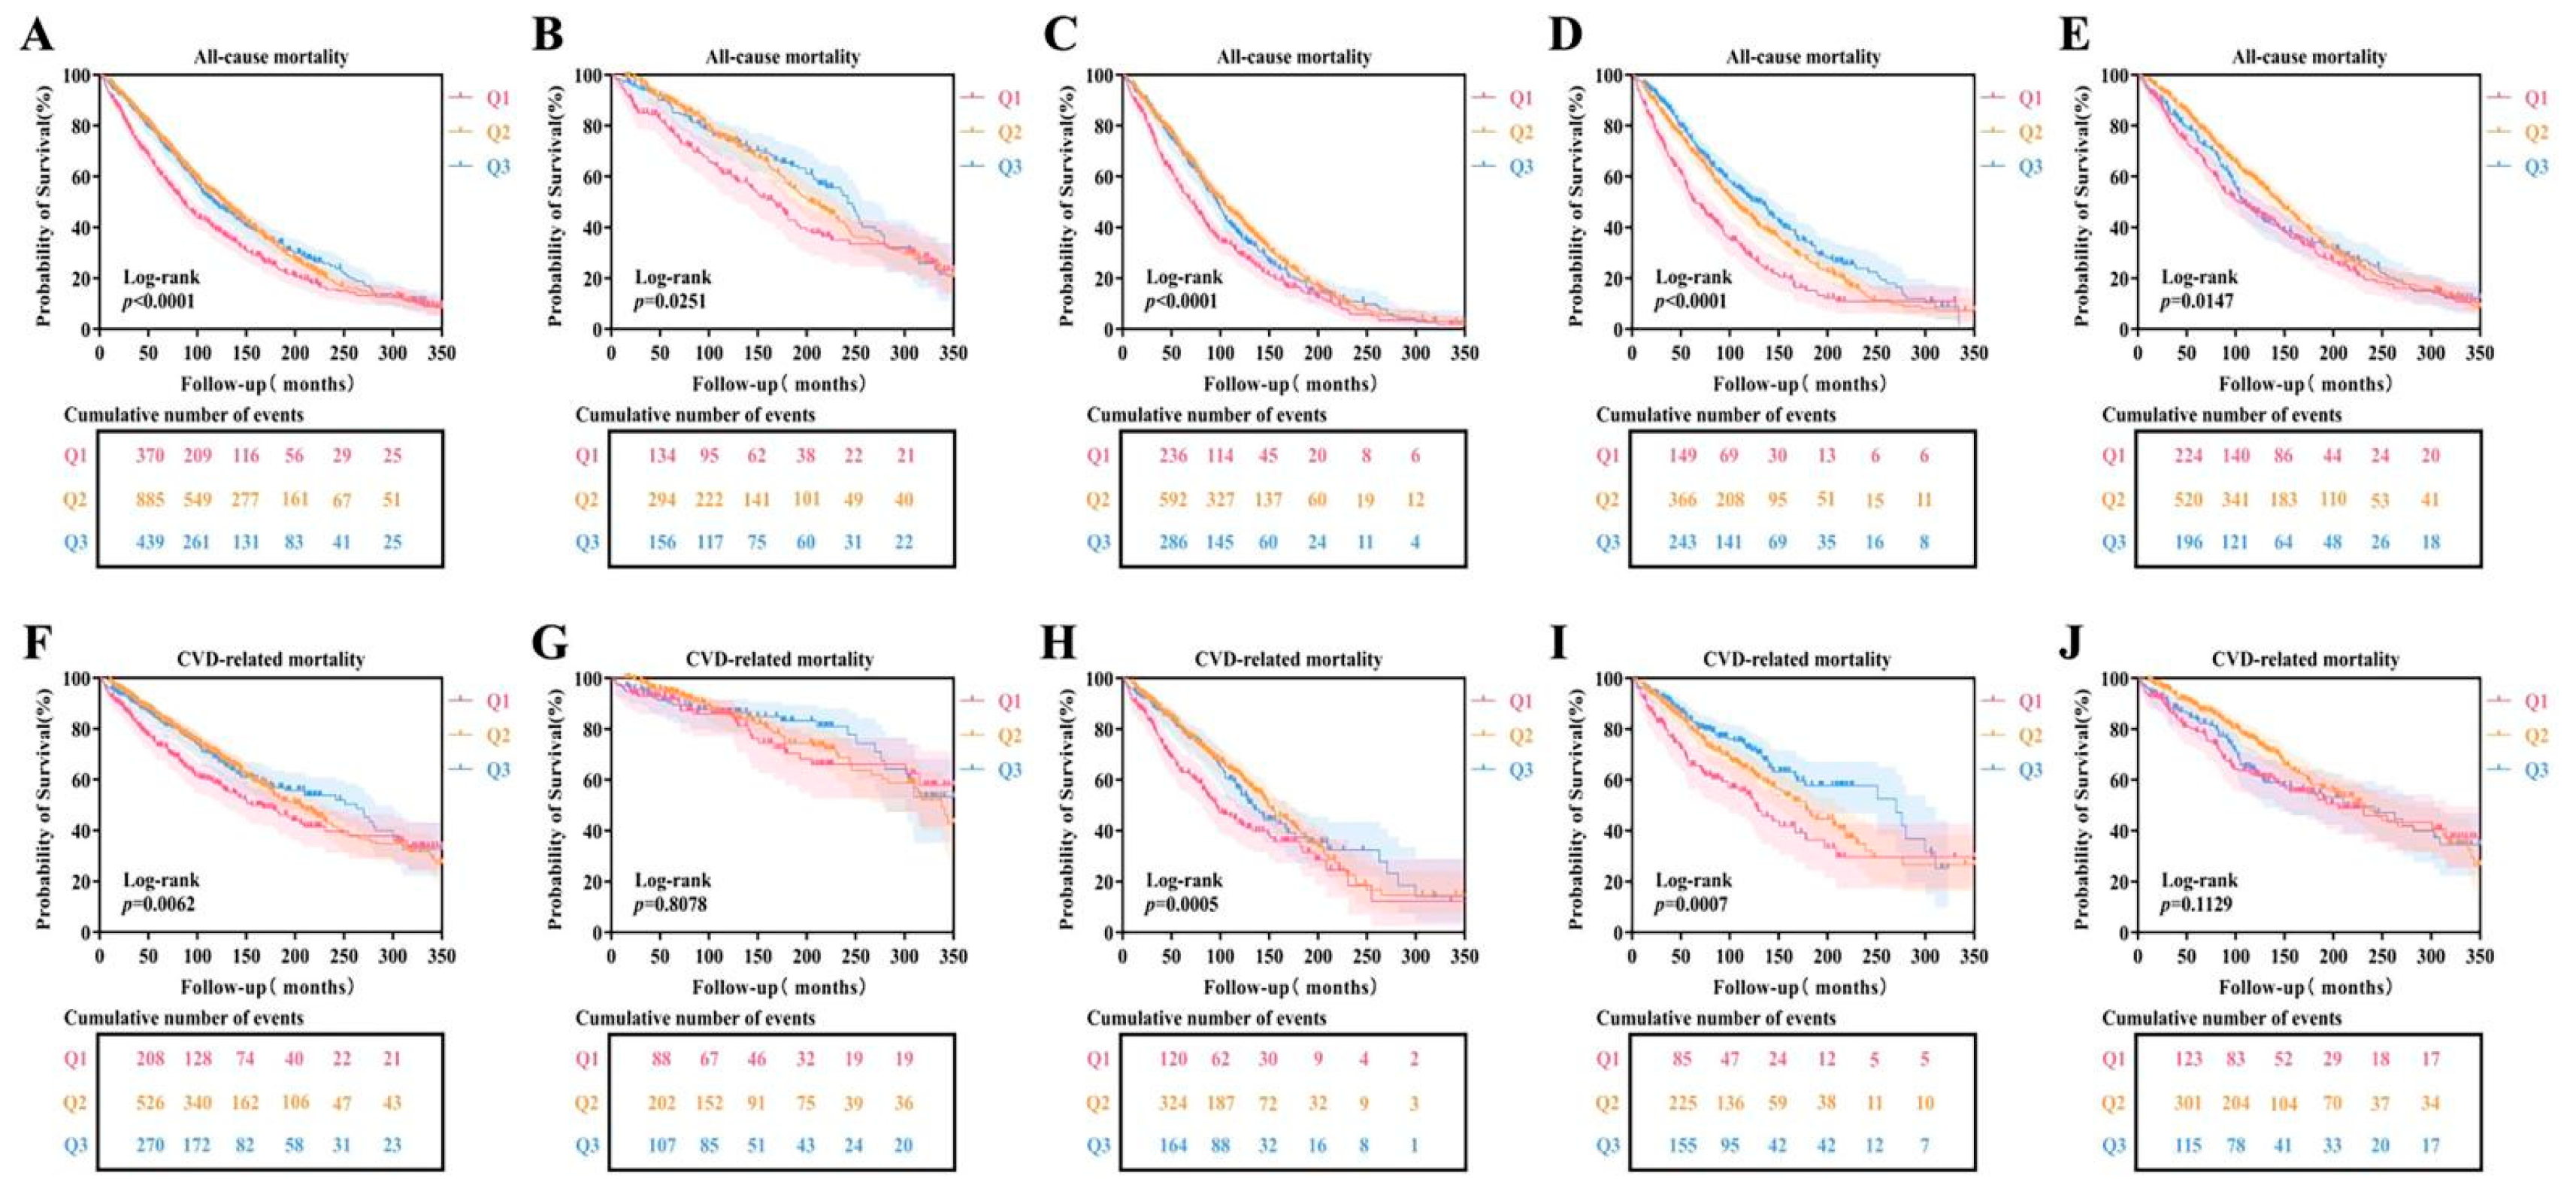
3.3. HALP Score and Risk of Mortality with DKD in Type 2 Diabetes
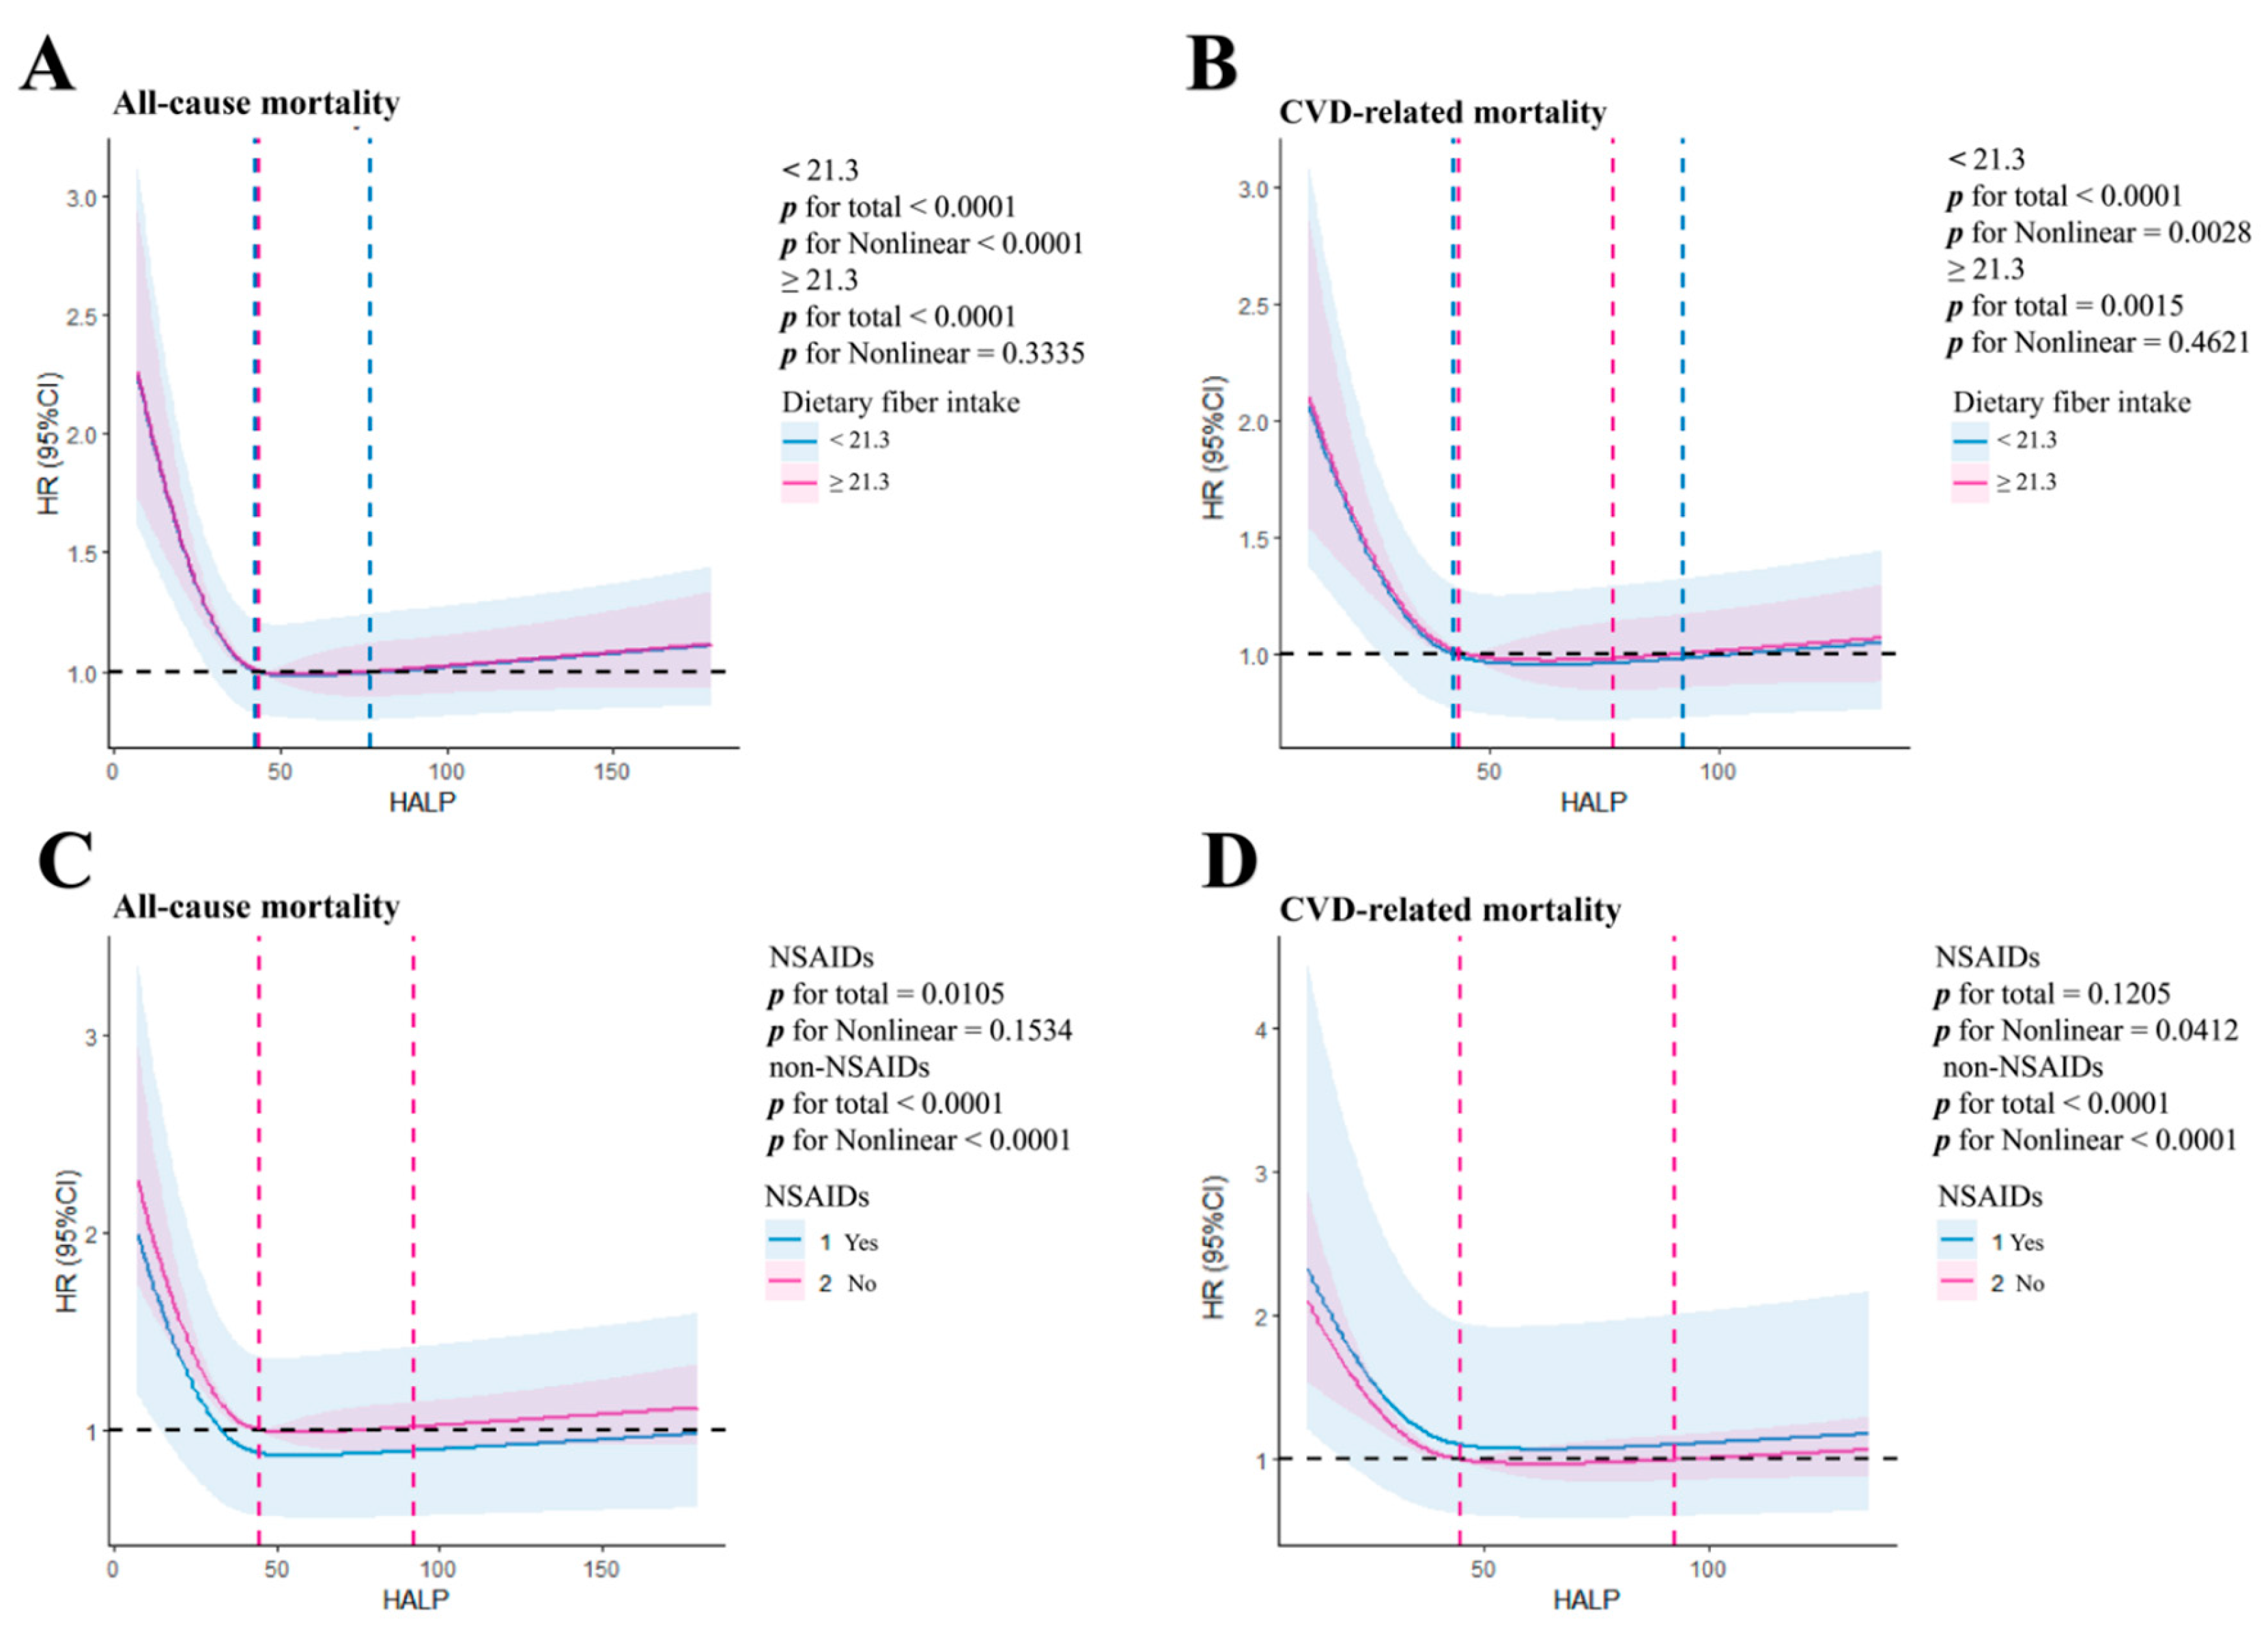
3.4. HALP Score and Risk of Mortality in Different Dietary Fiber Intake and NSAIDs Groups
3.5. Sensitivity Analyses
4. Discussion
5. Conclusions
Supplementary Materials
Author Contributions
Funding
Institutional Review Board Statement
Informed Consent Statement
Data Availability Statement
Acknowledgments
Conflicts of Interest
References
- American Diabetes Association. 10. Microvascular Complications and Foot Care: Standards of Medical Care in Diabetes-2018. Diabetes Care. 2018;41(Suppl 1):S105-S118. [CrossRef]
- Tuttle KR, Bakris GL, Bilous RW, et al. Diabetic kidney disease: a report from an ADA Consensus Conference. Diabetes Care. 2014;37(10):2864-2883. [CrossRef]
- Afkarian M, Zelnick LR, Hall YN, et al. Clinical Manifestations of Kidney Disease Among US Adults With Diabetes, 1988-2014. JAMA. 2016;316(6):602-610. [CrossRef]
- Shim K, Begum R, Yang C, Wang H. Complement activation in obesity, insulin resistance, and type 2 diabetes. World J Diabetes. 2020;11(1):1-12. [CrossRef]
- Tesch GH. Diabetic nephropathy - is this an immune disorder?. Clin Sci (Lond). 2017;131(16):2183-2199. Published 2017 Jul 31. [CrossRef]
- Zhang J, Chen Y, Zou L, Gong R. Prognostic nutritional index as a risk factor for diabetic kidney disease and mortality in patients with type 2 diabetes . Acta Diabetol. 2023;60(2):235-245. [CrossRef]
- Xie R, Bishai DM, Lui DTW, Lee PCH, Yap DYH. Higher Circulating Neutrophil Counts Is Associated with Increased Risk of All-Cause Mortality and Cardiovascular Disease in Patients with Diabetic Kidney Disease. Biomedicines. 2024;12(8):1907. [CrossRef]
- Shoelson, S. E., Lee, J., & Goldfine, A. B. (2006). Inflammation and insulin resistance. The Journal of clinical investigation, 116(7), 1793–1801. [CrossRef]
- Muhammed D , Adebiyi Y H , Odey B O ,et al.Nutritional Management of Diabetes Mellitus: An appraisal of the role of Medicinal plants[J]. 2021. [CrossRef]
- Peng D, Zhang C, Tang Q, Zhang L, Yang K, Yu X, et al. Prognostic significance of the combination of preoperative hemoglobin and albumin levels and lymphocyte and platelet counts (Halp) in patients with renal cell carcinoma after nephrectomy. BMC Urol (2018) 18(1):20. [CrossRef]
- Chen X, Xue L, Wang W, Chen H, Zhang W, Liu K, et al. Prognostic significance of the combination of preoperative hemoglobin, albumin, lymphocyte and platelet in patients with gastric carcinoma: a retrospective cohort study. Oncotarget (2015) 6(38):41370–82. [CrossRef]
- Zhang F, Li L, Shi T, Liu Y, Xie J, Yu L. The hemoglobin, albumin, lymphocyte, and platelet (HALP) is a potent indicator for the prognosis in hemodialysis patients. Medicine (Baltimore). 2023;102(19):e33650. [CrossRef]
- Pan H, Lin SS. Association of hemoglobin, albumin, lymphocyte, and platelet score with risk of cerebrovascular, cardiovascular, and all-cause mortality in the general population: results from the NHANES 1999-2018. Front Endocrinol (Lausanne). (2023) 14:1173399. [CrossRef]
- Ding R, Zeng Y, Wei Z, et al. The L-shape relationship between hemoglobin, albumin, lymphocyte, platelet score and the risk of diabetic retinopathy in the US population. Front Endocrinol (Lausanne). 2024;15:1356929. Published 2024 May 10. [CrossRef]
- Jia XH, Wang SY, Sun AQ. Dietary fiber intake and its association with diabetic kidney disease in American adults with diabetes: A cross-sectional study. World J Diabetes. 2024;15(3):475-487. [15]. [CrossRef]
- Donate-Correa J, Ferri CM, Mora-Fernández C, Pérez-Delgado N, González-Luis A, Navarro-González JF. Pentoxifylline ameliorates subclinical atherosclerosis progression in patients with type 2 diabetes and chronic kidney disease: a randomized pilot trial. Cardiovasc Diabetol. 2024;23(1):314. [CrossRef]
- Center for Disease Control and Prevention. study. Available online: https://www.cdc.gov/nchs/nhanes/index.htm.
- Yidu Cloud Research Collaboration Platform.Available online: https://www.yiducloud.com.cn/research/index.html.
- de Boer IH, Rue TC, Hall YN, Heagerty PJ, Weiss NS, Himmelfarb J.Temporal trends in the prevalence of diabetic kidney disease in the united states. Jama (2011) 305(24):2532–9. [CrossRef]
- Levey AS, Stevens LA, Schmid CH, Zhang YL, Castro AF3rd, Feldman HI, et al. A new equation to estimate glomerular filtration rate. Ann Intern Med (2009) 150(9):604–12. [CrossRef]
- Yang M, Zou Y, Lu T, et al. Revised Equations to Estimate Glomerular Filtration Rate from Serum Creatinine and Cystatin C in China. Kidney Blood Press Res. 2019;44(4):553-564. [CrossRef]
- Conway, R. B. N., Armistead, M. G., Denney, M. J., & Smith, G. S. (2021).Validating the matching of patients in the linkage of a large hospital system’s EHR with state and national death databases. Applied Clinical Informatics, 12(1), 82–89. [CrossRef]
- Gerds TA, Scheike TH, Andersen PK. Absolute risk regression for competing risks: interpretation, link functions, and prediction. Stat Med 2012;31:3921–30. [CrossRef]
- Wang S, Jia B, Niu S, Chen S. Relationship Between the Hemoglobin, Albumin, Lymphocyte Count, Platelet Count (HALP) Score and Type 2 Diabetes Retinopathy. Diabetes Metab Syndr Obes. 2024;17:2693-2706. Published 2024 Jul 10. [CrossRef]
- Pan H, Lin S. Association of hemoglobin, albumin, lymphocyte, and platelet score with risk of cerebrovascular, cardiovascular, and all-cause mortality in the general population: results from the NHANES 1999-2018. Front Endocrinol (Lausanne). 2023;14:1173399. [CrossRef]
- Shoelson SE, Lee J, Goldfine AB. Inflammation and insulin resistance. J Clin Invest. 2006 Jul;116(7):1793-801. [CrossRef]
- Eckel RH, Wassef M, Chait A, et al. Prevention Conference VI: Diabetes and Cardiovascular Disease: Writing Group II: pathogenesis of atherosclerosis in diabetes. Circulation. 2002;105(18):e138-e143. [CrossRef]
- Mullins AP, Arjmandi BH. Health Benefits of Plant-Based Nutrition: Focus on Beans in Cardiometabolic Diseases. Nutrients. 2021;13(2):519. [CrossRef]
- Tauchi E, Hanai K, Babazono T. Effects of dietary protein intake on renal outcome and mortality in patients with advanced diabetic nephropathy. Clin Exp Nephrol. 2020 Feb;24(2):119-125. [CrossRef]
- Liu W, Zheng S, Du X. Association of Systemic Immune-Inflammation Index and Systemic Inflammation Response Index with Diabetic Kidney Disease in Patients with type 2 diabetes . Diabetes Metab Syndr Obes. 2024 Feb 1;17:517-531. [CrossRef]
- Fouque D, Laville M. Low protein diets for chronic kidney disease in non diabetic adults. Cochrane Database Syst Rev. 2009 Jul 8;(3):CD001892. [CrossRef]
- Chapter 3: Management of progression and complications of CKD. (2013). Kidney international supplements, 3(1), 73–90. [CrossRef]
- Yang B, Zhao XH, Ma GB. Role of serum β2-microglobulin, glycosylated hemoglobin, and vascular endothelial growth factor levels in diabetic nephropathy. World J Clin Cases. 2022 Aug 16;10(23):8205-8211. [CrossRef]
- Caro JJ, Salas M, Ward A, Goss G. Anemia as an independent prognostic factor for survival in patients with cancer: a systemic, quantitative review. Cancer. 2001;91(12):2214-2221. [CrossRef]
- Zhang R, Wang Q, Li Y, Li Q, Zhou X, Chen X, Dong Z. A new perspective on proteinuria and drug therapy for diabetic kidney disease. Front Pharmacol. 2024 Jul 31;15:1349022. [CrossRef]
- Song S, Sun Y, Yu J. Causal relationship between 731 immune cells and the risk of diabetic nephropathy: a two-sample bidirectional Mendelian randomization study. Ren Fail. 2024 Dec;46(2):2387208. [CrossRef]
- Yay F, Bayram E, Aggul H, Güçlü CÖ, Ayan D. Can immature granulocytes and neutrophil-lymphocyte ratio be biomarkers to evaluate diabetic nephropathy?: A cross-sectional study. J Diabetes Complications. 2024;38(9):108807. [CrossRef]
- Wei S, Pan X, Xiao Y, Chen R, Wei J. The unique association between the level of plateletcrit and the prevalence of diabetic kidney disease: a cross-sectional study. Front Endocrinol (Lausanne). 2024 Apr 25;15:1345293. [CrossRef]
- Sulaiman MK. Diabetic nephropathy: recent advances in pathophysiology and challenges in dietary management. Diabetol Metab Syndr. 2019 Jan 23;11:7. [CrossRef]
- Zhang R, Wang Q, Li Y, Li Q, Zhou X, Chen X, Dong Z. A new perspective on proteinuria and drug therapy for diabetic kidney disease. Front Pharmacol. 2024 Jul 31;15:1349022. [CrossRef]
- Yood MU, Campbell UB, Rothman KJ, et al. Using prescription claims data for drugs available over-the-counter (OTC). Pharmacoepidemiol Drug Saf. 2007;16(9):961-968. [CrossRef]

| Variables | NHANES(n=7252) | Southwest China(n=18498) | ||||||||
| Total | HALP≤35.85 | 35.85<HALP<64.88 | HALP≥64.88 | p value | Total | HALP≤30.19 | 30.19<HALP<70.53 | HALP≥70.53 | p value | |
| Clinical characteristics | ||||||||||
| Age, years | 61.51±14.31 | 63.34±14.76 | 61.14±14.25 | 60.51±13.80 | <0.001 | 69.65±13.98 | 72.60±14.07 | 69.21±13.73 | 67.57±13.90 | 0.033 |
| Sex | <0.001 | <0.001 | ||||||||
| Male | 3606(49.70) | 733(40.40) | 1751(48.30) | 1122(61.90) | 9639(52.10) | 2353(50.90) | 4548(49.20) | 2738(59.20) | ||
| Female | 3646(50.30) | 1080(59.60) | 1875(51.70) | 691(38.10) | 8859(47.90) | 2271(49.10) | 4701(50.80) | 1887(40.80) | ||
| Race | <0.001 | <0.001 | ||||||||
| 1 | 1674(23.10) | 364(20.10) | 847(23.40) | 463(25.20) | 18290(98.90) | 4578(99.00) | 9152(99.00) | 4560(98.60) | ||
| 2 | 524(7.20) | 99(5.50) | 284(7.80) | 141(7.80) | 85(0.50) | 24(0.50) | 34(0.40) | 27(0.60) | ||
| 3 | 2609(36.00) | 674(37.20) | 1262(34.80) | 673(37.10) | 30(0.20) | 7(0.20) | 13(0.10) | 10(0.20) | ||
| 4 | 1867(25.70) | 558(30.80) | 922(25.40) | 387(21.30) | 21(0.10) | 7(0.20) | 11(0.10) | 3(0.10) | ||
| 5 | 578(8.00) | 118(6.50) | 311(8.60) | 149(8.20) | 72(0.40) | 8(0.20) | 39(0.40) | 25(0.50) | ||
| Drinking status | <0.001 | <0.001 | ||||||||
| Never drinkers | 2922(40.30) | 827(45.60) | 1444(39.80) | 651(35.90) | 13347(72.10) | 3378(73.10) | 6807(73.60) | 3162(68.40) | ||
| Ever drinkers | 4330(59.70) | 986(54.40) | 2182(60.20) | 1162(64.10) | 5151(27.80) | 1246(26.90) | 2442(26.40) | 1463(31.60) | ||
| Smoking status | <0.001 | <0.001 | ||||||||
| Never smokers | 3228(44.50) | 903(49.80) | 1627(44.90) | 698(38.50) | 12337(66.70) | 3120(67.90) | 6398(69.20) | 2819(61.00) | ||
| Ever smokers | 4024(55.50) | 910(50.20) | 1999(55.10) | 1115(61.50) | 6161(33.30) | 1504(32.10) | 2851(30.80) | 1806(39.00) | ||
| SBP, mmHg | 134.13±21.84 | 135.71±23.31 | 133.90±21.57 | 133.02±20.75 | <0.001 | 136.53±36.12 | 137.54±41.95 | 137.20±30.03 | 134.18±40.58 | 0.039 |
| DBP,mmHg | 68.94±14.99 | 66.45±16.04 | 69.34±14.61 | 70.62±14.33 | <0.001 | 78.78±16.42 | 77.61±13.42 | 79.55±16.92 | 78.40±17.96 | <0.001 |
| BMI, kg/m2 | 31.60±7.33 | 31.57±8.03 | 31.55±7.20 | 31.72±6.84 | 0.733 | 25.61±3.86 | 24.66±3.59 | 25.58±3.89 | 25.83±4.20 | 0.639 |
| CKD history | <0.001 | <0.001 | ||||||||
| Suffer from CKD | 2509(34.60) | 850(46.90) | 1164(32.10) | 495(27.30) | 15140(82.20) | 3473(75.60) | 7709(83.60) | 3958(85.90) | ||
| Free from CKD | 4743(65.40) | 963(53.10) | 2462(67.90) | 1318(72.70) | 3281(17.80) | 1120(24.40) | 1513(16.40) | 648(14.10) | ||
| Laboratory data | ||||||||||
| HGB, g/L | 133.00(120.00,146.00) | 119.00(101.00.133.00) | 135.00(123.00,146.00) | 143.00(130.00,157.00) | <0.001 | 136.77±40.96 | 116.93±28.55 | 136.24±28.21 | 157.68±53.95 | <0.001 |
| ALB, g/L | 40.85±3.78 | 38.93±4.12 | 41.16±3.34 | 42.24±3.48 | <0.001 | 46.27±67.47 | 35.40±9.28 | 41.51±7.33 | 66.66±132.05 | <0.001 |
| LYM, 10^9/L | 2.21±1.06 | 1.59±0.56 | 2.17±0.62 | 2.90±1.61 | <0.001 | 1.69±11.21 | 0.99±0.53 | 1.58±0.53 | 2.61±22.38 | <0.001 |
| PLT, 10^9/L | 249.10±74.82 | 289.64±85.83 | 249.65±63.53 | 207.44±59.80 | <0.001 | 183.35±75.67 | 220.36±90.63 | 186.70±60.49 | 139.67±63.84 | <0.001 |
| GLU, mmol/L | 8.58±5.05 | 9.08±5.17 | 9.65±5.19 | 9.82±5.18 | <0.001 | 11.32±25.78 | 11.82±18.22 | 11.07±30.08 | 11.34±22.72 | <0.001 |
| HbA1c, % | 8.60(6.80,11.54) | 9.10(6.80,11.54) | 8.50(6.80,11.54) | 8.40(6.87,11.54) | <0.001 | 16.10(10.00,22.05) | 14.99(10.00,21.09) | 15.89(10.00,21.84) | 17.47(10.00,23.36) | 0.002 |
| WBC, 10^9/L | 7.60±2.32 | 7.03±2.26 | 7.49±2.05 | 8.39±2.65 | <0.001 | 15.10±262.25 | 22.09±475.26 | 13.20±142.37 | 11.93±93.22 | 0.035 |
| SCR, mg/dL | 1.08±0.83 | 1.26±1.14 | 1.03±0.74 | 1.00±0.57 | <0.001 | 0.92(0.76,1.17) | 1.00(0.80,1.30) | 0.90(0.74,1.12) | 0.90(0.76,1.10) | <0.001 |
| UA, umol/L | 335.67±96.58 | 341.76±108.03 | 332.10±93.09 | 336.70±90.88 | <0.001 | 342.91±119.47 | 341.60±138.80 | 339.70±114.32 | 350.63±107.79 | <0.001 |
| TG, mmol/L | 1.99±1.76 | 1.90±1.90 | 1.92±1.63 | 2.23±1.83 | 0.002 | 1.69(1.02,2.69) | 1.54(0.95,2.53) | 1.67(1.01,2.59) | 1.91(1.15,3.02) | <0.001 |
| HDL-C, mmol/L | 1.24±0.38 | 1.30±0.40 | 1.25±0.38 | 1.16±0.35 | <0.001 | 1.18(0.98,1.44) | 1.22(1.03,1.53) | 1.19(1.01,1.44) | 1.11(0.93,1.34) | <0.001 |
| LDL-C, mmol/L | 2.82±1.05 | 2.74±1.08 | 2.83±1.04 | 2.86±1.06 | 0.001 | 2.78(2.06,3.50) | 2.66(1.98,3.44) | 2.82(2.10,3.51) | 2.82(2.11,3.53) | 0.189 |
| EOS, 10^9/L | 0.22±0.17 | 0.21±0.17 | 0.22±0.17 | 0.23±0.18 | <0.001 | 0.20(0.10,0.30) | 0.20(0.10,0.30) | 0.20(0.10,0.30) | 0.20(0.10,0.30) | 0.036 |
| NEU, 10^9/L | 4.52(3.19,5.39) | 4.84(3.90,7.35) | 4.31(3.15,5.09) | 3.98(2.80,4.84) | <0.001 | 4.30(3.40,5.50) | 4.30(3.30,5.50) | 4.30(3.30,5.45) | 4.40(3.53,5.60) | 0.032 |
| MON, 10^9/L | 0.58±0.20 | 0.54±0.20 | 0.57±0.20 | 0.63±0.22 | <0.001 | 0.41±0.23 | 0.44±0.26 | 0.40±0.21 | 0.38±0.22 | <0.001 |
| RBC, 10^9/L | 4.60±0.54 | 4.33±0.54 | 4.62±0.49 | 4.83±0.50 | <0.001 | 7.74±402.15 | 16.25±799.17 | 5.09±64.18 | 4.54±8.94 | <0.001 |
| eGFR, mL/min/1.73 m2 | 81.43±36.15 | 72.04±35.75 | 83.39±36.32 | 86.90±34.45 | <0.001 | 92.8±10.52 | 78.7±12.45 | 97.1±9.72 | 98.3±9.78 | <0.001 |
| HALP Score | NHANES | |||||
| Model 1 | Model 2 | Model 3 | ||||
| OR(95%CI) | p value | OR(95%CI) | p value | OR(95%CI) | p value | |
| Q1 | reference | reference | reference | |||
| Q2 | 0.536(0.477-0.601) | <0.001 | 0.573(0.506-0.650) | <0.001 | 0.611(0.513-0.713) | <0.001 |
| Q3 | 0.425(0.370-0.489) | <0.001 | 0.479(0.412-0.556) | <0.001 | 0.502(0.478-0.530) | <0.001 |
| HALP Score | Southwest China | |||||
| Model 1 | Model 2 | Model 3 | ||||
| OR(95%CI) | p value | OR(95%CI) | p value | OR(95%CI) | p value | |
| Q1 | reference | reference | reference | |||
| Q2 | 0.609(0.558-0.664) | <0.001 | 0.588(0.539-0.642) | <0.001 | 0.612(0.554-0.676) | <0.001 |
| Q3 | 0.508(0.456-0.565) | <0.001 | 0.478(0.429-0.533) | <0.001 | 0.528(0.451-0.617) | <0.001 |
| HALP Score | Model 1 | Model 2 | Model 3 | ||||||
| HR(95%CI) | p value | HR(95%CI) | p value | HR(95%CI) | p value | ||||
| All-cause mortality | |||||||||
| Q1 | reference | reference | reference | ||||||
| Q2 | 0.737(0.654-0.831) | <0.001 | 0.708(0.628-0.799) | <0.001 | 0.765(0.675-0.867) | <0.001 | |||
| Q3 | 0.737(0.641-0.848) | <0.001 | 0.714(0.620-0.823) | <0.001 | 0.833(0.709-0.977) | 0.025 | |||
| CVD-related mortality | |||||||||
| Q1 | reference | reference | reference | ||||||
| Q2 | 0.734(0.596-0.903) | 0.003 | 0.674(0.547-0.830) | <0.001 | 0.667(0.538-0.827) | <0.001 | |||
| Q3 | 0.722(0.567-0.920) | 0.008 | 0.678(0.531-0.866) | 0.002 | 0.610(0.464-0.801) | <0.001 | |||
| Malignancy-related mortality | |||||||||
| Q1 | reference | reference | reference | ||||||
| Q2 | 0.912(0.634-1.312) | 0.621 | 0.773(0.536-1.113) | 0.166 | 0.524(0.275-0.999) | 0.050 | |||
| Q3 | 0.812(0.532-1.240) | 0.336 | 0.769(0.501-1.179) | 0.228 | 0.460(0.231-0.917) | 0.027 | |||
| Cerebrovascular-related mortality | |||||||||
| Q1 | reference | reference | reference | ||||||
| Q2 | 0.723(0.457-1.145) | 0.167 | 0.617(0.388-0.981) | 0.041 | 0.597(0.375-0.950) | 0.030 | |||
| Q3 | 0.549(0.308-0.980) | 0.043 | 0.554(0.307-0.998) | 0.049 | 0.568(0.317-1.016) | 0.057 | |||
| All-cause mortality | CVD-related mortality | ||||||||
| Variables | Model 1 | Model 2 | Variables | Model 1 | Model 2 | ||||
| HR(95% CI) | p value | HR(95% CI) | p value | HR(95% CI) | p value | HR(95% CI) | p value | ||
| High dietary fiber intake(n=463) | High dietary fiber intake(n=281) | ||||||||
| Q1 | reference | 0.308 | reference | 0.687 | Q1 | reference | 0.096 | reference | 0.261 |
| Q2 | 0.820(0.631-1.067) | 0.140 | 0.893(0.684-1.164) | 0.402 | Q2 | 0.623(0.386-1.004) | 0.052 | 0.680(0.419-1.104) | 0.119 |
| Q3 | 0.839(0.608-1.157) | 0.284 | 0.904(0.651-1.256) | 0.548 | Q3 | 1.003(0.580-1.734) | 0.991 | 0.933(0.531-1.641) | 0.810 |
| Low dietary fiber intake(n=2046) | Low dietary fiber intake(n=1190) | ||||||||
| Q1 | reference | <0.001 | reference | <0.001 | Q1 | reference | 0.001 | reference | <0.001 |
| Q2 | 0.714(0.632-0.806) | <0.001 | 0.695(0.614-0.785) | <0.001 | Q2 | 0.687(0.559-0.844) | <0.001 | 0.659(0.535-0.811) | <0.001 |
| Q3 | 0.813(0.697-0.950) | 0.009 | 0.780(0.667-0.912) | 0.002 | Q3 | 0.739(0.562-0.971) | 0.03 | 0.676(0.511-0.894) | 0.006 |
| Use of NSAIDs drugs(n=26) | Use of NSAIDs drugs(n=19) | ||||||||
| Q1 | reference | 0.358 | reference | 0.468 | Q1 | reference | 0.177 | reference | 0.796 |
| Q2 | 0.521(0.204-1.334) | 0.174 | 1.663(0.453-6.114) | 0.444 | Q2 | 0.314(0.093-1.063) | 0.063 | 0.487(0.061-3.915) | 0.499 |
| Q3 | 0.435(0.053-3.541) | 0.436 | 0.355(0.035-3.627) | 0.382 | Q3 | 0.000(0.000-0.000) | 0.987 | 0.001(0.000-0.000) | 0.994 |
| Non-use of NSAIDs drugs(n=2483) | Non-use of NSAIDs drugs(n=1452) | ||||||||
| Q1 | reference | <0.001 | reference | <0.001 | Q1 | reference | 0.005 | reference | 0.001 |
| Q2 | 0.741(0.662-0.830) | <0.001 | 0.733(0.654-0.821) | <0.001 | Q2 | 0.724(0.595-0.881) | 0.001 | 0.692(0.569-0.843) | <0.001 |
| Q3 | 0.821(0.712-0.946) | 0.006 | 0.794(0.688-0.917) | 0.002 | Q3 | 0.836(0.655-1.068) | 0.151 | 0.775(0.605-0.993) | 0.044 |
Disclaimer/Publisher’s Note: The statements, opinions and data contained in all publications are solely those of the individual author(s) and contributor(s) and not of MDPI and/or the editor(s). MDPI and/or the editor(s) disclaim responsibility for any injury to people or property resulting from any ideas, methods, instructions or products referred to in the content. |
© 2024 by the authors. Licensee MDPI, Basel, Switzerland. This article is an open access article distributed under the terms and conditions of the Creative Commons Attribution (CC BY) license (http://creativecommons.org/licenses/by/4.0/).


