
Submitted:
25 January 2026
Posted:
26 January 2026
You are already at the latest version
Abstract
Sesame (Sesamum indicum L.) is a nutrient-rich oilseed crop whose improvement can be accelerated by unlocking untapped genetic variation in African landraces. We integrated a global meta-quantitative trait loci (QTL) analysis with a genome-wide association study (GWAS) of Ethiopian germplasm to identify molecular markers for plant height and seed coat color. Meta-analysis of eight available data sources revealed six conserved QTL hotspots on chromosomes 3, 4, 6, 8, 9 and 11. Subsequently, GWAS on 200 Ethiopian accessions, represented by 3,683 SNPs, detected 36 significant associations, including novel loci on chromosomes 12 and 13 that were not reported in Asian-focused research. Candidate gene analysis implicated key hormonal and transcriptional mechanisms, including brassinosteroid biosynthesis (CYP90B1) and ethylene signaling (AP2/ERF), which probably regulate plant architecture. In contrast, transcription factors (WRKY23, DOF3.1, and SBP-like) modulate flavonoid pathways, controlling seed coat pigmentation. Analyses of population structure revealed two distinct groups (K = 2), and linkage disequilibrium (LD) decayed rapidly (~190 kb). This rapid decay facilitates fine‑mapping of trait-associated regions and highlights the high genetic diversity within the Ethiopian panel. The present study presents validated molecular markers and candidate genes for marker-assisted selection in sesame breeding, providing a foundation for improving sesame in Africa and beyond.
Keywords:
Sesamum indicum L.
; genome-wide association study
; marker-assisted selection
; meta-QTL analysis
; plant height
; seed coat color
; Ethiopian germplasm
1. Introduction
Sesame (Sesamum indicum L.) is an economically important oilseed crop valued for its high-quality oil and protein-rich seeds [1,2]. However, global sesame yields remain low at under 0.8 t ha-1, due to limited breeding programs, narrow genetic variation, and slower genomic tool development compared to other major oilseed crops [3,4,5]. Genomic resources are now enabling improvements in productivity and stress tolerance [6,7,8,9].
Genome sequencing facilitated the discovery of quantitative trait loci (QTL) and marker-trait associations for major sesame traits, including oil content, stress tolerance, and oilseed production [10,11,12], mostly using QTL mapping and a genome-wide association study (GWAS) approach [13]. Yet, the African gene pool, containing considerable genetic variation, is still predominantly unexamined at the genomic level. This limits our comprehension of its capability for enhancing crops [3,14,15].
Ethiopia is a center of diversity and likely the primary center of domestication for sesame [16,17]. Ethiopian landraces show greater phenotypic variation, and molecular analysis reveals greater genetic diversity and stronger population structure than Asian germplasm [15,18]. Conversely, unique allelic variation and new loci shaped by local selection are not well known [6].
While Ethiopia represents a center of diversity for sesame, its germplasm remains underexplored at the genomic level, limiting our understanding of its potential for crop improvement. Our research focused on two key agronomic traits: plant height and seed coat color. Plant height is a factor in crop structure, influencing lodging resistance, simplifying harvesting, and ensuring strong yield capacity [4,19,20]. Seed coat color has an essential role in crop quality and commercial values related to nutrient composition and stress tolerance due to the responsible biosynthesis of phenolic compounds [21,22,23]. In Ethiopia, white seed coat color is the primary trait preferred by both farmers and export markets, fueling the extensive cultivation of cultivars such as ‘Humera-1’ [24,25]. However, the genetic basis of these traits in Ethiopian germplasm remains poorly characterized, limiting their use in sesame breeding. Despite the availability of significant genomic insights and the identification of numerous QTL and candidate genes in global research [21,26,27,28,29], the significance of allelic variation in Ethiopian germplasm is still unknown.
Analysis of QTL using crosses is controlled by the genetic variation of the parents, whereas most GWAS in sesame have been conducted using Asian germplasm. This focus may limit allele representation in diverse gene pools, such as those in African sesame [10,21,30]. A combined meta-analysis and GWAS approach, therefore, could offer a solution to these challenges, providing a comprehensive framework that merges results from multiple investigations while directly evaluating diverse populations [7,8,31].
Accordingly, this research employs an integrated approach combining a genome-wide meta-QTL analysis with an extensive GWAS of a diverse panel of Ethiopian sesame accessions. We aim to dissect the genetic foundations of plant height, a key determinant of lodging resistance and harvestability, and seed coat color, a primary quality trait governing market value and nutritional composition in sesame. Hence, the objectives of this study were to: (1) identify consensus meta-QTL hotspots for PH and SCC through a global analysis; (2) detect single nucleotide polymorphism (SNP)–trait associations and novel alleles within a diverse Ethiopian sesame panel using GWAS; (3) analyze the population structure, kinship, and linkage disequilibrium of Ethiopian germplasm; and (4) propose high-confidence candidate genes and molecular markers for immediate implementation in marker-assisted selection (MAS) programs for sesame improvement.
2. Results
2.1. Consensus Meta-QTL Hotspots
A genomic area was called a “meta-QTL hotspot” if it contained three or more independent QTL from different studies within a 5 Mb interval. A meta-analysis was conducted using data from eight available sources from QTL mapping, which included 34 QTL for PH and 43 QTL for SCC. When mapped to the reference genome, these QTL coalesced into six genomic regions; i.e., chromosomes 3, 4, 6, 8, 9 and 11. This indicates that these chromosomal intervals contain genetic loci that consistently control these traits across independent QTL mapping research and diverse genetic material, thus highlighting their fundamental importance in sesame biology [26,29,43]. For PH, three meta-QTL regions were found on chromosomes 3, 8, and 11 (Figure 1A). The chromosome 11 area was important, with QTL from four investigations and a combined consensus phenotypic variance explained (PVE) from 10.2% to 25.7%, thereby marking it as a major, stable locus for plant height with strong breeding potential. For SCC, three distinct genomic hotspots were identified on chromosomes 4, 6, and 9 (Figure 1B). The area in chromosome 6 was linked to color darkness (low L*) and color intensity (high a and b*), with a QTL that explained 23.1% of the variation in this study (Table 1). For PH, a major-effect QTL for plant height was identified on chromosome 8, which explained 71.4% of the phenotypic variation, reflecting genetic differences and varying study sizes. Genes in these intervals were functionally annotated, revealing candidates in growth- and pigment-related pathways (See Supplementary Table S2). The genes SIACS9 and SICEN2, involved in growth, and members of the polyphenol oxidase (PPO)[44], DIRigent [45], MYB and bHLH families were annotated in pigment biosynthesis (Table 1). The meta-QTL regions were targets for validation. The meta-QTL regions were subsequently validated through independent GWAS in the Ethiopian panel.
2.2. Phenotypic Variation and Heritability
The Ethiopian panel exhibited substantial phenotypic variation for all measured traits, confirming its suitability for genetic association mapping (Supplementary Table S3). PH ranged from 84.6 to 169.2 cm (mean 126.4 ± 18.7 cm), from lodging-resistant types to high-biomass types. SCC also had wide ranges, i.e., L* values from 19.8 (very dark) to 59.4 (light cream); a* values from -2.3 (slight green) to +9.1 (red/brown); and b* values from 3.1 to 18.8. L* values were skewed toward lighter seeds.
There were relationships between plant height and seed coat color traits (Figure 2B). The seed coat color trait L* was negatively correlated with a* (r = −0.41, p < 0.001) and b* (r = −0.38, p < 0.001), indicating that darker seeds tend to have higher red and yellow components. A negative correlation existed between PH and L* (r = -0.21, p < 0.01), suggesting taller plants tend to have darker seeds, possibly reflecting linked genetic regulation of growth and pigment accumulation.
The principal component (PC) analysis revealed that the first two PCs accounted for 67.4% of the variance (PC1: 33.9%, and PC2: 33.5%). PC1 was related to seed coat color traits (L*, a*, and b*), separating light-seeded from dark-seeded samples (Figure 2C). Plant height was related to PC2, showing that tall plants were different from short plants. The accessions were distributed across the entire range of variation, confirming the panel’s high diversity.
Broad-sense heritability (H2) was high for both traits: 0.89 for plant height and > 0.95 for L*, a*, and b* values, indicating strong genetic control. The high heritability values indicate strong genetic control of these traits, with relatively minor environmental influence. This is an indicator of the success of mapping and the potential for indirect selection using DNA markers. The wide phenotypic range supports the potential for selecting extreme genotypes for breeding programs targeting specific plant architectures or seed color profiles.
2.3. Population Structure, Kinship and Linkage Disequilibrium
Population structure analysis of the 3,683 SNPs showed that there were two separate genetic groups (K = 2) in the Ethiopian panel (Figure 3A). Cluster I (n = 110) mainly represented accessions from the northern states (Tigray and Amhara), whereas Cluster II (n = 90) represented accessions from the states of Oromia, Benishangul Gumuz, and Gambella. Kinship analysis confirmed this grouping (Figure 3B). Genome-wide LD decays rapidly, reaching half of its maximum value at ~190 kb (Figure 3C), reflecting high genetic diversity and allowing fine mapping. The detected distance of LD decay at ~190 kb agrees well with previous research characterizing diverse landrace panels in sesame and other outcrossing species of comparable complexity. For example, Wei et al. [44] reported LD decays in Asian varieties of sesame at ~370 kb. In general, LD decays more rapidly in the African landrace collections due to the higher genetic diversity and recombination rates. In GWAS of diverse germplasm, an LD decay distance of 100–500 kb is common, thus enabling fine-mapping of trait-associated regions without excessive marker density.
2.4. Genome-Wide Association Study
A genome-wide association identified 36 significant marker–trait associations across the sesame genome (Supplementary Table S5). For plant height, 15 SNPs were on chromosomes 1, 3, 5, 8, and 11. The most significant SNP was Chr11_1877114 (p = 1.24×10⁻⁶), explaining 14.20% of phenotypic variance. The strongest association for PH was for SNP Chr11_1877114 (p = 1.24 × 10⁻⁶, -log₁₀(p) = 5.91), explaining 14.2% PVE, which overlapped and agreed with recent meta-QTL analysis [11,43]. Clusters on chromosomes 8 and 11 overlapped with the meta-QTL regions, thus providing validation.
For seed coat color, 21 SNPs were identified as being linked to the parameters. Lightness (L*) was under the control of 7 SNPs on chromosomes 3, 6, and 13. Red-green (a*) was linked to 8 SNPs on chromosomes 6, 9, and 12. Yellow-blue was linked to 6 SNPs on chromosomes 3, 6, and 9. The top associated SNPs included Chr12_16523829 for lightness (L*; p = 2.17×10⁻³, PVE = 6.32%), Chr06_27694080 for redness (a*; p = 7.84×10⁻⁷, PVE = 8.95%), and Chr13_345249 for yellowness (b*; p = 1.48×10⁻³, PVE = 6.08%) (Table 2). While many color loci coincided with known meta-QTL regions, novel associations were detected on chromosomes 12 and 13 (Table 2, Figure 4). This indicates the presence of unique alleles in the Ethiopian gene pool absent from Asian-centric research. Q-Q plots showed values below the expected line until the tail, where they increased, showing a model with associations (Figure 4).
2.5. Comparative Genomic Analysis
Using the dataset by Wang et al. [37] and Wei et al. [44], we compared our GWAS loci in Ethiopian germplasm with the global genomic signatures. The genomic region containing the top plant height SNP (Chr11_1877114) exhibited higher FST (> 0.15) between the African and Asian groups in the global analysis, indicating strong population differentiation and potential local adaptation. The major seed coat color locus on chromosome 6 (Chr06_27694080) coincided with the reported QTL qBSCchr6 identified in other research [11,43]. Novel associations on chromosomes 12 and 13 for seed coat color were located in genomic regions with significantly higher nucleotide diversity in African accessions compared to Asian ones (π_AFR/π_ASIA > 2.0), thereby highlighting the unique genetic architecture of Ethiopian sesame. Higher nucleotide diversity in African accessions suggests a broader allelic repertoire for breeding programs aiming to enhance genetic gain and adaptation.
2.6. Prioritization of High-Priority Candidate Genes
Candidate genes were prioritized based on functional annotation, known roles in related pathways, and, where available, expression data from sesame seed and tissue-specific transcriptomes (e.g., Sinbase 2.0) [35]. Genes with homology to known regulators of plant height, hormone signaling, or flavonoid biosynthesis were given higher priority. In silico variant analysis of the resequencing data revealed non-synonymous SNPs within the coding sequences (CDS) of candidate genes CYP90B1 (Chr08) and WRKY23 (Chr06) that co-segregated with phenotypic extremes. Promoter-region polymorphisms were also identified for AP2/ERF (Chr11) and DOF3.1 (Chr03). Details of these variants are provided in Supplementary Table S7. Candidate gene analysis prioritized seven genes within ±190 kb of significant SNPs (Table 3, Figure 5). An expanded list of annotated candidate genes is provided in Supplementary Table S6. For plant height, the SNP clusters Sindi.11G025000 (AP2/ERF domain protein; 95.2% identity) on chromosome 11 and Sindi.08G015600 (CYP90B1; 88.7% identity) on chromosome 8 were identified. AP2/ERF transcription factors are regulators of ethylene-responsive genes and control cell expansion [47]. CYP90B1 (DWF4) is a cytochrome P450 that controls brassinosteroid biosynthesis, and changes in this gene cause dwarfism [48].
For seed coat color (SCC), key candidate genes were identified near associated SNPs: Sindi.12G045200 (SBP-like; 97.8% identity) linked to L, Sindi.06G123400 (WRKY23; 94.3% identity) and Sindi.03G078100 (DOF3.1; 82.1% identity) associated with a, and Sindi.09G078500 (salicylic acid-binding protein 2; 96.7% identity) linked to b* (Table 3). WRKY23 is a transcription factor known to activate anthocyanin biosynthesis genes under stress conditions [34]. The DOF3.1 transcription factor is a DNA-binding protein involved in light-regulated gene expression and pigment accumulation in plants [49]. SBP-like transcription factors, such as Sindi.12G045200, regulate genes involved in pigmentation pathways [22]. These findings indicate that plant height is influenced by hormonal pathways, including brassinosteroid via CYP90B1 and ethylene via AP2/ERF, while seed coat color is governed by transcription factors such as WRKY, DOF, and SBP-like, which modulate flavonoid biosynthesis.
3. Discussion
3.1. Validation of Genomic Regions and Discovery of New Alleles
By integrating meta-QTL analysis with field phenotyping and publicly available resequencing data, we validated conserved genomic regions and identified novel variants within the Ethiopian sesame population.
The meta-QTL hotspots on chromosomes 8 and 11, identified for plant height, have been confirmed by the presence of significant SNPs within germplasm from Ethiopia (Chr08_1771424, Chr11_1877114), with stable effects across environments [29,34,43]. The meta-QTL hotspot on chromosome 11 has a high FST score for comparisons between Africa and Asia [9,13,27,32,33,43], is consistent with our comparative analysis, thereby indicating adaptation within the Ethiopian germplasm.
The meta-QTL hotspot on chromosome 6 for a* that was associated with seed coat color in Asian germplasm [11,23], was also detected in the Sudanese [27] and in our panel (Chr06_27694080, PVE = 8.95%), thus confirming its conserved role across diverse populations.
Notably, the GWAS revealed novel trait-associated loci on chromosomes 12 and 13 that were absent in previous Asian-centric research. These regions show higher nucleotide diversity in African accessions [13,23,26,34], indicating that Ethiopian sesame harbors unique allelic variation shaped by local adaptation [6,10,15,18]. Including African diversity is therefore essential for capturing the full genetic potential of sesame [12,14,50] for breeding.
3.2. Hormonal Regulation of Plant Architecture
Candidate gene analysis identifies hormonal mechanisms likely regulating plant height. The brassinosteroid biosynthesis gene CYP90B1 and ethylene-responsive gene AP2/ERF are co-located within plant-height-related regions, suggesting a potential coordinated mechanism for stem-growth regulation. CYP90B1 gene variations result in dwarfing in various plant species [48,51], whereas AP2/ERF proteins mediate ethylene signaling to growth, although in a different manner [20,45,47]. The brassinosteroid and ethylene interactions result in plant height regulation in Arabidopsis thaliana and rice [52,53], which is probably analogous to sesame. In Arabidopsis, brassinosteroid and ethylene signaling pathways often interact synergistically to modulate cell expansion and division, ultimately influencing plant height, a mechanism that may be conserved in sesame. Marker-aided crop improvement via gene modification may result in short, lodging-resistant crop cultivars that are amenable to mechanical harvest systems [2,4,28,54].
3.3. Transcriptional Networks Behind Seed Coat Color
Seed coat color in sesame is regulated by transcription factors that control the phenylpropanoid/flavonoid biosynthesis pathway. GO and KEGG enrichment analyses of candidate genes support these pathways (Supplementary Table S9). Our results are consistent with previous findings (Table 4). The major QTL clusters on chromosomes 4, 6, and 9 have been consistently documented [21,23,26,29], with a marker linked to the gene (qBSCchr6) on chromosome 6, described as a major locus of brown seed coat color [11,55]. GWAS revealed the importance of WRKY23, DOF3.1, and SBP-like transcription factors. The WRKY transcription factor regulates anthocyanin gene expression in a stressed environment [20,34], while DOF regulates gene expression in a light environment [49]. Elsafy et al. [27] also revealed WRKY and DOF transcription factors in the seed coat color transcriptional network. A higher heritability (H² > 0.95) of the L*, a*, and b* indices in the Ethiopian materials shows that these qualities are genetically fixed to a great extent and are less likely to be affected by environmental factors [27]. A negative correlation between L* and a* (r = −0.41) implies that lighter seeds have lower red/green pigmentation, which may reflect reduced phenolic and anthocyanin content [21].
3.4. Population Structure and LD Decay
The population structure analysis revealed two genetic clusters (K = 2), reflecting geographical and agroecological regions [12,15,27]. Geographical variation in phenotypic traits across regions is detailed in Supplementary Table S10. The rapid LD decay observed in African landraces, exemplified by Ethiopian (~190 kb) and Sudanese (~0.240 Mb) germplasm [27], indicating higher recombination rates and genetic diversity than those found in Asian varieties (~370 kb) [19,44]. This contrast is consistent with the broader genetic base of the African sesame gene pool. The use of kinship and population structure covariates in the FarmCPU approach minimized false positives, which is evident from the proper calibration of the Q-Q plots [41,56].
3.5. From Discovery to Application: A Molecular Toolkit for Sesame Breeding
The integration of meta-QTL, trait-associated SNPs, and functionally annotated candidate genes is useful for sesame breeding. Our study is the first to integrate the meta-QTL and GWAS framework applied to unlock the genetic potential of Ethiopian sesame germplasm. We demonstrate that this underutilized gene pool contains not only alleles for known major loci but also novel, population-specific genetic variation crucial for adaptation. This study provides validated molecular markers and candidate genes that constitute a practical toolkit for marker-assisted sesame breeding. The validated meta-QTL intervals can offer priority regions for introgression and background selection. This study provides a validated molecular toolkit for sesame improvement, including SNPs with moderate-to-high PVE (e.g., Chr11_1877114 with 14.20% for plant height and Chr06_27694080 with 8.95% for color) and candidate genes with high sequence conservation (e.g., CYP90B1 at 88.7% and SBP-like at 97.8% identity). These markers and genes enable targeted selection and potential gene editing to optimize plant architecture and seed coat traits in Ethiopian and other sesame germplasm.
Given the high heritability and significant effects of SNPs, genomic selection models incorporating these markers (3,683 SNPs) could achieve genome-wide prediction accuracy of > 0.7 for both plant height and seed coat color [31,57,58]. For immediate application, breeders can use the identified SNPs to pyramid favorable alleles for optimal plant height and desirable seed coat color (e.g., high L* for white-seeded types) in elite backgrounds. Functional validation of the identified candidate genes and favorable alleles will further facilitate sesame breeding.
3.6. Limitations and Future Directions
It is known that landrace accessions generally exhibit a high degree of genetic diversity within each accession, and this diversity can pose a challenge when characterizing phenotypes and genotypes. Here, we addressed the challenge by the single-seed descent (SSD) method for two generations in each landrace accession, thereby obtaining homogeneous lines. We are therefore measuring the phenotypes and genotyping of the SNPs of individuals that have largely homozygous genetic backgrounds, which leads to higher mapping precision and less noise from intra-accession heterogeneity. However, some heterogeneity may still be present, and subsequent investigations can take advantage of deep sequencing or haplotype-based methods to reveal landrace diversity. Our meta-QTL analysis has combined data from research that used different types of populations for genetic mapping, different marker systems, and different genetic maps.
We aligned all the positions to a physical reference to have a common ground, but differences in population size, marker density, and QTL detection power remain in different investigations and may affect the stability of consensus intervals. In addition, differences in the resolution of mapping and thresholds for detection that arise from the use of both biparental QTL and GWAS data without limitations cannot be eliminated, even if the data have been handled carefully. By setting stringent hotspot criteria (3 independent QTL within 5 Mb) and performing functional validation through independent GWAS in Ethiopian germplasm, these limitations have been partially counterbalanced. The rapid LD decay (~190 kb) in our panel, while advantageous for fine-mapping, combined with our moderate SNP density (3,683 genome-wide SNPs, providing ~340 kb average spacing), means our candidate gene search windows of ±190 kb represent a practical balance between discovery power and mapping resolution in this diverse germplasm. Future research employing higher-density genotyping would enable finer resolution to pinpoint causal variants within the identified intervals.
4. Materials and Methods
4.1. Global Meta-QTL Analysis
A systematic meta-analysis was conducted to identify consensus genomic regions for plant height (PH) and seed coat color (SCC) in sesame. The following protocol was implemented to ensure transparency, reproducibility, and comparability across research undertakings. A comprehensive literature search was done for all published QTL mapping and GWAS on PH and SCC in sesame until January 2025. Search keywords included: “sesame QTL”, “Sesamum indicum plant height”, “seed coat color QTL”, and “sesame genome-wide association”. From an initial pool of over 85 publications, 28 investigations met the initial screening criteria of reporting primary QTL or marker-trait association data. After rigorous evaluation for completeness and comparability, eight investigations were selected for the final meta-analysis. The inclusion criteria were a peer-reviewed publication with primary QTL or GWAS data; clearly defined trait measurements for PH or SCC; reported chromosomal positions, genetic/physical map intervals, logarithm of odds (LOD) scores, and phenotypic variance explained (PVE); and availability of marker sequences or alignment information to allow mapping to a common reference genome. The eight investigations included in the meta-analysis were referenced [11,21,23,26,29,32,33,34]. A summary of excluded investigations with the criteria is provided in Supplementary Table S8. Data extraction and synthesis followed standard meta-analytic principles to mitigate bias. A summary of these investigations, including mapping method, population type, size, genetic map used, and marker system, is provided in Supplementary Table S1. Supplementary Table S1 provides a comprehensive summary of each study, including mapping method, population type and size, genetic map used, marker system, reported QTL intervals, logarithm of odds (LOD) scores, and phenotypic variance explained (PVE).
Data on QTL included the trait name, QTL linkage group [31]. markers, genetic position (cM), LOD score, and PVE. All the genetic positions were converted to the physical coordinates of the reference sesame genome using Sinbase version 2.0 (http://ocri-genomics.org/Sinbase/) [35] based on the sequence information of the markers. The meta-analysis was done using BioMercator v3.0 [36]. For each trait, QTL were gathered based on physical positions. Meta-QTL were found through a two-step process: (1) choosing the number of meta-QTL on each chromosome using model choice criteria (AIC, AICc, BIC), and (2) finding the consensus position and confidence interval for each meta-QTL. A genomic area was called a “meta-QTL hotspot” if it had three or more independent QTL from different investigations in a 5 Mb area. Candidate genes within these hotspot intervals were retrieved from the S. indicum genome annotation [35] and functionally annotated.
4.2. Plant Materials and Field Experimental Design
A total of 200 sesame samples were obtained from the Ethiopian Biodiversity Institute gene bank in Addis Ababa. The samples consisted mainly of landraces from five regional states in Ethiopia, which are major sesame production regions: Tigray (n = 56), Amhara (n = 50), Oromia (n = 44), Benishangul Gumuz (n = 32), and Gambella (n = 18). Three released cultivars, ‘Adi’, ‘Humera-1’, and ‘Kelafo-74’, were included as checks to evaluate performance and environmental effects. Kelafo-74 is a semi-dwarf, late-maturing, medium-yielding sesame with black seeds. ‘Adi’ is a tall, early-maturing, high-yielding sesame with white seeds, and ‘Humera-1’ is a medium-height, early-maturing, high-yielding sesame with white seeds and high oil content. To address the genetic heterogeneity typical of landraces, each accession was purified through two generations of single-seed descent (SSD) before field trials. This process ensured that each accession was represented by a genetically uniform line, minimizing within-accession variance and enhancing the accuracy of both phenotyping and genotyping. Bulk seed from the SSD-derived lines was used for field experiments and DNA extraction.
Field experiments were conducted over two growing seasons in 2024 and 2025 at the Werer Agricultural Research Center (WARC), Afar Region, Ethiopia (9°36′N, 40°05′E, 570 m above sea level). The location is characterized by semi-arid conditions, with an annual rainfall of 650 mm, silt loam soil containing 1.2% organic carbon, and a pH of 7.8. An augmented block design with eight blocks was used. All 200 test samples and three check cultivars were allocated to every block. The plot contained four 4 m rows with 30 cm spacing between rows and 10 cm between plants, with a total plot size of 3.6 m². Standard practices were followed, including irrigation, weeding, fertilizer, and pest management.
4.3. Phenotyping
Phenotyping was done at maturity. Plant height was included as one of the target traits because it is a key determinant of plant architecture and lodging resistance and is related to agronomic performance and yield potential. Plant height (PH) was measured in centimeters from the soil to the top of the main stem. Ten plants per plot were measured in centimeters, and the sample’s mean PH was recorded. Seed coat color (SCC) was evaluated because it is an important quality and market trait with clear phenotypic contrast among sesame cultivars, making it highly informative for genetic analysis. Seed coat color was measured using a Konica Minolta CR-400 Chroma Meter (Konica Minolta Sensing, Inc., Osaka, Japan). Color measurement had three samples of 50 grams of seeds. Before each session, the chroma meter was calibrated using a standard white calibration tile (L* = 93.7, a* = 0.3160, b* = 0.3323). Color was recorded in the CIELAB color space, defined by three parameters: lightness (L*, 0 = black to 100 = white), green-red axis (a*; negative values are green, positive values are red), and blue-yellow axis (b*; negative values are blue, positive values are yellow. Three technical replicates per accession and parameter (L*, a*, and b*) were averaged and used in subsequent analysis. The coefficient of variation between values was < 1%, meaning the measurement was precise.
4.4. SNP Data Processing
Whole-genome resequencing data for the 200 Ethiopian accessions were obtained from publicly available whole-genome resequencing data from BioProject PRJNA626474, which includes 705 global sesame accessions [37]. Our panel represents a subset of the global panel re-sequenced by Wang et al. [37], specifically those of Ethiopian origin. Raw sequencing reads were aligned to the S. indicum v3.0 reference genome using BWA-MEM v0.7.17. Variant calling was performed using GATK v4.2 following best practices for germline short variant discovery. Given the SSD-derived nature of the lines, within-accession heterogeneity was minimal; however, to ensure accuracy, genotype calling was performed using a pooled allele frequency threshold above 0.8 for homozygous calls. Genotype data in VCF format were filtered using PLINK v1.9 and VCFtools with the following criteria: minor allele frequency (MAF) above or equal to 0.03; individual genotype missing rate below 20%; SNP call rate above or equal to 80%; Hardy–Weinberg equilibrium p-value above 1 × 10⁻⁶; and removal of indels and multi-allelic sites. SNPs with a minor allele frequency (MAF) below 0.03 were excluded to remove rare variants that could produce spurious associations. After filtering, 3,683 high-confidence biallelic SNPs were retained for downstream population genomic and GWAS analyses. A summary of significant SNPs is provided in Supplementary Table S4.
4.5. Comparative Genomic Analysis
Given the limited availability of publicly deposited raw variant data specifically for African sesame germplasm, we performed comparative analysis by referencing published findings and summary statistics from major sesame genomics research. We focused on data from Wang et al. [37], who re-sequenced 705 global sesame accessions, including 62 from Ethiopia, data available under BioProject PRJNA626474. A summary of key public genomic resources used and referenced in this study is provided in Supplementary Table S1. From their published supplementary materials and results, we extracted published summary statistics including allele frequencies, population differentiation (FST), and nucleotide diversity (π) for genomic regions corresponding to our GWAS hits. This approach allowed us to contextualize our Ethiopian-specific accessions within global sesame diversity without requiring reprocessing of raw sequencing data. This analysis, though reliant on published summary statistics, offers a practical and valuable approach for initial validation within the constraints of available resources.
4.6. Population Structure, Kinship and Linkage Disequilibrium Analysis
Population structure analysis was carried out using the algorithm in ADMIXTURE v1.3.0 [38]. Runs were carried out for values of K ranging between 1 and 10, using cross-validation with 10 folds for each K [39]. K with the lowest cross-validation error was selected. Ancestry proportions as estimated by the Q-matrix output from K=2 were incorporated as covariates in the GWAS model to account for population stratification. The K-matrix was calculated to model genetic relatedness among individuals. The K-matrix was calculated to model genetic relatedness among individuals. The K-matrix was generated using the identity-by-state (IBS) algorithm in TASSEL v5.2 [40]. Genome-wide linkage disequilibrium (LD) was found using PLINK to measure the correlation (r²) between all pairs of SNPs in a 1 Mb window. r² values were plotted against the distance in kilobases between SNP pairs. The distance at which the smoothed curve, fitted with a LOESS regression, dropped to half its maximum value was taken as the LD decay distance and used to define the candidate gene search window around significant SNPs.
4.7. Genome-Wide Association Analysis
GWAS analysis between the 3,683 SNPs and the traits (PH, L*, a*, and b*) was performed using the Fixed and Random Model Circulating Probability Unification (FarmCPU) method [41], in the GAPIT3 R package v3.1.0 [56]. FarmCPU uses a Fixed-Effect Model (FEM) to test SNPs for association and a Random-Effect Model (REM) [6,10] to control for polygenic background, reducing false positives. Population structure and kinship matrix were used as covariates. In this study, marker-trait associations were considered significant if they exceeded the Bonferroni-corrected threshold of −log₁₀(p) = 3.4 (p ≤ 4.0 × 10⁻⁴). Notably, a similar threshold of −log₁₀(p) = 3.3 was used in the discovery-phase GWAS of Ethiopian sesame by Berhe et al. [10]. We adopted this threshold as it is biologically informed and appropriate for our study’s objectives and sample characteristics. Manhattan plots and quantile-quantile (Q-Q) plots were drawn to show GWAS results and measure model fit.
4.8. Candidate Gene Identification and In Silico Functional Annotation
For each SNP, a candidate genomic area was defined as the region ± the LD decay distance (~190 kb). All annotated genes in these areas were taken from the S. indicum v3.0 GFF3 file. Protein sequences were taken and studied using BLASTP searches against the NCBI non-redundant (nr) protein database (E-value cutoff < 1 × 10⁻⁵). Protein domain structure was studied using InterProScan v5.52-86.0 [42]. Candidate genes were chosen based on known functions, mostly genes in plant hormone production/signaling (e.g., PH) and phenylpropanoid/flavonoid production (e.g., SCC).
4.9. Phenotypic Data Analysis
For both traits, the mean, range, standard deviation, and coefficient of variation were calculated. Pearson’s correlation coefficients between traits were also estimated. Principal component analysis (PCA) was done in R on the trait matrix (PH, L*, a*, and b*) using the prcomp function. The FactoMineR and factoextra packages were used for PCA visualization. Broad-sense heritability (H²) for each trait across the seasons was measured using variance components from a linear mixed model:
where σ²g is the genotypic variance, σ²ge is the genotype-by-environment interaction variance, σ²ε is the residual error variance, e is the number of environments (seasons), and r is the number of replicates per environment. For test entries, replication was derived from the research design, and variance components were measured using the lme4 package in R.
5. Conclusion
This study demonstrates the power of combining global meta-analysis with population-specific GWAS to dissect the genetic architecture of complex traits within underutilized germplasm. We identified and validated six conserved meta-QTL hotspots for plant height and seed coat color, pinning the stability of those genomic regions across diverse sesame populations. More importantly, our GWAS on Ethiopian landraces has identified novel trait-associated loci on chromosomes 12 and 13, revealing unique allelic variation from the African gene pool, which was missed in previous Asian-centric research. The high-priority candidate genes identified include CYP90B1 and AP2/ERF for plant architecture and WRKY23, DOF3.1, and SBP-like genes related to pigmentation, which provide functional targets for further validation. The rapid LD decay (~190 kb) and clear population structure (K=2) of the Ethiopian panel facilitate fine-mapping and allele mining. Collectively, this work provides a validated molecular toolkit comprising meta-QTL intervals, trait-associated SNPs, and candidate genes that can be immediately deployed in marker-assisted selection programs to accelerate the improvement of sesame, particularly by introgressing favorable alleles from Ethiopian germplasm into elite breeding lines.
Supplementary Materials
Supporting information and supplementary tables can be downloaded from the Figshare repository at: DOI: 10.6084/m9.figshare.31082782.
Author Contributions
Conceptualization: A.G., R.O. and R.V.; Methodology: A.G. and R.O.; Software: A.G.; Validation: A.G., R.O. and R.V.; Formal Analysis: A.G.; Investigation: A.G. R.O. and R.V.; Resources: R.O. and R.V.; Data Curation: A.G. and R.O.; Writing -- Original Draft Preparation: A.G.; Writing -- Review and Editing: A.G., R.V. and R.O.; Visualization: A.G.; Supervision: R.O. and R.V.; Project Administration: R.O. and R.V.; Funding Acquisition: R.O. and R.V. All authors have read and agreed to the published version of the manuscript.
Funding
This research was funded by the Carl Tryggers Stiftelse för Vetenskaplig Forskning, grant number CTS 23:2654. The APC was funded by the Swedish University of Agricultural Sciences.
Data Availability Statement
All supplementary tables, the curated phenotypic dataset, and the filtered SNP dataset (Excel format) for the Ethiopian panel are available in the Figshare repository at: [DOI: 10.6084/m9.figshare.31082782]. These data are publicly accessible. The plant materials are maintained by the Ethiopian Biodiversity Institute (EBI), Addis Ababa, and may be requested according to EBI’s material transfer agreements. Public resequencing data used for comparative analysis is available under BioProject PRJNA626474.
Acknowledgments
We thank the Carl Tryggers Stiftelse for funding this research and covering the APC. We thank the Ethiopian Biodiversity Institute (EBI), Addis Ababa, for the resources. We thank Mesay Tadesse, Zemedkun Alemu, and the staff at the Werer Agricultural Research Center (WARC) for their help. The authors thank SLU Bioinformatics Infrastructure (SLUBI) for technical help during the bioinformatic data analysis. We acknowledge the researchers who generated the global sesame resequencing dataset (PRJNA626474), which enabled valuable contextualization of our Ethiopian-specific findings.
Conflicts of Interest
The authors declare no conflicts of interest.
Abbreviations
| AIC | Akaike Information Criterion |
| AICc | Corrected Akaike Information Criterion |
| AP2/ERF | APETALA2/ETHYLENE RESPONSE FACTOR |
| BIC | Bayesian Information Criterion |
| BSA | Bulked Segregant Analysis |
| BWA-MEM | Burrows-Wheeler Aligner – Maximal Exact Matches (bioinformatics tool) |
| Chr | Chromosome |
| cM | Centimorgan |
| CR-400 | Model of the Konica Minolta Chroma Meter |
| CV | Coefficient of Variation |
| CYP90B1 | Cytochrome P450 90B1 (DWF4 gene) |
| DIR | DIRigent (gene family) |
| DOF | DNA-binding One Zinc Finger |
| EBI | Ethiopian Biodiversity Institute |
| F₂ | Second Filial Generation |
| F₃ | Third Filial Generation |
| F₇ | Seventh Filial Generation |
| F₈ | Eighth Filial Generation |
| FAO | Food and Agriculture Organization |
| FarmCPU | Fixed and Random Model Circulating Probability Unification |
| FEM | Fixed-Effect Model |
| FST | Fixation Index (population genetic statistic) |
| GAPIT | Genome Association and Prediction Integrated Tool |
| GATK | Genome Analysis Toolkit |
| GBS | Genotyping-by-Sequencing |
| GFF3 | General Feature Format version 3 |
| GWAS | Genome-Wide Association Study |
| H² | Broad-sense Heritability |
| HTRX | Haplotype Trend Regression with eXclusion |
| IBS | Identity-by-State |
| K | Number of genetic clusters (in population structure) |
| KASP | Kompetitive Allele-Specific PCR |
| kb | Kilobase |
| LD | Linkage Disequilibrium |
| LOD | Logarithm of Odds |
| LOESS | Locally Estimated Scatterplot Smoothing |
| L* | Lightness (CIELAB color space parameter) |
| a* | Green–Red component (CIELAB color space parameter) |
| b* | Blue–Yellow component (CIELAB color space parameter) |
| MAF | Minor Allele Frequency |
| MAS | Marker-Assisted Selection |
| Mb | Megabase |
| MYB | v-MYB avian myeloblastosis viral oncogene homolog (transcription factor family) |
| bHLH | Basic Helix-Loop-Helix (transcription factor family) |
| NCBI nr | National Center for Biotechnology Information non-redundant (database) |
| PCA | Principal Component Analysis |
| PEG | Polyethylene Glycol |
| PH | Plant Height |
| PLINK | Whole genome association analysis toolset |
| PPO | Polyphenol Oxidase |
| PVE | Phenotypic Variance Explained |
| Q-matrix | Ancestry proportion matrix (from population structure) |
| Q-Q plot | Quantile-Quantile plot |
| QTL | Quantitative Trait Locus/Loci |
| r | Number of replicates |
| r² | Squared correlation coefficient (measure of LD) |
| RAD-seq | Restriction-site Associated DNA Sequencing |
| REM | Random-Effect Model (mentioned as background model in FarmCPU) |
| RIL | Recombinant Inbred Line |
| SBP | SQUAMOSA Promoter-Binding Protein |
| SCC | Seed Coat Color |
| SIACS9 | Sesamum indicum 1-aminocyclopropane-1-carboxylic acid synthase 9 |
| SICEN2 | Sesamum indicum Centroradialis 2 |
| Sindi | Sesamum indicum (gene prefix in genome annotation) |
| SLAF | Specific-Length Amplified Fragment |
| SLUBI | Swedish University of Agricultural Sciences Bioinformatics Infrastructure |
| SLU | Swedish University of Agricultural Sciences |
| SNP | Single Nucleotide Polymorphism |
| SSD | Single-Seed Descent |
| SSR | Simple Sequence Repeat |
| STY8 | Serine/Threonine-protein kinase STY8 |
| TASSEL | Trait Analysis by aSSociation, Evolution and Linkage |
| TF | Transcription Factor |
| VCF | Variant Call Format |
| VCFtools | Variant Call Format tools |
| WARC | Werer Agricultural Research Center |
| WRKY | Transcription factor family named after the conserved WRKY domain |
References
- Wei, W.; Zhang, Y.; Lü, H.; Li, D.; Wang, L.; Zhang, X. Association Analysis for Quality Traits in a Diverse Panel of Chinese Sesame (Sesamum indicum L.) Germplasm. J. Integr. Plant Biol. 2013, 55, 745–758. [Google Scholar] [CrossRef]
- Andargie, M.; Vinas, M.; Rathgeb, A.; Möller, E.; Karlovsky, P. Lignans of Sesame (Sesamum indicum L.): A Comprehensive Review. Molecules 2021, 26, 883. [Google Scholar] [CrossRef] [PubMed]
- Dossa, K.; Diouf, D.; Wang, L.; Wei, X.; Zhang, Y.; Niang, M.; Fonceka, D.; Yu, J.; Mmadi, M.A.; Yehouessi, L.W.; et al. The Emerging Oilseed Crop Sesamum indicum Enters the “Omics” Era. Front. Plant Sci. 2017, 8, 1154. [Google Scholar] [CrossRef]
- Rauf, S.; Basharat, T.; Gebeyehu, A.; Elsafy, M.; Rahmatov, M.; Ortiz, R.; Kaya, Y. Sesame, an Underutilized Oilseed Crop: Breeding Achievements and Future Challenges. Plants 2024, 13, 2662. [Google Scholar] [CrossRef]
- FAOSTAT. World Food and Agriculture - Statistical Yearbook 2024. 2024. Available online: https://www.fao.org/faostat/ (accessed on 21 September 2025).
- Tesfaye, T.; Tesfaye, K.; Keneni, G.; Alemu, T.; Alemu, A. Genome-Wide Association Study for Yield-Related Traits in Sesame (Sesamum Indicum). Plant Breed. 2022, 141, 246–256. [Google Scholar] [CrossRef]
- Varshney, R.K.; Bohra, A.; Yu, J.; Graner, A.; Zhang, Q.; Sorrells, M.E. Designing Future Crops: Genomics-Assisted Breeding Comes of Age. Trends Plant Sci. 2021, 26, 631–649. [Google Scholar] [CrossRef] [PubMed]
- Varshney, R.K.; Graner, A.; Sorrells, M.E. Genomics-Assisted Breeding for Crop Improvement. Trends Plant Sci. 2005, 10, 621–630. [Google Scholar] [CrossRef]
- Weldemichael, M.Y.; Gebremedhn, H.M.; Runo, S.; Gandhi, H. Molecular Breeding for Stress Tolerance in Sesame. Mol. Genet. Genom. 2025, 300, 69. [Google Scholar] [CrossRef]
- Berhe, M.; Dossa, K.; You, J.; Mboup, P.A.; Diallo, I.N.; Diouf, D.; Zhang, X.; Wang, L. Genome-Wide Association Study and Its Applications in the Non-Model Crop Sesamum indicum. BMC Plant Biol. 2021, 21, 283. [Google Scholar] [CrossRef]
- Debnath, A.J.; Ernst, D.; Harenčár, Ľ.; Kučka, M.; Basu, D.; Sikdar, S.R. A Review on Yield Improvement of the Important Oilseed Sesame (Sesamum indicum L.) using Biotechnology. Sesamum indicum 2024. [Google Scholar] [CrossRef]
- Teklu, D.H.; Shimelis, H.; Abady, S. Genetic Improvement in Sesame (Sesamum indicum L.): Progress and Outlook: A Review. Agronomy 2022, 12, 2144. [Google Scholar] [CrossRef]
- Wang, L.; Yu, S.; Tong, C.; Zhao, Y.; Liu, Y.; Song, C.; Zhang, Y.; Zhang, X.; Wang, Y.; Hua, W.; et al. Genome Sequencing of the High Oil Crop Sesame Provides Insight into Oil Biosynthesis. Genome Biol. 2014, 15, R39. [Google Scholar] [CrossRef]
- Mondal, R.; Kumar, A.; Gnanesh, B.N. Crop Germplasm: Current Challenges, Physiological-Molecular Perspective, and Advanced Strategies Towards Development of Climate-Resilient Crops. Heliyon 2023, 9, e12879. [Google Scholar] [CrossRef]
- Teklu, D.H.; Shimelis, H.; Tesfaye, A.; Mashilo, J.; Zhang, X.; Zhang, Y.; Dossa, K.; Shayanowako, A.I.T. Genetic Variability and Population Structure of Ethiopian Sesame (Sesamum indicum L.) Germplasm Assessed through Phenotypic Traits and Simple Sequence Repeats Markers. Plants 2021, 10, 1129. [Google Scholar] [CrossRef]
- Harlan, J.R. Crops and Man; American Society of Agronomy and Crop Science Society of America: Madison, WI, USA, 1992. [Google Scholar]
- Nayar, N.M.; Mehra, K. Sesame: Its Uses, Botany, Cytogenetics, and Origin. Econ. Bot. 1970, 24, 20–31. [Google Scholar] [CrossRef]
- Gedifew, S.; Demelash, H.; Abate, A.; Abebe, T.D. Association of Quantitative Traits and Genetic Diversity in Ethiopian Sesame (Sesamum indicum L.) Genotypes. Heliyon 2024, 10, e26623. [Google Scholar] [CrossRef] [PubMed]
- Li, D.; Dossa, K.; Zhang, Y.; Wei, X.; Wang, L.; Zhang, Y.; Liu, A.; Zhou, R.; Zhang, X. GWAS Uncovers Differential Genetic Bases for Drought and Salt Tolerances in Sesame at the Germination Stage. Genes 2018, 9, 87. [Google Scholar] [CrossRef]
- Wu, J.; Cheng, J.-H.; Yang, F.-C. Transcriptional Regulation of Anthocyanin Biosynthesis in Plants. Chin. J. Cell Biol. 2006, 28, 453–456. [Google Scholar]
- Cui, C.; Liu, Y.; Liu, Y.; Cui, X.; Sun, Z.; Du, Z.; Wu, K.; Jiang, X.; Mei, H.; Zheng, Y. Genome-Wide Association Study of Seed Coat Color in Sesame (Sesamum indicum L.). PLoS ONE 2021, 16, e0251526. [Google Scholar] [CrossRef]
- Wang, L.; Dossou, S.S.K.; Wei, X.; Zhang, Y.; Li, D.; Yu, J.; Zhang, X. Transcriptome Dynamics during Black and White Sesame (Sesamum indicum L.) Seed Development and Identification of Candidate Genes Associated with Black Pigmentation. Genes 2020, 11, 1399. [Google Scholar] [CrossRef]
- Zhang, H.; Miao, H.; Wei, L.; Li, C.; Zhao, R.; Wang, C. Genetic Analysis and QTL Mapping of Seed Coat Color in Sesame (Sesamum indicum L.). PLoS ONE 2013, 8, e63898. [Google Scholar] [CrossRef] [PubMed]
- Moazzami, A.A.; Kamal-Eldin, A. Sesame Seed Is a Rich Source of Dietary Lignans. J. Am. Oil Chem. Soc. 2006, 83, 719–723. [Google Scholar] [CrossRef]
- Teklu, D.H.; Shimelis, H.; Tesfaye, A.; Abady, S. Appraisal of the Sesame Production Opportunities and Constraints, and Farmer-Preferred Varieties and Traits, in Eastern and Southwestern Ethiopia. Sustainability 2021, 13, 11202. [Google Scholar] [CrossRef]
- Du, H.; Zhang, H.; Wei, L.; Li, C.; Duan, Y.; Wang, H. A High-Density Genetic Map Constructed Using Specific Length Amplified Fragment (SLAF) Sequencing and QTL Mapping of Seed-Related Traits in Sesame (Sesamum indicum L.). BMC Plant Biol. 2019, 19, 588. [Google Scholar] [CrossRef]
- Elsafy, M.; Badawi, W.; Ibrahim, A.; Hafiz Baillo, E.; Bajgain, P.; Abdelhalim, T.S.; Rahmatov, M. Genome-Wide Association Scan and Candidate Gene Analysis for Seed Coat Color in Sesame (Sesamum indicum L.). Front. Plant Sci. 2025, 16, 1541656. [Google Scholar] [CrossRef] [PubMed]
- Guden, B.; Qureshi, M.; Wang, L.; Li, H.; Sinare, B.; Uzun, B.; Yol, E. Molecular Breeding to Design Ideal Sesame Crop. In Allele Mining for Genomic Designing of Oilseed Crops; Kole, C., Ed.; CRC Press: Boca Raton, FL, USA, 2024; pp. 217–238. [Google Scholar]
- Wang, L.; Xia, Q.; Zhang, Y.; Zhu, X.; Zhu, X.; Li, D.; Ni, X.; Gao, Y.; Xiang, H.; Wei, X.; et al. Updated Sesame Genome Assembly and Fine Mapping of Plant Height and Seed Coat Color QTLs Using a New High-Density Genetic Map. BMC Genom. 2016, 17, 31. [Google Scholar] [CrossRef]
- Myles, S.; Peiffer, J.; Brown, P.J.; Ersoz, E.S.; Zhang, Z.; Costich, D.E.; Buckler, E.S. Association Mapping: Critical Considerations Shift from Genotyping to Experimental Design. Plant Cell 2009, 21, 2194–2202. [Google Scholar] [CrossRef]
- Bhat, J.A.; Ali, S.; Salgotra, R.K.; Mir, Z.A.; Dutta, S.; Jadon, V.; Tyagi, A.; Mushtaq, M.; Jain, N.; Singh, P.K.; et al. Genomic Selection in the Era of Next-Generation Sequencing for Complex Traits in Plant Breeding. Front. Genet. 2016, 7, 221. [Google Scholar] [CrossRef]
- Liang, J.; Sun, J.; Ye, Y.; Yan, X.; Yan, T.; Rao, Y.; Zhou, H.; Le, M. QTL Mapping of PEG-Induced Drought Tolerance at the Early Seedling Stage in Sesame Using Whole Genome Re-Sequencing. PLoS ONE 2021, 16, e0247681. [Google Scholar] [CrossRef] [PubMed]
- Sheng, C.; Song, S.; Zhou, R.; Li, D.; Gao, Y.; Cui, X.; Tang, X.; Zhang, Y.; Tu, J.; Zhang, X. QTL-seq and Transcriptome Analysis Disclose Major QTL and Candidate Genes Controlling Leaf Size in Sesame (Sesamum indicum L.). Front. Plant Sci. 2021, 12, 580846. [Google Scholar] [CrossRef]
- Wu, K.; Liu, H.; Yang, M.; Tao, Y.; Ma, H.; Wu, W.; Zuo, Y.; Zhao, Y. High-Density Genetic Map Construction and QTLs Analysis of Grain Yield-Related Traits in Sesame (Sesamum indicum L.) Based on RAD-Seq Technology. BMC Plant Biol. 2014, 14, 274. [Google Scholar] [CrossRef]
- Wang, L.; Yu, J.; Zhang, Y.; You, J.; Zhang, X.; Wang, L. Sinbase 2.0: An Updated Database to Study Multi-Omics in Sesamum indicum. Plants 2021, 10, 272. [Google Scholar] [CrossRef]
- Sosnowski, O.; Charcosset, A.; Joets, J. BioMercator V3: An Upgrade of Genetic Map Compilation and Quantitative Trait Loci Meta-Analysis Algorithms. Bioinformatics 2012, 28, 2082–2083. [Google Scholar] [CrossRef]
- Wang, M; Huang, J; Liu, S; Liu, X; Li, R; Luo, J; Fu, Z. Improved assembly and annotation of the sesame genome. DNA Res. 2022, 29(6), dsac041. [Google Scholar] [CrossRef] [PubMed] [PubMed Central]
- Alexander, D.H.; Novembre, J.; Lange, K. Fast Model-Based Estimation of Ancestry in Unrelated Individuals. Genome Res. 2009, 19, 1655–1664. [Google Scholar] [CrossRef] [PubMed]
- Yang, Y.; Lawson, D.J. HTRX: An R Package for Learning Non-Contiguous Haplotypes Associated with a Phenotype. Bioinform. Adv. 2023, 3, vbad038. [Google Scholar] [CrossRef]
- Bradbury, P.J.; Zhang, Z.; Kroon, D.E.; Casstevens, T.M.; Ramdoss, Y.; Buckler, E.S. TASSEL: Software for Association Mapping of Complex Traits in Diverse Samples. Bioinformatics 2007, 23, 2633–2635. [Google Scholar] [CrossRef] [PubMed]
- Liu, X.; Huang, M.; Fan, B.; Buckler, E.S.; Zhang, Z. Iterative Usage of Fixed and Random Effect Models for Powerful and Efficient Genome-Wide Association Studies. PLoS Genet. 2016, 12, e1005767. [Google Scholar] [CrossRef]
- Jones, P.; Binns, D.; Chang, H.-Y.; Fraser, M.; Li, W.; McAnulla, C.; McWilliam, H.; Maslen, J.; Mitchell, A.; Nuka, G.; et al. InterProScan 5: Genome-Scale Protein Function Classification. Bioinformatics 2014, 30, 1236–1240. [Google Scholar] [CrossRef] [PubMed]
- Kaur, S.; Das, A.; Sheoran, S.; Rakshit, S. QTL Meta-Analysis: An Approach to Detect Robust and Precise QTL. Trop. Plant Biol. 2023, 16, 225–243. [Google Scholar] [CrossRef]
- Wei, X; Gong, H; Yu, J; Liu, P; Wang, L; Zhang, Y; Zhang, X. SesameFG: an integrated database for the functional genomics of sesame. Sci Rep. 2017, 7(1), 2342. [Google Scholar] [CrossRef] [PubMed] [PubMed Central]
- Dubois, M.; Van den Broeck, L.; Inzé, D. The Pivotal Role of Ethylene in Plant Growth. Trends Plant Sci. 2018, 23, 311–323. [Google Scholar] [CrossRef]
- Mei, H.; Liu, Y.; Cui, C.; Hu, C.; Xie, F.; Zheng, L.; Du, Z.; Wu, K.; Jiang, X.; Zheng, Y. QTL Mapping of Yield-Related Traits in Sesame. Mol. Breed. 2021, 41, 43. [Google Scholar] [CrossRef]
- Müller, M.; Munné-Bosch, S. Ethylene Response Factors: A Key Regulatory Hub in Hormone and Stress Signaling. Plant Physiol. 2015, 169, 32–41. [Google Scholar] [CrossRef]
- Choe, S.; Dilkes, B.P.; Fujioka, S.; Takatsuto, S.; Sakurai, A.; Feldmann, K.A. The DWF4 Gene of Arabidopsis Encodes a Cytochrome P450 That Mediates Multiple 22α-Hydroxylation Steps in Brassinosteroid Biosynthesis. Plant Cell 1998, 10, 231–243. [Google Scholar] [CrossRef] [PubMed]
- Yanagisawa, S. Dof Domain Proteins: Plant-Specific Transcription Factors Associated with Diverse Phenomena Unique to Plants. Plant Cell Physiol. 2004, 45, 386–391. [Google Scholar] [CrossRef] [PubMed]
- Cortés, A.J.; López-Hernández, F. Harnessing Crop Wild Diversity for Climate Change Adaptation. Genes 2021, 12, 783. [Google Scholar] [CrossRef]
- Nolan, T.M.; Vukašinović, N.; Liu, D.; Russinova, E.; Yin, Y. Brassinosteroids: Multidimensional Regulators of Plant Growth, Development, and Stress Responses. Plant Cell 2020, 32, 295–318. [Google Scholar] [CrossRef]
- Achard, P.; Vriezen, W.H.; Van Der Straeten, D.; Harberd, N.P. Ethylene Regulates Arabidopsis Development via the Modulation of DELLA Protein Growth Repressor Function. Plant Cell 2003, 15, 2816–2825. [Google Scholar] [CrossRef] [PubMed]
- Shahzadi, I.; Ahmad, A.; Noreen, Z.; Akram, W.; Yasin, N.A.; Khan, W.U. Brassinosteroid and Ethylene-Mediated Cross Talk in Plant Growth and Development. In Brassinosteroids Signalling: Intervention with Phytohormones and Their Relationship in Plant Adaptation to Abiotic Stresses; Aftab, T., Ed.; Springer: Singapore, 2022; pp. 117–136. [Google Scholar]
- Langham, D. Shatter Resistance in Sesame. In Sesame Improvement by Induced Mutations; Final reports of an FAO/IAEA coordinated research project. 1993-1998; International Atomic Energy Agency: Vienna, Austria, 2001; pp. 51–61. [Google Scholar]
- Dossou, S.S.K.; Luo, Z.; Deng, Q.; Zhou, R.; Zhang, Y.; Li, D.; Li, H.; Tozo, K.; You, J.; Wang, L. Biochemical and Molecular Insights into Variation in Sesame Seed Antioxidant Capability as Revealed by Metabolomics and Transcriptomics Analysis. Antioxidants 2024, 13, 514. [Google Scholar] [CrossRef]
- Wang, J.; Zhang, Z. GAPIT Version 3: Boosting Power and Accuracy for Genomic Association and Prediction. Genom. Proteom. Bioinform. 2021, 19, 629–640. [Google Scholar] [CrossRef] [PubMed]
- Heslot, N.; Jannink, J.L.; Sorrells, M.E. Perspectives for Genomic Selection Applications and Research in Plants. Crop Sci. 2015, 55, 1–12. [Google Scholar] [CrossRef]
- Sharma, R.; Yang, C.J.; Rossi, N.; Irving, E.; Tuffin, A.; Aliki, H.; Powell, W.; Dawson, I.K. Integrating Molecular Genetics with Plant Breeding to Deliver Impact. Plant Physiol. 2025, 198, kiaf087. [Google Scholar] [CrossRef] [PubMed]
Figure 1.
Genomic distribution of meta-quantitative trait loci (meta-QTL) hotspots for (A) plant height and (B) seed coat color derived from a global meta-analysis of eight QTL mapping sources. Chromosomes are drawn to scale (megabases, Mb). The Y-axis indicates the normalized LOD score, showing the strength of QTL evidence after meta-analysis. Peaks represent meta-QTL positions. Meta-QTL hotspots are represented by horizontal yellow bars: plant height hotspots on chromosomes 3, 8, and 11 (A), and seed coat color hotspots on chromosomes 4, 6, and 9 (B).
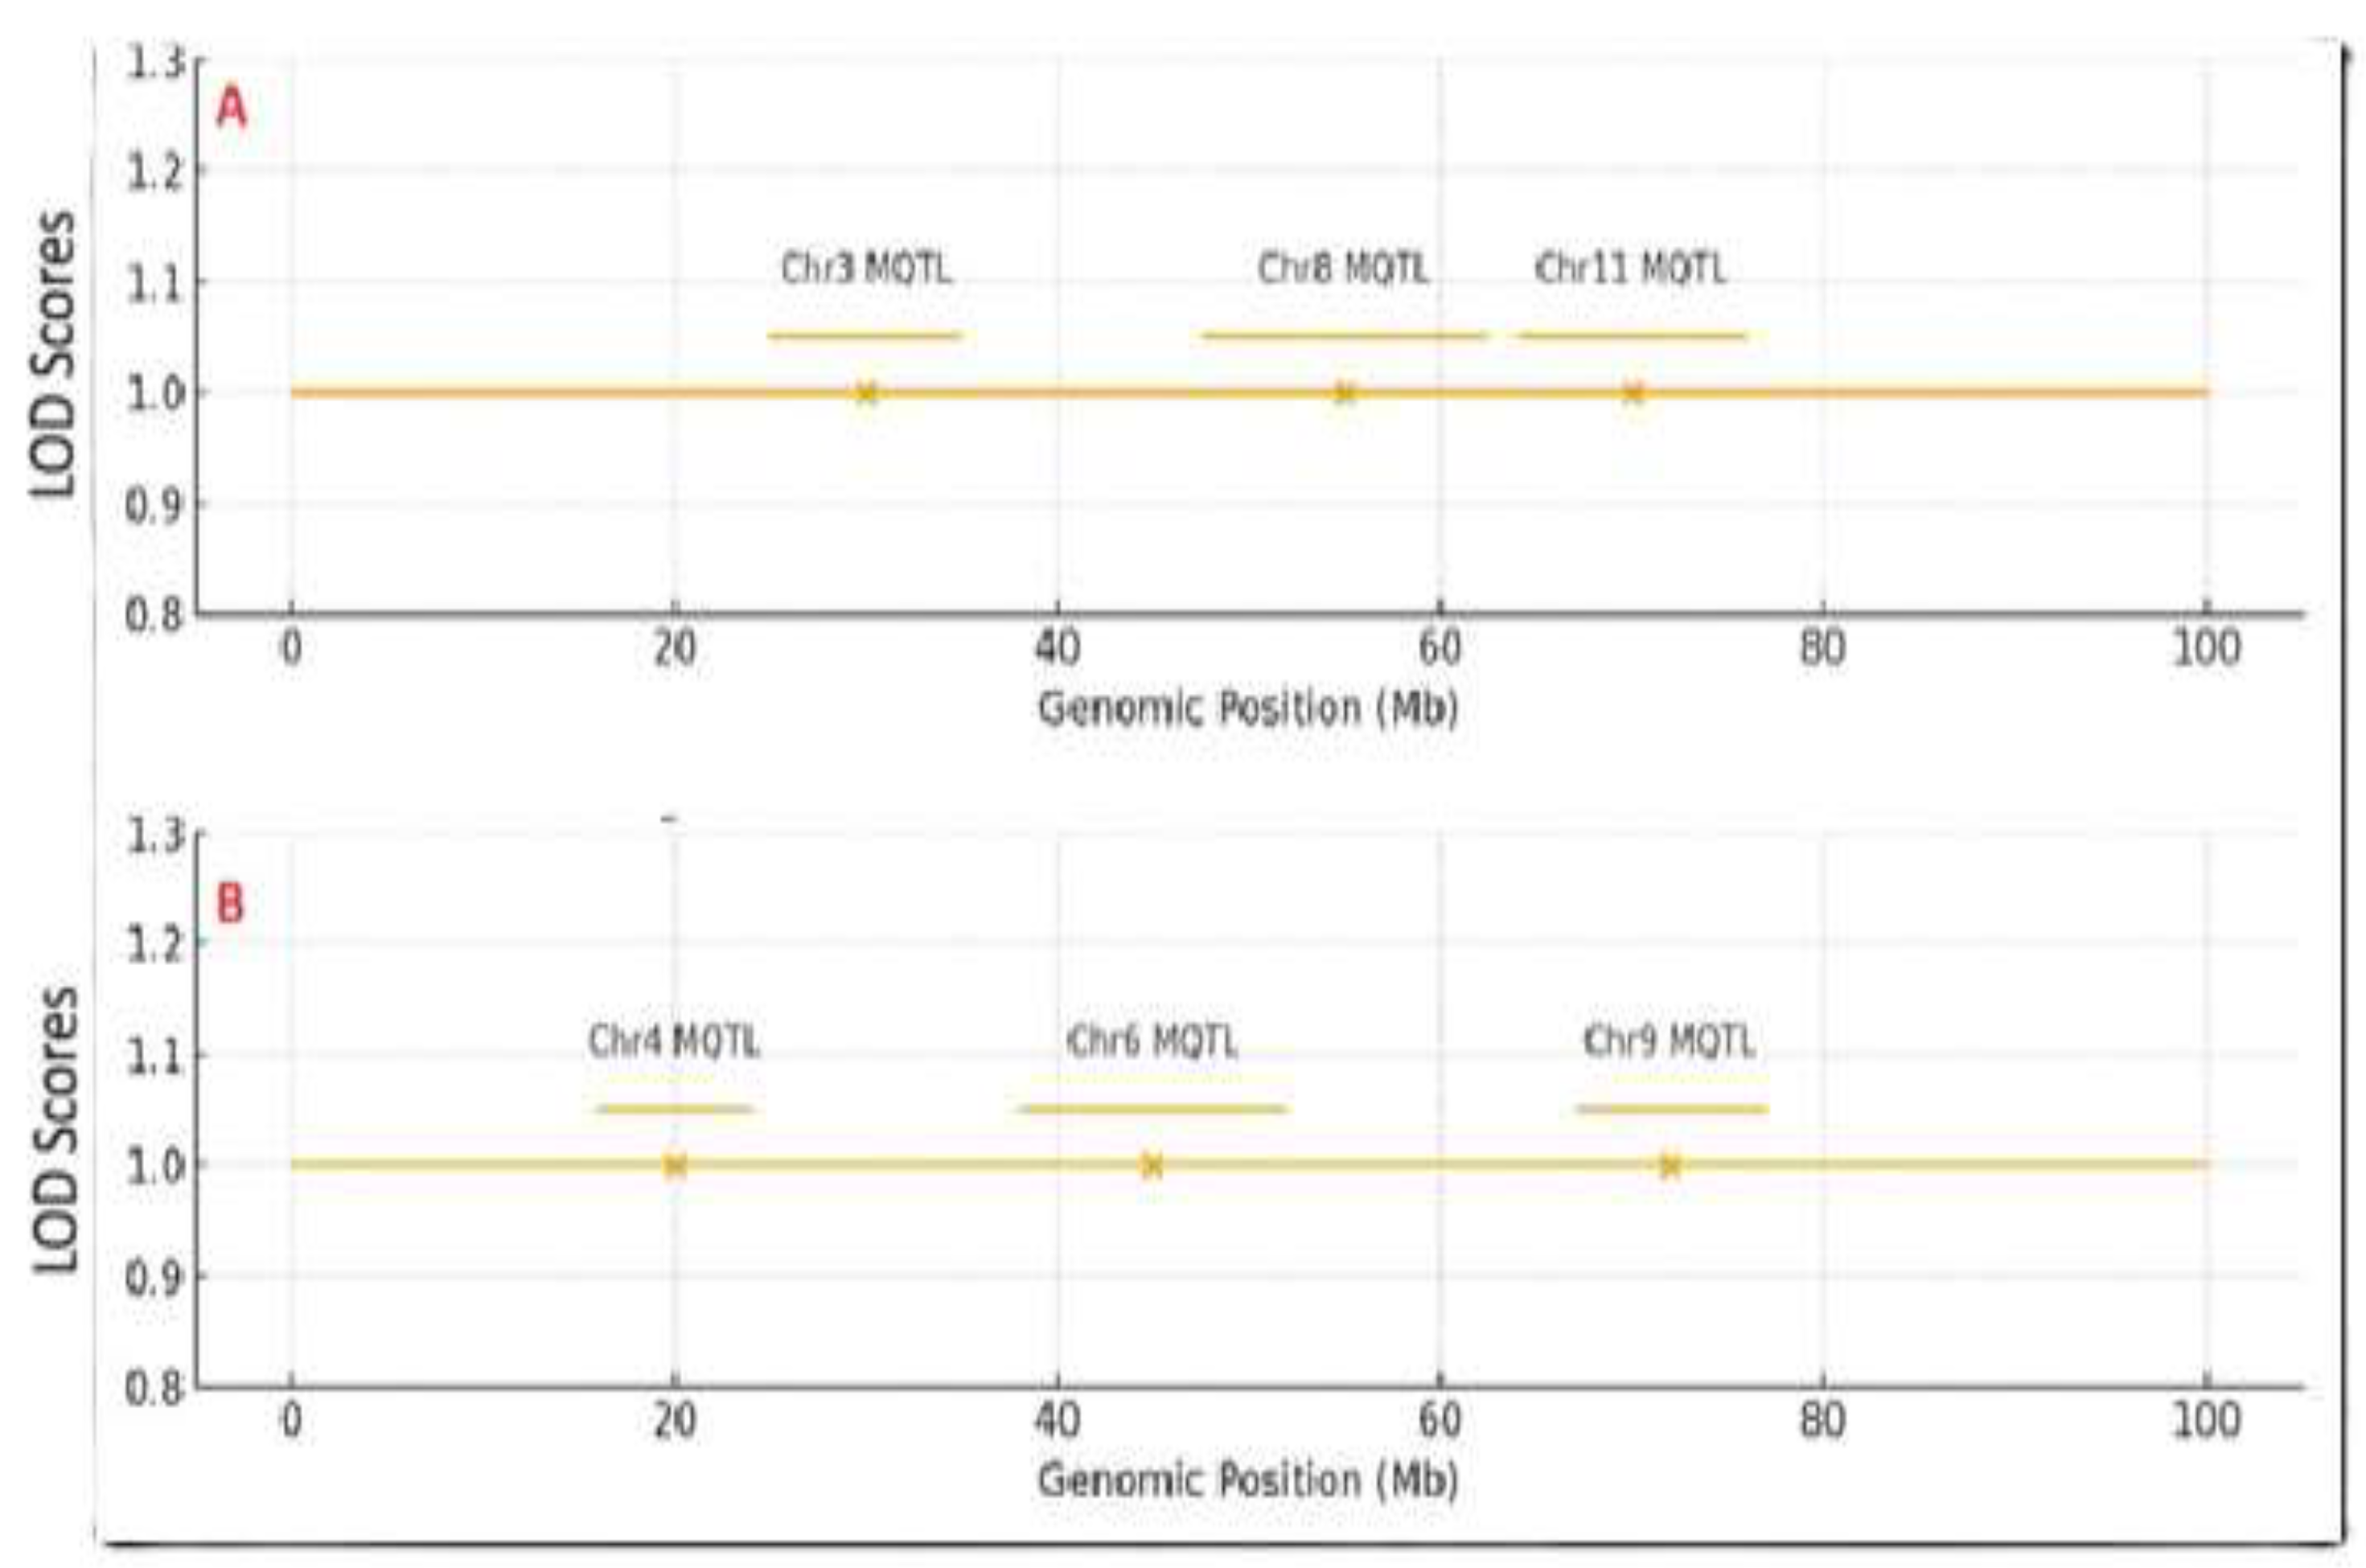
Figure 2.
Phenotypic characterization of 200 Ethiopian sesame accessions. (A) Box plots showing distributions of plant height (PH, in cm) and seed coat color parameters (L, a, b in CIELAB units) across two growing seasons. (B) Correlation matrix and scatter plots among PH and SCC traits. (C) Principal component analysis (PCA) biplot of accessions based on PH, L, a, and b.
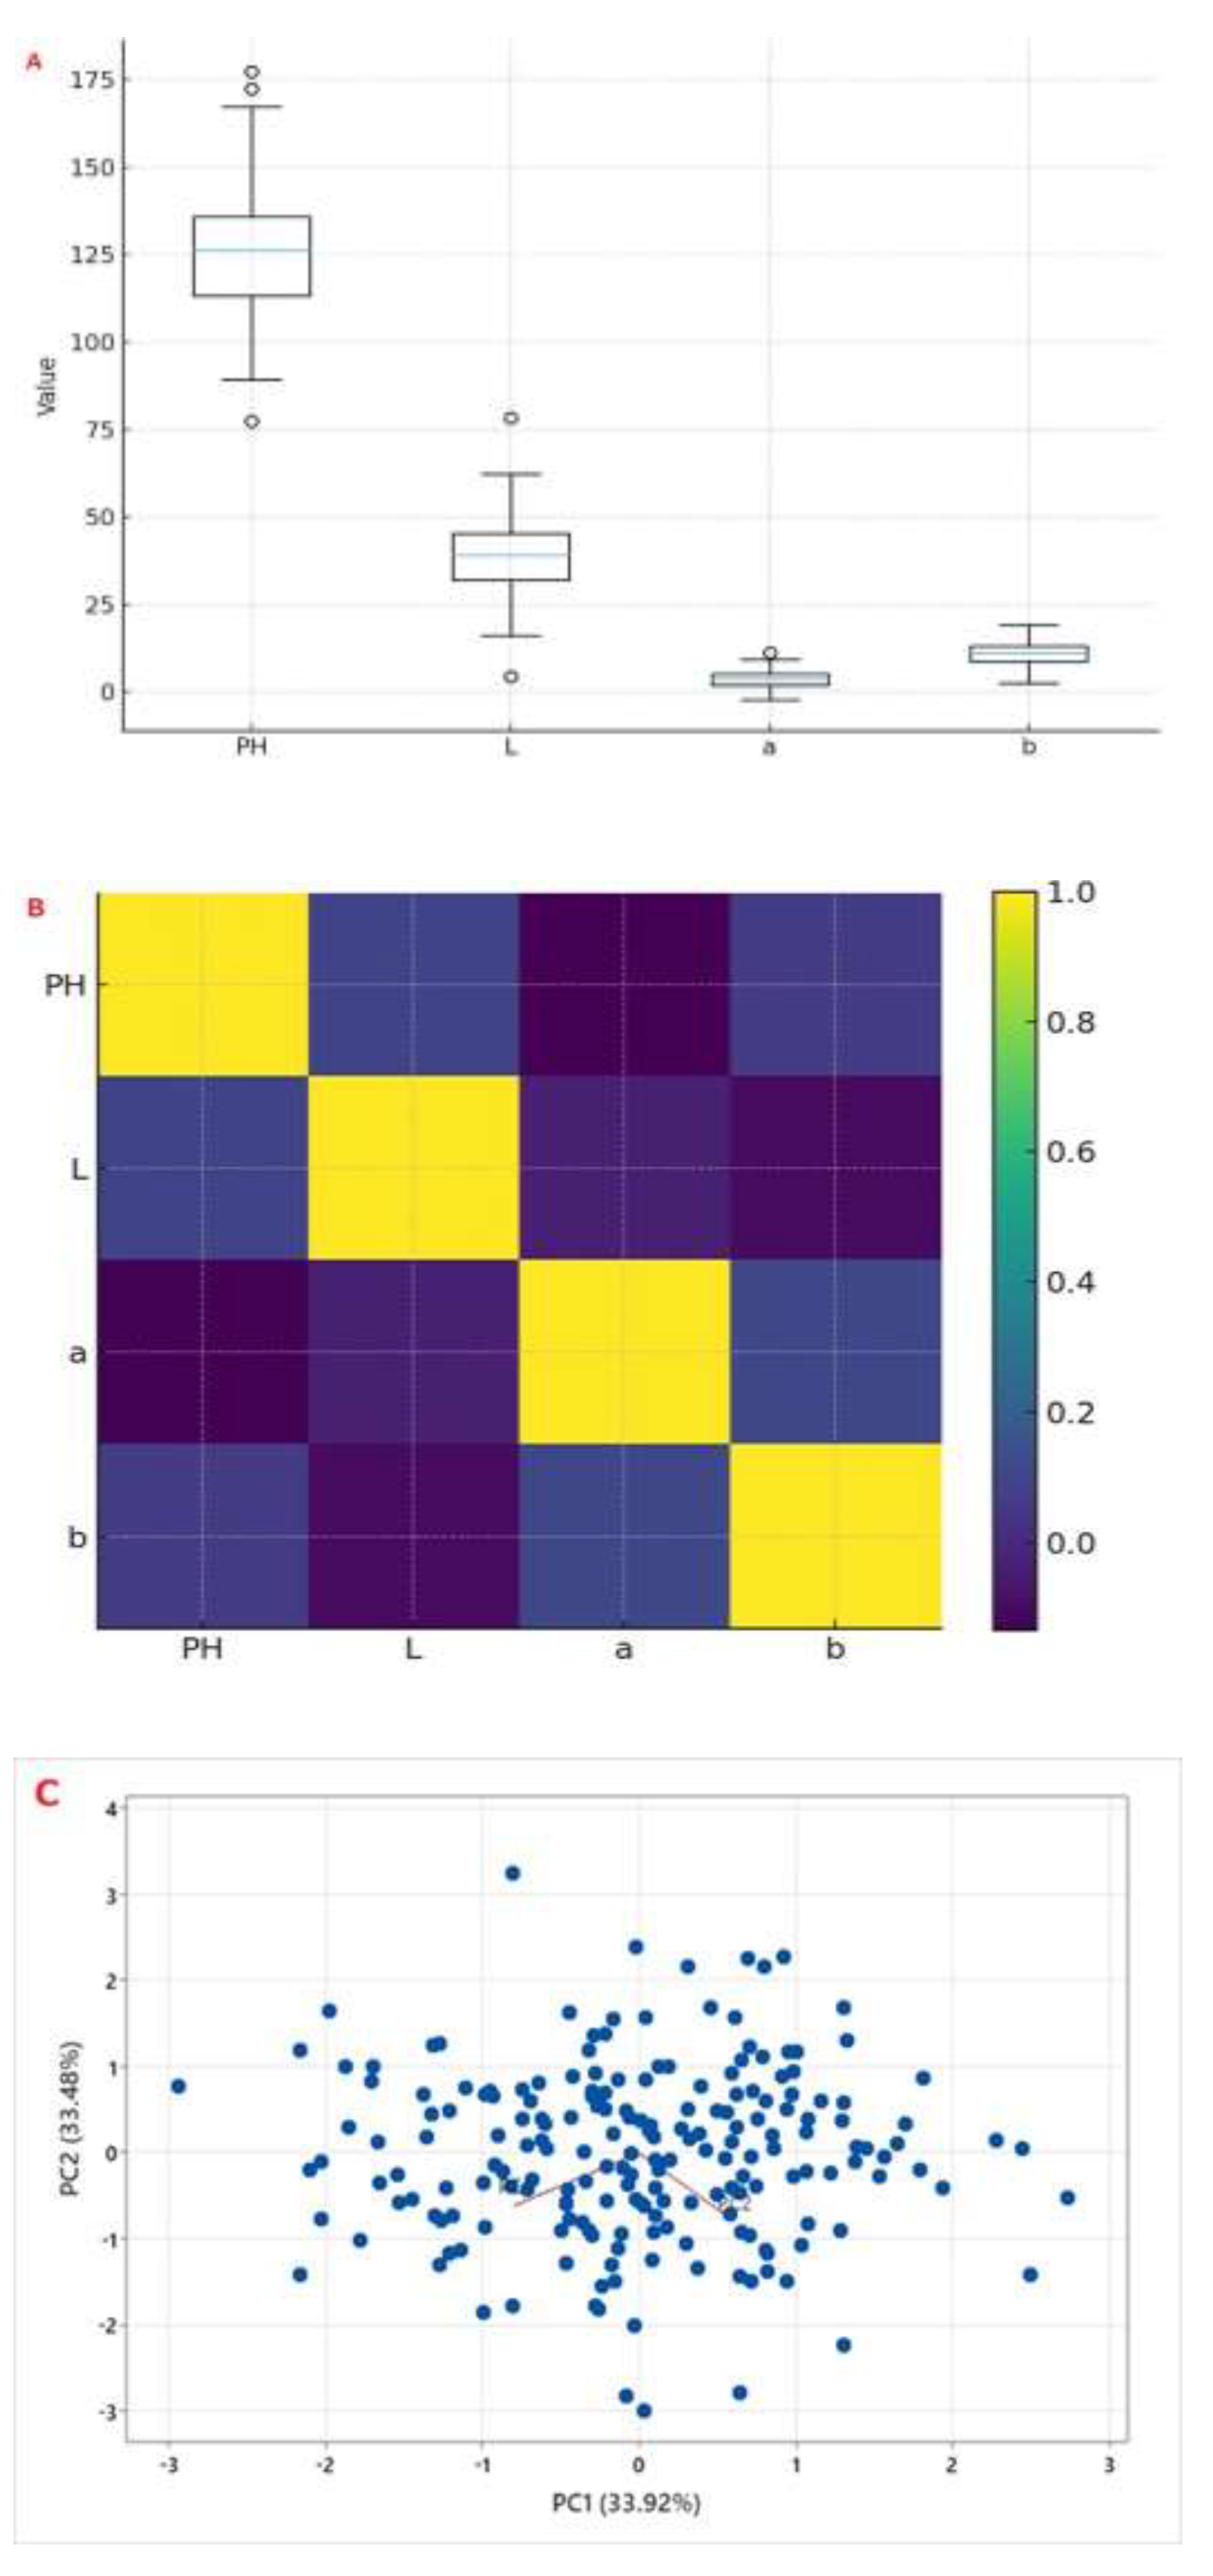
Figure 3.
Population genomic analysis of 200 Ethiopian sesame accessions. (A) Population structure (ADMIXTURE, K = 2) showing ancestry proportions: Cluster I (blue, northern regions: Tigray and Amhara) and Cluster II (orange, central and western regions: Oromia, Benishangul Gumuz and Gambella). (B) Kinship matrix heatmap (darker red = higher genetic relatedness). Accessions are ordered by clusters from (A). (C) Genome-wide LD decay plot showing correlation (r²) between SNP pairs plotted against physical distance (kb); LOESS-smoothed curve decays to half-maximum at ~190 kb.
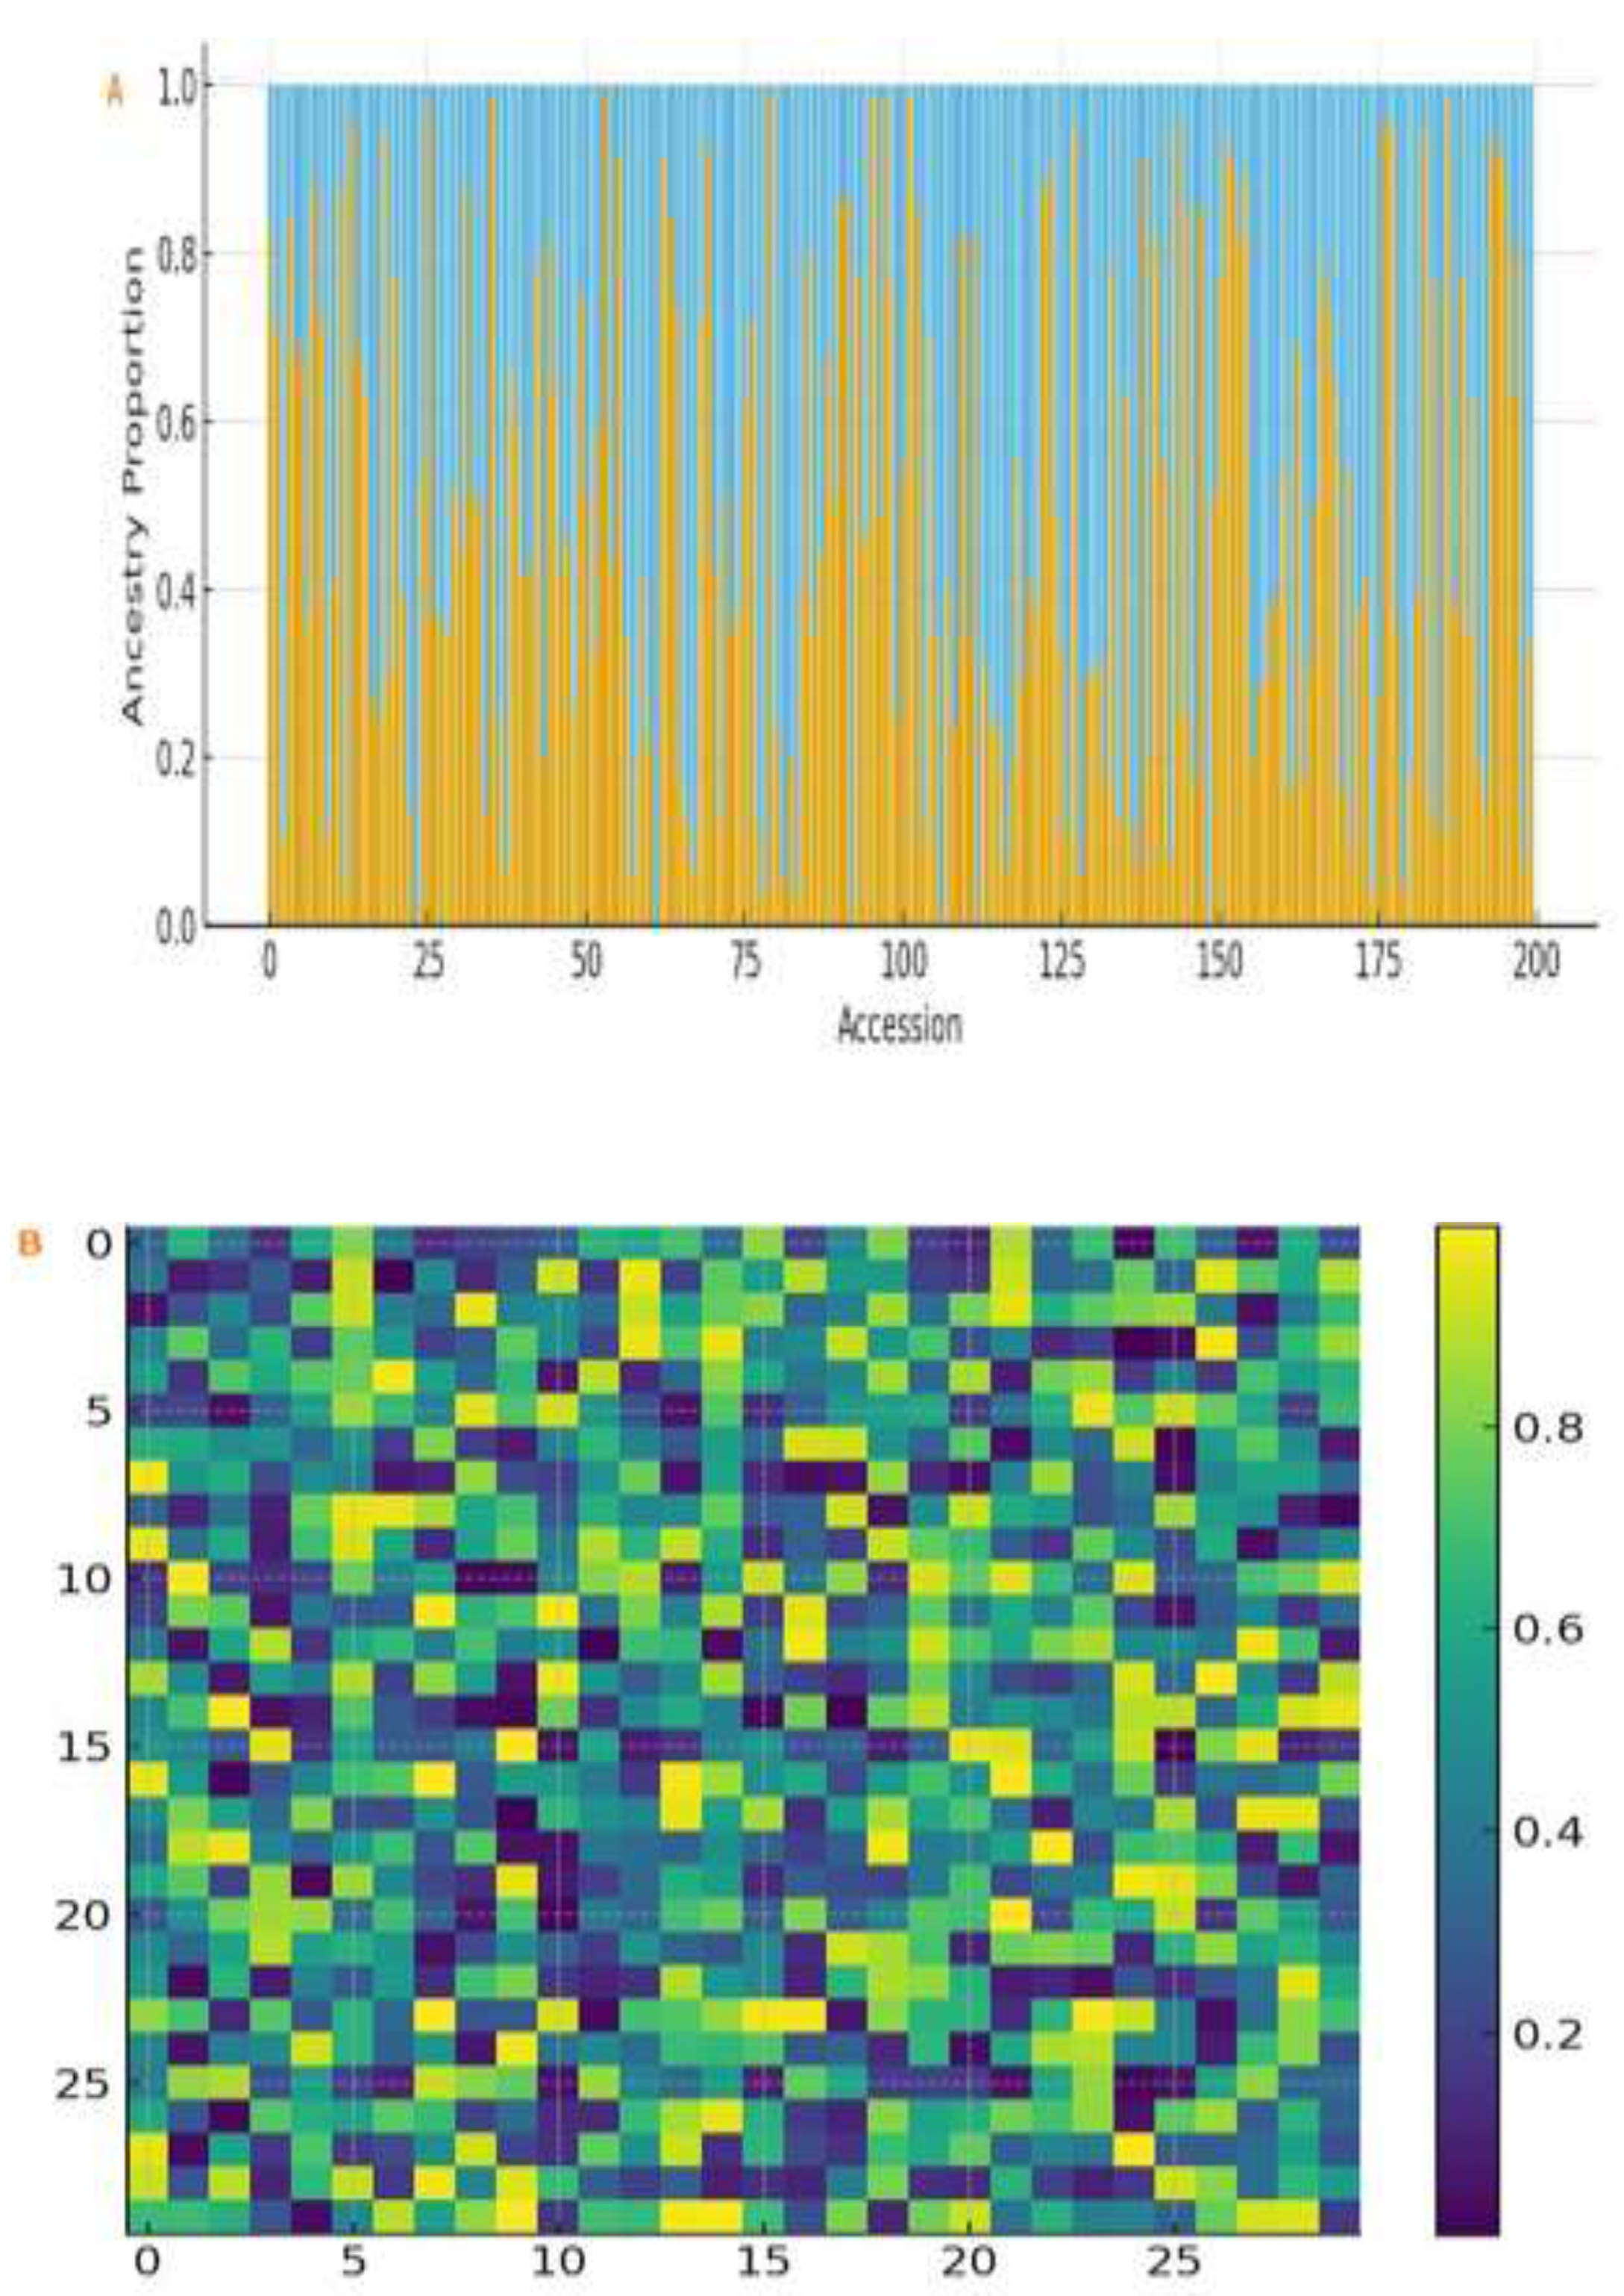
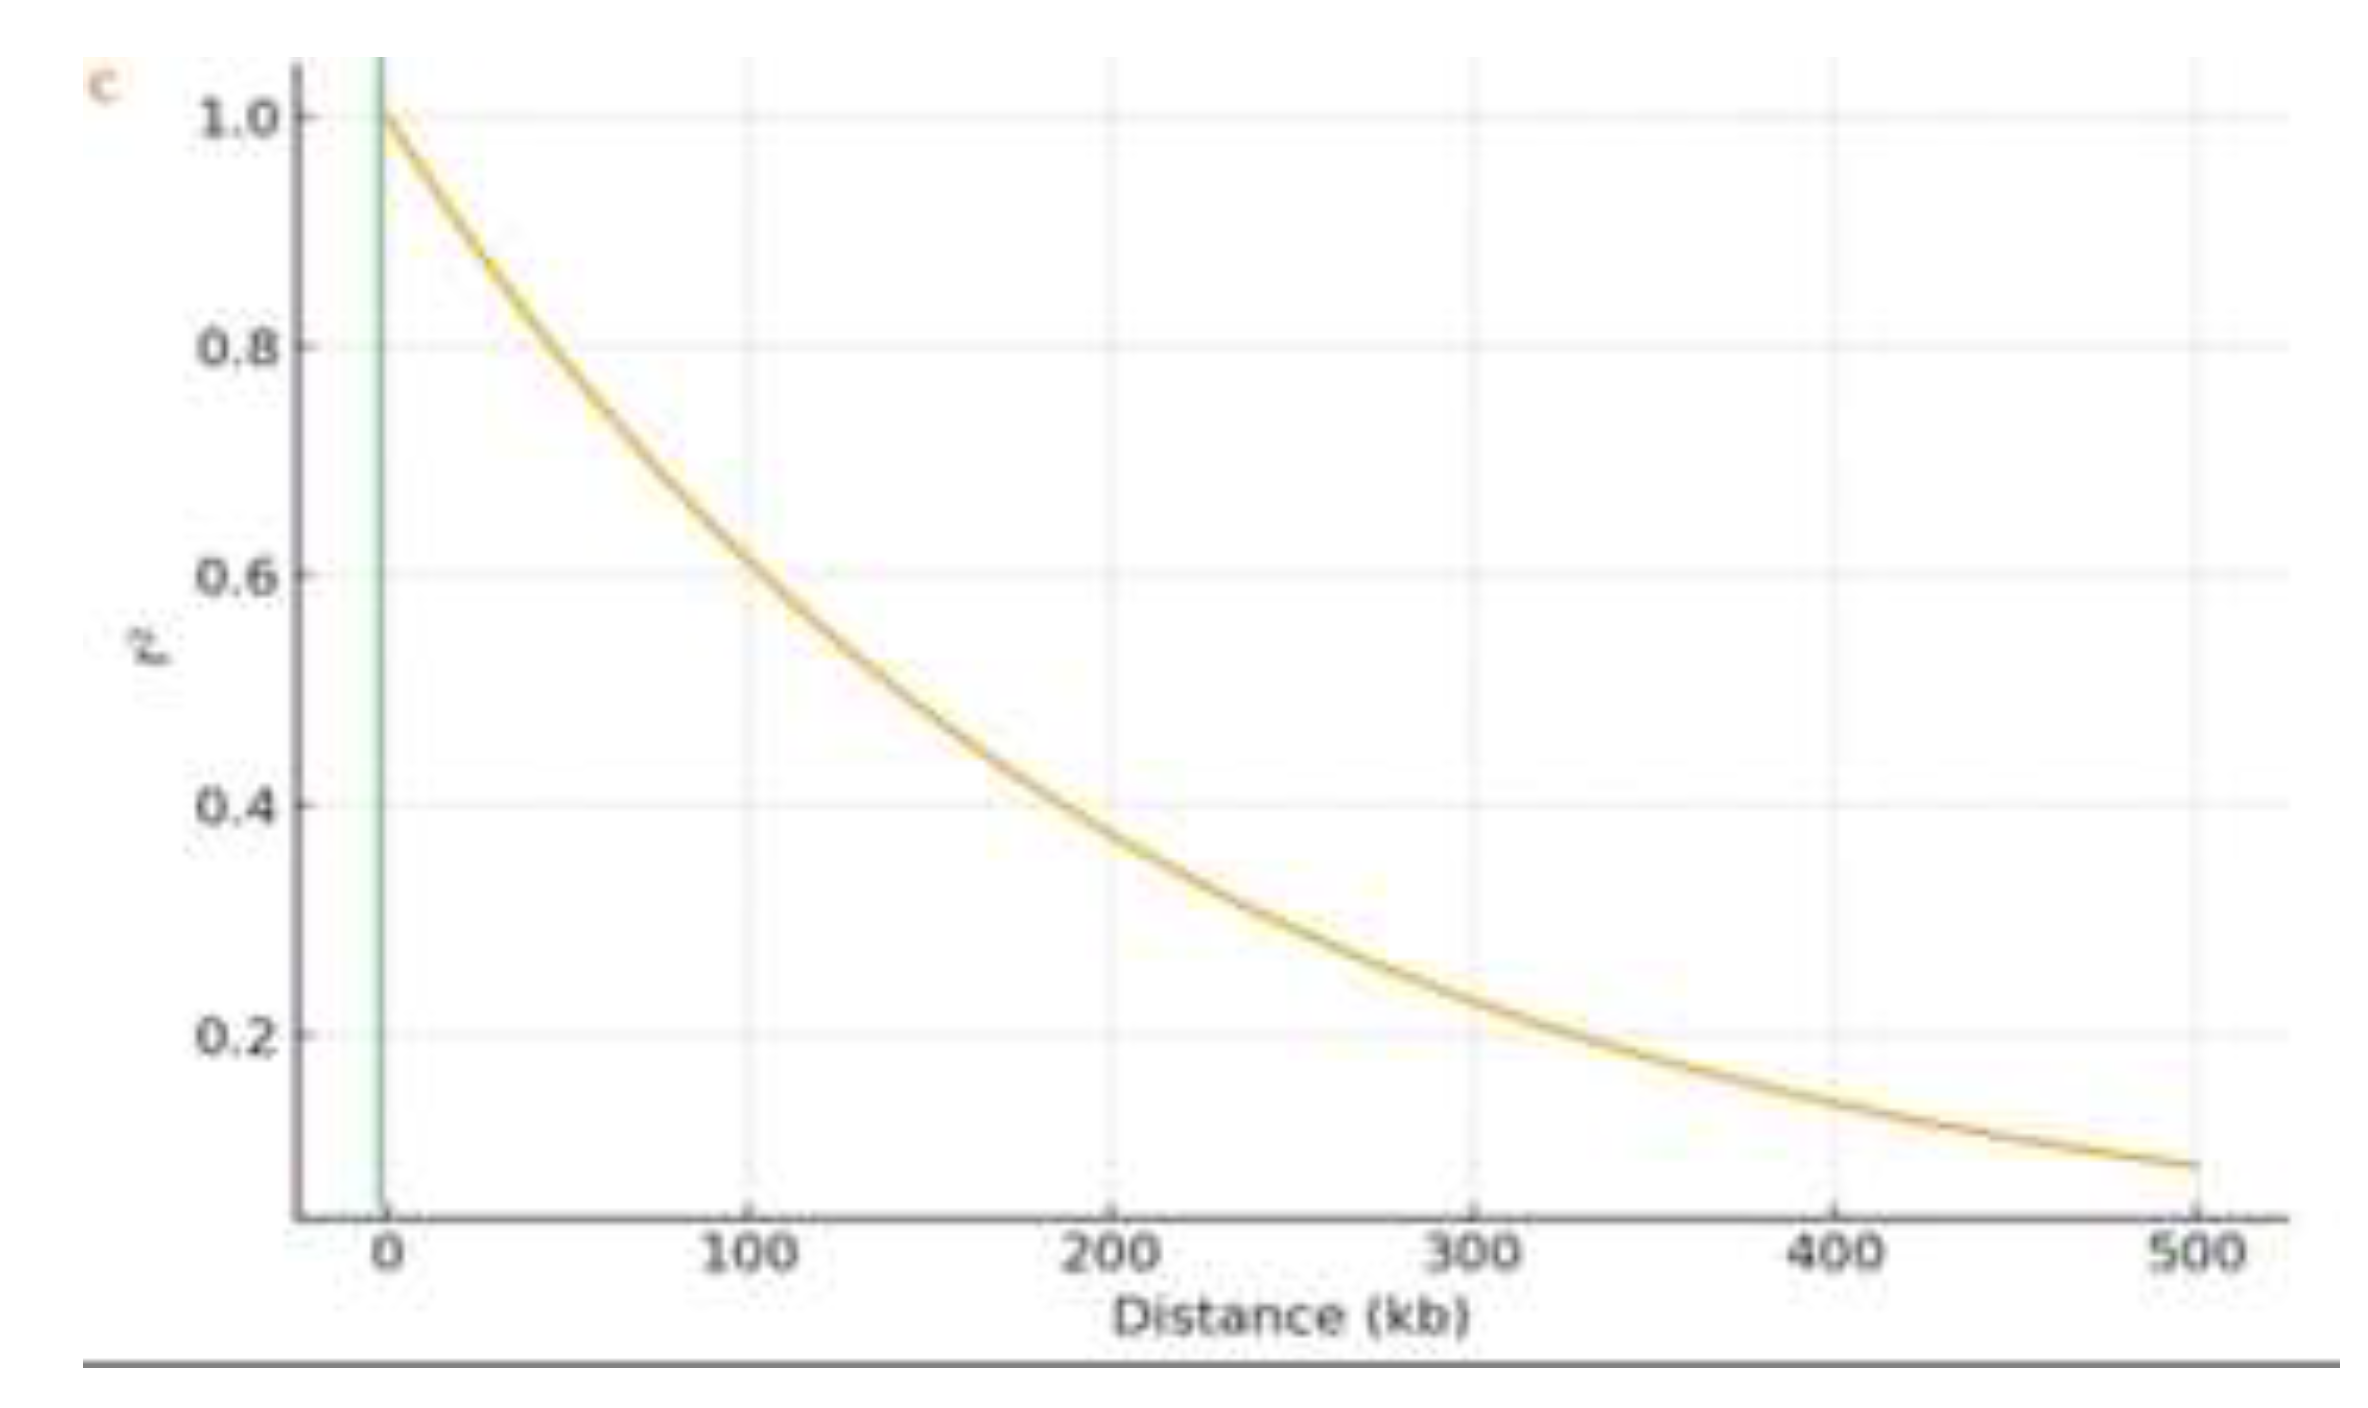
Figure 4.
Genome-wide association study (GWAS) results for plant height and seed coat color traits. (A) Manhattan plots showing association signals (−log₁₀(p)) for 3,683 SNPs across 13 chromosomes. The red horizontal line indicates the Bonferroni-corrected significance threshold (−log₁₀(p) = 3.4). Significant SNPs exceeding this threshold are seen as blue dots above the threshold line. (B) Quantile-quantile (Q–Q) plots comparing observed versus expected −log₁₀(p) values under the null hypothesis of no association. Deviation from the diagonal (orange line) at higher p-values indicates true associations. Points represent individual SNPs; the shaded area indicates the 95% confidence band.
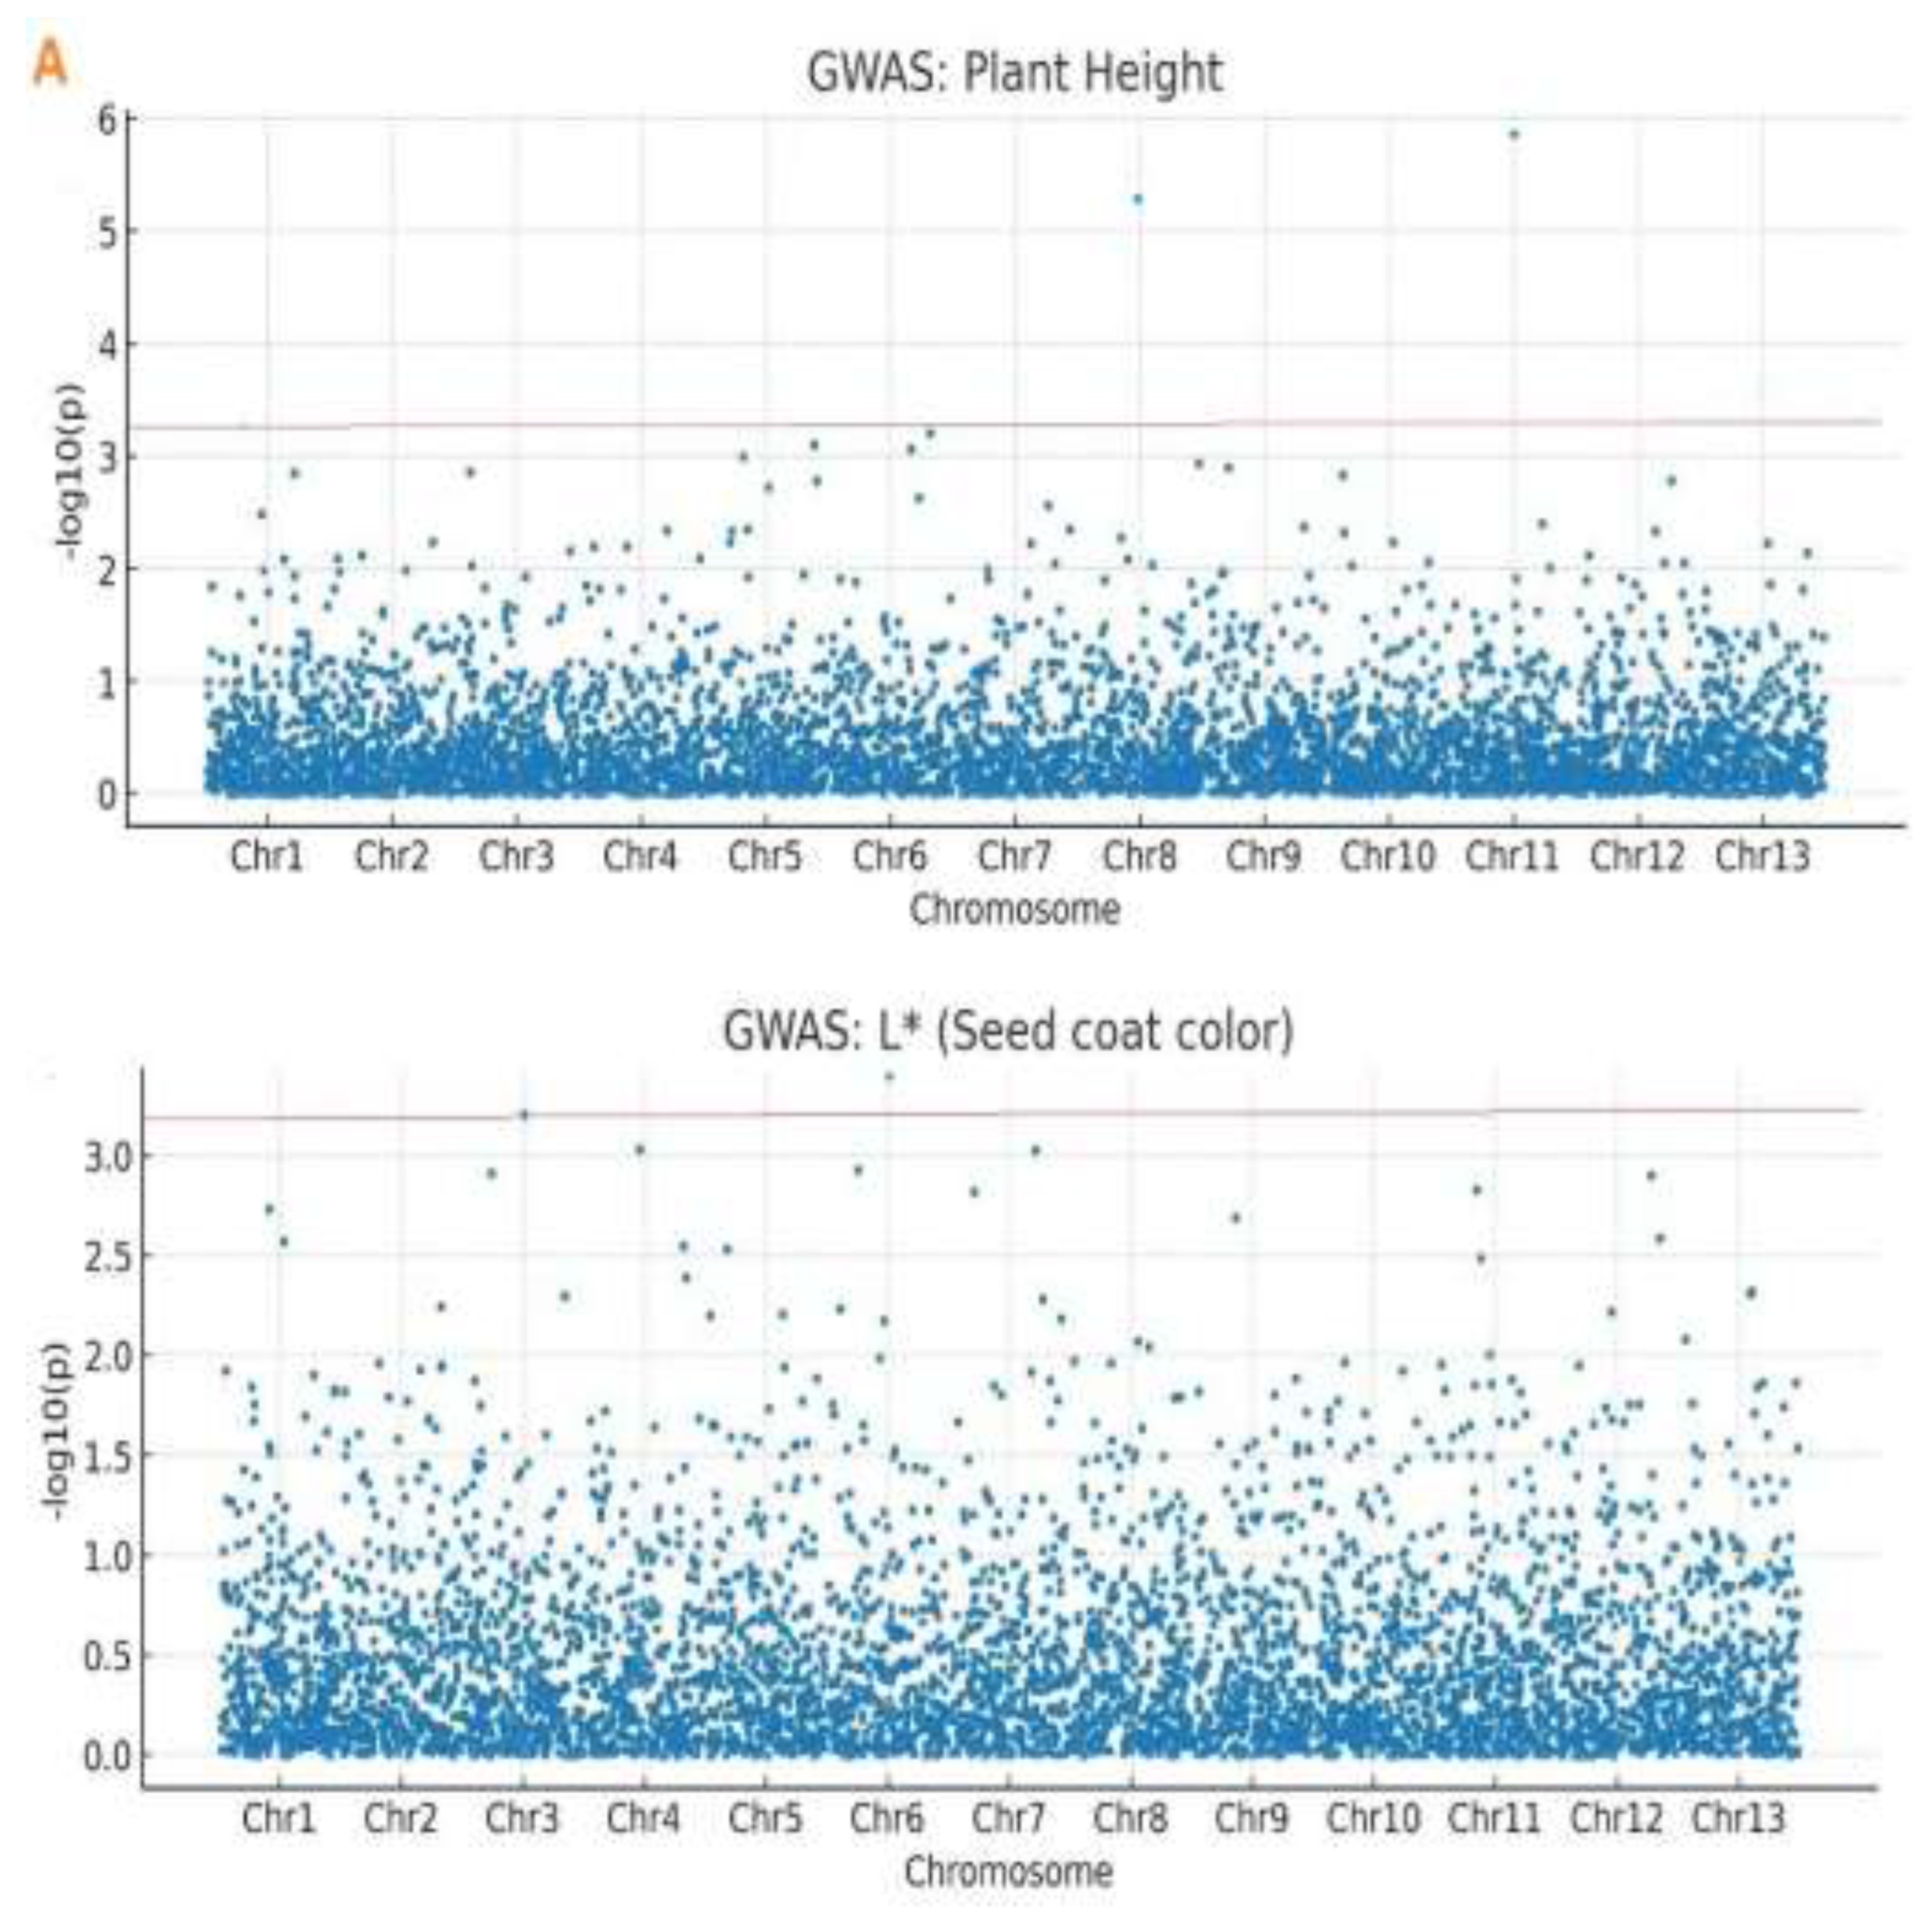
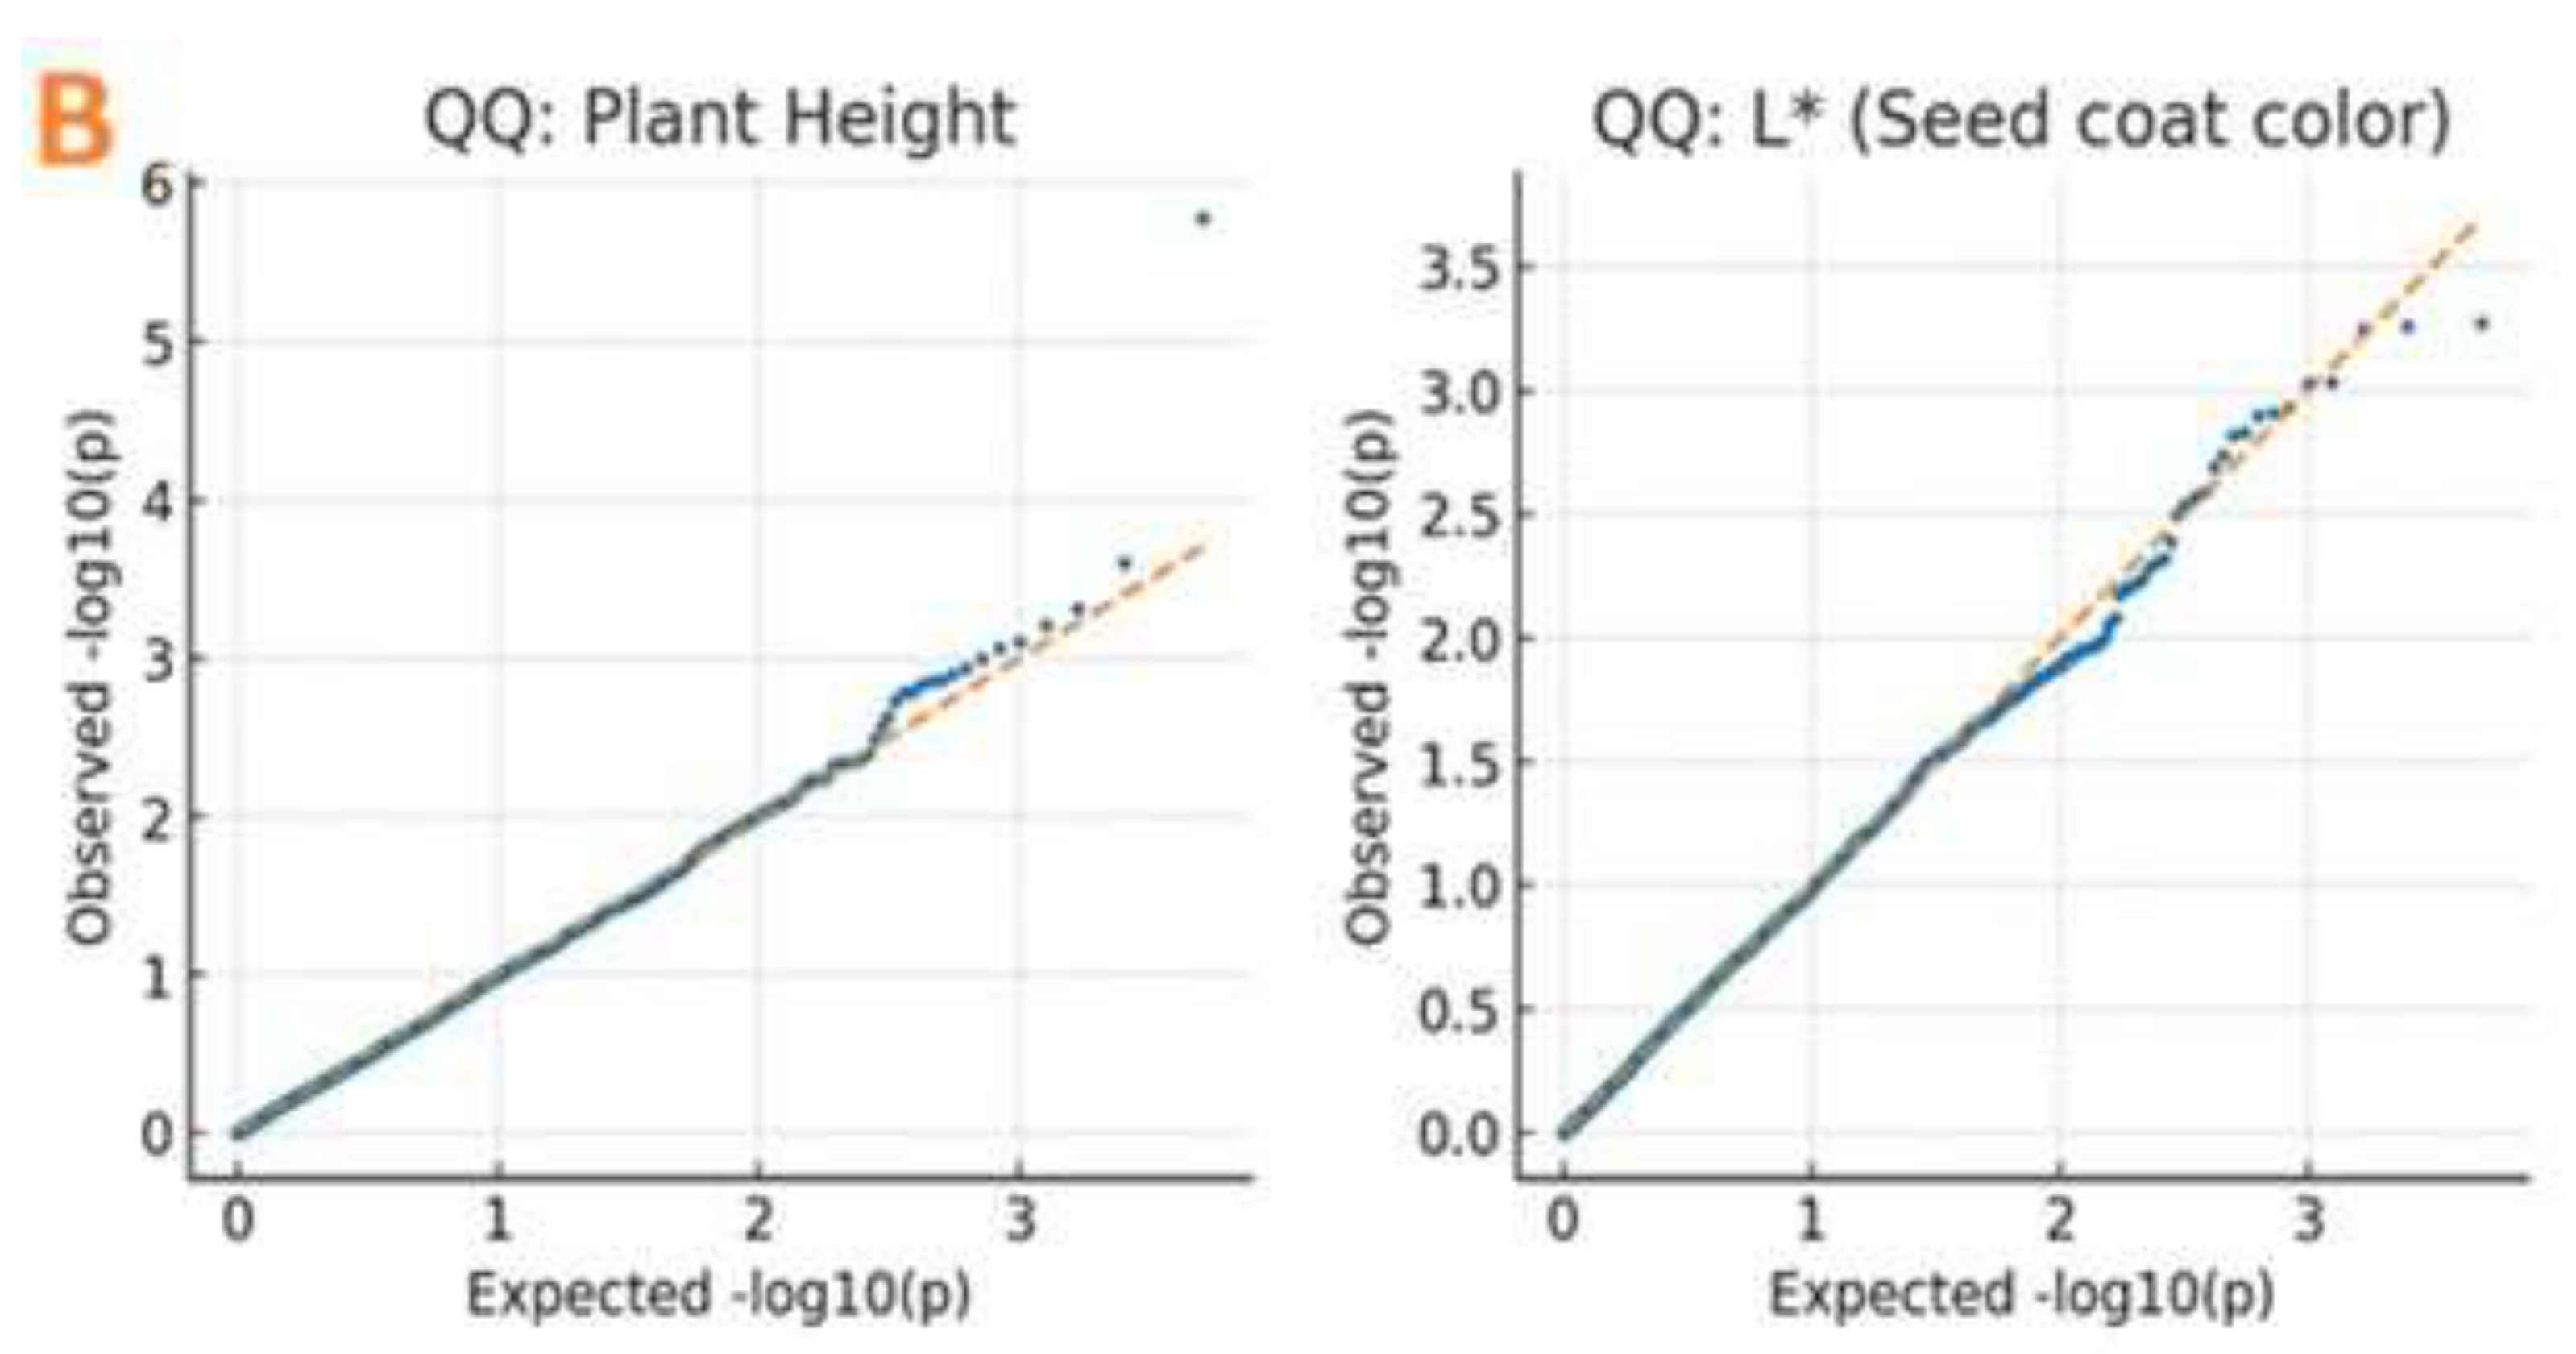
Figure 5.
Genomic positions and annotations of high-priority candidate genes identified through integrated meta-QTL and GWAS analysis. Candidate genes (labeled) are mapped to their physical coordinates (megabases, Mb) on sesame chromosomes 3, 6, 8, and 11. Significant GWAS SNPs (orange peaks) are shown relative to gene positions. Gene functions are coded: plant height candidates (CYP90B1, AP2/ERF), and seed coat color candidates (WRKY23, SBP-like).
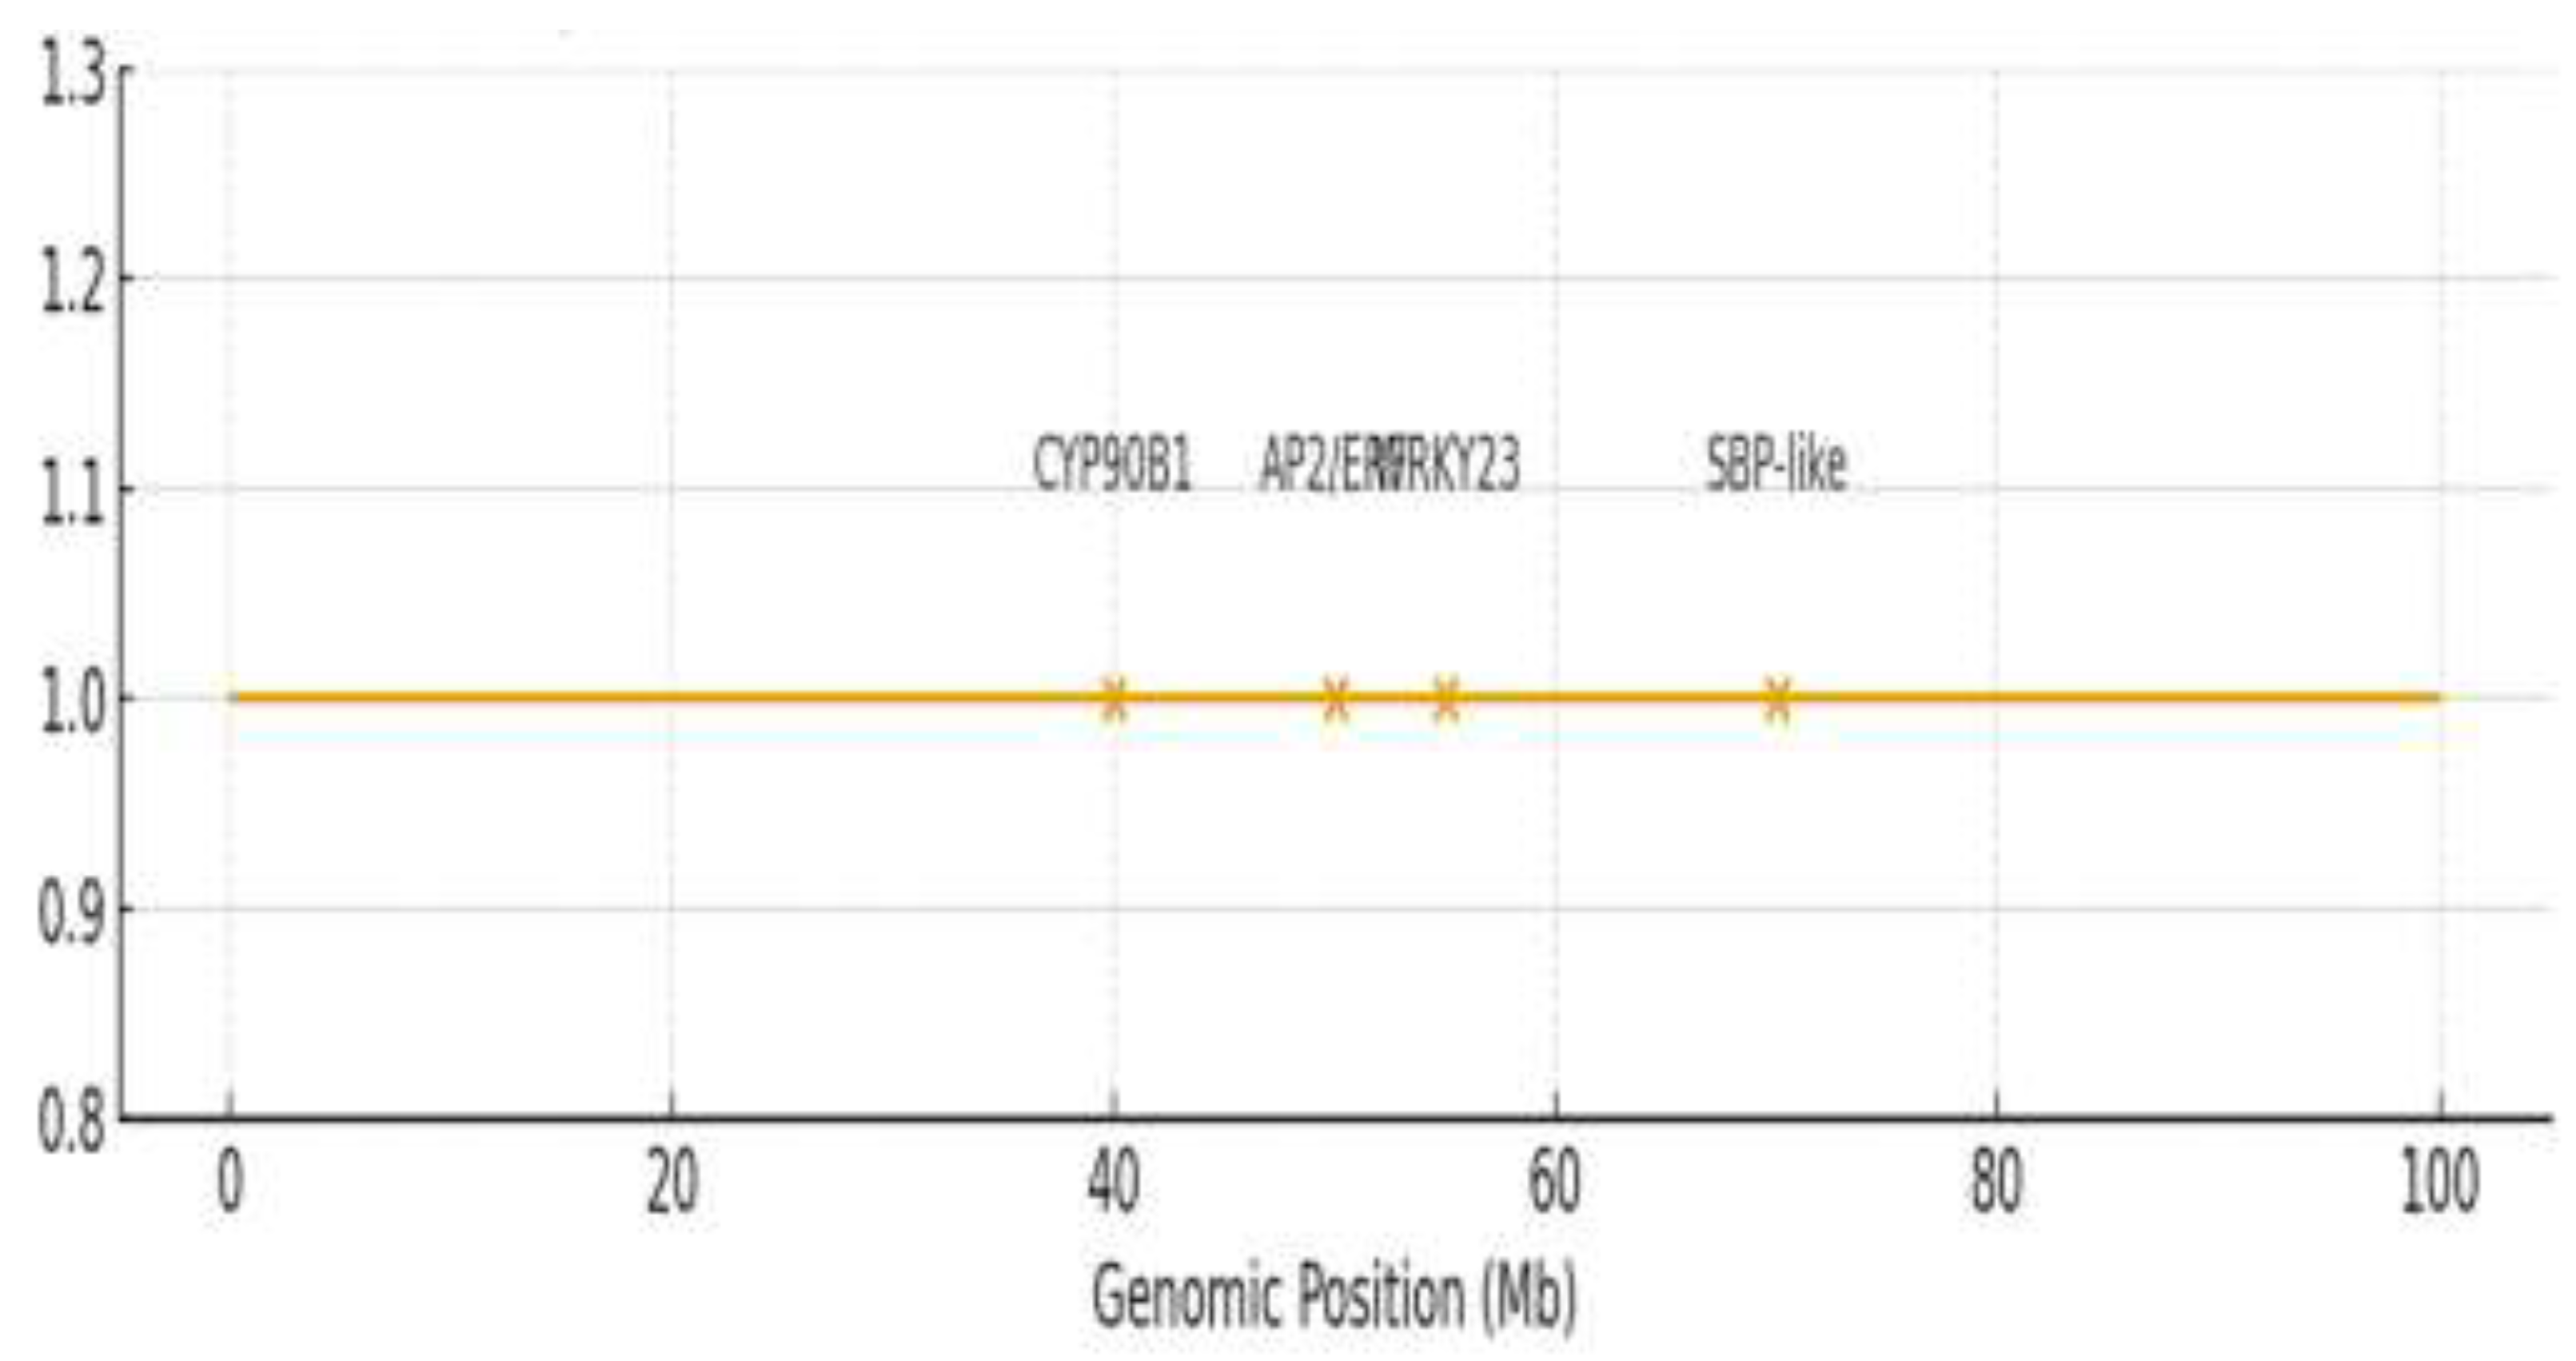

Table 1.
Summary of meta-QTL hotspots for plant height and seed coat color identified from the global analysis.
Table 1.
Summary of meta-QTL hotspots for plant height and seed coat color identified from the global analysis.
| Trait | Meta-QTL hotspot region | Peak position (Mb) | Closely linked markers | Number of QTL | PVE range (%) | Key candidate genes/ References |
|---|---|---|---|---|---|---|
| Plant Height | Chr03: ~25-35 cM | 28.4 | Sindi.03G185, Sindi.03G192 | 5 | 9.44 – 15.10 |
SICEN2 [46], SIACS9 [32] |
| Plant Height | Chr08: ~175-180 cM | 177.8 | Sindi.08G774, Sindi.I08G781 | 4 | 12.80 – 71.41 | qFCHLG08-2 [46], CYP90B1 (this study) |
| Plant Height | Chr11: ~185-190 cM | 187.2 | Sindi11G945, Sindi11G952 | 4 | 11.23 – 18.50 | qPLLG11-1 [46], AP2/ERF (this study) |
| Seed Coat Color | Chr04: ~45-55 cM | 48.6 | Sindi04G332, Sindi04G339 | 6 | 5.62 – 23.10 | qSC6-4-1 [29], DIR gene family [21] |
| Seed Coat Color | Chr06: ~0.7-0.85 cM | 1.21 | Sindi06G058, Sindi06G065 | 5 | 8.50 – 25.50 | qBSCchr6 [43], PPO [44], WRKY (this study) |
| Seed Coat Color | Chr09: ~88-92 cM | 90.1 | Sindi09G441, Sindi09G448 | 4 | 10.15 – 32.88 | qSC6-9 [26], MYB/bHLH [21,22] |
QTL: quantitative trait loci, PVE: phenotypic variance explained Note: The high PVE (71.41%) for PH on chromosome 8 originated from a biparental population and likely represents a major-effect locus under controlled conditions [23].
Table 2.
Selected significant single-nucleotide polymorphisms (SNPs) associated with plant height and seed coat color traits as identified by a genome-wide association study (GWAS), indicating their chromosome (Chr.), significance (p-value, -log₁₀(p)), phenotypic variation explained (PVE) and allelic effect.
| Trait | SNP marker | Chr. | Position (bp) | p-value | -log₁₀(p) | PVE (%) | Allelic effect |
|---|---|---|---|---|---|---|---|
| Plant Height | Chr11_1877114 | 11 | 1,877,114 | 1.24 × 10⁻⁶ | 5.91 | 14.20 | -8.45 |
| Plant Height | Chr08_1771424 | 8 | 1,771,424 | 3.89 × 10⁻⁶ | 5.41 | 12.80 | 7.21 |
| L* | Chr12_16523829 | 12 | 16,523,829 | 2.17 × 10⁻³ | 2.66 | 6.32 | -3.95 |
| a* | Chr06_27694080 | 6 | 27,694,080 | 7.84 × 10⁻⁷ | 6.11 | 8.95 | -1.72 |
| a* | Chr03_15960455 | 3 | 15,960,455 | 4.25 × 10⁻⁴ | 3.37 | 7.05 | 1.42 |
| b* | Chr13_345249 | 13 | 345,249 | 1.48 × 10⁻³ | 2.83 | 6.08 | -4.71 |
Table 3.
High-priority candidate genes associated with significant single-nucleotide polymorphisms (SNPs) for plant height and seed coat color.
Table 3.
High-priority candidate genes associated with significant single-nucleotide polymorphisms (SNPs) for plant height and seed coat color.
| Trait | SNP marker | Candidate gene |
Distance to SNP (kb) | Putative function | Sequence identity (%) |
|---|---|---|---|---|---|
| Plant Height | Chr11_1877114 | Sindi.11G025000 | 12.4 | AP2/ERF domain-containing protein | 95.2 |
| Plant Height | Chr08_1771424 | Sindi.08G015600 | 8.7 | Cytochrome P450 CYP90B1 (Brassinosteroid biosynthesis) | 88.7 |
| a* | Chr06_27694080 | Sindi.06G123400 | 15.2 | WRKY transcription factor 23 | 94.3 |
| L* | Chr12_16523829 | Sindi.12G045200 | 22.8 | Squamosa promoter-binding protein 1 | 97.8 |
| a* | Chr03_15984975 | Sindi.03G078100 | 18.5 | DOF zinc finger protein DOF3.1 | 82.1 |
| a* | Chr03_26242291 | Sindi.03G090200 | 31.7 | Serine/threonine-protein kinase STY8 | 98.5 |
| b* | Chr09_22387055 | Sindi.09G078500 | 26.3 | Salicylic acid-binding protein 2 | 96.7 |
Table 4.
Synthesis of major QTL hotspots for sesame seed coat color from previous research.
| Chr. | Key QTL region | PVE range (%) | Population | Key candidates | Reference |
|---|---|---|---|---|---|
| 4 | qSCa-4.1, qscca*4 (∼78-81 cM) | 8.56–23.10 | RIL, F₃ | DIR gene family | [26,29] |
| 6 | qBSCchr6 (∼2.1 cM) | Major QTL | RIL (BSA) | 13 candidate brown seed locus | [43] |
| 6 | Meta-QTL hotspot | 8.50–25.50 | Meta-analysis | PPO, WRKY TFs | This study (Table 1) |
| 9 | qsccY9, qsccZ9 (∼90-104 cM) | 32.88–33.25 | F₃ | MYB, bHLH TFs | [26] |
| 9 | Meta-QTL hotspot | 10.15–32.88 | Meta-analysis | MYB/bHLH complex | Table 1 |
| 12 | qsccZ12 | 5.58 | F₃ | – | [26] |
| 12, 13 | Novel GWAS associations | 6.22–6.51 | Ethiopian panel | SBP-like, Kinase STY8 | Table 1 |
Disclaimer/Publisher’s Note: The statements, opinions and data contained in all publications are solely those of the individual author(s) and contributor(s) and not of MDPI and/or the editor(s). MDPI and/or the editor(s) disclaim responsibility for any injury to people or property resulting from any ideas, methods, instructions or products referred to in the content. |
© 2026 by the authors. Licensee MDPI, Basel, Switzerland. This article is an open access article distributed under the terms and conditions of the Creative Commons Attribution (CC BY) license.
Copyright: This open access article is published under a Creative Commons CC BY 4.0 license, which permit the free download, distribution, and reuse, provided that the author and preprint are cited in any reuse.


