
Submitted:
05 January 2026
Posted:
06 January 2026
You are already at the latest version
Abstract
Background/Objectives: Soccer is a team sport that places significant physical demands on players. Players cover greater distances at higher speeds, and the number of high-intensity movements is increasing. The present study analyzed the locomotor and mechanical variables of Hungarian second division professional soccer players over three seasons (2022/23, 2023/24, 2024/25), using Catapult Vector S7 and processing data from 94 matches. Methods: We included 94 matches in the study (2022/23: N=38; 2023/24: N=29; 2024/25: N=27), in which only the data of players who played the entire matches were analyzed, excluding red card matches. Performance data was collected using Catapult Vector S7 10 Hz GNNS system. Results: The median average distance covered decreased continuously from the 2022/23 season (10.210 m) to the 2024/25 season (9.795 m) (H (2) = 14.14, p<0.001, Rank ε² = 0.152, medium effect size). The median Player Load decreased from 1002 (2022/23 and 2023/24) to 846 in the 2024/25 season (H (2) = 55.64, p<0.001, Rank ε² = 0589, very large effect size). The median acceleration-deceleration effort (Accel + Decel) decreased from 220.8 (2022/23) to 199.0 (2024/25) (H (2) = 26.81, p<0.001, Rank ε² = 0.288, effect size). Conclusion: There was a significant seasonal decrease in match load variables. The most pronounced decrease occurred in the mechanical indicator. These results may provide useful insights into the physical demands of matches.
Keywords:
Catapult Vector S7
; second division
; acceleration
; deceleration
; player load
1. Introduction
Performance optimization in modern soccer increasingly relies on advanced technologies such as GPS (Global Positioning System) systems, which enable accurate monitoring of players physical exertion Total Load, which presents the calculated global performance indicator based on accelerometer data, is a key tool in sports science for injury prevention, training periodization, and performance analysis [1]. GPS technology plays a key role in the performance analysis of team sports in measuring the physical demands on players, but the lack of standardization of speed zones limits comparisons between different sports, highlighting the need for future research in this area. This recognition could form the basis for the development of training programs, especially in soccer codes, where the most data is available [2]. A study showed that 10 Hz Catapult GPS devices are better at measuring the movement requirements of team sports than 1 Hz and 5 Hz devices. However, this result was not as clear for 15 Hz (GPSports) GPS devices, although these devices also proved to be suitable for measuring certain movement requirements [3]. 10 Hz GPS devices were more reliable in measuring instantaneous speed than 5 Hz devices, newer GPS devices may be acceptable for measuring constant speed, acceleration, and deceleration [4]. The Catapult Vector S7 system, as a high-frequency (10Hz) GNNS and inertial sensor analysis tool, has proven to be a reliable and valid tool for measuring total distance and improving athlete performance [5]. Acceleration and deceleration data can be correlated with increased muscle pain and decreased neuromuscular performance in athletes participating in team sports [6]. The Vector S7 was often used to analyze the load on young elite players, for example, the internal and external load on young elite soccer players was examined during Small-Side games, where the Player Load (PL) indicator showed a significant correlation with game intensity, highlighting the accuracy of the system in dynamic movements [7]. A study examining professional men’s field hockey matches that players’ Player Load per minute workload can be used to identify differences in peak mechanical demands between forward and midfielder [8]. Young soccer players’ workload and recovery indicators were monitored, where the total distance covered as measured by the Vector S7 and the distance covered at speeds above 20 km/h helped identify the cumulative effects of fatigue, suggesting the integration of web-based applications into everyday training management [9]. In a similar study, the perceived exertion of college male soccer players was compared to the Catapult Vector S7 PL variable, which showed that increasing PL values increase perceived exertion, suggesting that PL may be an objective complement to subjective measures [10]. PL is often used in soccer to monitor workload, as it incorporates accelerations, decelerations, collisions, and changes of direction, and increases in PL are associated with fatigue, muscle damage, and injury risk [11]. The physical parameters of elite Hungarian U17 soccer players were analyzed, emphasizing that GPS data can be used to optimize training loads, preventing under- and overtraining [12]. In another study, data showed that avoiding high weekly loads during microcycles would increase the distance covered by soccer players during matches, furthermore, appropriate distribution of weekly loads could optimize the subsequent performance of soccer players [13]. Another study compared the external load of English League 2 soccer players during training and matches in periods of high load, where, based on Vector S7 data, coaches gradually reduced the load of training sessions towards match day (tapering strategy), with MD-4 having the highest load, while MD-2 and MD-1 had the lowest load [14]. Another study analyzed non-contact injuries in elite soccer, where GPS and video-based data were combined to help identify risks during high-speed running, showing that, based on GPS data, injuries often occur during acceleration and deceleration [15]. The GPS variables of NCAA football players were examined, revealing a correlation between workload and player performance [16]. Global positioning system (GPS) are widely used to monitor training load, but costs and the wide variety of systems make longitudinal comparisons difficult [17]. An elite team was monitored with GPS throughout an entire season, during which there were minimal changes, suggesting that the training load pattern of elite teams is relatively consistent, without drastic fluctuations [18]. The training load of an elite soccer team was examined throughout an entire season, and it was found that there was minimal variation in the weekly microcycles during the preseason, but greater variations were observed during the season: players covered greater distances at the beginning of the competitive season, while heart rate response was highest in the middle of the season [19]. The distribution of training load affects the match results, for example, lighter load on MD-1 (shorter but more intense training) can lead to victory, while longer training can lead to draw or defeat [20]. In matches that won, the overall running performance is similar, but there is less running in the attacking phase and more in the defensive phase, which supports the idea that more successful play is based on maintaining possession and quick recovery. Furthermore, the study emphasizes that elite soccer is characterized not primarily by greater total running performance, but by efficiency in the defensive phase, which represents a strategic advantage [21]. In summary, we can see that in professional soccer, understanding match demands is key to optimizing performance, preventing injuries, and tailoring training programs. GPS technology has revolutionized this with objective data such as locomotor indicators (e.g., accelerations, decelerations). However, most research focuses on elite leagues, leaving gaps in lower divisions such as the Hungarian second division. Our study fills this gap by examining trends over three consecutive seasons (2022/23, 2023/24, 2024/25), using Catapult Vector S7, processing data from 94 matches. The aim of the research is to explore seasonal changes, contributing to sports science literature.
2. Results
When analyzing data, we examined the differences between three seasons (2022/23, 2023/24, and 2024/25) in terms of the following variables: Average Distance (m), Average Player Load, and total number of acceleration and deceleration (Accel + Decel). The descriptive statistics are summarized in (Table 1).
The median Average Distance (m) in the 2022/23 season is 10.210.00 m (mean = 10.200.00 m, SD = 353.30, IQR = 540.50), in the 2023/24 season it will be 10.010.00 m (mean = 10.002.00 m, SD = 400.70, IQR = 269.90), and 9795.00 m (mean = 9833.00 m, SD = 378.10, IQR = 533.50) in the 2024/25 season. The median Average Player Load indicator was 1002.00 in the 2022/23 season (mean = 1000.00, SD = 46.10, IQR = 60.02), in the 2023/24 season also 1002.00 (mean = 1002.00, SD = 480.01, IQR = 66.40), and 846.60 (mean = 842.20, SD = 47.25, IQR = 91.61) in the 2024/25 season. The median Accel + Decel Effort in the 2022/23 season was 220.80 (mean = 223.10, SD = 16.83, IQR = 22.81), in the 2023/24 season 201.60 (mean = 206.50, SD = 16.04, IQR = 21.53), and 196.00 (mean = 195.20, SD = 21.66, IQR = 25.50) in the 2024/25 season (Table 1).
Kruskal-Wallis H tests showed significant differences between seasons for all three variables (Table 2). For Average Distance (m), the test statistic H (2) was 14.14 (df = 2, p <0.001), and the rank-based effect sizes were Rank ε² = 0.152 (95% CI: 0.041–0.351). For the Average Player Load, the test statistic H (2) was 55.64 (df = 2, p <0.001), Rank ε² = 0.598 (95% CI: 0.570–0.641). For Accel + Decel Efforts, the test statistic H (2) was 26.81 (df = 2, p <0.001), Rank ε² = 0.288 (95% CI: 0.141–0.503).
Dunn's post hoc comparisons revealed further details about the differences between pairs. There was a significant difference in Average Distance (m) between the 2022/23 and 2024/25 seasons (Z = 3.747, p <0.001, r = –0.528), while the other comparisons were not significant (2022/23 vs. 2023/24: Z = 1.296, p = 0.585, r = –0.203; 2023/24 vs. 2024/25: Z = 2.332, p = 0.059, r = –0.387) (Figure 1). A significant decrease in the Average Player Load indicator was observed between the 2022/23 and 2024/25 (Z = 6.702, p < 0.001, r = –0.984) and between the 2023/24 and 2024/25 seasons (Z = 6.422, p < 0.001, r = –0.990), but not between 2022/23 and 2023/24 (Z = –0.124, p = 1.000, r = 0.023) (Figure 1). There were significant differences in Accel + Decel efforts between 2022/23 and 2023/24 (Z = 3.320, p < 0.01, r = –0.510) and between the 2022/23 and 2024/25 seasons (Z = 5.006, p < 0.001, r = –0.694), while there were no significant differences between 2023/24 and 2024/25 (Z = 1.651, p = 0.296, r = –0.305) (Figure 1).
3. Discussion
Based on the results, a clear downward trend can be observed in the physical performance indicators of soccer players during the three seasons examined. We found a moderate difference in the Average Distance, with a wide CI, indicating uncertainty in the exact size. The Average Player Load indicator shows a strong difference and a narrow CI, indicating a stable effect size, and this indicator shows the greatest seasonal change. There is a large effect on the number of Accel + Decel Efforts, but a wide CI, indicating greater variability in the effect estimate. All variables showed a significant decline, especially compared to the 2022/23 season. This trend is consistent with the phenomenon of cumulative fatigue observed in the team sports, where the output performance of players decreases as a result of consecutive matches and training sessions [22]. The largest decline in the Average Player Load indicator was observed for the 2024/25 season. The medium-to-large effect sizes of the Kruskal-Wallis tests (e.g., Rank ε² = 0.598 for the Average Player Load performance indicator) confirm that these differences are not only statistically significant but also have practical significance. Dunn’s post hoc analyses show that between the 2022/23 and 2023/24 seasons, there was a significant decrease primarily in Accel + Decel Efforts (Z = 3.320, p ≤ 0.001), while comparisons covering the 2024/25 season showed a strong negative correlation in all three indicators (r = -0.528 to – 0.990). These results suggest that the physical load on players decreased during the most recent season. Similar seasonal variations have been observed in other studies of soccer players’ loads. For example, a study of professional male soccer players examined seasonal changes in internal and external workload indicators and found that workload intensity may depend on the cycles of the season, including preparation, competition, and recovery periods [23]. A multi-season study also observed that load periodization affects neuromuscular readiness in elite soccer players, supporting the idea that reduced load is not necessarily negative, but can be an adaptive response to load management [24]. Furthermore, this is similar to what is described in sport science literature, where player load indicators often show seasonal fluctuations based on positions and match types [25]. These findings have practical implications for coaches, as monitoring match load can help optimize training load, reducing the risk of injury while maintaining performance.
4. Materials and Methods
4.1 Participants
Ninety-four matches were included in the analysis (2022/23: N = 38; 2023/24: N = 29; 2024/25: N = 27), involving professional soccer players who completed the full duration of each match. Matches involving red cards were excluded to ensure consistency in playing time and avoid bias from reduced player numbers. Only data from players who participated in the entire match were analyzed. In the study, we only compared the averages of the matches to avoid overlapping between players across seasons. Participants were N= 33 male professional soccer players (mean age: [24.68] ± 4.17 years; mean height: [183.21] ± 7.19 cm; mean body mass: [78.99] ± 8.12 kg). All procedures were approved by the [Institutional Ethics Committee name and approval number], and the study was conducted in accordance with the Declaration of Helsinki. Informed consent was obtained from all participants prior to data collection.
4.2 Procedures and Data Collection
Performance data were collected using the Catapult Vector S7 global navigation satellite system (GNSS) device (Catapult Sports, Melbourne, Australia), operating at a sampling rate of 10 Hz. Devices were worn in a custom vest positioned between the scapulae during official matches. The key performance variables analyzed were: Average Distance (m): Total distance traveled per player, averaged across matches. Average Player Load™: A proprietary metric from Catapult representing the cumulative load from accelerations in three planes (anterior-posterior, medial-lateral, and vertical), calculated as the square root of the sum of squared instantaneous rates of change in acceleration divided by 100 [26]. Total Average Accel + Decel Efforts: The summed number of events exceeding >2 m/s² in magnitude for both accelerations and decelerations. Data was downloaded and processed using the manufacturer’s software (OpenField, Catapult Sports) immediately post-match to ensure data integrity.
4.3 Statistical Analysis
Data normality was assessed using the Shapiro-Wilk test, which indicated non-normal distribution for all variables (p < 0.05). Homogeneity of variances was evaluated with Levene’s test, and assumptions were met (p > 0.05). Due to the non-normal distribution, non-parametric Kruskal-Wallis H tests were employed to compare performance variables across seasons. Post-hoc pairwise comparisons were conducted using Dunn’s test with Bonferroni correction for post-hoc comparisons. Effect sizes were calculated as rank epsilon squared (ε²) for the Kruskal-Wallis H test and rank-biserial correlation (r) based on individual Mann-Whitney U tests. The effect sizes were interpreted based on Cohen’s guidelines, adapted for non-parametric tests: for ε² (similar to η²), small (0.01–0.059), medium (0.06–0.139), and large (≥0.14); for rank-biserial r, small (|0.10|–|0.29|), medium (|0.30|–|0.49|), and large (≥|0.50|). Statistical significance was set at p < 0.05. All analyses were performed using JASP software JASP Team (2025). JASP (Version 0.95.3) [Computer software].
5. Conclusions
In summary, the study showed that there was a significant seasonal decrease in match load variables. The most significant decrease was in the Average Player Load indicator, suggesting that seasonal changes can affect the physical load on players, which is important for performance optimization, injury prevention, and effectiveness. GPS-based monitoring, such as Catapult Vector S7, has proven to be a valuable tool for tracking workload. Future research should investigate the reasons for the decrease (e.g., technical, tactical data, playing style) and the long-term effects on performance to better support sports science practice.
6. Limitation
The study has several limitations, as the sample is relatively small and we only examined 94 matches, which, although representative of the Hungarian second division, does not reflect the higher divisions or international level. Furthermore, we did not control other variables like weather, pitch conditions, opponent strength, or individual player factors (e.g., age, position, injury history) that may influence Average Player Load. The data for the 2024/25 season is incomplete, which may distort the results. Finally, the statistical analysis was non-parametric, which is robust but does not provide information on the magnitude of changes in absolute terms, so it would be worthwhile to use longitudinal models on a larger sample in future studies.
Author Contributions
For research articles with several authors, a short paragraph specifying their individual contributions must be provided. The following statements should be used “Conceptualization, B.R. and R.B.I.; methodology, B.R.; software, K.B.; validation, A.Z., I.F. and B.I.; formal analysis, P.Á.; investigation, B.I.; resources, B.R.; data curation, A.Z.; writing—original draft preparation, B.R.; writing—review and editing, I.F.; visualization, A.Z.; supervision, S.L.; project administration, I.F.; funding acquisition, A.Z. All authors have read and agreed to the published version of the manuscript.
Funding
This research received no external funding.
Institutional Review Board Statement
Data collection was conducted in full compliance with the ethical principles of the Declaration of Helsinki. Participants and their legal guardians were fully informed about the study and gave their written consent to participate. The study was conducted on a voluntary basis in cooperation with the sports clubs and national rowing associations involved. The study was conducted in accordance with the guidelines and regulations of the Scientific and Research Ethics Committee of Széchenyi Istvan (protocol code SZE/ETT-94/2022 (XII.5.), approval date 5 December 2022) and the Declaration of Helsinki.
Informed Consent Statement
Informed consent was obtained from all subjects involved in the study.
Data Availability Statement
The original contributions presented in this study are included in the article. Further inquiries can be directed at the corresponding author.
Acknowledgments
Authors thank all participants.
Conflicts of Interest
The authors declare no conflicts of interest.
References
- Bowen, L.; Gross, A.S.; Gimpel, M.; Li, F.-X. Accumulated Workloads and the Acute:Chronic Workload Ratio Relate to Injury Risk in Elite Youth Football Players. Br J Sports Med 2017, 51, 452–459. [Google Scholar] [CrossRef]
- Cummins, C.; Orr, R.; O’Connor, H.; West, C. Global Positioning Systems (GPS) and Microtechnology Sensors in Team Sports: A Systematic Review. Sports Med 2013, 43, 1025–1042. [Google Scholar] [CrossRef] [PubMed]
- Johnston, R.J.; Watsford, M.L.; Kelly, S.J.; Pine, M.J.; Spurrs, R.W. Validity and Interunit Reliability of 10 Hz and 15 Hz GPS Units for Assessing Athlete Movement Demands. Journal of Strength and Conditioning Research 2014, 28, 1649–1655. [Google Scholar] [CrossRef] [PubMed]
- arley, M.C.; Fairweather, I.H.; Aughey, R.J. Validity and Reliability of GPS for Measuring Instantaneous Velocity during Acceleration, Deceleration, and Constant Motion. Journal of Sports Sciences 2012, 30, 121–127. [Google Scholar] [CrossRef]
- Ocak, M.F.; Şentürk, D.; Akyildiz, Z. Validity and Reliability of Catapult Vector S7 GNSS Units in Distance Measurement. BMC Sports Sci Med Rehabil 2025, 17, 296. [Google Scholar] [CrossRef] [PubMed]
- Ellens, S.; Carey, D.L.; Gastin, P.B.; Varley, M.C. Accuracy of GNSS-Derived Acceleration Data for Dynamic Team Sport Movements: A Comparative Study of Smoothing Techniques. Applied Sciences 2024, 14, 10573. [Google Scholar] [CrossRef]
- Rabano-Muñoz, A.; Suarez-Arrones, L.; Requena, B.; Asian-Clemente, J.A. Internal and External Loads of Young Elite Soccer Players during Defensive Small-Sided Games. Journal of Human Kinetics 2023, 87, 179–188. [Google Scholar] [CrossRef]
- Lin, L.; Ji, X.; Zhang, L.; Weng, H.; Wang, X. Peak Running, Mechanical, and Physiological Demands of Professional Men’s Field Hockey Matches. Journal of Human Kinetics 2023, 87, 133–141. [Google Scholar] [CrossRef]
- Anderegg, J.; Brefin, S.L.; Nigg, C.R.; Koschnick, D.; Paul, C.; Ketelhut, S. Load and Recovery Monitoring in Top-Level Youth Soccer Players: Exploring the Associations of a Web Application-Based Score With Recognized Load Measures. European Journal of Sport Science 2025, 25, e70031. [Google Scholar] [CrossRef]
- Li, Z.; Qin, S.; Li, X.; Ren, D. Use the Rating of Perceived Exertion to Evaluate Load in Collegiate Male Soccer Player, Validity and Influencing Factors. Sci Rep 2025, 15, 16880. [Google Scholar] [CrossRef]
- Oliva-Lozano, J.M.; Conte, D.; Fortes, V.; Muyor, J.M. Exploring the Use of Player Load in Elite Soccer Players. Sports Health: A Multidisciplinary Approach 2023, 15, 61–66. [Google Scholar] [CrossRef] [PubMed]
- Kádár, L.; Révész, L.; Sáfár, S.; Géczi, G.; Bognár, J.; Csáki, I. Elite U17 Football Players’ Physical Parameters: Focus on Contextual Variables during Training and Matches. International Journal of Performance Analysis in Sport 2025, 25, 753–767. [Google Scholar] [CrossRef]
- Ponce-Bordón, J.C.; Polo-Tejada, J.; Lobo-Triviño, D.; Sanabria-Pino, B.; Raya-González, J.; Muñoz, A.; García-Calvo, T. The Influence of Weekly Training Load on Match Physical Demands in Spanish Professional Soccer Players: A Full In-Season Study. Sensors 2025, 25, 2413. [Google Scholar] [CrossRef]
- Fleming, A.; Walker, M.; Armitage, M.; Connor, M.; Beato, M. A Comparison of Training and Match Play External Load During a Congested In-Season Period in English League 2 Football. Journal of Strength & Conditioning Research 2023, 37, e527–e534. [Google Scholar] [CrossRef]
- Aiello, F.; Di Claudio, C.; Fanchini, M.; Impellizzeri, F.M.; McCall, A.; Sharp, C.; Brown, S.J. Do Non-Contact Injuries Occur during High-Speed Running in Elite Football? Preliminary Results from a Novel GPS and Video-Based Method. Journal of Science and Medicine in Sport 2023, 26, 465–470. [Google Scholar] [CrossRef] [PubMed]
- Lecher, M.; Matsuo, H.; Morgan, G.; Stamatis, A. Sports Analytics in NCAA Division III Men’s Soccer: A Case of Practical Application of GPS Metrics. 2022. [Google Scholar]
- Oosthuizen, J.J.; Rampinini, E.; Bisschoff, C.A.; Cockeran, M.; Sparks, M. Interchangeability of Two Global Positioning System Devices for Measuring Player Movement in Rugby Union. Measurement in Physical Education and Exercise Science 2025, 1–14. [Google Scholar] [CrossRef]
- Oliveira, R.; Brito, J.P.; Martins, A.; Mendes, B.; Marinho, D.A.; Ferraz, R.; Marques, M.C. In-Season Internal and External Training Load Quantification of an Elite European Soccer Team. PLoS ONE 2019, 14, e0209393. [Google Scholar] [CrossRef]
- Malone, J.J.; Di Michele, R.; Morgans, R.; Burgess, D.; Morton, J.P.; Drust, B. Seasonal Training-Load Quantification in Elite English Premier League Soccer Players. International Journal of Sports Physiology and Performance 2015, 10, 489–497. [Google Scholar] [CrossRef]
- Oliveira, R.; Brito, J.P.; Loureiro, N.; Padinha, V.; Ferreira, B.; Mendes, B. Does the Distribution of the Weekly Training Load Account for the Match Results of Elite Professional Soccer Players? Physiology & Behavior 2020, 225, 113118. [Google Scholar] [CrossRef]
- Modric, T.; Versic, S.; Morgans, R.; Sekulic, D. Match Running Performance Characterizing the Most Elite Soccer Match-Play. bs 2023, 40, 949–958. [Google Scholar] [CrossRef] [PubMed]
- Thorpe, R.T.; Atkinson, G.; Drust, B.; Gregson, W. Monitoring Fatigue Status in Elite Team-Sport Athletes: Implications for Practice. International Journal of Sports Physiology and Performance 2017, 12, S2-27-S2-34. [Google Scholar] [CrossRef] [PubMed]
- Nobari, H.; Martins, A.D.; Oliveira, R.; Ardigò, L.P. Seasonal Variations of the Relationships between Measures of Training Monotony and Strain in Professional Soccer Players. Sci Rep 2022, 12, 10930. [Google Scholar] [CrossRef] [PubMed]
- Mandorino, M.; Tessitore, A.; Lacome, M. Loading or Unloading? This Is the Question! A Multi-Season Study in Professional Football Players. Sports 2024, 12, 148. [Google Scholar] [CrossRef]
- Maughan, P.C.; MacFarlane, N.G.; Swinton, P.A. The Influence of Season Phase on Multivariate Load Relationships in Professional Youth Soccer. Journal of Sports Sciences 2022, 40, 345–350. [Google Scholar] [CrossRef]
- Boyd, L.J.; Ball, K.; Aughey, R.J. The Reliability of MinimaxX Accelerometers for Measuring Physical Activity in Australian Football. International Journal of Sports Physiology and Performance 2011, 6, 311–321. [Google Scholar] [CrossRef]
Figure 1.
The raincloud plots illustrate seasonal trends in soccer player performance metrics across the 2022/23, 2023/24, and 2024/25 seasons. Data points represent individual match values, colored by season (green for 2022/23, orange for 2023/24, purple for 2024/25). Raincloud plots depict density distributions, box plots show medians and interquartile ranges, and shaded trend lines indicate overall patterns. Analyses were conducted using JASP software, with p-values derived from Dunn’s post hoc test, and the rank-biserial correlations (r) based on individual Mann-Whitney U tests. (a) Average distance covered per match (in meters), showing a moderate negative trend. (b) Average Player Load per match, exhibiting a strong negative trend. (c) Accel + Decel Effort per match, displaying a notable negative trend.
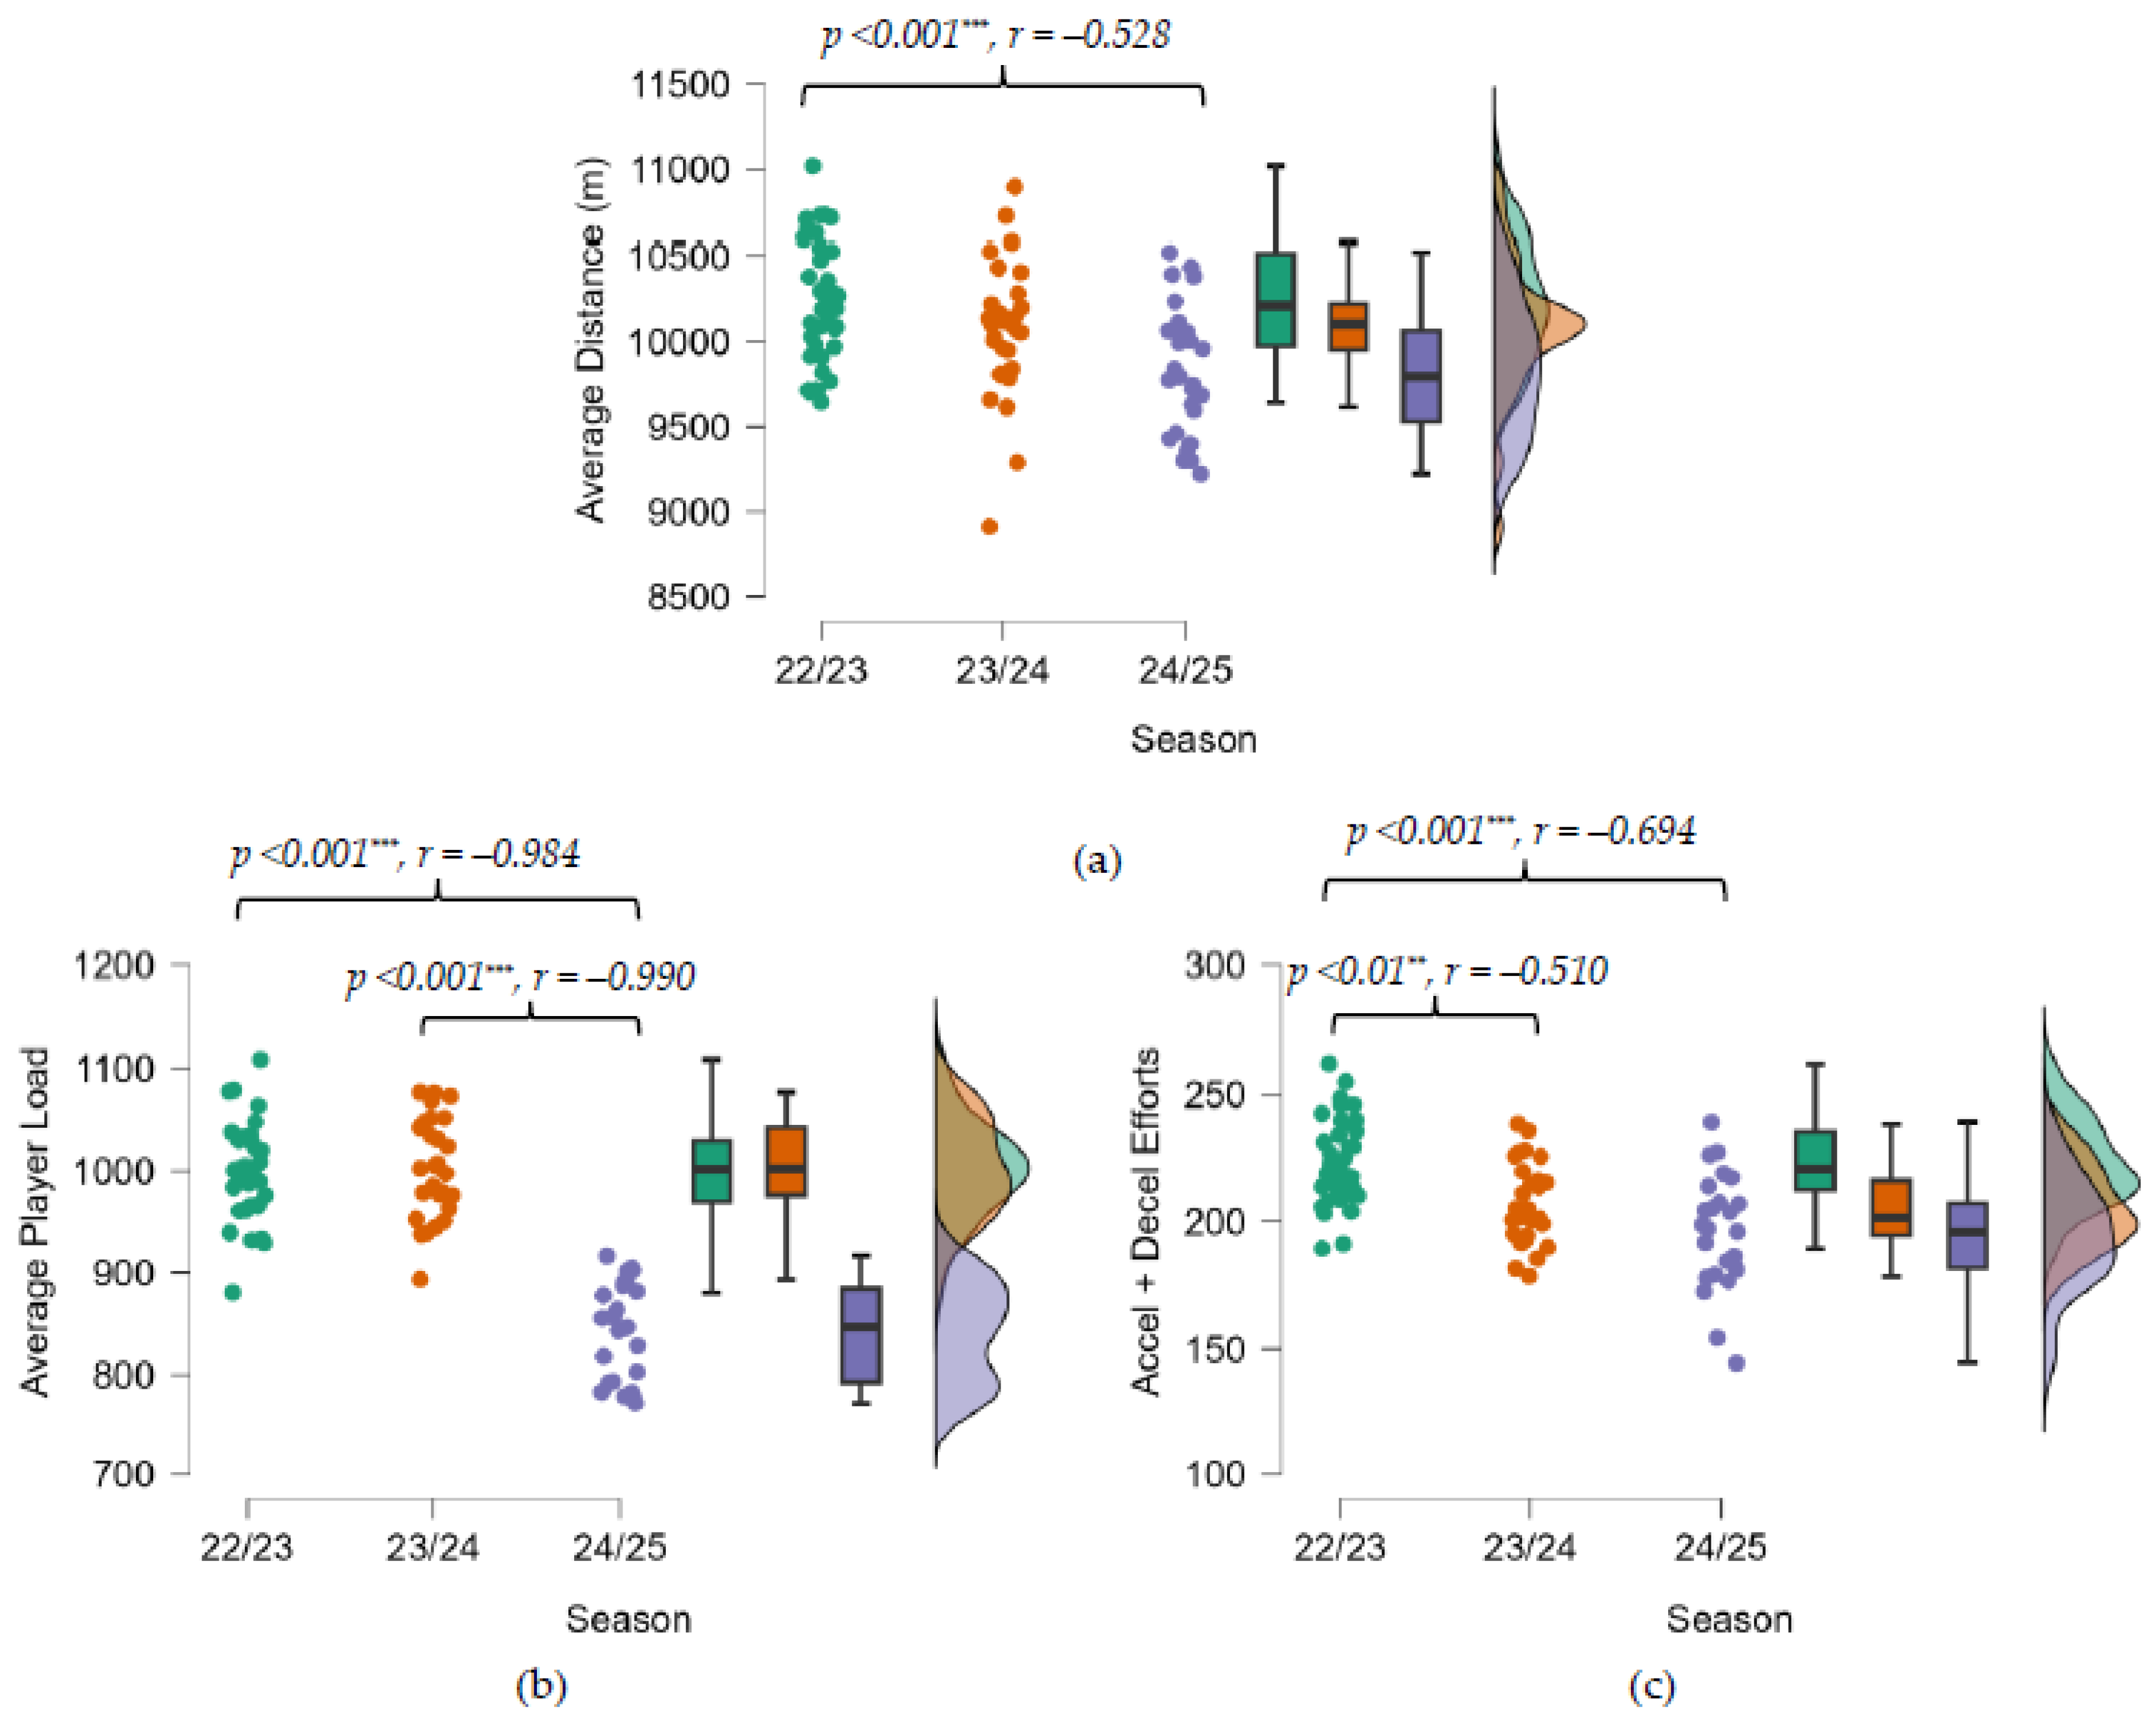

Table 1.
The descriptive statistics.
| Average Distance (m) | Average Player Load | Accel + Decel Efforts | |||||||
| 22/23 | 23/24 | 24/25 | 22/23 | 23/24 | 24/25 | 22/23 | 23/24 | 24/25 | |
| N | 38 | 29 | 27 | 38 | 29 | 27 | 38 | 29 | 27 |
| Median | 10210.00 | 10100.00 | 9795.00 | 1002.00 | 1002.00 | 846.60 | 220.80 | 201.60 | 196.00 |
| Mean | 10220.00 | 10070.00 | 9833.00 | 1000.00 | 1002.00 | 842.20 | 223.10 | 206.50 | 195.20 |
| Std. Deviation | 353.30 | 400.70 | 378.10 | 46.10 | 48.01 | 47.25 | 16.83 | 16.04 | 21.66 |
| IQR | 540.50 | 269.90 | 533.50 | 60.02 | 66.40 | 91.61 | 22.81 | 21.53 | 25.50 |
Table 2.
Kruskal-Wallis H test.
| Kruskal-Wallis H test | 95% CI for Rank ε² | ||||||||||||
| Variables | H Statistic | df | p value | Rank ε² | Lower | Upper | |||||||
| Average Distance (m) | 14.14 | 2 | <.001 | 0.152 | 0.041 | 0.351 | |||||||
| Average Player Load | 55.64 | 2 | <.001 | 0.598 | 0.570 | 0.641 | |||||||
| Accel + Decel (db) | 26.81 | 2 | <.001 | 0.288 | 0.141 | 0.503 | |||||||
p <0.001***, r = –0.528.
Disclaimer/Publisher’s Note: The statements, opinions and data contained in all publications are solely those of the individual author(s) and contributor(s) and not of MDPI and/or the editor(s). MDPI and/or the editor(s) disclaim responsibility for any injury to people or property resulting from any ideas, methods, instructions or products referred to in the content. |
© 2026 by the authors. Licensee MDPI, Basel, Switzerland. This article is an open access article distributed under the terms and conditions of the Creative Commons Attribution (CC BY) license (http://creativecommons.org/licenses/by/4.0/).
Copyright: This open access article is published under a Creative Commons CC BY 4.0 license, which permit the free download, distribution, and reuse, provided that the author and preprint are cited in any reuse.


