Introduction
The industrialization of scientific fraud has reached a critical inflection point. While academic misconduct was historically a decentralized, "boutique" issue, the rapid commoditization of generative Artificial Intelligence (AI) has triggered a phase shift in what researchers now categorize as “bibliometric pollution” [
1,
2]. The barrier to entry for paper mills—organizations that manufacture fraudulent manuscripts for profit—has collapsed, allowing for the mass production of synthetic science that mimics the linguistic structure of legitimate research [
3,
4].
This evolution in fraud is marked by a clear transition in technique. Early iterations relied on crude automated "spinning" software, identified by the telltale presence of “tortured phrases”—awkward synonyms like “counterfeit consciousness” instead of “artificial intelligence” [
3]. However, the emergence of advanced Large Language Models (LLMs) like ChatGPT has neutralized these primitive heuristics [
5,
6]. These models produce high-coherence text that frequently bypasses both traditional plagiarism detection and initial editorial screenings [
7]. Consequently, the scientific community has been forced into a reactive posture, struggling to develop forensic tools that can distinguish between human-led research and synthetic outputs at scale [
2,
7].
Crucially, the “threat landscape” of AI misconduct shifted from sporadic anomalies to a systemic crisis between 2024 and 2025. The withdrawal of over 11,000 articles from the Hindawi/Wiley catalog in 2024—following the discovery of industrialized peer-review manipulation—demonstrated that generative tools have enabled paper mills to penetrate the highest levels of scholarly indexing [
8,
9]. This resulted in the delisting of over 50 journals from the Web of Science and a permanent shift in how publishers like Wiley and Springer Nature manage Special Issues [
10]. Today, in early 2026, the focus has moved beyond simple linguistic detection toward identifying the automated, cluster-based patterns that define this new era of bibliometric pollution.
This study seeks to quantify the AI-driven retraction footprint using a more granular, fractional attribution framework. We leverage the Retraction Watch Database [
12] and cross-reference it with the OpenAlex open-metadata graph [
13]. Unlike proprietary indices which may have lag times or restricted access, the OpenAlex graph provides the transparency necessary for a rigorous, multi-institutional audit of scholarly metadata [
14]. By isolating retractions explicitly tagged as “Computer-Aided Content,” we test the hypothesis that generative AI is being strategically weaponized in jurisdictions facing the highest pressures for publication volume, revealing a distinct statistical morphology of modern fraud.
Methods
Mathematical Model and Variable Definitions
To objectively quantify the contribution of distinct geopolitical and institutional entities to the retraction corpus, a fractional attribution model was employed. This approach normalizes the impact of multi-authored and multi-affiliated publications, ensuring that the total retraction penalty assigned to any single Digital Object Identifier (DOI) is conserved at unity ().
Let
P denote the set of all unique retracted papers in the analyzed corpus. For a specific paper
, the set of unique countries associated with the author’ affiliations is defined as
, and the set of unique institutions as
. The attribution weight
for a specific country
is calculated as the inverse of the cardinality of the country set for that paper:
Similarly, the attribution weight
for a specific institution
is derived as:
This derivation ensures that if multiple authors belong to the same country or institution, the entity is counted only once per paper, preventing the inflation of scores due to large single-institution research groups. Conversely, for international or inter-institutional collaborations, the responsibility is divided equally among the participating entities. The total
Retraction Score (
) for an entity
e (where
e represents either a country or an institution) is defined as the summation of weights across the entire corpus:
where
is the set of entities associated with paper
p, and
is the Kronecker delta function (
if
, else 0). To analyze detection latency, the
Median Time-to-Retraction (
) is calculated. For each paper
p, the latency
(in days) is:
Records where (indicating metadata errors) were excluded from temporal analysis but retained for aggregate count metrics.
Analysis Logic, Code, and Data Pipeline
The analytical pipeline was implemented in Python (v3.12.12) utilizing the
pandas library for data manipulation. The process was executed in three sequential stages: data ingestion, metadata enrichment, and metric calculation. The primary dataset was derived from the Retraction Watch Database. The
OriginalPaperDOI field was normalized to lowercase and stripped of protocol prefixes (e.g., “
https://doi.org/”) to ensure rigorous deduplication. The dataset was deduplicated at the DOI level, prioritizing the earliest retraction record to establish a conservative baseline for the Retraction Date. Records lacking a valid DOI or essential timestamps were discarded to maintain statistical integrity (
).
Metadata enrichment was conducted via the OpenAlex API (covering the period 2013–2025). To ensure high throughput while adhering to ethical scraping standards, we utilized the “Polite Pool” by identifying our requests with a dedicated User-Agent and mailto header. Rather than a fixed latency, we implemented an asynchronous request handler with a 100ms stagger and an automated back-off logic for 429 status codes. This pipeline facilitated the extraction of the authorships object, which was then parsed to map ROR institutional identifiers and ISO-2 country codes. This step leveraged OpenAlex’s disambiguated institutional graph rather than relying on unstructured text parsing. To isolate the impact of generative AI, a subset was generated using strict inclusion criteria:
- (1)
Temporal Filter: (aligned with the public release of ChatGPT).
- (2)
Taxonomy Filter: The Reason field must contain the exact substring “Computer-Aided Content or Computer-Generated Content”.
The attribution metrics defined in Equations (1–3) were re-calculated specifically for this subset to generate the final rankings.
Results
The analysis encompasses a final corpus of retracted publications. Metadata enrichment via OpenAlex yielded valid affiliation data for 83.0% of these records. The dataset exhibits high concentration: the top ten countries account for 78.0% of the total fractional retraction score, while the top fifty institutions account for 17.7%. The global median Time-to-Retraction (TTR) is 672 days (IQR: 449–1246 days).
Institutional-Level Retraction Dynamics
While country-level metrics indicate broad geopolitical trends, the institutional analysis reveals specific university hubs associated with high volumes of retracted content.
Table 1 details the top ten institutions globally.
Vellore Institute of Technology University (India) ranks first with a fractional score of 31.61. Saveetha University (India) ranks second () and is explicitly linked to the retraction reason “Computer-Aided Content or Computer-Generated Content.” This specific reason string is also observed for Sichuan Normal University (Rank 4, ) and Shandong First Medical University (Rank 8, ).
The detection latency varies significantly by misconduct type. Institutions associated with computer-aided content show lower median TTRs (e.g., Shandong First Medical University: 574.5 days) compared to institutions associated with historical data or image issues, such as the National Institute of Advanced Industrial Science and Technology (AIST, Japan), which exhibits a median TTR of 4,054 days.
Country-Level Retraction Dynamics
Table 2 presents the top ten countries ranked by their fractional Retraction Score. The distribution is characterized by a significant power-law outlier: China (CN) holds the first rank with a score of 1,351.54, which is nearly four times higher than the second-ranked country, India (IN) (
).
We utilized Shannon Entropy (
H) [
15] to quantify the diversity of retraction reasons within each jurisdiction. China (
) and India (
) exhibit high entropy, indicating a broad spectrum of misconduct types ranging from peer review manipulation to AI-generated content. In contrast, the Russian Federation (
) displays a notably lower entropy (
), suggesting that retractions there are driven by a narrower, more repetitive set of reasons (primarily “Concerns/Issues about Article” and “Referencing/Attributions”).
By cross-referencing
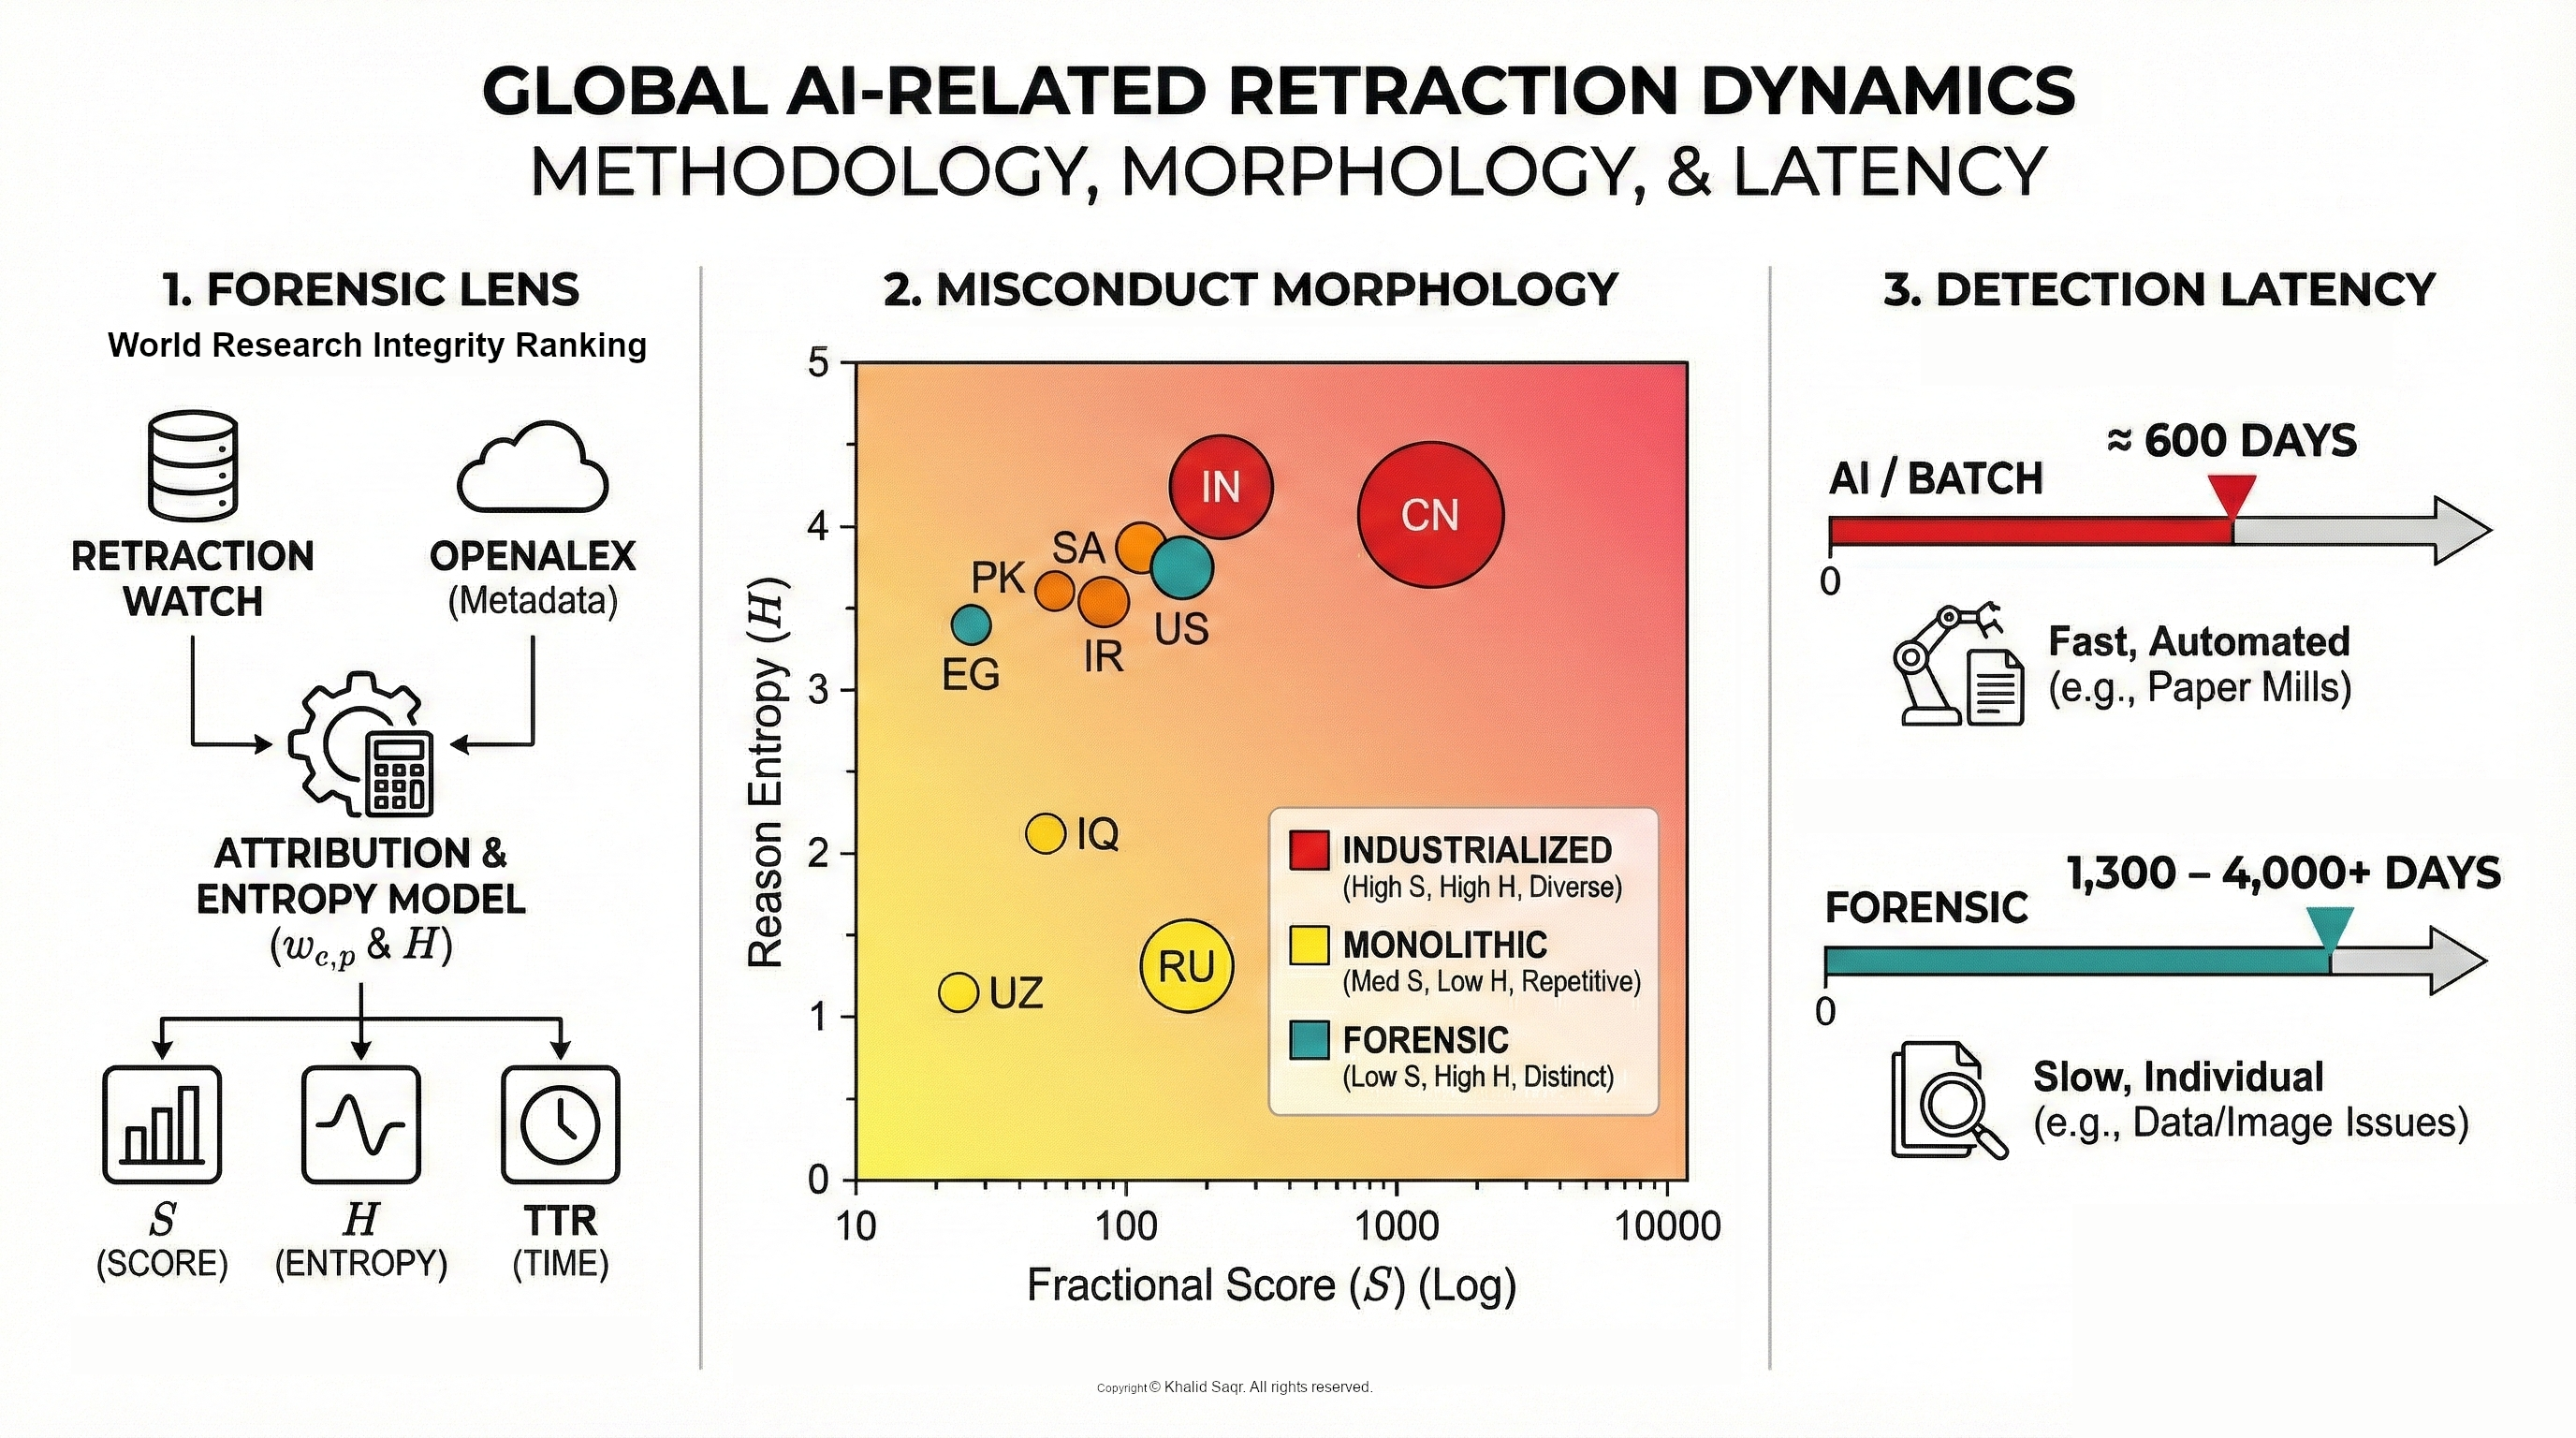
H with the primary retraction driver, we identified three distinct statistical clusters, or “misconduct morphologies” (
Table 3).
Industrialized/Generative Cluster Characterized by high entropy () and the explicit presence of “Paper Mill” or “Computer-Aided” indicators. This morphology, observed in China and India, reflects a dual-economy of fraud where high-volume, automated misconduct co-exists with traditional authorship disputes. Procedural/Monolithic Cluster Characterized by low entropy () and a repetitive focus on referencing or article issues. This pattern, seen in Russia and Uzbekistan, suggests systemic, uniform manipulation strategies (e.g., citation cartels) rather than diverse individual errors. Forensic/Substantive Cluster Characterized by high entropy but distinct primary drivers such as “Data Issues” or “Image Falsification.” Observed in the US and Japan, this morphology indicates complex, individually investigated cases rather than batch-processed automation.
This morphological divergence is validated by temporal data (
Table 4). We observe a statistically significant split in detection latency. The “Industrialized” institutions exhibit a tight median TTR clustering (∼570–640 days), supporting a hypothesis of batch detection. In contrast, “Forensic” institutions show TTRs exceeding 1,300 days, consistent with the timeline required for complex image or data investigations.
This typological divergence is mirrored in the temporal data.
Table 4 presents the “Detection Latency Clusters.” We identify a “Fast/Batch” cluster (TTR ≈ 500–650 days) associated with recent paper mill retractions, significantly distinct from the “Slow/Forensic” cluster (TTR > 1,300 days) associated with complex investigations in the US and Japan.
Discussion
The analysis confirms that by early 2026, computer-aided content has graduated from a localized risk to a dominant, capital-intensive vector of misconduct. The 2025 retraction clusters suggest that LLMs are being used not just for text generation, but for the automated fabrication of entire research programs. By triangulating fractional scores with entropy metrics, we unmask an ecosystem where generative AI is strategically weaponized in jurisdictions facing the most extreme productivity pressures.
A primary takeaway is the sharp morphological divide between high-output nations. Our Shannon Entropy (
H) analysis reflects the dual-economy of fraud documented during the 2024 mass-retraction waves. In China and India (
), the data shows a “heavy head” of industrialized fraud where “Computer-Aided Content” frequently clusters with compromised peer-review rings, as noted by recent investigative reports [
8,
11]. In contrast, the 2025 data from the Russian Federation suggests a more monolithic strategy centered on rigid citation cartels, highlighting that while the AI threat is significant, it has not yet fully displaced traditional systemic fraud in all jurisdictions.
The institutional data further clarifies the operational mechanics of this surge. The TTR (Time-to-Retraction) clustering observed for Saveetha University and Sichuan Normal University—tightly constrained between 570 and 640 days—presents a temporal paradox. This window is significantly narrower than the multi-year investigations required for image falsification (as seen in the AIST Japan case, TTR days), yet it is too long to prevent citation pollution. We interpret this as evidence of a “Batch-Processing Trap.” It appears that publishers are not detecting these papers individually during peer review. Instead, they are flagging them in bulk post-publication, only after linguistic or forensic audits of specific “Special Issues” trigger mass-retraction events. The coupling of “Computer-Aided Content” with “Compromised Peer Review” suggests that AI is being used to flood editorial pipelines, effectively exhausting the human-in-the-loop until the system collapses into a reactive audit.
Perhaps most concerning is the “Sophistication Gap” revealed by the absence of AI flags in the US and UK records. Given the ubiquity of LLM access, the lack of AI-related retractions in the Global North is likely an artifact of linguistic bias in current detection heuristics. While we are effectively unmasking the “low-quality” tier of AI use—characterized by blatant linguistic artifacts and “tortured phrases”—the higher-quality synthetic science produced by native English speakers or advanced prompting remains largely undetected. We are essentially catching the noise while the signal remains embedded in the record.
Ultimately, the correlation between paper mill indicators and computer-generated content confirms that AI has become the primary capital equipment for scaled misconduct. This structural shift renders text-based plagiarism detection—the industry’s primary defense for two decades—mathematically obsolete. We argue that the focus must shift from identifying the *product* of fraud to verifying the *provenance* of the research. Without an immutable log of the scientific process itself, the distinction between synthetic and human-led science will continue to decay.
Conclusions
This analysis provides the first large-scale empirical quantification of the generative AI footprint in the retraction record. By processing 3,974 records through a fractional attribution lens, we have demonstrated that “Computer-Aided Content” is no longer a fringe anomaly but a structural pillar of modern research misconduct.
Our findings reveal a stark asymmetry in the global integrity landscape. The concentration of AI-linked retractions in high-pressure jurisdictions, paired with a distinct ∼600-day detection latency, indicates that the current peer-review infrastructure is being outpaced by the near-zero marginal cost of synthetic content. The “Sophistication Gap” identified in this study further suggests that our current forensic tools are biased toward catching low-tier linguistic errors while potentially missing a more advanced stratum of synthetic science.
The implications for scientometrics are clear: the era of text-based forensics is over. As LLMs evolve, the linguistic signals of fraud will inevitably vanish, leaving the scientific record vulnerable to a total dilution of authenticity. We conclude that the only viable long-term defense is a transition from post-publication detection to prospective provenance verification. The scientific community must move toward “process-integrity” frameworks—where the immutable logging of the research and writing lifecycle becomes the standard for trust—replacing our fragile reliance on the final, polishable PDF.
Funding
The author declares that no funds, grants, or other support were received during the preparation of this manuscript.
Data Availability Statement
The datasets generated and/or analyzed during the current study, along with the full analytical pipeline and Python implementation, are available in the project repository at this
Github repository.
Conflicts of Interest
The author declares no competing financial interests or personal relationships that could have appeared to influence the work reported in this paper.
References
- Van Noorden, R. ChatGPT: five priorities for research. Nature 2023, 614(7947), 224–226. [Google Scholar] [CrossRef] [PubMed]
- Else, H. ’Paper-mill’ alarm software flags potentially fake papers. Nature 2022, 609(7929), 20–21. [Google Scholar] [CrossRef]
- Cabanac, G.; Labbé, C.; Magazinov, A. Tortured phrases: A dubious writing style emerging in science. arXiv 2021, arXiv:2107.06751. [Google Scholar] [CrossRef]
- Brainard, J. Fake scientific papers are alarmingly common. Science 2023, 380(6645), 567. [Google Scholar] [CrossRef]
- Stokel-Walker, C. ChatGPT listed as author on research papers: many scientists disapprove. Nature 2023, 613(7945), 620–621. [Google Scholar] [CrossRef] [PubMed]
- Thorp, H. H. ChatGPT is fun, but not an author. Science 2023, 379(6630), 313. [Google Scholar] [CrossRef] [PubMed]
- Conroy, G. How ChatGPT and other AI tools could disrupt scientific publishing. Nature 2023, 622(7982), 234–236. [Google Scholar] [CrossRef] [PubMed]
- Abalkina, A.; Aquarius, R.; Bik, E.; Bimler, D.; Bishop, D.; Byrne, J.; Cabanac, G.; Day, A.; Labbé, C.; Wise, N. ’Stamp out paper mills’ — science sleuths on how to fight fake research. Nature 2025, 637(8048), 1047–1050. [Google Scholar] [CrossRef] [PubMed]
- Kincaid, E. Wiley to stop using "Hindawi" name amid 18 million revenue decline. Retraction Watch. 2023. Available online: https://retractionwatch.com/2023/12/06/wiley-to-stop-using-hindawi-name-amid-18-million-revenue-decline/.
- Forbes Advisor. Surge In Academic Retractions Should Put U.S. Scholars On Notice. Forbes. 2024. Available online: https://www.forbes.com/sites/petersuciu/2024/02/01/surge-in-academic-retractions-should-put-us-scholars-on-notice/.
- Hvistendahl, M. China’s publication bazaar. Science 2013, 342(6162), 1035–1039. [Google Scholar] [CrossRef] [PubMed]
- Ordway, D.-M. Retraction Watch: Tracking retractions as a window into the scientific process. In Journal’s Resource; 2021. [Google Scholar]
- Priem, J.; Piwowar, H.; Orr, R. OpenAlex: A fully-open index of scholarly works, author, venues, institutions, and concepts. arXiv 2022, arXiv:2205.01833. [Google Scholar]
- Guerrero-Bote, V. P.; Chinchilla-Rodríguez, Z.; Mendoza, A.; de Moya-Anegón, F. Comparative analysis of the bibliographic data sources Dimensions and Scopus: An approach at the country and institutional level. Frontiers in Research Metrics and Analytics 2021, 5, 593494. [Google Scholar] [CrossRef] [PubMed]
- Shannon, C. E. A mathematical theory of communication. The Bell System Technical Journal 1948, vol. 27(no. 3), 379–423. [Google Scholar] [CrossRef]
- Weber-Wulff, D.; Anohina-Naumeca, A.; Bjelobaba, S.; Foltýnek, T.; Guerrero-Dib, J.; Popoola, O.; Waddington, L. Testing of detection tools for AI-generated text. International Journal for Educational Integrity 2023, 19(1), 26. [Google Scholar] [CrossRef]
- Else, H. Abstracts written by ChatGPT fool scientists. Nature 2023, 613(7944), 423. [Google Scholar] [CrossRef] [PubMed]
Table 1.
Top 10 Institutions by Fractional Retraction Score and Primary Retraction Reason. Bold text indicates AI-specific retraction reasons.
Table 1.
Top 10 Institutions by Fractional Retraction Score and Primary Retraction Reason. Bold text indicates AI-specific retraction reasons.
| Rank |
Institution |
Score |
TTR |
Top Retraction Reasons |
| 1 |
Vellore Inst. of Technology |
31.61 |
801.0 |
Peer Review; Investigation by Journal/Publisher |
| 2 |
Saveetha University |
31.34 |
632.0 |
Computer-Aided Content or Computer-Generated Content; Referencing/Attributions |
| 3 |
King Saud University |
29.51 |
630.5 |
authorship/Affiliation; Investigation by Journal/Publisher |
| 4 |
Sichuan Normal University |
28.00 |
1238.0 |
Computer-Aided Content or Computer-Generated Content; authorship/Affiliation |
| 5 |
Lovely Professional Univ. |
22.15 |
469.0 |
Article Issues; Referencing/Attributions |
| 6 |
Don State Technical Univ. |
21.33 |
490.0 |
Article Issues; Referencing/Attributions |
| 7 |
Institute of Engineering |
16.48 |
640.0 |
Article Issues; Referencing/Attributions |
| 8 |
Shandong First Med. Univ. |
16.48 |
574.5 |
Computer-Aided Content or Computer-Generated Content; Data Issues |
| 9 |
Menoufia University |
16.48 |
1497.0 |
Referencing/Attributions; Investigation by Journal |
| 10 |
National Inst. AIST |
16.42 |
4054.0 |
Error in Image; Falsification/Fabrication of Image |
Table 2.
Top 10 Countries by Fractional Retraction Score and Reason Entropy. High entropy (H) indicates a diverse range of misconduct types; low entropy indicates repetitive or systematic reasons.
Table 2.
Top 10 Countries by Fractional Retraction Score and Reason Entropy. High entropy (H) indicates a diverse range of misconduct types; low entropy indicates repetitive or systematic reasons.
| Rank |
Country |
Score |
TTR |
H |
Primary Retraction Reasons |
| 1 |
China (CN) |
1351.54 |
850.0 |
4.22 |
Computer-Aided Content or Computer-Generated Content; authorship/Affiliation |
| 2 |
India (IN) |
359.29 |
651.0 |
4.29 |
Article Issues; Referencing/Attributions |
| 3 |
Russia (RU) |
190.80 |
490.0 |
1.33 |
Article Issues; Referencing/Attributions |
| 4 |
USA (US) |
134.98 |
1365.0 |
3.85 |
Concerns/Issues about Data; Image Issues |
| 5 |
Saudi Arabia (SA) |
122.60 |
743.0 |
3.91 |
Referencing/Attributions; Investigation by Journal |
| 6 |
Iran (IR) |
109.95 |
1132.0 |
3.65 |
authorship/Affiliation; Investigation by Journal |
| 7 |
Pakistan (PK) |
92.12 |
878.0 |
3.72 |
Referencing/Attributions; Peer Review Issues |
| 8 |
Iraq (IQ) |
88.77 |
640.0 |
2.10 |
Article Issues; Referencing/Attributions |
| 9 |
Egypt (EG) |
68.12 |
1122.0 |
3.44 |
Referencing/Attributions; Investigation by Journal |
| 10 |
Uzbekistan (UZ) |
55.89 |
490.0 |
1.15 |
Article Issues; Referencing/Attributions |
Table 3.
Misconduct Morphology by Jurisdiction. Countries are categorized by their dominant retraction drivers and entropy (H), revealing distinct regional typologies of fraud.
Table 3.
Misconduct Morphology by Jurisdiction. Countries are categorized by their dominant retraction drivers and entropy (H), revealing distinct regional typologies of fraud.
| Jurisdiction |
Morphology Type |
H |
Dominant Indicators |
| China (CN) |
Industrialized / Generative |
4.22 |
Computer-Aided Content; Paper Mill; Compromised Peer Review |
| India (IN) |
Industrialized / Procedural |
4.29 |
Article Issues; Referencing/Attributions; Peer Review |
| Russia (RU) |
Monolithic / Citation |
1.33 |
Concerns/Issues about Article; Referencing/Attributions |
| United States (US) |
Substantive / Forensic |
5.04 |
Concerns/Issues about Data; Image Issues; authorship |
| Saudi Arabia (SA) |
Procedural / Citation |
4.77 |
Referencing/Attributions; Investigation by Journal |
| Pakistan (PK) |
Mixed / Procedural |
3.79 |
Referencing/Attributions; Peer Review Issues |
Table 4.
Detection Latency Clusters. Top institutions are grouped by Median Time-to-Retraction (TTR), highlighting the speed differential between automated AI detection and manual forensic investigation.
Table 4.
Detection Latency Clusters. Top institutions are grouped by Median Time-to-Retraction (TTR), highlighting the speed differential between automated AI detection and manual forensic investigation.
| Cluster Type |
Institution |
Median TTR |
Primary Retraction Driver |
| Fast / Batch |
Uzbekistan (National) |
490 days |
Article Issues; Referencing |
| |
Shandong First Med. Univ. |
574.5 days |
Computer-Aided Content; Data Issues |
| |
Saveetha University |
632.0 days |
Computer-Aided Content; Paper Mill |
| |
King Saud University |
630.5 days |
authorship; Investigation by Journal |
| Slow / Forensic |
Vellore Inst. of Tech. |
801.0 days |
Peer Review; Investigation |
| |
Menoufia University |
1,497.0 days |
Referencing; Unreliable Results |
| |
AIST (Japan) |
4,054.0 days |
Image Falsification; Misconduct |
|
Disclaimer/Publisher’s Note: The statements, opinions and data contained in all publications are solely those of the individual author(s) and contributor(s) and not of MDPI and/or the editor(s). MDPI and/or the editor(s) disclaim responsibility for any injury to people or property resulting from any ideas, methods, instructions or products referred to in the content. |
© 2026 by the authors. Licensee MDPI, Basel, Switzerland. This article is an open access article distributed under the terms and conditions of the Creative Commons Attribution (CC BY) license (http://creativecommons.org/licenses/by/4.0/).