Preprint
Article

This version is not peer-reviewed.

Waterlogging Stress Memory Including the Tillering Stage Confers the Greatest Tolerance to Waterlogging at Anthesis in Wheat via Enhanced Post-Stress Nitrogen Uptake

Submitted:

02 January 2026

Posted:

04 January 2026

You are already at the latest version

Abstract

Waterlogging stress, particularly during flowering severely constrains wheat production, yet the optimal timing and frequency of waterlogging stress memory and its linkage to post-stress nitrogen acquisition remain unclear. We conducted pot experiments under glasshouse over two consecutive growing seasons (2022/23 and 2023/24) using the Japanese bread wheat cultivar Norin 61 to evaluate eight treatment combinations of waterlogging stress memory applied at the tillering, stem elongation, and booting stages, followed by waterlogging during flowering stage. Leaf greenness (SPAD), chlorophyll fluorescence (Fv′/Fm′), photosynthetic rate, yield and its components, and nitrogen dynamics were assessed. To quantify post-stress nitrogen uptake, 15N-labeled ammonium sulfate was applied immediately after waterlogging termination at flowering, and 15N uptake and allocation to plant organs and grains were determined during grain filling and at harvest. Treatments that included tillering-stage stress memory consistently delayed leaf senescence, maintained higher photosynthetic performance, increased thousand-grain weight, and improved grain yield relative to the non-primed treatment, with reproducible effects across both seasons. These treatments also showed higher post-stress 15N uptake and greater 15N allocation to grains. Overall, tillering-stage waterlogging stress memory was associated with improved tolerance to flowering-stage waterlogging in wheat through maintenance of post-stress nitrogen uptake capacity and nitrogen allocation to grains.

Keywords: 
;  ;  ;  ;  ;  ;  ;  

1. Introduction

In the context of global climate change, the frequency of extreme weather events, including sudden torrential rainfall and flooding, has increased worldwide. As global warming progresses, extreme precipitation events are occurring more frequently [1]. Consequently, waterlogging stress induced by such events has become one of the major abiotic constraints on crop production [2].
Wheat is predominantly cultivated in arid to semi-humid regions, particularly in semi-arid environments, and exhibits limited adaptability to humid conditions. Under soil waterlogging, wheat growth and grain yield are markedly reduced. Globally, 15–20% of wheat yield is lost annually due to waterlogging damage, affecting approximately 10–15 million hectares [3]. In Japan, the risk of waterlogging damage is particularly high because of abundant rainfall and the frequent cultivation of wheat in converted paddy fields characterized by heavy clay soils and poor drainage capacity. As a result, waterlogging has been identified as the primary cause of wheat yield reduction in Japan, making its mitigation a critical agronomic challenge [4].
Although waterlogging damage can occur at various growth stages in wheat, the flowering stage is especially sensitive [5,6,7]. Waterlogging stress during flowering reduces nitrogen uptake capacity and leaf greenness, as reflected by decreased SPAD values, thereby accelerating premature leaf senescence through chlorosis and necrosis. This process suppresses photosynthesis and leads to poor grain filling [6,8]. Grain yield and quality in wheat are strongly influenced by nitrogen redistribution during the grain-filling period [9,10]. Waterlogging stress has been shown to inhibit the remobilization of nitrogen and photosynthetic assimilates stored in vegetative organs to the grain, resulting in yield reduction [11]. Early senescence has been hypothesized to occur via leaf “self- destruction” as a compensatory response to reduced nitrogen uptake capacity [12,13]. Therefore, sustaining nitrogen uptake capacity is essential for mitigating premature senescence and yield loss in wheat under waterlogging conditions.
Plants have been reported to possess adaptive mechanisms described as “stress memory”, “stress priming”, “stress hardening”, or “stress imprint”, which enable them to respond more effectively to subsequent stress after prior exposure [14,15,16,17,18]. The strategic exploitation of these mechanisms has attracted increasing attention as a potential approach to enhance crop tolerance to abiotic stresses. Waterlogging-related stress memory has been documented in several crop species. In soybean, exposure to water-logging during the vegetative stage reduced oxidative damage and maintained yield when plants were subsequently subjected to waterlogging during the reproductive stage [19]. Similarly, in tomato, repeated waterlogging treatments applied at the seedling stage maintained photosynthetic capacity compared with non-primed plants [20].
In wheat, waterlogging stress memory has also been reported. Short-term (two days) waterlogging applied at multiple 7-leaf, 9-leaf, and heading stages enhanced tolerance to subsequent waterlogging at flowering by delaying leaf senescence and maintaining grain filling and yield [21]. In addition, waterlogging priming at early vegetative stages, such as the 4- and 6-leaf stages, mitigated declines in photosynthetic capacity and grain yield under later waterlogging stress, with clear varietal differences [22]. Waterlogging priming at the 4-leaf stage has also been shown to increase antioxidant enzyme activity and soluble sugar content, and in tolerant variety, to promote inducible aerenchyma formation, thereby alleviating reductions in SPAD values and grain yield under waterlogging stress [23].
Despite these advances, previous studies have generally examined waterlogging stress memory at limited growth stages or with a fixed number of treatments. Consequently, the optimal growth stage and frequency of waterlogging stress memory treatments required to maximize waterlogging tolerance in wheat remain unclear. Moreover, although wheat grain yield is closely associated with nitrogen uptake capacity after flowering [24], the effects of waterlogging stress memory on post-flowering nitrogen uptake and subsequent nitrogen remobilization to grains have not been quantitatively evaluated.
The present study was conducted under controlled pot conditions over two consecutive growing seasons to address these knowledge gaps. Eight treatments were established by combining the presence or absence of waterlogging stress memory at three key growth stages: the tillering, stem elongation, and booting stages. This experimental design enabled a systematic evaluation of both the timing and frequency of stress memory treatments. The objectives of this study were (i) to determine whether waterlogging stress memory mitigates waterlogging damage during flowering, (ii) to identify the growth stage and treatment combination that most effectively enhances waterlogging tolerance, and (iii) to assess the reproducibility of these effects across two growing seasons. In addition, ammonium sulfate labeled with the nitrogen stable isotope (15N) was applied after the removal of waterlogging stress at flowering to quantitatively evaluate the effects of waterlogging stress memory on nitrogen uptake capacity and nitrogen remobilization to grains.

2. Materials and Methods

2.1. Cultivation Environments and Waterlogging Stress Memory Treatment

The representative Japanese bread wheat (Triticum aestivum L.) cultivar Norin 61 was used as the plant material. Pot experiments were conducted in a glasshouse at the Faculty of Agriculture, Tottori University, Japan (134.1705°E, 35.5146°N), over two consecutive growing seasons (2022/23 and 2023/24). The glasshouse allowed control of precipitation, thereby eliminating rainfall effects. To ensure precise application of waterlogging stress at specific growth stages, well-drained sandy soil was used and filled into white HIPS (High Impact Polystyrene) pots (1/2000 a Wagner pot; surface area 500 cm²; inner diameter 25 cm; inner height 30 cm).
In the 2022/23 growing season, basal fertilizers were applied at the following rates: 1.19 g pot⁻¹ (5 g N m⁻²) ammonium sulfate, 3.40 g pot⁻¹ (12 g P₂O₅ m⁻²) superphosphate, 1.20 g pot⁻¹ (12 g K₂O m⁻²) potassium sulfate, and 4.50 g pot⁻¹ of the trace element fertilizer “Hama Green”. On 28 December 2022, six seeds per hill were sown at six equally spaced points arranged in a circle in each pot. Plants were thinned on three occasions to retain three plants per hill (18 plants per pot). On 10 March 2023, ammonium sulfate was applied as a topdressing at 1.19 g pot⁻¹ (5 g N m⁻²). On 13 April 2023, the day after termination of the 5-day waterlogging stress during flowering, 1.20 g pot⁻¹ of ammonium sulfate containing 2.5 atom% 15N was dissolved in tap water and applied evenly around the base of each hill to assess nitrogen uptake capacity after waterlogging stress.
In the 2023/24 growing season, basal fertilizers were applied at 1.19 g pot⁻¹ (5 g N m⁻²) ammonium sulfate, 1.40 g pot⁻¹ (12 g P₂O₅ m⁻²) heavy superphosphate lime, 1.00 g pot⁻¹ (12 g K₂O m⁻²) potassium chloride, and 4.50 g pot⁻¹ “Hama Green”. Seeds were sown on 28 November 2023 as in 2022/23, and plants were thinned to two plants per hill (12 plants per pot). Ammonium sulfate (1.19 g pot⁻¹, equivalent to 5 g N m⁻²) was applied as topdressing on 8 February and again on 11 March 2024. On 16 April 2024, the day after termination of the 4-day waterlogging stress during flowering, 1.20 g pot⁻¹ of ammonium sulfate containing 2.5 atom% 15N was applied to each pot, as in 2022/23.
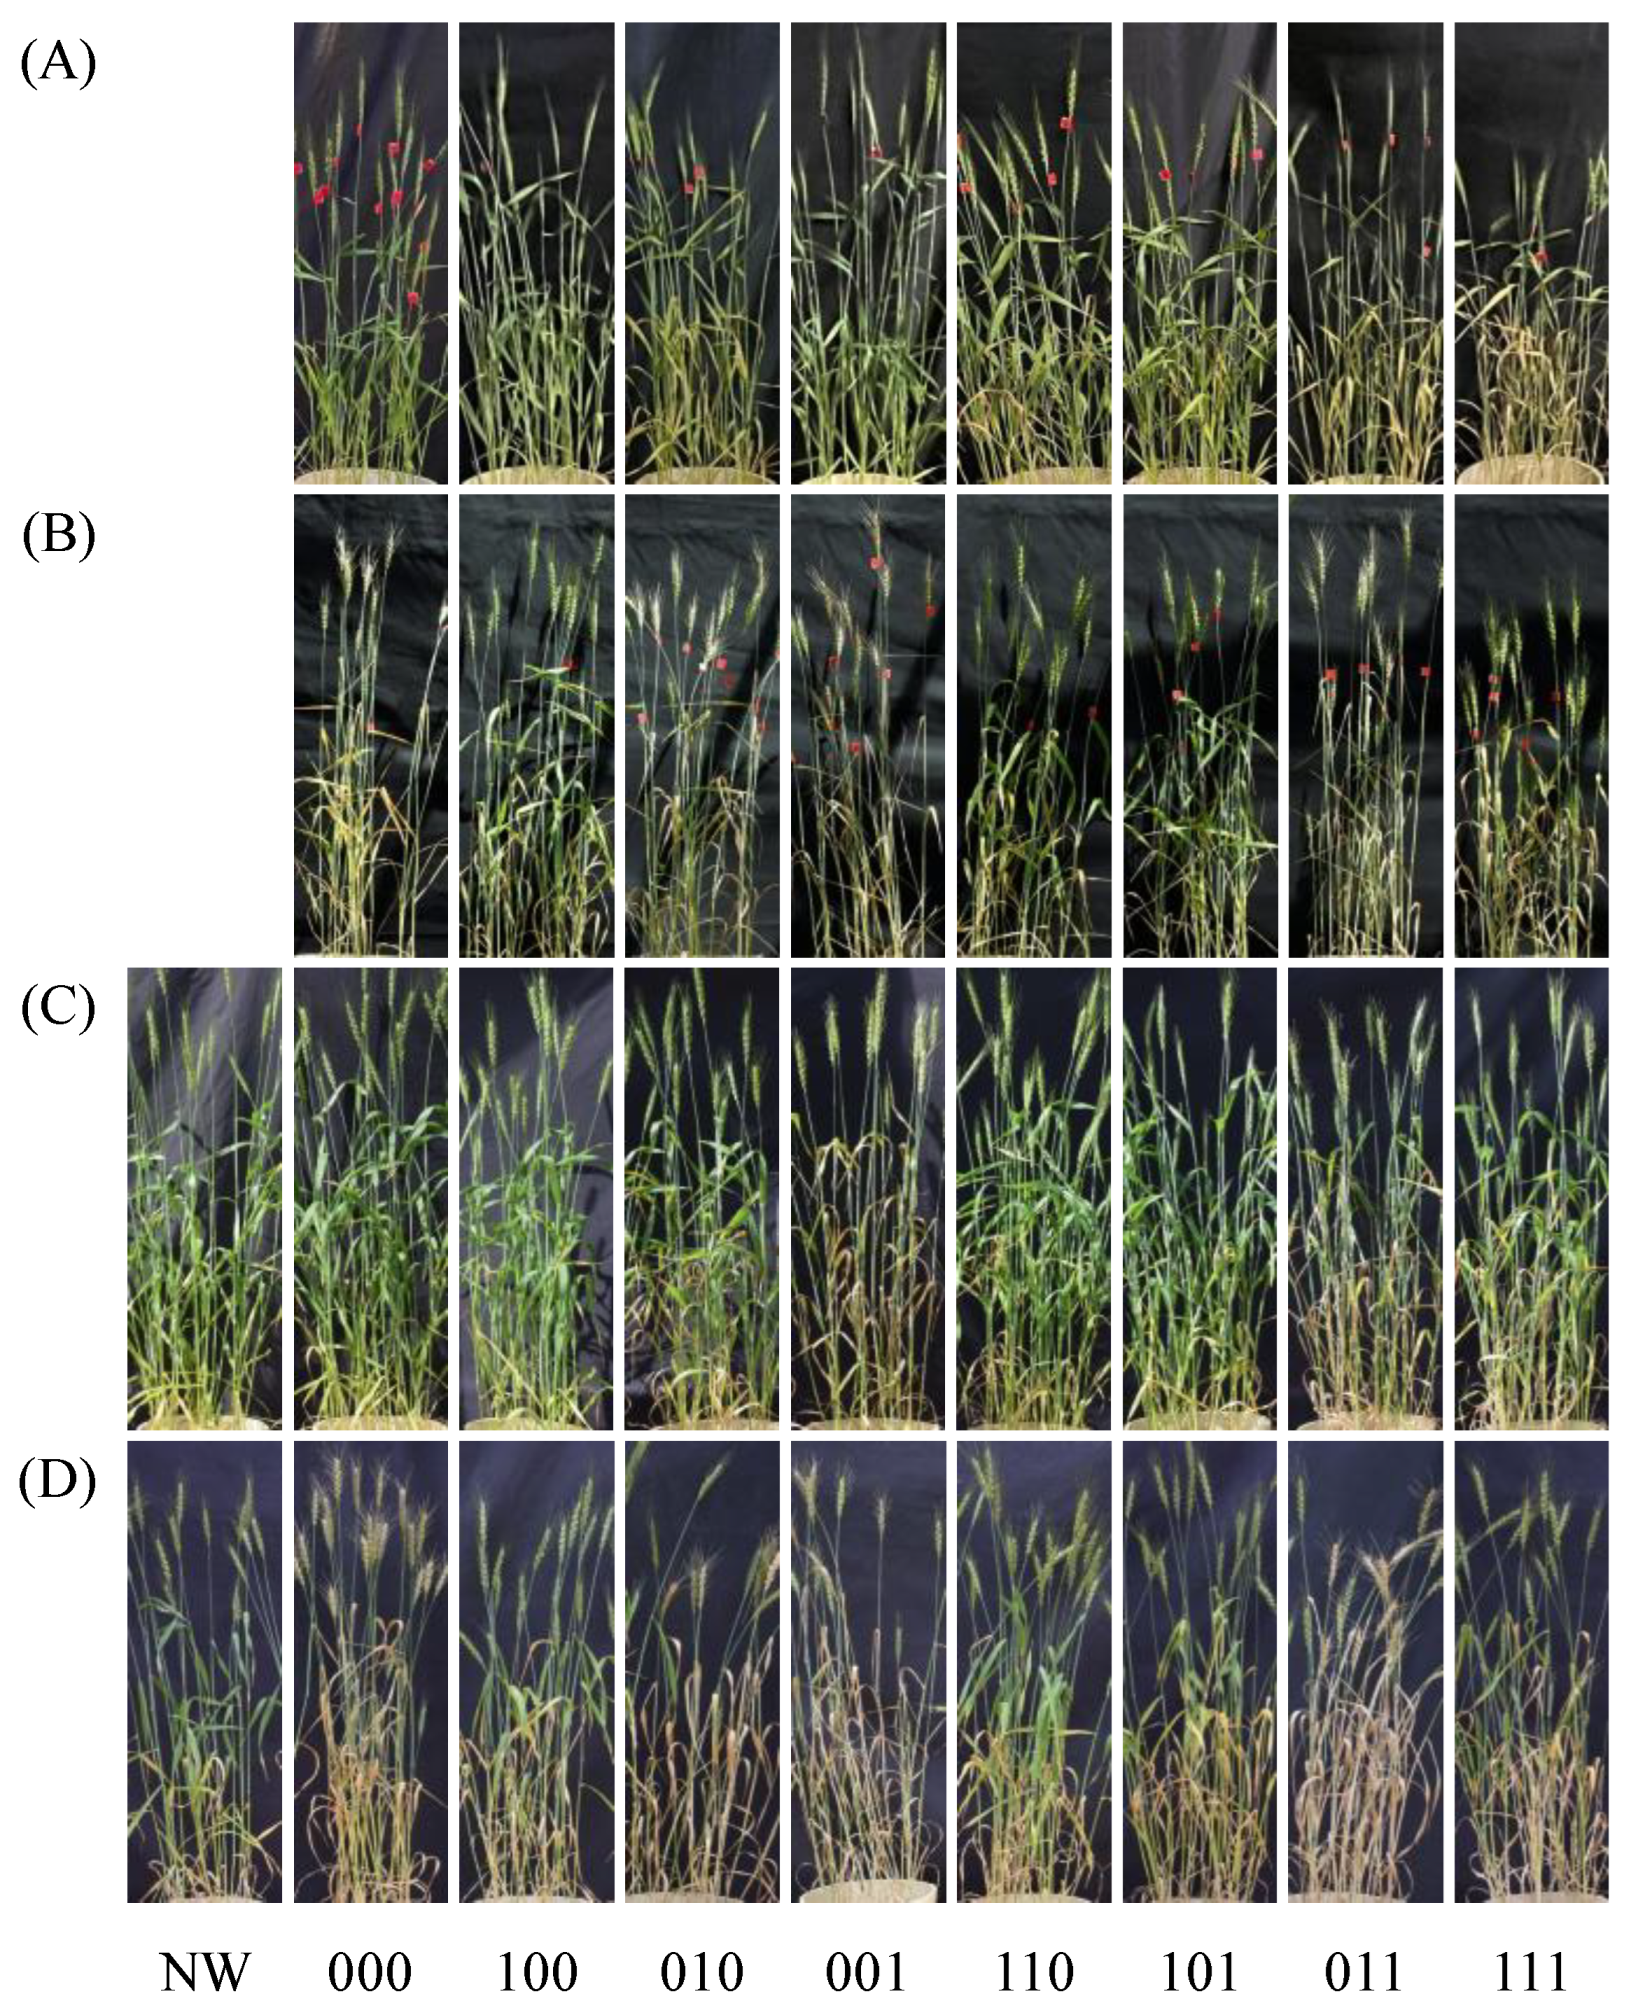
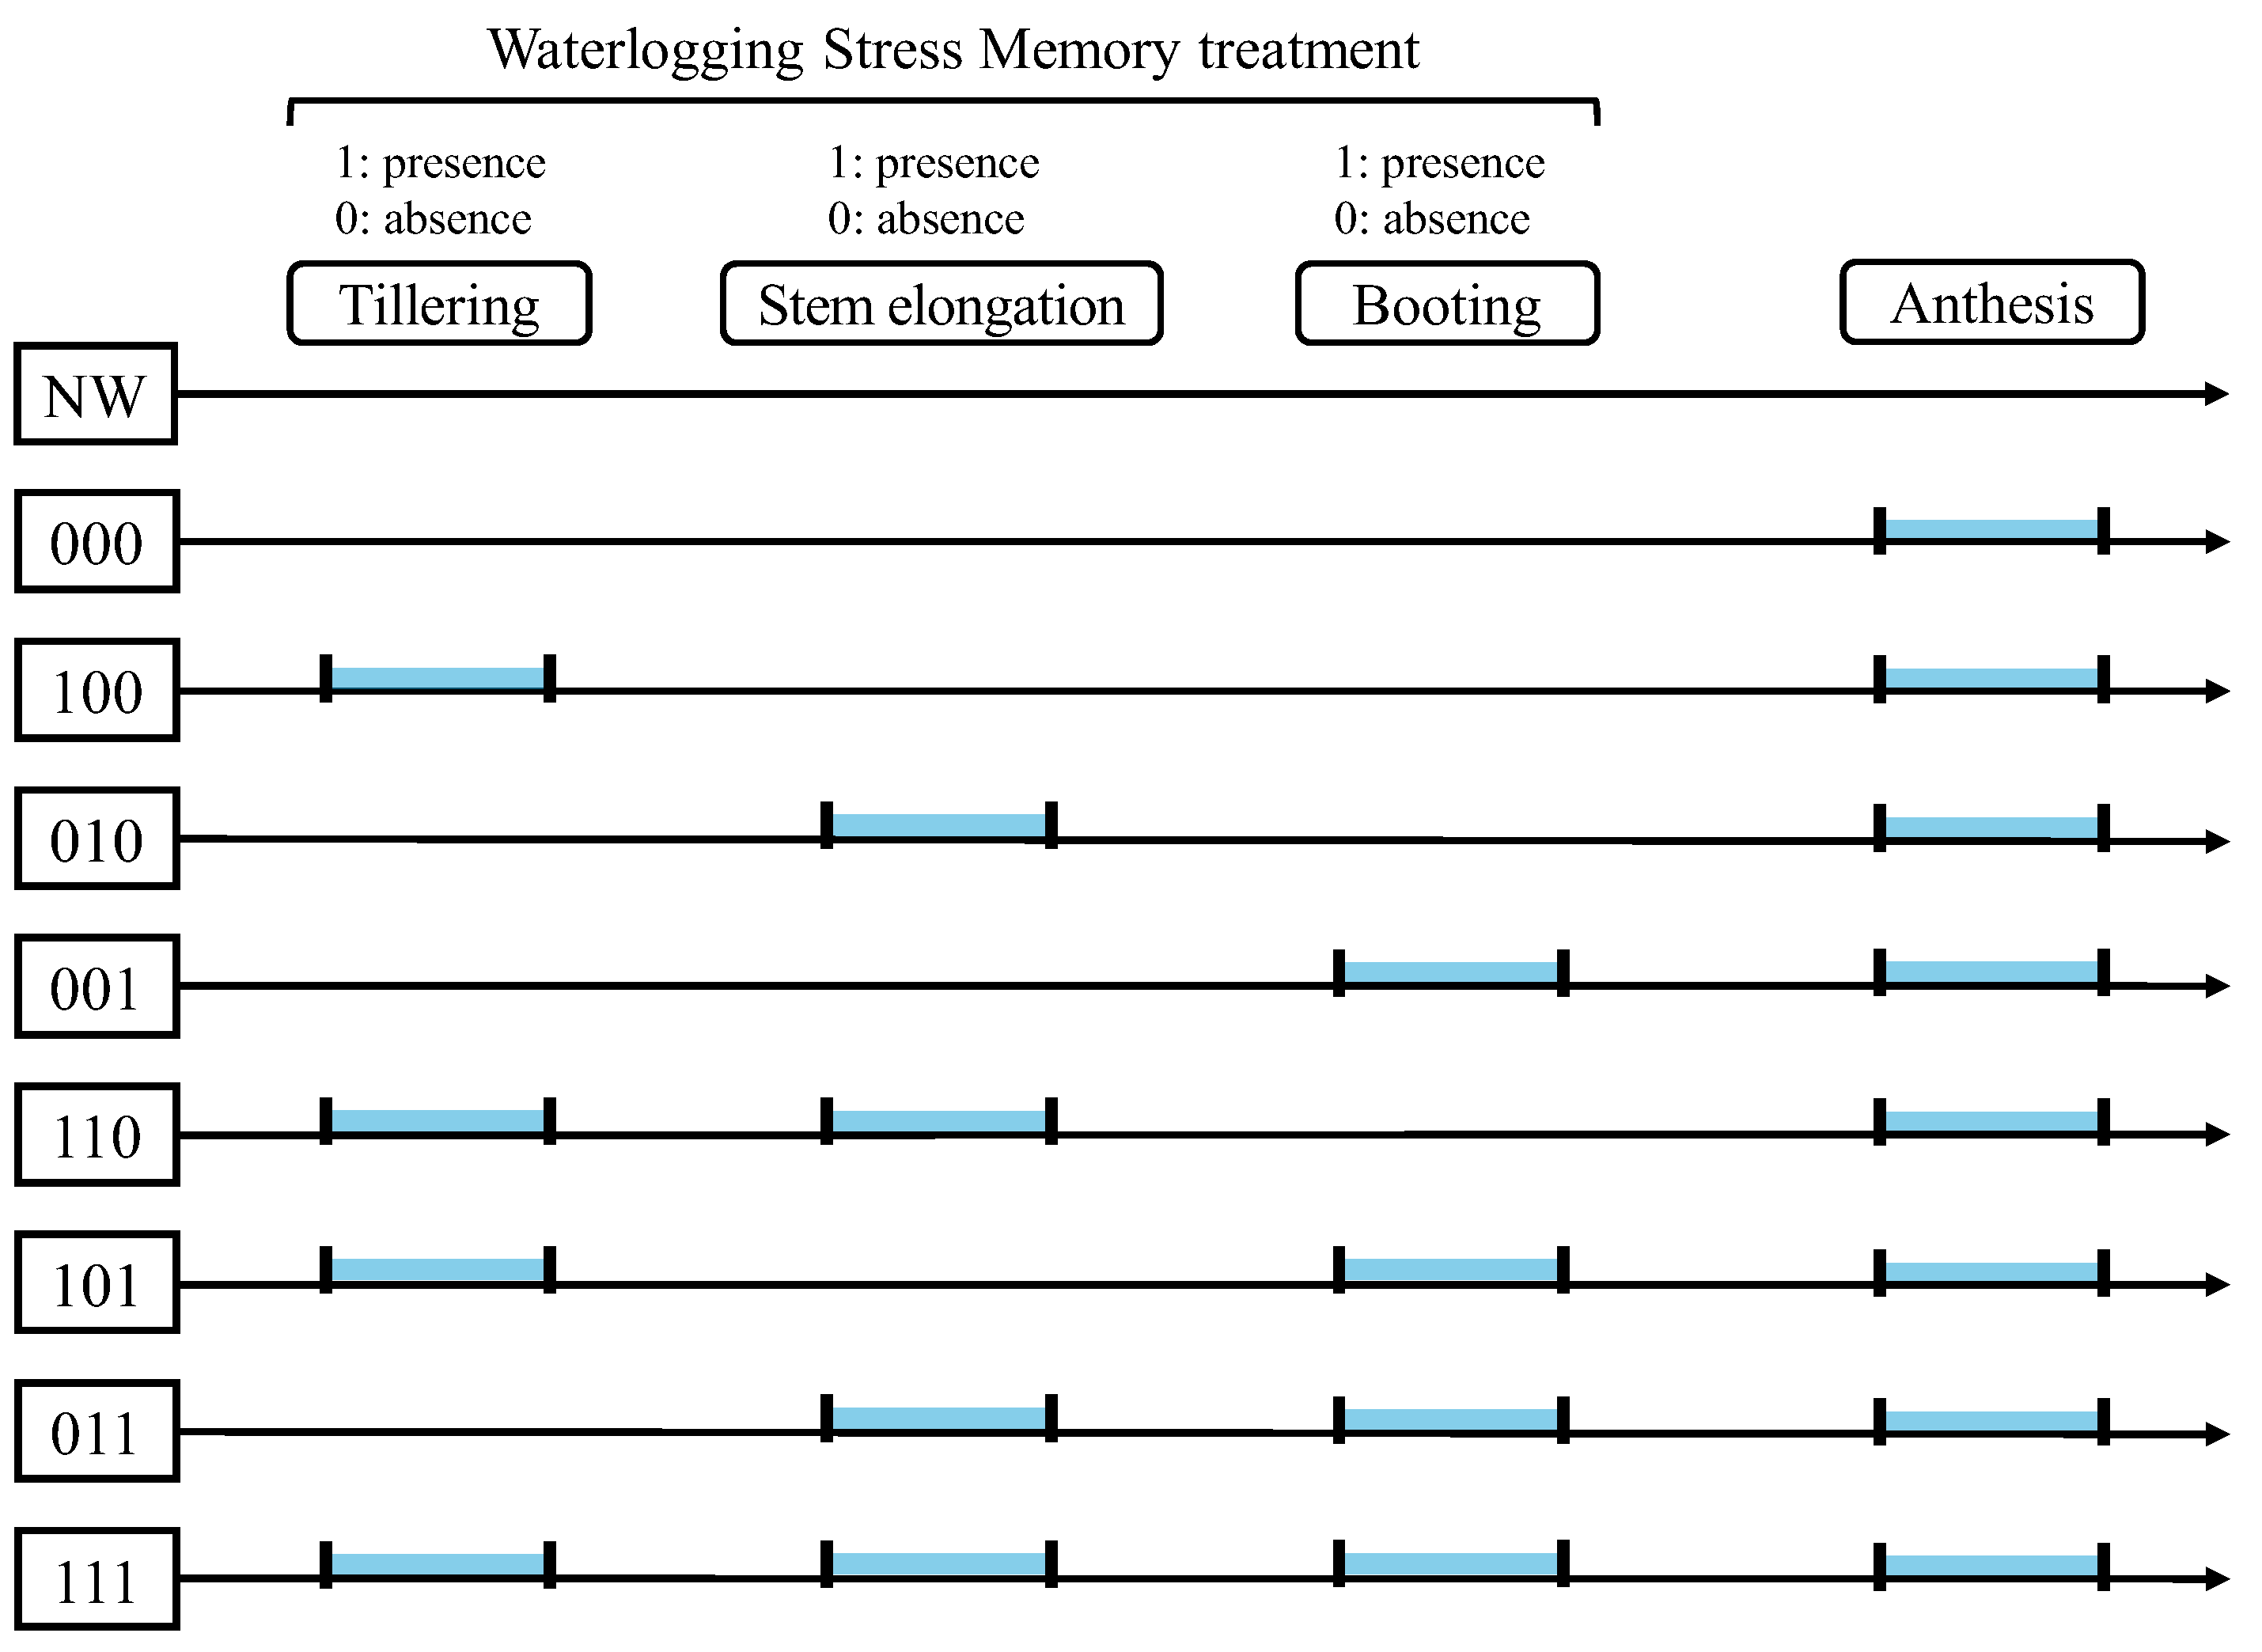
Eight treatments were established by combining the presence (1) or absence (0) of waterlogging stress memory treatments at the tillering, stem elongation, and booting stages (Figure 1). In the 2023/24 season, a non-waterlogged control that received no waterlogging stress throughout the growing period was also included for physiological evaluation. Except for this control, all treatments were subjected to waterlogging stress during flowering. The experiments were conducted in a randomized block design with five replicates in 2022/23 and six replicates in 2023/24 (treatments 100 and 101 in 2022/23 had four replicates because of poor growth before initiation of the tillering-stage memory treatment).
In 2022/23, waterlogging stress memory treatments were applied for 4 days at the tillering stage (6–10 March 2023), 4 days at the stem elongation stage (20–24 March), and 3 days at the booting stage (27–30 March). All pots were subsequently subjected to 5 days of waterlogging stress during flowering (7–12 April). In 2023/24, treatments were applied for 4 days at the tillering stage (21–25 February 2024), 4 days at the stem elongation stage (6–10 March), and 4 days at the booting stage (22–26 March). During flowering, a 4-day waterlogging stress treatment (11–15 April) was applied to all pots except the non-waterlogged control. For all waterlogging treatments, the water level was maintained approximately 3 cm above the soil surface. After each treatment, water was rapidly drained through the drainage holes at the bottom of the pots, collected separately, and reused for subsequent irrigation to minimize nutrient leaching.

2.2. Measurements and Sampling

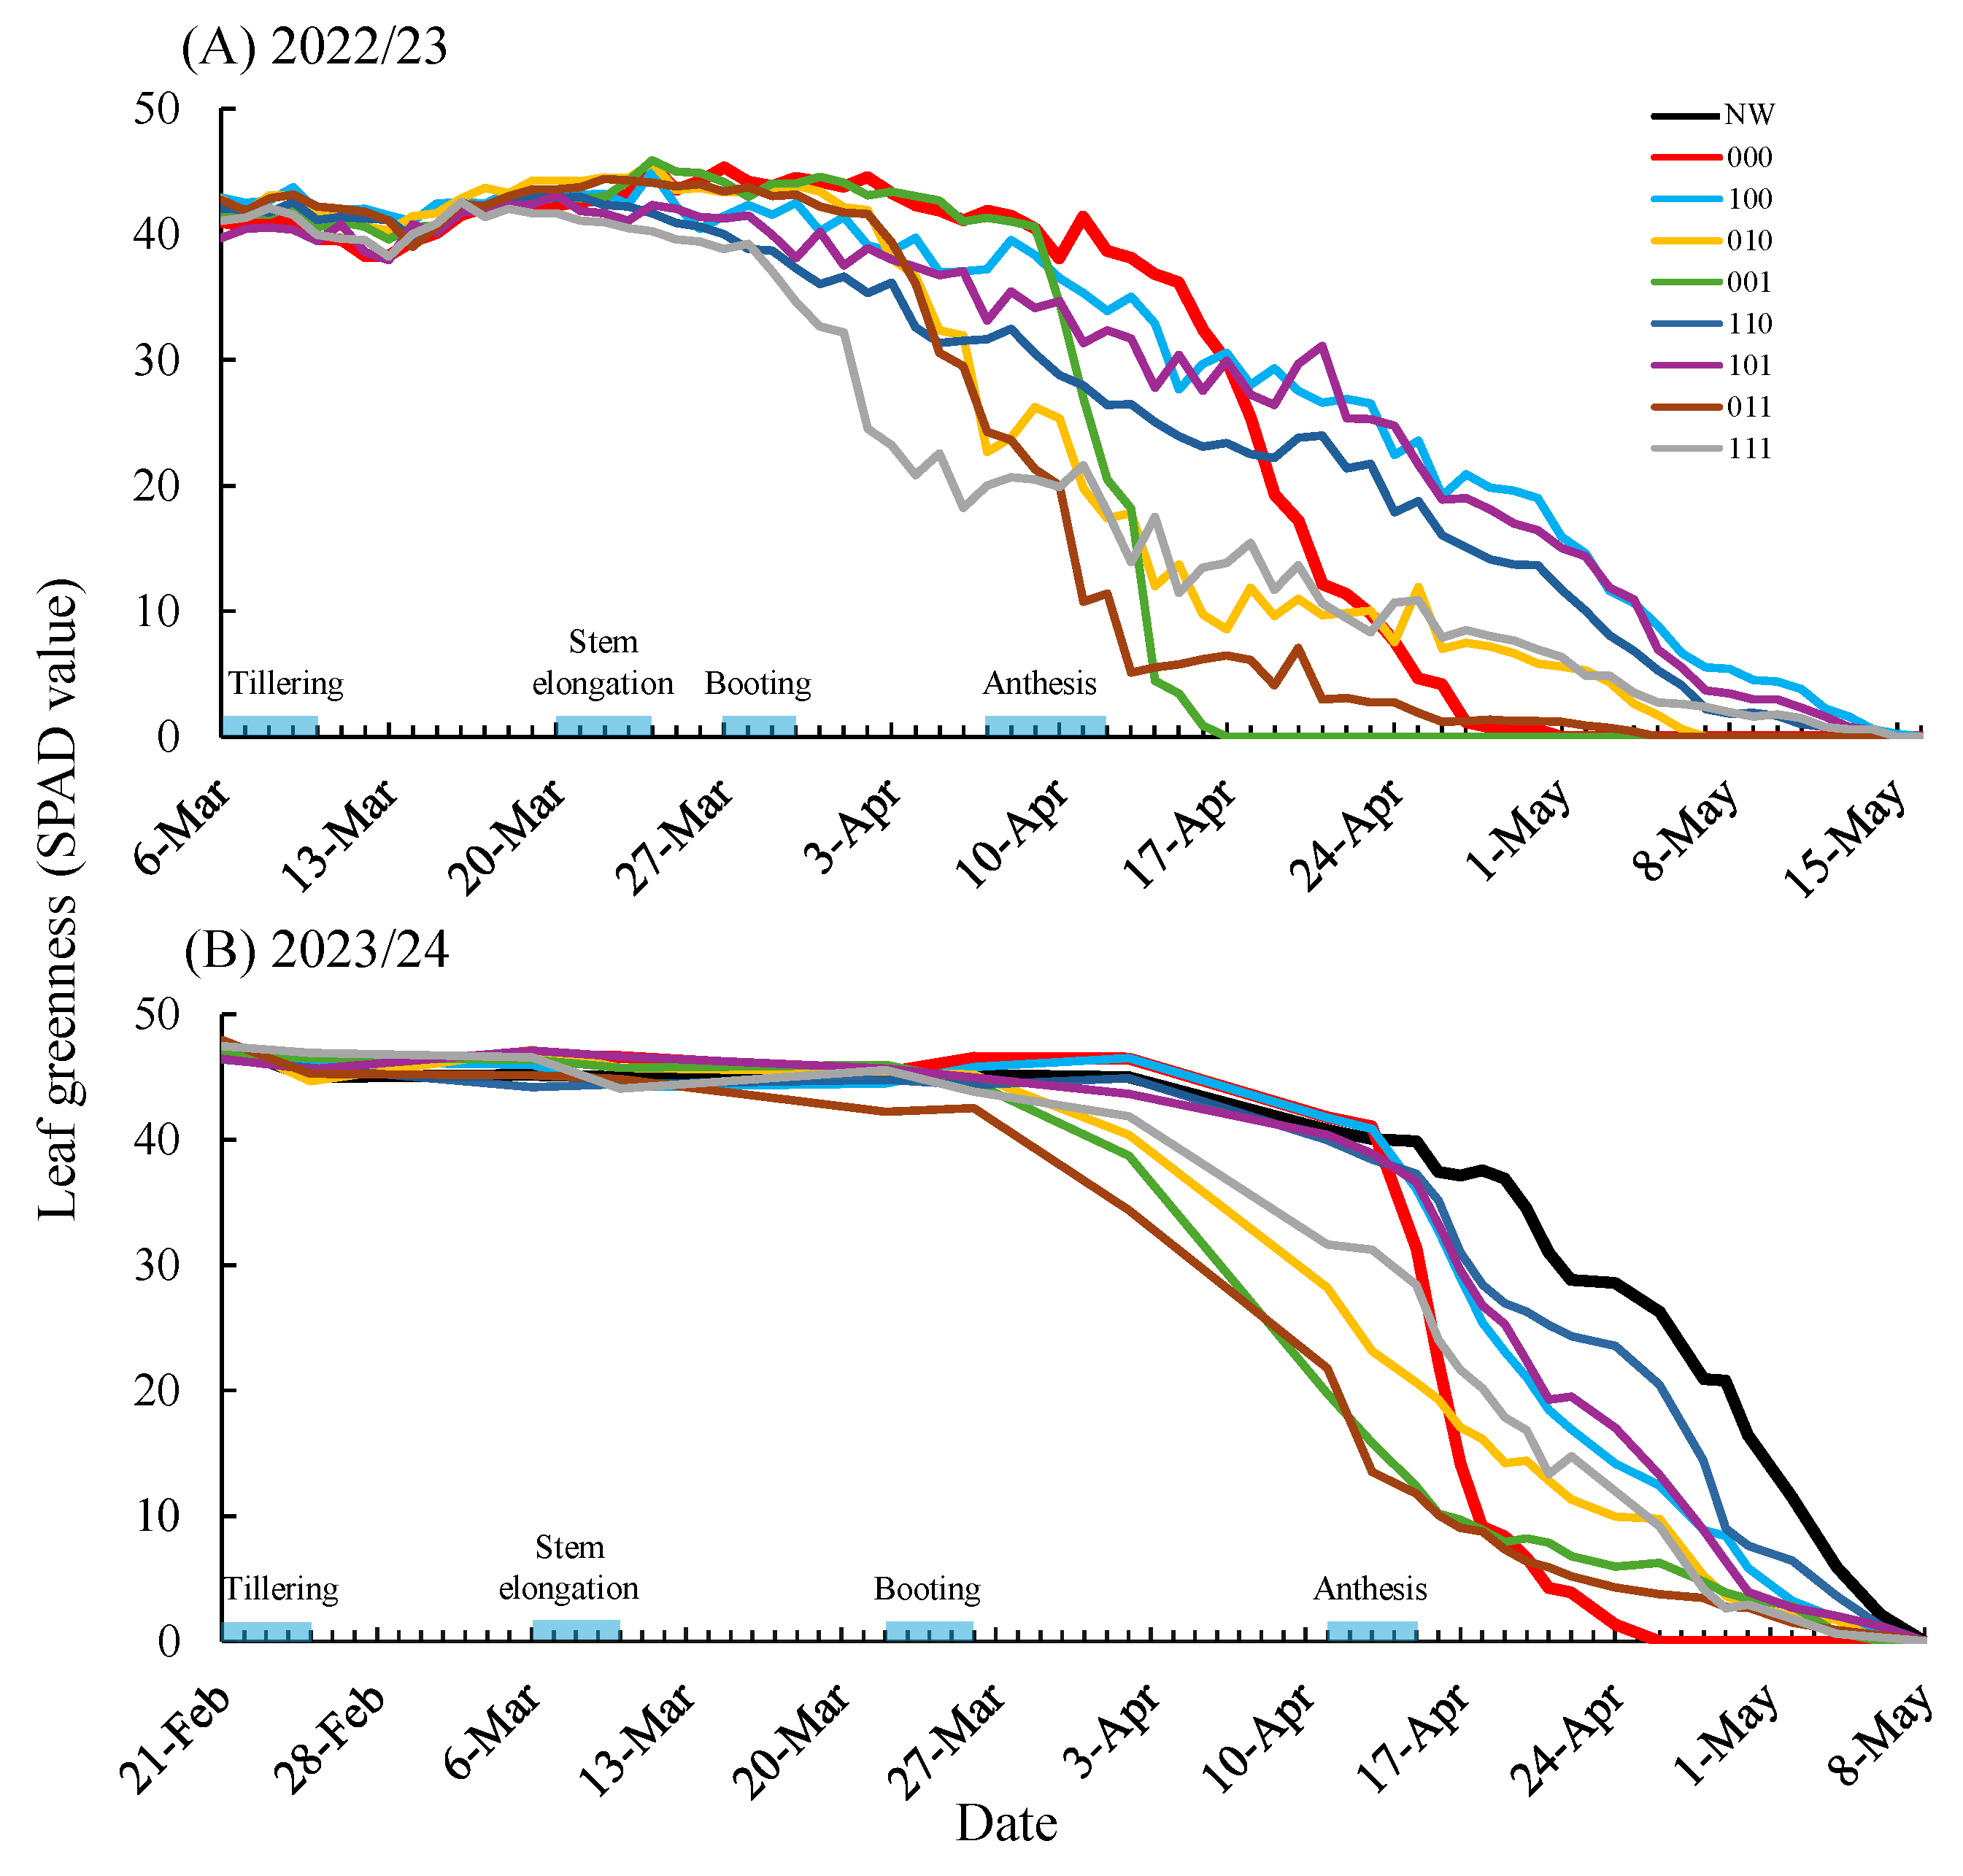
SPAD values of the uppermost fully expanded leaf or flag leaf with average leaf color in each pot were measured over time from the initiation of the tillering-stage memory treatment until complete leaf senescence using a portable chlorophyll meter (SPAD-502Plus, Konica Minolta Inc., Japan). Measurements were taken at the distal, medial, and basal regions of each leaf, and the mean of the three readings was used as the representative value.
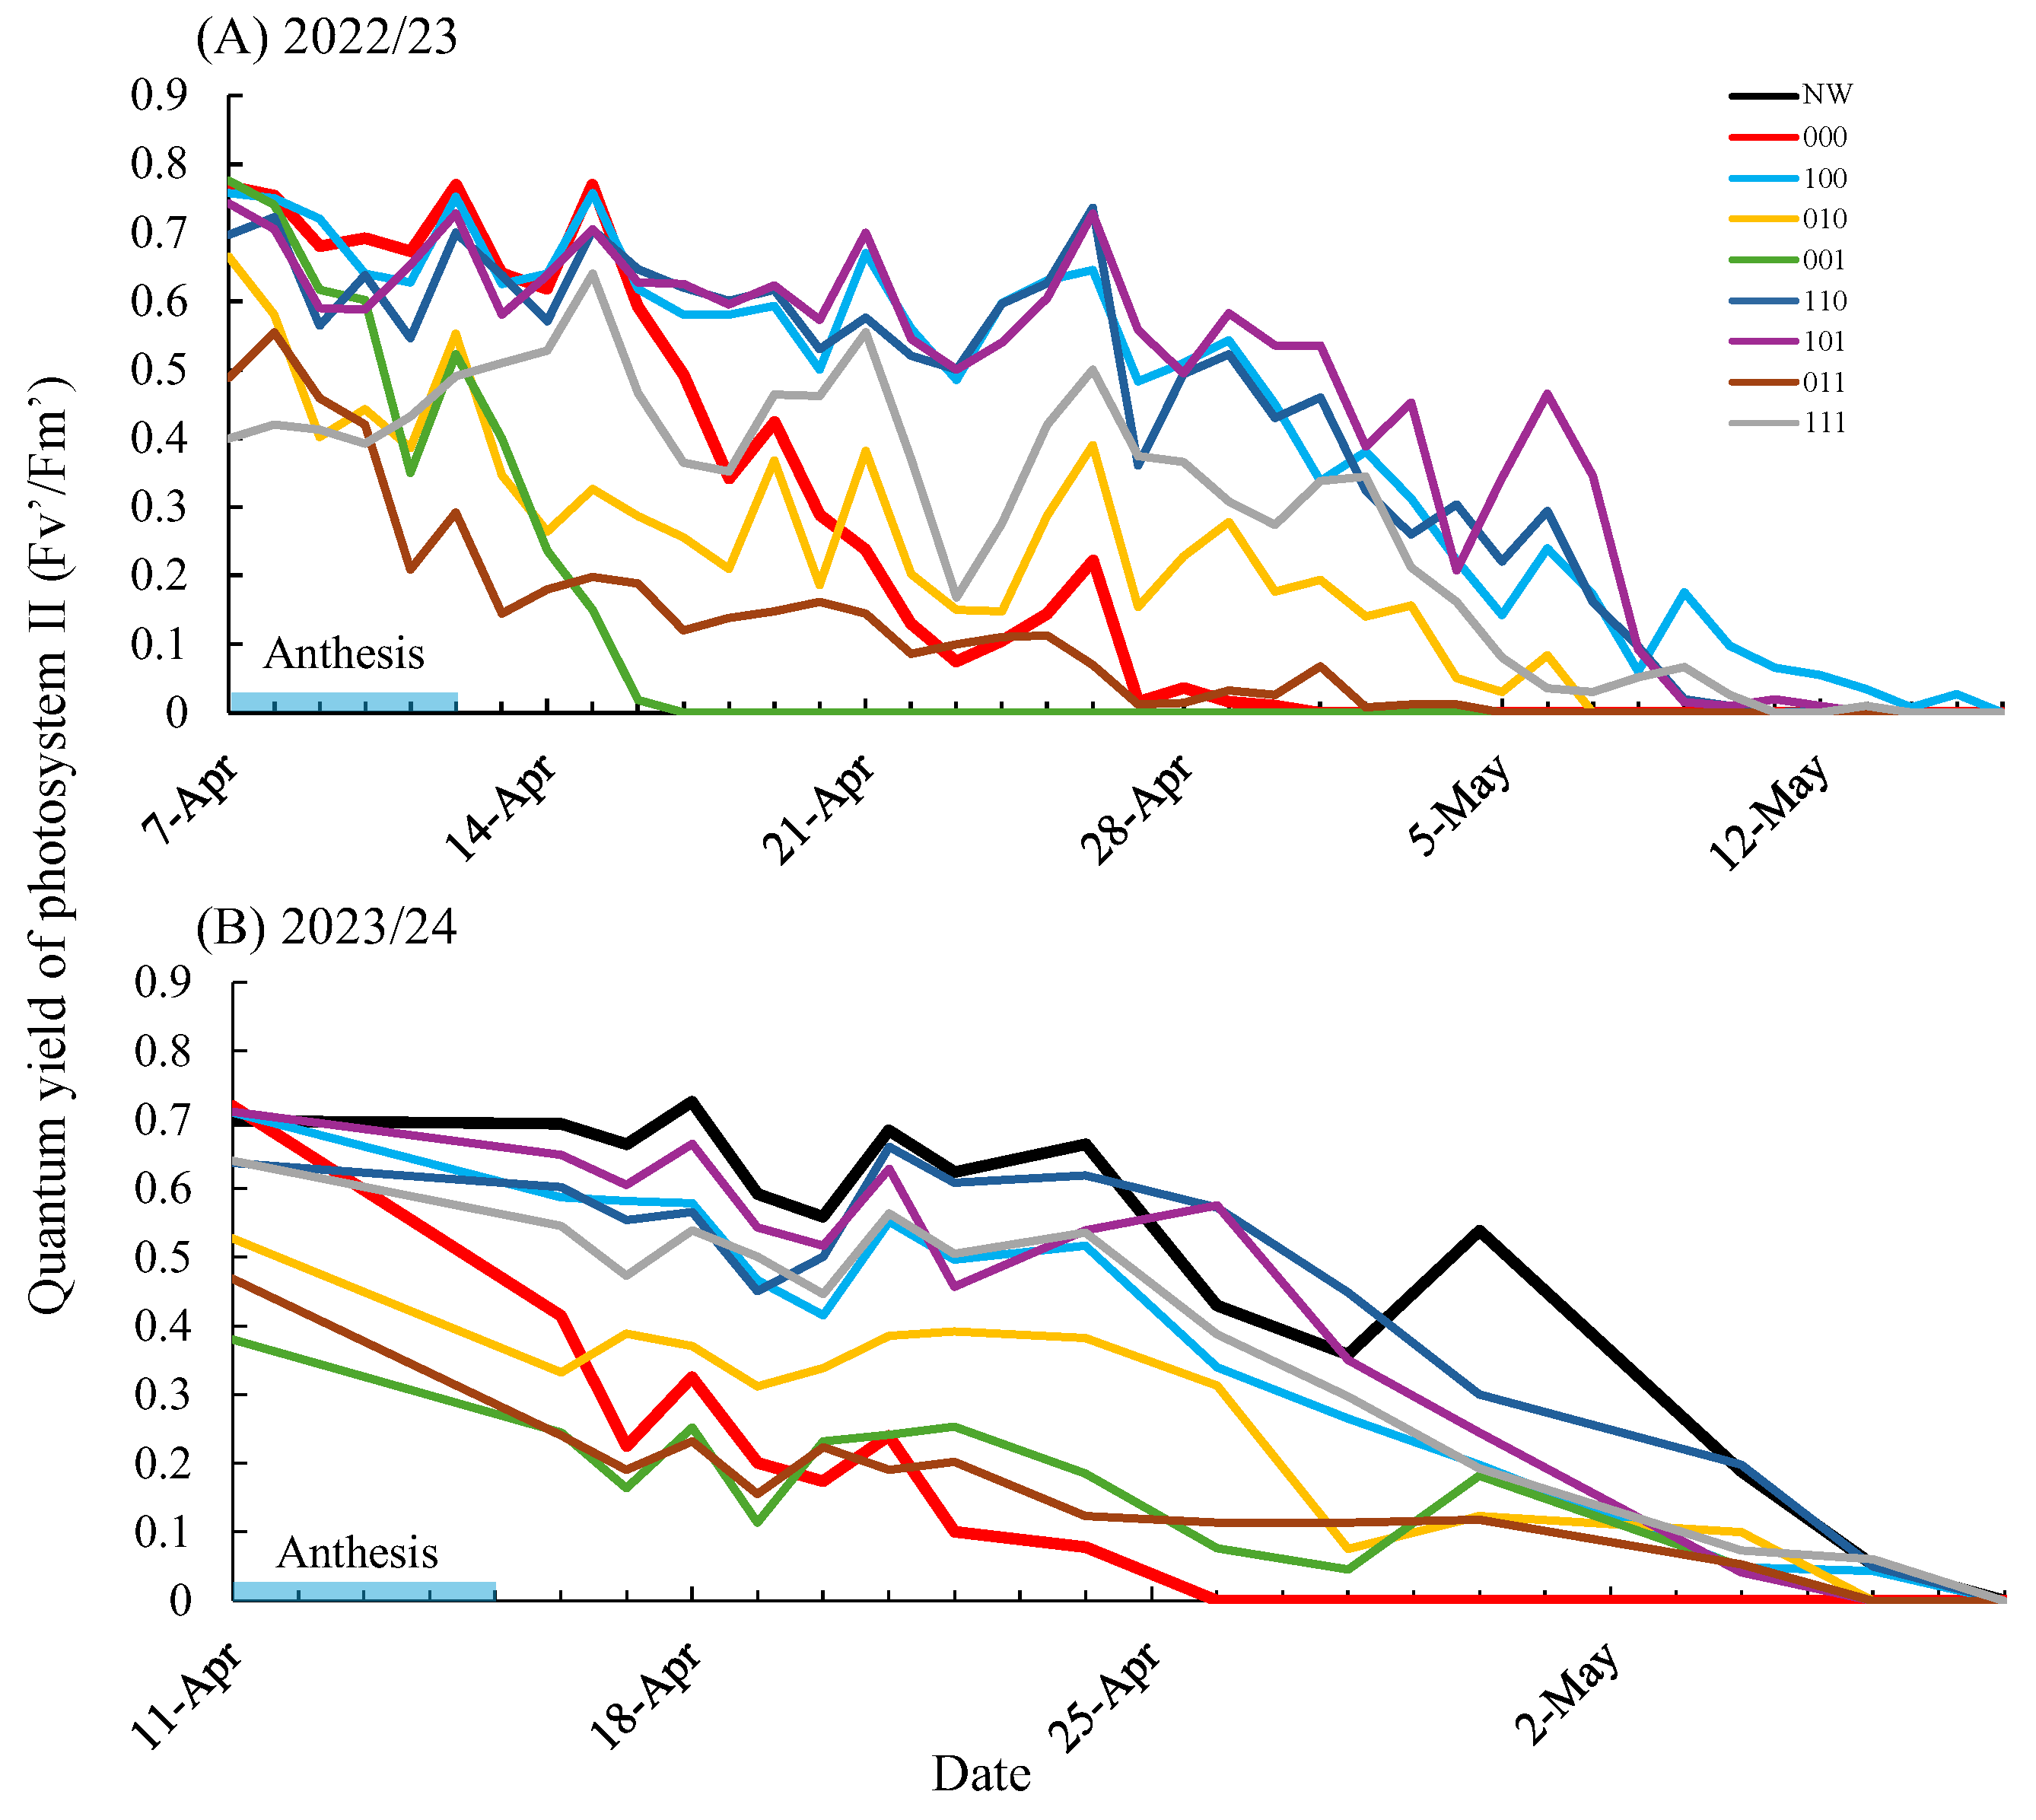
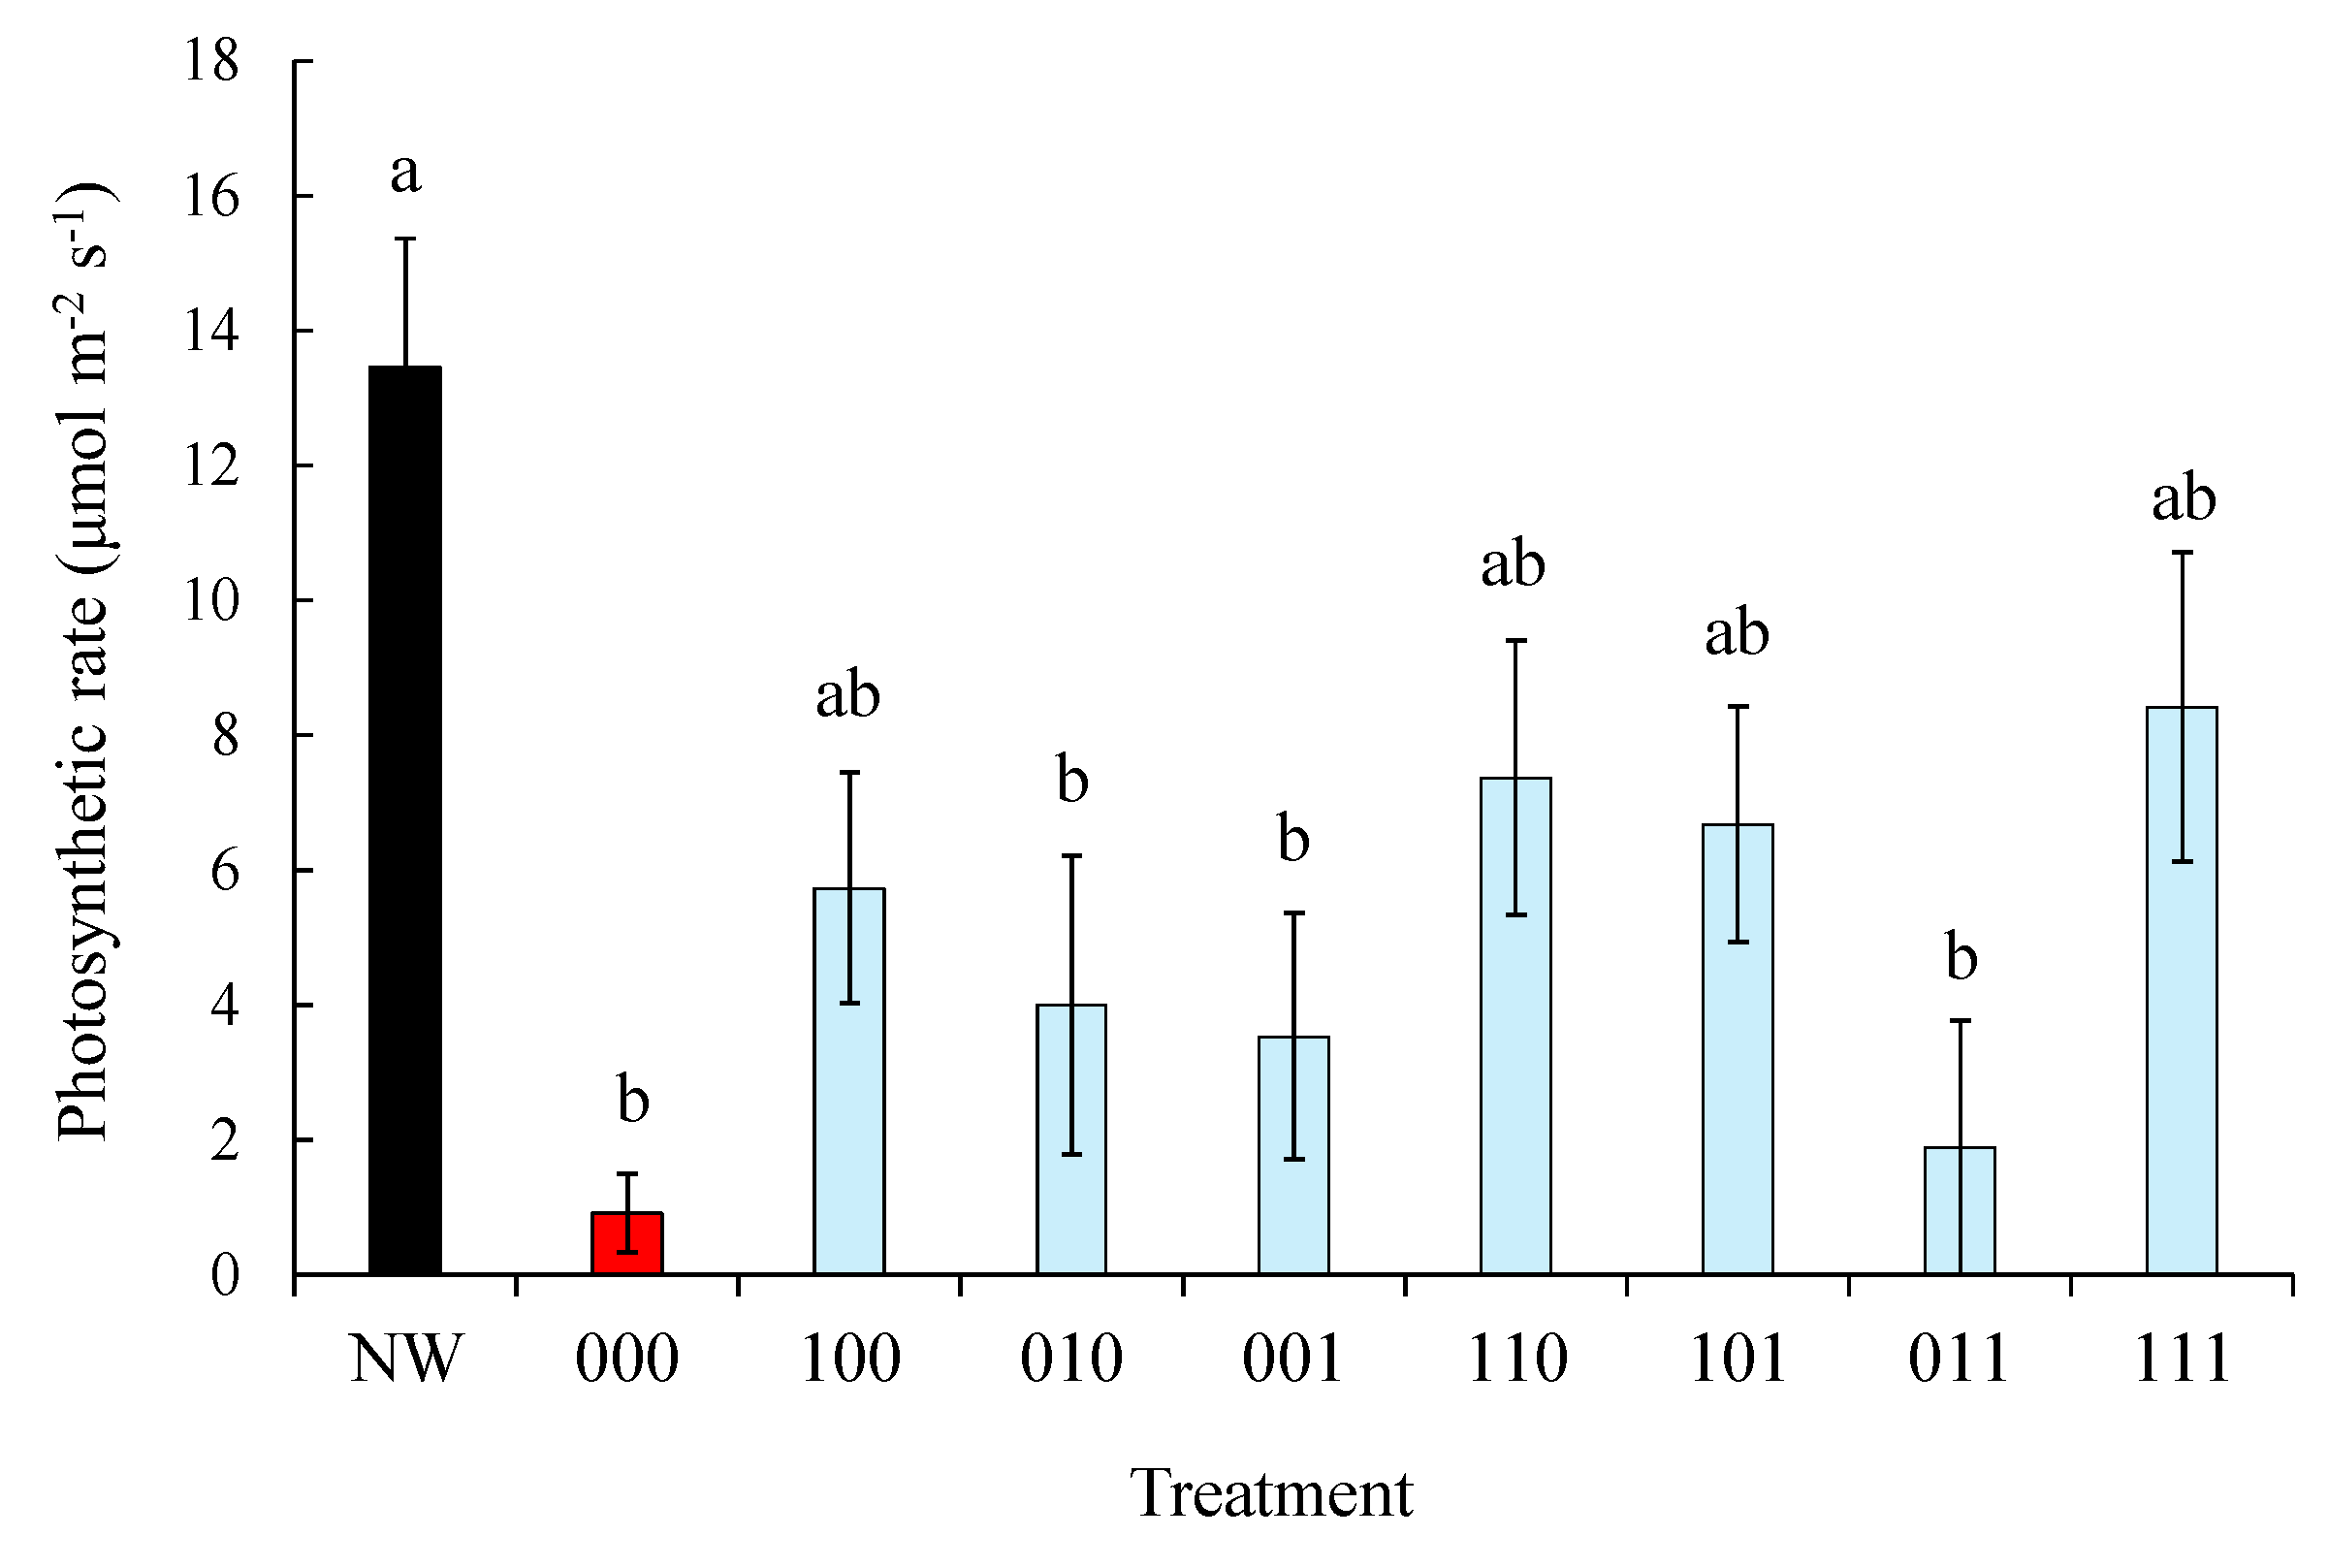
The quantum yield of photosystem II (Fv′/Fm′) was measured from the onset of waterlogging stress during flowering until leaf senescence using a portable chlorophyll fluorometer (PAR E-FP110/S, PSI, Czech Republic). Measurements were conducted under natural light between 08:00 and 12:00 on the middle portion of the flag leaf in each pot. Photosynthetic rate was measured only in the 2023/24 season. On 17 April 2024, measurements were taken from the middle portion of the flag leaf using a photosynthetic rate measurement device (MIC-100, Masa International Corp., Japan).
Sampling was conducted twice, during grain filling and at harvest. In 2022/23, three plants from an average hill were sampled from each pot during grain filling on 24 April 2023 (12 days after removal of waterlogging stress during flowering). In 2023/24, sampling was conducted on 25 April 2024 (10 days after stress removal). Samples were oven-dried at 80 °C for 3 days. In 2022/23, culms + leaf sheaths, leaves, and grains were weighed. In 2023/24, culms + leaf sheaths, lower leaves, flag leaf, glumes + rachis, and grains were measured. At maturity, four hills (three and two plants per hill in 2022/23 and 2023/24, respectively) were sampled, air-dried at room temperature. For yield evaluation, two hills with average spike weight were selected from the four hills. In 2022/23, only the main culm was used since less appearance of tillers, whereas in 2023/24 both the main culm and tillers were used to assess grain yield per plant, grain number per spike and thousand-grain weight.
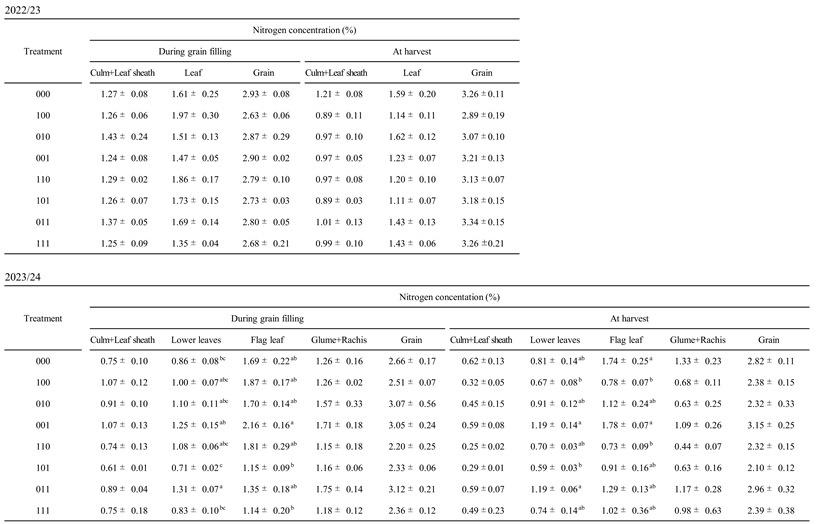
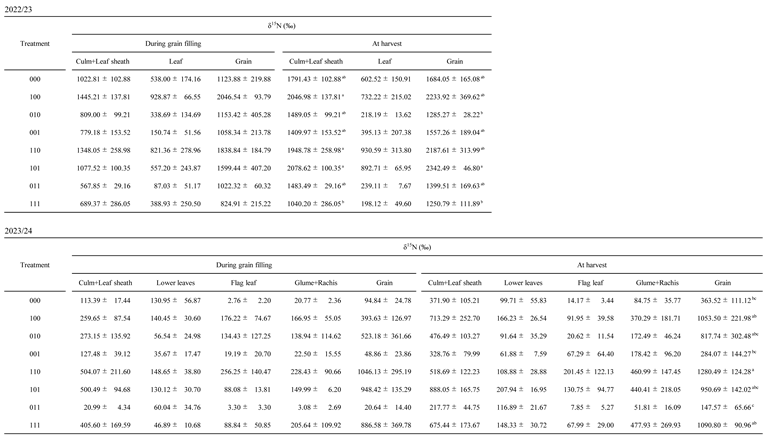
After dry weight determination, dried samples of each component were ground with a pulverizer (WB-1, Osaka Chemical Co. Ltd., Japan) to determine nitrogen concentration (Table A2) and nitrogen stable isotope composition (δ15N, 
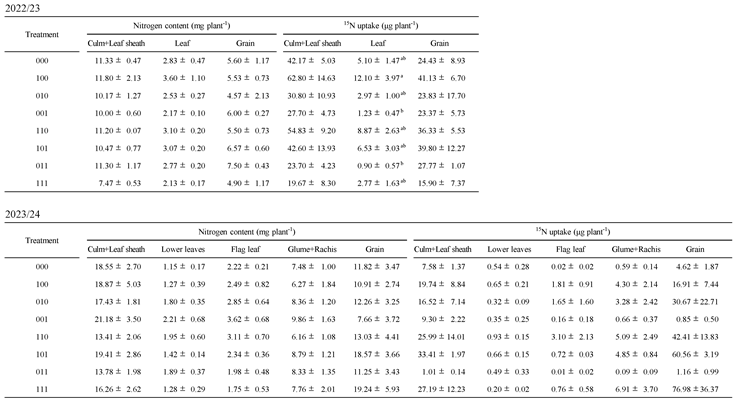
Table A3) . Nitrogen concentration (%) was measured using a C/N analyzer (JM1000CN, J-Science, Japan) and multiplied by dry weight to calculate nitrogen content (mg plant⁻¹). Isotopic composition was determined using a stable isotope ratio mass spectrometer (EA IsoLink CN and DELTA V Advantage, Thermo Fisher Scientific, USA) after encapsulation of powdered samples in tin cups. Total 15N uptake was calculated by multiplying total nitrogen content by the difference between sample 15N atom% and the natural abundance (0.3663 atom%), following [25]. The 15N allocation ratio for each component was calculated as the proportion of total aboveground 15N uptake. Nitrogen-related parameters were measured for three replicates with average thousand-grain weight.

2.3. Statistical Analysis

Statistical analyses were performed using SPSS Statistics 29 (IBM Corp., USA). Differences among treatments were evaluated by one-way analysis of variance (ANOVA), and Tukey’s honestly significant difference (HSD) test was used for multiple comparisons when significant effects were detected. Pearson’s correlation coefficient was used to assess relationships between variables. The significance level was set at p < 0.05 for all tests.

3. Results

3.1. Leaf Senescence (Chlorosis and Necrosis)

Treatment 000, which did not receive any waterlogging stress memory treatment, showed the highest SPAD values in flag leaves at the onset of waterlogging stress during flowering in both seasons (2022/23 and 2023/24). However, SPAD values declined sharply after the onset of waterlogging, beginning 4 days after stress initiation in 2022/23 (Figure 3A) and throughout the stress period in 2023/24 (Figure 3B). As shown in Figure 2B,D, many leaves below the flag leaf in treatment 000 had already yellowed or withered 10 days (2022/23) and 5 days (2023/24) after removal of waterlogging stress. Treatment 000 exhibited the second earliest complete leaf senescence in 2022/23 and the earliest in 2023/24 among all treatments.
In contrast, treatments that received waterlogging stress memory maintained higher SPAD values for a longer period than treatment 000, resulting in delayed final senescence. In particular, treatments 100, 110, and 101, which included waterlogging stress memory during the tillering stage, showed pronounced maintenance of SPAD values in both seasons. Conversely, treatments 001 and 011, which received waterlogging stress memory during the booting stage without during tillering stage, exhibited severe waterlogging damage before the onset of flowering (Figure 2A,B), followed by earlier declines in SPAD values than treatment 000. Treatment 111, which received waterlogging stress memory at all three stages, began senescence earliest during the booting-stage treatment period in 2022/23 and maintained low SPAD values for an extended period, although final senescence occurred later than in treatment 000. In 2023/24, SPAD values at the start of flowering-stage waterlogging were lower in treatment 111 than in treatment 000; however, treatment 111 did not show the rapid wilting observed in treatment 000 and retained leaf greenness for a longer period. Treatment 010 showed trends similar to those of treatment 111 in both seasons.
Figure 2. Aboveground appearance of wheat before and after flowering-stage waterlogging stress. (A) Aboveground appearance one day before the initiation of waterlogging stress during flowering in 2022/23. (B) Aboveground appearance 10 days after removal of waterlogging stress during flowering in 2022/23. (C) Aboveground appearance one day before the initiation of waterlogging stress during flowering in 2023/24. (D) Aboveground appearance 5 days after removal of water-logging stress during flowering in 2023/24. NW means non-waterlogged control during cultivation.
Preprints 192594 g002
Figure 3. Changes in leaf greenness (SPAD values) of the uppermost fully expanded leaf or flag leaf from tillering stage to complete senescence in 2022/23 (A) and 2023/24 (B). Blue horizontal bars indicate periods of waterlogging stress memory treatments and flowering-stage waterlogging stress. NW means non-waterlogged control during cultivation.
Preprints 192594 g003

3.2. Photosynthetic Performance

The quantum yield of photosystem II (Fv’/Fm’) varied with weather conditions on measurement days; however, overall seasonal trends were similar to those observed for SPAD values in both years (Figure 4). Treatment 000 showed the highest Fv’/Fm’ at the onset of flowering-stage waterlogging but exhibited a precipitous decline in both seasons and became the first treatment to reach complete senescence and become unmeasurable, except for treatment 001 in 2022/23. In contrast, treatments 100, 110, and 101, which included tillering-stage stress memory, maintained relatively high Fv’/Fm’ values throughout the observation period. Treatments 010 and 111 showed similar trends to each other, particularly in 2022/23. Treatments 001 and 011 exhibited consistently low values in both seasons and became unmeasurable later than treatment 000, except for treatment 001 in 2022/23.
Photosynthetic rate of the flag leaf was measured in 2023/24 on the second day after removal of flowering-stage waterlogging stress (17 April 2024; Figure 5). A non-waterlogged control (NW) was included for comparison. Photosynthetic rate in treatment 000 was reduced by 93.2% compared with the NW, confirming the strong negative effect of flowering-stage waterlogging on wheat photosynthesis. Although no significant differences were detected among the waterlogging stress memory treatments, all such treatments exhibited higher photosynthetic rates than treatment 000. Treatments 100, 110, 101, and 111, which included tillering-stage stress memory, showed photosynthetic rates that did not differ significantly from those of the NW.

3.3. Grain Yield and Its Components

Grain number per spike tended to be higher in waterlogging stress memory treatments than in treatment 000 in 2023/24, although no significant differences were detected in either season (Table 1). In contrast, thousand-grain weight in treatments 100, 110, and 101, which included tillering-stage stress memory, was significantly higher than in treatment 000 in 2022/23, with increases of 59.3%, 62.7%, and 55.9%, respectively (Table 1). In 2023/24, these treatments also showed higher thousand-grain weight than treatment 000 (increases of 32.0%, 45.9%, and 34.6%, respectively), although the differences were not statistically significant.
Grain yield was higher in all waterlogging stress memory treatments except 001 and 011 compared with treatment 000 in both seasons (Table 1). This effect was most pronounced in treatments 100, 110, and 101. In 2022/23, grain yield increased by 80.6%, 64.5%, and 54.8% in treatments 100, 110, and 101, respectively, relative to treatment 000. In 2023/24, corresponding increases were 125.8%, 159.7%, and 140.3%. Treatment 111 showed grain yield comparable to treatment 000 in 2022/23 but exhibited a 138.7% increase in 2023/24.

3.4. Nitrogen Uptake Capacity and Remobilization

Nitrogen content in grains during grain filling (10–12 days after removal of flowering-stage waterlogging) tended to be higher in treatments 101 and 011 than in treatment 000 in 2022/23; however, no significant differences among treatments were detected in either season (Table A1). In contrast, 15N uptake during grain filling was consistently higher in treatments 100, 110, and 101 than in treatment 000 across all components in both seasons. In 2023/24, treatments 010 and 111 also showed higher 15N uptake than treatment 000 in most components, except lower leaves (Table A1). At harvest, nitrogen content in culms + leaf sheaths, flag leaves, and glumes + rachis was lower in waterlogging stress memory treatments than in treatment 000 in both seasons, whereas nitrogen content in grains was higher in the stress memory treatments (Table 2). In grains, treatments 100, 110, and 101 showed notably higher values than treatment 000 in both years. Patterns of 15N uptake were similar to those of nitrogen content (Table 2). In 2022/23, 15N uptake in culms + leaf sheaths and leaves was lower in waterlogging stress memory treatments than in treatment 000, whereas grain 15N uptake was higher in treatments 100, 110, and 101, with a significant increase in treatment 101. In 2023/24, grain 15N uptake was markedly higher in treatments 100, 110, 101, 010, and 111 than in treatment 000, and treatments 100, 110, and 101 also showed higher 15N uptake in other organs, including culms + leaf sheaths.
15N allocation ratios among plant components are shown in Figure 6. During grain filling in 2022/23, no clear differences among treatments were detected, with grain allocation ratios ranging from 35% to 50% (Figure 6). In contrast, during grain filling in 2023/24, treatments 000 and 011 showed grain allocation ratios of approximately 35–40%, whereas treatments 110, 101, and 111 exhibited higher ratios of 55–70% (Figure 6). At harvest, grain allocation ratios increased in most treatments in both seasons. In 2022/23, the grain allocation ratio was 48% in treatment 000 and 65–75% in waterlogging stress memory treatments (Figure 6). A similar pattern was observed in 2023/24, with low grain allocation ratios in treatments 000, 001, and 011 and higher ratios (80–90%) in the remaining treatments, including those that received tillering-stage stress memory (Figure 6).

3.5. Correlation Between SPAD and leaf δ15N or Thousand-Grain Weight

Significant positive correlations were observed between SPAD values of the terminal leaf during grain filling and leaf δ15N values (all leaves in 2022/23 and flag leaf in 2023/24), as well as between SPAD values of the flag leaf and thousand-grain weight, in both seasons (Figure 7).

4. Discussion

The objective of this study was to identify the most effective growth stage and optimal frequency for applying pre-flowering waterlogging stress memory treatments to mitigate waterlogging damage in wheat during flowering, and to clarify the physiological basis of this memory effect with particular emphasis on nitrogen uptake after stress removal. In this context, waterlogging stress memory is defined as the persistent physiological capacity of plants to respond more effectively to subsequent waterlogging stress following an earlier, non-lethal exposure, without implying permanent acclimation or genetic adaptation. In the current study, the use of sandy soil enabled precise and reproducible imposition of waterlogging at defined growth stages, and consistent responses were observed across two consecutive pot experiment seasons.
Plants subjected only to waterlogging during flowering (treatment 000) exhibited pronounced declines in SPAD values and accelerated senescence of the flag leaf after stress removal in both seasons (Figure 2, Figure 3 and 
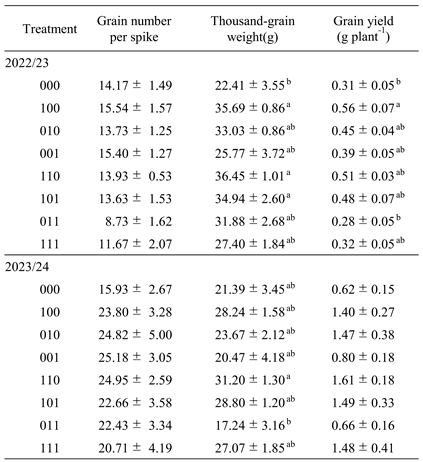
Figure 4). This early loss of photosynthetically active leaf area was associated with impaired grain filling, leading to reduced thousand-grain weight and consequently lower grain yield (Table 1). These responses are consistent with previous reports indicating that wheat is particularly vulnerable to waterlogging stress during flowering, when premature senescence constrains assimilate supply to developing grains [6,7].
In contrast, several treatments receiving waterlogging stress memory prior to flowering, most notably treatment 100, 110, and 101, showed a markedly attenuated decline in SPAD values when exposed to waterlogging at flowering, thereby delaying senescence (Figure 2 and Figure 3). Grain yield responses closely mirrored SPAD trends, with significant yield increases observed in these treatments. In the 2022/23 season, grain yield in treatment 100 was significantly higher than in 000, while in 2023/24, additional treatments (010 and 111) also showed higher yields (Table 1). Across both seasons increased thousand-grain weight was the most consistent contributor to yield improvement, particularly in treatment 100, 110, and 101. Similar increases in thousand-grain weight following waterlogging stress priming have been reported previously [21,22]. Collectively, these results indicate that waterlogging stress memory can alleviate the deterioration of grain filling typically induced by flowering-stage waterlogging.
By comparing eight treatments that combined the presence or absence of water logging stress memory at tillering, stem elongation, and booting stages, this study demonstrated that memory effects were strongest when waterlogging priming was applied during tillering, either alone (treatment 100) or in combination with subsequent stages (treatment 110 and 101). Although the tillering-stage priming in this study corresponded to the 5–6 leaf stage, earlier studies have shown that brief waterlogging at the 4-leaf stage can reduce declines in SPAD values and grain yield under later stress at heading [23] , and that repeated priming at the 4- and 6-leaf stages can mitigate reductions in photosynthesis and yield under booting-stage waterlogging [22]. In contrast, treatments primed only at booting (treatment 001 and 011) exhibited accelerated leaf senescence prior to flowering in both seasons (Figure 3 and Figure 4), with no corresponding increases in thousand-grain weight or yield (Table 1). While it was reported beneficial effects of repeated waterlogging at multiple later stages, differences in growth stage timing and stress duration likely account for these discrepancies [20]. Notably, treatment 111, which received priming at all three stages, tended to maintain leaf greenness and grain yield in 2023/24 (Figure 3 and Figure 4; Table 1). Taken together, these findings suggest that exposure to waterlogging stress during tillering is a critical component for establishing an effective stress memory that enhances tolerance from booting through flowering.
Waterlogging stress is known to reduce the quantum yield of photosystem II (Fv’/Fm’) and photosynthetic rate in wheat [26]. Consistent with this, treatment 000 showed pronounced declines in both parameters (Figure 4 and Figure 5). In contrast, treatments receiving tillering-stage priming (treatment 100, 110, and 101) maintained relatively high Fv’/Fm’ values during flowering-stage waterlogging, paralleling SPAD responses (Figure 4). Although differences in photosynthetic rate were not statistically significant, primed treatments exhibited values approximately 6–8 times higher than 000 (Figure 5). In previous studies, it is documented that a modest increase of photosynthetic rate in flowering-stage waterlogging was observed in response to waterlogging stress memory in vegetative stages of wheat [21]. These results indicate that tillering-stage waterlogging memory contributes to maintaining photosystem II function under subsequent stress, which is consistent with improved grain filling and higher thousand-grain weight.
Previous studies have proposed antioxidant capacity and/or aerenchyma formation as key components of waterlogging stress memory in wheat [21,22,23,27,
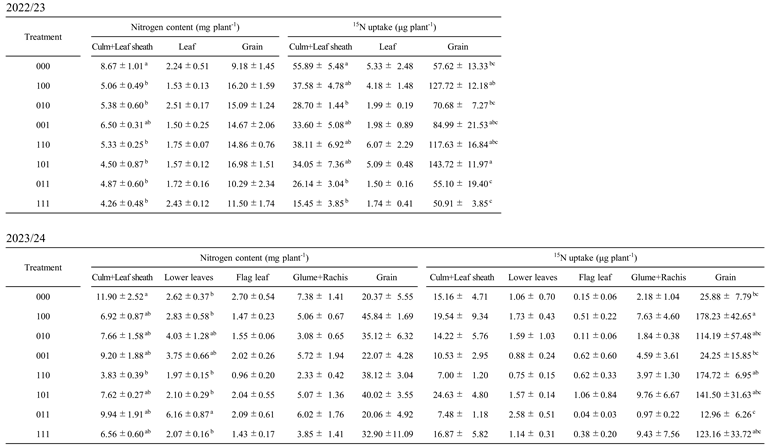
28]. Given that waterlogging after flowering is known to suppress nitrogen uptake [10], this study focused on nitrogen dynamics after stress removal using stable isotope tracers. Treatments primed during tillering (100, 110, and 101) consistently showed higher δ¹⁵N values in multiple organs during grain filling than 000 (Table A3), indicating greater nitrogen acquisition after flowering-stage waterlogging. Correspondingly, total ¹⁵N uptake, calculated from δ¹⁵N values and dry weight, was higher in these treatments both during grain filling and at harvest (Table 2 and Table A1 and Table A3). These results demonstrate that tillering-stage waterlogging memory allows wheat to sustain nitrogen uptake capacity long after the priming event, even when later exposed to waterlogging at flowering.
The persistence of this effect, observed more than 4–6 weeks after tillering-stage priming, suggests involvement of relatively stable morphological or physiological modifications in the root system. Under waterlogged conditions, wheat roots can form aerenchyma through programmed cell death, facilitating oxygen transport to root tips and supporting root function under hypoxia [29]. Previous studies have shown that brief waterlogging at early leaf stages can induce aerenchyma formation in wheat, particularly in tolerant varieties [23]., and that priming accelerates aerenchyma development during subsequent stress events [27,28]. While root anatomy was not directly assessed in the present study, the enhanced post-flowering nitrogen uptake and higher SPAD values observed in tillering-primed treatments (Table 2; Figure 3) are consistent with improved root function under waterlogging, potentially mediated by such structural adaptations.
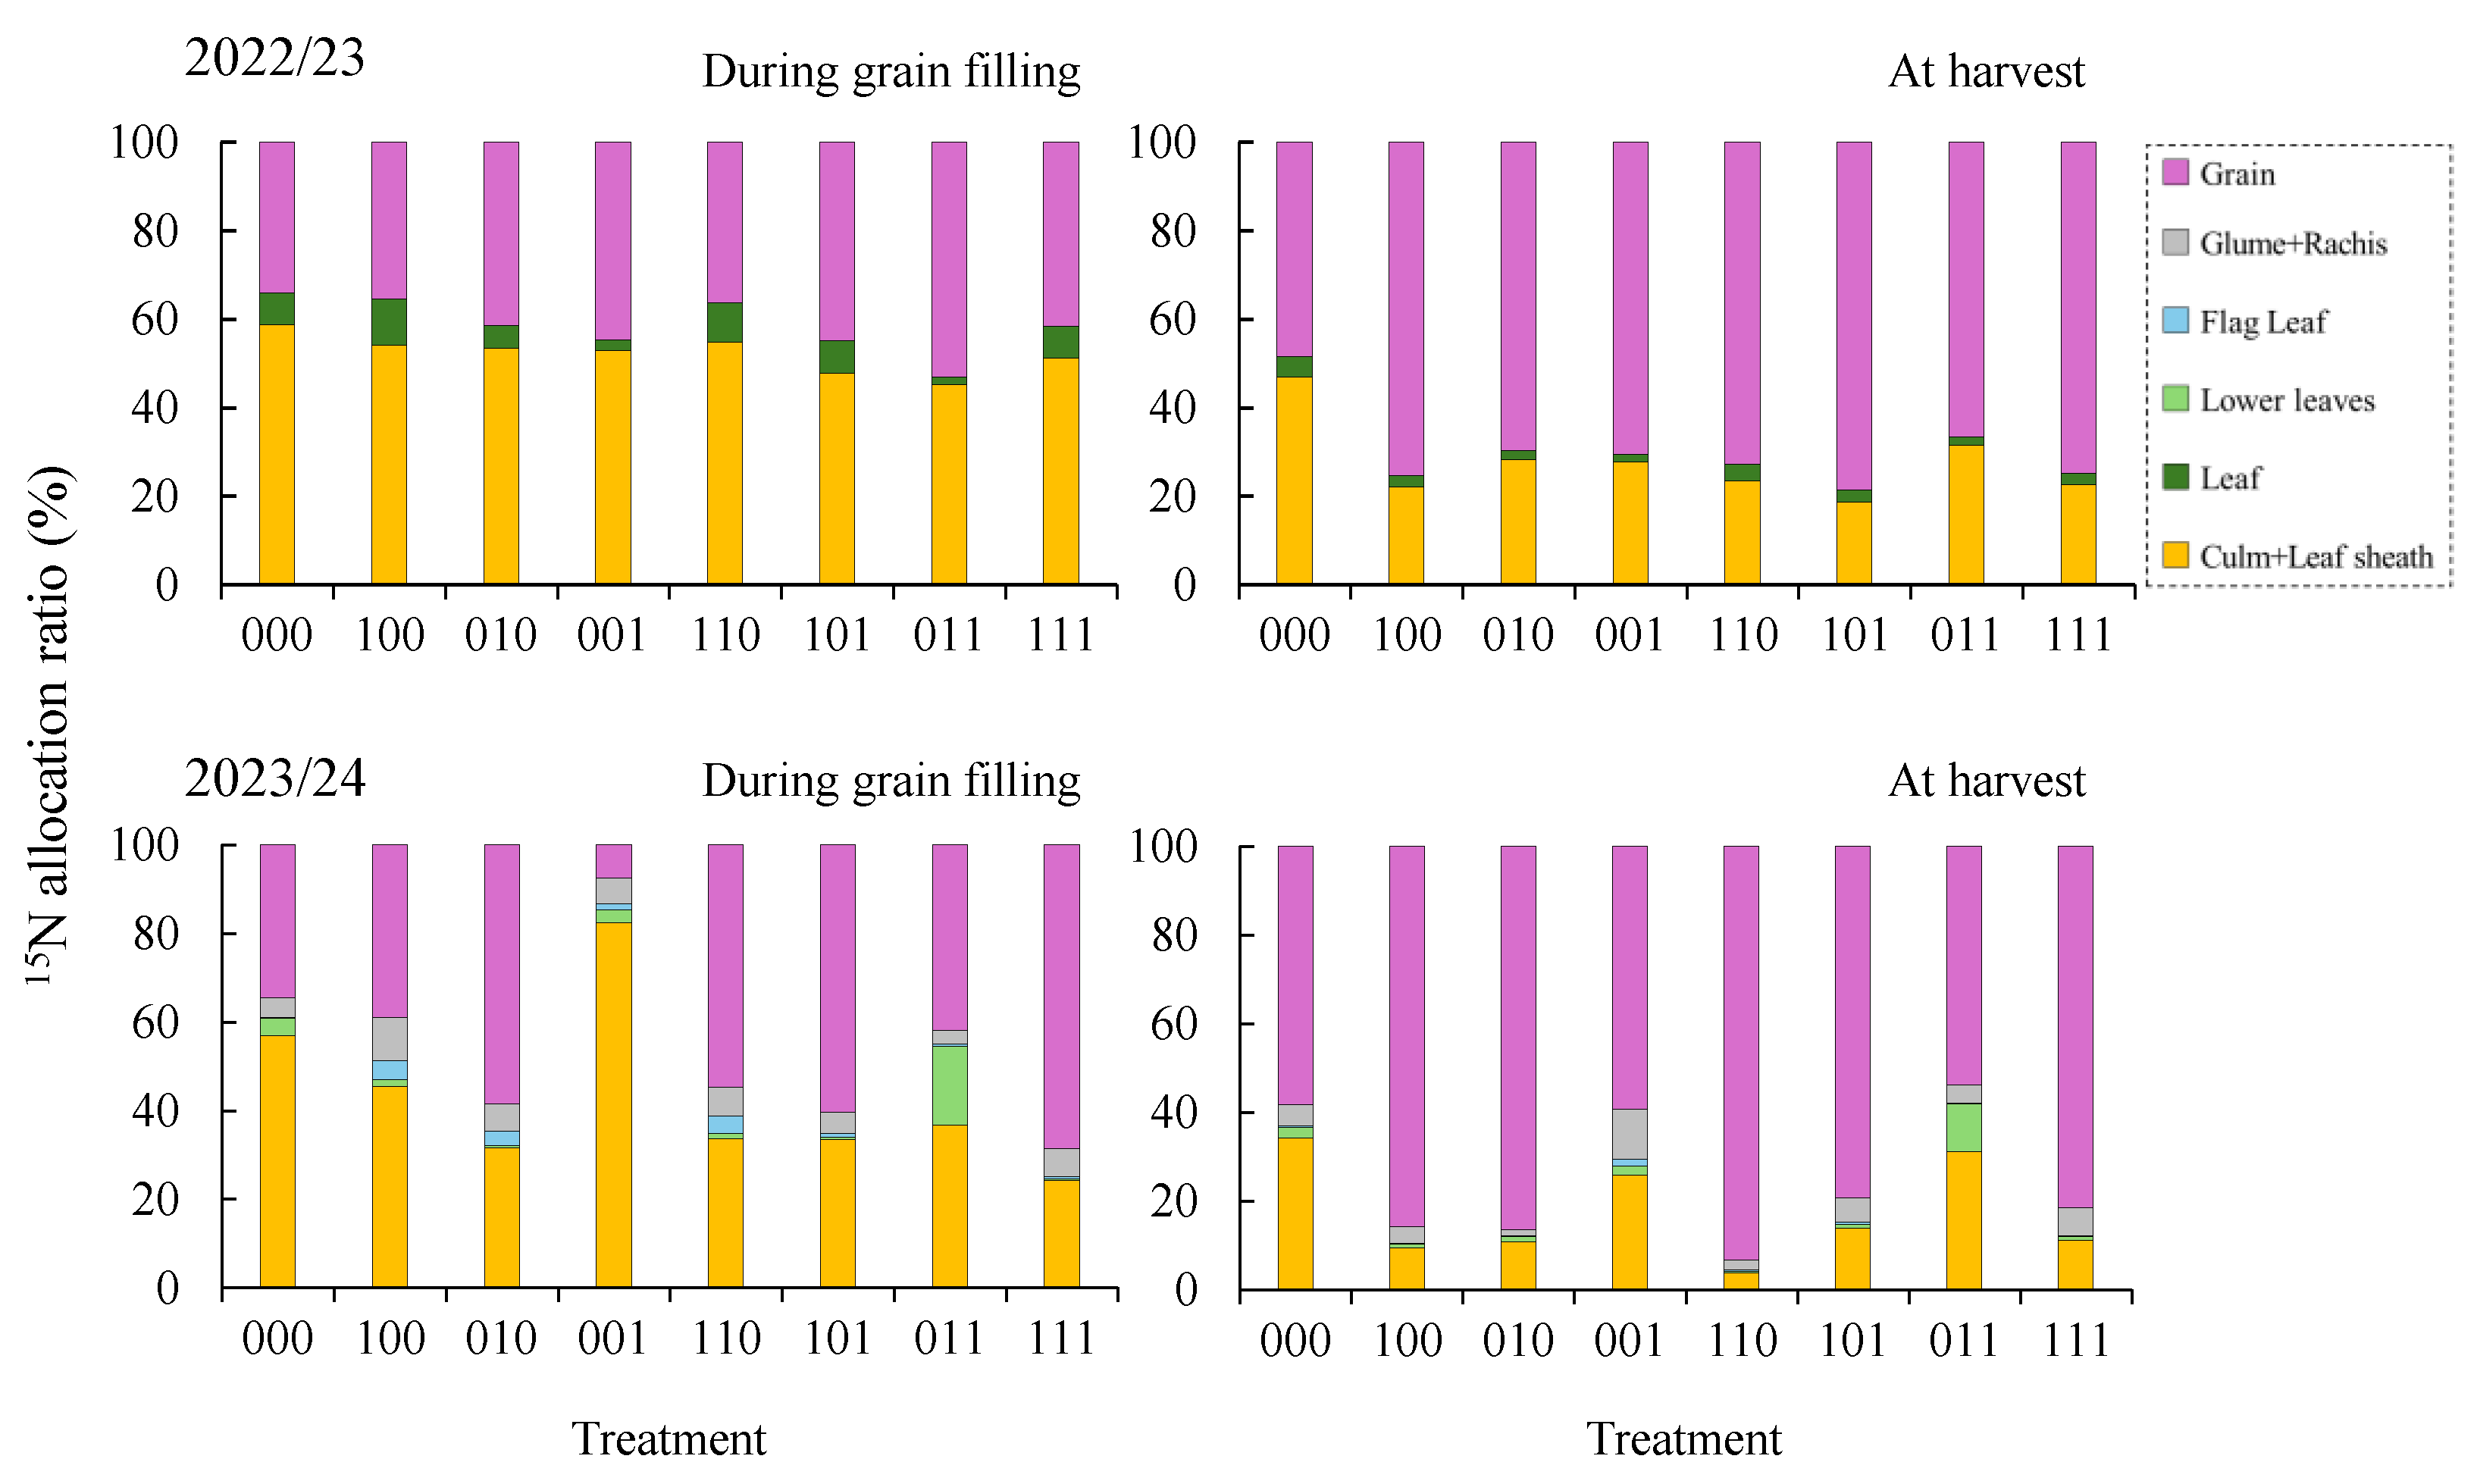
Nitrogen demand in wheat grains increases substantially after flowering [30], yet waterlogging from stem elongation to flowering can impair nitrogen uptake, translocation, and remobilization to grains [31]. A comparable phenomenon has been documented in the context of maize [32]. Analysis of ¹⁵N allocation revealed that, although treatment differences were minimal during grain filling in 2022/23, allocation to grains at harvest was consistently lower in 000 than in primed treatments (Figure 6). In 2023/24, treatments lacking tillering-stage priming (001 and 011) showed little improvement over treatment 000, whereas treatments including tillering priming exhibited higher ¹⁵N allocation to grains. These results indicate that waterlogging stress memory established during tillering contributes not only to sustained nitrogen uptake but also to the maintenance of nitrogen translocation to grains, supporting grain nitrogen accumulation under flowering-stage waterlogging.

5. Conclusion

Overall, the two-year precision pot experiments demonstrate that waterlogging stress memory induced during the tillering stage enhances wheat tolerance to subsequent waterlogging at flowering. This enhanced tolerance is closely associated with the maintenance of nitrogen uptake capacity and delayed leaf senescence, as supported by the significant positive correlations between flag-leaf SPAD values and δ¹⁵N during grain filling, and between SPAD values and thousand-grain weight (Figure 7). Despite differences in sowing dates, fertilization regimes, and weather conditions etc. between seasons, treatments 100, 110, and 101 consistently showed superior performance, indicating that tillering-stage priming produces robust and reproducible effects. From an agronomic perspective, these findings suggest that early-stage waterlogging events, if managed appropriately, may condition wheat plants to better withstand later waterlogging during flowering. Further studies under field conditions, particularly in waterlogging-prone systems such as converted paddy fields, will be essential to evaluate the practical applicability of waterlogging stress memory-based wheat management strategies.

Author Contributions

Conceptualization, W.T.; Methodology, W.T.; formal analysis, M.K.; investigation, M.K.; resources, W.T.; data curation, M.K.; writing—original draft preparation, M.K. and W.T.; writing—review and editing, W.T.; visualization, M.K. and W.T.; supervision, W.T.; project administration, W.T.; funding acquisition, W.T. All authors have read and agreed to the published version of the manuscript.”

Funding

This research was partly supported by JSPS KAKENHI Grant Numbers JP20K05999 and JP24K08859.

Data Availability Statement

The original contributions presented in this study are included in the article. Further inquiries can be directed to the corresponding author.

Acknowledgments

We are deeply grateful to Professor Takeshi Yamaguchi, Tottori University and Professor Tadashi Takahashi, Yamaguchi University, for their valuable comments and suggestions before and during the experiment.

Conflicts of Interest

The authors declare no conflicts of interest.

Abbreviations

The following abbreviations are used in this manuscript:
15N Nitrogen stable isotope
δ15N Nitrogen stable isotope composition
Fv′/Fm′ Quantum yield of photosystem II

Appendix A

Appendix A.1

Table A1. Nitrogen content and 15N uptake in plant components during grain filling in 2022/23 and 2023/24.
Preprints 192594 i003

Appendix A.2

Table A2. Nitrogen concentration in plant components during grain filling and at harvest in 2022/23 and 2023/24.
Preprints 192594 i004

Appendix A.3

Table A3. Grain yield and its components under different waterlogging stress memory treatments in 2022/23 and 202Nitrogen stable isotope composition (d15N) in each plant component during grain filling and at harvest in 2022/23 and 2023/24.
Preprints 192594 i005

References

  1. Donat, M. G.; Angélil, O.; Ukkola, A.M. Intensification of precipitation extremes in the world’s humid and water-limited regions. Environ. Res. Lett. 2019, 14, 065003. [Google Scholar] [CrossRef]
  2. Zhang, Y.; Chen, X.; Geng, S.; Zhang, X. A review of soil waterlogging impacts, mechanisms, and adaptive strategies. Front. Plant Sci. 2025, 16, 1545912. [Google Scholar] [CrossRef] [PubMed]
  3. Hossain, M.A.; Uddin, S.N. Mechanisms of waterlogging tolerance in wheat: Morphological and metabolic adaptations under hypoxia or anoxia. Aust. J. Crop Sci. 2011, 5, 1094–1101. [Google Scholar]
  4. Kawaguchi, K. Wet Injury of Wheat in Upland Field Converted from Paddy Field in Japan. In Proceedings of the 7th Asian Crop, Bogor, Indonesia, 27–30 September 2011; Science Association Conference; pp. 147–152. [Google Scholar]
  5. Cannell, R.Q.; Belford, R.K.; Gales, K.; Dennis, C.W; Prew, R.D. Effects of waterlogging at different stages of development on the growth and yield of winter wheat. J. Sci. Food Agri 1980, 31, 117–132. [Google Scholar] [CrossRef]
  6. Araki, H.; Hamada, A.; Hossain, M.A.; Takahashi, T. Waterlogging at jointing and/or after anthesis in wheat induces early leaf senescence and impairs grain filling. Field Crops Res. 2012, 137, 27–36. [Google Scholar] [CrossRef]
  7. de San Celedonio, R.P.; Abeledo, L.G.; Miralles, D.J. Identifying the critical period for waterlogging on yield and its components in wheat and barley. Plant Soil 2014, 378, 265–277. [Google Scholar] [CrossRef]
  8. Hossain, M.A.; Araki, H.; Takahashi, T. Poor grain filling induced by waterlogging is similar to that in abnormal early ripening in wheat in Western Japan. Field Crops Res. 2011, 123, 100–108. [Google Scholar] [CrossRef]
  9. Distelfeld, A.; Avni, R.; Fischer, A.M. Senescence, nutrient remobilization, and yield in wheat and barley. J. Exp. Bot. 2014, 65, 3783–3798. [Google Scholar] [CrossRef]
  10. Zhou, B.; Serret, M.D.; Pie, J.B.; Shah, S.S.; Li, Z. Relative contribution of nitrogen absorption, remobilization, and partitioning to the ear during grain filling in Chinese winter wheat. Front. Plant Sci. 2018, 9, 01351. [Google Scholar] [CrossRef]
  11. Jiang, D.; Fan, X.; Dai, T.; Cao, W. Nitrogen fertiliser rate and post-anthesis waterlogging effects on carbohydrate and nitrogen dynamics in wheat. Plant Soil 2008, 304, 301–314. [Google Scholar] [CrossRef]
  12. Sinclair, T.R.; de Wit, C.T. Analysis of the carbon and nitrogen limitations to soybean yield. Agron. J. 1976, 68, 319–322. [Google Scholar] [CrossRef]
  13. Sakuraba, Y. Molecular basis of nitrogen starvation-induced leaf senescence. Front. Plant Sci. 2022, 13, 1013304. [Google Scholar] [CrossRef] [PubMed]
  14. Bruce, T.J.A.; Matthes, M.C.; Napier, J.A.; Pickett, J.A. Stressful memories of plants: evidence and possible mechanisms. Plant Sci. 2007, 173, 603–608. [Google Scholar] [CrossRef]
  15. Liu, H.; Able, A.J.; Able, J.A. Priming crops for the future: rewiring stress memory. Trends Plant Sci. 2022, 27, 699–716. [Google Scholar] [CrossRef] [PubMed]
  16. Sharma, M.; Kumar, P.; Verma, V.; Sharma, R.; Bhargava, B.; Irfan, M. Understanding plant stress memory response for abiotic stress resilience: Molecular insights and prospects. Plant Physiol. Biochem. 2022, 179, 10–24. [Google Scholar] [CrossRef] [PubMed]
  17. Siddique, A.; Parveen, S.; Rahman, M.Z.; Rahman, J. Revisiting plant stress memory: mechanisms and contribution to stress adaptation. Physiol. Mol. Biol. Plants 2024, 30, 349–367. [Google Scholar] [CrossRef]
  18. Aswathi, K.P.R.; Ul-Allah, S.; Puthur, J.T.; Siddique, K.H.M.; Frei, M.; Farooq, M. The Plant Mind: Unraveling Abiotic Stress Priming, Memory, and Adaptation. Physiol. Plant. 2025, 177, e70372. [Google Scholar] [CrossRef]
  19. Agualongo, D.A.P; Da-Silva, C.J.; Garcia, N.; de Oliveira, F.K.; Shimoia, E.P.; Posso, D.A.; de Oliveira, A.C.B.; de Oliveira, D.D.C.; do Amarante, L. Waterlogging priming alleviates the oxidative damage, carbohydrate consumption, and yield loss in soybean (Glycine max) plants exposed to waterlogging. Funct. Plant Biol. 2022, 49, 1029–1042. [Google Scholar] [CrossRef]
  20. Zhou, R.; Jiang, F.; Yu, X.; Abdelhakim, L.; Li, X.; Rosenqvist, E.; Ottosen, C.; Wu, Z. Dominant and priming role of waterlogging in tomato at e[CO2] by multivariate analysis. Int. J. Mol. Sci. 2022, 23, 12121. [Google Scholar] [CrossRef]
  21. Li, C.; Jiang, D.; Wollenweber, B.; Li, Y.; Dai, T.; Cao, W. Waterlogging pretreatment during vegetative growth improves tolerance to waterlogging after anthesis in wheat. Plant Sci. 2011, 180, 672–678. [Google Scholar] [CrossRef]
  22. Zhang, Y.F.; Wang, X.; Malko, M. M.; Zhou, Q.; Cai, J.; Zhong, Y.; Huang, M.; Jiang, D. Unravelling the long-term beneficial effects of stress priming-induced tolerance to waterlogging stress in wheat. Plant Growth Regul. 2025, 105, 2067–2084. [Google Scholar] [CrossRef]
  23. Jin, N.; Cai, Z.; Ye, L.; Shen, Q.; Zhang, G.; Xu, Z. Improvement of waterlogging tolerance in wheat by the stress priming through inducing aerenchyma formation. Plant Growth Regul. 2025, 105, 245–255. [Google Scholar] [CrossRef]
  24. Taulemesse, F.; Le Gouis, J.; Gouache, D.; Gibon, Y.; Allard, V. Post-flowering nitrate uptake in wheat is controlled by N status at flowering, with a putative major role of root nitrate transporter NRT2.1. PLoS ONE 2015, 10, e0120291. [Google Scholar] [CrossRef] [PubMed]
  25. McNeill, A.M.; Unkovich, M.J. Estimates of N accumulated below-ground by grain legumes derived using leaf or stem 15N-feeding: in search of a practical method for potential use at remote field locations. Plant Soil 2024, 500, 721–741. [Google Scholar] [CrossRef]
  26. Pais, I.P.; Moreira, R.; Semedo, J.N.; Ramalho, J.C.; Lidon, F.C.; Coutinho, J.; Maças, B.; Scotti-Campos, P. Wheat crop under waterlogging: Potential soil and plant effects. Plants 2023, 12, 149. [Google Scholar] [CrossRef]
  27. Li, L.; Dong, X.; He, M.; Huang, M.; Cai, J.; Zhou, Q.; Zhong, Y.; Jiang, D.; Wang, X. Unravelling the role of adventitious roots under priming-induced tolerance to waterlogging stress in wheat. Environ. Exp. Bot. 2023, 216, 105516. [Google Scholar] [CrossRef]
  28. Zhang, Y.; Wang, X.; Malko, M.M.; Zhou, Q.; Cai, J.; Zhong, Y.; Huang, M.; Jiang, D. The physiological mechanisms of waterlogging priming on aerenchyma formation in secondary roots of wheat under waterlogging stress. Environ. Exp. Bot. 2025, 237, 106207. [Google Scholar] [CrossRef]
  29. Herzog, M.; Striker, G.G.; Colmer, T.D.; Pedersen, O. Mechanisms of waterlogging tolerance in wheat—A review of root and shoot physiology. Plant Cell Environ. 2016, 39, 1068–1086. [Google Scholar] [CrossRef]
  30. Fradgley, N.S.; Bentley, A.R.; Swarbreck, S.M. Defining the physiological determinants of low nitrogen requirement in wheat. Biochem. Soc. Trans. 2021, 49, 609–616. [Google Scholar] [CrossRef]
  31. de San Celedonio, R.P.; Abeledo, L.G.; Miralles, D.J. Nitrogen accumulation and remobilisation in wheat and barley plants exposed to waterlogging at different developmental stages. Crop Pasture Sci. 2022, 73, 615–626. [Google Scholar] [CrossRef]
  32. Ren, B.; Dong, S.; Zhao, B.; Liu, P.; Zhang, J. Responses of nitrogen metabolism, uptake and translocation of Maize to water logging at different growth stages. Front. Plant Sci. 2017, 8, 01216. [Google Scholar] [CrossRef]
Figure 1. Schematic diagram of waterlogging stress memory treatments. Eight treatments were established by combining the presence or absence of waterlogging stress memory treatments at the tillering, stem elongation, and booting stages. Blue horizontal bars indicate periods during which waterlogging stress memory treatments were applied. Treatments were identified using three-digit codes, where “1” denotes the application of a stress memory treatment and “0” denotes its absence. Treatment 000 represents the control without any waterlogging stress memory treatment. All treatments were subjected to waterlogging stress during the flowering stage. In the 2023/24 season, an additional non-waterlogged (NW) control that received no waterlogging stress throughout the growing period was included for physiological measurements.
Preprints 192594 g001
Figure 4. Changes in the quantum yield of photosystem II (Fv′/Fm′) of flag leaf from anthesis to complete senescence in 2022/23 (A) and 2023/24 (B). Blue horizontal bars indicate periods of flowering-stage waterlogging stress. NW means non-waterlogged control during cultivation.
Preprints 192594 g004
Figure 5. Photosynthetic rate of flag leaves after flowering-stage waterlogging stress in 2023/24. Photosynthetic rate was measured on 17 April 2024, two days after removal of waterlogging stress during flowering. NW means non-waterlogged control during cultivation. Values represent means ± standard error (n=6). Different letters indicate significant differences at P < 0.05 according to Tukey’s HSD test.
Preprints 192594 g005
Figure 6. Allocation ratio of 15N to plant components during grain filling and at harvest in 2022/23 and 2023/24. 15N allocation ratios among plant components were evaluated for the wheat plants sampled in grain filling stage in 12 days after removal of flowering-stage waterlogging) in 2022/23, and in 10 days after removal of flowering-stage waterlogging in 2023/24.
Preprints 192594 g006
Figure 7. Relationships between SPAD values and leaf δ15N or thousand-grain weight in 2022/23 and 2023/24. Relationship between SPAD values of the flag leaf at 12 days after removal of flowering-stage waterlogging stress and δ15N of all leaves in 2022/23. Relationship between SPAD values of the flag leaf at 9 days after removal of the stress and δ15N of the flag leaf in 2023/24. Pearson’s correlation coefficient was used to test relationships between variables. ** and *** indicate significance at P < 0.01 and P < 0.001, respectively.
Preprints 192594 g007
Table 1. Grain yield and its components under different waterlogging stress memory treatments in 2022/23 and 2023/24.
Preprints 192594 i001
In the 2022/23 season, measurements were conducted using the main culm of six plants per pot, whereas in the 2023/24 season both the main culm and tillers of four plants per pot were included. Values represent means ± standard error with five replicates in 2022/23 and six replicates in 2023/24. Different letters indicate significant differences at P < 0.05 according to Tukey’s HSD test.
Table 1. Nitrogen content and 15N uptake in plant components at harvest in 2022/23 and 2023/24.
Preprints 192594 i002
In 2022/23, analyses were conducted for culms + leaf sheaths, leaves, and grains; in 2023/24, analyses included culms + leaf sheaths, lower leaves, flag leaves, glumes + rachis, and grains. Values represent means ± standard error with five replicates in 2022/23 and six replicates in 2023/24. Different letters indicate significant differences at P < 0.05 according to Tukey’s HSD test.
Disclaimer/Publisher’s Note: The statements, opinions and data contained in all publications are solely those of the individual author(s) and contributor(s) and not of MDPI and/or the editor(s). MDPI and/or the editor(s) disclaim responsibility for any injury to people or property resulting from any ideas, methods, instructions or products referred to in the content.
Copyright: This open access article is published under a Creative Commons CC BY 4.0 license, which permit the free download, distribution, and reuse, provided that the author and preprint are cited in any reuse.
Prerpints.org logo

Preprints.org is a free preprint server supported by MDPI in Basel, Switzerland.

Subscribe

Disclaimer

Terms of Use

Privacy Policy

Privacy Settings

© 2026 MDPI (Basel, Switzerland) unless otherwise stated