
Submitted:
01 January 2026
Posted:
02 January 2026
You are already at the latest version
Abstract
Maritime safety is a crucial aspect in busy and complex shipping lanes, particularly in strait areas that are prone to accidents due to high vessel traffic and dynamic envi-ronmental conditions. This study aims to calculate a maritime safety index by consid-ering various factors, including vessel characteristics, ship encounter conditions, oper-ational time parameters, and oceanographic conditions such as currents and waves. The data used consist of questionnaires, AIS data, and oceanographic information, collected over a one-month period at three-hour intervals. The case study focuses on the Bali Strait and the Lombok Strait, with spatial segmentation into grid cells to sup-port spatial analysis. The safety index is calculated using two models: Model I com-bines vessel and encounter characteristics with temporal parameters, while Model II incorporates oceanographic factors into the assessment. Following the index calcula-tion, multivariate analysis conducted to identify the key factors that significantly in-fluence maritime safety levels. The results show that navigation risks in both straits are mainly influenced by vessel traffic, sailing hours, days of the week, and environmental conditions. In the Bali Strait, the highest risks occur near Ketapang and Gilimanuk Ports, while in the Lombok Strait, Padangbai, Lembar, and the ALKI II route show ele-vated risks. Multivariate analysis reveals that longer vessels, higher speeds, and dy-namic sea conditions dominate in Lombok, whereas older vessels and closer spacing are more critical in Bali.
Keywords:
AIS data
; multivariant analysis
; oceanography
; safety index
; ship collision
1. Introduction
Navigational safety plays a vital role in the maritime sector, especially in heavily trafficked routes that present complex navigational challenges, such as those commonly found in strait regions [1,2]. Straits are narrow waterways that geographically connect two larger bodies of water and often serve as major passageways for both domestic and international vessels [3]. In Indonesia, straits such as the Malacca Strait, Bali Strait, Lombok Strait, Sunda Strait, and Makassar Strait are key maritime corridors with high levels of vessel movement [4,5,6,7]. These conditions increase the likelihood of incidents, including ship collisions, which may result in financial losses, environmental degradation, and threats to human lives [8,9].
Most ship collisions are mainly caused by human errors, such as breaking maritime traffic rules, navigation mistakes, and lack of coordination [10]. Environmental conditions, like rough seas, also increase the risk of accidents [11]. For this reason, improving maritime safety should not rely only on technical solutions, but also consider the complex and changing risk factors [12]. In busy areas like Indonesian straits, an assessment method that combines environmental conditions, traffic patterns, navigation behavior, and communication quality is important to support decision-making and reduce risks [13].
Several previous studies have developed methods for calculating safety indices by considering various factors. The study by Hasanspahić et al. [14] focused on assessing the navigation risks of tanker ships in narrow passages to reduce the chances of grounding or collisions. They used a matrix method that classified risk factors based on their probability and impact levels. Meanwhile, Yildiz et al. [15] examined navigational safety in the Istanbul and Dover Straits, which have complex geographical conditions and high traffic density. By applying GIS and Kernel Density Estimation methods, they mapped 274 maritime accidents from 2004 to 2020 and used the Chi-Square test to evaluate the relationship between ship operational conditions, accident types and severity, and the density of incident locations.
To support a broader assessment of safety, semi-quantitative approaches have also been developed. Siuta et al. [16] proposed a semi-quantitative methodology to determine a safety index. This approach includes questionnaires, calculation procedures, and graphical tools to evaluate various safety culture factors. It allows for the identification, prioritization, and benchmarking of safety culture elements across different companies and industrial sectors. The method was verified through a case study in an energy company with three locations in Poland and can be easily applied to other industries.
Furthermore, risk assessment has also been explored in the context of complex ship interactions. Shi et al. [17] applied fuzzy logic theory and the Analytic Hierarchy Process (AHP) to evaluate collision risk in multi-ship encounter situations. The method was validated using data from the Taiwan Strait, and the results showed that it can provide early warnings of multi-ship collision risks in the area. This approach offers an important basis for maritime collision risk monitoring and navigational risk assessment for maritime authorities and land-based centers managing autonomous ships.
Data-driven approaches based on historical records have also gained attention in safety evaluation. Gaggero et al. [18] proposed a comprehensive methodology to assess the safety and comfort of various types of vessels operating along specific routes in the Mediterranean Sea. The study highlighted the importance of considering weather conditions and introduced a statistical method to define safety and comfort thresholds using historical AIS data. In addition, the method analyzed traffic patterns and seakeeping performance across different vessel categories, including passenger ships, cargo vessels, and torpedo crafts.
With the advancement of technology, new approaches have also been developed to support the safety of autonomous ships [19]. Fan et al. [20] presented a comprehensive method for constructing a risk matrix specifically designed for Maritime Autonomous Surface Ships (MASS). They developed a risk matrix to visualize and manage risks associated with emerging maritime technologies. The study introduced a framework that combines probability and consequence indices using the fuzzy Analytic Hierarchy Process (AHP).
In addition, research in Indonesia has also developed models to predict accidents along national strategic routes. A study by Ratih et al. [21] applied a Bayesian Network (BN) to assess ship collision risk in the Lombok Strait, which is part of ALKI II, using accident data from 2007 to 2019. The model calculated prior, conditional, and joint probabilities to estimate the likelihood of collisions. The results showed an accuracy of 96.97%, specificity of 90%, and sensitivity of 100%. The probabilities for head-on, overtaking, and crossing collisions were 2.85 x 10⁻⁴, 1.03 x 10⁻⁵, and 6.24 x 10⁻⁵ respectively, with estimated annual frequencies of 0.000026, 0.0000031, and 0.0000015 incidents per year.
Based on the literature review presented, various methods have been applied in risk assessment calculations. However, studies that thoroughly integrate oceanographic conditions such as currents and waves, along with time-related and operational hour factors in relation to ship safety, remain limited. Therefore, this study aims to analyze vessel traffic patterns based on specific hours and time periods, calculate a safety index by considering operational time factors, and integrate internal ship characteristics, oceanographic conditions, and operational timing into the safety index calculation. In addition, multivariate analysis will be used to evaluate the significance of each potential risk factor contributing to ship safety. Through this approach, the study is expected to provide a more comprehensive understanding and improve the accuracy of safety index estimation under various operational conditions.
2. Methodology
In general, the research method used in this study is shown in Figure 1. This study uses a comprehensive approach by combining both quantitative and qualitative data, and includes various risk factors that have not been deeply explored in previous studies. The main goal is to develop a dynamic and adaptive model for assessing maritime safety index, especially in strait areas with high traffic and complex oceanographic conditions
The first step begins with selecting a strategic study area to be used as the research location. The area is chosen based on several criteria, such as high shipping activity, the diversity of vessel types passing through, and challenging oceanographic characteristics, including strong currents, and high waves [22]. To produce structured results and support more focused spatial analysis, the study area is divided into several grid segments of a certain size (for example, a 3x4 grid), so that each segment can be analyzed individually in terms of risk and safety factors.
After the study areas are defined, the next step is to identify the parameters and sub-parameters that contribute to the risk of maritime accidents. The parameters considered include ocean conditions (such as waves and currents), ship traffic density, vessel direction and relative speed, weather conditions, and the timing of navigation. To measure the level of significance of each parameter, questionnaires were distributed to experts with experience in navigation, maritime operations, and sea traffic monitoring [23]. The evaluation was done using a scale from 1 to 9, representing the level of importance or influence of each parameter on maritime safety. The data from these questionnaires were then used to calculate the risk level of each factor.
The next step is collecting dynamic data from the Automatic Identification System (AIS), which includes information on ship position, sailing direction, speed, and vessel type. AIS data were collected over a one-month period, from June 20 to July 20, 2025, with a time interval of three hours. This data aims to capture ship traffic patterns over time and provide a realistic overview of sailing conditions in the study areas [24,25]. In addition, oceanographic data such as wave height and ocean currents were obtained from the Copernicus Marine Service platform, using the same temporal resolution as the AIS data. The use of oceanographic data is important to understand how sea conditions affect the risk of accidents.
All data collected, including expert questionnaire results, AIS data, and oceanographic data, are then integrated into the process of calculating the maritime safety index. This index represents the overall level of risk in each segment of the study areas, based on a combination of static parameters (such as quantified expert judgment) and dynamic parameters (such as ocean current conditions, wave height, and ship traffic patterns). The integration of both types of parameters provides a more realistic and dynamic view of the potential risks in each area, making the evaluation results more relevant to actual field conditions.
The results of this calculation process are then visualized in the form of a hazard map, which shows the variation in safety levels across each segment within the study areas. This visualization is essential for identifying accident-prone zones geographically and supporting location-based decision-making by maritime authorities, route planners, and policymakers. By using spatial visualization, stakeholders can more easily interpret complex information into a format that is easier to understand and directly applicable in the field.
The final stage of this study is an advanced analysis using the Multivariate Analysis (MVA) approach. MVA is applied to explore the complex relationships between the variables collected during the research process. This approach makes it possible to identify patterns and correlations among several risk factors that affect maritime safety both individually and in combination [26]. Using MVA allows the dominant influence of specific parameters on the safety index to be statistically identified, as well as the contribution of interactions between factors, such as traffic density and wave conditions, to the risk level in a specific area [27].
2.1. Safety Index Calculation
The first step in this stage is to quantify the risks based on the questionnaire responses provided by expert respondents. Each evaluated parameter is assigned a different weight, depending on its level of importance or influence on the overall risk category. This weighting process aims to give proportional values to each parameter so that their contributions are more accurately reflected in the risk assessment. The questionnaire employs a nine-level scale, where the lowest score represents a negligible element. The results are then used to quantify the risk associated with each element. The calculation of the risk weight values is carried out using Equation (1).
Where is the weighting value for each category based on the item number and the element number of each questionnaire item, and represents the experience factor, which influences the level of trust in the expert's navigational judgment. The next step is to calculate the quantified value of each sub-parameter. The equation used for risk quantification is as follows:
In the equation above, is the average numerical value for the j-th element of item -i. represents the response value for the j-th element of item -i. Meanwhile, N, i, and j refer to the number of respondents, the questionnaire item number, and the element number of each item, respectively.
To simplify the calculation process, each risk component will be calculated separately at first. Once all component values are obtained, the next step is to combine these values according to the predefined criteria and model structure. This approach is intended to make the calculation process more systematic and well-organized. The calculation of each component follows the equations below:
- Ship type component;
- Ship age component;
- Ship length component;
- Ship speed component;
- Ship distance component;
- Ship direction component;
- Operational hour component;
- Sailing day component;
- Current speed component;
- Wave heigh component.
In the above equation, is the column vector of the questionnaire item number variable. Detail of following Table 1, where the value is 1 if the variable represents the specified type and 0 otherwise. The next step is to combine the components above into a more comprehensive equation by considering the related factors. The model classification follows the case configuration in Table 2, with each model calculated using Equation 13 and 14.
- Model I (Including operational hour and sailing day);
- Wave heigh component.
2.2. Multivariant Analysis (MVA)
Multivariate analysis is used to calculate the relative percentage contribution of each factor to the overall safety index. Each factor is analyzed using specific equations defined in Equations (3) to (12). This approach makes it possible to identify the influence of each parameter individually while maintaining the interconnections among components within the safety index calculation framework.
The average percentage contribution is obtained by dividing the value of each calculated component by the final value of the safety index. For example, the contribution of the ship type parameter is calculated using the designated formula, while other parameters are processed in a similar way according to their respective equations. The results provide a quantitative representation of the proportionate influence of each factor, allowing us to determine which factors are the most dominant and which have relatively minor contributions in defining the level of navigational safety in the study area.
- Percentage influence of ship type;
- Percentage influence of ship age;
- Percentage influence of ship length;
- Percentage influence of ship speed;
- Percentage influence of ship distance;
- Percentage influence of ship direction;
- Percentage influence of operational hours;
- Percentage influence of sailing days;
- Percentage influence of current speed;
- Percentage influence of wave height.
All parameters and sub-parameters are calculated based on historical and operational ship data obtained from the AIS system. The number of datasets used in this study is adjusted according to the availability and total number of AIS data records.
3. Case Configurations
The case study in this research focuses on two strategic maritime areas: the Bali Strait and the Lombok Strait. These straits were selected due to their high shipping traffic and significant navigational complexity. As shown in Figure 2, these areas are key parts of both domestic and international shipping routes, mainly because of their position connecting the Indian Ocean and the Flores Sea, and their role as part of the Indonesian Archipelagic Sea Lanes (ALKI) [28]. Based on traffic density data, the Bali and Lombok Straits are among the busiest maritime passages in Indonesia [29]. These conditions make them ideal locations for analyzing maritime safety risks and for developing a safety index model that is responsive to actual field conditions.
3.1. Bali Strait
In the Bali Strait, the study focuses on two main ports: Ketapang Port in Banyuwangi, East Java, and Gilimanuk Port in Bali, covering the Ketapang–Gilimanuk route and vice versa. These ports play an important role in supporting the local economy, as this route serves as a key connection for transporting goods, including agricultural commodities and other products, between Java and Bali [30]. With the high volume of passengers and vehicles using this route, punctuality and operational efficiency of the ferry services are crucial to maintaining smooth transportation across the Bali Strait [31].
As part of the research scope, the study area is specifically focused on the ferry crossing route between Ketapang Port in East Java and Gilimanuk Port in Bali, as shown in Figure 3. This area is geographically bounded by latitudes from -8.136º to -8.163º in the north and south, and longitudes from 114.399º to 114.437º in the west and east. The main focus of this study is on ferries that regularly operate along this crossing route, but it also considers the presence and interaction of other vessels passing through the same area. In this way, all maritime activities in the region are analyzed to gain a more complete understanding of potential risks and overall maritime safety.
To support more detailed spatial analysis, the study area is divided into 12 grids, each measuring 1 km2 (4 columns x 3 rows), as shown in Figure 3. Each grid is labeled using a combination of letters (A–D) for columns and numbers (1–3) for rows. This division allows AIS ship data to be grouped systematically according to the actual sailing route. For example, grids 1A and 3D represent port areas, while grids 1B–1C and 2B–2C reflect the main ferry crossing route. Some grids, such as 3A and 1D, are rarely used due to their proximity to the coastline. In addition, ships with different destinations that pass-through columns B and C are also included in the risk evaluation. This division supports more targeted and accurate risk mapping along the crossing route.
3.2. Lombok Strait
In this study, the focus area in the Lombok Strait includes two main ports: Padang Bai Port in Bali and Lembar Port in West Nusa Tenggara (NTB). These ports were selected based on the availability of relevant data related to increased shipping activity in the surrounding waters, as well as their strategic role in supporting connectivity between regions in central and eastern Indonesia [32,33].
Padang Bai Port is one of the key maritime transportation hubs connecting Bali Island with Lombok Island. It serves regular ferry routes to Lembar Port in Lombok and Mentigi Port in Nusa Penida. Meanwhile, Lembar Port, located in West Lombok Regency, is the main port in the West Nusa Tenggara (NTB) region, handling both cargo and passenger vessels. This port manages several important ferry routes, including Padang Bai – Lembar, Ketapang – Lembar, and Jangkar – Lembar. Due to the high volume of maritime traffic passing through this port, Lembar plays a vital role in supporting interregional mobility and serves as a key location in the maritime safety assessment in the Lombok Strait.
As in the case study in the Bali Strait, the analysis in the Lombok Strait is also carried out within clearly defined geographical boundaries. The study area is bounded by latitude -8.497º in the north and -8.764º in the south, and by longitude 115.503º in the west and 116.054º in the east. Given the wider coverage area in the Lombok Strait, the spatial analysis grid is divided into 10 x 10 km sections, consisting of 6 columns (A–F) and 3 rows (1–3) (see Figure 4). The size of each grid is approximately ten times larger than those used in the Bali Strait case study, adjusted to the larger research scale and the more complex characteristics of the maritime traffic in the area.
Each grid is labeled using a combination of letters and numbers; for example, grid 1A represents the location of Padang Bai Port in Bali, while grid 3F marks the position of Lembar Port in Lombok. In addition to the regular ferry route between these two ports, the Lombok Strait is also a major route for vessels traveling between East Asia and Australia. This cross-regional traffic results in vessel crossings in several central grids, especially in columns B through D. Therefore, the grid segmentation not only enables the grouping of local traffic but also facilitates the analysis of interactions between vessels on different routes, which adds to the complexity of risk in this area.
4. Results
4.1. Risk Quantification
To assess both weighting and scoring values, the questionnaire responses are analyzed using equations (1) and (2) as the basis for calculation. The results, presented in Table 3, outline the individual impact of each factor, with specific weights assigned according to their relative significance. By quantifying these factors, the analysis provides a structured approach to evaluating how different elements contribute to the overall safety level. This method ensures that each factor’s influence is measured objectively, offering a clear understanding of their respective roles in maritime safety.
By examining these weighted contributions, a more comprehensive insight into navigators’ perceptions is achieved. Identifying the most influential factors allows for better prioritization of safety measures, ensuring that critical aspects receive appropriate attention. This structured evaluation not only enhances safety assessments but also supports decision-making processes aimed at improving onboard safety standards. Ultimately, the findings contribute to the development of more effective risk management strategies in maritime operations.
4.2. Oceanography Characteristics
The modeling was carried out over a one-month interval. The data used consisted of three-hour intervals for each day. Ocean current modeling was performed using the Copernicus Marine Data website (Global Ocean Physics Analysis and Forecast). Meanwhile, wave height modeling was conducted on the same website using Reanalysis data from ERA5. ERA5 is the fifth-generation reanalysis produced by ECMWF for global climate and weather over the past eight decades. The data are available from 1940 onward.
4.2.1. Bali Strait
The oceanographic analysis results, covering current speed and wave height in the Bali Strait, are shown in Figure 5. As illustrated, wave height and current speed fluctuated throughout the measurement period. Wave height reached its peak in the last week of June and the second week of July, with values of about 2.6 m. Current speed continued to increase from the beginning of the observation until it peaked in early July at around 1.3 m/s, before decreasing again to about 1 m/s at the end of the period. A clearer summary of these results is provided in Table 4, which presents the minimum, average, and maximum values. For wave height, the minimum, average, and maximum were 1.273 m, 1.961 m, and 2.682 m, respectively, while for current speed the corresponding values were 0.884 m/s, 1.169 m/s, and 1.392 m/s.
4.2.2. Lombok Strait
The results of wave height and current speed measurements in the Lombok Strait are presented in Figure 6. The figure shows that wave height peaked three times: at the beginning of the observation period, in the second week of July, and at the end of the period, with values exceeding 3.5 m. Current speed fluctuated throughout the observation period, also reaching three peaks within the first two weeks of July at around 1.6 m/s. A detailed summary of these phenomena is provided in Table 5, where the minimum, average, and maximum wave heights are 1.663 m, 2.608 m, and 3.657 m, respectively, while the corresponding values for current speed are 1.062 m/s, 1.388 m/s, and 1.627 m/s. Overall, the oceanographic conditions (wave height and current speed) in the Lombok Strait are higher than in the Bali Strait, as the more open waters in the Lombok Strait generate higher waves, while the presence of ARLINDO also increases current speed in the strait.
4.3. Statistical Evaluation of AIS Data
AIS data were collected from the Marine Traffic website (www.marinetraffic.com) over a full month, from 20 June 2025 to 20 July 2025. The data were systematically recorded at three-hour intervals, starting at 00:00, 03:00, 06:00, and so forth, to ensure comprehensive coverage of vessel activities throughout the period. This approach provides a continuous record of ship movements, allowing for a more accurate analysis of maritime traffic patterns in the study area.
4.3.1. Bali Strait
During one month of data collection, a total of 3,013 ship records were obtained, with passenger vessels dominating at 92.83%. This highlights the dominance of passenger transport in the area, largely linked to the busy inter-island crossing routes such as Ketapang–Gilimanuk. The analysis further shows that the highest traffic density occurred in grids A1 and D3, as shown in Figure 7, reflecting the strategic role of ports in these locations as key hubs for trade, logistics, and passenger transport. The high volume of vessel traffic requires efficient management to avoid congestion and reduce accident risks, making optimal navigation strategies, strict monitoring, and the use of maritime traffic surveillance technologies essential to maintain smooth operations and navigational safety in the region.
To summarize the AIS statistical data, Table 6 shows the daily average number of ships over eight time periods. Sunday and Monday recorded the highest averages at 112.2 and 107.75, indicating denser activity during the weekend, likely influenced by ship schedules or port operations. In contrast, Friday had the lowest average of 81.6, which may reflect reduced operations or fewer ship movements. Overall, the daily average reached 97.23, showing relatively consistent traffic with some variations between days.
Table 7 also shows variations by time of day. At 03:00, the highest average was on Monday with 14.75 ships, while the lowest was on Saturday with 8.8. At 21:00, Sunday recorded the highest average with 16 ships. In general, the number of ships during the morning, midday, and afternoon was lower, ranging from 12 to 14 ships.
4.3.1. Lombok Strait
During one month of data collection, 2441 ships were recorded, showing the variety of vessel types operating along the ALKI II route. As seen in Figure 8, the distribution of ships follows the routes illustrated in Figure 2. The composition consists of 61.9% passenger ships, 14.82% cargo ships, 11.42% bulk carriers, and the rest classified as other types. This indicates that shipping activity in this area is more diverse compared to regions that are dominated by a single type of vessel. From Figure 8, the highest density was found in grid A1 near Padangbai Port and grid F3 near Lembar Port, while other grids show a more even distribution. Although A1 and F3 recorded higher traffic than the surrounding areas, the total number of ships is still lower than in the Bali Strait. Meanwhile, columns C and D represent international shipping lanes.
To summarize the AIS statistical data in the Lombok Strait, Table 8 presents the daily average number of ships recorded during one month of observation. According to the table, Friday and Saturday had the highest averages, with 82.8 and 83.4 ships respectively, followed by Wednesday with 80.25 ships. This suggests that mid to late week is the busiest period for shipping activity in the area. On the other days, the daily average was below 80, ranging between 70 and 79 ships. Overall, the daily average was 78.5 ships, providing a general picture of traffic density in the Lombok Strait across different days.
In general, Table 9 shows that the number of ships tends to increase from midday to afternoon, peaking at 12:00 with the highest average of 12.8 ships on Friday. Activity then declines during the night and early morning, where at 00:00 most days recorded fewer than 10 ships on average, except for Saturday.
4.4. Safety Index Estimation
4.4.1. Influence of Sailing Days and Operational Hours (Model I)
The calculation of the safety index in this subsection follows Equation 13, with the contributing factors presented in Table 2. The AIS data used includes all available records (00:00, 03:00, 06:00, and so on). Since Model I in Equation 13 is expressed as a summation function, a higher safety index value indicates greater risk or hazard.
4.4.1.1. Bali Strait
The analysis of the safety index based on variations in sailing time reveals a fluctuating pattern that reflects the dynamics of operational activities around Ketapang and Gilimanuk Ports. As shown in Figure 9, the maximum value of the safety index demonstrates a sharp upward trend from 03:00 to 06:00, reaching its highest peak at 06:00 with a value of 19,579.42. This indicates that in the early morning, there is a significant increase in navigation safety risks, most likely due to the high volume of vessel movements occurring simultaneously.
After 06:00, the maximum safety index value consistently decreases, reaching its lowest point at 15:00 with a value of 8,640.34, before gradually rising again until 21:00 with a value of 10,892.3. This pattern indicates that navigation risk tends to decrease as vessel activity slows during the afternoon, but increases again in the evening. These findings provide a useful basis for evaluating operational schedules and regulating vessel traffic to reduce potential hazards during peak hours in the Bali Strait.
The analysis of the maximum safety index values based on the days of the week provides an interesting insight into the variation of navigation risks in the Bali Strait. As shown in Figure 10, there is a significant increase from Monday to Thursday. On Monday, the maximum safety index is only about 6702.93, roughly one-third of the maximum value on Thursday, which reaches 19579.42. This phenomenon is likely related to the midweek surge in vessel activity, when ship movements increase significantly.
After peaking on Thursday, the safety index drops sharply on Friday and Saturday, with minimum values of 12118.22 and 8460.5, reflecting decreased vessel traffic and lower navigation risk toward the weekend. However, on Sunday, the safety index rises again to 10892.3, indicating increased ship activity at the end of the week. Overall, this pattern shows that the day of operation affects fluctuations in navigation safety and can be an important consideration for scheduling and risk mitigation strategies in the Bali Strait.
The visualization of the safety index results is presented as a color-coded plot, where color variations represent different safety levels. In this study, this representation is referred to as a hazard map. Figure 11(a) shows the average safety index for each segment based on Model I. The results indicate that grids 1A and 3D have the highest average values, 1932.626 and 2335.708 respectively. According to Model I, which sums various risk parameters, a higher safety index value corresponds to greater risk in the segment. This increase in the safety index aligns with the higher vessel density in these areas.
As shown in Figure 11(b), grids 1A and 3D also have the highest average number of vessels, 1.929 and 2.565 respectively. The area near Ketapang Port, grid 2A, has an average safety index of 1438.495 with an average of 1.397 vessels, while near Gilimanuk Port, grid 2D has a value of 1358.498 with an average of 1.418 vessels. In contrast, grids farther from the two ports show relatively lower values due to reduced vessel activity in these areas.
The intense vessel movement in grids 1A and 3D is related to the strategic role of these locations in maritime operations. Grid 1A is located near the main entry channel to one of the ports, often serving as an accumulation point for vessels before maneuvering in or out. Meanwhile, grid 3D is a high-activity area for loading and unloading and serves as a transit zone for vessels continuing to major trade routes. The high traffic intensity in these two grids contributes to an increased potential safety risk in the region.
4.4.1.2. Lombok Strait
Based on Figure 12, the maximum safety index in the Lombok Strait shows a noticeable fluctuation throughout the day. It starts at 00:00 with a value of 5846.57 and decreases to 3778.50 at 03:00. Similar to the pattern in the Bali Strait, there is a sharp increase at 06:00, reaching 9072.4, which is the highest value of the day. This rise can be associated with the dense vessel activity at that time, as the Lombok Strait serves not only domestic navigation but also acts as a strategic international route (ALKI II).
After reaching its peak, the maximum safety index drops sharply at 09:00 to 3738.61, then rises moderately around midday to 5635.58. The value remains relatively stable until 18:00 and decreases slightly at night (21:00) to 4852.27. This hourly movement pattern indicates that navigation risk is strongly influenced by daily vessel activity, with the highest risk occurring in the morning when traffic is most concentrated, while the risk during the afternoon and evening is lower.
The analysis of the maximum safety index based on the days of the week in the Lombok Strait is presented in Figure 13. The figure shows that the maximum safety index fluctuates throughout the week, reflecting variations in navigation risk influenced by daily and weekly vessel activity. On Monday, the maximum safety index is recorded at 5846.57, followed by a significant increase on Tuesday, reaching the weekly peak of 9072.4. This rise is likely related to the higher intensity of vessel movements at the beginning of the week, when this strategic shipping route is more actively used.
After reaching its peak on Tuesday, the maximum safety index decreases on Wednesday to 4525.27, then rises again on Thursday to 5635.58. A further decrease occurs on Friday to 3860.44, followed by another increase on Saturday to 5537.6, before finally dropping on Sunday to a value nearly equal to that of Friday. This fluctuating pattern indicates that navigation risk is not constant throughout the week but is influenced by a combination of operational factors and vessel traffic density on specific days.
Overall, the maximum safety index in the Lombok Strait is relatively lower than in the Bali Strait, suggesting a comparatively lower navigation risk. This difference can be explained by the larger study area in the Lombok Strait, where each grid represents 10 km × 10 km, or ten times larger than a single grid in the Bali Strait. With a larger grid size, risk is distributed over a wider area, so the maximum value per grid tends to be lower even when vessel activity is high.
For clarity, this is illustrated in the hazard maps shown in Figure 14(a), which depict the average safety index distribution based on Model I for each segment in the Lombok Strait. From the visualization, grid 1A stands out with the highest average index value of 732.404, far exceeding the other grids. This indicates that the segment has the highest level of hazard risk based on the combined parameters included in Model I, which consist of sailing time, day of navigation, and ship encounter characteristics.
This condition is caused by dense vessel activity in grid 1A, located near Padangbai Port, with the highest average number of vessels at 1.364 (see Figure 14(b)). This relationship reinforces the indication that high vessel traffic directly contributes to increased risk in the area. Although the average number of vessels is similar to grid 2A in the Bali Strait, the average safety index is much lower, influenced by the larger grid size. Additionally, locations near other ports, such as grids 1B and 2A, also show relatively high safety index values of 377.849 and 421.706, respectively, indicating that areas close to ports generally have higher potential risks.
4.4.2. Safety Index Calculation with All Factors (Model II)
As shown in Equation 14 and Table 2, the calculation of the safety index in Model II combines all the existing factors. This approach aims to provide a more comprehensive overview of safety levels in the study waters by integrating these factors into a quantitative formulation.
4.4.2.1. Bali Strait
Figure 15 shows the distribution of average safety index values based on calculations using Model II. The analysis indicates that, in general, the pattern of the safety index in Model II is similar to that observed in Model I, with certain grids standing out as areas of higher risk. Specifically, grids 1A and 3D again show the highest average safety index values, at 2504.188 and 3015.788 respectively. These higher values reflect the relatively greater risk in these areas compared to other grids, even when operational and oceanographic variables are also considered in the calculation.
The main difference between Model I and Model II is seen in the significant increase in safety index values. While Model I only accounts for the day and time of navigation, Model II integrates all relevant factors, including sea conditions and vessel movement characteristics. This integration allows Model II to capture the complex interactions among risk factors more comprehensively, resulting in safety index values that are more representative of actual conditions in the field. These findings highlight the importance of considering multiple operational and environmental aspects in navigation safety assessments, as the risks depend not only on vessel activity schedules but also on oceanographic conditions and traffic dynamics in each segment of the area.
4.4.2.2. Lombok Strait
Figure 16 presents the distribution of average navigation safety index values in the Lombok Strait based on calculations using Model II. The analysis shows that the highest safety index is observed in grid 1A, reaching 973.063, followed by grid 2A (561.874) and 2D (541.809). These high values indicate that these segments have relatively lower risk levels compared to other areas, even after considering all factors. In contrast, grids such as 1F and 3A-B show low safety index values (with grid 3B even reaching zero), suggesting areas with much lower risk or very limited navigation data.
The increase in safety index values shown by Model II indicates that integrating all parameters plays an important role in improving the accuracy of safety assessments. This model can represent navigation conditions more realistically because it considers the complexity of interacting factors. These findings also reinforce previous results obtained in the Bali Strait, where models incorporating more risk parameters produced higher safety index values, reflecting greater navigation hazards. The consistency demonstrates that a multi-factor approach in navigation risk analysis can capture potential hazards more comprehensively, providing a solid basis for mitigation efforts and improving maritime safety across various Indonesian waters.
4.5. Multivariant Analysis (MVA)
Figure 17 presents a comparison of the average percentage contribution of each factor to the safety index at the study locations, namely the Bali Strait and the Lombok Strait. This visualization provides a clear overview of the dominant factors affecting navigation safety in both areas, while also highlighting differences in operational characteristics and sea environment conditions in each strait. By analyzing the proportion of each parameter’s contribution, such as ship type, ship age, ship length, relative speed, current speed, wave height, vessel spacing, and ship direction, key factors that require attention for improving navigation safety can be identified. Differences in parameter contributions between the two locations not only reflect traffic conditions and vessel types but are also influenced by local geographic features and oceanographic dynamics.
The Ship Type parameter in the Lombok Strait contributes 10.36%, slightly higher than in the Bali Strait at 9.38%. This is related to the diversity of vessel types operating in the Lombok Strait, ranging from passenger ships and cargo vessels to large fishing boats, which affects maritime traffic characteristics and potential risks. In addition, the Ship Length parameter is also higher in the Lombok Strait (9.55%) compared to the Bali Strait (8.92%) due to the larger proportion of cargo vessels, which are generally longer. In contrast, the Ship Age parameter is higher in the Bali Strait (11.27%) than in the Lombok Strait (9.69%), indicating that vessels in Bali tend to be older, increasing operational risk due to the potential decline in technical conditions with age.
The Speed parameter in the Lombok Strait reaches 11.51%, higher than in the Bali Strait (10.46%), influenced by Lombok’s wider and deeper geography, which allows vessels to move at higher speeds. Higher speeds can increase risk, especially under dense traffic or adverse weather conditions. From an oceanographic perspective, the Lombok Strait also shows higher contributions for Current Speed (11.27% vs. 10.24%) and Wave Height (13.46% vs. 12.44%), reflecting more dynamic sea conditions that pose higher potential navigation risks.
The Sailing Days parameter is relatively similar for both regions (Bali 6.53%, Lombok 6.41%), while Sailing Hours is slightly higher in the Bali Strait (8.71% vs. 8.24%). The Ship Distance parameter is higher in the Bali Strait (13.154% vs. 12.125%) because its narrower width and dense traffic reduce vessel spacing, increasing the risk of collisions. The Ship Direction parameter is almost the same in both areas (Bali 12.181%, Lombok 12.459%), indicating that vessel movement patterns have a similar influence on the safety index, although Lombok is slightly higher due to more varied currents and navigation routes.
Overall, the Lombok Strait is dominated by factors related to longer vessels, higher speeds, and more extreme sea conditions, while the Bali Strait is characterized by older vessels and closer spacing. These differences reflect distinct operational and environmental characteristics between the two straits and are important considerations for navigation safety management in each region.
5. Conclusions
In this study, the analysis of ship-ship safety index in the Bali Strait and Lombok Strait was conducted using two models, Model I and Model II, to evaluate the influence of multiple operational and environmental factors on maritime risk. The AIS data obtained indicate that traffic density in the Bali Strait is higher than in the Lombok Strait, where the Bali Strait is dominated by domestic navigation with passenger ships, while the Lombok Strait is more diverse due to its position along both domestic and international shipping routes.
The analysis of safety index in the Bali and Lombok Straits using both Model I and Model II shows that vessel traffic, sailing hours, days of the week, and environmental conditions strongly influence maritime risk. In the Bali Strait, the highest risks occur in the early morning and midweek, particularly near Ketapang and Gilimanuk Ports, with grids 2A and 3D consistently showing the highest safety index values. In the Lombok Strait, risk peaks in the morning and varies throughout the week, with grids near Padangbai and Lembar Ports and along the ALKI II international route showing higher safety indices. Model II, which integrates all operational and oceanographic factors, produces higher and more representative safety index values, capturing the complex interactions among vessel activity, traffic density, and sea conditions. Overall, areas close to ports and major shipping lanes consistently show higher risks, highlighting the importance of comprehensive traffic management, monitoring, and risk mitigation strategies to improve maritime safety in both straits.
The multivariate analysis shows that navigation risks in the Lombok and Bali Straits are influenced by different dominant factors. In the Lombok Strait, higher contributions come from longer vessels, greater speeds, and more dynamic sea conditions, while in the Bali Strait, older vessels and closer vessel spacing play a larger role. Other factors such as ship type, current speed, wave height, sailing days, sailing hours, and ship direction also contribute to varying degrees. These differences reflect the distinct operational and environmental characteristics of each strait, highlighting the need for tailored risk management and safety strategies according to local conditions.
For future studies, it is important to further develop this safety index calculation method into a more practical and user-friendly format, such as a dedicated application or graphical user interface (GUI). Such a system could potentially be integrated into real-time navigation platforms on vessels, allowing crews to monitor risks continuously and implement timely mitigation measures in case of hazards.
Author Contributions
Conceptualization, M.I.F. and M.B.Z.; methodology, M.I.F. and R.O.S.G.; software, M.I.F.; validation, R.O.S.G. and M.B.Z.; formal analysis, M.I.F.; investigation, M.I.F.; resources, R.O.S.G.; data curation, M.B.Z.; writing—original draft preparation, M.I.F.; writing—review and editing, R.O.S.G. and M.B.Z.; visualization, M.I.F.; supervision, R.O.S.G. and M.B.Z.; project administration, M.I.F.; funding acquisition, M.I.F. and M.B.Z. All authors have read and agreed to the published version of the manuscript.
Data Availability Statement
The original contributions presented in this study are included in the article. Further inquiries can be directed to the corresponding author.
Acknowledgments
The authors would like to express their sincere gratitude to Institut Teknologi Sepuluh Nopember (ITS) and the Surabaya Merchant Marine Polytechnic for their valuable support and collaboration in this research.
Conflicts of Interest
The authors declare no conflicts of interest.
References
- Huntington, H.P.; Daniel, R.; Hartsig, A.; Harun, K.; Heiman, M.; Meehan, R.; Noongwook, G.; Pearson, L.; Prior-Parks, M.; Robards, M.; et al. Vessels, Risks, and Rules: Planning for Safe Shipping in Bering Strait. Mar. Policy 2015, 51, 119–127. [CrossRef]
- Paulauskas, V.; Filina-Dawidowicz, L.; Paulauskas, D. Navigation Safety on Shipping Routes during Construction. Appl. Sci. 2023, 13, 8593. [CrossRef]
- Chen, J.; Lu, F.; Peng, G. A Quantitative Approach for Delineating Principal Fairways of Ship Passages through a Strait. Ocean Eng. 2015, 103, 188–197. [CrossRef]
- Bokau, J.R.K.; Camliyurt, G.; Priadi, A.A.; Park, Y.; Kim, D. Enhancing Safety of Navigation: Redesigning Precautionary Areas into Roundabouts in Marine Traffic Separation Schemes. Appl. Sci. 2024, 14, 11588. [CrossRef]
- Priadi, A.A.; Ivan, R.; Darsani; Anindhyta, C. Evaluation Of The Implementation Of Traffic Separation Scheme (TSS) In The Sunda Strait. IOP Conf. Ser. Earth Environ. Sci. 2024, 1294, 012028. [CrossRef]
- Suryadi, A.; Artha Dewi, K.; Bosoz, A. The Effect of The Implementation of Traffic Separation Scheme (TSS) In Maintaining Maritime Environment Safety of Lombok Strait. Din. Bahari 2024, 5, 50–56. [CrossRef]
- Nofandi, F.; Widyaningsih, U.; Rakhman, R.A.; Mirianto, A.; Zuhri, Z.; Harini, N. V Case Study of Ship Traffic Crowds in The Malacca Strait-Singapore by Using Vessel Traffic System. IOP Conf. Ser. Earth Environ. Sci. 2022, 1081, 012009. [CrossRef]
- Meng, X.; Li, H.; Zhang, W.; Zhou, X.-Y.; Yang, X. Analyzing Ship Collision Accidents in China: A Framework Based on the N-K Model and Bayesian Networks. Ocean Eng. 2024, 309, 118619. [CrossRef]
- Gao, X.; Dai, W.; Yu, L.; Yu, Q. Study on Factors Contributing to Severity of Ship Collision Accidents in the Yangtze River Estuary. Transp. Saf. Environ. 2024, 6. [CrossRef]
- Bogalecka, M. Collision and Contact – Analysis of Accidents at Sea. TransNav, Int. J. Mar. Navig. Saf. Sea Transp. 2024, 18, 75–85. [CrossRef]
- Liu, Y.; Zhou, Y.; Zhong, R.Y. A Multi-Objective Optimisation Strategy for Ice Navigation under Ship Safety-Following Scenarios. Ocean Coast. Manag. 2023, 243, 106727. [CrossRef]
- Firdaus, M.I.; Zaman, M.B.; Gurning, R.O.S. Analysis of Ship Collision Accidents in Indonesia Using Fault Tree Analysis (FTA) Method. IOP Conf. Ser. Earth Environ. Sci. 2024, 1423, 012003. [CrossRef]
- Saransi, F.; Bokau, J.R.K. Marine Traffic Risk Assessment Using Spatio-Temporal AIS Data in Makassar Port, Indonesia. In; 2024; pp. 78–87.
- Hasanspahić, N.; Frančić, V.; Rudan, I.; Maglić, L. Analysis of Navigation Safety Regarding Tankers in Narrow Waterways. J. Marit. Transp. Sci. 2019, 55, 201–217. [CrossRef]
- Yildiz, S.; Uğurlu, Ö.; Loughney, S.; Wang, J.; Tonoğlu, F. Spatial and Statistical Analysis of Operational Conditions Influencing Accident Formation in Narrow Waterways: A Case Study of Istanbul Strait and Dover Strait. Ocean Eng. 2022, 265, 112647. [CrossRef]
- Siuta, D.; Kukfisz, B.; Kuczyńska, A.; Mitkowski, P.T. Methodology for the Determination of a Process Safety Culture Index and Safety Culture Maturity Level in Industries. Int. J. Environ. Res. Public Health 2022, 19. [CrossRef]
- Shi, Z.; Zhen, R.; Liu, J. Fuzzy Logic-Based Modeling Method for Regional Multi-Ship Collision Risk Assessment Considering Impacts of Ship Crossing Angle and Navigational Environment. Ocean Eng. 2022, 259, 111847. [CrossRef]
- Gaggero, T.; Bucciarelli, F.; Besio, G.; Mazzino, A.; Villa, D. A Method to Assess Safety and Comfort for Different Ships Types in a Region of Interest. Ocean Eng. 2022, 250, 110995. [CrossRef]
- Jovanovic, I.; Vladimir, N.; Cajner, H.; Perčic, M. The Overview of Risk Analysis Methods and Discussion on Their Applicability for Power System of Autonomous Ships. TransNav, Int. J. Mar. Navig. Saf. Sea Transp. 2024, 18, 109–113. [CrossRef]
- Fan, C.; Montewka, J.; Zhang, D.; Han, Z. A Framework for Risk Matrix Design: A Case of MASS Navigation Risk. Accid. Anal. Prev. 2024, 199, 107515. [CrossRef]
- Ratih, I.D.; Artana, K.B.; Kuswanto, H.; Pratiwi, E.; Zaki, A.R. Probabilistic Modeling of Ship Collision in The Lombok Strait, Indonesia: A Bayesian Network Approach. IOP Conf. Ser. Earth Environ. Sci. 2024, 1423, 012008. [CrossRef]
- Barasa, L.; Simanjuntak, M.; Syafitra, B.W. Factors Affecting the Safety Climate of the Ship’s Crew: Empirical Evidence from Shipping Companies in Indonesia. Asian J. Shipp. Logist. 2025, 41, 75–82. [CrossRef]
- Heikkilä, M.; Himmanen, H.; Soininen, O.; Sonninen, S.; Heikkilä, J. Navigating the Future: Developing Smart Fairways for Enhanced Maritime Safety and Efficiency. J. Mar. Sci. Eng. 2024, 12, 324. [CrossRef]
- Bläser, N.; Magnussen, B.B.; Fuentes, G.; Lu, H.; Reinhardt, L. MATNEC: AIS Data-Driven Environment-Adaptive Maritime Traffic Network Construction for Realistic Route Generation. Transp. Res. Part C Emerg. Technol. 2024, 169, 104853. [CrossRef]
- Guo, Z.; Qiang, H.; Xie, S.; Peng, X. Unsupervised Knowledge Discovery Framework: From AIS Data Processing to Maritime Traffic Networks Generating. Appl. Ocean Res. 2024, 146, 103924. [CrossRef]
- Zampeta, V.; Chondrokoukis, G.; Kyriazis, D. Applying Big Data for Maritime Accident Risk Assessment: Insights, Predictive Insights and Challenges. Big Data Cogn. Comput. 2025, 9, 135. [CrossRef]
- Li, D.; Wong, Y.D.; Tan, K.H.; Wang, N.; Yuen, K.F. Real-Time Prediction and Detection of Contacts between Vessels and Facilities Based on AIS: A Multivariate Time-Series Classification Approach. Expert Syst. Appl. 2024, 257, 125109. [CrossRef]
- Herdiawan, D.; . A. Development Strategy of Navy Base Capability in Realizing Maritime Security of Traffic Separation Scheme Lombok Strait. J. Ecohumanism 2024, 3, 6069–6083. [CrossRef]
- Marine Traffic MarineTraffic: Global Ship Tracking Intelligence Available online: https://www.marinetraffic.com/en/ais/home/centerx:115.3/centery:-8.4/zoom:10 (accessed on 28 July 2025).
- Raharjo, E.P.; Kartika, K.R.D.; Adidana, I.K.S.P. Application of Transport Demand Management in Addressing Economic Losses Due to Traffic Congestion (Case Study of Gilimanuk Port During the 2024 Eid Holiday). J. Teknol. Transp. dan Logistik 2024, 5, 213–224. [CrossRef]
- Apriani, D.D.; Yusuf, M. Factors Influencing the Implementation of Vehicle Loading Regulations on Ferry Ships. In; 2024; pp. 217–228.
- Kartini, S.; Apriani, D.D.; Widiatmika Dewi, A.D.P. Evaluation Of The Scheduling Of Padangbai-Lembar Ships During The Pandemic Period In Bali Province. IWTJ Int. Water Transp. J. 2023, 3. [CrossRef]
- Syuhada, D.N.; Putranta, A.A.B.D.D. Evaluation Of International Safety Management (ISM) Code Implementation Using Quantitative Descriptive Methods And Quality Function Deployment On Crossing Ship. IJEBD (International J. Entrep. Bus. Dev. 2024, 7, 107–121. [CrossRef]
Figure 1.
Flowchart of methodology.
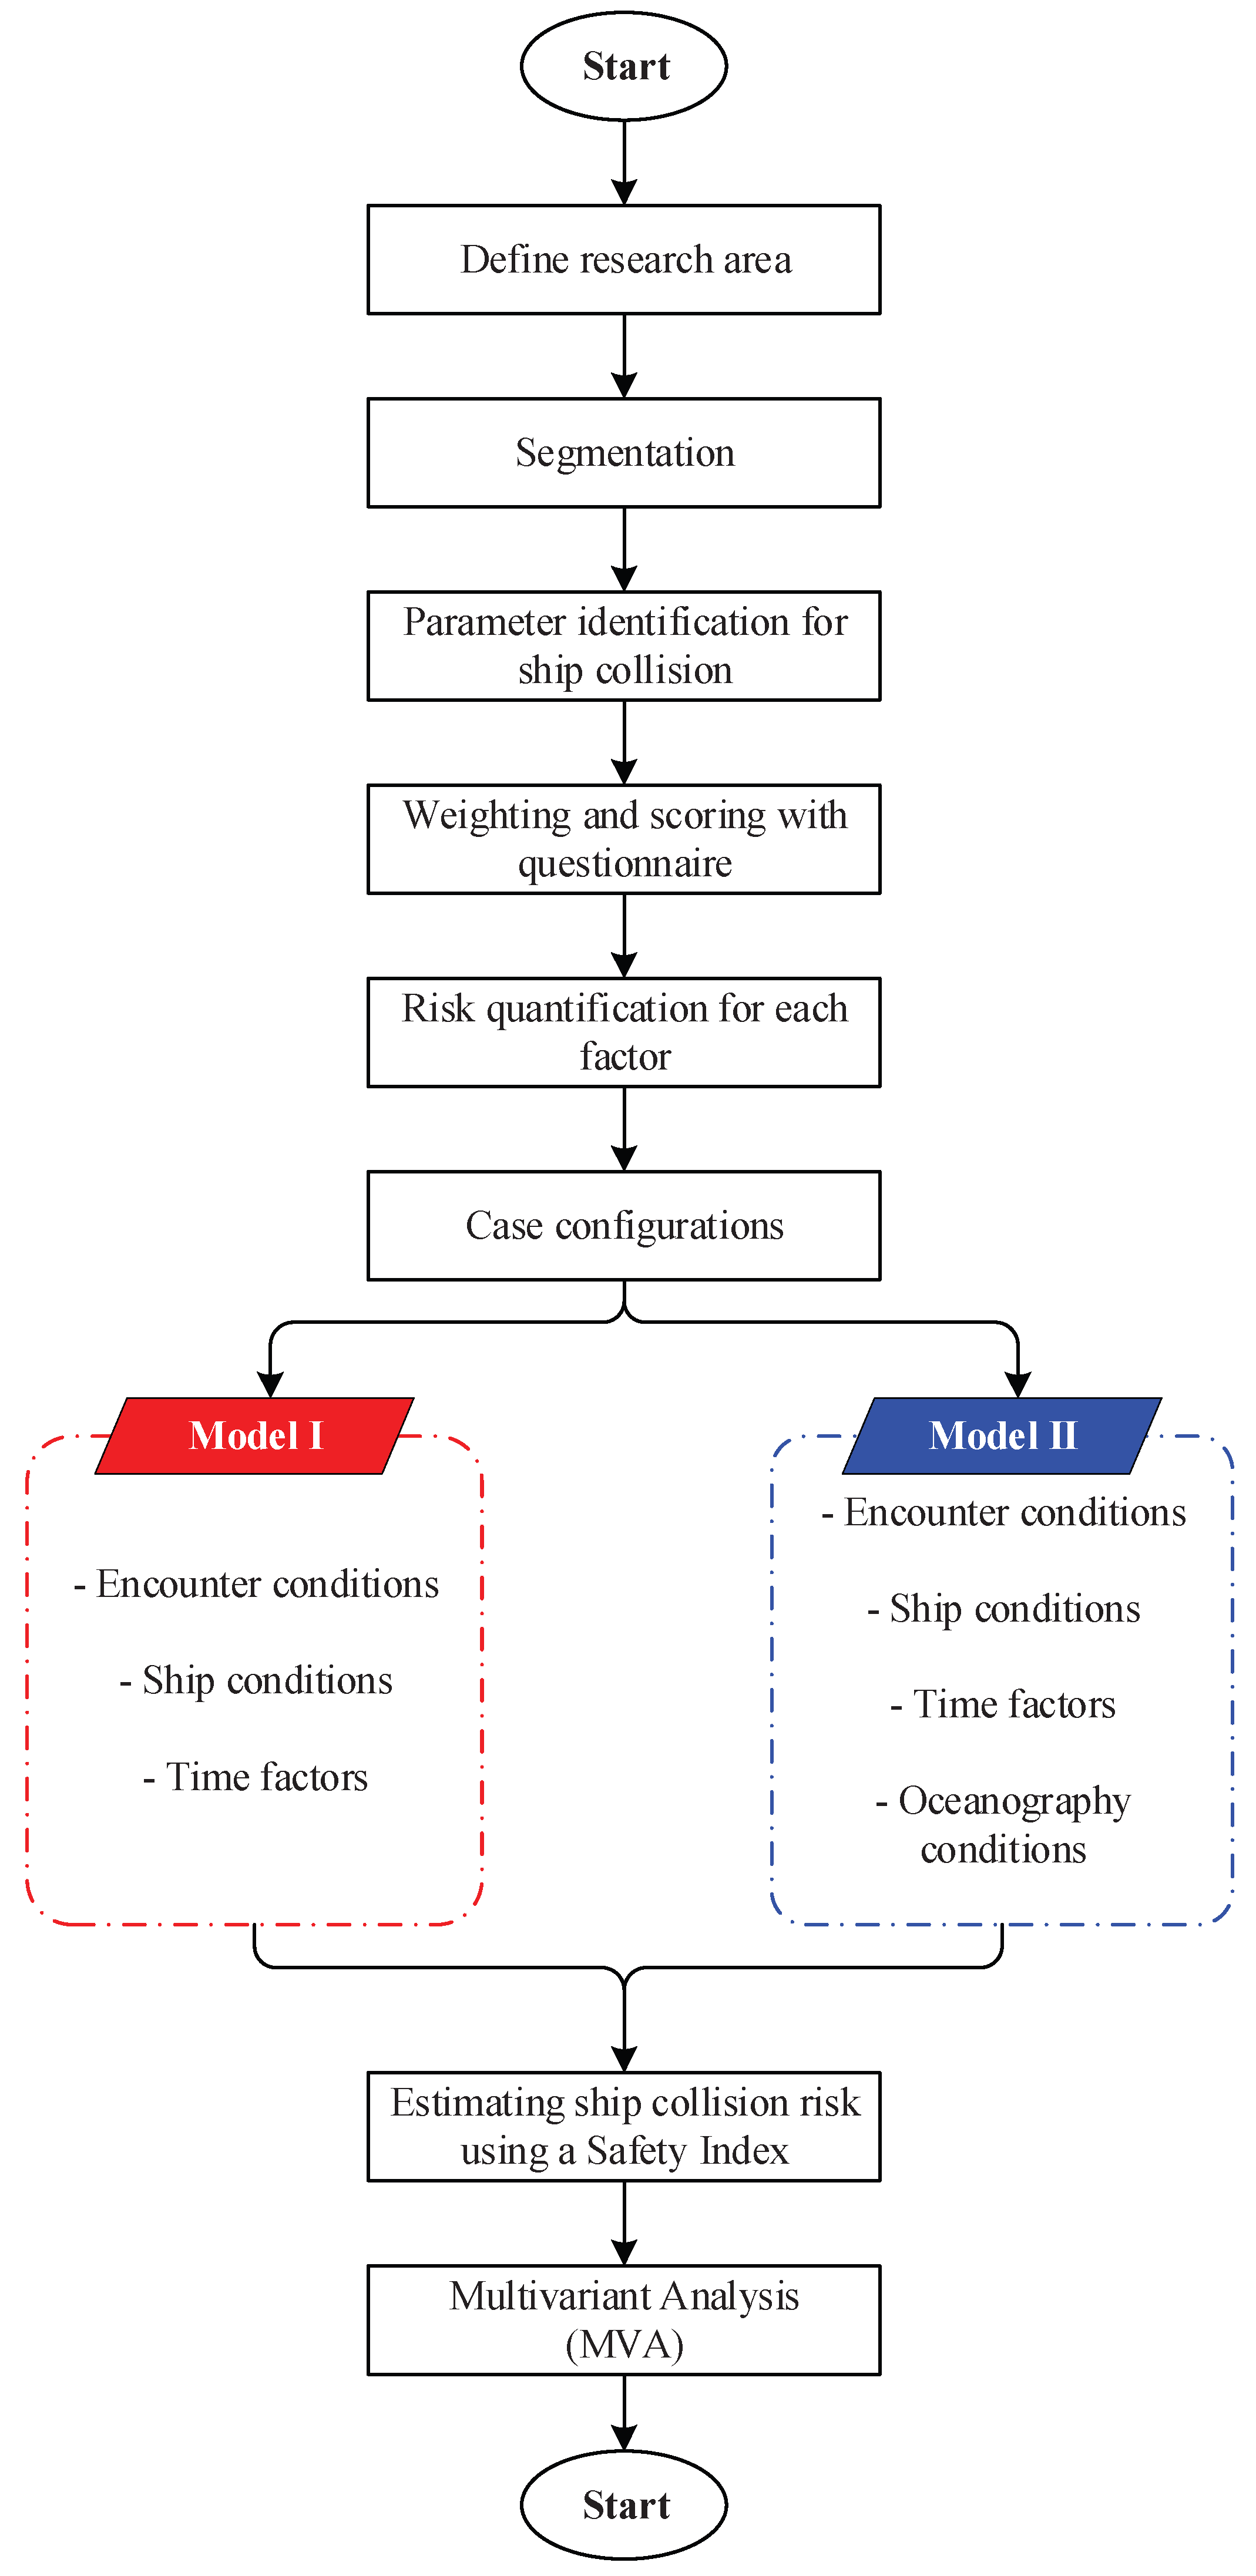
Figure 2.
Traffic density of the research location [29].
Figure 2.
Traffic density of the research location [29].
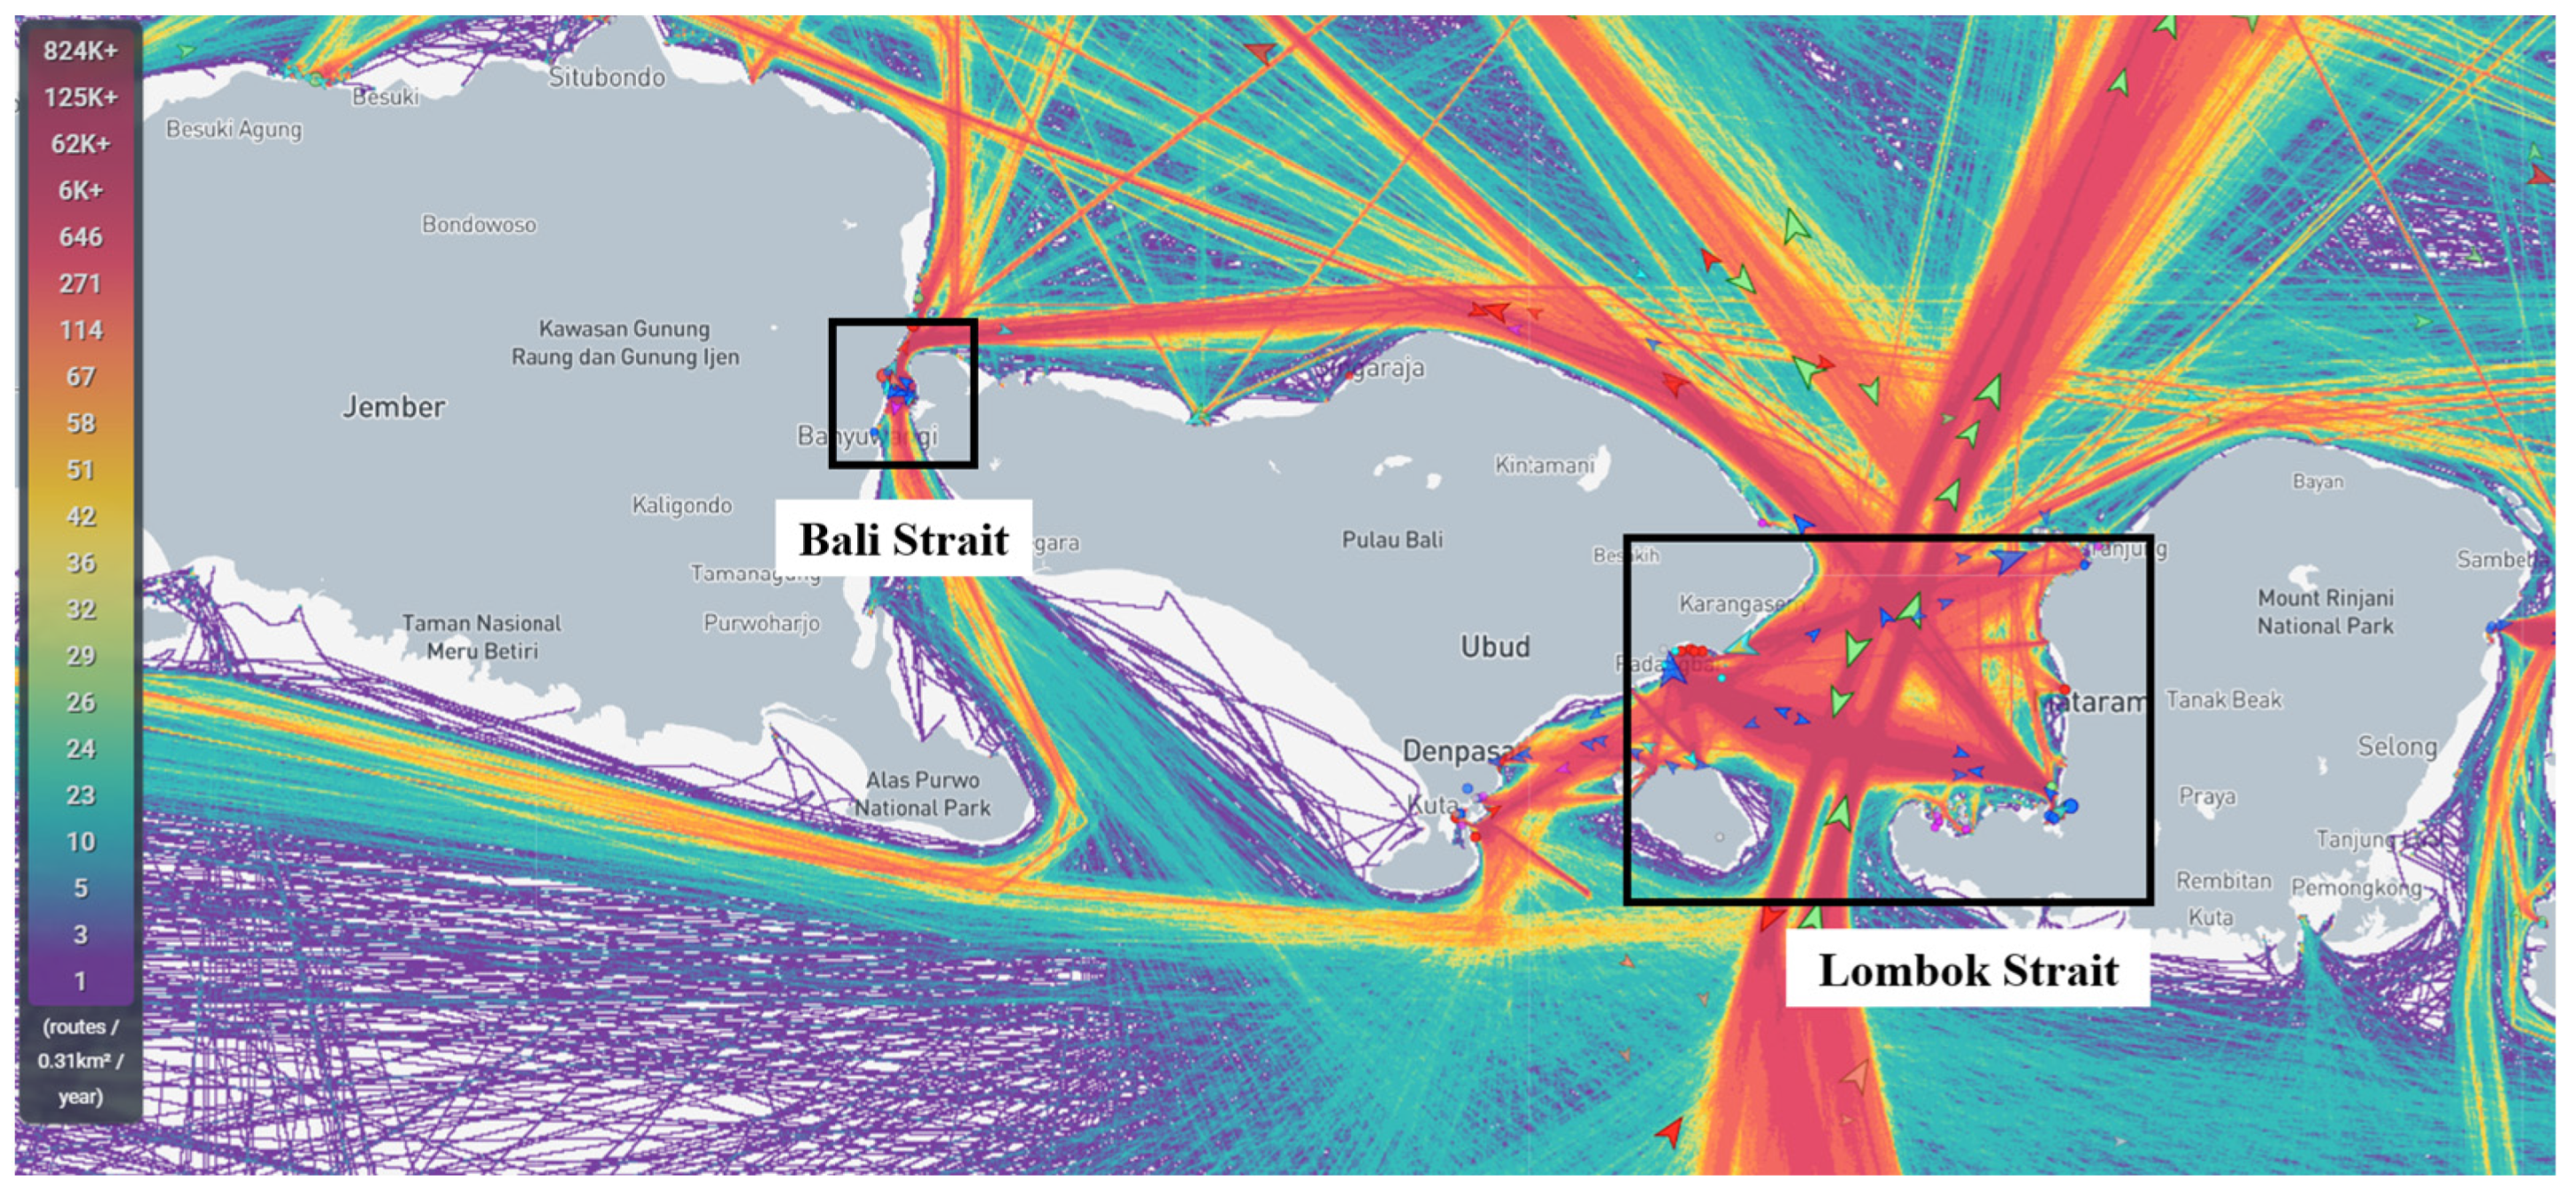
Figure 3.
Study area and grid segmentation in the Bali Strait.
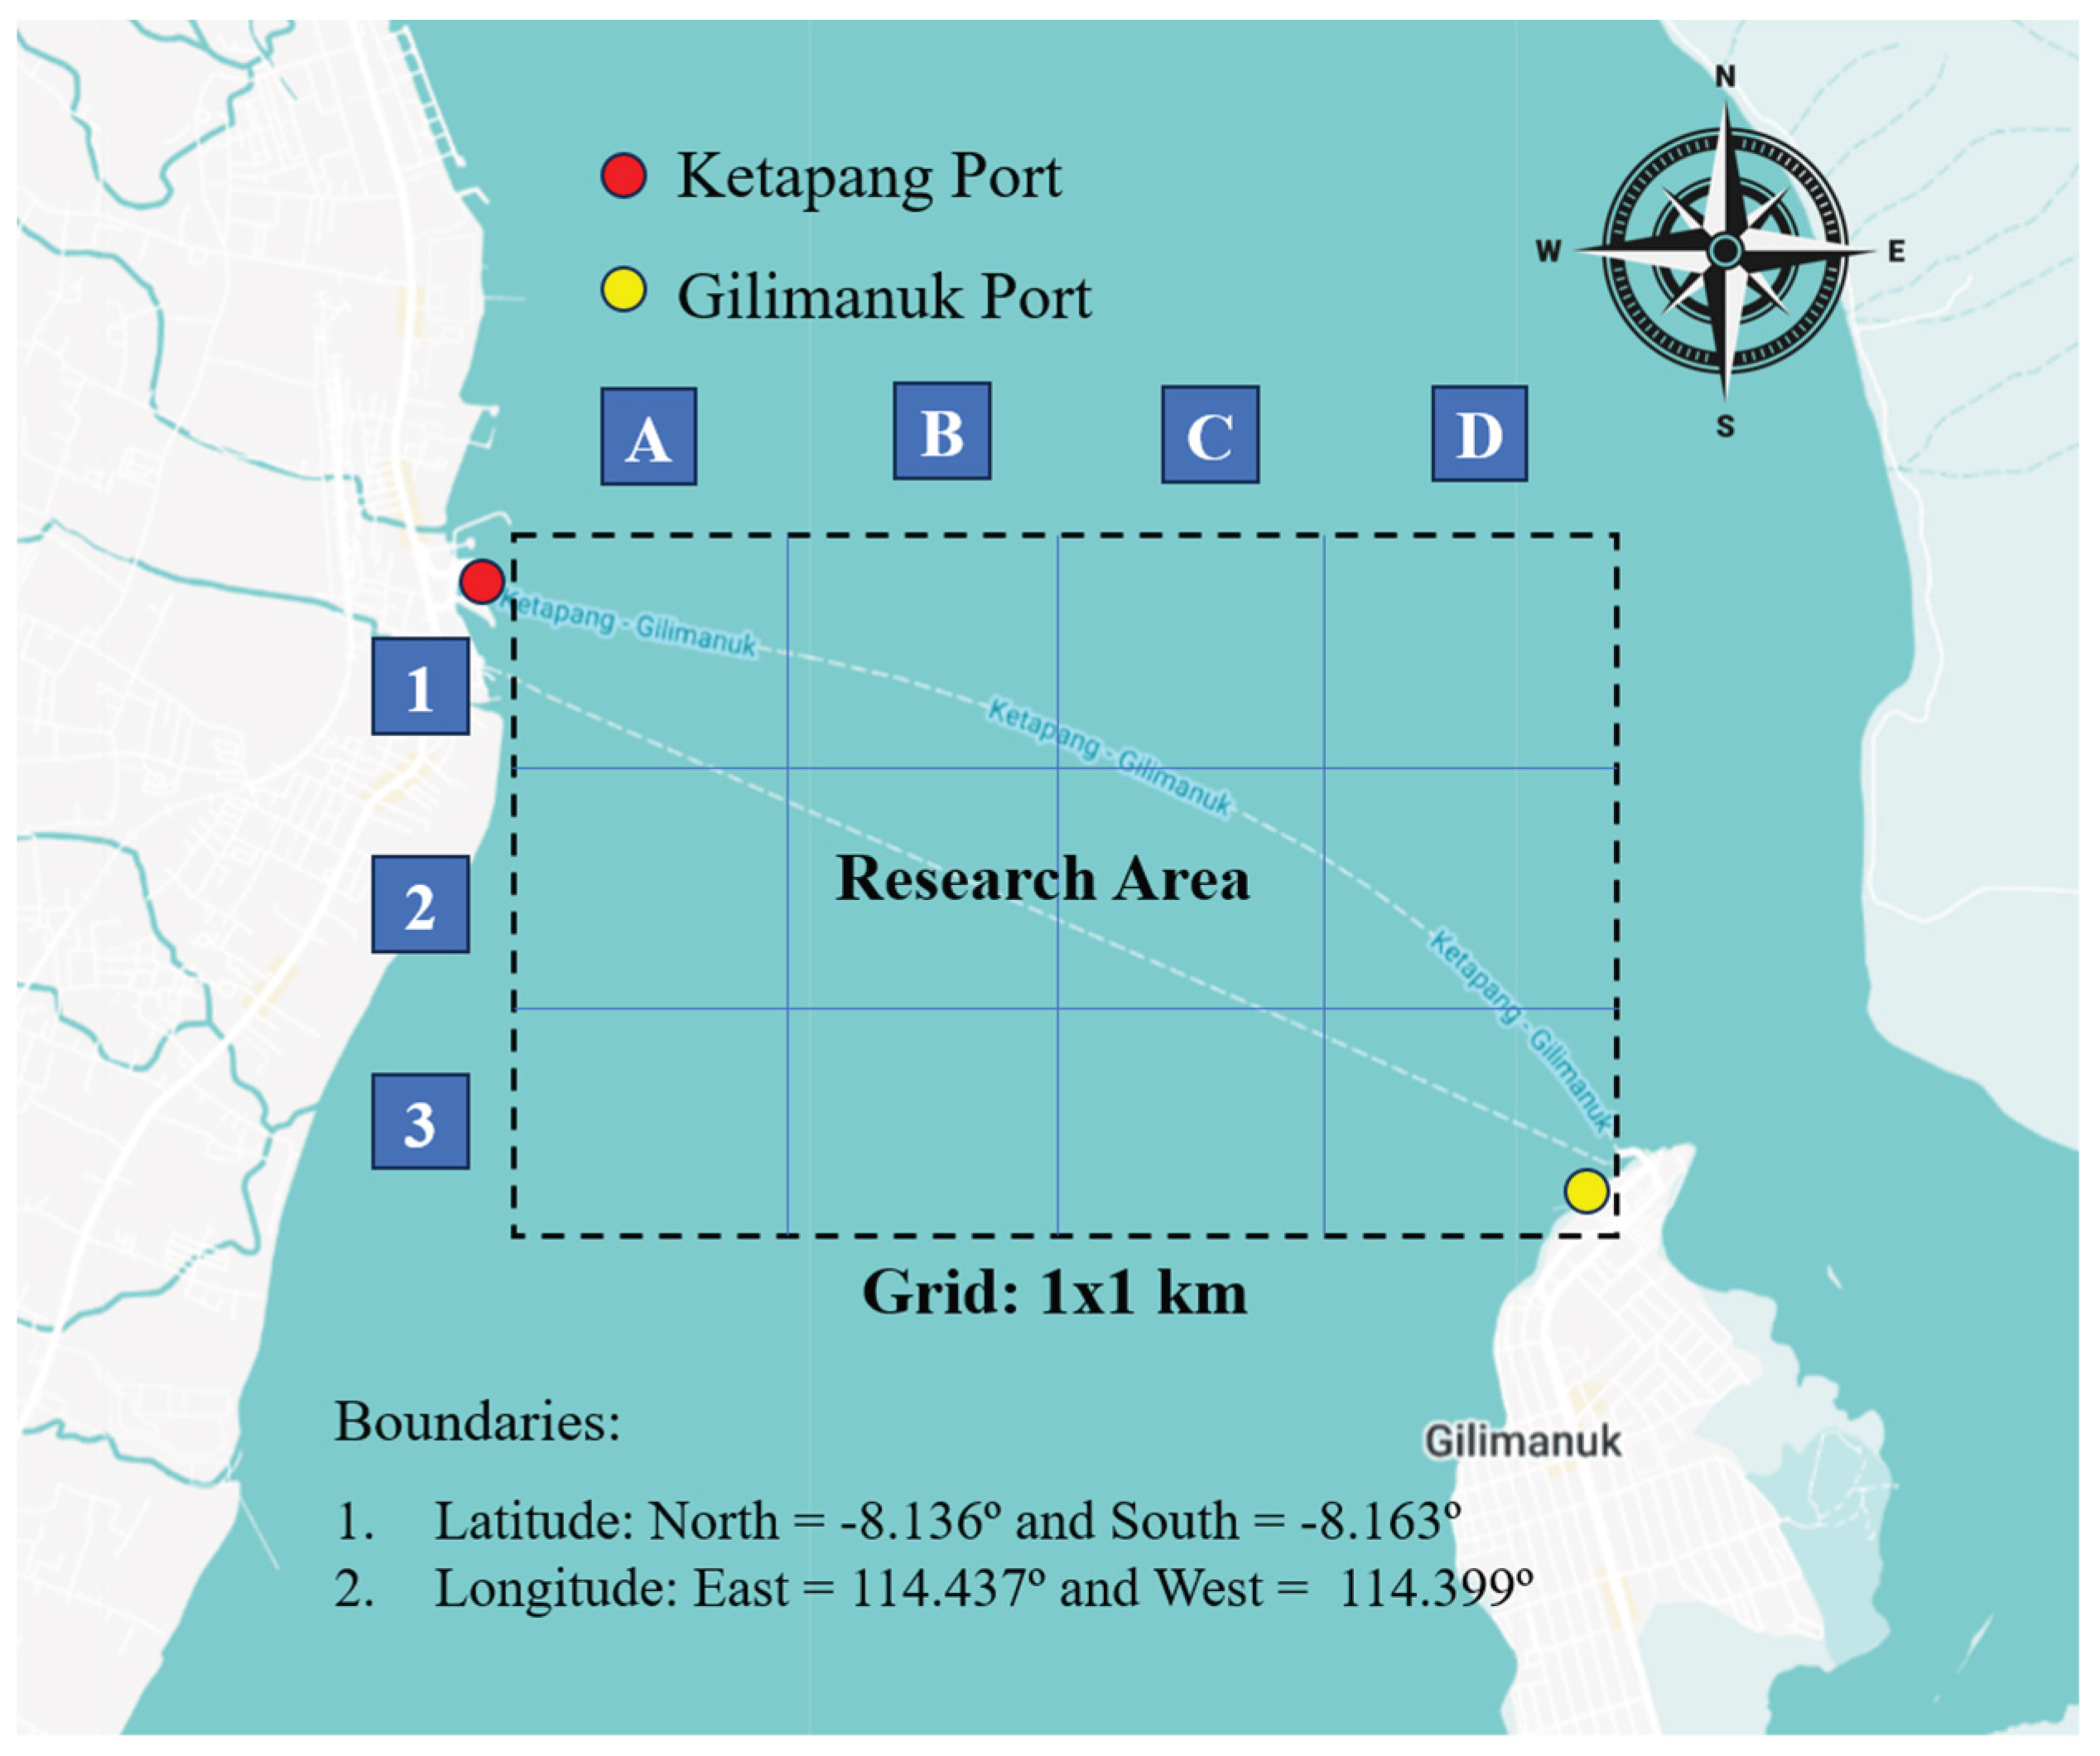
Figure 4.
Study area and grid segmentation in the Lombok Strait.
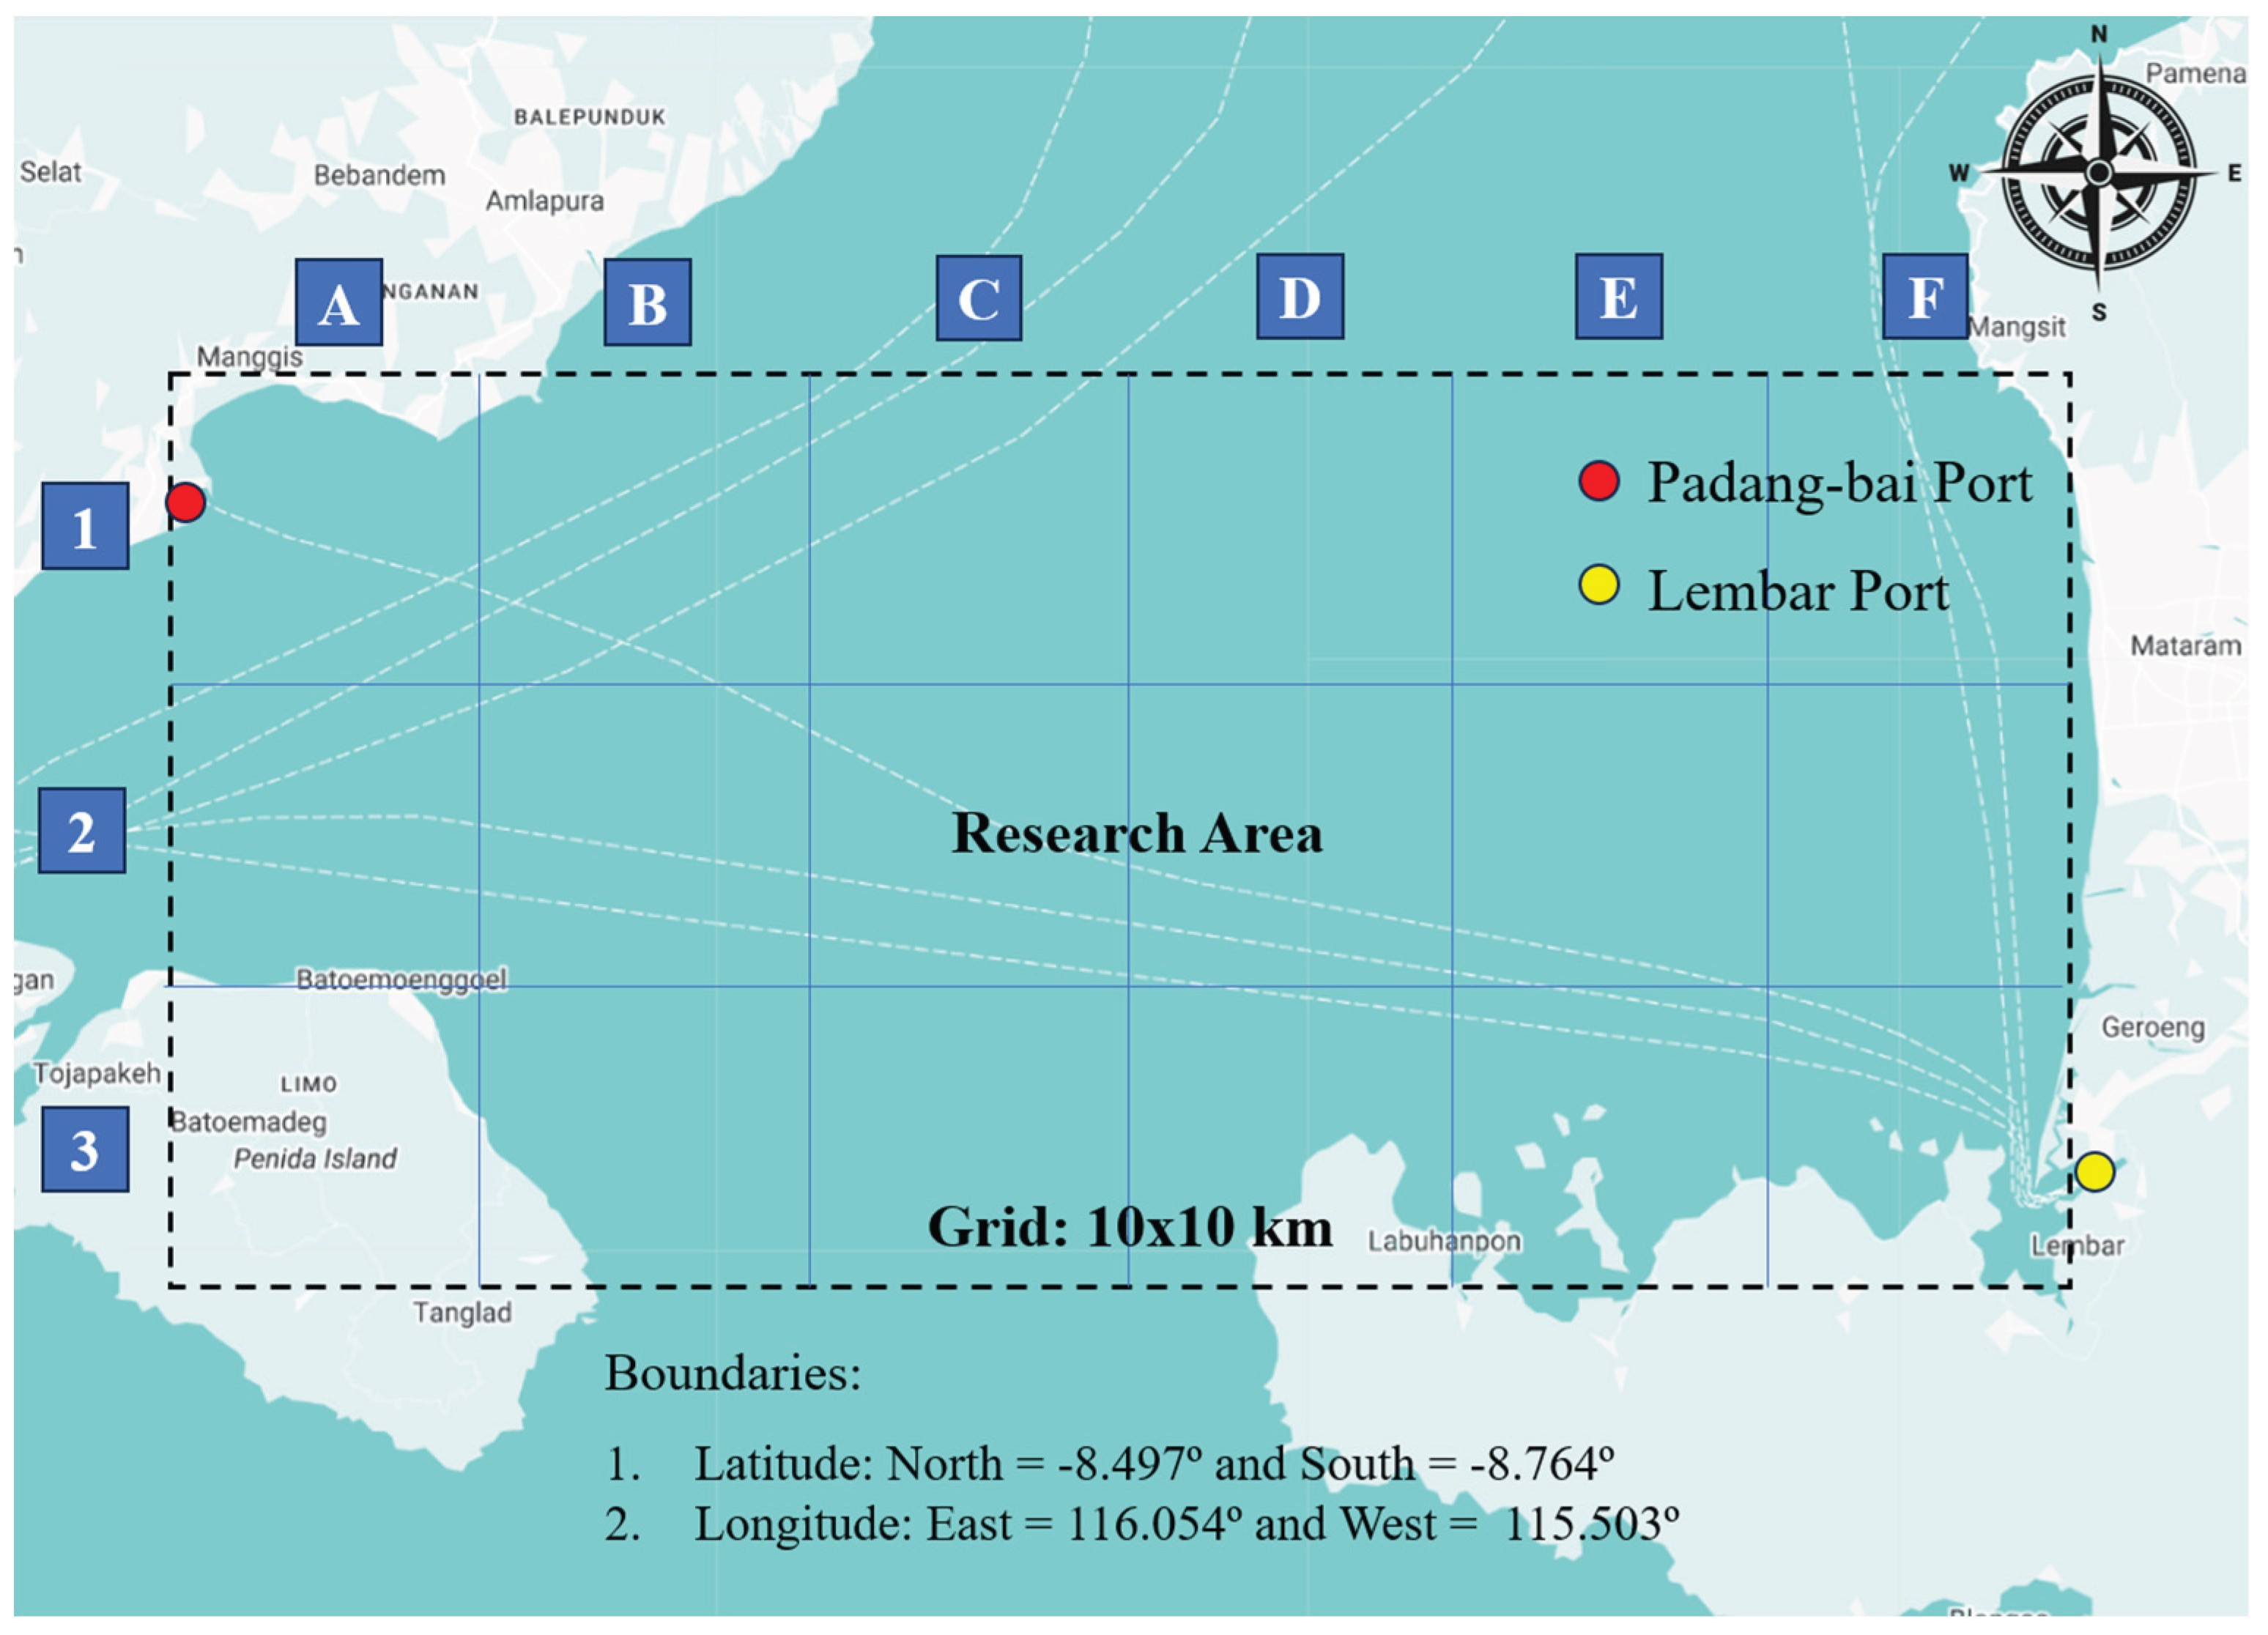
Figure 5.
Wave height and current speed data in the Bali Strait.
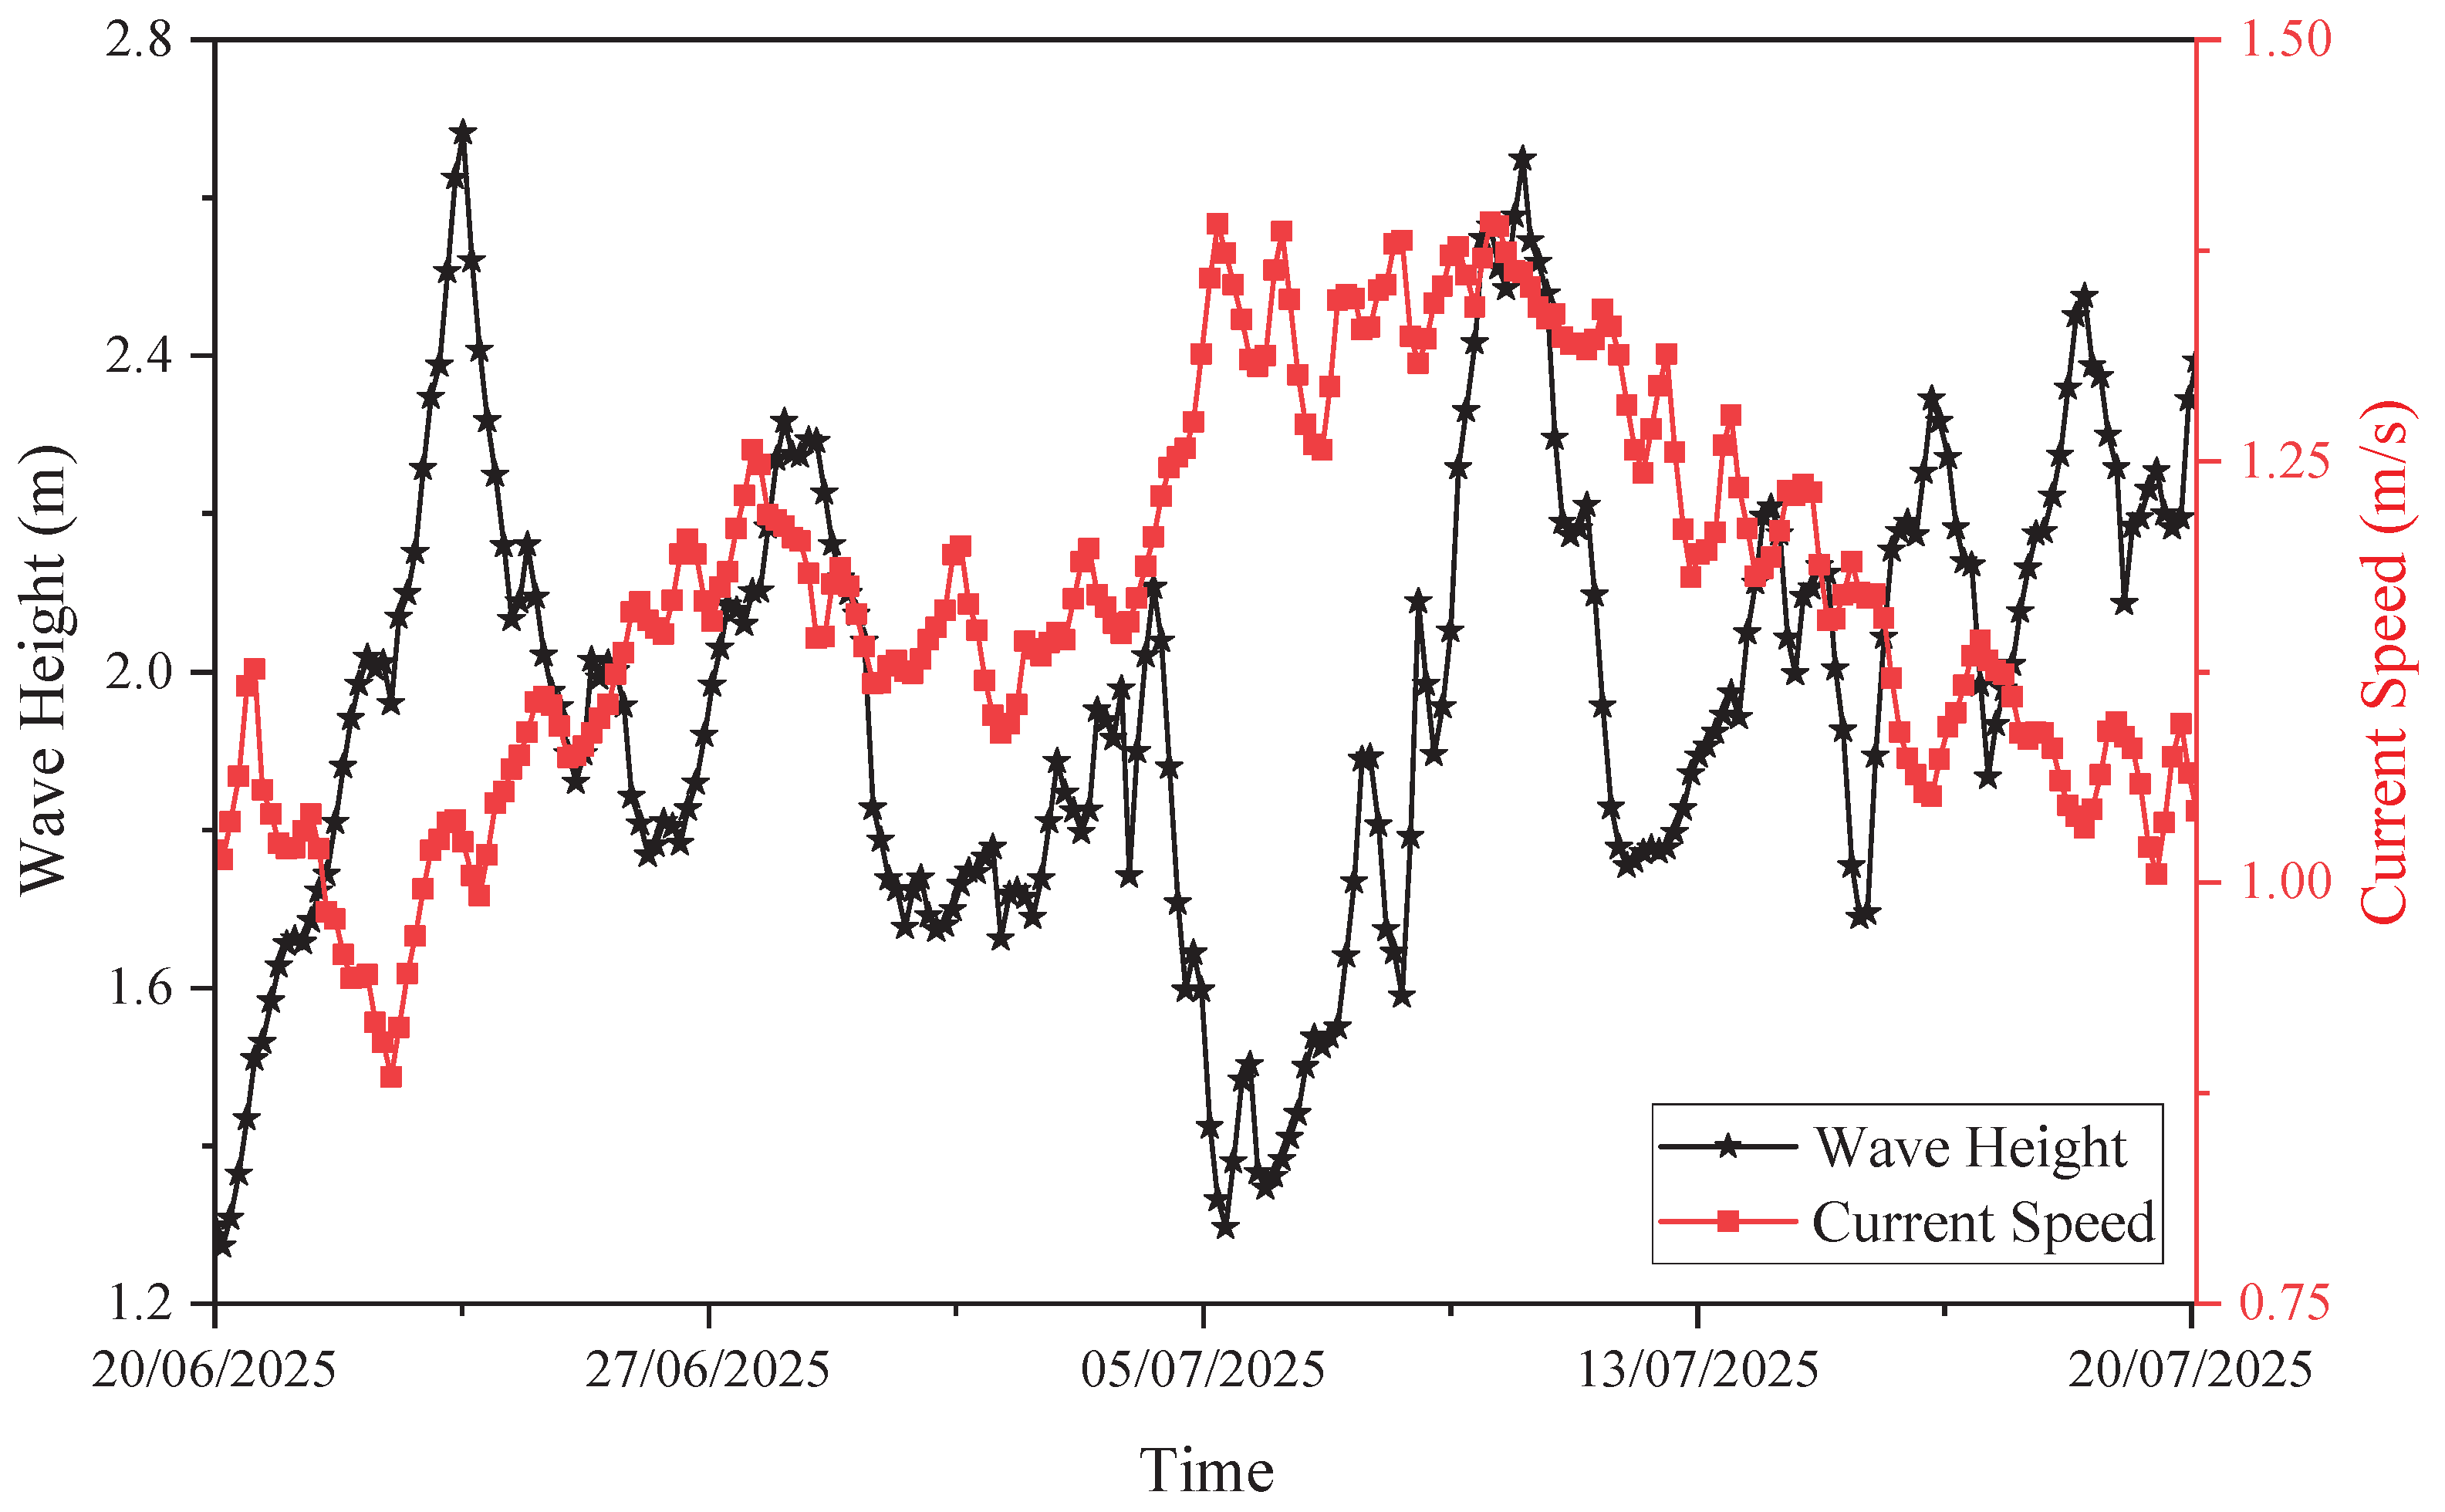
Figure 6.
Wave height and current speed data in the Lombok Strait.
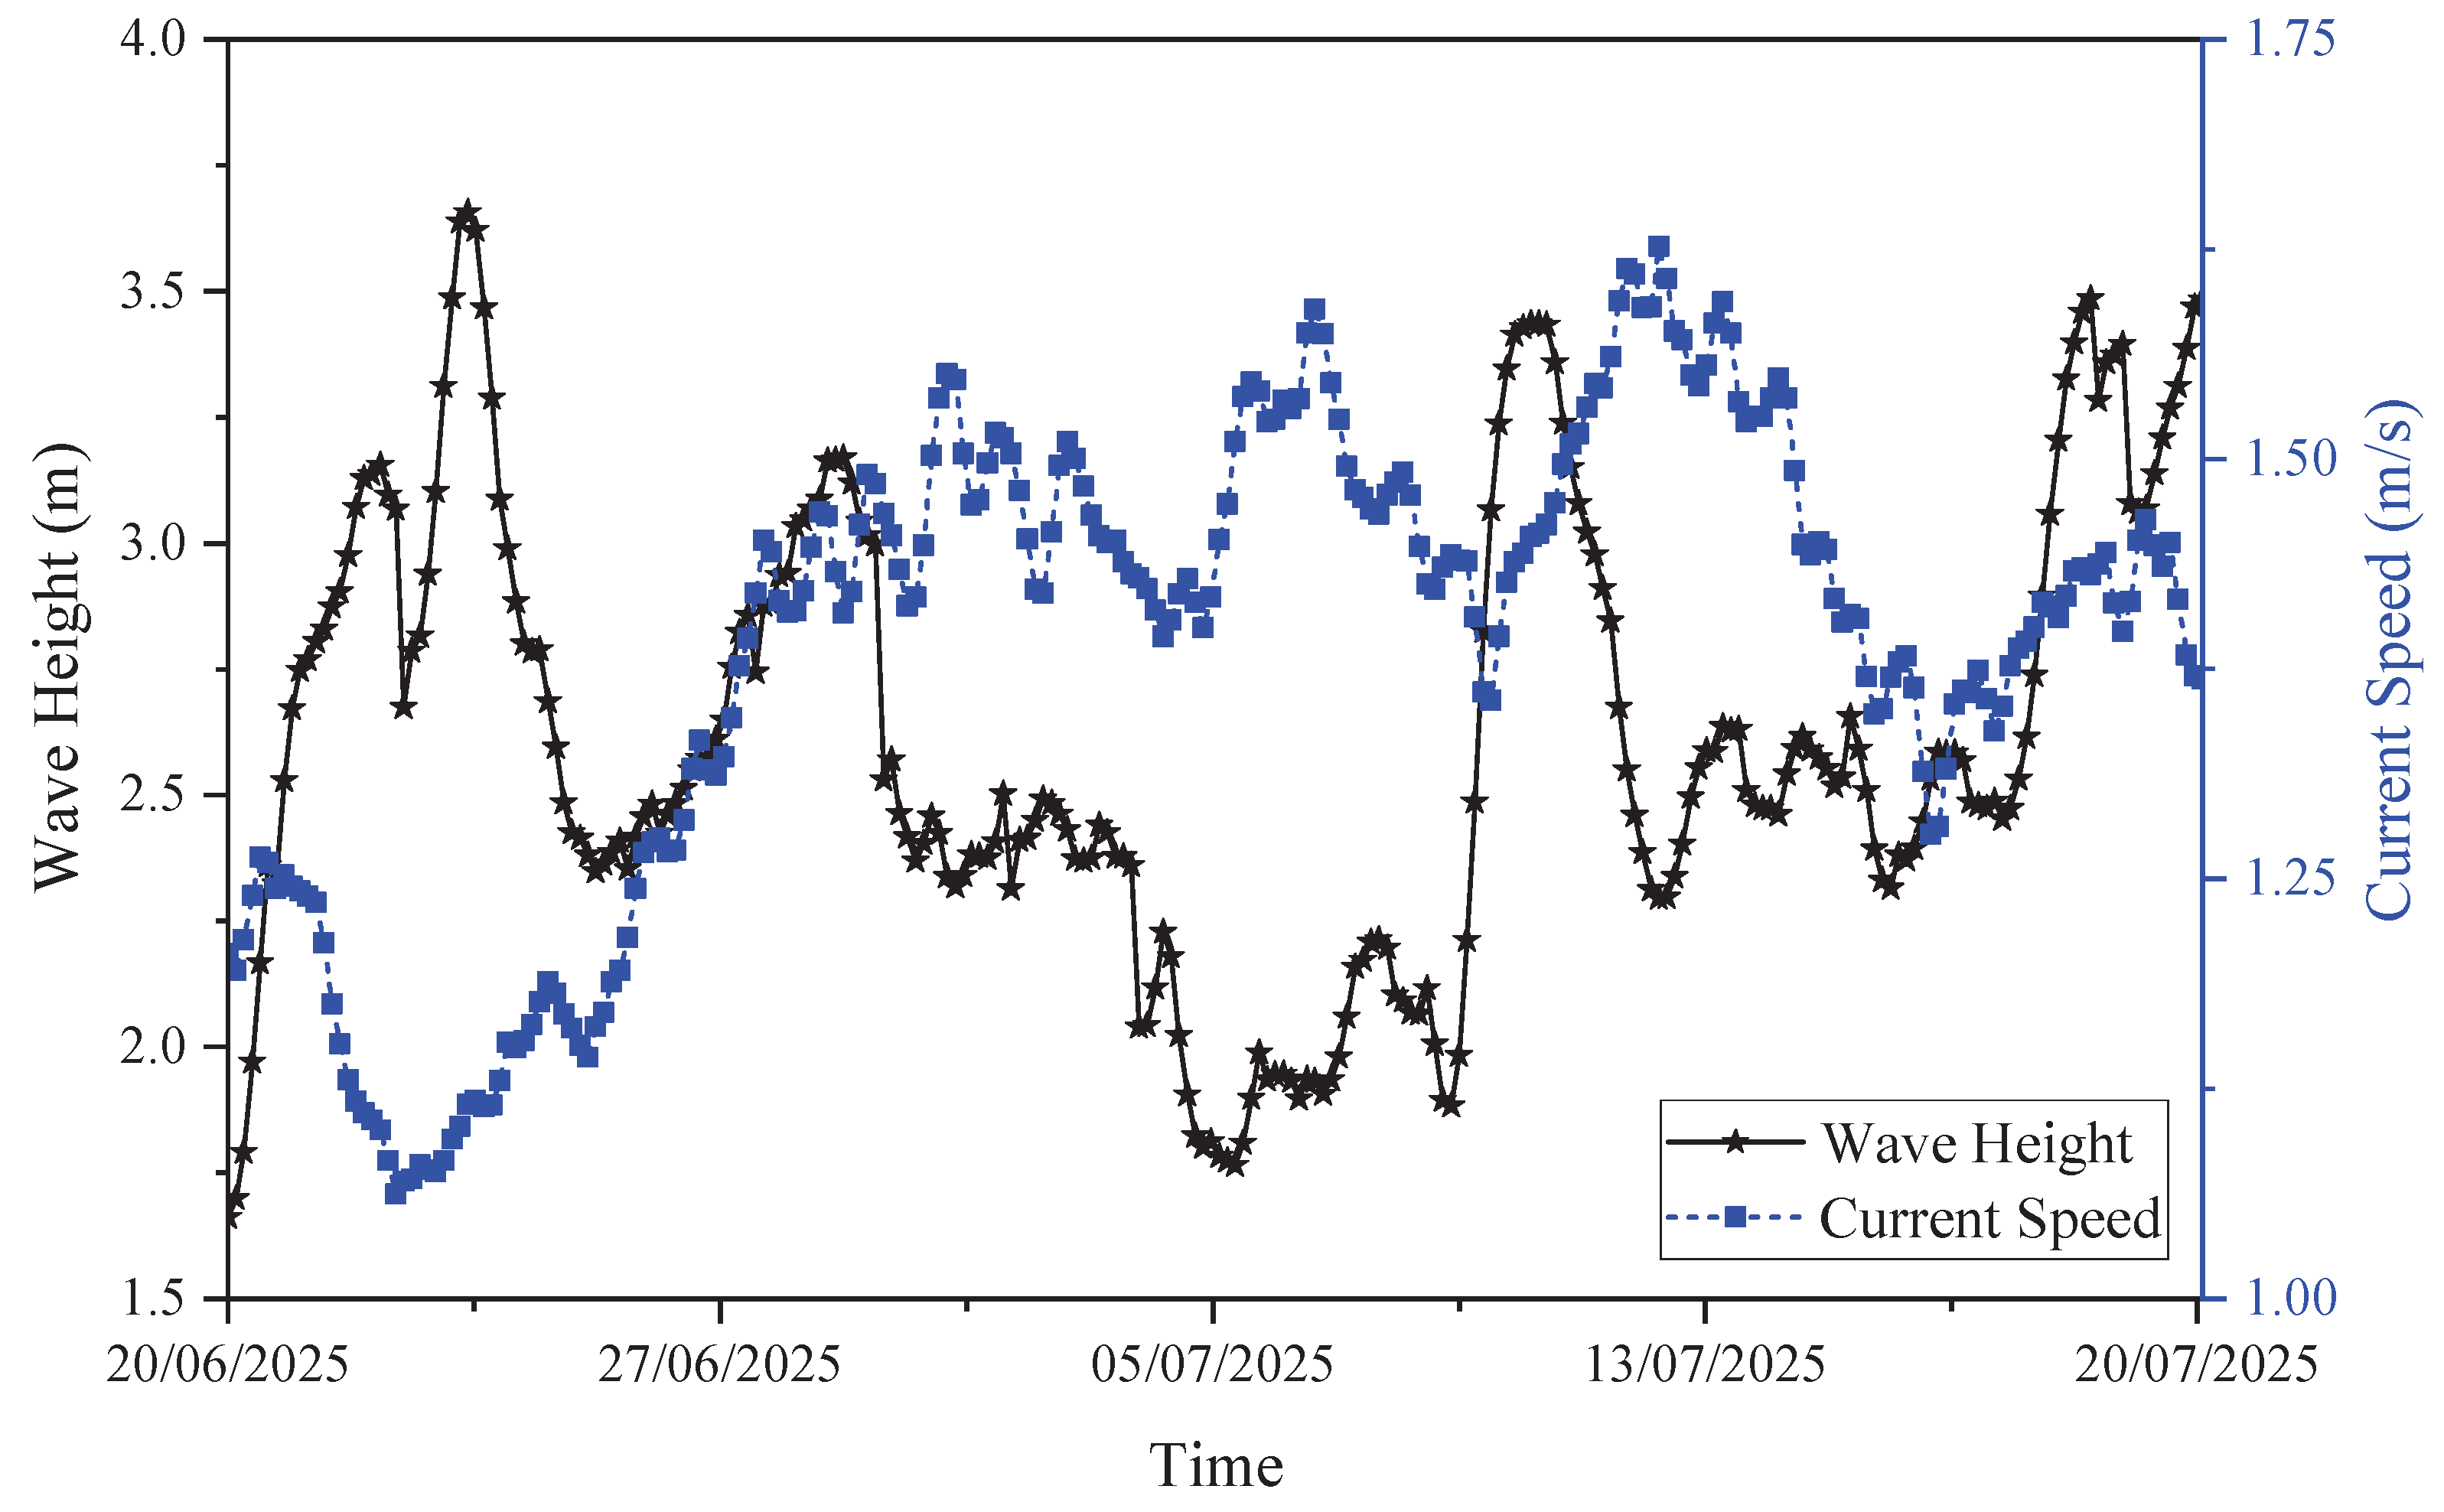
Figure 7.
One-month period AIS data in Bali Strait.
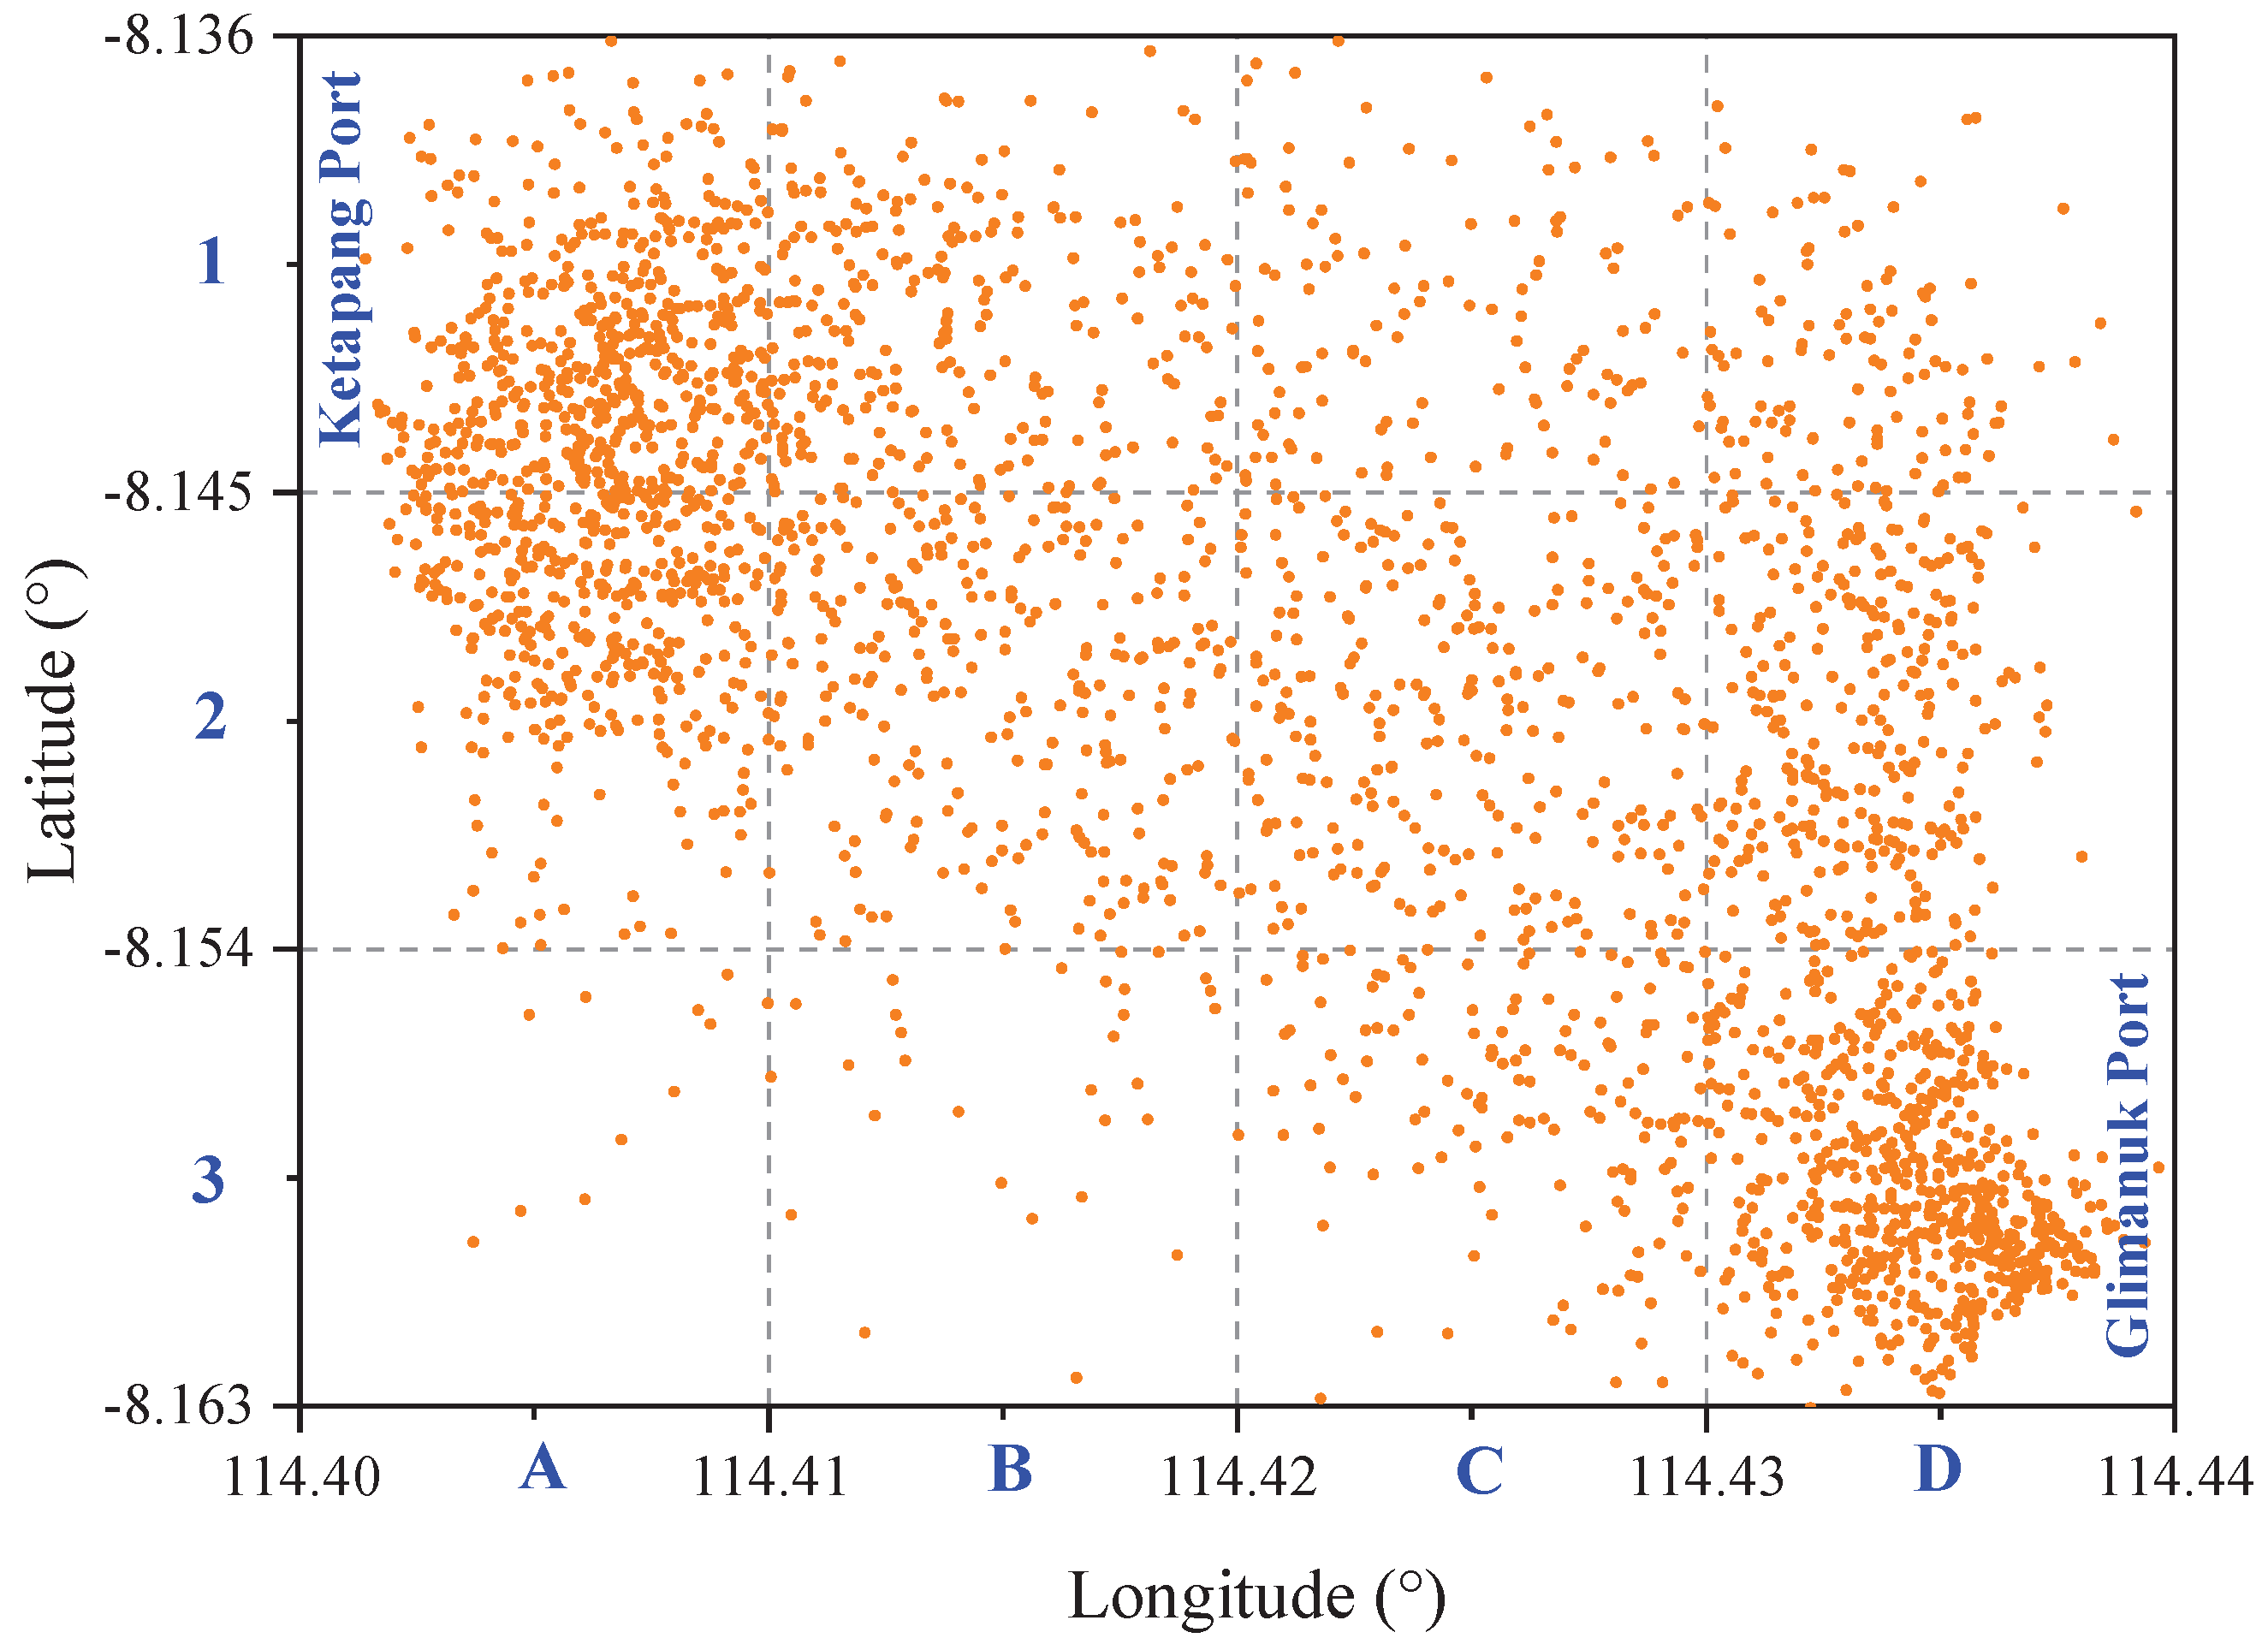
Figure 8.
One-month period AIS data in Lombok Strait.
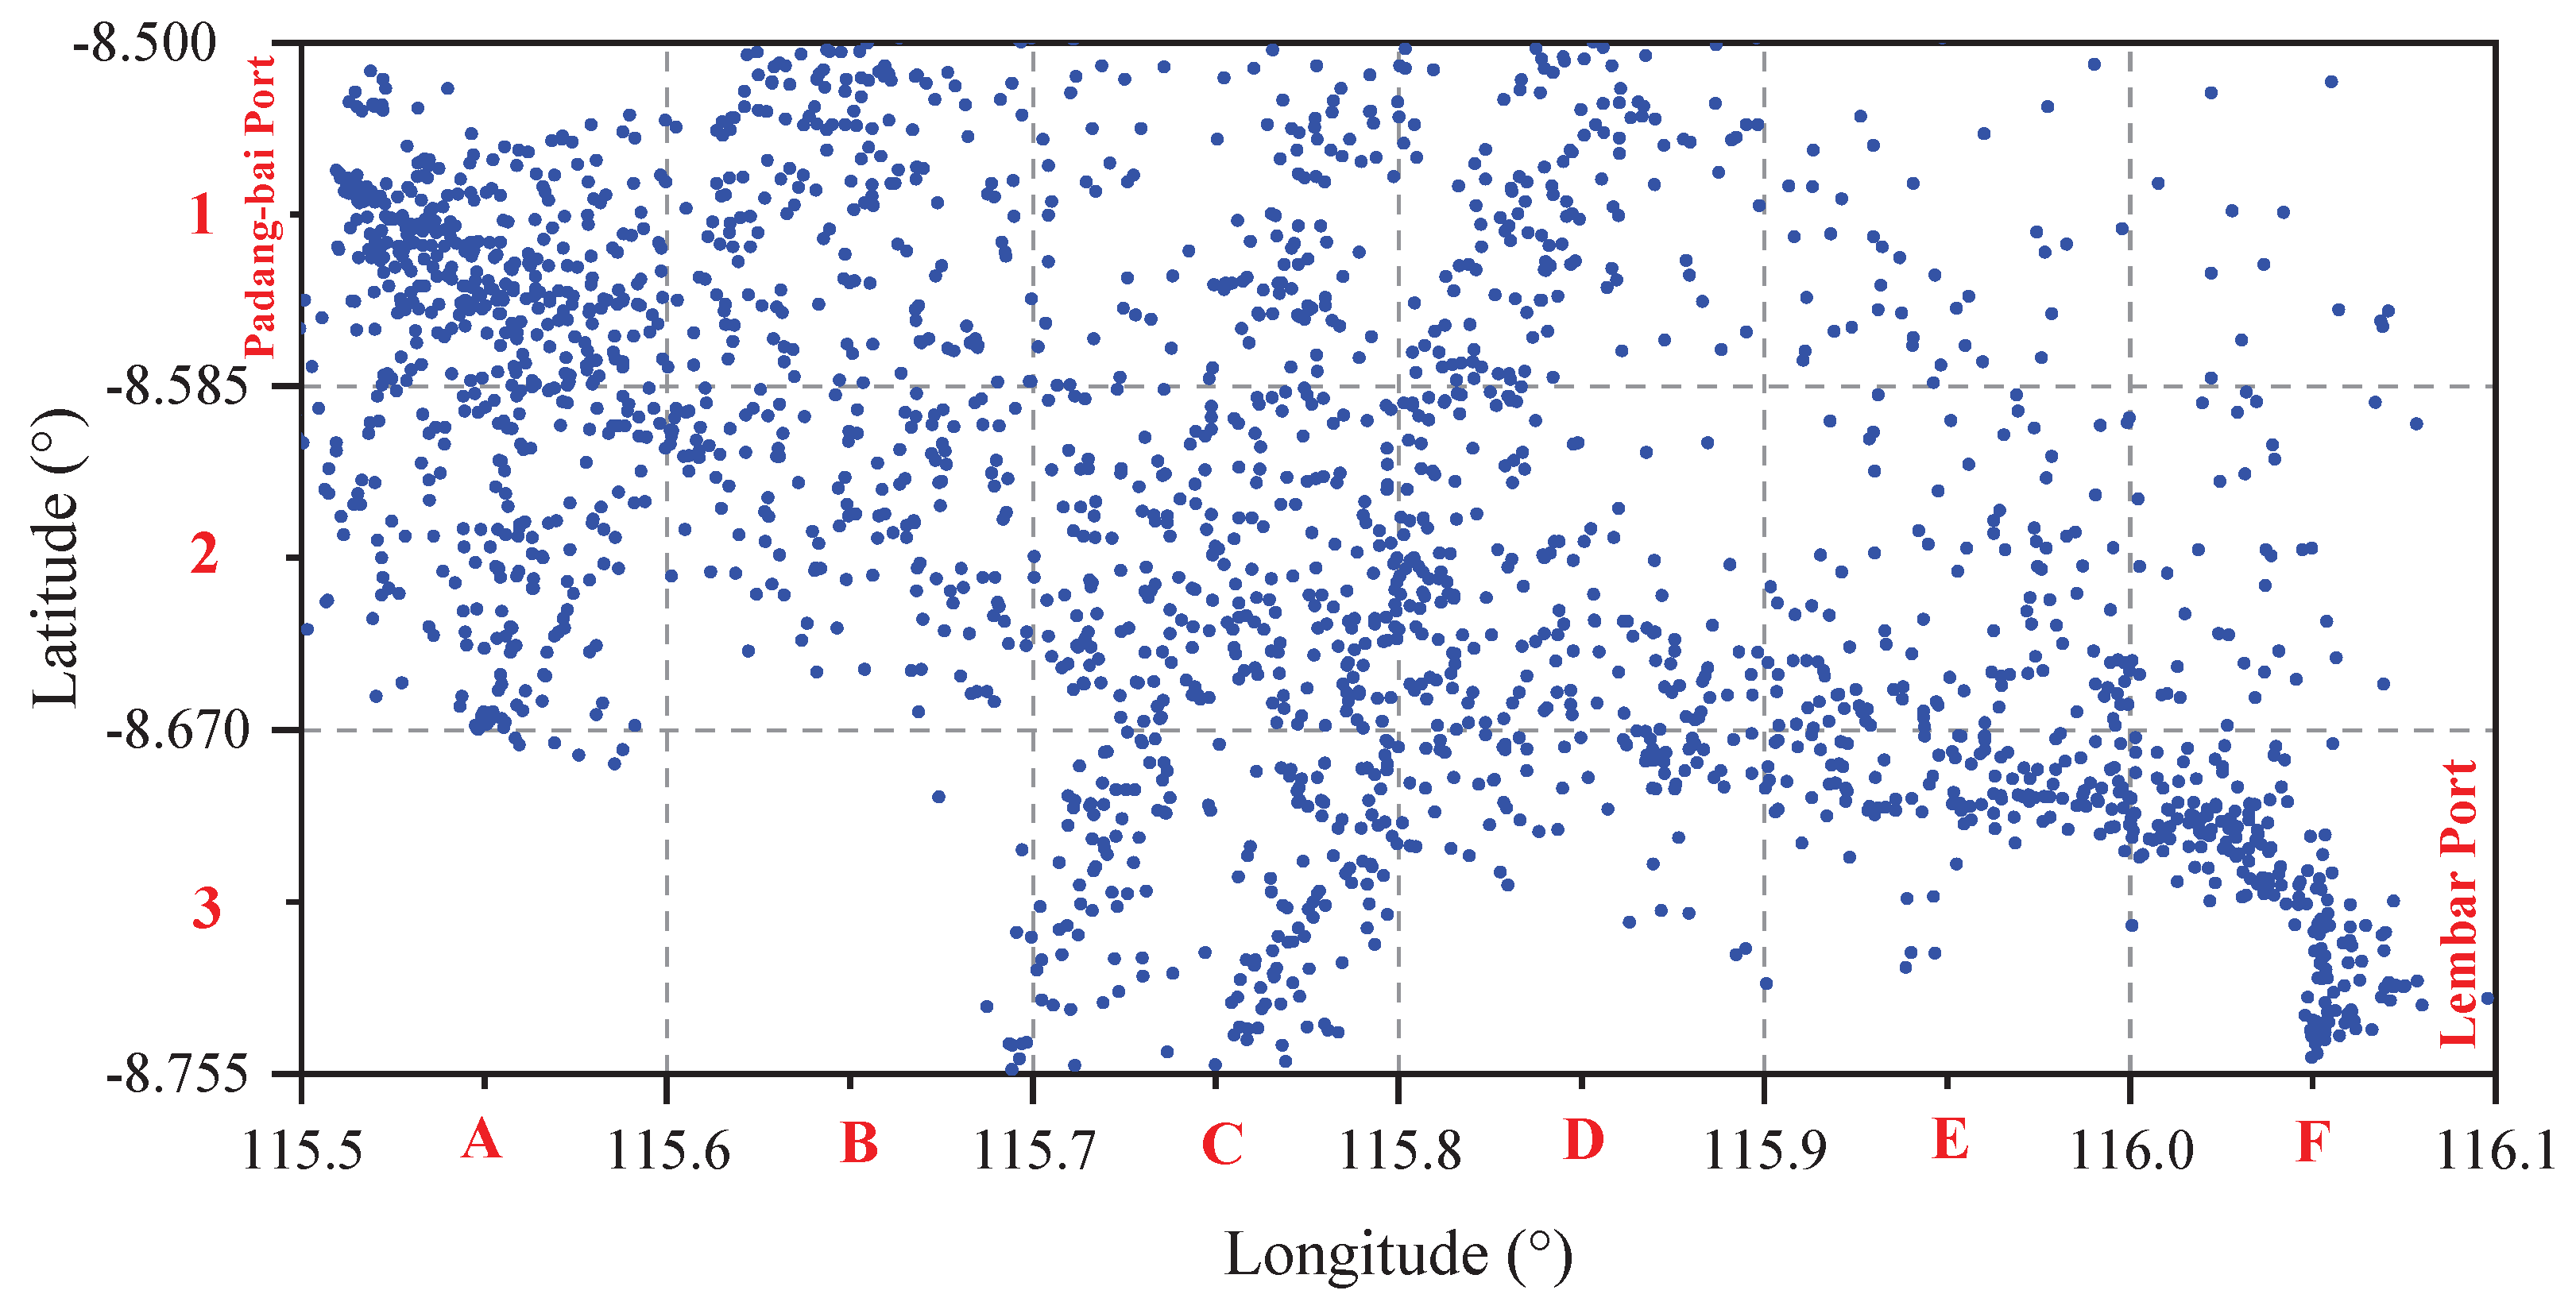
Figure 9.
Maximum safety index value for each time variation in Bali Strait.
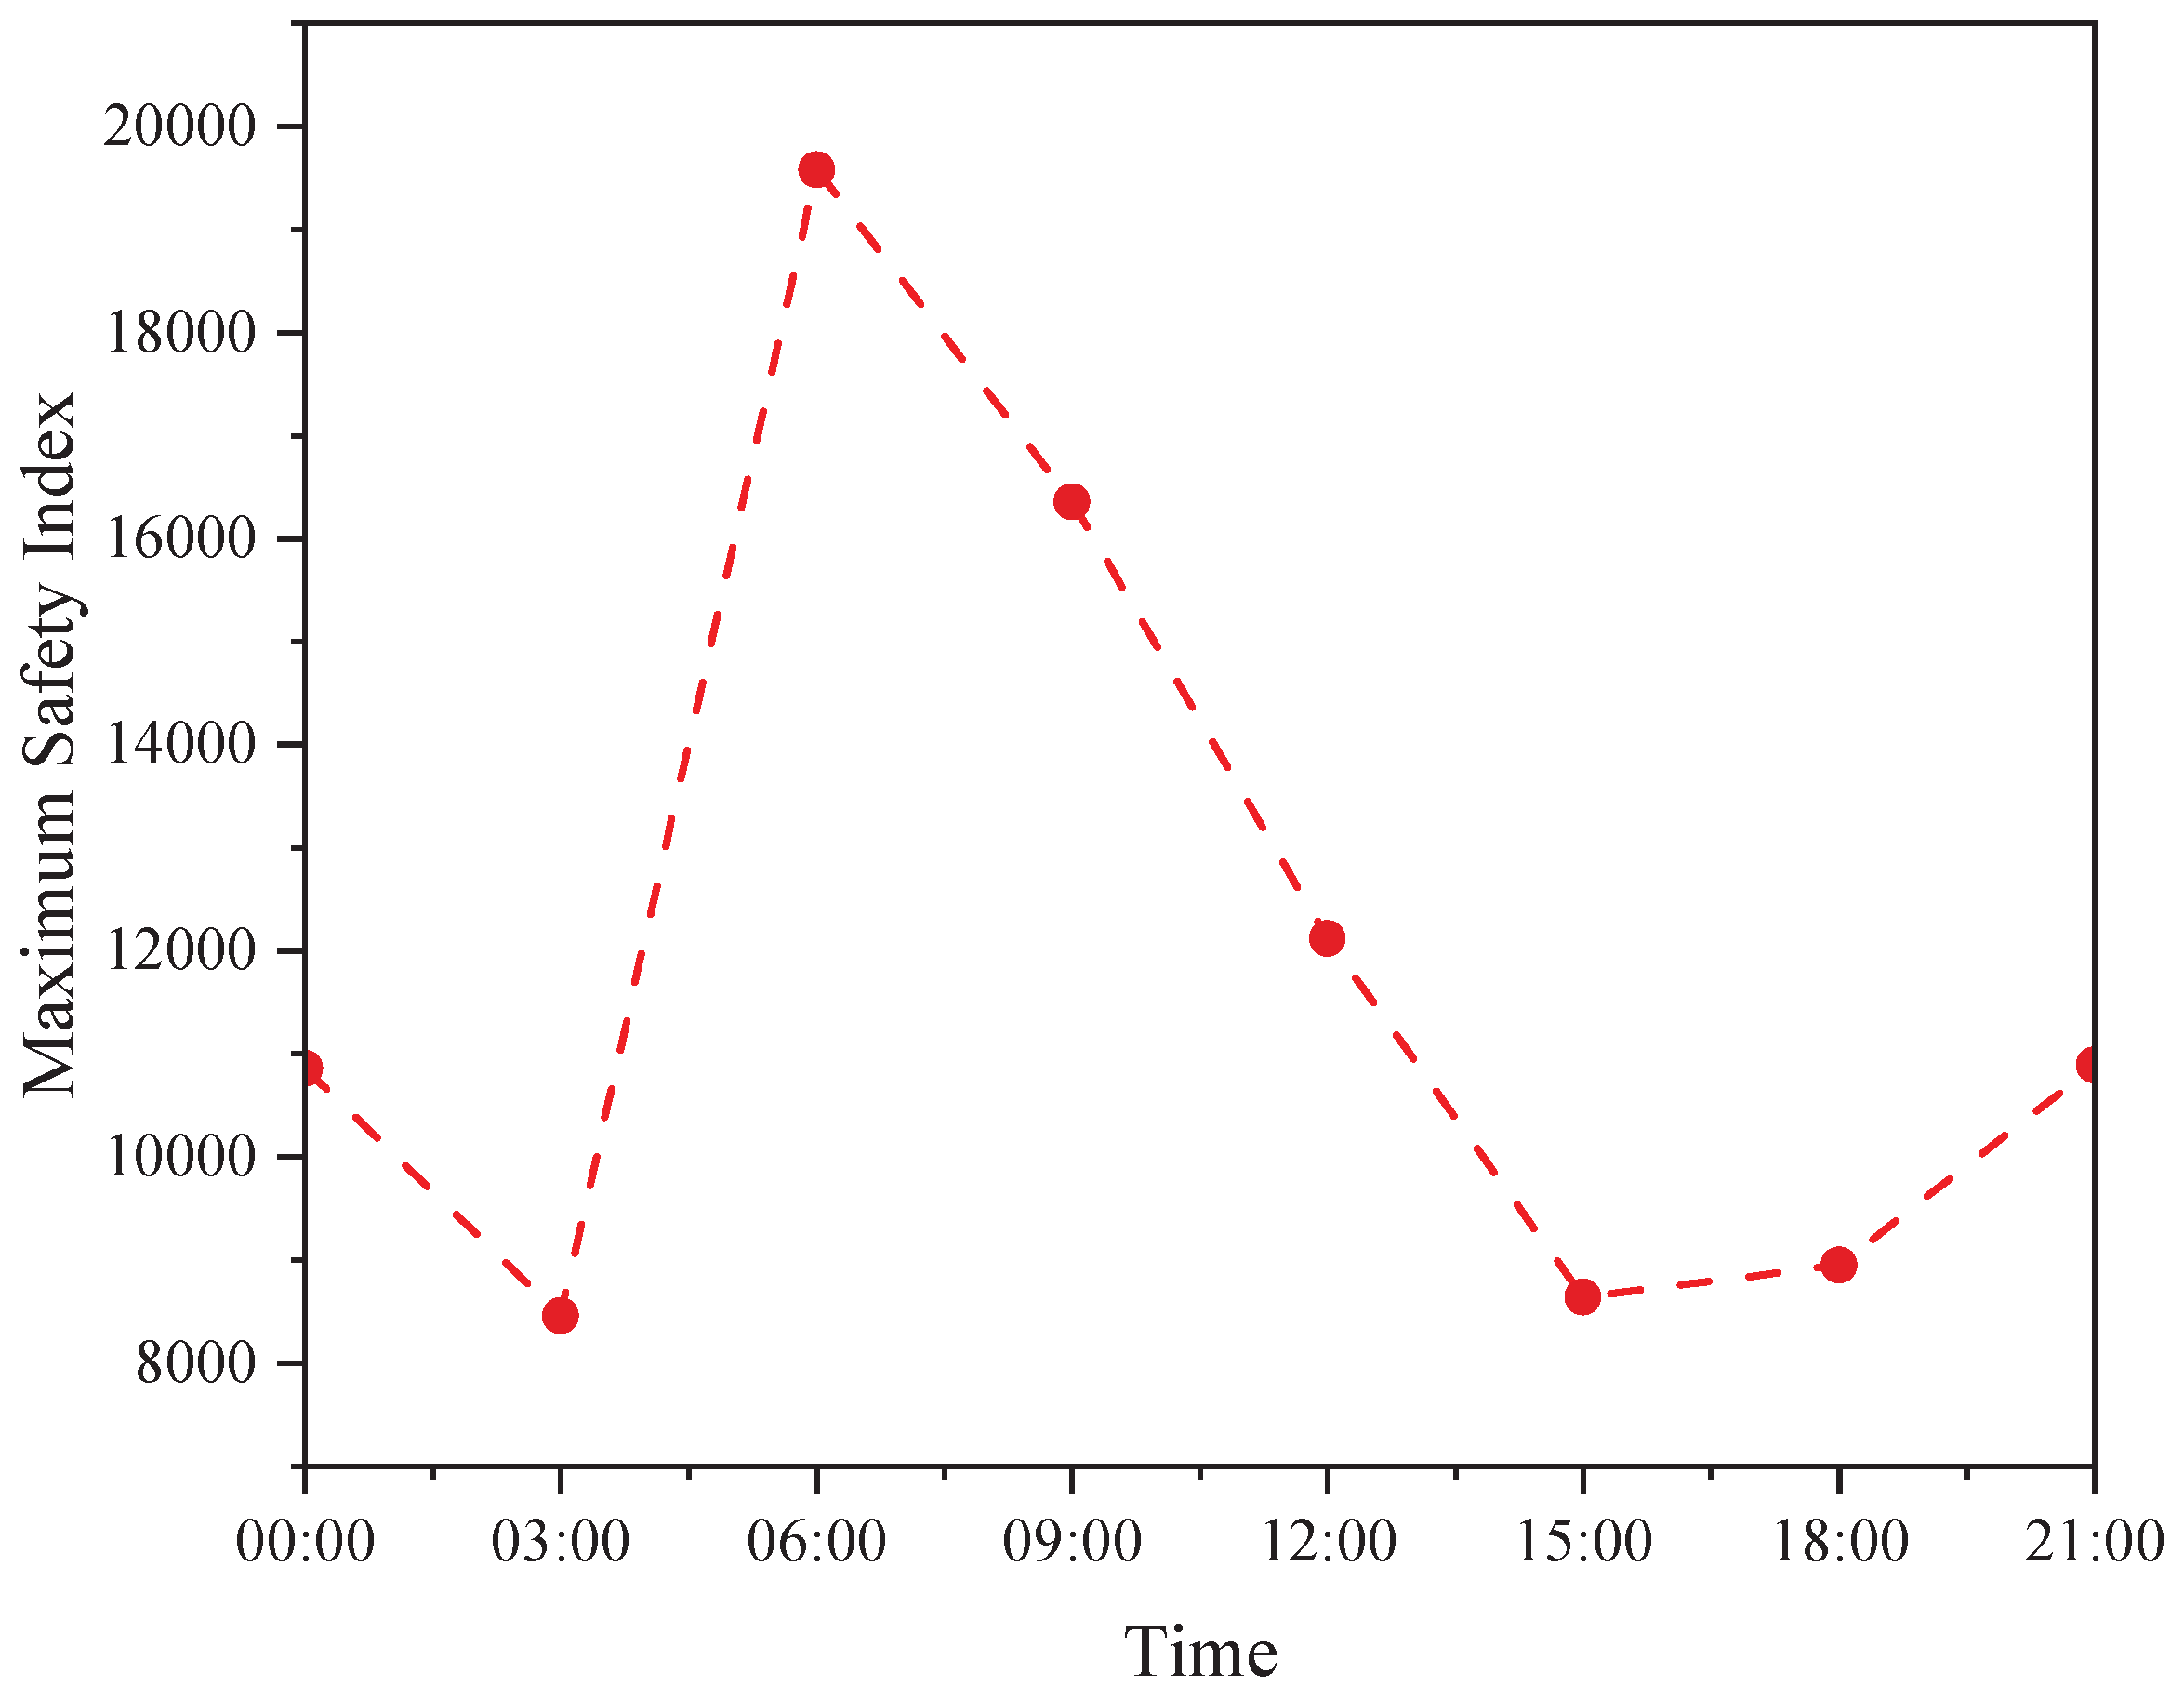
Figure 10.
Maximum safety index value for each day variation in Bali Strait.
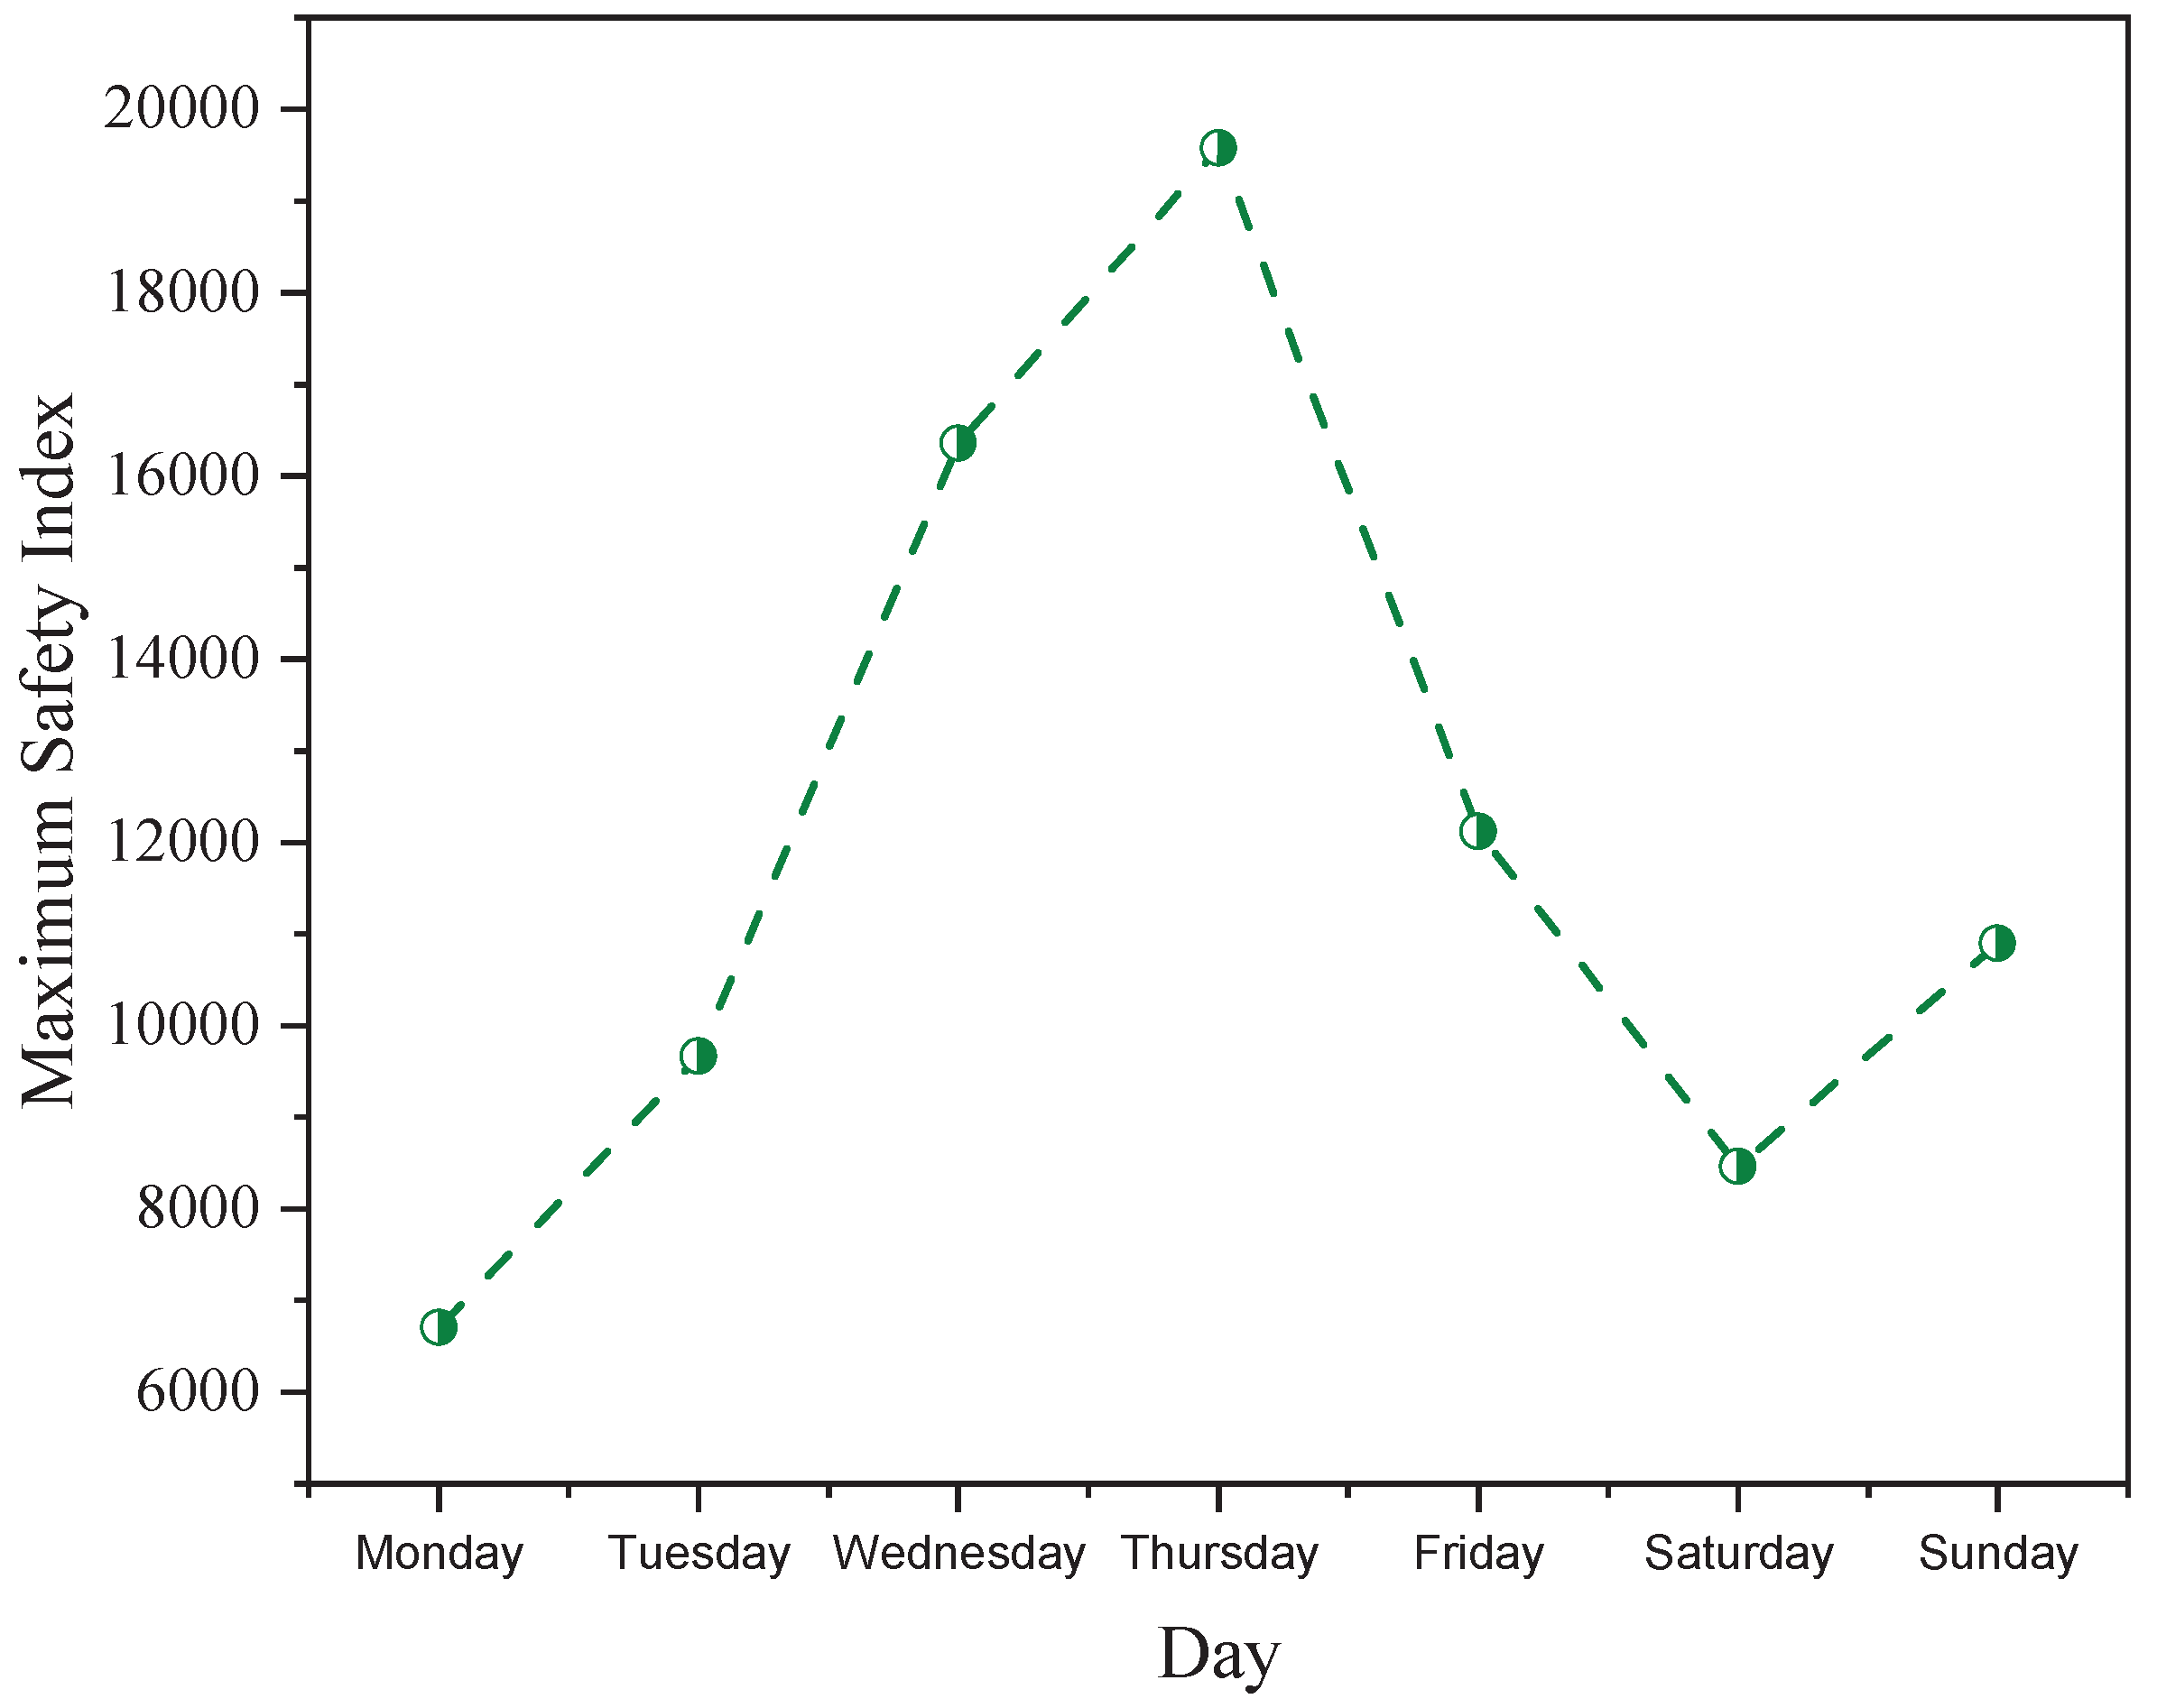
Figure 11.
(a) Average safety index (Model I) in each segment of Bali Strait and (b) Average ship count in each segment of Bali Strait.
Figure 11.
(a) Average safety index (Model I) in each segment of Bali Strait and (b) Average ship count in each segment of Bali Strait.
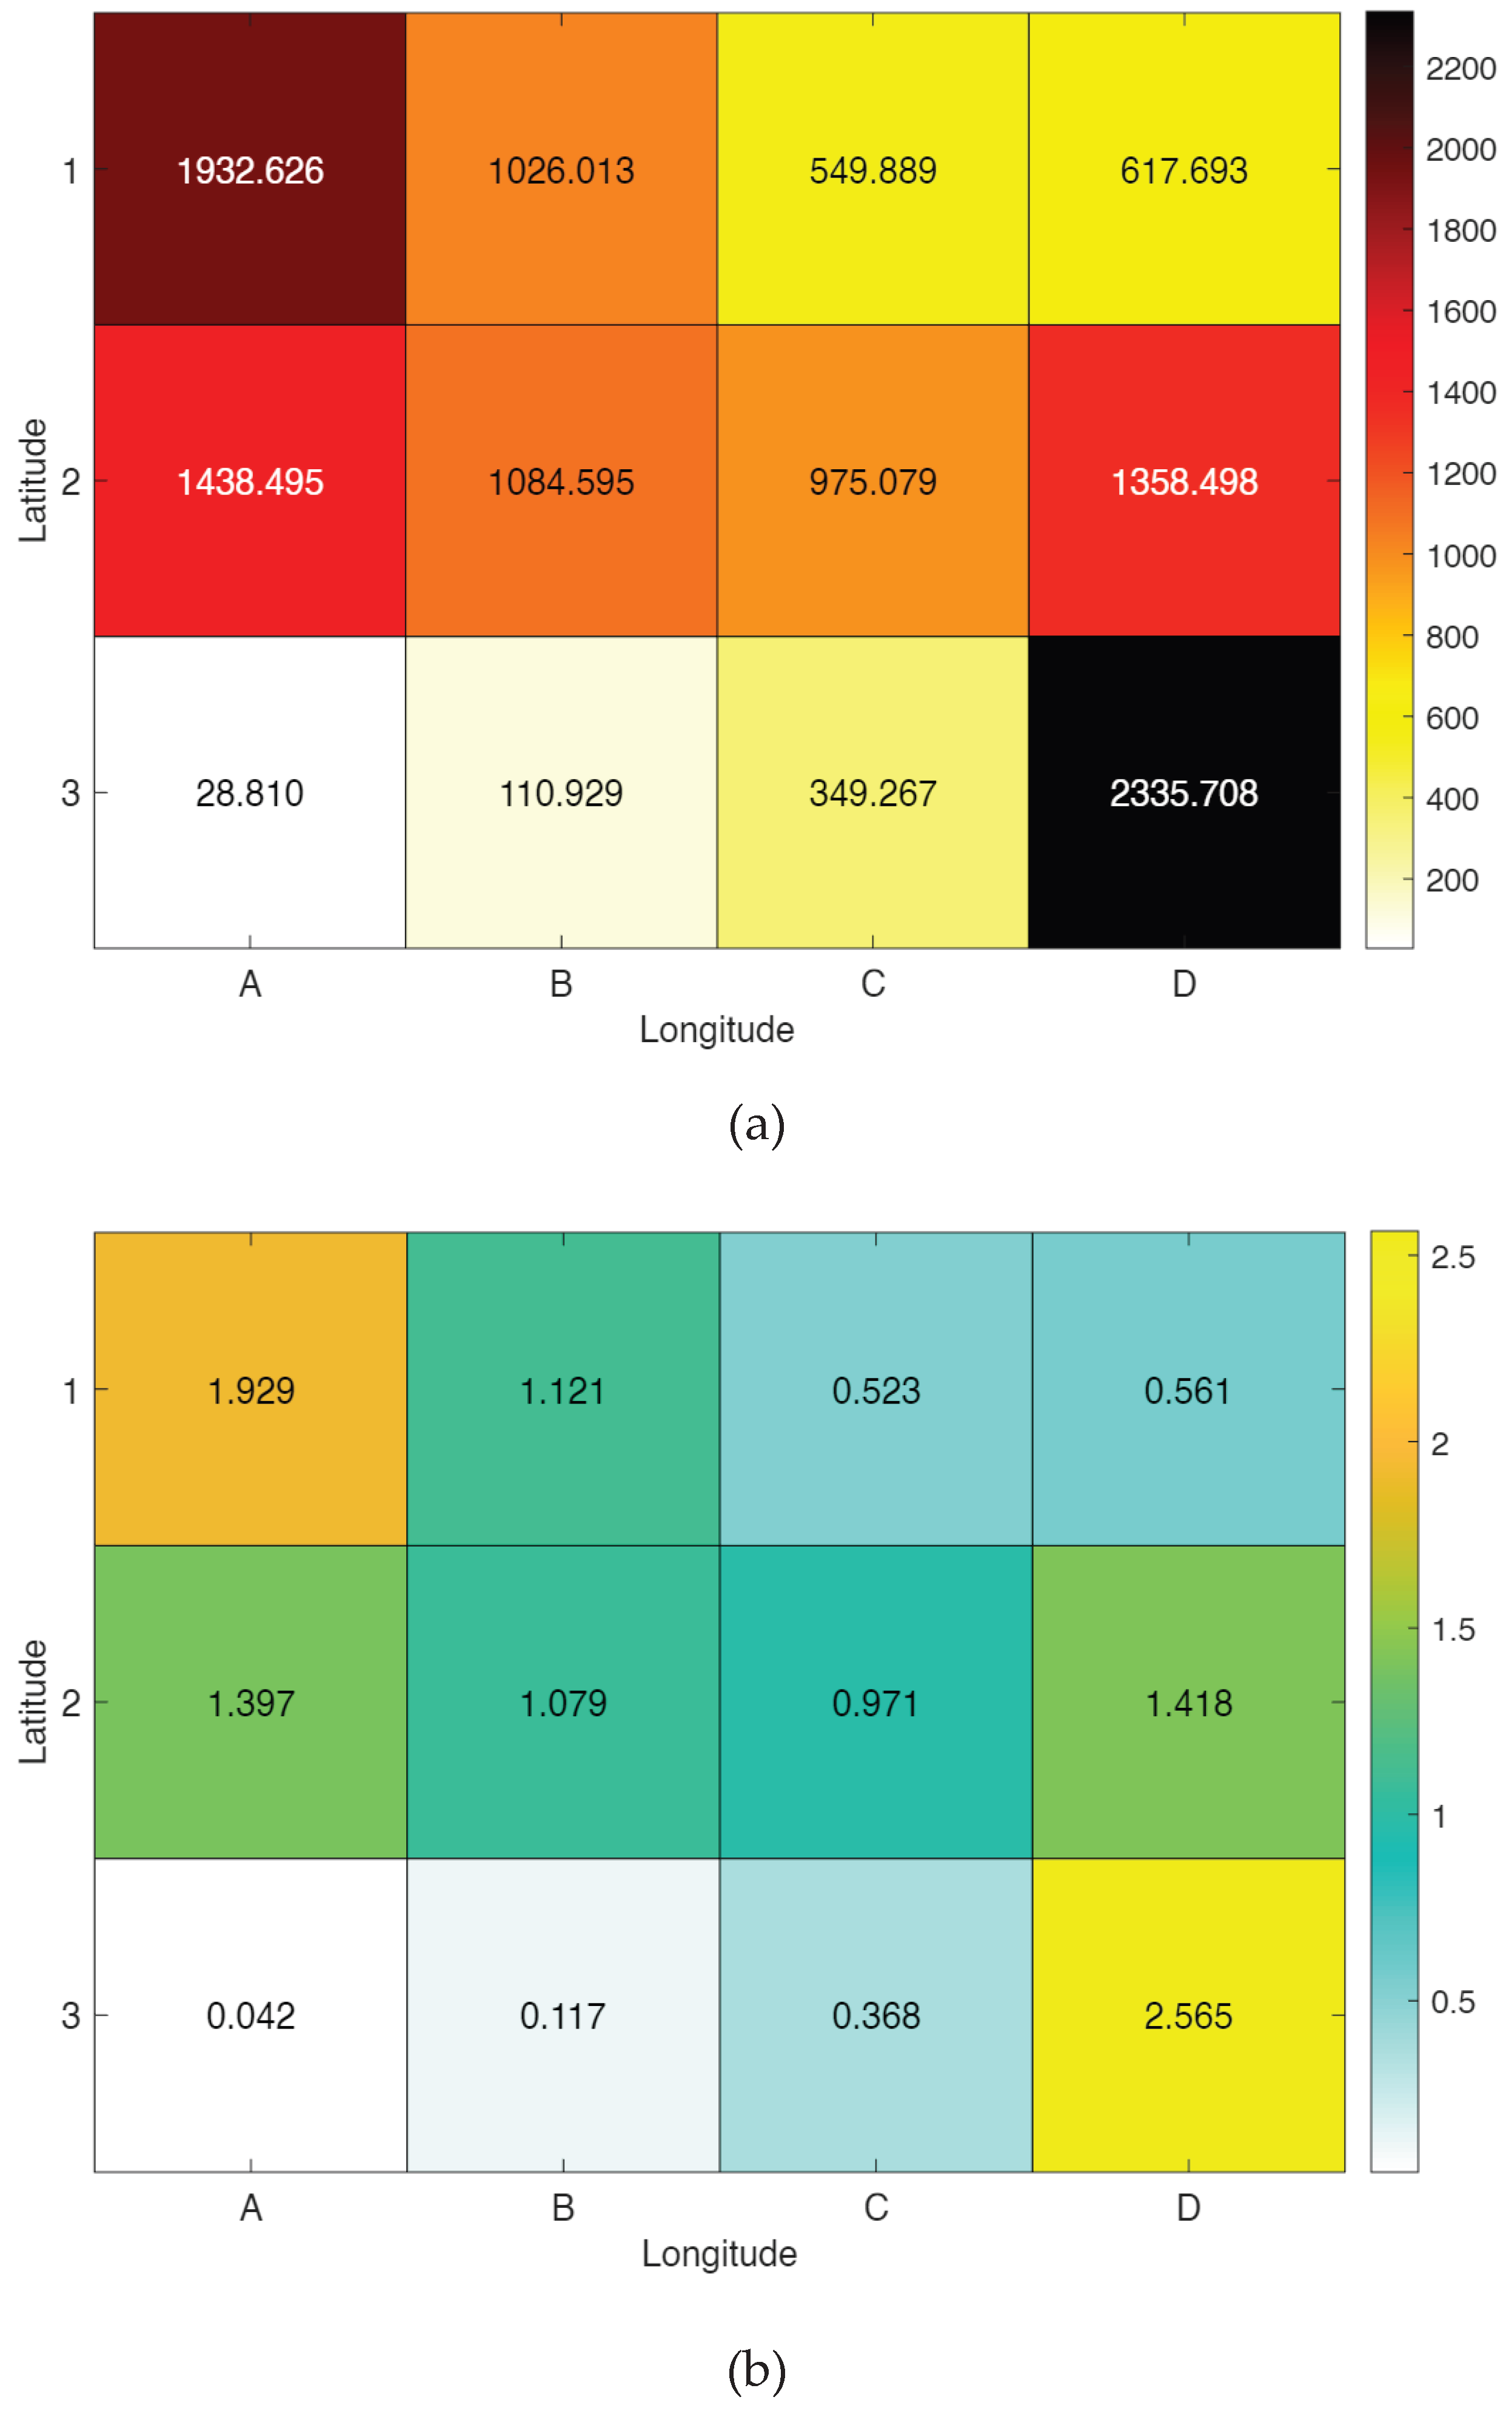
Figure 12.
Maximum safety index value for each time variation in Lombok Strait.
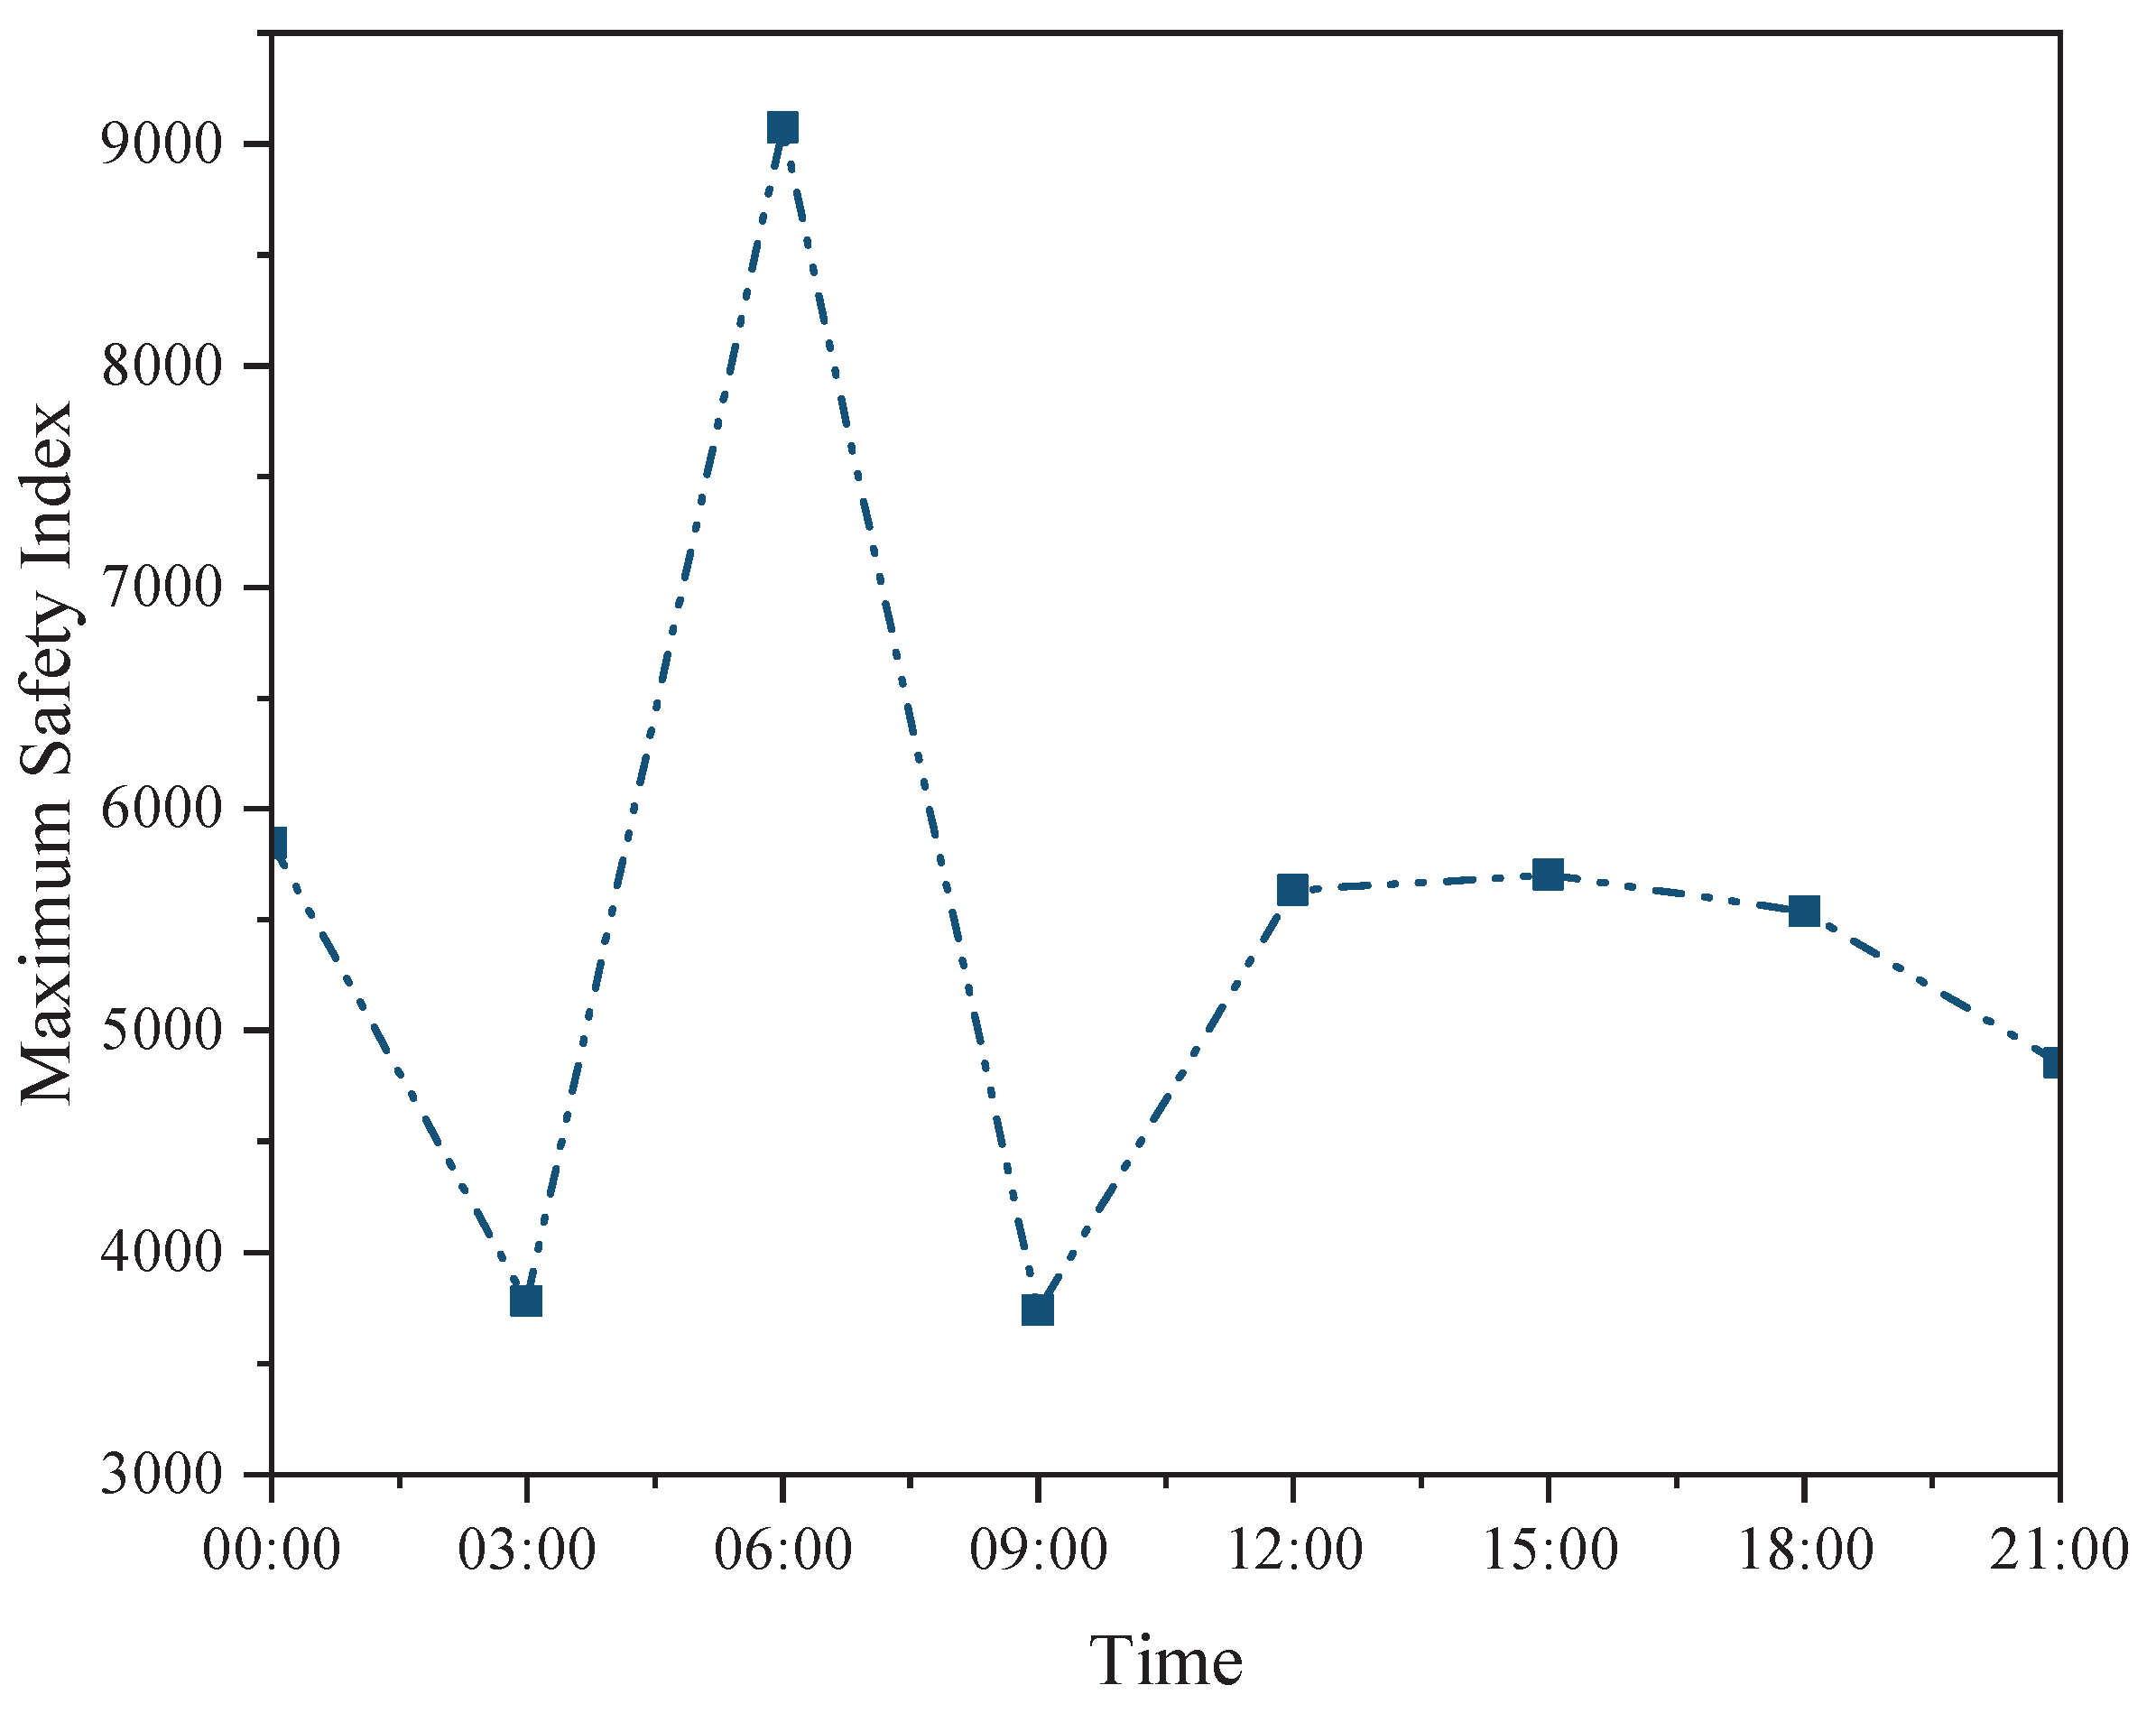
Figure 13.
Maximum safety index value for each day variation in Lombok Strait.
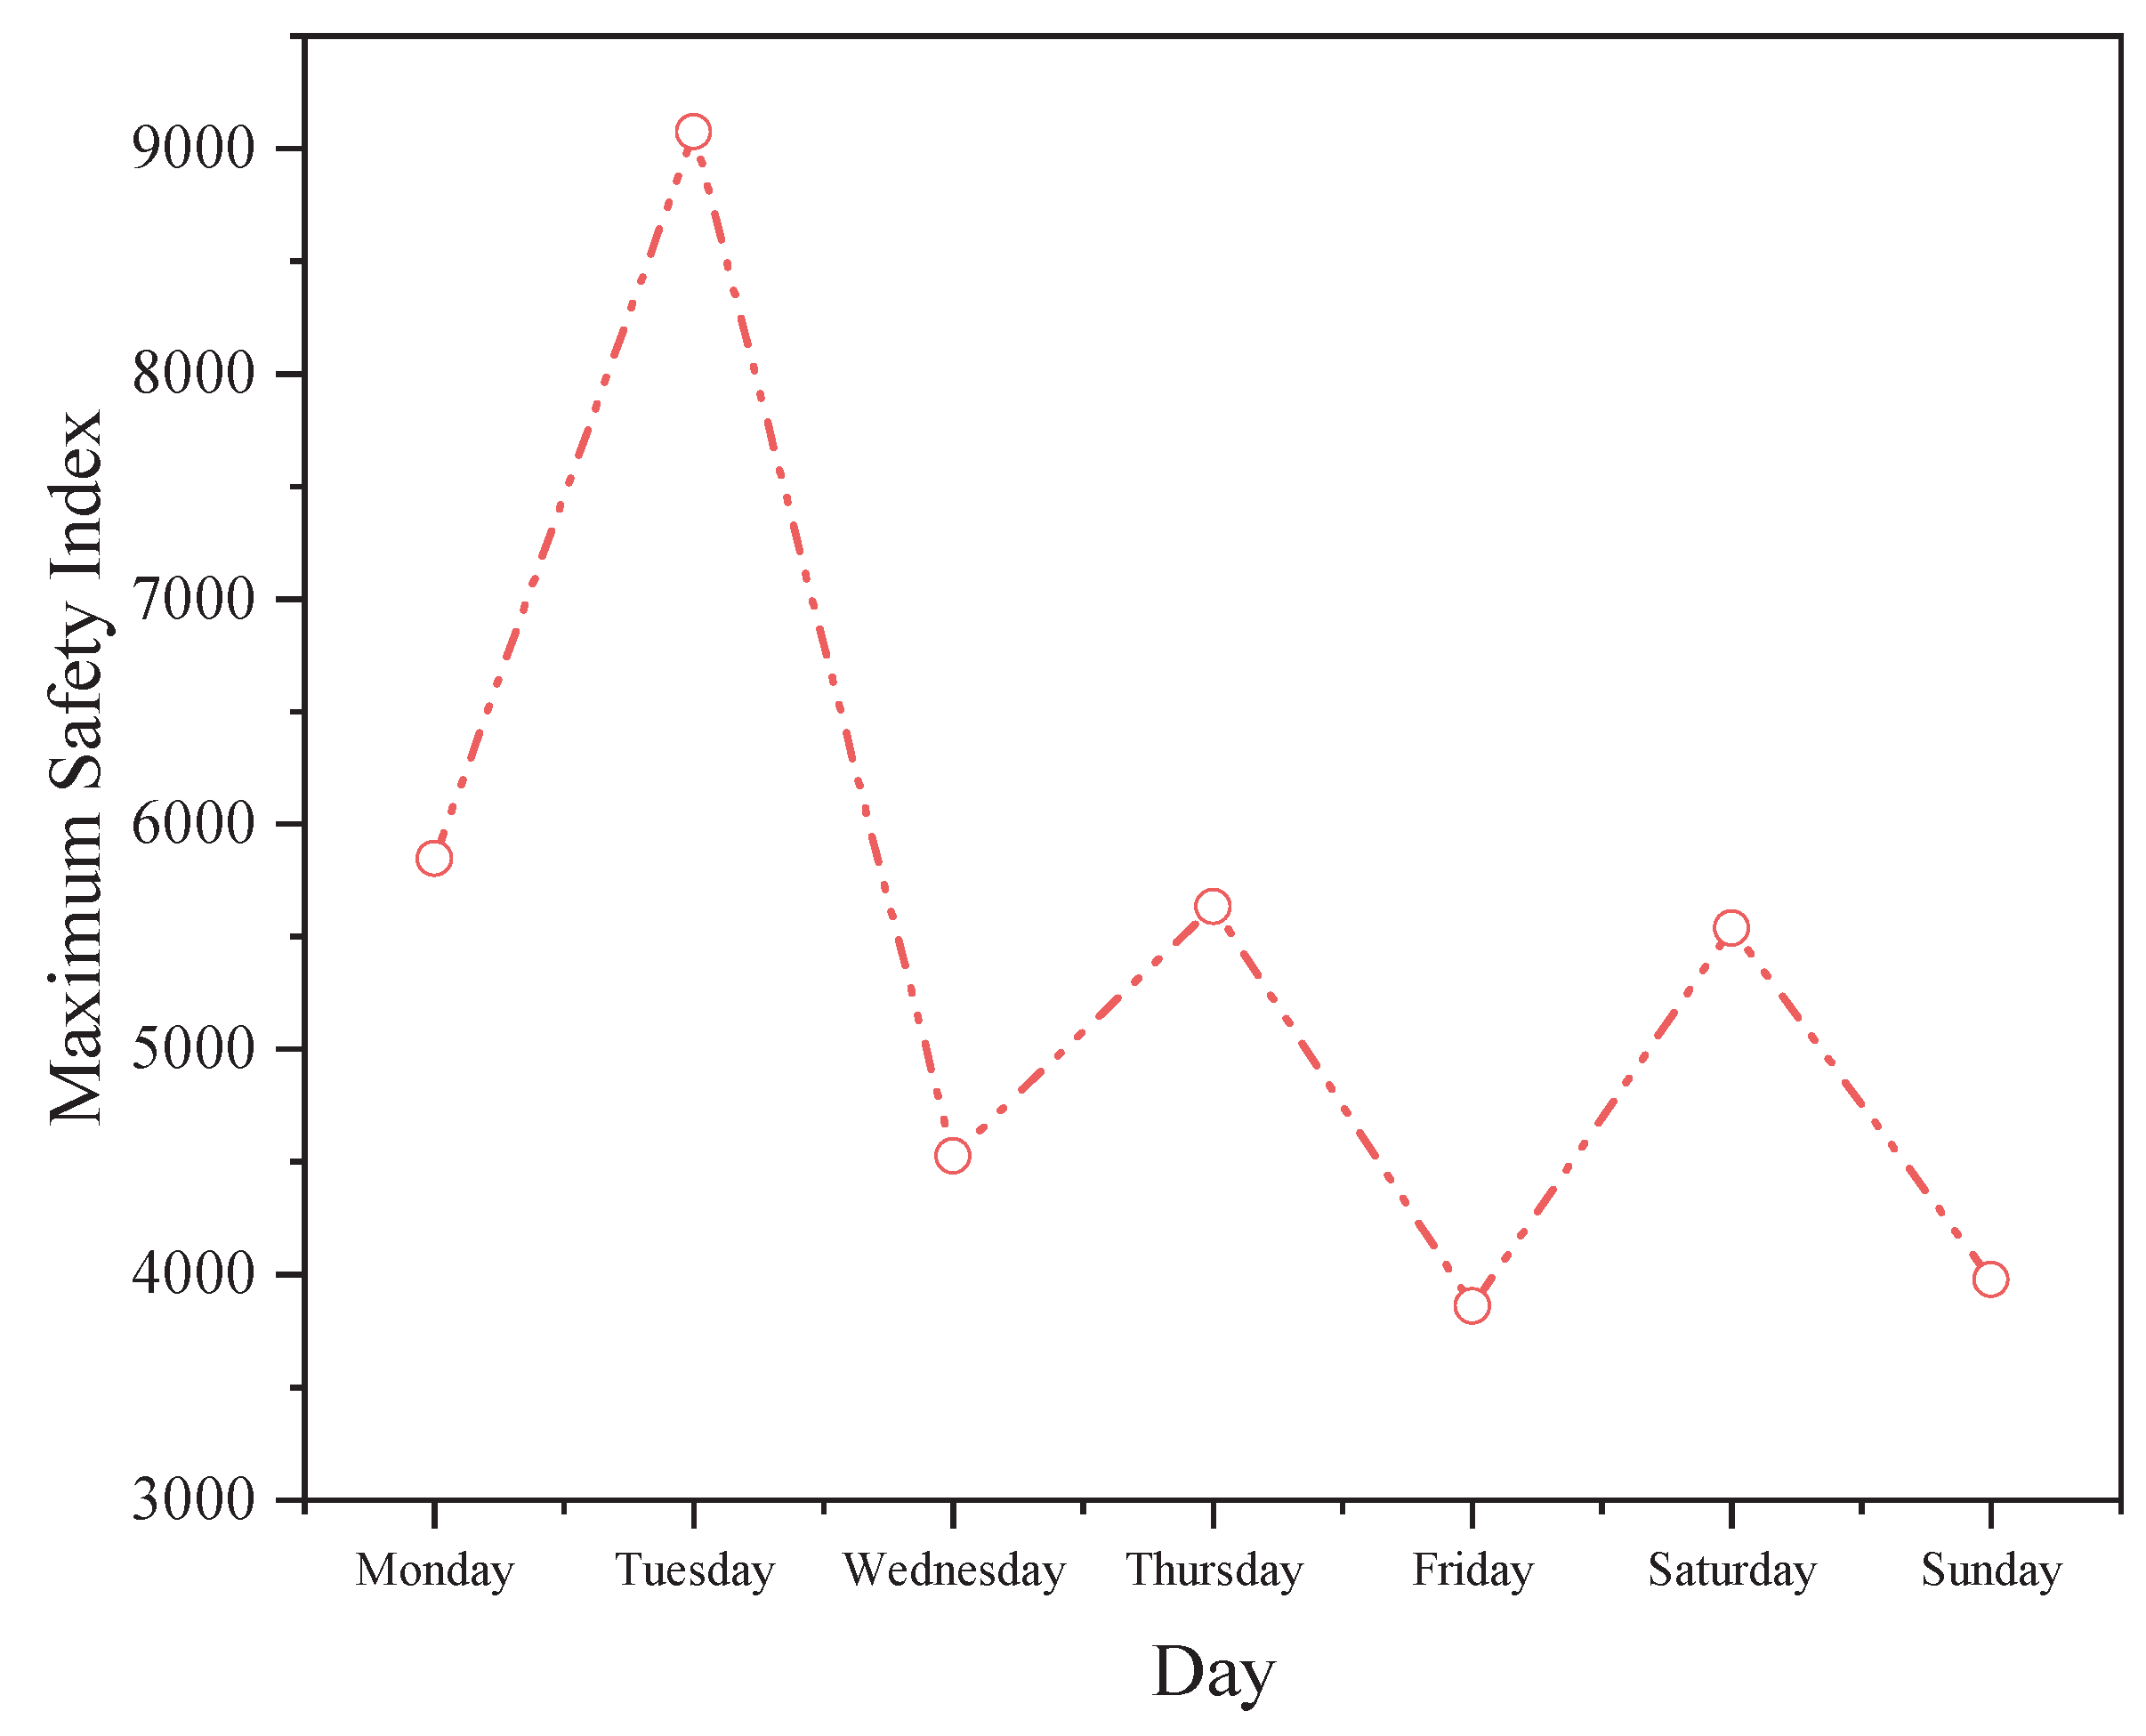
Figure 14.
(a) Average safety index (Model I) in each segment of Lombok Strait and (b) Average ship count in each segment of Lombok Strait.
Figure 14.
(a) Average safety index (Model I) in each segment of Lombok Strait and (b) Average ship count in each segment of Lombok Strait.
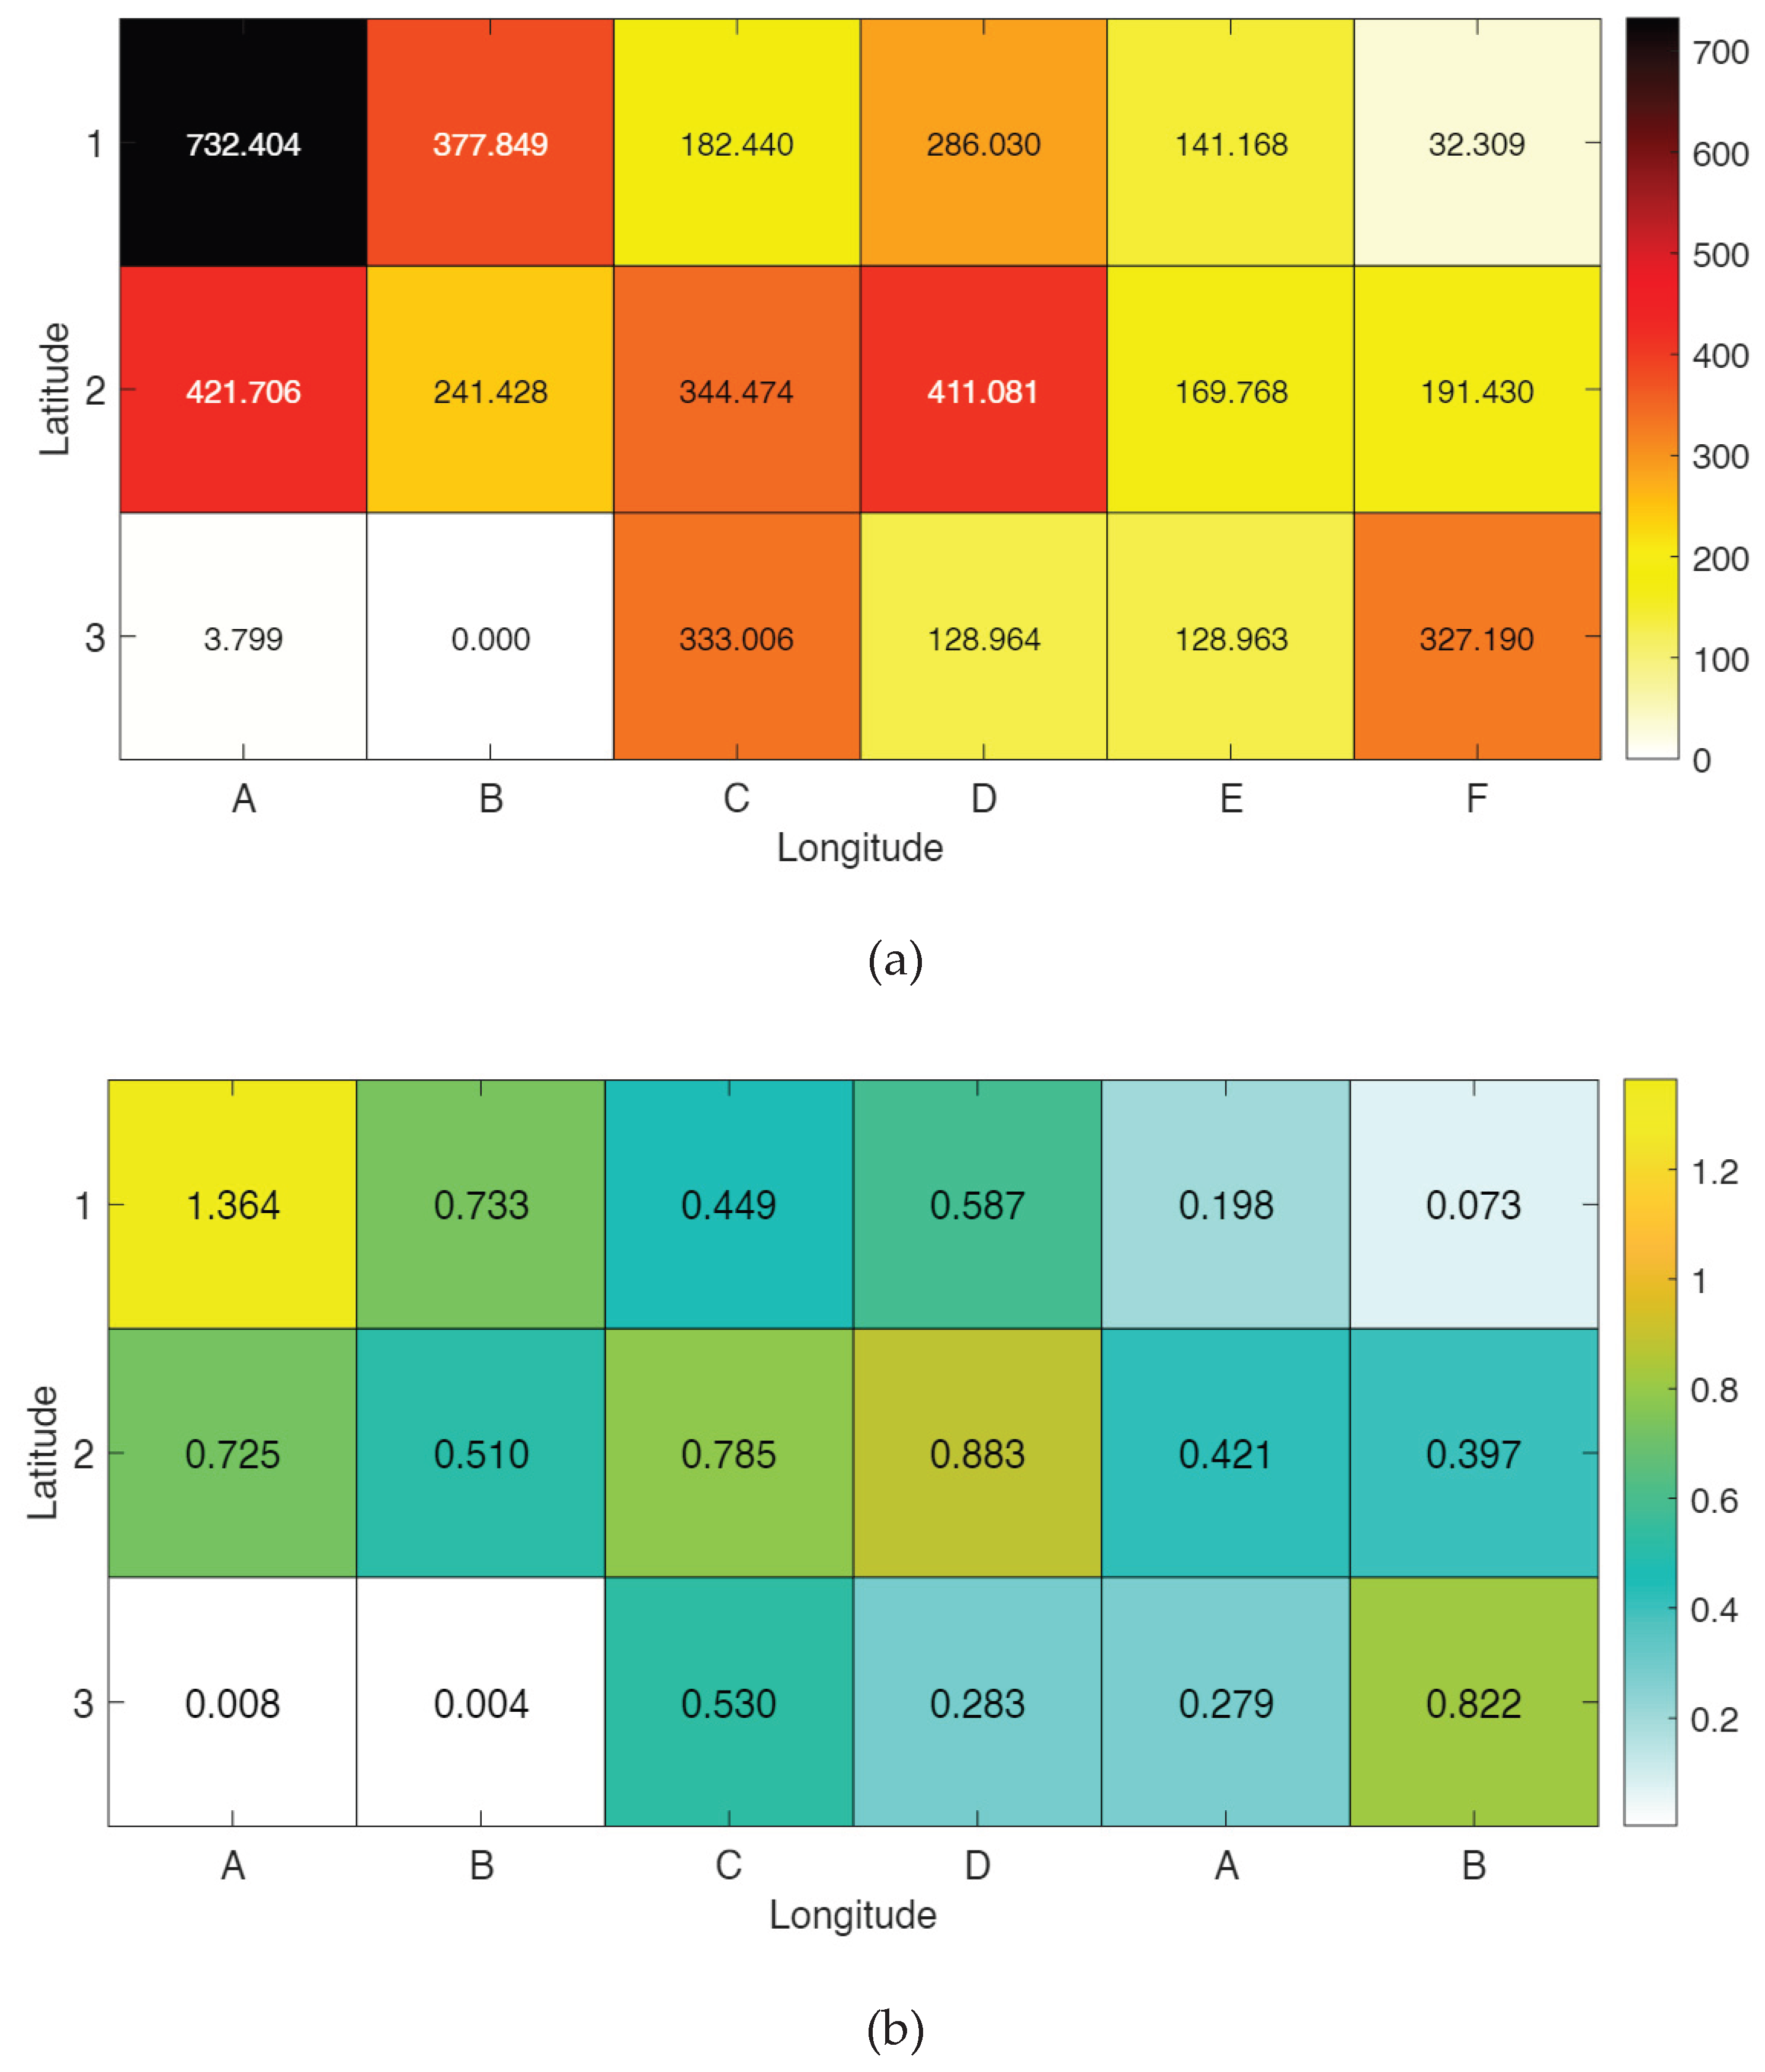
Figure 15.
Average safety index (Model II) in each segment of Bali Strait.
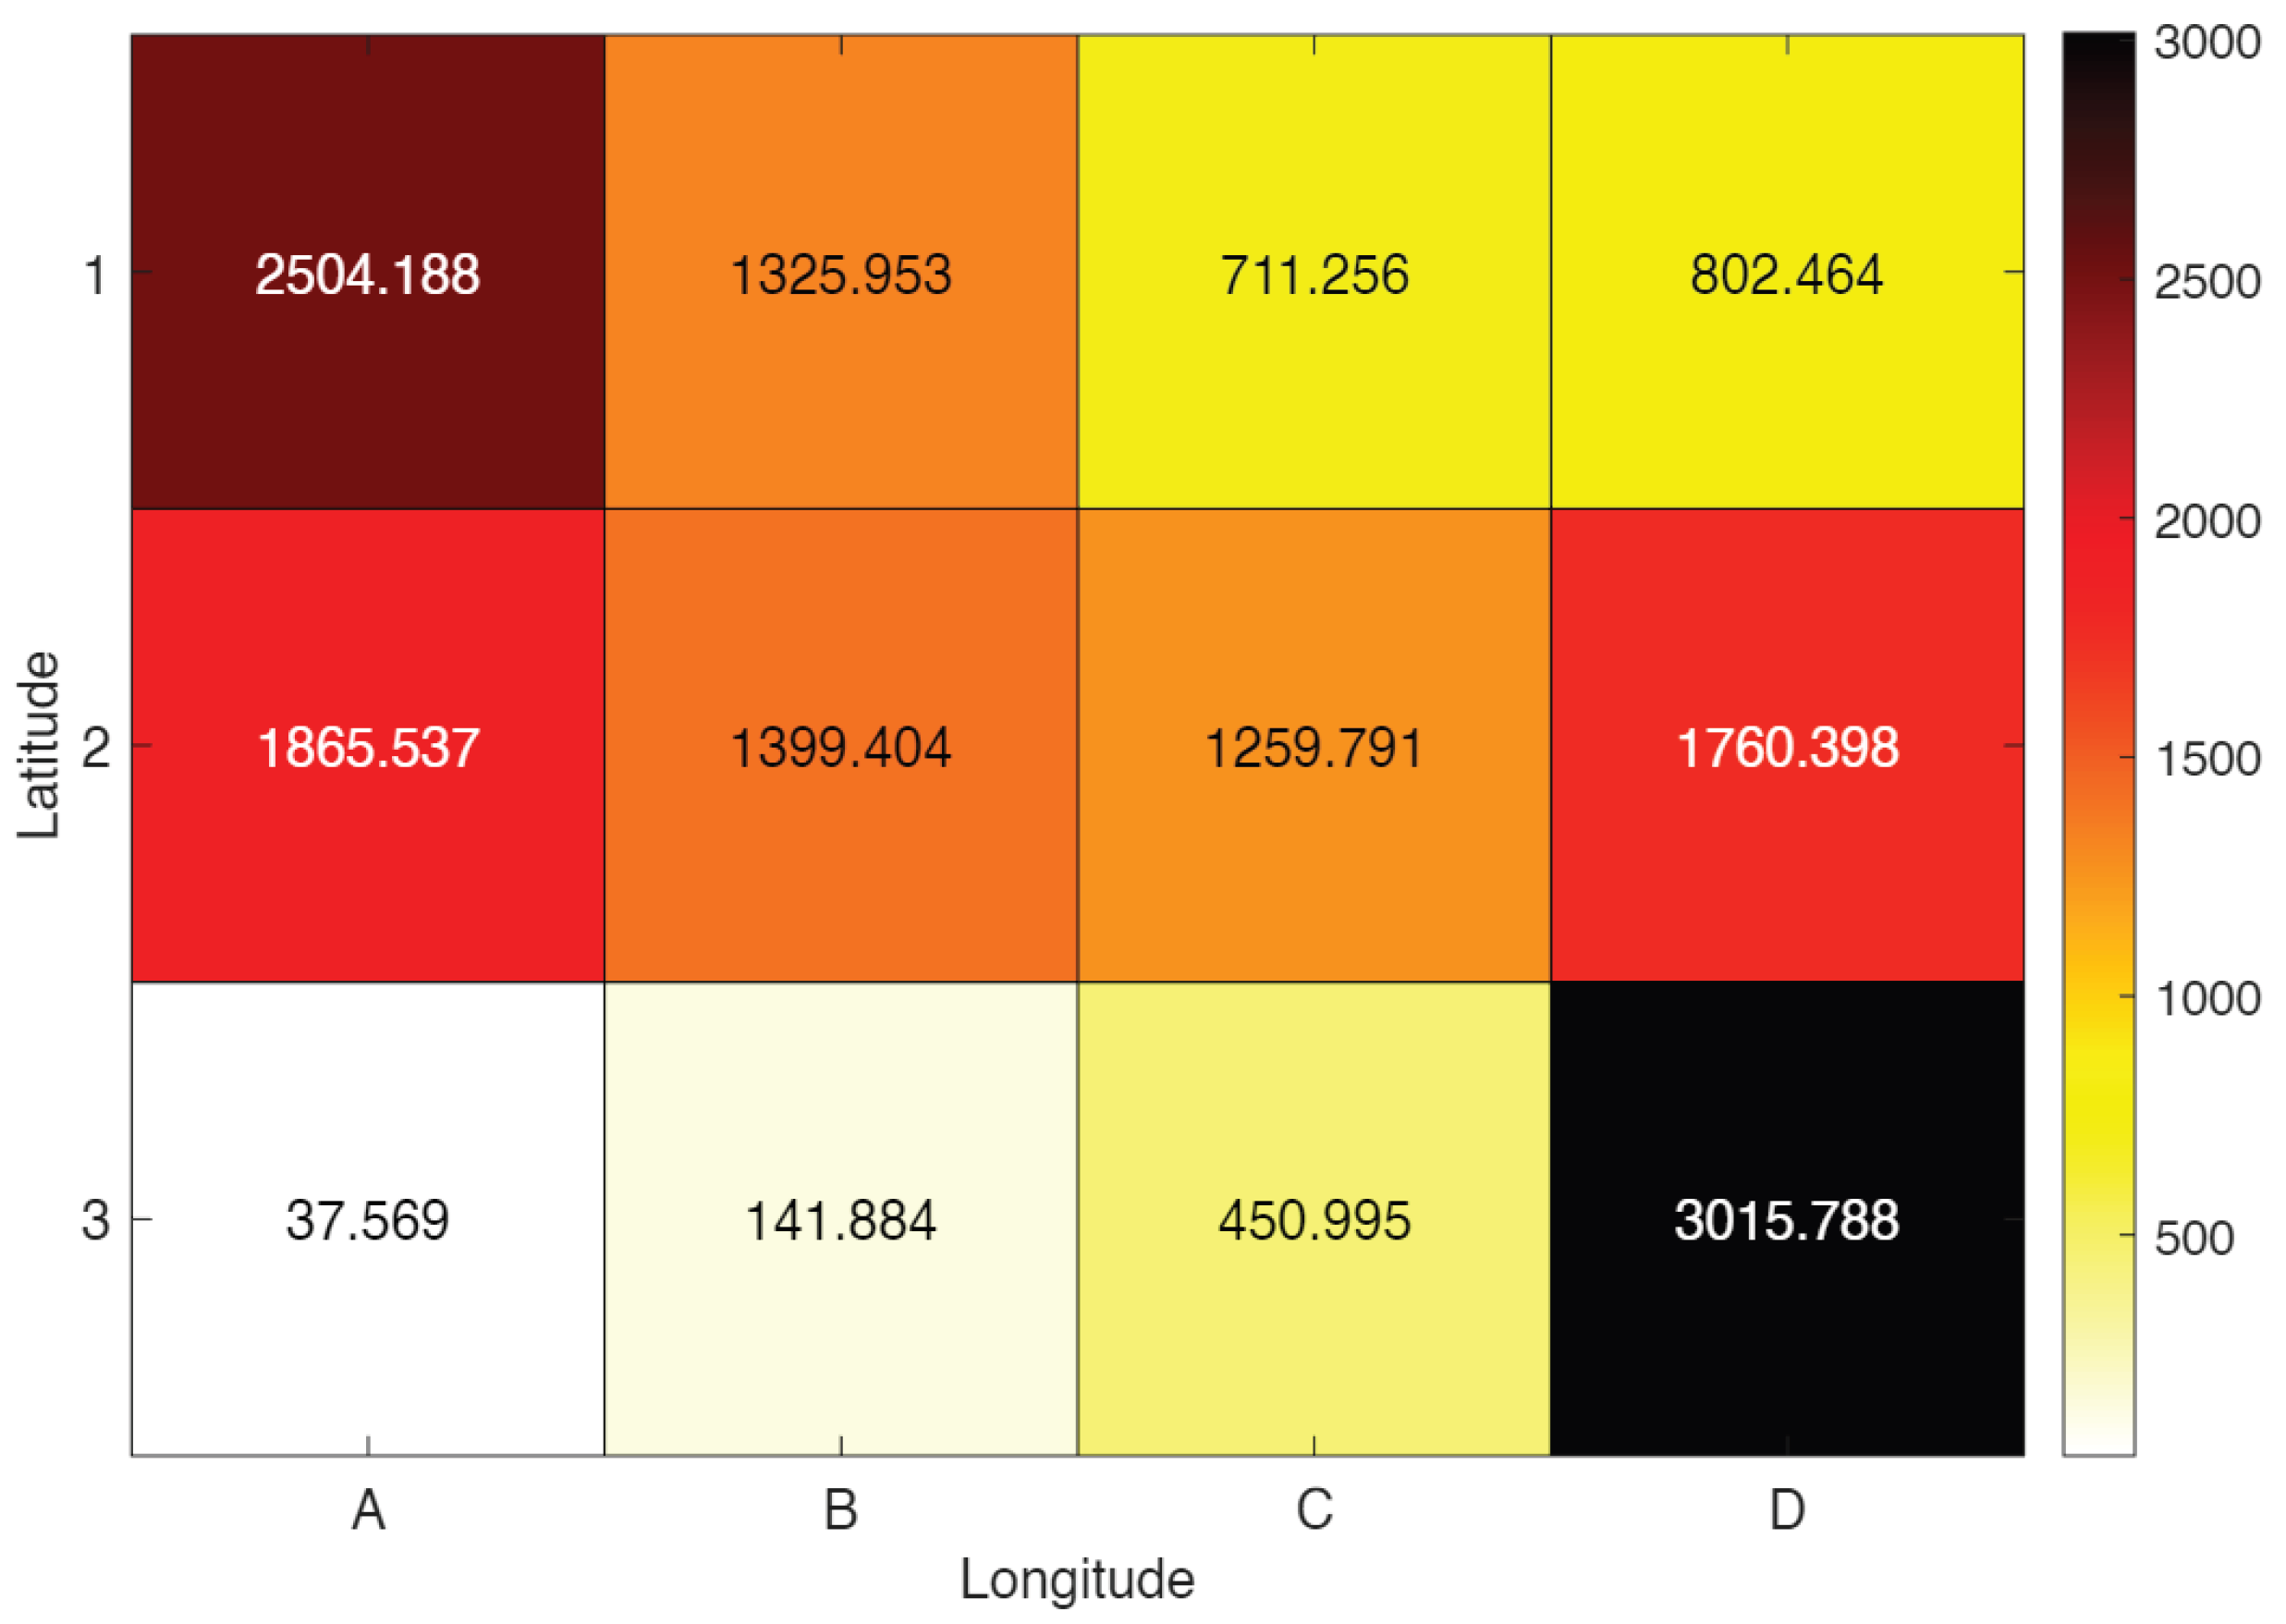
Figure 16.
Average safety index (Model II) in each segment of Lombok Strait.
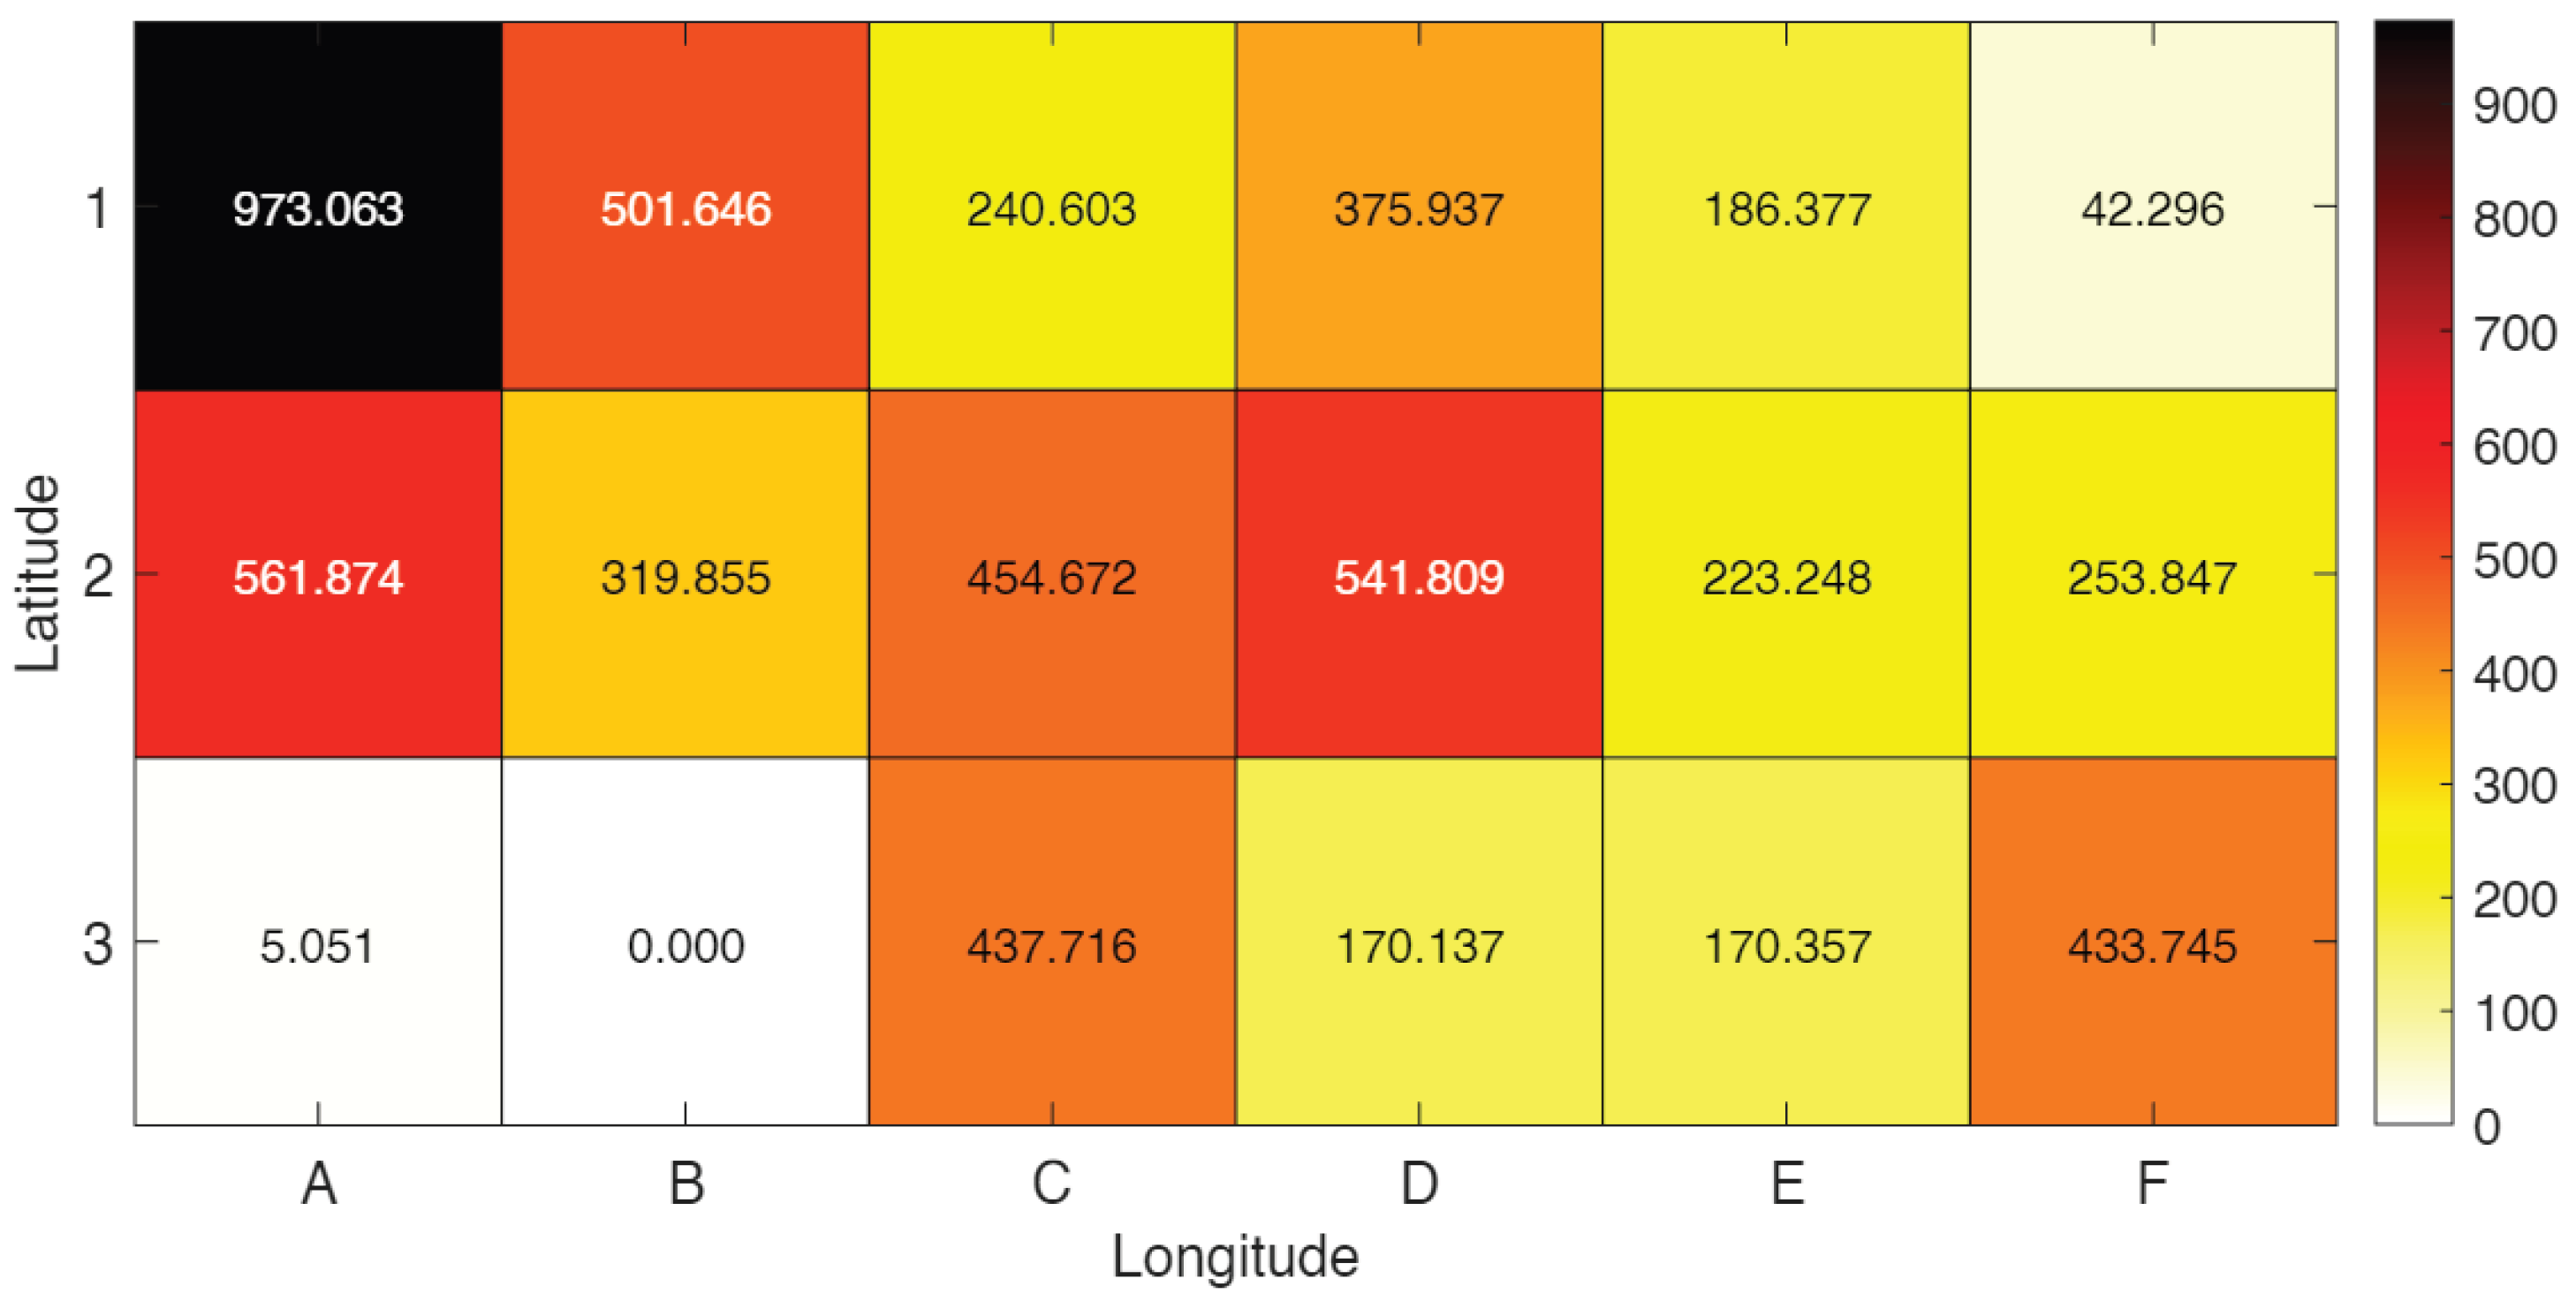
Figure 17.
Average percentage contribution of each factor in the two study areas.
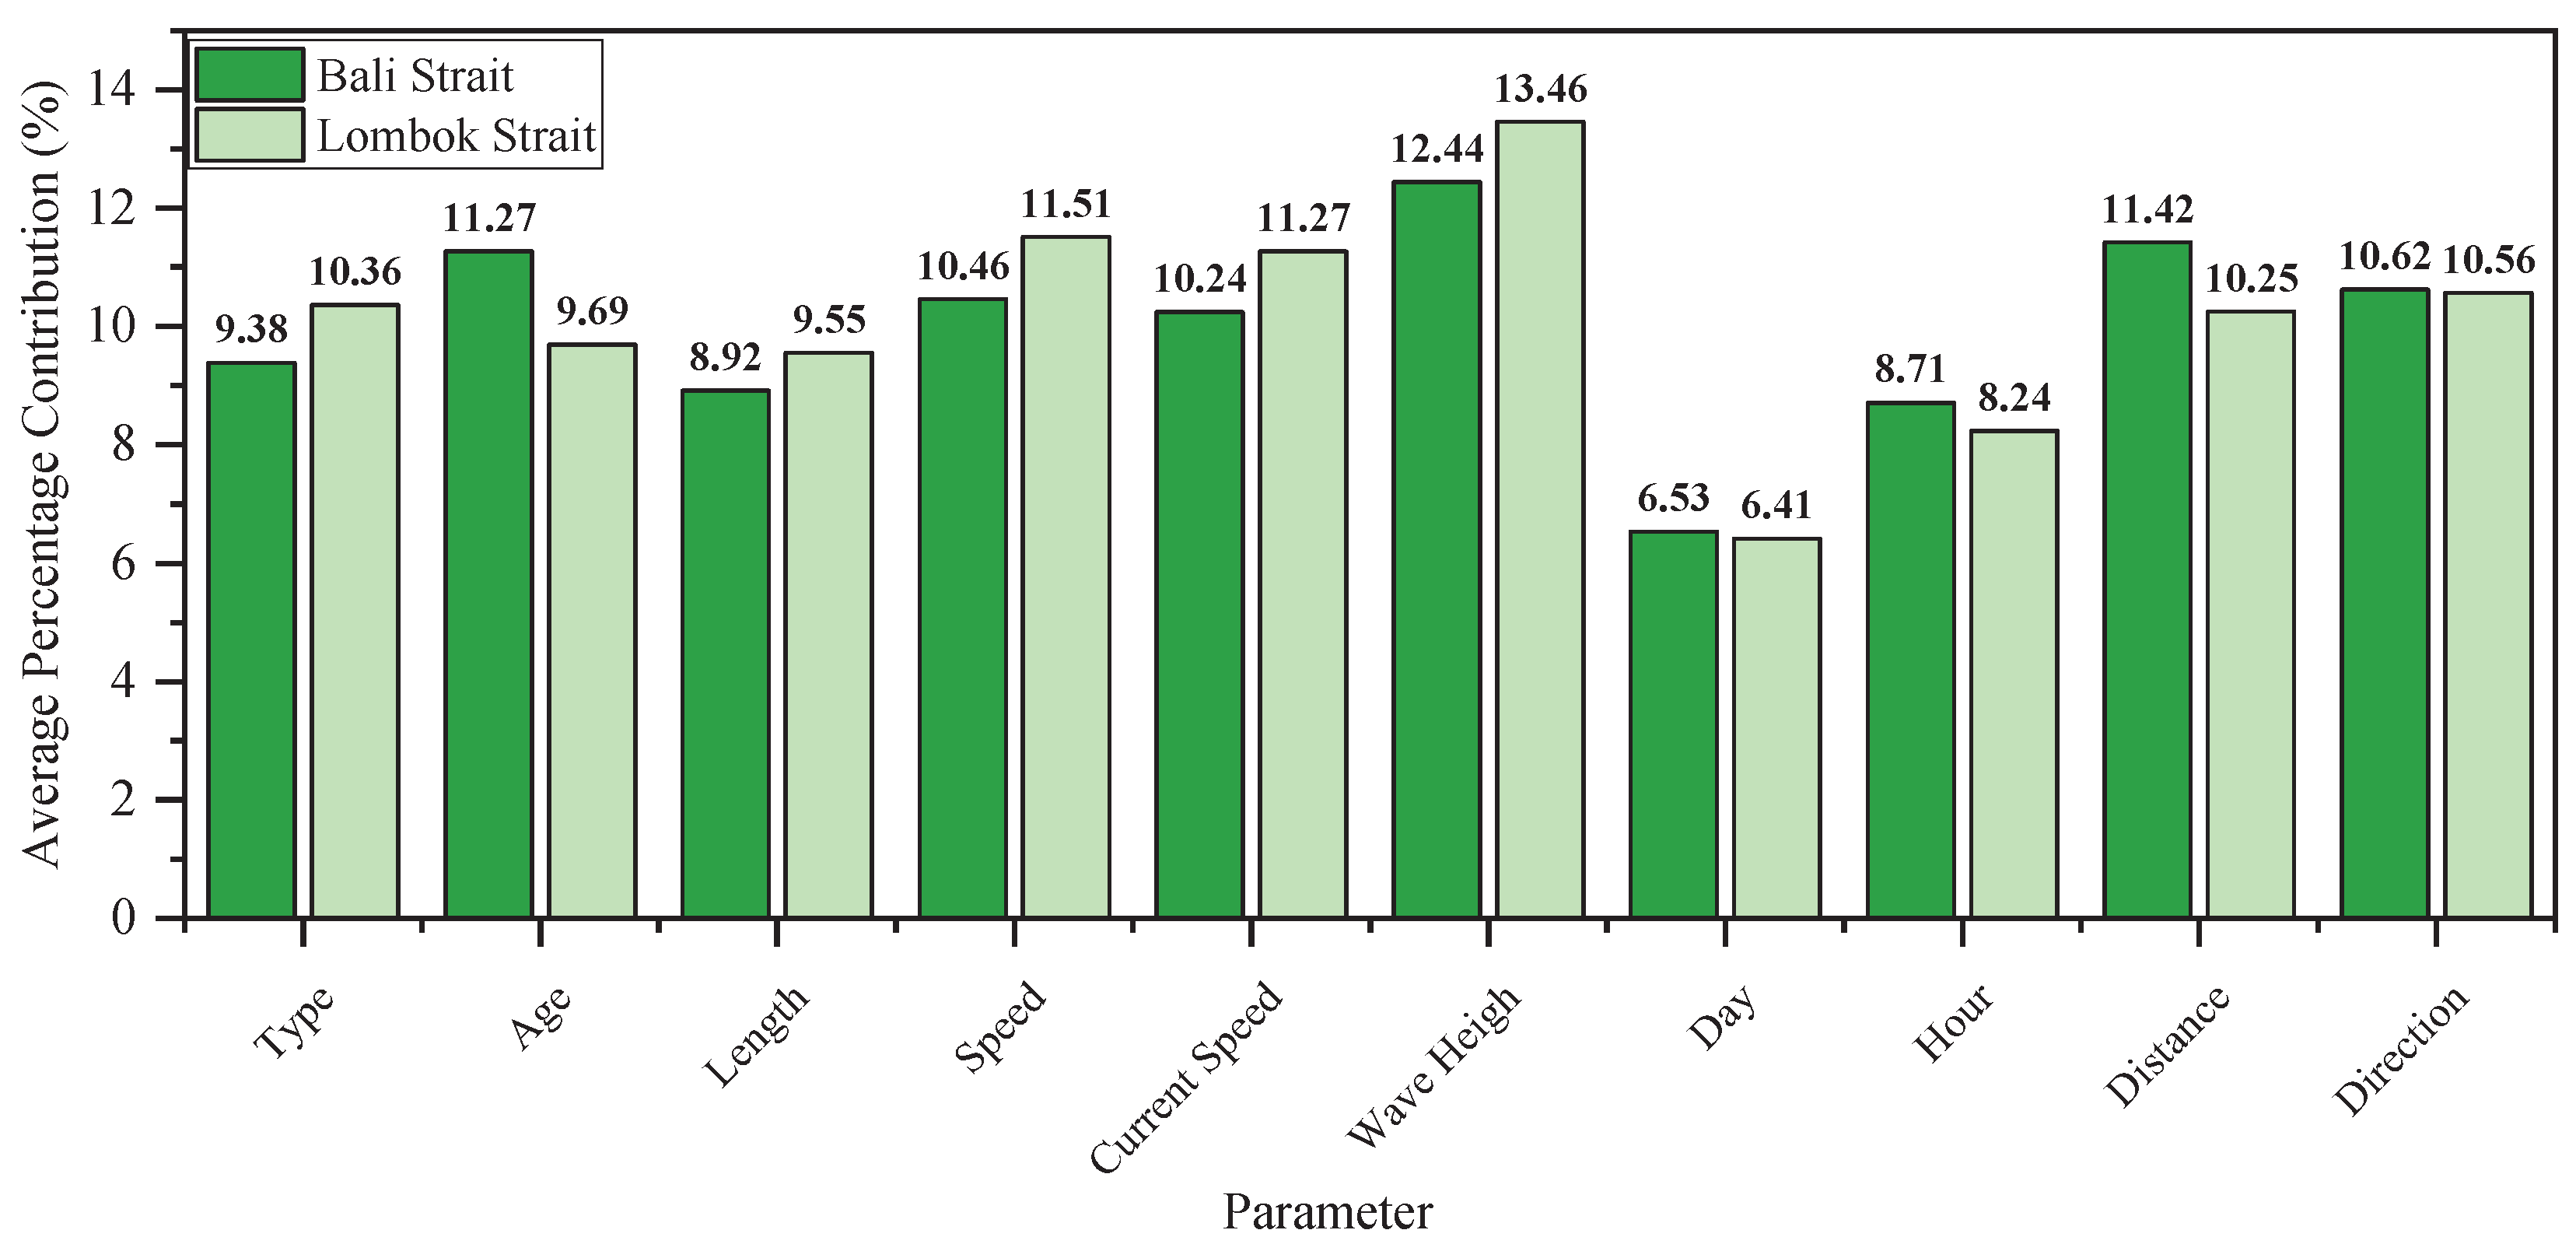

Table 1.
Detail parameters and sub-parameters.
| Parameter | Sub-parameter | Detail | |
|---|---|---|---|
| Ship Condition | Type | Bulk carrier, Tug boat, ferry, Passenger ship, Container ship, LNG, LPG, Fisher, VLCC, PCC, and Reefer ship | |
| Age (year) | 0 – 5, 6 – 10, 11 – 15, 16 – 20, 21 – 25, and > 25 | ||
| Length (m) | 100, 101 – 150, 151 – 200, 201 – 250, 251 – 300, and > 300 | ||
| Encounter Condition |
Speed (knot) | 1, 1.1 – 2, 2.1 – 3, 3.1 – 4, and over 4.1. | |
| Distance (L, ship length, m) |
< 5L, 6 – 10L, 11 – 15L, 16 – 20L, 21 – 25L, 26 – 30L, and > 31L | ||
| Direction | Head-on, crossing on starboard, crossing on port, and overtaking | ||
| Time | Hour | 06:01 – 12:00, 12:01 – 18:00, 18:01 – 24:00, and 00:01 – 06:00 | |
| Day | Monday, Tuesday, Wednesday, Thursday, Friday, Saturday, Sunday | ||
| Environment Condition | Current speed (m/s) | < 0.2, 0.2 – 0.4, 2.1 – 3, 0.4 – 0.7, and >4.1 | |
| Wave height (m) | < 0.1, 0.1 – 1, 1 – 4, and > 4 |
Table 2.
Model details.
| Model | Explanation |
| I | The safety index calculation is a combination of ship condition and encounter condition factors (such as ship type, ship length, relative speed, distance, and direction) along with time parameters (operational hours and day of voyage). |
| II | The safety index calculation is a combination of all factors, including ship condition, encounter condition, oceanographic condition, and operational time parameters. |
Table 3.
Results of risk quantification.
| Items | ||
|---|---|---|
| Ship type | 6.247 | 9.034 – 10.889 |
| Ship age (year) | 6.596 | 6.348 – 12.225 |
| Ship length (m) | 7.258 | 7.438 – 11.955 |
| Speed (knot) | 7.101 | 6.798 – 10.337 |
| Distance (L, ship length in m) | 7.360 | 8.618 – 10.573 |
| Direction | 6.787 | 8.809 – 9.809 |
| Hour | 5.618 | 7.528 – 11.180 |
| Day | 5.101 | 7.303 – 8.022 |
| Current speed (m/s) | 6.753 | 7.337 – 10.202 |
| Wave height (m) | 7.427 | 12.764 – 12.787 |
Table 4.
Summarized oceanographic conditions in the Bali Strait.
| Parameters | Wave Height (m) | Current Speed (m/s) |
| Minimum | 1.273 | 0.884 |
| Average | 1.961 | 1.169 |
| Maximum | 2.682 | 1.392 |
Table 5.
Summarized oceanographic conditions in the Lombok Strait.
| Parameters | Wave Height (m) | Current Speed (m/s) |
| Minimum | 1.663 | 1.062 |
| Average | 2.608 | 1.388 |
| Maximum | 3.657 | 1.627 |
Table 6.
Average number of ship data per day in Bali Strait.
| Day | Average number of ship data | Overall average |
| Monday | 107.75 | 97.23 |
| Tuesday | 97.75 | |
| Wednesday | 90.5 | |
| Thursday | 94.25 | |
| Friday | 81.6 | |
| Saturday | 96.6 | |
| Sunday | 112.2 |
Table 7.
Average number of vessels by time variation in the Bali Strait.
| Hour | Average number of vessels by time variation | ||||||
| Monday | Tuesday | Wednesday | Thursday | Friday | Saturday | Sunday | |
| 00:00 | 14.25 | 12 | 12 | 13.5 | 13.4 | 8.8 | 14 |
| 03:00 | 14.75 | 12 | 12.25 | 14 | 10.6 | 11.2 | 14.2 |
| 06:00 | 14 | 12.5 | 11.25 | 10.25 | 10.8 | 13.2 | 13.8 |
| 09:00 | 14.5 | 10.5 | 10.75 | 11.75 | 9.4 | 12.2 | 12.8 |
| 12:00 | 12.5 | 13 | 11.5 | 11.25 | 11 | 10.8 | 12.6 |
| 15:00 | 13 | 12.25 | 11 | 11.5 | 9.2 | 14.2 | 14 |
| 18:00 | 12.25 | 11.75 | 11.25 | 11.25 | 8.8 | 13.8 | 14.8 |
| 21:00 | 12.5 | 13.75 | 10.5 | 10.75 | 8.4 | 12.4 | 16 |
Table 8.
Average number of ship data per day in Lombok Strait.
| Day | Average number of ship data | Overall average |
| Monday | 76.75 | 78.5 |
| Tuesday | 70 | |
| Wednesday | 80.25 | |
| Thursday | 79.75 | |
| Friday | 82.8 | |
| Saturday | 83.4 | |
| Sunday | 76.6 |
Table 9.
Average number of vessels by time variation in the Lombok Strait.
| Hour | Average number of vessels by time variation | ||||||
| Monday | Tuesday | Wednesday | Thursday | Friday | Saturday | Sunday | |
| 00:00 | 9.25 | 9.75 | 12.5 | 8 | 10 | 12.2 | 10 |
| 03:00 | 8.5 | 6.75 | 13 | 8.25 | 8.6 | 11.4 | 10 |
| 06:00 | 7.75 | 7.5 | 10 | 9.75 | 8.4 | 9 | 11.2 |
| 09:00 | 10.25 | 8.5 | 8 | 11.25 | 10.2 | 10.4 | 9.6 |
| 12:00 | 12.75 | 9 | 11 | 12.25 | 12.8 | 9.8 | 10.2 |
| 15:00 | 10.75 | 11.5 | 10.25 | 11.25 | 11.8 | 11 | 8.2 |
| 18:00 | 11 | 8.25 | 8 | 9.5 | 10.6 | 9.8 | 8.4 |
| 21:00 | 6.5 | 8.75 | 7.5 | 9.5 | 10.4 | 9.6 | 9 |
Disclaimer/Publisher’s Note: The statements, opinions and data contained in all publications are solely those of the individual author(s) and contributor(s) and not of MDPI and/or the editor(s). MDPI and/or the editor(s) disclaim responsibility for any injury to people or property resulting from any ideas, methods, instructions or products referred to in the content. |
© 2026 by the authors. Licensee MDPI, Basel, Switzerland. This article is an open access article distributed under the terms and conditions of the Creative Commons Attribution (CC BY) license.
Copyright: This open access article is published under a Creative Commons CC BY 4.0 license, which permit the free download, distribution, and reuse, provided that the author and preprint are cited in any reuse.


