

Submitted:
16 August 2024
Posted:
16 August 2024
You are already at the latest version
Abstract
It is vital to analyze ship collision risk for preventing collisions and improving safety at sea. This paper takes Ningbo-Zhoushan Port, a typical complex navigable water, as the research object, propose a probabilistic conflict detection method to estimate the potential collision risk by using a dynamic domain model driven by AIS data. Combined with the algorithm of fast modularity optimization and spectral clustering, a ship group extraction method from the perspective of water navigation management was proposed. Aiming at ship traffic characteristics in complex navigable waters, conduct dynamic calculation of ship collision risk from individual, regional and local multi-scale perspectives. The results show that the proposed method can detect the collision risk in a timely, reliable and effective manner under complex dynamic conditions. As such, they provide valuable insights for ship collision risk prediction and the development of risk mitigation measures.
Keywords:
ship navigation safety
; risk quantification
; complex water
; group of ships
1. Introduction
The growing shipping volume leads to higher traffic density and more complex navigation environment, especially in hot areas such as complex navigable waters. Ship collision and grounding are the most common types of accidents[1]. Such accidents will cause serious economic losses, greatly threaten life safety and marine environment, and seriously hinder the improvement and development of water transportation efficiency.
Ship navigation safety is the primary issue of global maritime development, and it is the most fundamental prerequisite for improving shipping efficiency, strengthening port operation and management, and ensuring high-quality development of transportation [2]. Related research shows that the proportion of ship accidents caused by human factors reaches 83%, of which 71% of human errors caused by drivers’ inaccurate perception of navigate risks [3]. Accurate, real-time and dynamic navigation risk perception is an important basis for supervision from the perspective of water navigation management. Especially in the complex navigable waters with high ship density, various types of ships, significant interaction and interference between ships, and great differences in risks in different local waters, more and more attention has been paid to the accurate, real-time and dynamic calculation of ship navigation risks.
At present, the research on ship navigation risk mainly carried out along two paths [4]. One is from the perspective of ship navigation and maneuvering. This kind of method usually uses the geometric parameters between the ship and the nearby obstacles to construct risk modeling. Carry on the collision accident frequency and consequence estimation to realize the risk quantification. Second, it carried out from the perspective of water navigation management, this kind of method based on “human-ship-environment-management” to identify the risk factors of ship navigation, and construct a cognitive model of domain experts to quantify the risk.
The main contributions of this paper summarized as follows.
(1) The construction of ship conflict probability detect model. Aiming at the effective perception of ship collision risk in the dynamic navigation scene of complex navigable waters, a calculation method of conflict probability proposed.
(2) Ship group extraction from the perspective of water navigation management. In order to realize the fast and accurate grouping of ships in complex navigable waters and facilitate the safety supervision of different local waters, a two-stage algorithm of ship group division based on fast modularity optimization and spectral clustering algorithm is proposed.
(3) Dynamic calculation of ship navigation risk. Based on the ship Conflict Detect(CD) method and the ship group extraction from the perspective of water navigation management, the regional ships are detected for conflict probability and contribution identification, and the risks of different local waters and regions are quantified.
The rest of the study is organized as follows. The second section summarizes the current two paths of study the risk of ship collision. In the third section, the proposed dynamic calculation method of navigation risk is introduced in detail, including ship conflict probability detection, ship group extraction and key ship identification. The fourth section gives the application results and performance test of the actual AIS data experiment. The fifth section gives the conclusion.
2. Literature Review
The risk of ship collision has always been a hot topic in the field of ship transportation. Many researchers have devoted themselves to quantifying the probability and risk of ship collision using various methods from different perspectives. This paper summarizes the current research situation at home and abroad based on the two major research paths of ship navigation risk: the navigation risk research based on the perspective of ship steering and the research on ship navigation risk from the perspective of water navigation management.
2.1. Based on Ship Driving and Maneuvering Perspective
In recent years, the rapid development of various advanced equipment and technologies has improved the ability to collect, store and process ship trajectory data, providing a rich data source for the detection and analysis of ship collision risks [5,6]. Various definitions and concepts, such as “traffic conflict” [7], “collision candidate” [8] and “near miss” [9], have been used to detect and characterize the collision risk between ships. The relevant risk detection methods can be divided into ship domain-based methods, comprehensive indicator methods and danger zone-based methods.
Among them, the collision risk detection method based on the ship domain model is one of the most widely used methods at present [10]. The ship domain refers to the area around the ship where other ships or obstacles need to maintain a certain distance. At present, the development of various intelligent technologies and the continuous increase of AIS data sources have promoted the proposal of various ship domain models. These models have different shapes (such as circular [11], polygonal [12], quadruple [13], fuzzy [1]and risk-based [14] ship domains), adopt different theoretical methods (such as based on experience, knowledge and analysis [15]) and consider different influencing factors (such as ship attributes, crew knowledge and fatigue status, ship maneuverability, traffic conditions and navigation environment [16]). They perform collision risk assessment and detection based on the intrusion or overlap of ship domains, and perform well in quantitatively examining encounter scenarios with collision possibilities and unexpected consequences and in collision warning.
The comprehensive index method usually adopts mathematical expressions or black box models to calculate the collision risk index by integrating relevant factors that characterize the spatiotemporal proximity of ships. Initially, the two most common indicators, namely, the distance to the closest point of approach (DCPA) and the time to the closest point of approach (TCPA), were fused by various technical means (such as binary state (i.e., safe/dangerous), weighted coefficients [17], linear regression [18], and fuzzy theory [19]) to measure the Collision Risk Index (CRI). Subsequently, such methods have been improved and extended by considering more risk influencing factors (e.g., distance, relative bearing, relative speed, ship maneuverability, and ship domain [20,21]) and adopting advanced fusion techniques (e.g., support vector machine [22], hierarchical analysis method, and Dempster-Shafer evidence theory [23]) to ensure that they are applicable to various complex encounter scenarios. However, most of the methods in such studies follow an assumption that the target ship will maintain its current speed and sail in a straight line in the near future. This assumption often leads to inaccurate or unreliable detection of collision risk, especially when the ship performs certain maneuvers (such as changes in heading or speed) during the encounter. In addition, the interaction between different risk factors makes it difficult for such methods to provide clear meaning and interpretation for CRI results.
For the hazard area-based methods, they rely on collecting sets of own ship speeds and/or headings that cause a collision risk with the target ship, and if the real-time speed/heading of the own ship falls into these sets, a collision warning is issued. Typical hazard area identification methods include collision threat parameter area (CTPA) [24], projected obstacle area (POA) [25], velocity obstacle (Velocity Obstacle, VO) [26], etc., among which VO has been widely used due to its simple implementation and ability to effectively find conflict resolution solutions. Related application examples include combining the ship domain with VO [27], constructing nonlinear VO, probabilistic VO and generalized VO algorithms by releasing the assumption of linear motion of ships and considering the maneuverability of ship motion [28], considering the entire ship encounter process when detecting potential collisions [20], and estimating the time-varying collision risk by the percentage of overlapping area between the VO set and the achievable speed set [29]. These studies show that this type of research can detect real collision risks under dynamic traffic conditions and can be applied to various encounter scenarios. However, due to the non-negligible computational cost of mapping the spatiotemporal proximity between ships into velocity space, such methods are difficult to combine with complex danger zone models. Therefore, they are usually combined with some simple risk measurement models, such as constant minimum safety distance and circular ship field, to detect potential collision risks in real time. This leads to the insufficiency of such studies in revealing the differences in collision risks of ships in different encounter situations.
2.2. From the Perspective of Water Navigation Management
Research on ship navigation risks from the perspective of water navigation management usually quantitatively describes the level of ship navigation risks in a specific navigation water area. Which can provide a basis for water navigation management and decision-making.
Statistical analysis of historical maritime accidents is one of the basic methods to determine the relationship between collision frequency (and possible accident consequences) and risk factors (such as ship attributes, environmental factors, human behavior, technical failures and traffic conditions) [30]. Usually, such studies use information such as accident databases and accident investigation reports to support the analysis [31]. Techniques such as correlation analysis, logistic regression and random process analysis are often used to predict the probability of accidents related to events and environments [32,33] in order to gain a deeper understanding of the conditions under which the probability of ship traffic accidents is higher. However, such studies are highly dependent on historical accident data, which is not always easy to obtain. Especially when studying small sea areas, the frequency of collision accidents is usually very low, which makes it difficult to conduct effective statistical analysis [34]. This problem is particularly prominent when focusing on the relationship between many risk-related factors and collision accidents. Therefore, in order to more clearly understand the formation mechanism of ship collision risk, it is necessary to adopt more data and information sources.
Compared with the statistical analysis of historical accidents, collision risk modeling integrates multiple information sources such as expert knowledge, historical accident data and computer simulation results, involving two important components: the frequency/probability of ship collision accidents and the corresponding potential consequences. The application methods of this type of research include Pedersen [35], fault tree [36], Bayesian network [37] and ordered probit model [38]. This type of research can be used to identify important influencing factors causing collision risk, estimate the causal probability of accidents and analyze the relationship between factors. The relevant research results can help ship regulators understand the frequency and consequences of possible collisions under different traffic situations.
3. Methodology:Dynamic Calculation of Navigation Risk
In this section, systematically describe the dynamic calculation method of ship navigation risk. This method is divided into three interactive steps, each of which is associated to methods of high dependency (see Figure 1). Specifically, this step is achieved using a probabilistic conflict detection framework, which can accurately estimate the conflict criticality in the presence of ship motion dynamics and uncertainty. Secondly, we construct a ship group extraction method based on the conflict interaction between ships, and define the ship set of navigation risk interaction. In addition, realize the discretization of regional water risk assessment. Finally, the key influential ships in the regional traffic situation are identified. The critical supporting techniques in each step are elaborated in the subsequent subsections to demonstrate the logical flow of the methodology.
3.1. Probabilistic Conflict Detection
The CD approach is first developed from a probabilistic risk viewpoint, in which the influence of uncertainty related to various sources on the potential conflict is considered. It is designed to quantify the conflict criticality between ship pairs and provide essential functionality for extract ship group. The probabilistic CD approach is characterized by a conflict criticality measure and conflict probability estimation.
3.1.1. Conflict Criticality Measure
A conflict occurs when the predicted trajectories of two ships violate the specified separation distance. The paper defines ship conflict based on the MSD model [39] The method of conflict identification is shown in Figure 2. If the sum of the MSD of the two ships and the distance between the two ships within the prediction time satisfy equation (1), then ship A and ship B are considered to be in a conflict state:
Where D(t) is the distance between the two ships, and represent the distances between the ship centers and their dynamic domain boundaries, respectively. Because we focus on identifying ship conflicts with ship motion uncertainty, inequality (1) is a probabilistic issue.
Given that the probability density function (PDF) for the unsafe separation (i.e., ) between the two ships at time t is denoted as , the instantaneous occurrence probability of a conflict is expressed as follows:
where L(t) equals .
The maximum conflict probability within the predicted range is used to measure the severity of the conflict as follows:
3.1.2. Conflict Probability Estimation
Probabilistic CD is based on the prediction of ship trajectories with uncertainty. Therefore, considering the ship motion model with uncertain mode of ship heading and ship position, we use the Monte Carlo simulation algorithm which can accurately calculate the conflict probability to extend CD to the probability framework.
The initial position of the two ships is determined, but the ship is affected by many uncertain factors, such as pilot’s maneuver and intention, wind and waves, mechanical failure and so on. Considering the fluctuation of the ship’s trajectory, the equation of ship’s motion is expressed as follows:
Among them, ,is the heading angle of and respectively. 、 is the error of ship’s predicted position.and is an error covariance matrix related to trajectory uncertainty.
The probability of ship conflict depends on the relative motion between ships. The distance between ships at any time, that is, the relative position, can be expressed as follow:
Among the top formula:
The dynamic domain boundary between ships has a significant influence on the severity of the conflict. The following formula is used to calculate the dynamic domain boundary distance of the ship in all directions at a certain time.
Where are the predicted speeds of ships A and B at t time respectively, and are assumed to be zero-mean Gaussian distribution.、 Represents the predicted relative position of the target ship relative to the own ship at time t.
Under the influence of various uncertain factors, the ship’s course will change (affecting the relative orientation between ships), thereby affecting the MSD. The uncertainty component of the course prediction is taken into account and is described as follows:
represents the course prediction error component of the ship at time t.
In [40], the uncertainty distribution PDF of the ship’s course and position extracted based on AIS data drive is used as the assumption of the uncertainty component of this article. It uses Kernel Density Estimation (KDE), a non-parametric estimation method, to identify the uncertain components of the PDF of a data set via the following equation:
Among them, is the kernel function with bandwidth h that satisfies and , represents the number of elements in the data set within the bandwidth h.
Note thatin the inequalityandare functions of the position and heading prediction error components. Therefore, whether equation is established as a probabilistic event, its occurrence probability needs to be determined by a probability-based calculation method.
Considering the advantages of the Monte Carlo (MC) method as a quantitative risk assessment method in dealing with uncertainty in the ship navigation process, this paper calculates the ship conflict probability distribution based on the MC method. Generate random sampling points based on the PDF of the course and ship position, insert each random sample point into the ship’s uncertainty motion equation model, convert the random problem into a deterministic problem. When the number of simulations is large enough, the statistical information of the uncertain relative positions between ships can be calculated by using a set of deterministic solutions. According to the literature [40], 15000 iterations are needed to achieve an accuracy of 0.01, Algorithm 1 describes in detail the MC simulation process for calculating ship conflict probability, as shown in the following table:

Table 1.
Calculation of ship conflict probability.
| Algorithm 1: MC simulation algorithm |
|---|
| 1: FunctionReturn 2: 3: 4: For do 5: Generate a random sample vector of position/course for each ship 6: For to do 7: 8: 9: Call function to calculate based on random sample vector 10: if then 11: 12: End if 13: 14: End for 15: Output: |
3.2. Ship Group Extraction
The framework for grouping regional ships is shown in Figure 3. First, the method proposed in Section 3.1 is used to detect conflicts between ships in the core port area of Ningbo-Zhoushan Port. Secondly, a ship topology network is generated based on the conflict relationship between ships. Then, coupled Fast Modularity Optimization and Spectral Clustering (FMOASC) algorithms is used to group the regional ships.
The implementation of FMOASC includes the following three steps: solving the optimal modularity, constructing the new dimension information graph of node and edge relationship, extracting the features of Laplacian matrix and clustering, as shown in Figure 4:
3.2.1. Preliminary Group Partition based on FMO Algorithm
One of the principles of regional ship grouping is to find the ship combination with strong conflict connection within the group and relatively weak connection between different groups of ships. Based on the conflict connection relationship between ships, the FMO algorithm is used to divide the regional ships into sub-communities. The preliminary division of the ship group is more concerned with the conflict connection between ships, so grouping across spatial distances may occur.
Modularity is a strength index to measure the division of a network into sub-communities, which can be used to evaluate the division of communities. The calculation method of modularity is as follows:
Whererepresents the edge weight between nodeand,is the sum of edge weights attached to node,represents the community to which nodeis divided, is the sum of edge weights in the network, andis defined as a simple incremental function as follows:
In the regional ship undirected weighted graph, taking the ship as the node, as the node set, as the ship node, the ship with conflict relationship is connected, is the edge set, ,is the conflict relation edge, and the weight is the conflict probability value.
FMO can find the highly modular division of the network in a short time and show a complete hierarchical community structure. It is a bottom-up greedy optimization algorithm based on modularity maximization. Starting from each node as a community, the algorithm merges the neighboring communities in turn, calculates the modularity change , and continuously merges the communities along the direction of the maximum increase in modularity . Until the result of community division corresponding to the maximum modularity is obtained. The iterative process is shown in the following figure:
Figure 5.
Visual diagram of FMO algorithm iteration.
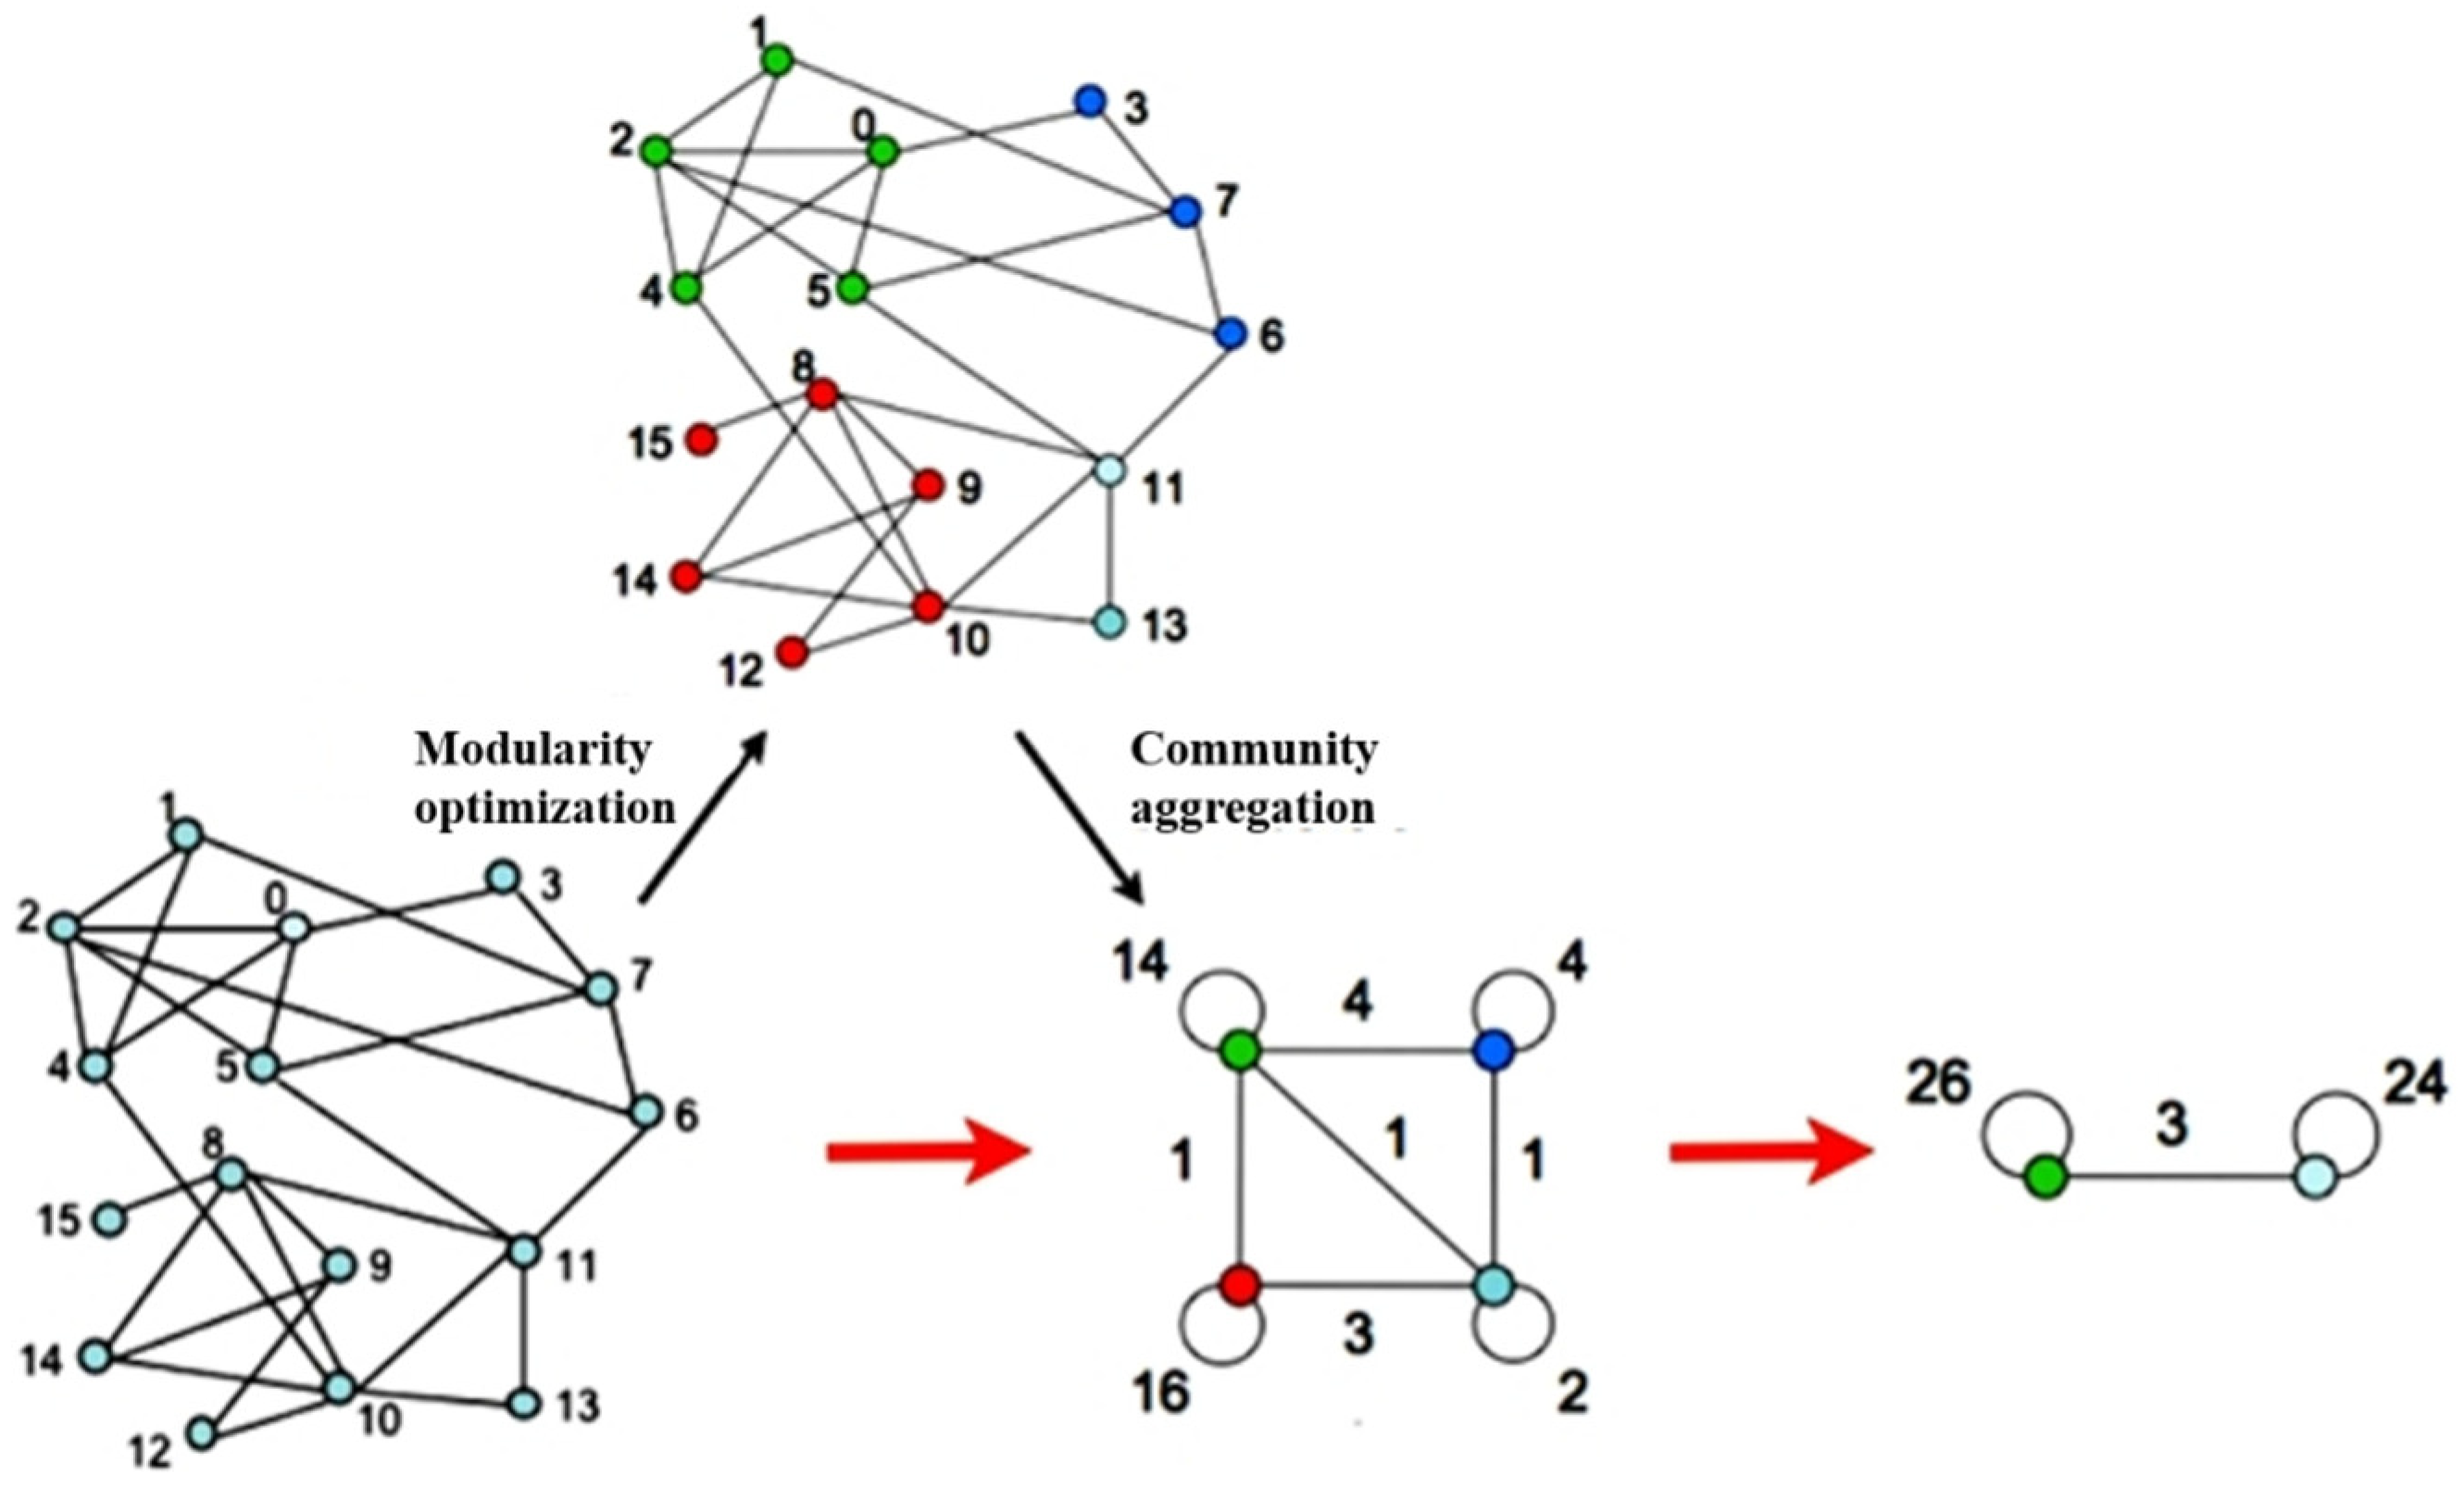
The modularity gain gained by moving orphaned nodes to the community can be calculated by the following formula:
Among them, is the sum of the weights of the connected edges in the community C, is the sum of the weights of the connections associated to the node in C, is the sum of the weights of the connections associated to the node , is the sum of the weights of the connected edges from the node to the nodes in C, and is the sum of the weights of all the connection relations in the network. When a node is removed from its community, expressions are used to evaluate the change in modularity.
Through the preliminary division of regional ships through the FMO algorithm, sub-communities based on the conflict connection relationships between ship nodes can be obtained. It is the basis for subsequent optimal division using the SC algorithm, and the basis for constructing new dimensional information on the connection relationships between ships.
3.2.2. Optimal Group Partition based on Spectral Clustering
Based on the preliminary grouping results of FMO, combined with the goal of conflict connectivity and spatial compactness, a new dimension of information is constructed to represent the edge weight between ship nodes. The function representation of the edge weight between ships is constructed according to the probability of conflict between ships and the spatial distance. The new dimension information graph is represented as , where is the node set, is the node,is the edge set, and is the edge of the graph.
In the second stage of group division, the grouping results obtained by FMO algorithm need to be fine-tuned. The more important goal of this stage is to consider the influence of ship spatial distance on the basis of conflict relations. Therefore, it is necessary to weaken the influence of conflict connections between ships and get spatially compact grouping results. Based on the influence of weakening the conflict connection relationship, the distance between ships , the collision probability between ships and the preliminary division group label are obtained, and the similarity feature vector is proposed, where is the group tag obtained based on FMO algorithm. The calculation of is as follows:
Next, standardize each feature vector, that is, .
Among them, represents the standardized eigenvalues corresponding to each eigenvector; and are the eigenvalues and the average values of eigenvalues corresponding to each eigenvector, respectively, is the standard deviation of the corresponding eigenvalues of all eigenvectors. The Euclidean distance corresponding to the normalized feature vector between all nodes is , the edge weight is , whereis the standard deviation of .
Through the feature extraction and decomposition of Laplacian Matrix L (the calculation formula is L=D-W. W is the adjacency matrix represents the adjacency relationship between nodes. D is the degree matrix, and the concept of degree indicates how many edges of a node are connected to it.) and K-means clustering, the optimal division result of ship group is obtained.
3.2.3. Group Quantity Adjustment Indicator
Using the FMOASC algorithm to divide the ship groups can obtain schemes with different numbers of groups. In order to select the ship group division scheme with excellent performance in terms of modularity and the number of noise points, an index I for comprehensive evaluation of these two important considerations is introduced. The modularity and the number of noise points of each grouping scheme are used as evaluation parameters, and the weighted normalization formula is used for calculation, as shown below:
Among them, andare the modularity and the number of noise points corresponding to the ship grouping scheme respectively; andare the modularity and the number of noise points after normalization respectively; andare the weights corresponding to the modularity and the number of noise points respectively.
By comparing the indicators under different grouping schemes, the number of ship groups is selected, and a balanced result in terms of modularity and the number of noise points is obtained.
3.3. Dynamic Calculation of Ship Navigation Risk
In order to identify the navigation risks of ships in different local waters and regions in complex navigable waters, explore the evolution law of ship navigation risks, assist maritime regulatory authorities in tracking potential high-risk ships and grasping local high-risk waters, this section carries out the following work based on the ship conflict probability detection and the extraction of ship groups from the perspective of water navigation management: First, the problem of ship navigation risk assessment is described, and the framework of global risk assessment is explained; secondly, the Shapley value method based on cooperative game is introduced to identify the contribution of each ship in a multi-ship encounter situation; finally, the navigation risks of single ships, different local waters and regions are quantified, and the navigation risks of the research waters are visualized using data visualization technology. This will help maritime regulatory authorities to have a more comprehensive understanding of real-time collision risks, effectively grasp the risks and traffic complexity of different local waters and regions, and thus have a deeper understanding of ship navigation risks, provide guidance for the formulation of risk mitigation measures.
3.3.1. Risk Assessment Framework
The ship navigation risk system is composed of the set of all ships sailing in the research waters at a certain time, as shown in Figure 6. For example: if there are n ships in the system, the system can be represented by a graph, where S is a set of ships, represented as, and the elements in the set are each ship, where the edge set is, represents the conflict relationship between ships, and the edge weight is the conflict probability value between ships. The conflict probability of shipand shipat time t is represented by. Only when there is a conflict betweenandat time t, , that is, when and only when,.
Figure 7 (a) (b) are the spatial position distribution and conflict connection relationship diagrams of ships at a certain moment. Combining Figure 7 (a) (b), we can see that at a certain moment, there is no connection between ships that are far away or even close but have a tendency to move away from each other. Therefore, the ship system graph is not connected, but is divided into several subgraphs. Assume is a connected subgraph of, a subgraph (that is, a ship group divided according to the FMOASC algorithm) is a subset (subsystem) of the ship system, and m is the number of subsystems. The relationship between the ship navigation risk system and subsystems in the study waters is.For any two subgraphs and, there exists.
The collision risk of the kth subsystem is represented by . For any pair of ships with a non-zero collision probability, the risk of the subsystem in which they are located will be affected by the collision probability between them, which in turn affects the system risk of the regional ship composition. This paper will modelas the function of, that is, whereand.
3.3.2. Global risk Assessment
The process of evaluating global collision risk is shown in the figure below:
Figure 8.
Global collision risk assessment process.
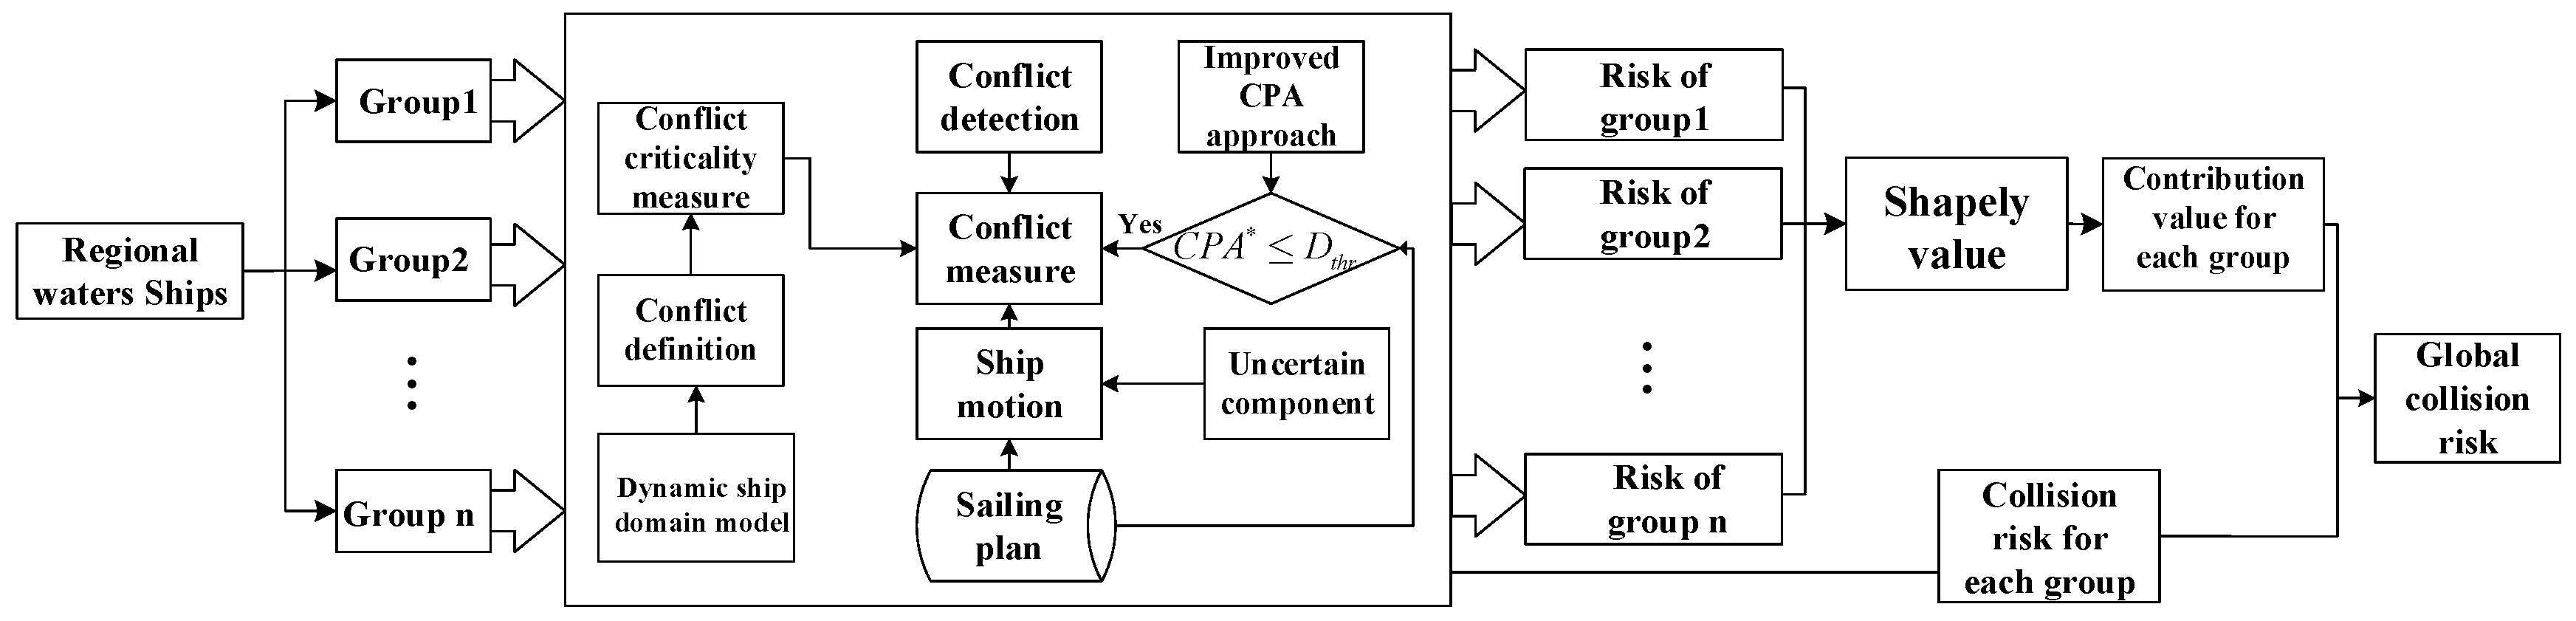
It is assumed that the global collision risk of a multi-ship encounter is composed of the collision risk of each ship in the situation. However, due to the different encounter types and collision avoidance maneuvers between different ships, the contribution of each ship to the global collision risk will also be different. Based on the above assumptions, the Global Collision Risk (GCR) of a multi-ship encounter can be expressed by the following equation:
Among them, andrefer to the collision risk and contribution of ship in the multi-ship encounter scenario, respectively.
In order to evaluate the global collision risk in multi-ship encounter, it is necessary to first determine the collision risk of each ship in the encounter and its contribution. For complex navigable waters with high ship density, a large number of ships will be in the same waters at the same time. The calculation of the global collision risk needs to traverse all ships in the waters at the same time. Therefore, the calculation complexity is very large. In order to simplify the calculation, this paper adopts the ship group division method from the perspective of water navigation management proposed in Section 3.2, divides the ships in the study waters into different ship groups, and then identifies the collision risk of each ship based on the ship conflict probability detection method proposed in Section 3.1. Subsequently, the Shapley value method in the cooperative game (to be introduced in the next subsection) is used to determine the contribution of each ship. The collision risk within the ship group is calculated according to formula (21). On this basis, all collision risks of different ship groups are integrated through formula (22) to obtain the Regional Collision Risk (RCR).
Among them, is the Collision Risk of each Group, is the contribution of each ship group.
3.3.3. Local/Regional Navigation Risk Quantification
The scope of ship navigation risk events discussed is aimed at two or more ships, that is, at least two ships are the system objects of ship navigation risk events. The navigation status of the ship can be obtained based on AIS data, and the probability of conflict between ships can be obtained using the ship conflict probability detection method proposed in Section 3.1. This degree of conflict is a measure of the severity of the conflict from the perspective of each ship. The forms of local and regional system risks are characterized byand respectively.
3.3.4. Contribution Determination
The Shapley value method was proposed by Shapley L.S in 1953 to solve the problem of conflicts caused by the distribution of benefits among multiple participants in the process of cooperation. It is a solution method in the field of cooperative games. The Shapley value method represents the contribution of each participant to the entire group. A major advantage of applying the Shapley value is that the benefits are distributed according to the marginal contribution rate of the members to the combination. This solves the problem of benefit distribution because the method distributes the cooperation amount by estimating the contribution of each participant. This method is used to calculate the contribution of each ship to the navigation risk in multi-ships encounter. The general form of the Shapley value is as follows:
Among them, refers to the participants in the game, refers to the combination consisting of participants, refers to the number of participants in the combination, refers to the number of participants in the entire group, refers to the amount generated by the combination,refers to the amount generated by the combination before the participants join, and refers to the Shapley value corresponding to the participants.
When applying the Shapley value method, the multi-ships encounter is regarded as a cooperative game, each ship in the encounter scenario is regarded as a game subject, and its collision risk is regarded as the game amount. Ships can form different combinations through permutations and combinations. According to formula (23), when calculating the Shapley value of each ship, it is first necessary to find the risk of each combination. The number of combinations is the sum of all the permutations of the encountering ships, expressed as follows:
Among them, refers to the collision risk of the ship in n-ships encounter.
Each ship’s contribution is calculated as follows:
- Find out all ship combinations by arranging them.
- For each combination, the combined risk value is calculated by summing the risk of each ship according to Formula (24).
- Calculate the Shapley value of each ship according to equation (23).
- Normalized the Shapley value to obtain the contribution degree of each ship to the global collision risk.
In addition to vessels with a high risk of collision, VTS supervisors also need to focus on vessels with a high Shapley value, which is essential for the control and management of global collision risk. Because the reduction of collision risk of ships with high Shapley value is conducive to the mitigation of global collision risk.
4. Applications and Case Study Results
In this section, we apply and evaluate the performance of the proposed dynamic calculation method for ship navigation risk. Section 4.1 presents the case study and the relevant AIS data. Section 4.2 presents the experimental results of ship probabilistic conflict detection. Section 4.3 presents the experimental analysis of the ship grouping method. Section 4.4 quantifies and statistically analyzes the navigation risk in different local waters.
4.1. Study Area and Data Description
Ningbo-Zhoushan Port was selected as the experimental research area to test the dynamic calculation method of ship navigation risk proposed in this paper. In terms of cargo throughput, the port is the largest port in the world with high traffic density, limited navigable waters, and complex spatiotemporal uncertainty in ship movement. Therefore, the port is a representative of complex waters. AIS data for one month were collected from the port. The region for evaluation is bounded between longitudes 122°06E-122°16E and latitudes 29°49N-29°57N (see Figure 9). Since ships such as fishing vessels, pilot boats, and tugboats often coexist to perform tasks and may not comply with conventional maritime safety rules, the experimental analysis used AIS data of general commercial ships including cargo ships and tankers. Although AIS provides a powerful and easily accessible data source for maritime traffic research, the collected data often have problems such as missing data or incorrect position and speed information due to various technical failures. Therefore, the AIS data preprocessing module is crucial to improve data quality. This study adopts a systematic preprocessing procedure to clean the data, in this way, we can remove possible noise and reconstruct clean and reliable trajectory data for experimental analysis. In other words, this data cleaning process is a prerequisite for real-time analysis.
4.2. Conflict Probability Detection Based on Ship Encounter Scenarios
To test the performance of the proposed approach under the condition that the encountering ships have changeable spatiotemporal motion behaviors, a ship-pair encounter scenario derived from the historical data is presented (see Figure 10). The lines in Figure 10 are the trajectories of the ship-pair involved in the encounter, where “x” marks the ships starting locations and “△” are their final locations. It can be seen that one ship basically sails linearly, while another one has a turning behavior during the encounter. The data of the ships at corresponding times are input into the conflict probability calculation model to obtain the ship conflict analysis diagram, as shown in Figure 10 (b).
Figure 10 (b) shows the change of the conflict probability with and without considering the turning point in the encounter scenario (where the conflict probability * curve is the conflict probability detection result obtained based on the method proposed in this paper). Due to the turning behavior of ship A, DCPA has two troughs during the encounter. Figure 10 (b) shows that without considering the turning point, the conflict probability value fluctuates greatly with the change of DCPA, which may confuse the marine navigator when identifying the collision risk. Obviously, conflict identification without considering the turning point becomes invalid in this encounter scenario. This is because DCPA assumes that the ship sails linearly without changing its heading and speed. Therefore, traditional collision risk assessment methods based on DCPA may provide false alarms, hindering their application in highly dynamic traffic environments. The conflict probability detection method proposed in this paper can take into account the dynamics and uncertainty of ship motion, thereby providing accurate and timely collision warnings.
In order to further verify the effectiveness of the proposed conflict probability detection method in multi-ships encounter scenario, a three-ship encounter scenario extracted from real AIS data was selected for experiment. The ship navigation trajectory is shown in Figure 11 (a). This paper measures the distance between multiple ships using the average ship spacing, as shown below:
Where is the distance between shipand ship. The change of conflict probability and average distance over time in the multi-ships encounter scenario is shown in Figure 11 (b). The red curve is the totalvalue of ship A and the other two ships in the multi-ship encounter scenario, and the blue curve and orange curve represent the conflict probability values ,of ship A and ship B, ship A and ship C, respectively. The dotted line is the sum. It can be observed that the total valueis higher than that of any single target ship. This finding is consistent with the general understanding of collision risk, that is, ships participating in multi-ships encounter usually face greater risks than two-ship encounter. It can be seen from Figure 11 (b) that the average distance between ships is negatively correlated with the conflict probability. In addition, by comparing the red curve and the black dotted line, it is found that the total valueof ship A with ships B and ship C is not the sum of its and each target ship. Therefore, the proposed conflict probability detection method can not only detect the conflict probability of the ship when multiple ships encounter, but also provide the probability of occurrence of multi-ship conflicts.
The conflict probability provides a criticality measure that can be used to distinguish between conflicts that can be ignored (below the conflict probability detection standard threshold) and conflicts that need to be avoided (above the conflict detection standard threshold). In addition, the conflict probability can also be used to determine the priority of conflict resolution.
4.3. Ship Grouping Experiment
The ships in the research waters at a certain moment (as shown in Figure 12) were grouped using the FMO, SC and FMOASC algorithms, and a comparative experiment was conducted using modularity and the number of noise points as grouping indicators. FMOASC was used as the experimental group, and FMO and SC were used as the control group. The results are shown in Figure 13.
As can be seen from Figure 13 (a), in terms of modularity index, the results of FMO and SC algorithms are quite different, especially when the number of groups is small. Overall, the modularity of SC is also lower than that of FMO. The FMOASC algorithm proposed in this paper combines the advantages of both FMO and SC algorithms, so the modularity of the FMOASC algorithm can be maintained at a high level. From the curve corresponding to the FMOASC algorithm, it can be seen that since the algorithm comprehensively considers the topological connection relationship and spatial characteristics of ship conflicts, as the number of groups decreases, the modularity of the FMOASC algorithm decreases significantly slower than that of the SC algorithm, indicating that the loss value of the modularity of the algorithm will not be large when the number of groups is small. The modularity value of FMOASC becomes closer and closer to that of FMO as the number of groups increases, until it almost completely overlaps. Therefore, the modularity of the grouping results obtained by the FMOASC algorithm proposed in this paper is high, which can achieve the effect of division with close connections within the group and sparse connections between groups.
It can be seen from Figure 13 (b) that the number of noise points of the SC algorithm is significantly lower than that of the FMO, while the number of noise points obtained by the FMOASC algorithm proposed in this paper is very close to that of the SC algorithm. As the number of groups increases, especially when the number of groups is 10 or more, the noise point number curves of FMOASC and SC almost overlap, so the number of noise points obtained by FMOASC is small. FMOASC combines the FMO and SC algorithms to divide the ship groups. The algorithm integrates the advantages of the two algorithms, which can not only maintain a high modularity, but also minimize the number of noise points, and has a balanced performance in modularity and the number of noise points.
Figure 14 shows the comprehensive evaluation index values of different grouping schemes when the ships in the study area (shown in Figure 3-13) are divided into ship groups using the FMOASC algorithm. By analyzing Figure 14, it can be found that the highest comprehensive evaluation value (I=0.5828) is the division scheme with 10 ship groups, so this division scheme is adopted. The ship group division results obtained by the three algorithms are shown in Figure 15.
Figure 15 (a) shows the position distribution and heading of ships in the research waters at a certain moment. The ellipses in Figure 15 (b), (c), and (d) represent different groups. As can be seen from Figure 15 (b), Group 4 spans the spatial distance. This is because FMO only considers the conflict relationship between ships and does not consider the spatial position of ships. Considering only the current conflict relationship has another disadvantage. Some ships do not have a conflict relationship currently, but they have a tendency to approach each other and should be put in one group for comprehensive consideration. The advantage is that the FMO algorithm can divide ships that are close in spatial distance but have a tendency to move away from each other (no conflict relationship) into different groups.
By observing the results of the SC algorithm, we can find two types of situations that do not meet the principles of group division proposed in this paper. The first type: the distance between ships is close but they are already in a state of leaving each other and do not pose a risk. The SC algorithm will classify such ships into a group. It is not meaningful to manage such ships as a group; the second type: there is a conflict relationship between ships, but the ships that are far apart at the moment are not classified into a group. Such ships should be classified into a group for management, so as to timely discover the risks of ship navigation. These two types of divisions occur because the SC algorithm only uses the spatial distance between ships as the edge weight and constructs a similarity matrix to divide ships into groups. The FMOASC algorithm proposed in this paper divides ship groups by comprehensively considering the conflict connection relationship and spatial position between ships. On the basis of considering the conflict connection relationship, the spatial position of the ship is considered, so that a more ideal group division result can be obtained from the perspective of water navigation management.
4.4. Quantifying Risks in Different Local Waters
Using 7,680,496 AIS data from the study area for one month, conflict data was calculated. The conflict distribution visualization diagram for each hour is shown in Figure 16. The numbers under each sub-figure in the figure represent 24 time periods, such as “1” represents the conflict distribution during the 00:00-01:00 time period. As shown in sub-figures 16 (1)-(4), the number of ship conflicts during the 00:00-04:00 time period is relatively small; in Figures 16 (5)-(15), the conflict distribution area is wider and is roughly distributed in the Fudu Waterway, Luotou Waterway, and Xiazhimen Channel. Among them, the frequency of ship conflicts in Luotou Waterway and Xiazhimen Channel is higher. The reason for the higher frequency of conflicts in Luotou Waterway is that ship traffic from other directions converges in this water area, increasing the frequency of multiple ship encounters. In addition, ship turning due to terrain geometric constraints in this water area may also be one of the reasons for this result. In fact, Luotou Waterway is an official warning area issued by the Ningbo-Zhoushan VTS Center, which to some extent verifies the effectiveness of the conflict probability detection method proposed in this paper in identifying high collision risk areas. Xiazhimen Channel is the main channel for large ships to enter and leave the port, but the navigation width is narrow, so it becomes one of the areas with high collision risk. One possible reason for the high frequency of ship conflicts in Fudu Waterway is that the traffic width in this water area is narrow, resulting in a reduction in the minimum passing distance between encountering ships, so, many high-severity conflicts occur. The degree and distribution range of ship conflicts are expanding in the time period of 20:00-24:00, which may be due to the increase in the number of ship conflicts caused by reduced visibility at night.
The distribution of ship conflicts during the day and at night is explored, that is, the ship conflicts in the time periods of 06:00-18:00 and 18:00-06:00 are counted, and two conflict distribution images are generated every 10 days, as shown in Figure 17, where “Daytime” in the sub-image represents the conflict distribution in the time period of 06:00-18:00, and “Night” represents the conflict distribution image in the time period of 18:00-06:00. As can be seen from the figure, the degree of conflict is more severe during the day than at night, the number of conflicts is larger, and the high-risk areas are concentrated in the waters of the intersection of Luotou Waterway and Zhitouyang, Fodu Waterway, Xiazhimen Channel, and the southern part of Damao Island. Among them, the waters south of Damao Island are the main roads connecting the port hub with offshore ship traffic. It is the area with the highest ship traffic density and the highest frequency of ship encounters in the port; the intersection of Luotou Waterway and Zhitouyang waters, and the intersection of Xiazhimen Channel and Zhitouyang waters are both navigation warning areas officially established by the maritime department, which verifies the accuracy and effectiveness of this article’s conflict research at the micro-time and space scale.
Figure 18 shows the characteristics of the distribution of the hourly conflict probability values in the study waters. It can be observed that the median conflict probability fluctuates slightly over time. In the 11:00-15:00 time period, the median of conflicts between ships is larger than that in other time periods. The possible reason is that the ship traffic volume in this time period is large and the possibility of dangerous encounters between ships is high. The maximum conflict probability is basically maintained at 1, which means that ship encounters with high conflict severity will occur in every time period. VTS centers can use indicators such as median and maximum values to more comprehensively understand the real-time collision risks and traffic complexity in the region, thereby improving their ability to deal with dangerous encounters caused by high traffic intensity.
Figure 18.
Time distribution of conflict.
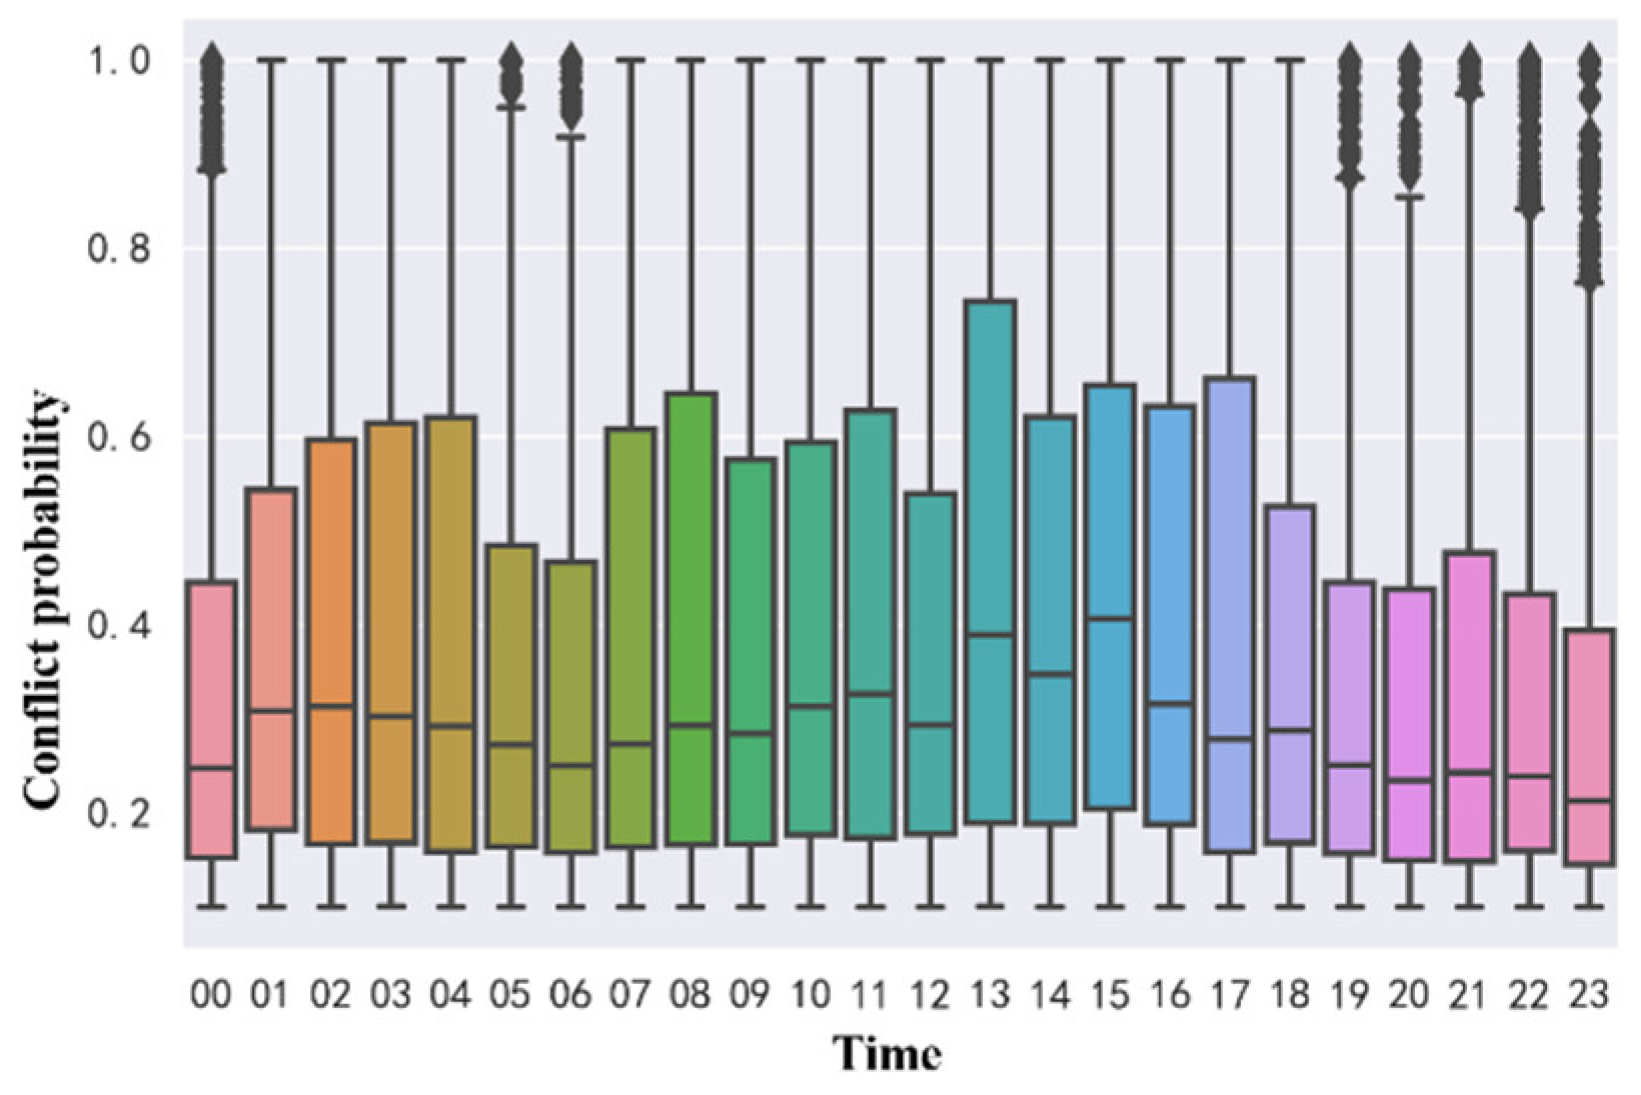
Figure 19.
Time distribution of the number of conflicts.
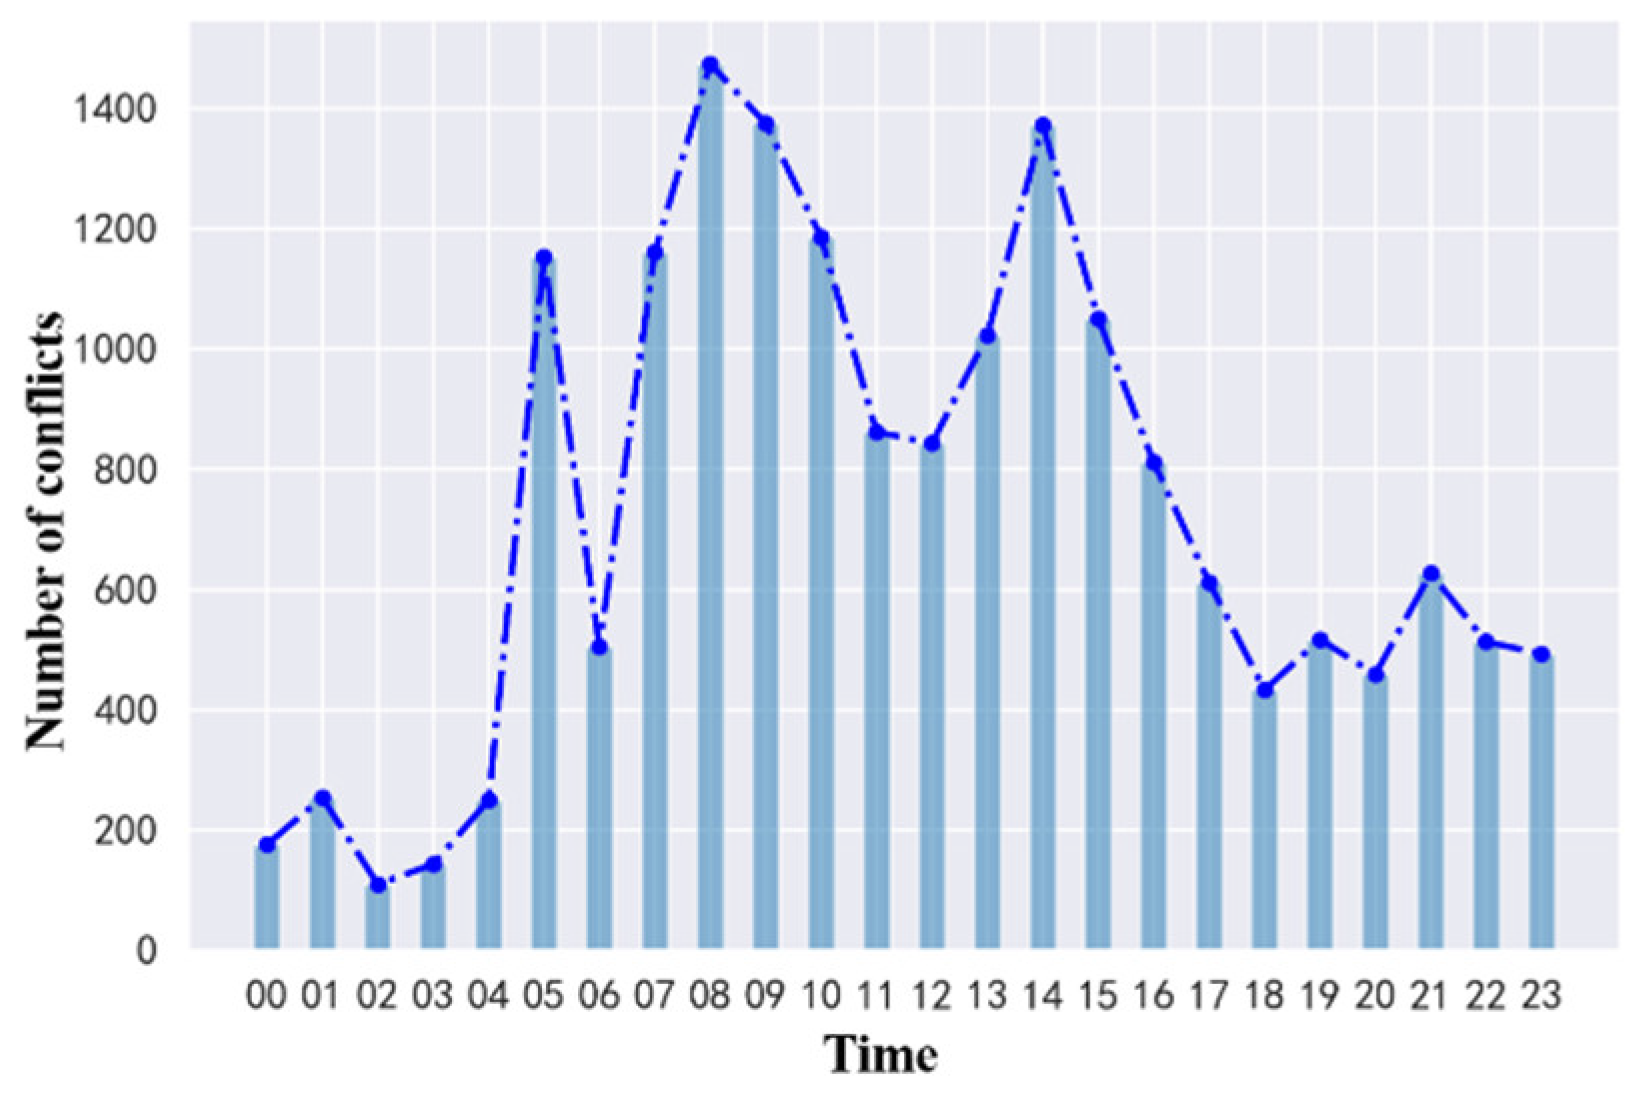
Figure 19 shows the number of conflicts per hour in the study waters. It can be seen that ship conflicts occur more frequently in the time periods of 05:00, 07:00-11:00, and 13:00-17:00, which is consistent with the actual traffic conditions in the study waters, because the ship traffic density is higher during the day. Based on the identification results of the conflict distribution in time and space, marine navigators and maritime departments can have a deeper understanding of when and where to enhance situational awareness during the navigation process of ships, providing valuable reference for traffic regulatory departments to formulate and implement appropriate regulatory strategies.
The distribution of conflict severity and the corresponding cumulative probability distribution are shown in Figure 20. It can be seen from the figure that the severity of most conflicts is below 0.2, which indicates that the probability of a ship being involved in a higher conflict is much lower than the probability of being involved in a minor conflict. In order to further demonstrate the characteristics of the detected conflicts, Figure 21 shows the number of different conflict types among different ship types. It can be seen that the number of crossing encounter conflict types is the largest, followed by overtaking, and then head-on. Compared with overtaking and head-on conflicts, the proportion of conflicts in crossing encounter scenarios is higher, mainly because the relatively large angle range is classified as crossing encounters. In addition, the number of conflicts between cargo ships in the three encounter scenarios is much higher than that of other ships, which may be due to the large number of cargo ships in the study waters and the frequent encounters.
In order to verify the effectiveness and feasibility of the global risk assessment method proposed in this paper, the complexity of maritime traffic is introduced as a collision risk indicator for evaluation. The complexity of maritime traffic is used to indicate the degree of traffic conditions, including the degree of congestion and risk. Although the traffic complexity model is not a traditional risk assessment model, it can reflect the instantaneous collision risk to a certain extent. Generally speaking, the higher the traffic complexity, the higher the collision risk, because when the traffic situation becomes complicated, the difficulty of avoiding collision increases. In addition, compared with simple indicators such as traffic density and ship distance, it can more fully reflect the risk of ship collision. Therefore, this paper uses traffic complexity as an indicator of the effectiveness of the global risk assessment framework.
The definition of the maritime traffic complexity model includes two parts: traffic density factor and traffic conflict factor. The traffic density factor is described by the relative distance between ships, and the traffic conflict factor is described by the length, speed and relative orientation of the ship. The traffic complexity is expressed as follows:
Among them, 、、are the traffic complexity, traffic density complexity, and traffic conflict complexity of the ship and ship , respectively. are the relative distance, relative speed, and relative orientation between the ship and ship, respectively; is the traffic complexity of the ship, is the average of the sum of all complexities involving ship.
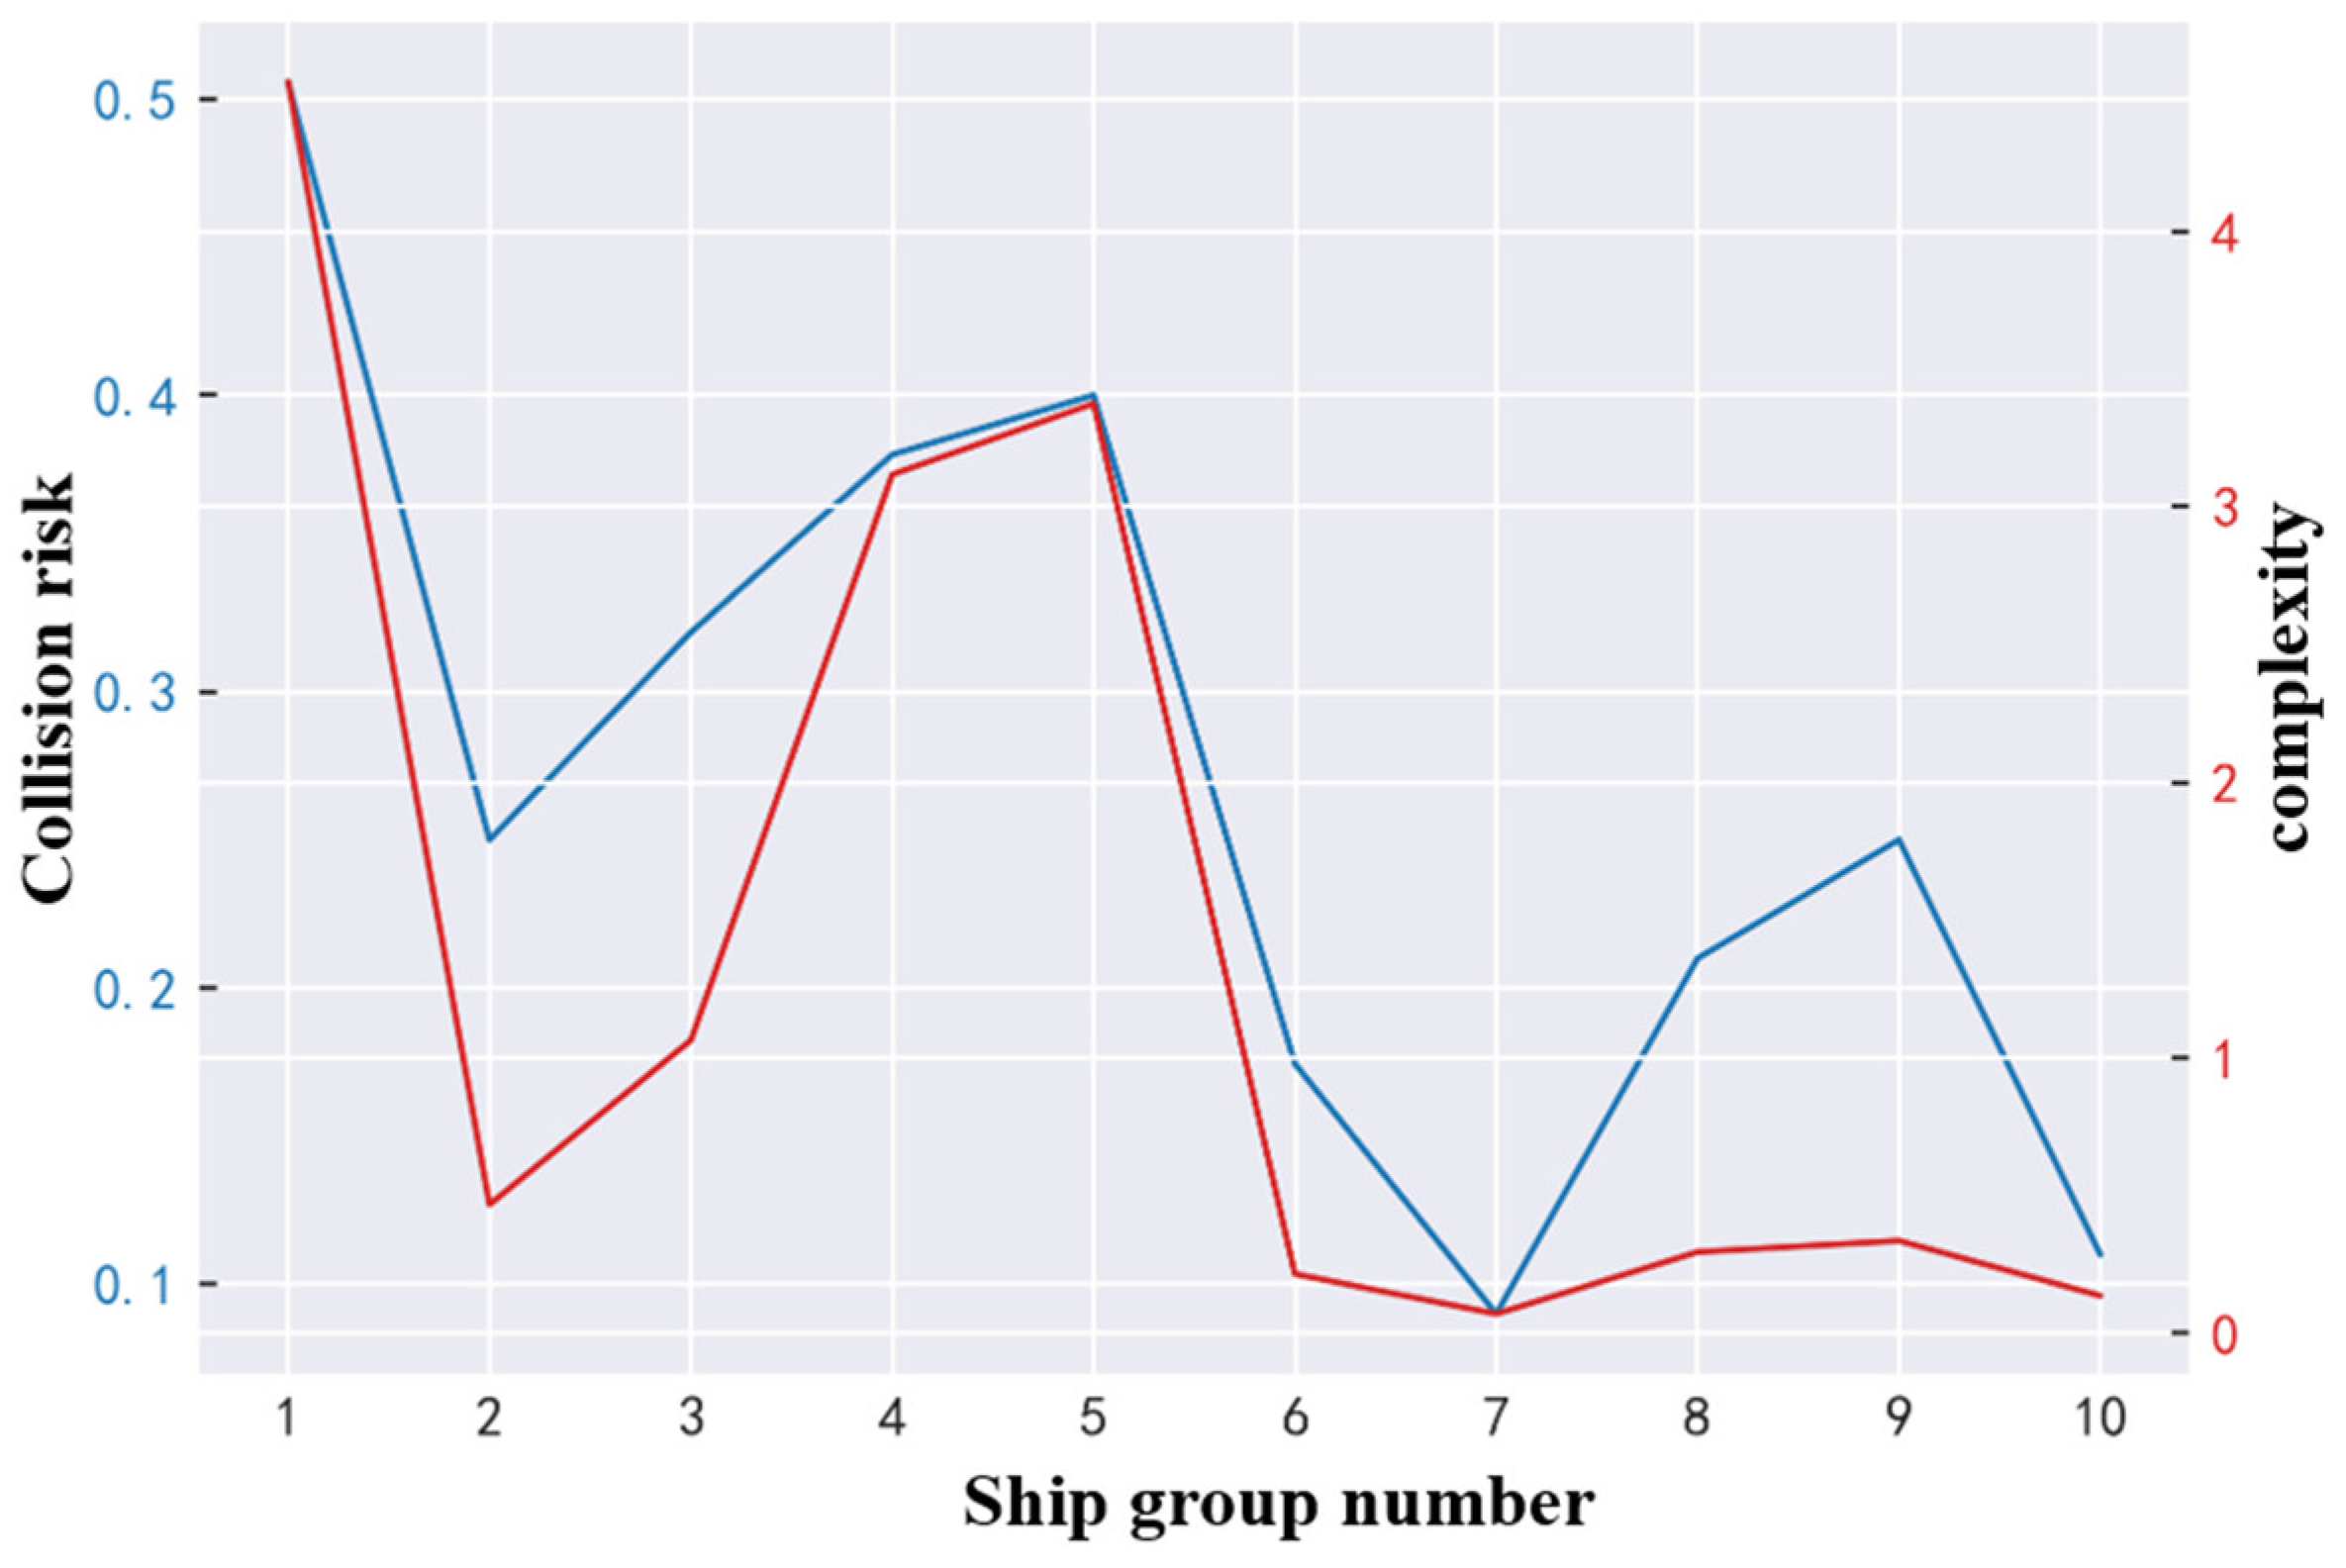
According to the ship group extraction algorithm proposed in this paper, the ships in the study waters at a certain time are divided into 10 ship groups, as shown in Figure 22. The contribution value of each ship in each ship group obtained by the Shapley value method in cooperative game is shown in Figure 23. The collision risk and traffic complexity of each ship group are shown in Figure 24.
It can be seen from Figure 24 that the group with the highest collision risk is Group 1, which reaches 0.5058. It can be seen that: the ship traffic density in Group 1 is large, there are many ship conflicts, and the narrow channel width leads to a reduced passing distance between ships, resulting in a high risk within the group; Group 7 has the lowest collision risk of 0.09, and the distance between ships in the group is relatively large, resulting in a conflict of lower severity; and the collision risk in Group 3 is significantly greater than that in Group 7. This is because the distance between ships in Group 3 is much smaller than that in Group 7. When approaching each other, the distance is negatively correlated with the collision risk. Therefore, the collision risk calculated according to this framework is consistent with the actual traffic conditions in the study waters. In addition, it can be seen from Figure 24 that the traffic complexity curve and collision risk curve of each group have the same change trend. In order to quantitatively analyze the correlation between the change trend of collision risk and traffic complexity of the 10 ship groups, a Pearson correlation analysis was performed. The analysis results show that at a confidence level of 99%, the change trend of collision risk of the 10 ship groups is strongly correlated with the change trend of traffic complexity, with a correlation coefficient of 0.923 and a P value of less than 0.001. Therefore, it can be proved that the collision risk of different ship groups in the waters calculated according to the proposed framework is effective.
5. Conclusions
This paper takes complex navigable waters as the research object, conducts relevant research on the dynamic calculation of ship navigation risks, and proposes a ship group division method from the perspective of water navigation management based on the ship conflict probability detection method based on AIS data. Aims to establish a navigation risk quantification model for different local waters that comprehensively considers the spatiotemporal dynamics and uncertainty of ship movement, systematically form a dynamic calculation theory of ship navigation risk, reduce the regulatory pressure of maritime authorities, and provide valuable reference for more accurate and timely provision of appropriate control and management strategies based on real conflict situations.
The innovation of this paper is mainly reflected in the following two aspects: (1) Proposing a conflict probability detection method that considers the uncertainty characteristics and dynamic characteristics of ship movement This method can detect the probability of ship conflict in a complex dynamic environment in a timely and accurate manner, provide valuable information for the quantification of ship collision risks and safety supervision from the perspective of water navigation management. (2) Propose a dynamic calculation method for navigation risk of ship groups based on the perspective of water navigation management It is convenient for maritime regulatory authorities to more comprehensively and clearly grasp the internal connection and attributes between ships involved in decision-making, which helps regulatory personnel to effectively capture high-risk traffic clusters, better understand the risk status of different local waters, and provide targeted supervision and management plans to improve ship traffic safety and efficiency.
Author Contributions
Conceptualization, Y.C. and Q.Y.; methodology, Y.C.; software, W.W.; validation, W.W., X.W. and Y.C.; formal analysis, Y.C.; investigation, Q.Y.; resources, Q.Y.; data curation, Q.Y; writing—original draft preparation, Y.C.; writing—review and editing, Y.C.; visualization, Y.C.; supervision, X.W.; project administration, Q.Y.; funding acquisition, Q.Y. All authors have read and agreed to the published version of the manuscript.
Funding
This research was funded by the National Natural Science Foundation of China (Grant No. 52201412), China. This research was supported by the university-level Young and Middle-aged Research Fund of Xiamen Institute of Technology (No. KYT2023001).
Institutional Review Board Statement
Not applicable
Informed Consent Statement
Not applicable
Data Availability Statement
Not applicable
Acknowledgments
Thanks for the funding from the National Natural Science Foundation of China (Grant No. 52201412); Thans for the support of Xiamen Institute of Technology University-level Youth Research Fund Project (No. KYT2023001)
Conflicts of Interest
The authors declare no conflict of interest.
References
- Goerlandt, F.; Montewka, J. Maritime Transportation Risk Analysis: Review and Analysis in Light of Some Foundational Issues. Reliab Eng Syst Saf 2015, 138, 115–134. [CrossRef]
- Liu, Z.; Li, Y.; Zhang, Z.; Yu, W.; Han, B.; Du, Y. Spatial Modeling and Analysis Approach for Ship-Encounters Dynamic Spatial–Temporal Domain. Ocean Engineering 2023, 278, 114373. [CrossRef]
- Yim, J.-B.; Kim, D.-S.; Park, D.-J. Modeling Perceived Collision Risk in Vessel Encounter Situations. Ocean Engineering 2018, 166, 64–75. [CrossRef]
- Chen, P.; Huang, Y.; Mou, J.; van Gelder, P.H.A.J.M. Probabilistic Risk Analysis for Ship-Ship Collision: State-of-the-Art. Saf Sci 2019, 117, 108–122. [CrossRef]
- Zhao, Y.; Suo, Y.; Xian, B. Ship Encounter Scenario and Maneuvering Behavior Mining Based on AIS Data. In; 2022; pp. 58–65.
- Liu, J.; Zhang, J.; Yang, Z.; Wan, C.; Zhang, M. A Novel Data-Driven Method of Ship Collision Risk Evolution Evaluation during Real Encounter Situations. Reliab Eng Syst Saf 2024, 249, 110228. [CrossRef]
- Lei, P.-R. Mining Maritime Traffic Conflict Trajectories from a Massive AIS Data. Knowl Inf Syst 2020, 62, 259–285. [CrossRef]
- Chen, P.; Huang, Y.; Mou, J.; van Gelder, P.H.A.J.M. Ship Collision Candidate Detection Method: A Velocity Obstacle Approach. Ocean Engineering 2018, 170, 186–198. [CrossRef]
- Zhang, W.; Goerlandt, F.; Kujala, P.; Wang, Y. An Advanced Method for Detecting Possible near Miss Ship Collisions from AIS Data. Ocean Engineering 2016, 124, 141–156. [CrossRef]
- Kundakçı, B.; Nas, S.; Gucma, L. Prediction of Ship Domain on Coastal Waters by Using AIS Data. Ocean Engineering 2023, 273, 113921. [CrossRef]
- Fujii, Y.; Tanaka, K. Traffic Capacity. Journal of Navigation 1971, 24, 543–552. [CrossRef]
- Wang, Y.; Chin, H.-C. An Empirically-Calibrated Ship Domain as a Safety Criterion for Navigation in Confined Waters. Journal of Navigation 2016, 69, 257–276. [CrossRef]
- Wang, N. A Novel Analytical Framework for Dynamic Quaternion Ship Domains. Journal of Navigation 2013, 66, 265–281. [CrossRef]
- Zhang, L.; Meng, Q. Probabilistic Ship Domain with Applications to Ship Collision Risk Assessment. Ocean Engineering 2019, 186, 106130. [CrossRef]
- Szłapczyński, R.; Niksa-Rynkiewicz, T. A Framework of A Ship Domain-Based Near-Miss Detection Method Using Mamdani Neuro-Fuzzy Classification. Polish Maritime Research 2018, 25, 14–21. [CrossRef]
- Dinh, G.H.; Im, N. The Combination of Analytical and Statistical Method to Define Polygonal Ship Domain and Reflect Human Experiences in Estimating Dangerous Area. International Journal of e-Navigation and Maritime Economy 2016, 4, 97–108. [CrossRef]
- Zhen, R.; Riveiro, M.; Jin, Y. A Novel Analytic Framework of Real-Time Multi-Vessel Collision Risk Assessment for Maritime Traffic Surveillance. Ocean Engineering 2017, 145, 492–501. [CrossRef]
- Chin, H.C.; Debnath, A.K. Modeling Perceived Collision Risk in Port Water Navigation. Saf Sci 2009, 47, 1410–1416. [CrossRef]
- Wang, N.; Yuen, K.F.; Yuan, J.; Li, D. Ship Collision Risk Assessment: A Multi-Criteria Decision-Making Framework Based on Dempster–Shafer Evidence Theory. Appl Soft Comput 2024, 162, 111823. [CrossRef]
- Zhang, M.; Montewka, J.; Manderbacka, T.; Kujala, P.; Hirdaris, S. A Big Data Analytics Method for the Evaluation of Ship - Ship Collision Risk Reflecting Hydrometeorological Conditions. Reliab Eng Syst Saf 2021, 213, 107674. [CrossRef]
- Gil, M.; Montewka, J.; Krata, P.; Hinz, T.; Hirdaris, S. Determination of the Dynamic Critical Maneuvering Area in an Encounter between Two Vessels: Operation with Negligible Environmental Disruption. Ocean Engineering 2020, 213, 107709. [CrossRef]
- Gang, L.; Wang, Y.; Sun, Y.; Zhou, L.; Zhang, M. Estimation of Vessel Collision Risk Index Based on Support Vector Machine. Advances in Mechanical Engineering 2016, 8, 168781401667125. [CrossRef]
- Li, B.; Pang, F.-W. An Approach of Vessel Collision Risk Assessment Based on the D–S Evidence Theory. Ocean Engineering 2013, 74, 16–21. [CrossRef]
- Lenart, A.S. Analysis of Collision Threat Parameters and Criteria. Journal of Navigation 2015, 68, 887–896. [CrossRef]
- Larson, J.; Bruch, M.; Ebken, J. Autonomous Navigation and Obstacle Avoidance for Unmanned Surface Vehicles.; Gerhart, G.R., Shoemaker, C.M., Gage, D.W., Eds.; May 5 2006; p. 623007.
- Huang, Y.; van Gelder, P.H.A.J.M.; Wen, Y. Velocity Obstacle Algorithms for Collision Prevention at Sea. Ocean Engineering 2018, 151, 308–321. [CrossRef]
- Szlapczynski, R.; Szlapczynska, J. A Target Information Display for Visualizing Collision Avoidance Maneuvers in Various Visibility Conditions. Journal of Navigation 2015, 68, 1041–1055. [CrossRef]
- Huang, Y.; Chen, L.; van Gelder, P.H.A.J.M. Generalized Velocity Obstacle Algorithm for Preventing Ship Collisions at Sea. Ocean Engineering 2019, 173, 142–156. [CrossRef]
- Huang, Y.; van Gelder, P.H.A.J.M. Time-Varying Risk Measurement for Ship Collision Prevention. Risk Analysis 2020, 40, 24–42. [CrossRef]
- Idiri, B.; Napoli, A. The Automatic Identification System of Maritime Accident Risk Using Rule-Based Reasoning. In Proceedings of the 2012 7th International Conference on System of Systems Engineering (SoSE); IEEE, July 2012; pp. 125–130.
- Hänninen, M. Bayesian Networks for Maritime Traffic Accident Prevention: Benefits and Challenges. Accid Anal Prev 2014, 73, 305–312. [CrossRef]
- Kujala, P.; Hänninen, M.; Arola, T.; Ylitalo, J. Analysis of the Marine Traffic Safety in the Gulf of Finland. Reliab Eng Syst Saf 2009, 94, 1349–1357. [CrossRef]
- Bye, R.J.; Aalberg, A.L. Maritime Navigation Accidents and Risk Indicators: An Exploratory Statistical Analysis Using AIS Data and Accident Reports. Reliab Eng Syst Saf 2018, 176, 174–186. [CrossRef]
- Du, L.; Goerlandt, F.; Kujala, P. Review and Analysis of Methods for Assessing Maritime Waterway Risk Based on Non-Accident Critical Events Detected from AIS Data. Reliab Eng Syst Saf 2020, 200, 106933. [CrossRef]
- Terndrup Pedersen, P. Collision and Grounding Mechanics;
- Martins, M.R.; Maturana, M.C. Application of Bayesian Belief Networks to the Human Reliability Analysis of an Oil Tanker Operation Focusing on Collision Accidents. Reliab Eng Syst Saf 2013, 110, 89–109. [CrossRef]
- Fan, S.; Blanco-Davis, E.; Yang, Z.; Zhang, J.; Yan, X. Incorporation of Human Factors into Maritime Accident Analysis Using a Data-Driven Bayesian Network. Reliab Eng Syst Saf 2020, 203, 107070. [CrossRef]
- Weng, J.; Li, G.; Chai, T.; Yang, D. Evaluation of Two-Ship Collision Severity Using Ordered Probit Approaches. Journal of Navigation 2018, 71, 822–836. [CrossRef]
- Chen Y.; Liu K.; Xin X.; Miao P.; Zhang M. Ship collision probability detection method based on AIS data. Chinese Nav. 2022,45(04):15-22.
- Xin, X.; Liu, K.; Yang, Z.; Zhang, J.; Wu, X. A Probabilistic Risk Approach for the Collision Detection of Multi-Ships under Spatiotemporal Movement Uncertainty. Reliab Eng Syst Saf 2021, 215, 107772. [CrossRef]
Figure 1.
Framework of this paper.
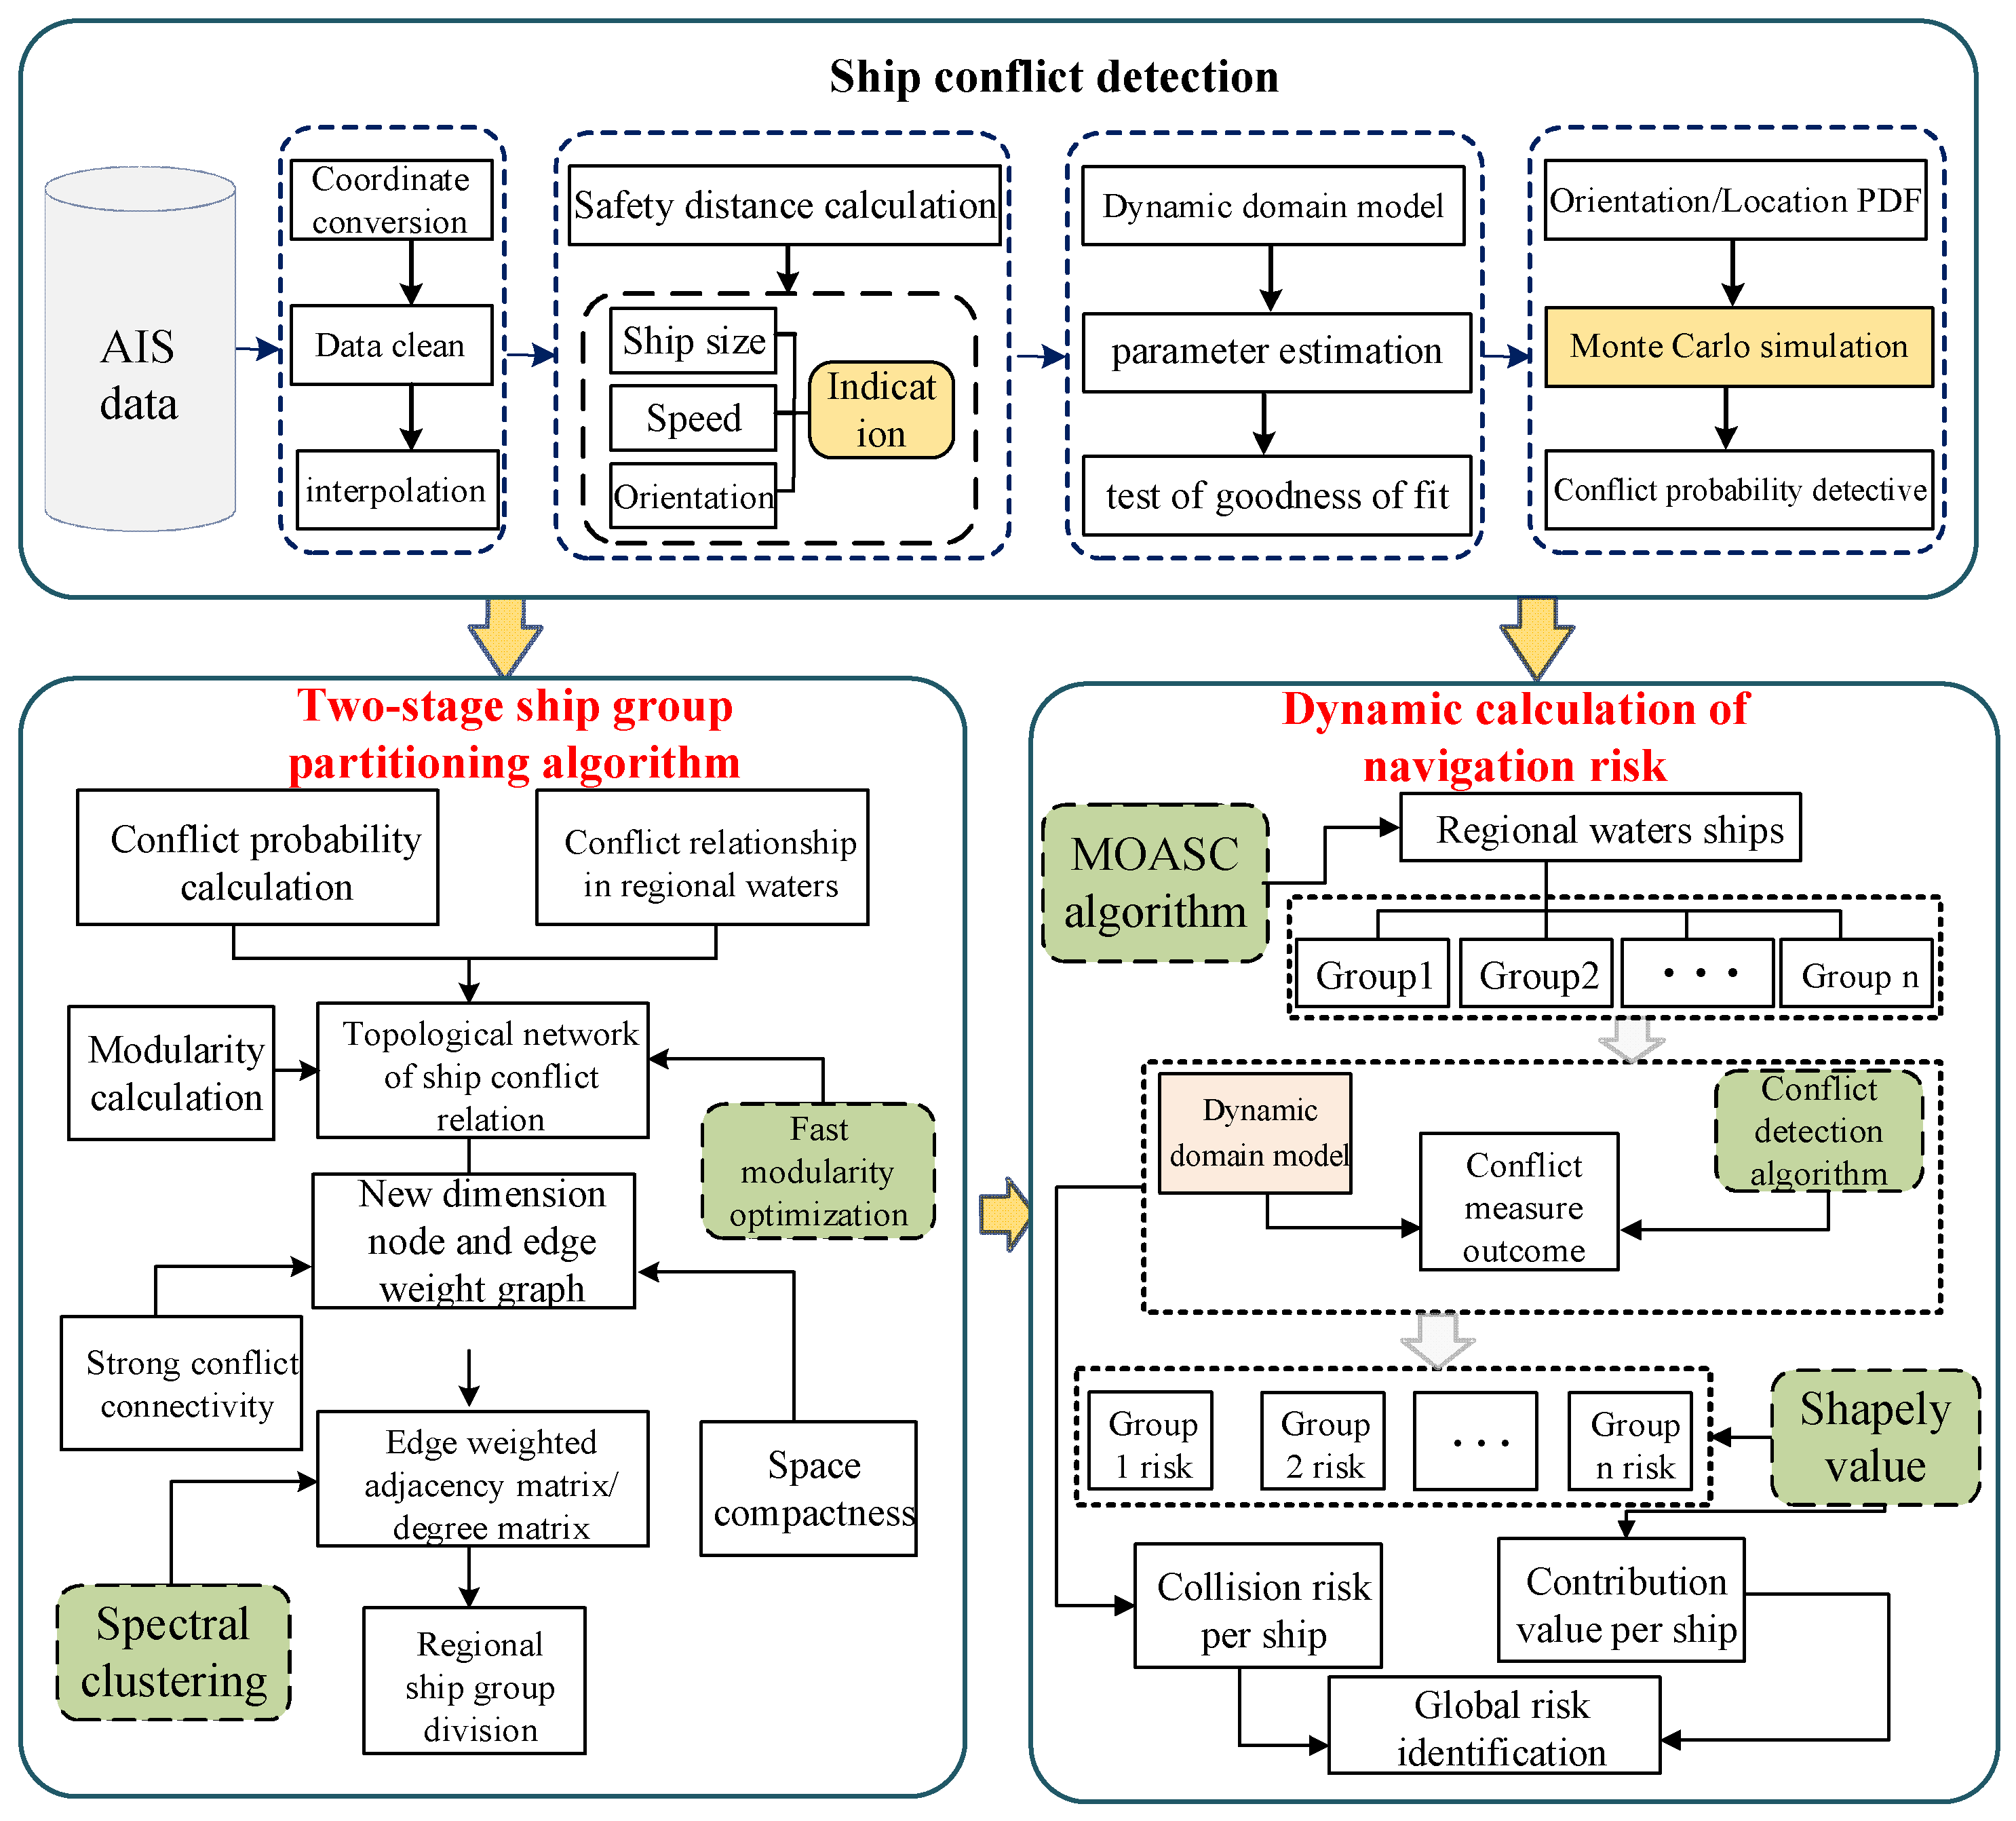
Figure 2.
Ship conflict illustration.
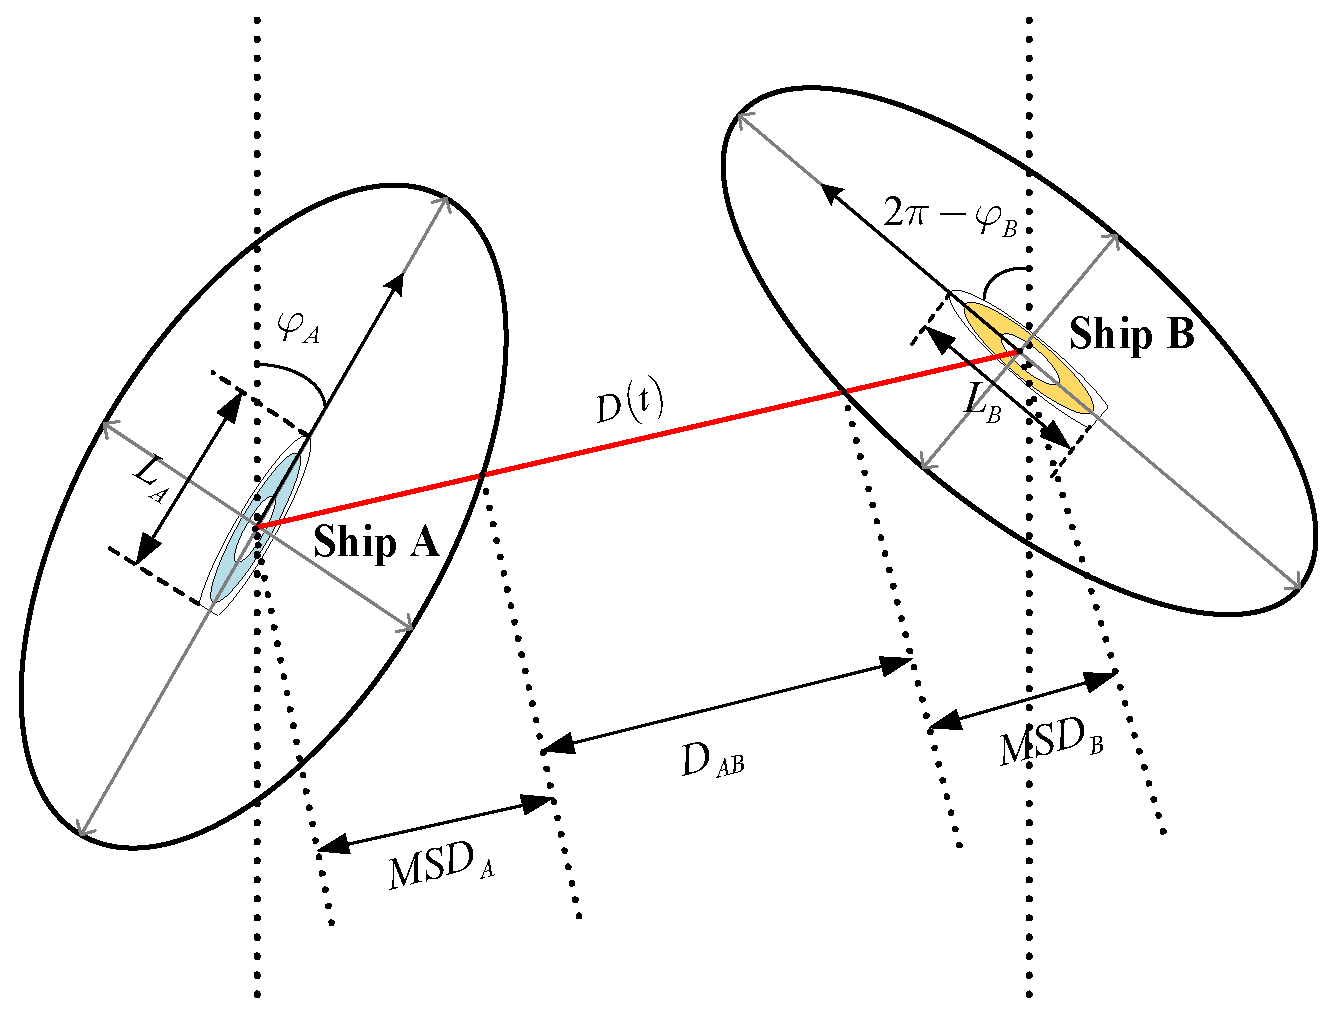
Figure 3.
Ship group division framework.
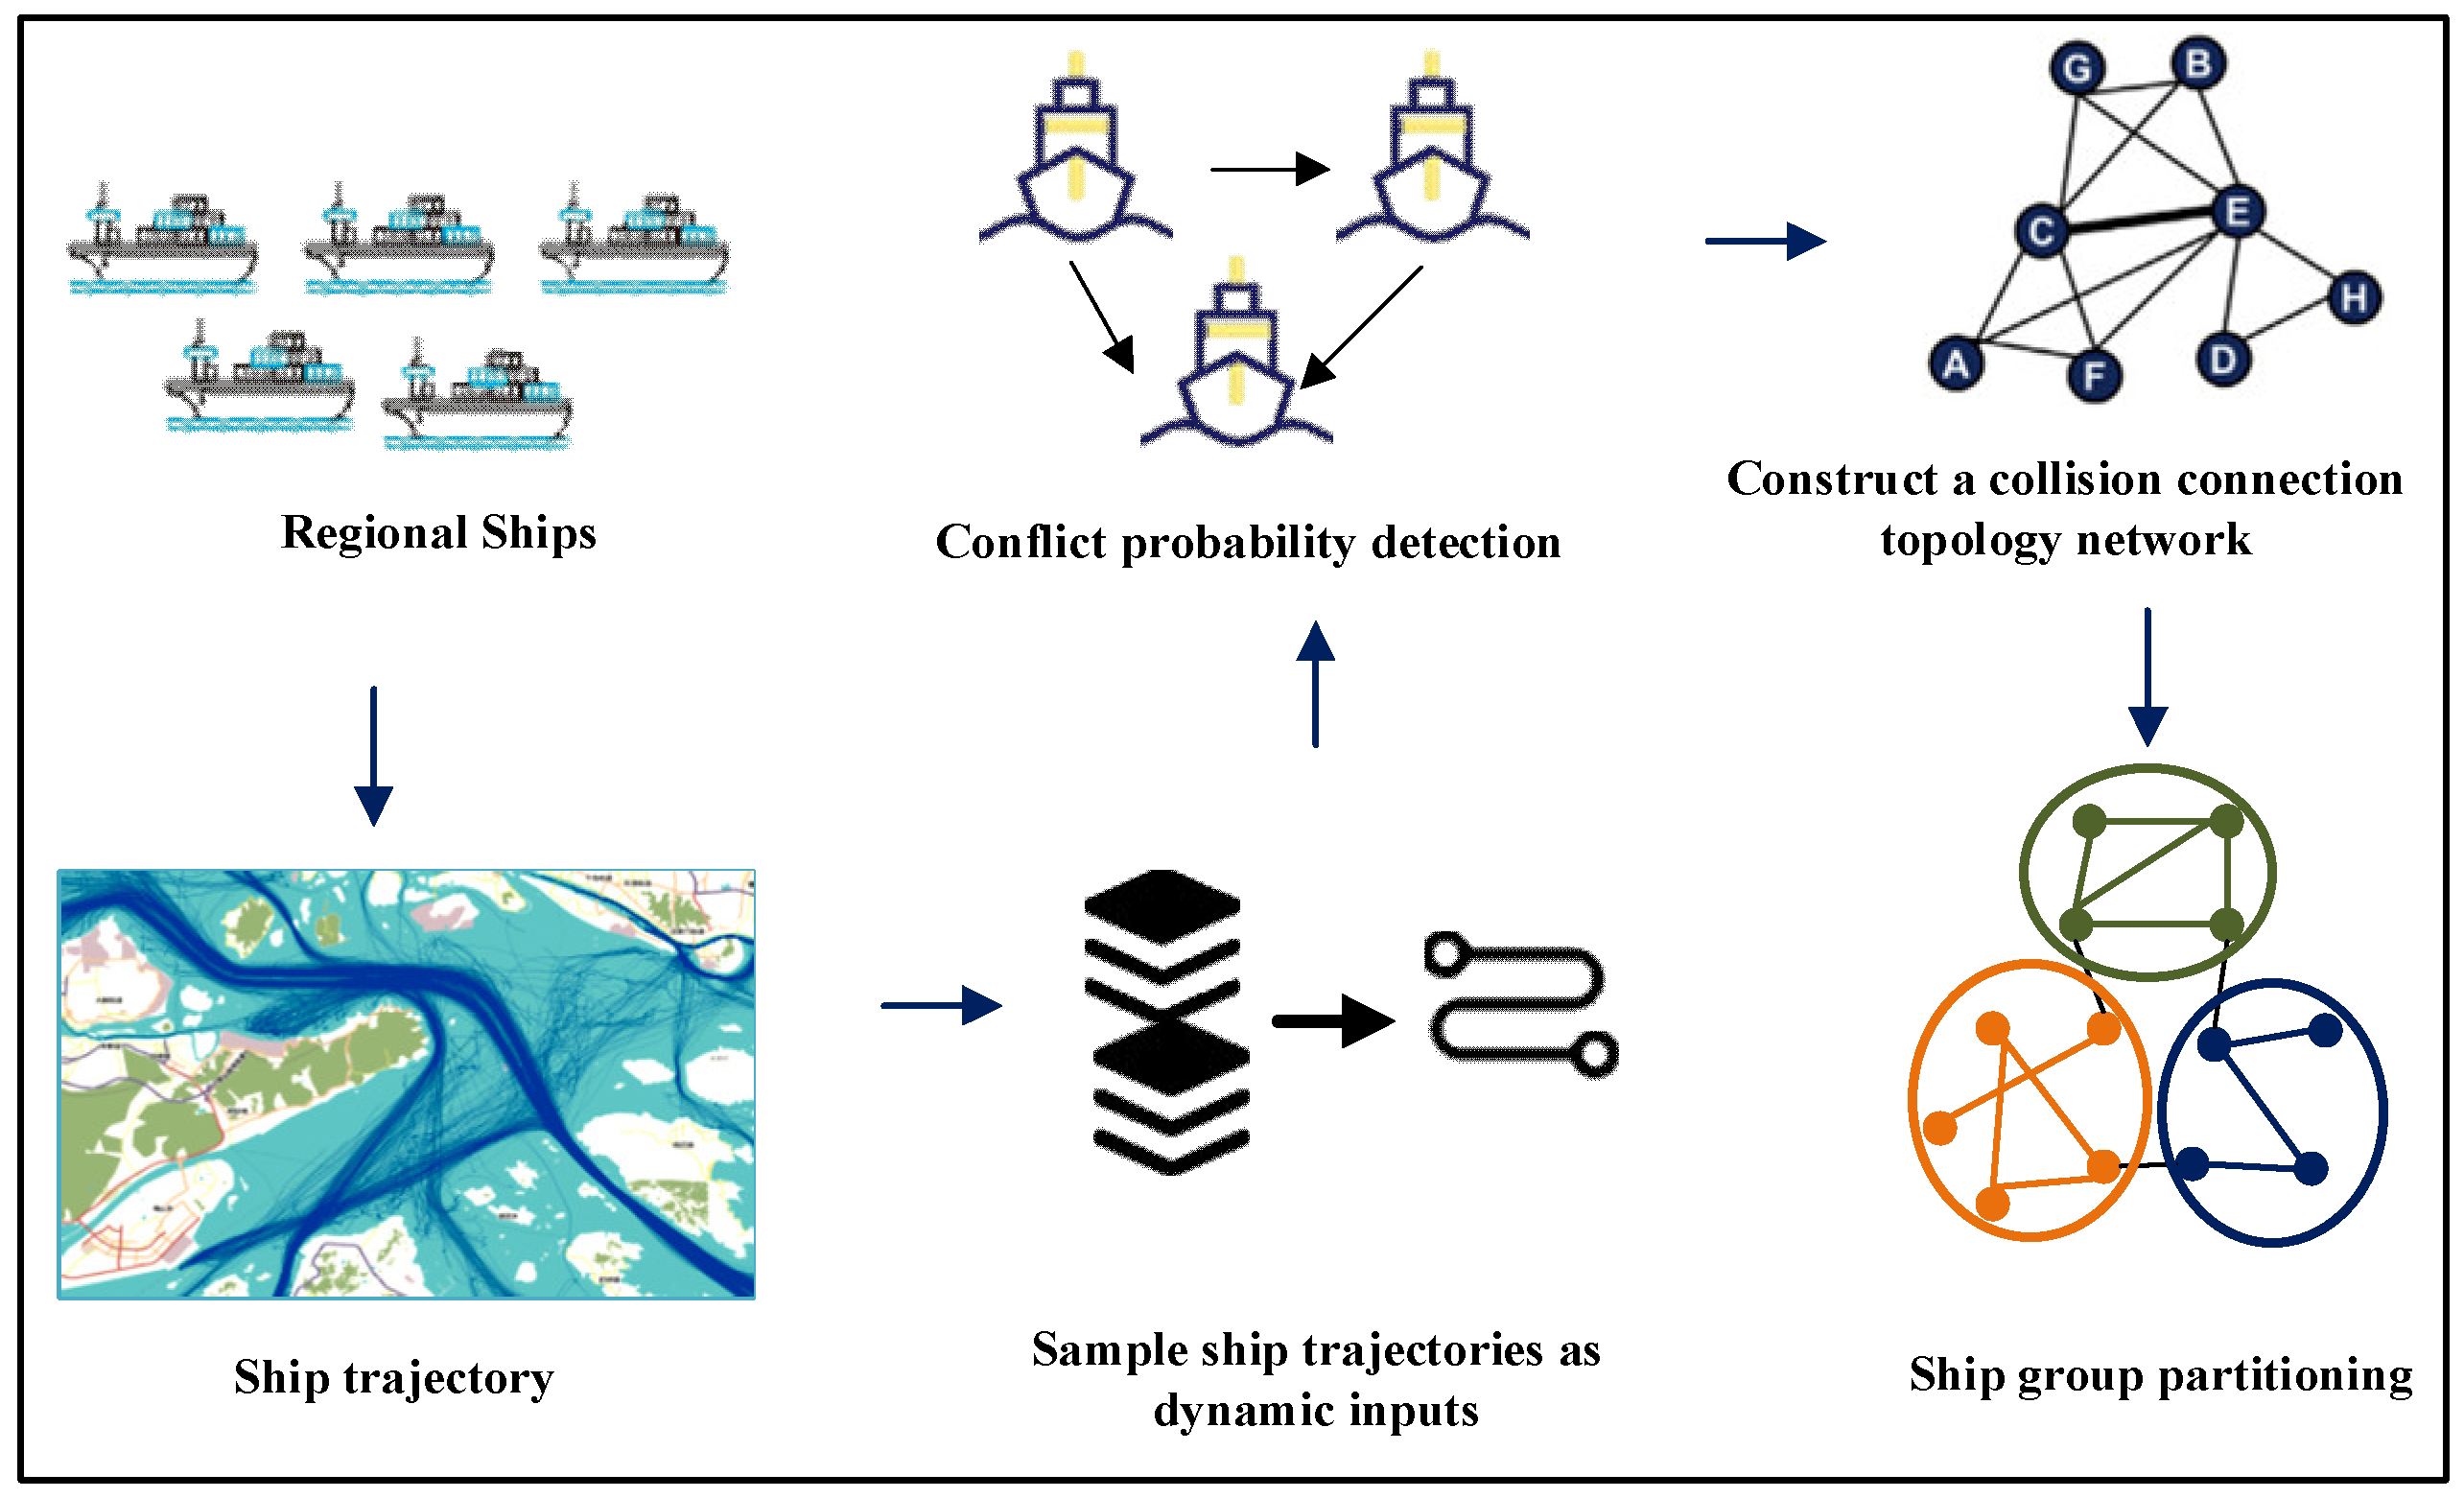
Figure 4.
FMOASC algorithm.

Figure 6.
Ship system diagram.
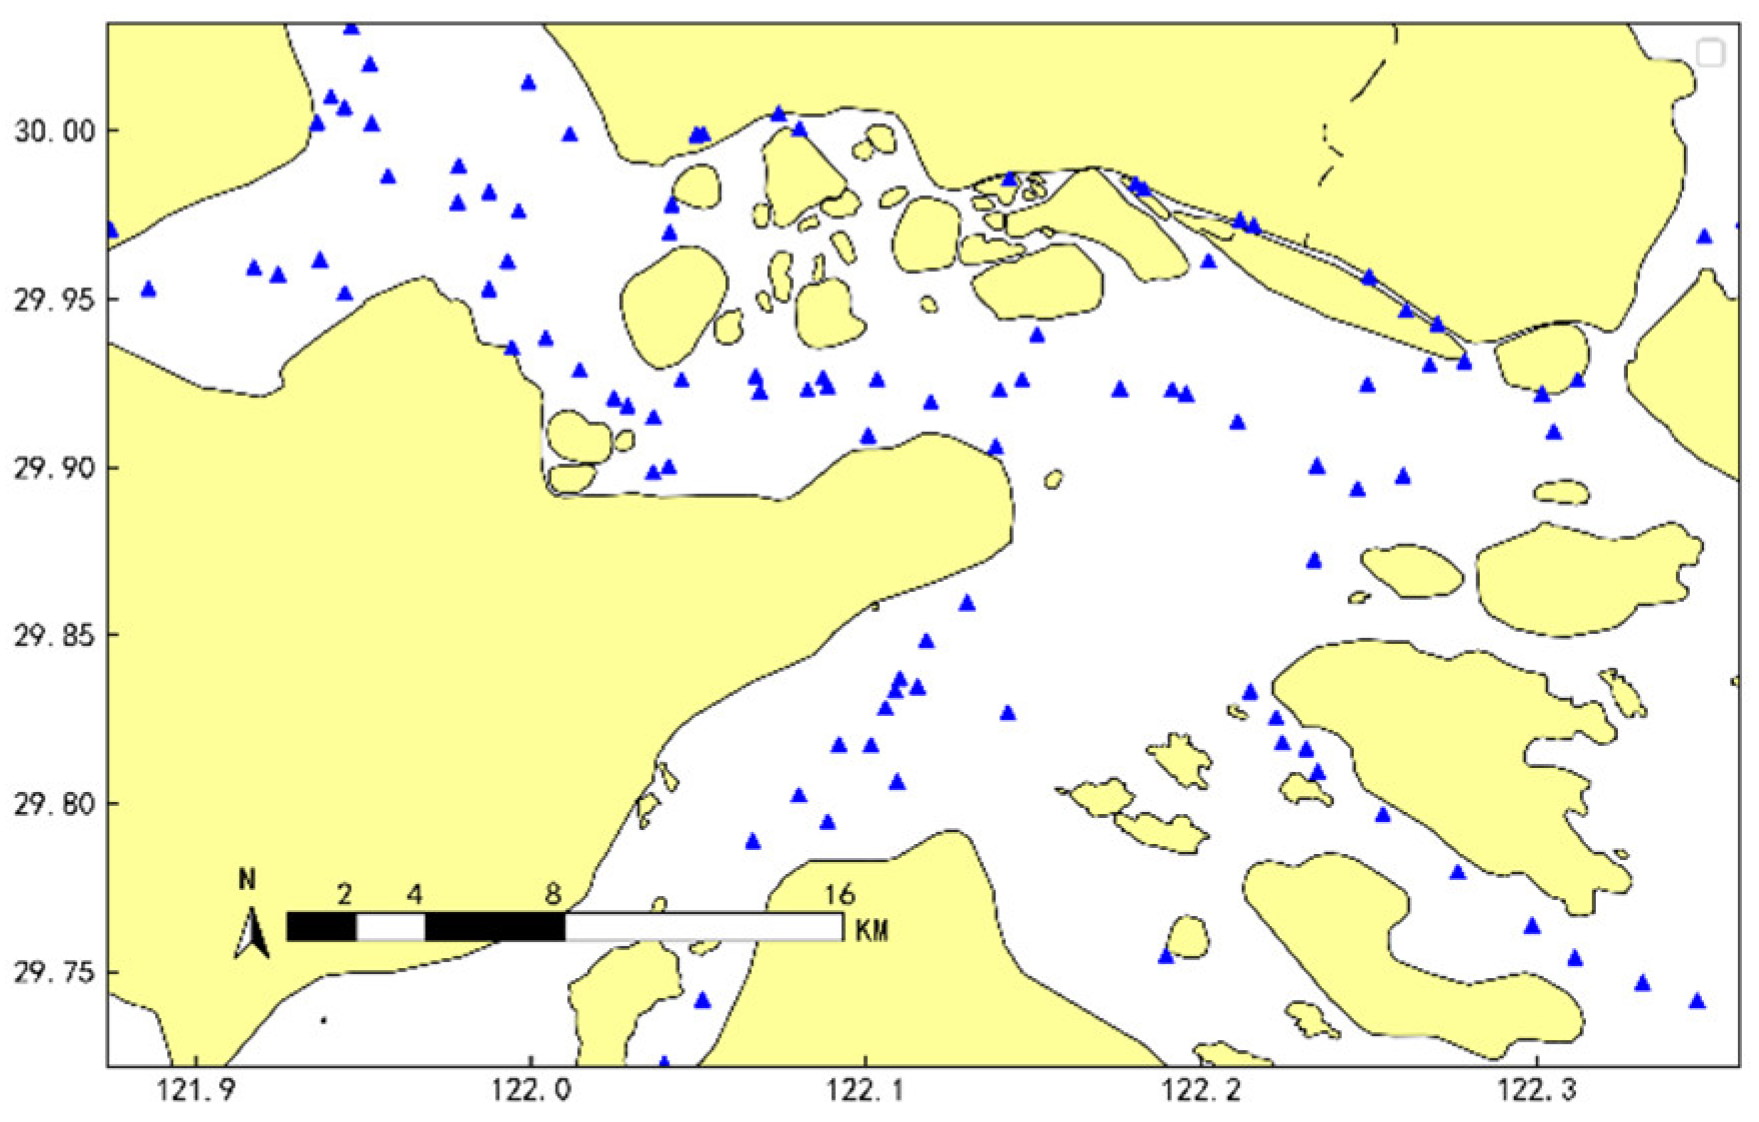
Figure 7.
Ship position distribution and conflict connection diagram: (a) Spatial position distribution and heading; (b) Ship conflict connection.
Figure 7.
Ship position distribution and conflict connection diagram: (a) Spatial position distribution and heading; (b) Ship conflict connection.
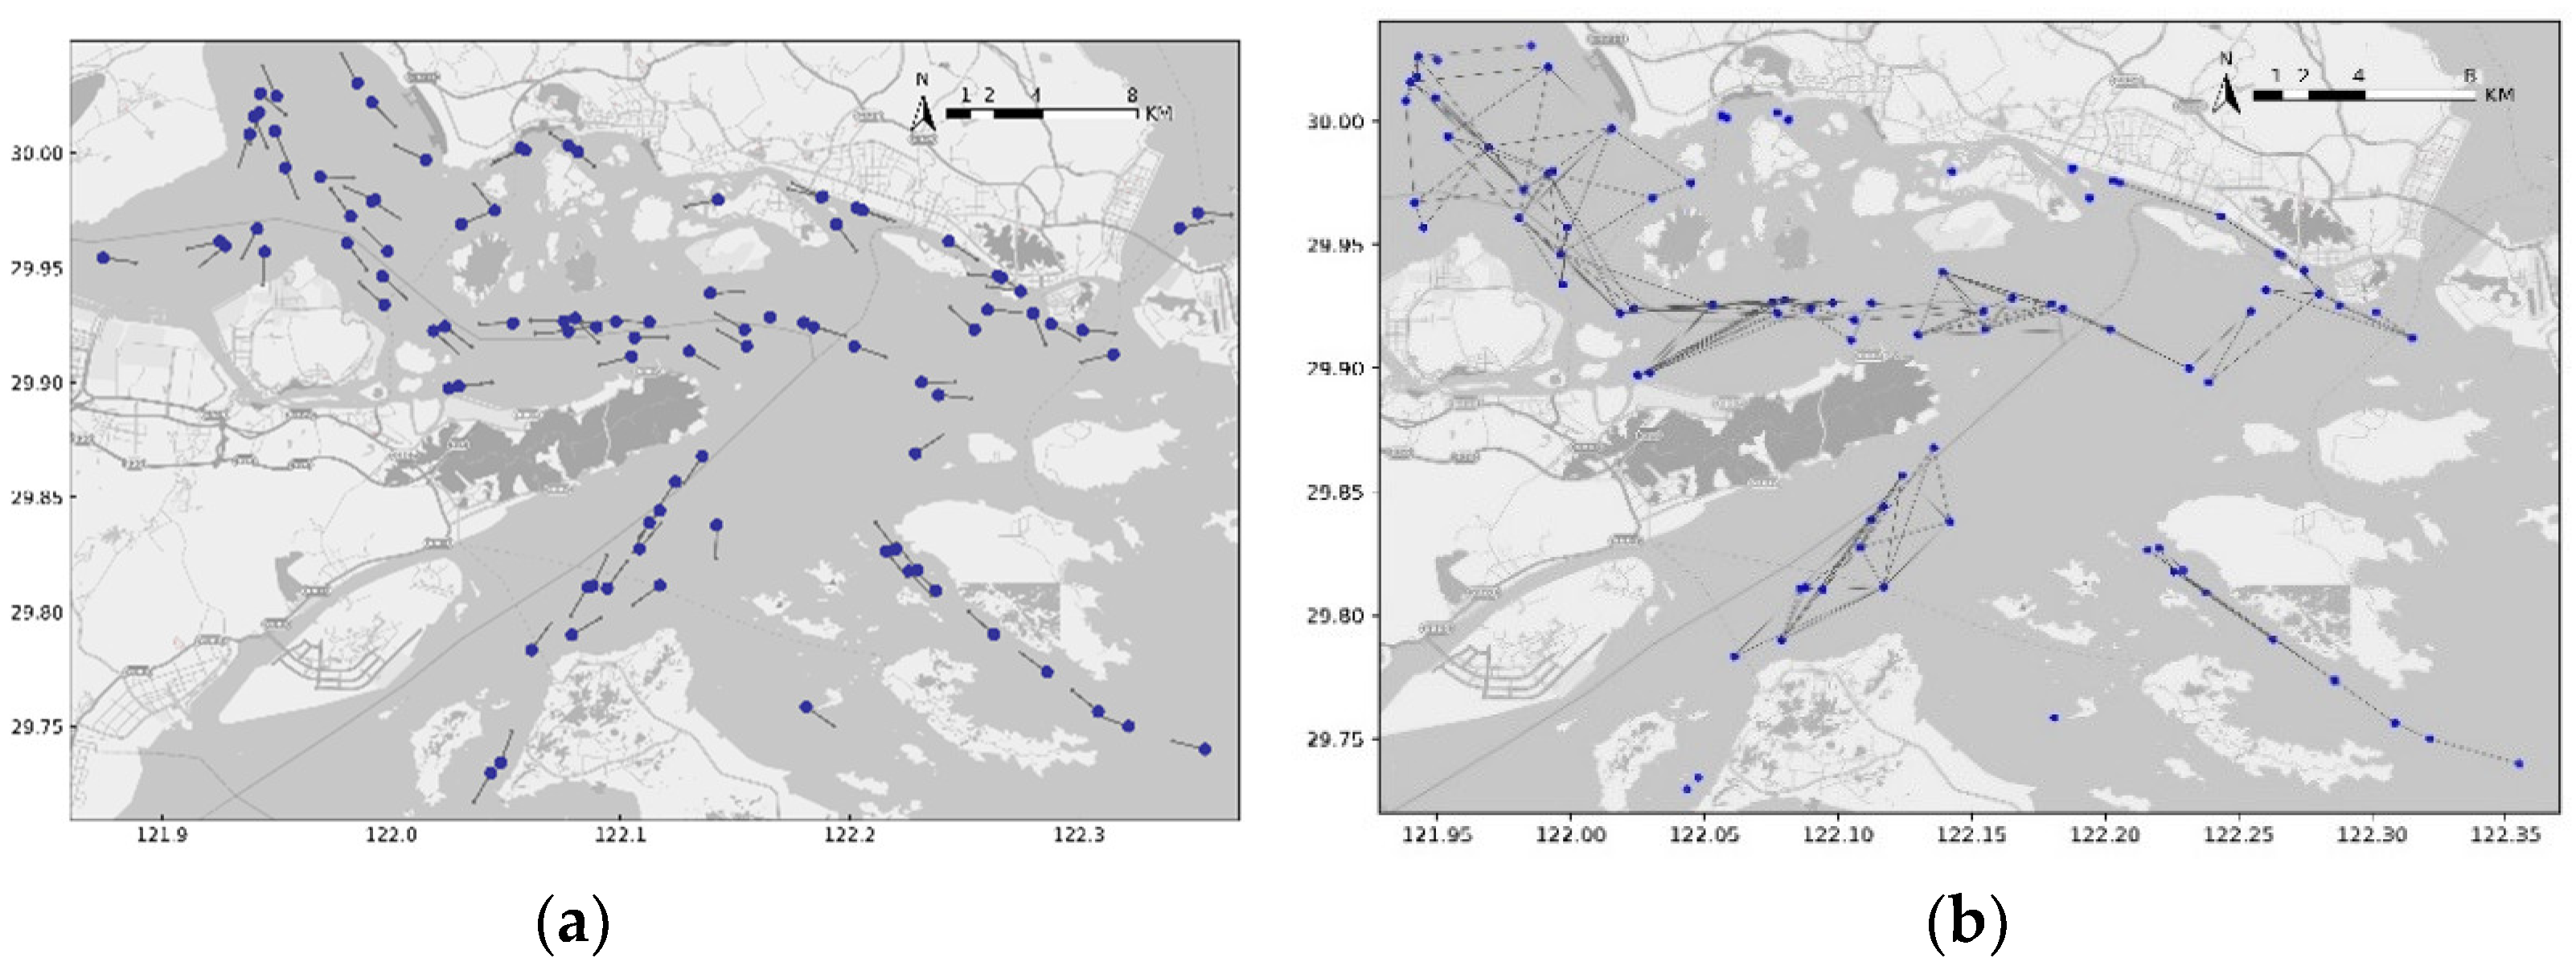
Figure 9.
Ningbo-Zhoushan Port, China.
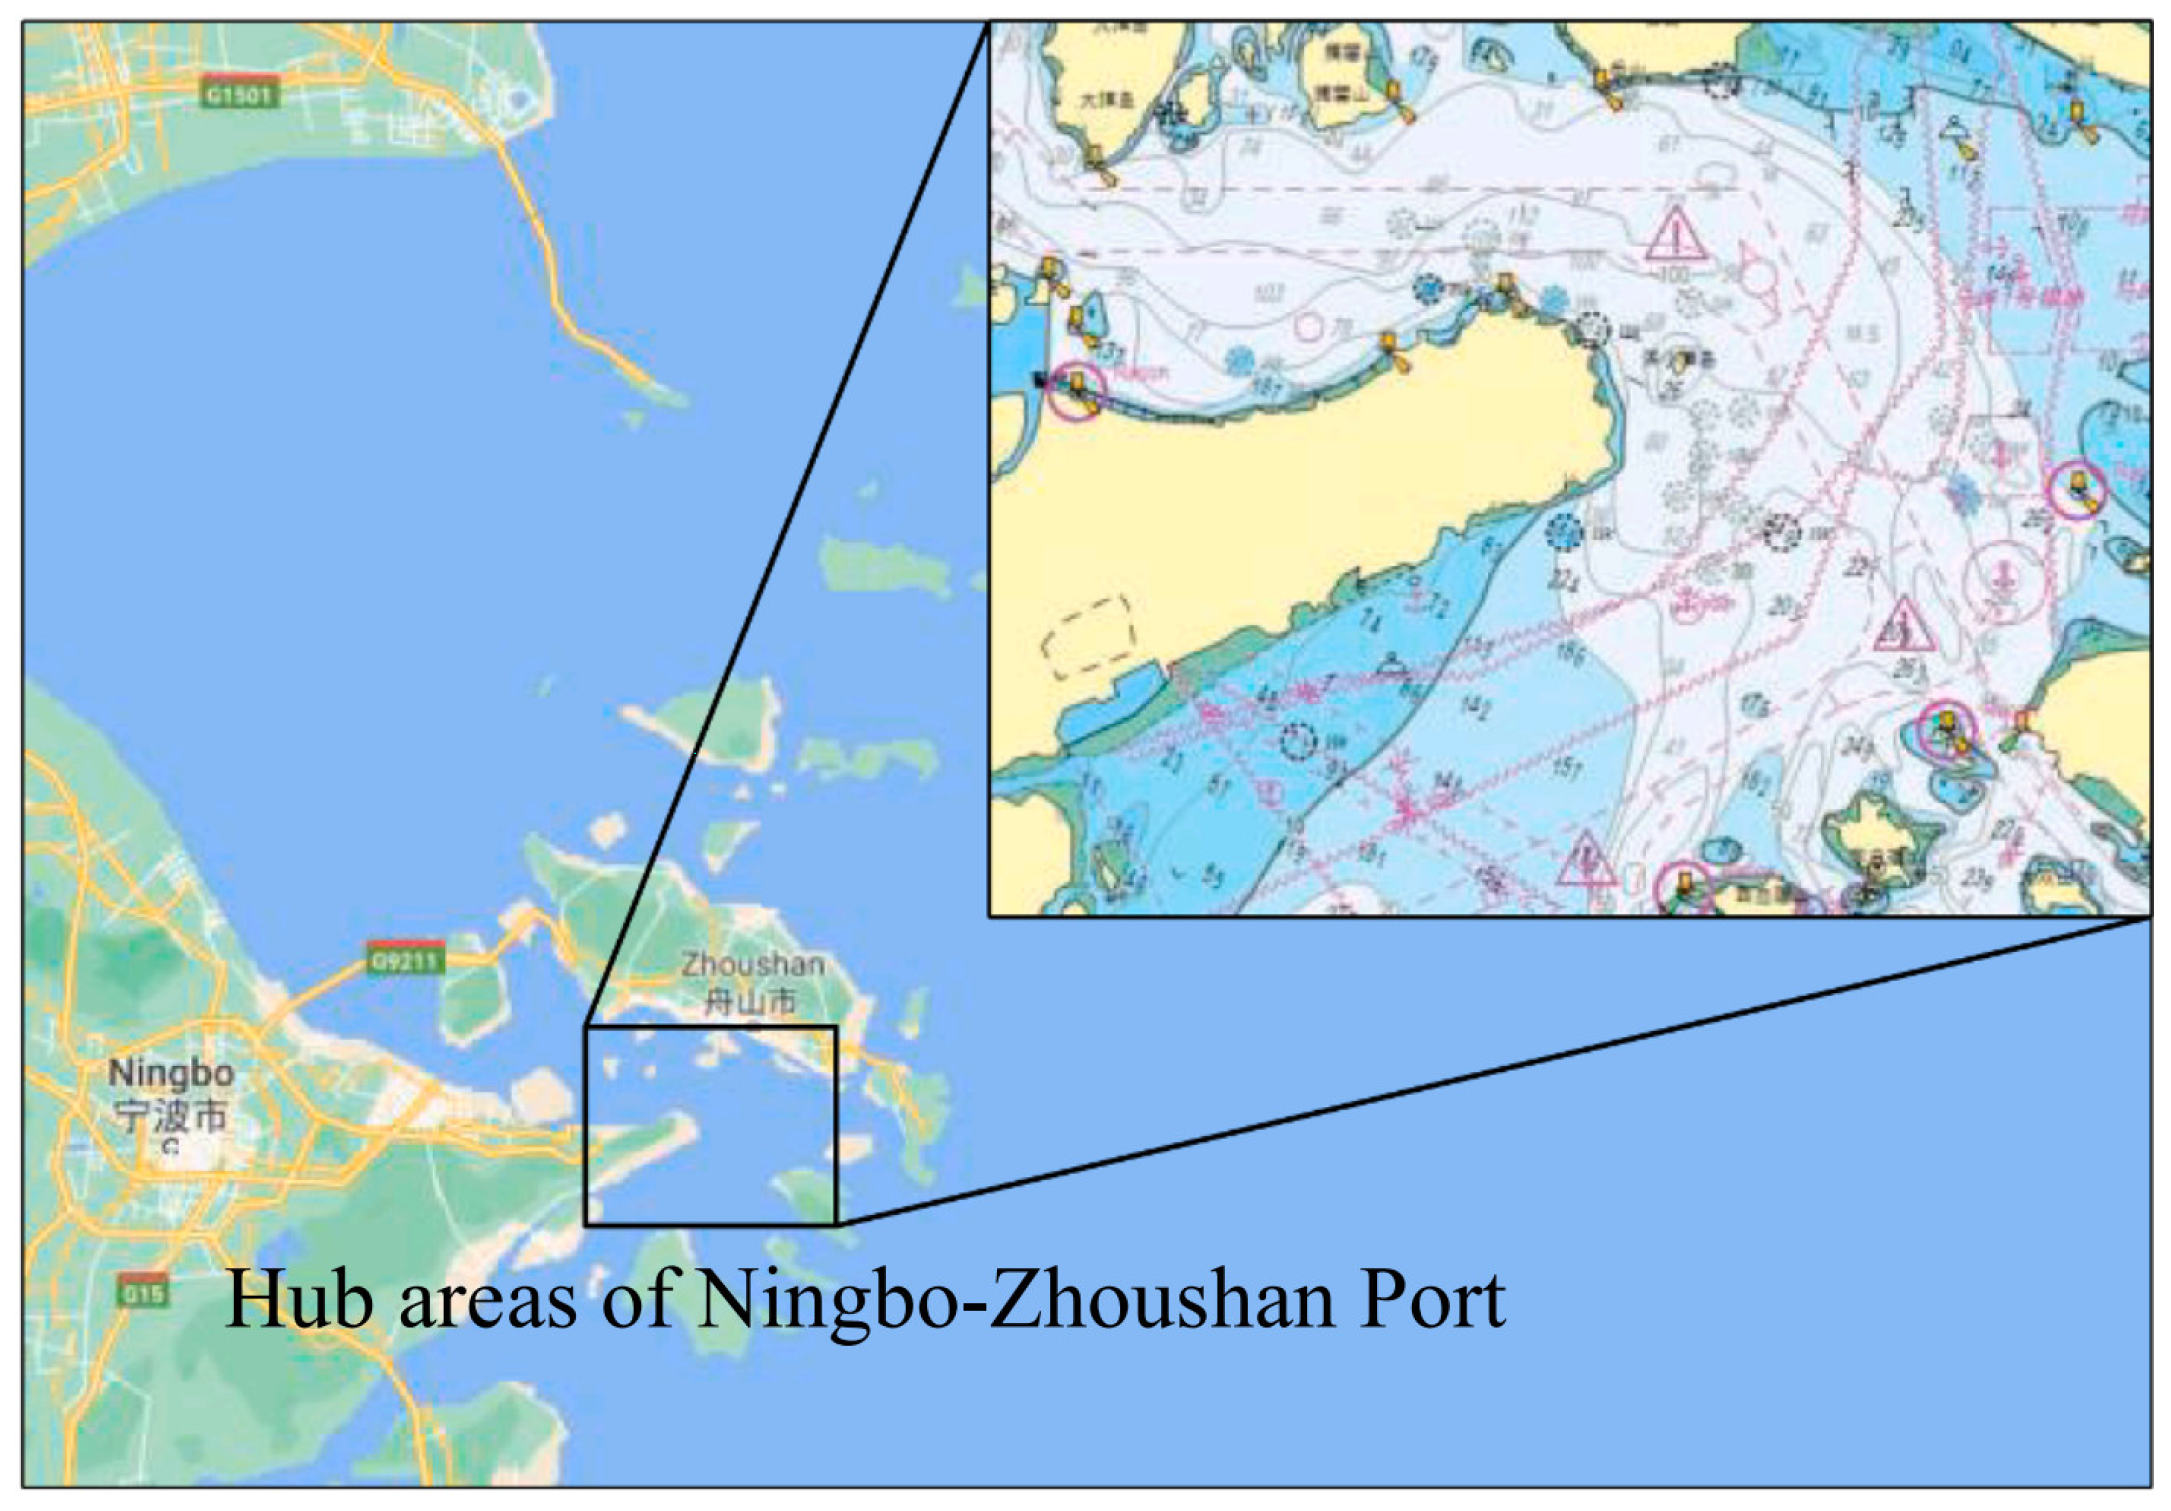
Figure 10.
Ship collision probability detection: (a) Ship trajectory; (b) DCPA/ Relative distance and conflict probability.
Figure 10.
Ship collision probability detection: (a) Ship trajectory; (b) DCPA/ Relative distance and conflict probability.
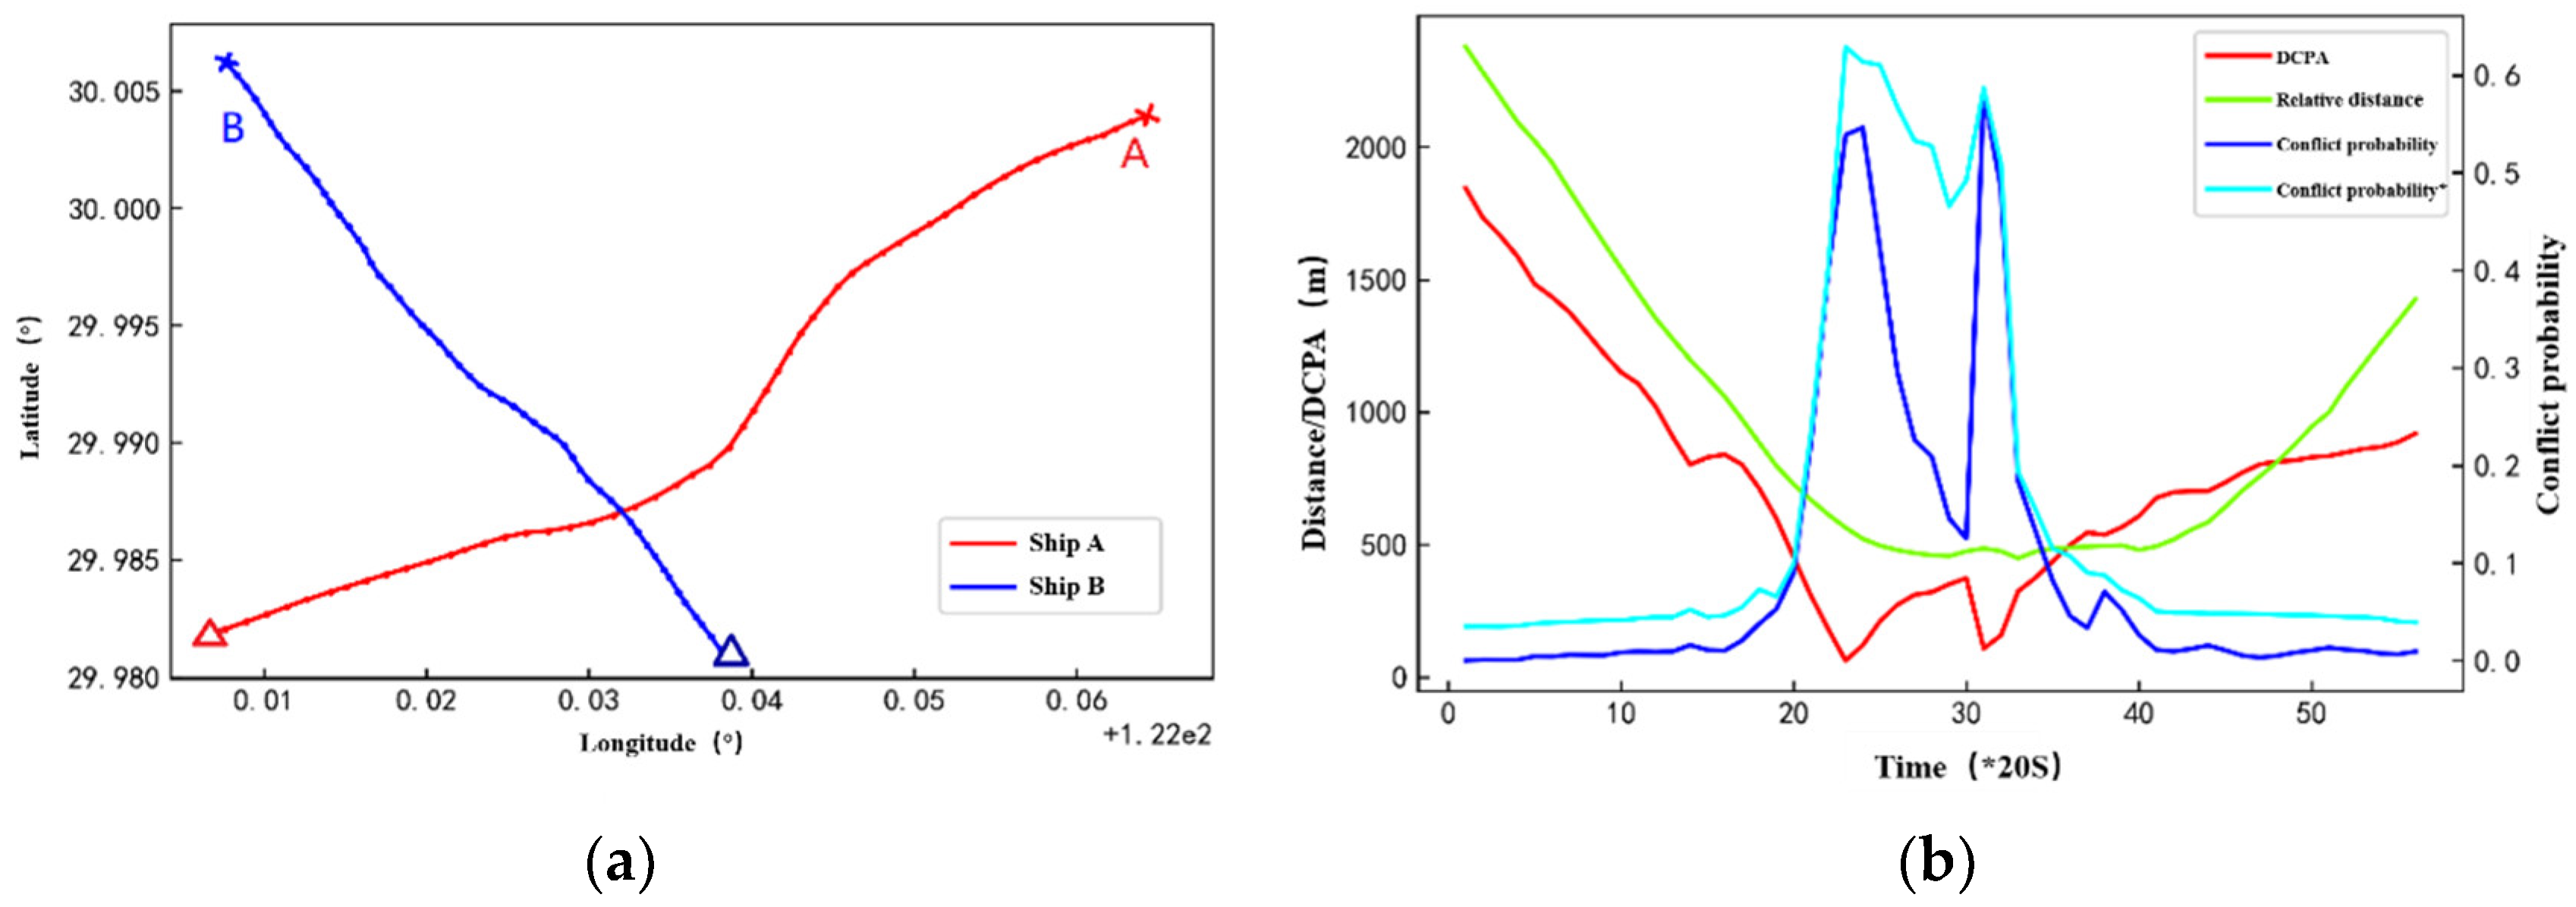
Figure 11.
Multi-ship collision probability detection: (a) Ship trajectory; (b) DCPA/ Relative distance and conflict probability.
Figure 11.
Multi-ship collision probability detection: (a) Ship trajectory; (b) DCPA/ Relative distance and conflict probability.
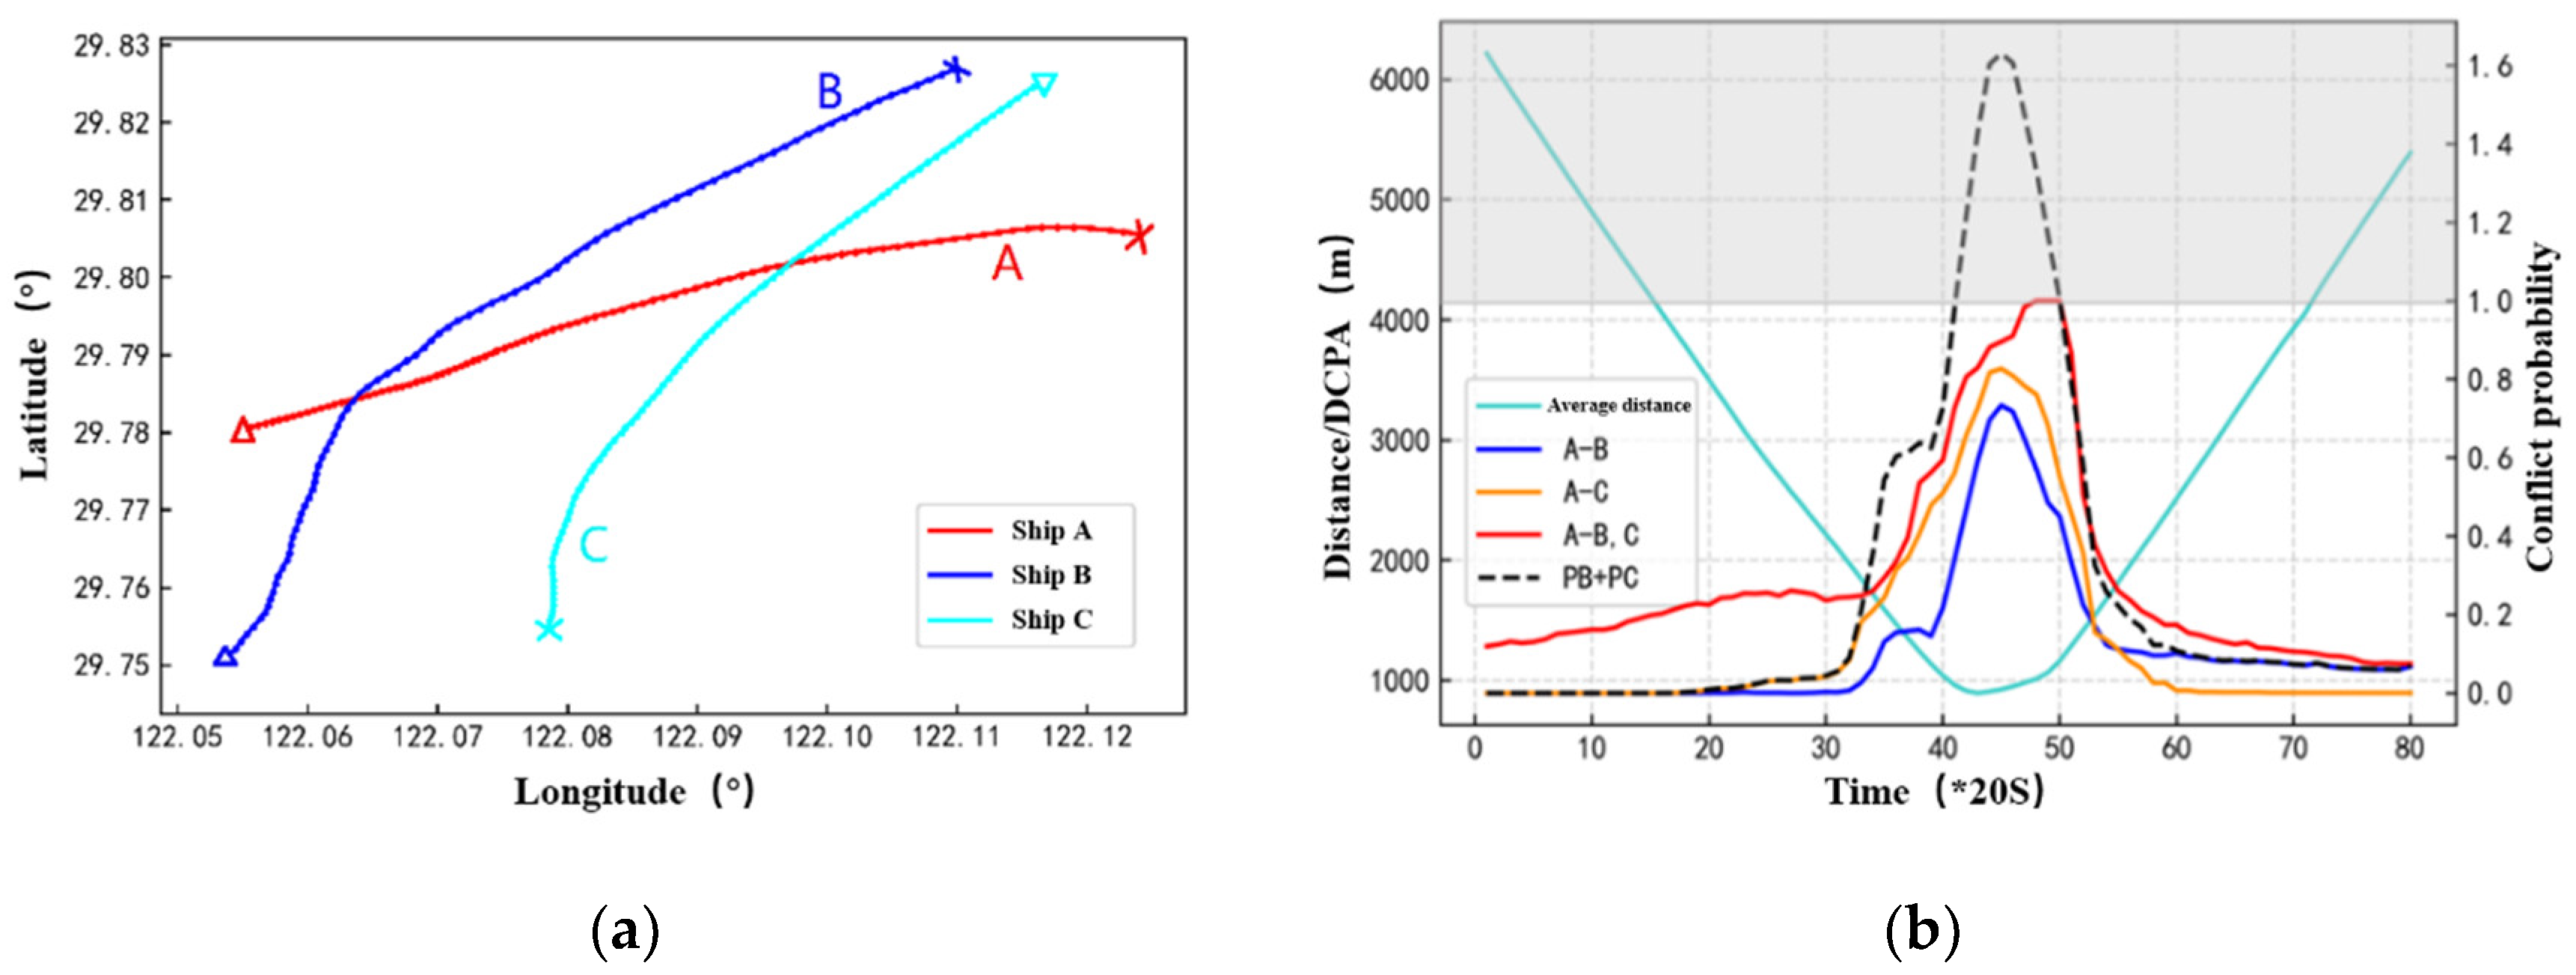
Figure 12.
Spatial distribution of ships at a certain time.
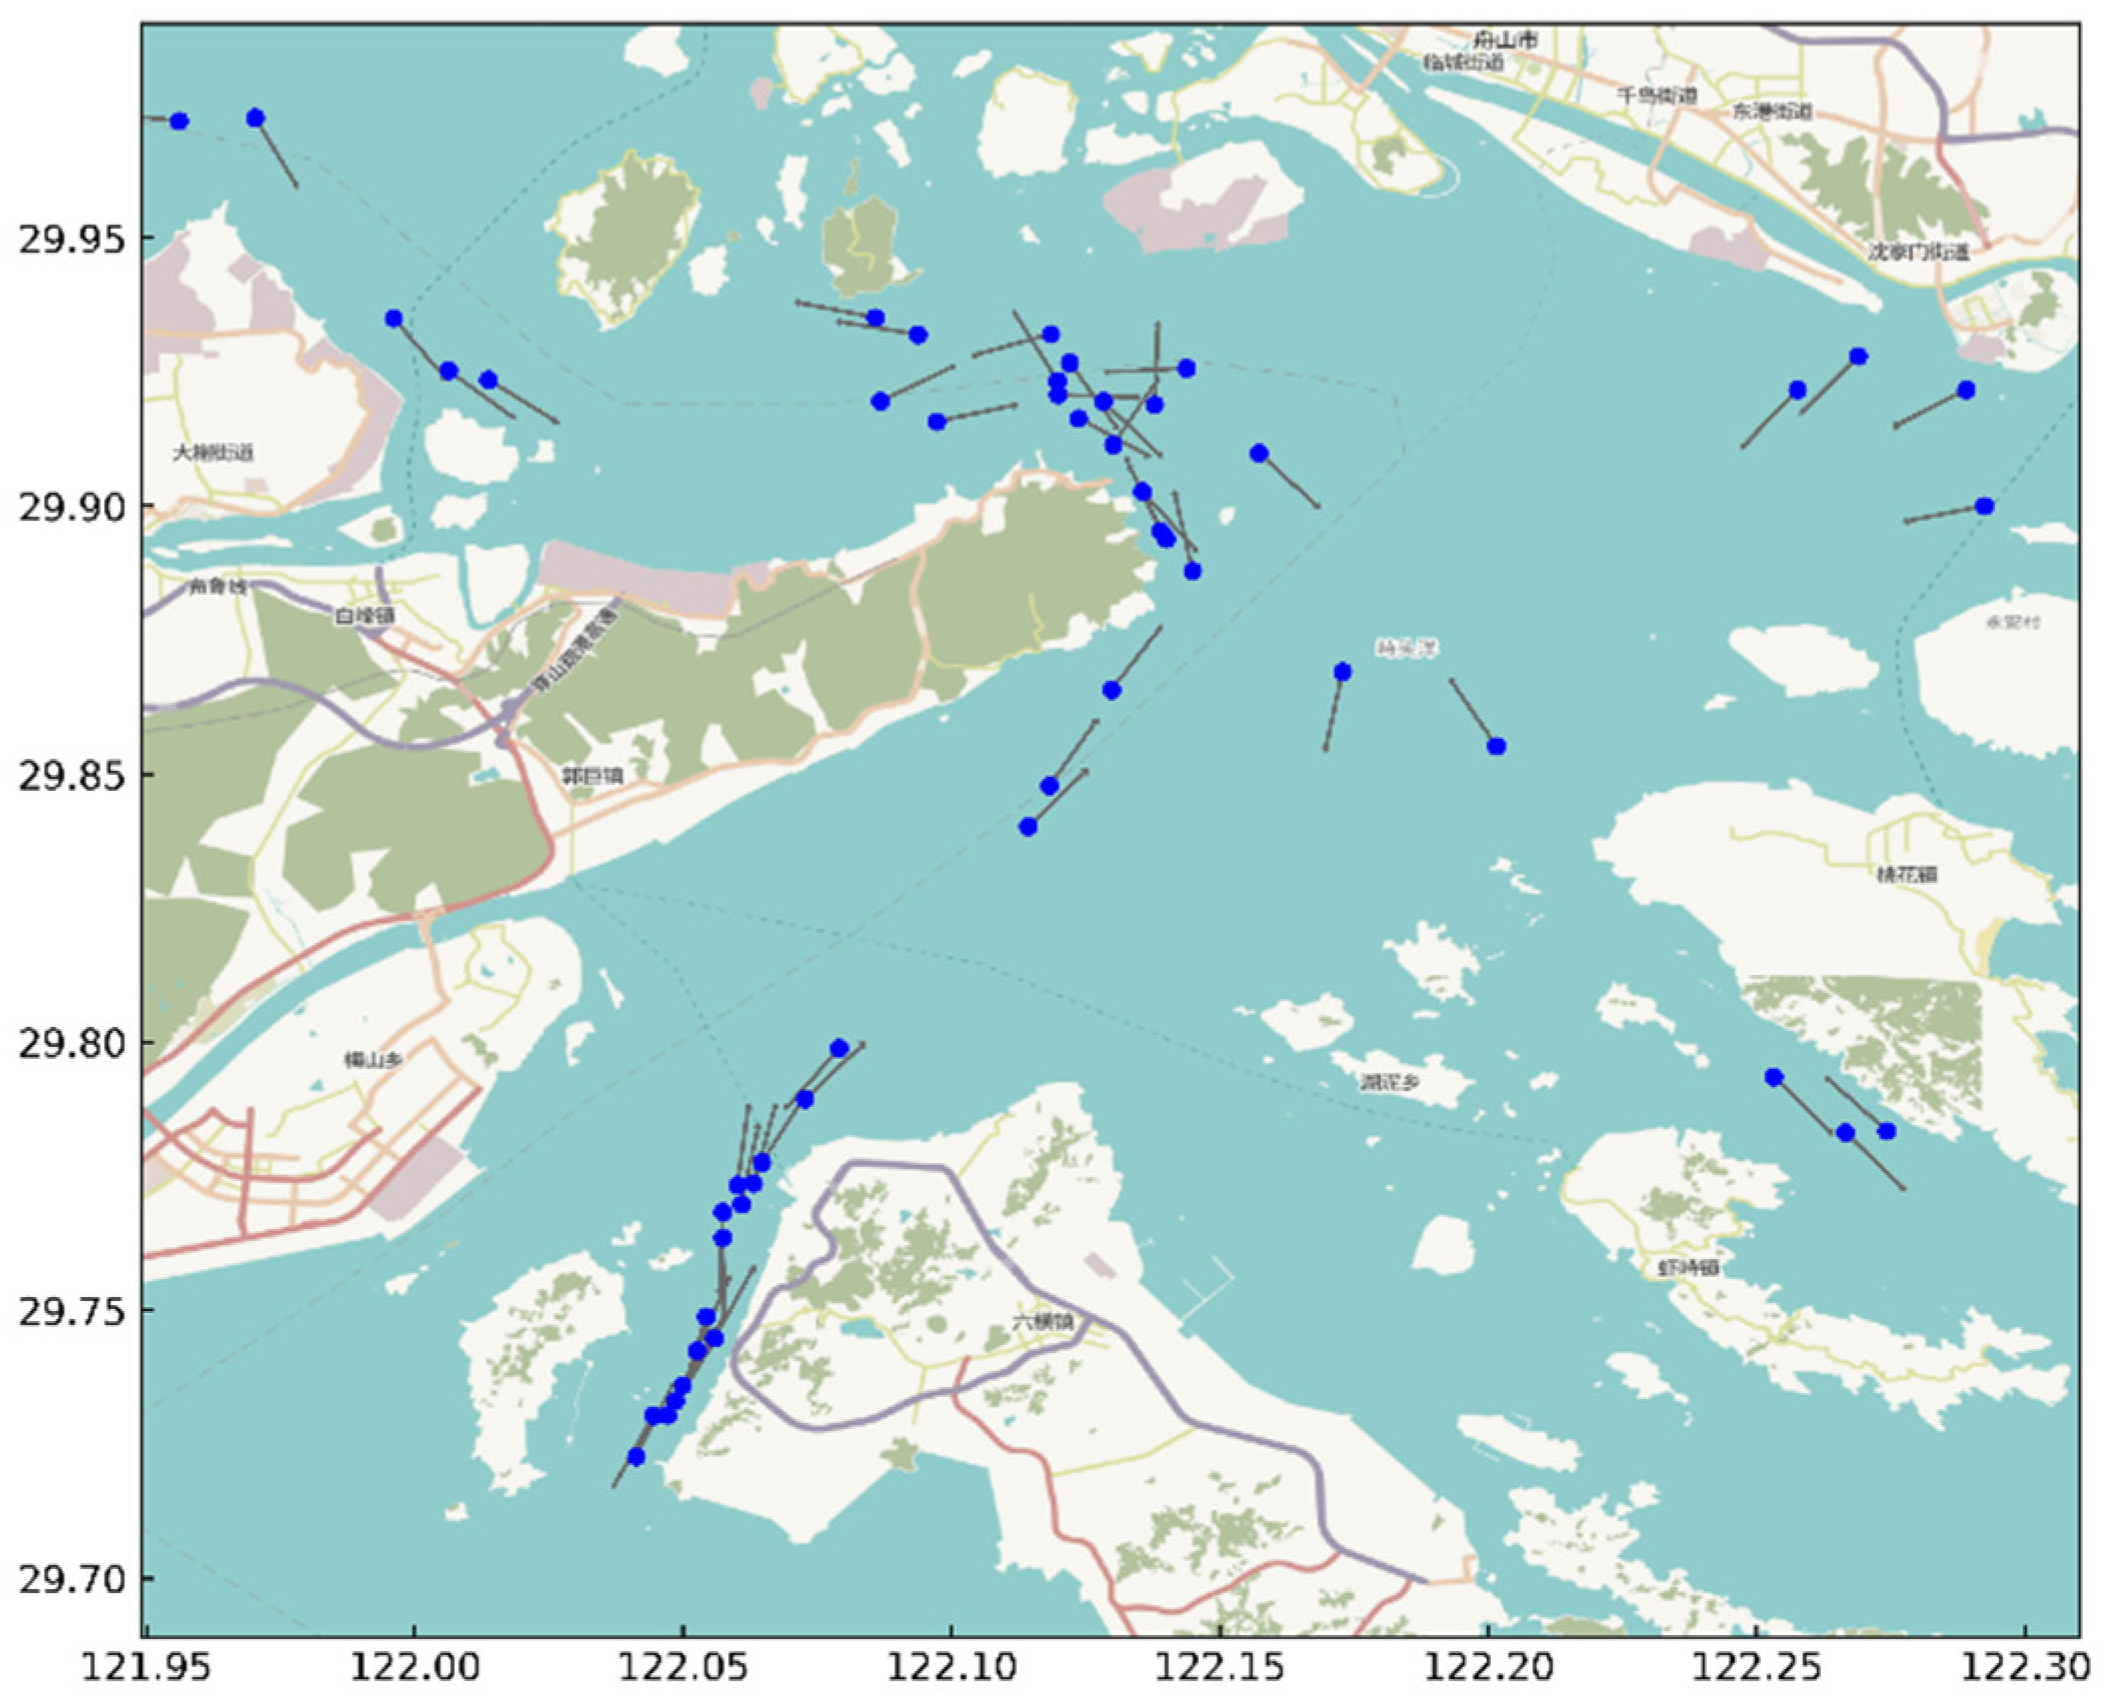
Figure 13.
Comparison of experimental results: (a) Modularity; (b) Number of noise points.
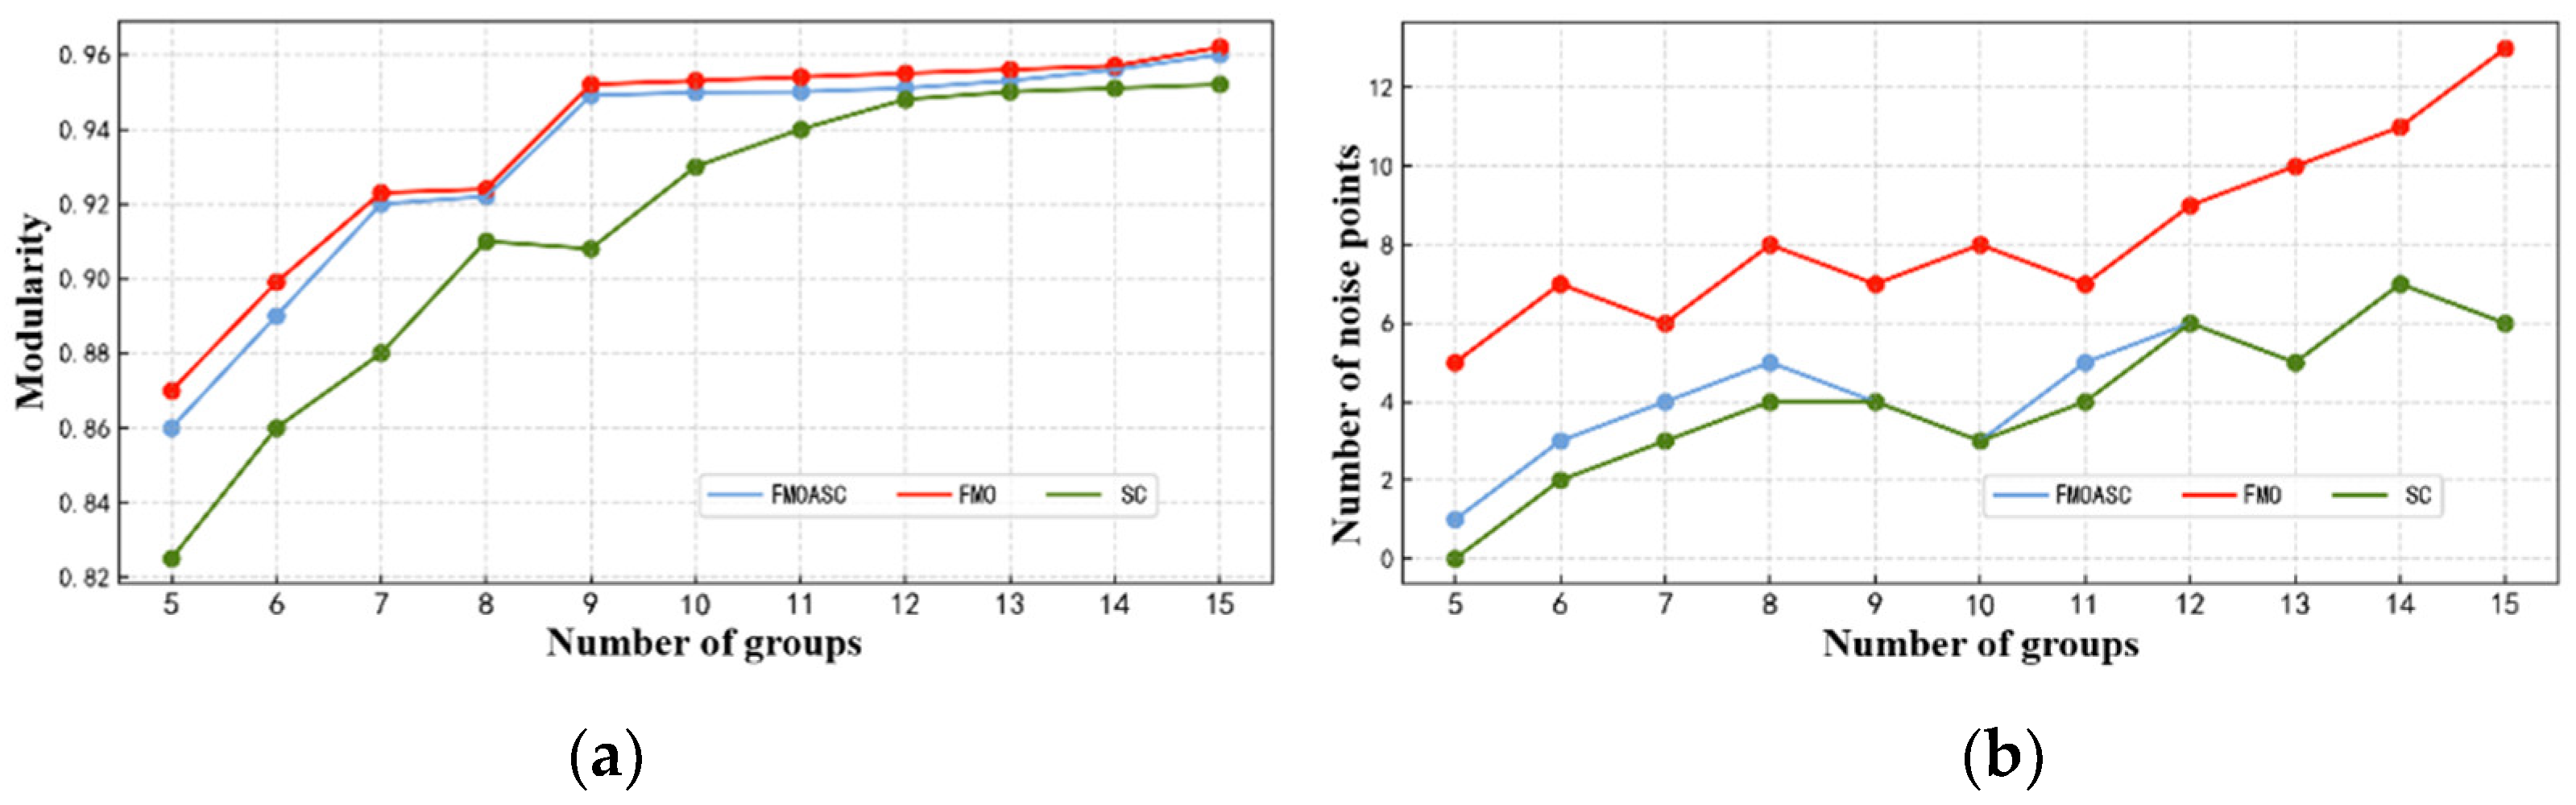
Figure 14.
Ship group division comprehensive evaluation index.
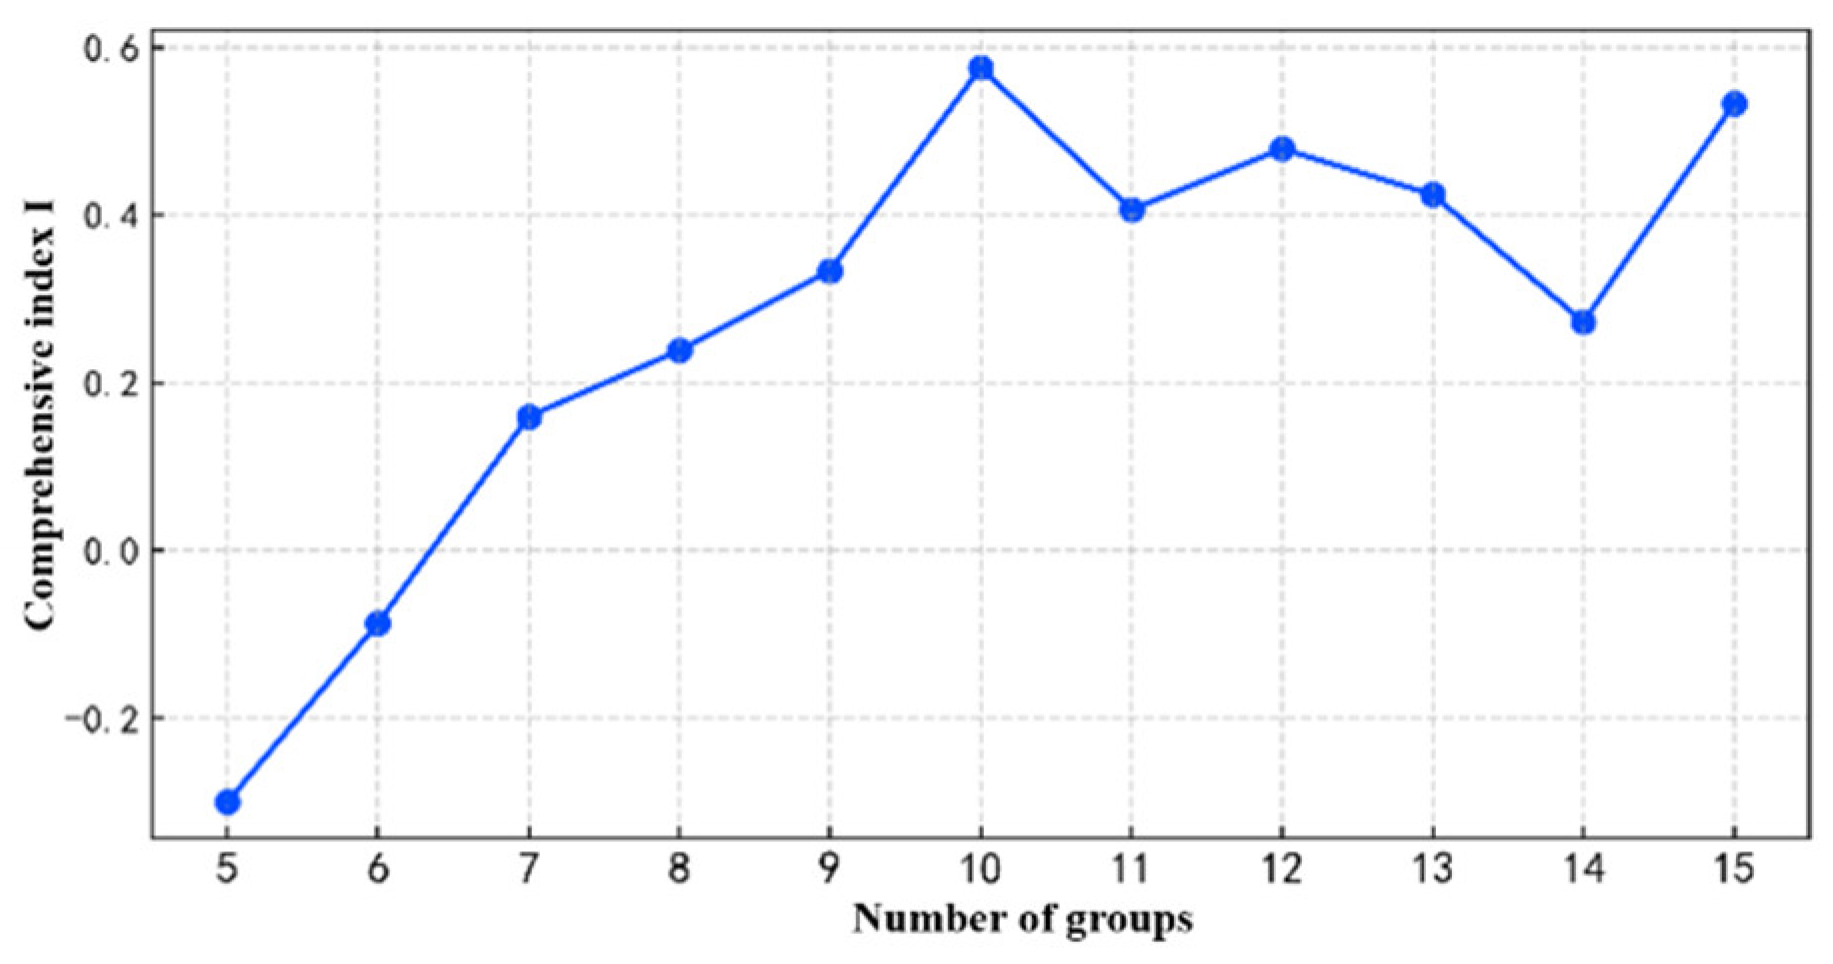
Figure 15.
Results of ship group division based on three algorithms: (a) Spatial distribution of ships; (b) FMO algorithm group partitioning; (c) SC algorithm group partitioning; (d) FMOASC algorithm group partitioning.
Figure 15.
Results of ship group division based on three algorithms: (a) Spatial distribution of ships; (b) FMO algorithm group partitioning; (c) SC algorithm group partitioning; (d) FMOASC algorithm group partitioning.
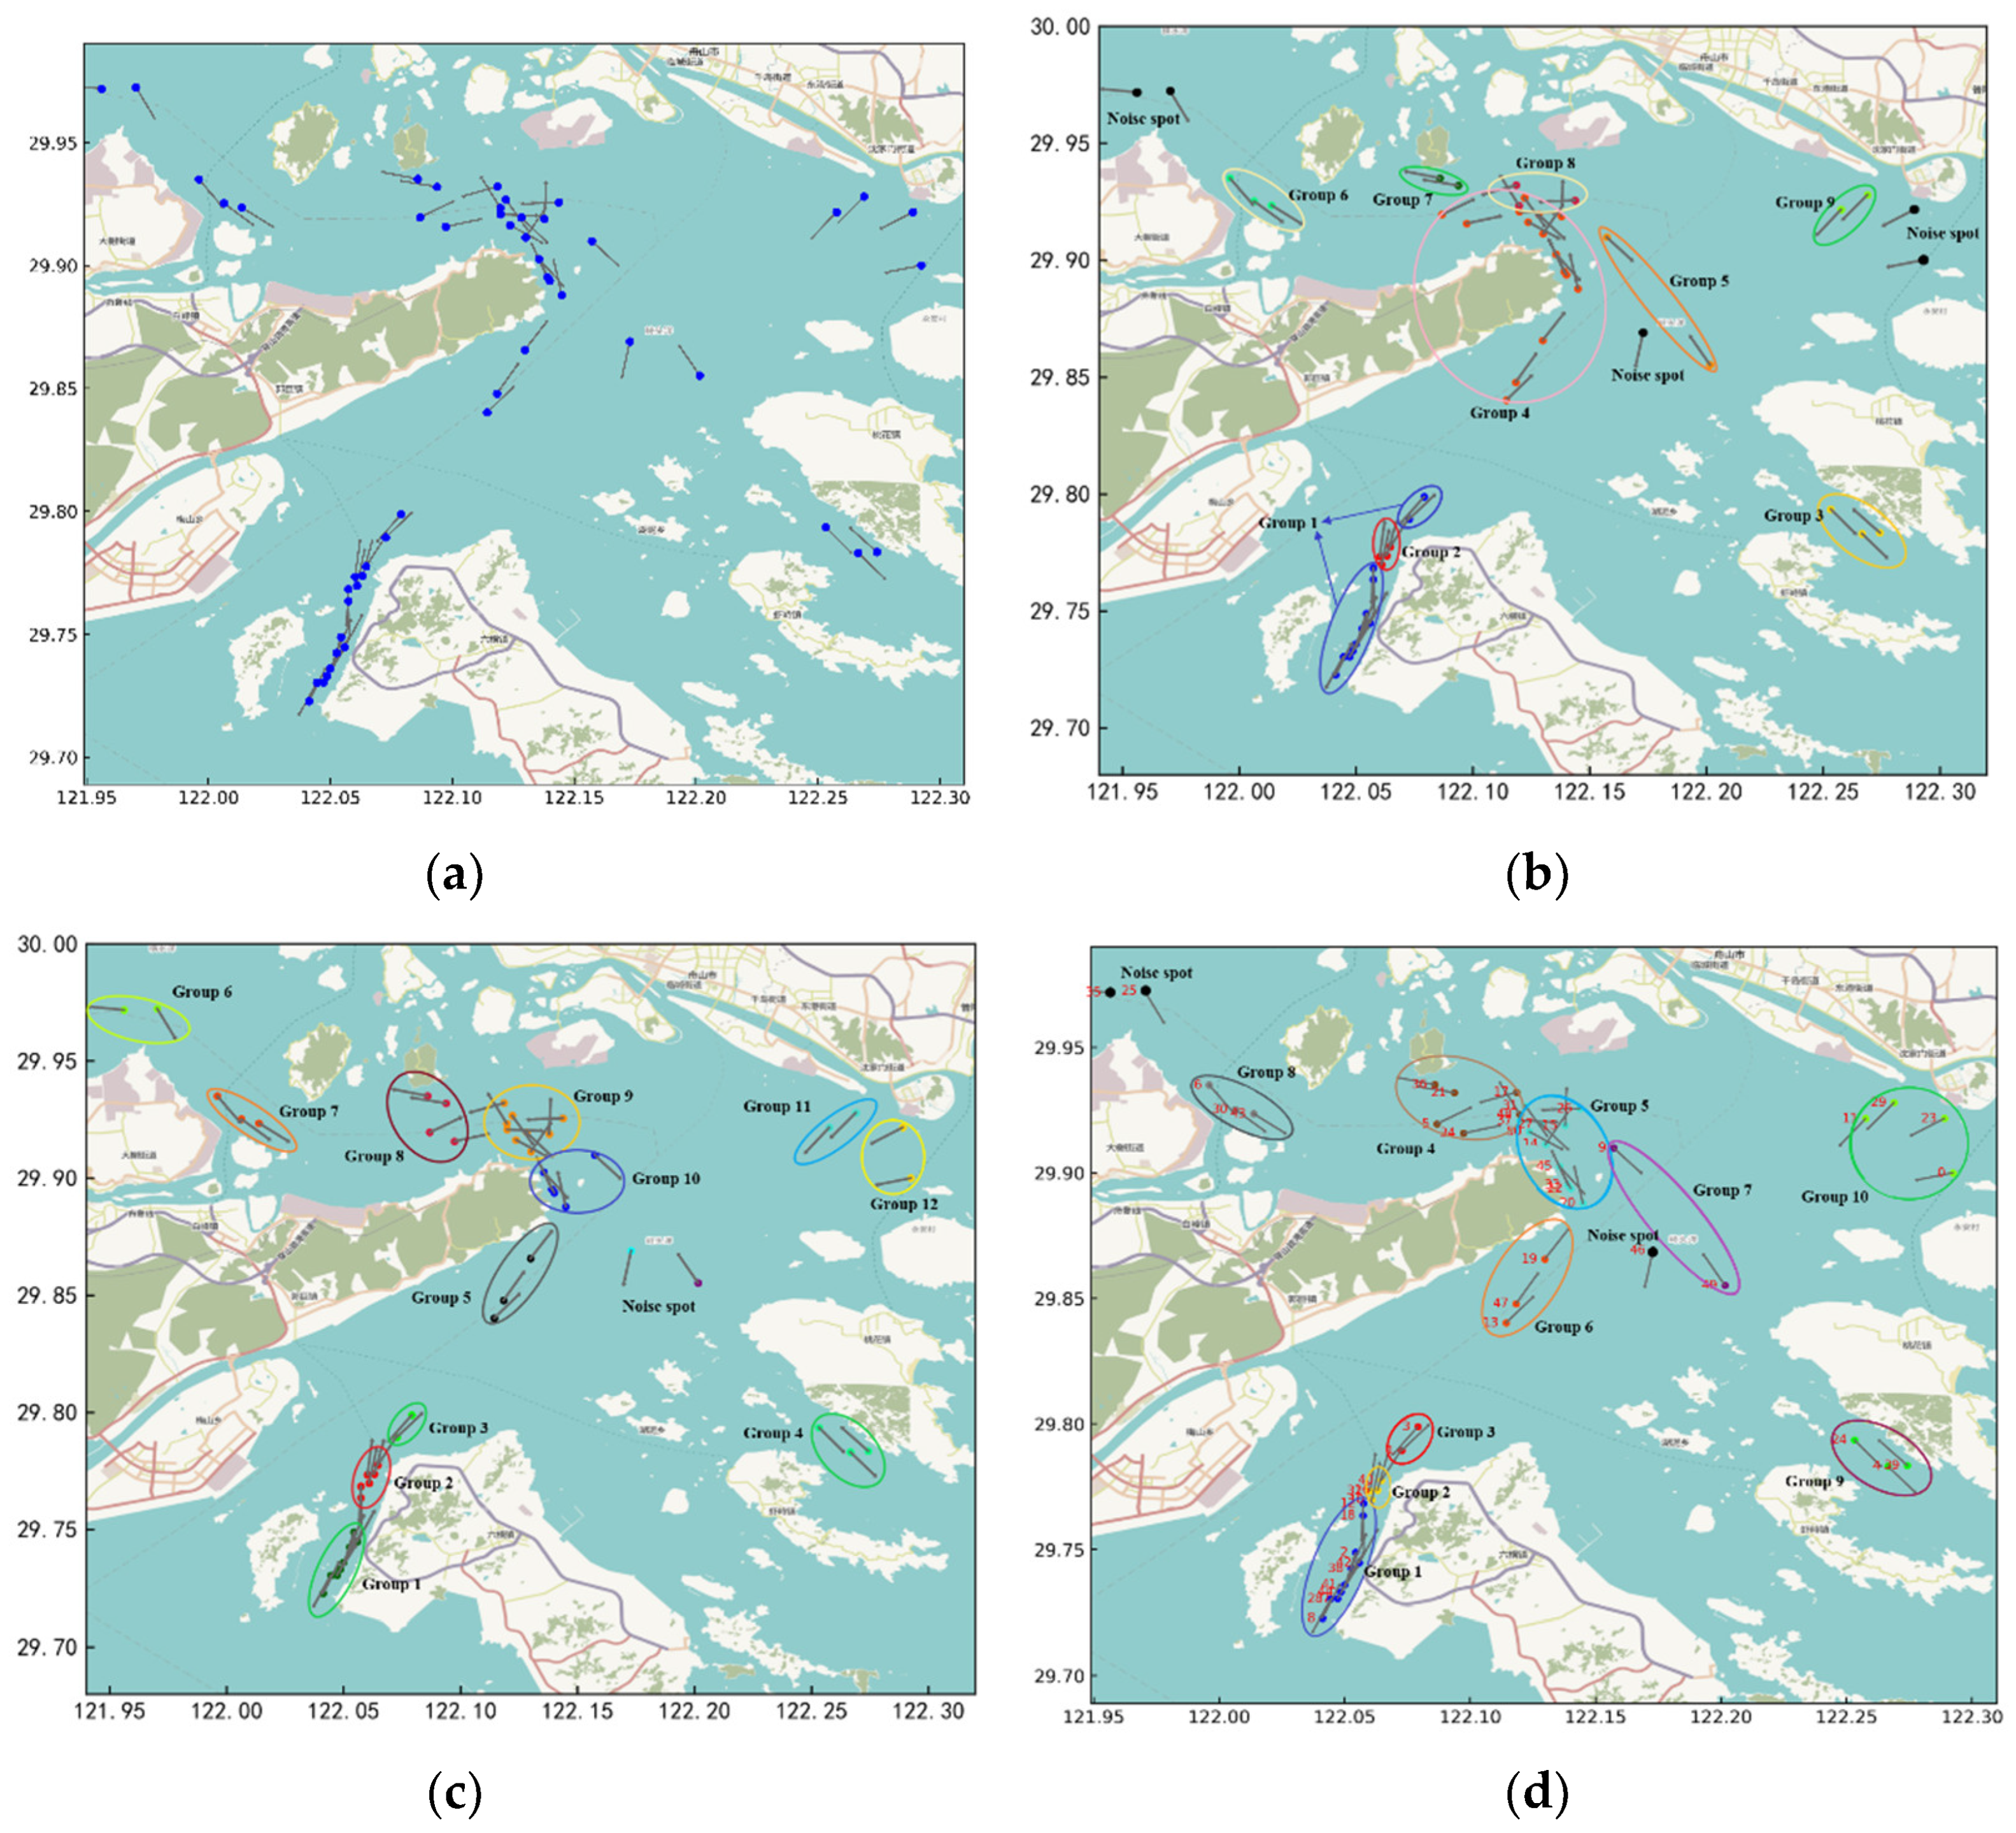
Figure 16.
Hourly conflict distribution visualization.
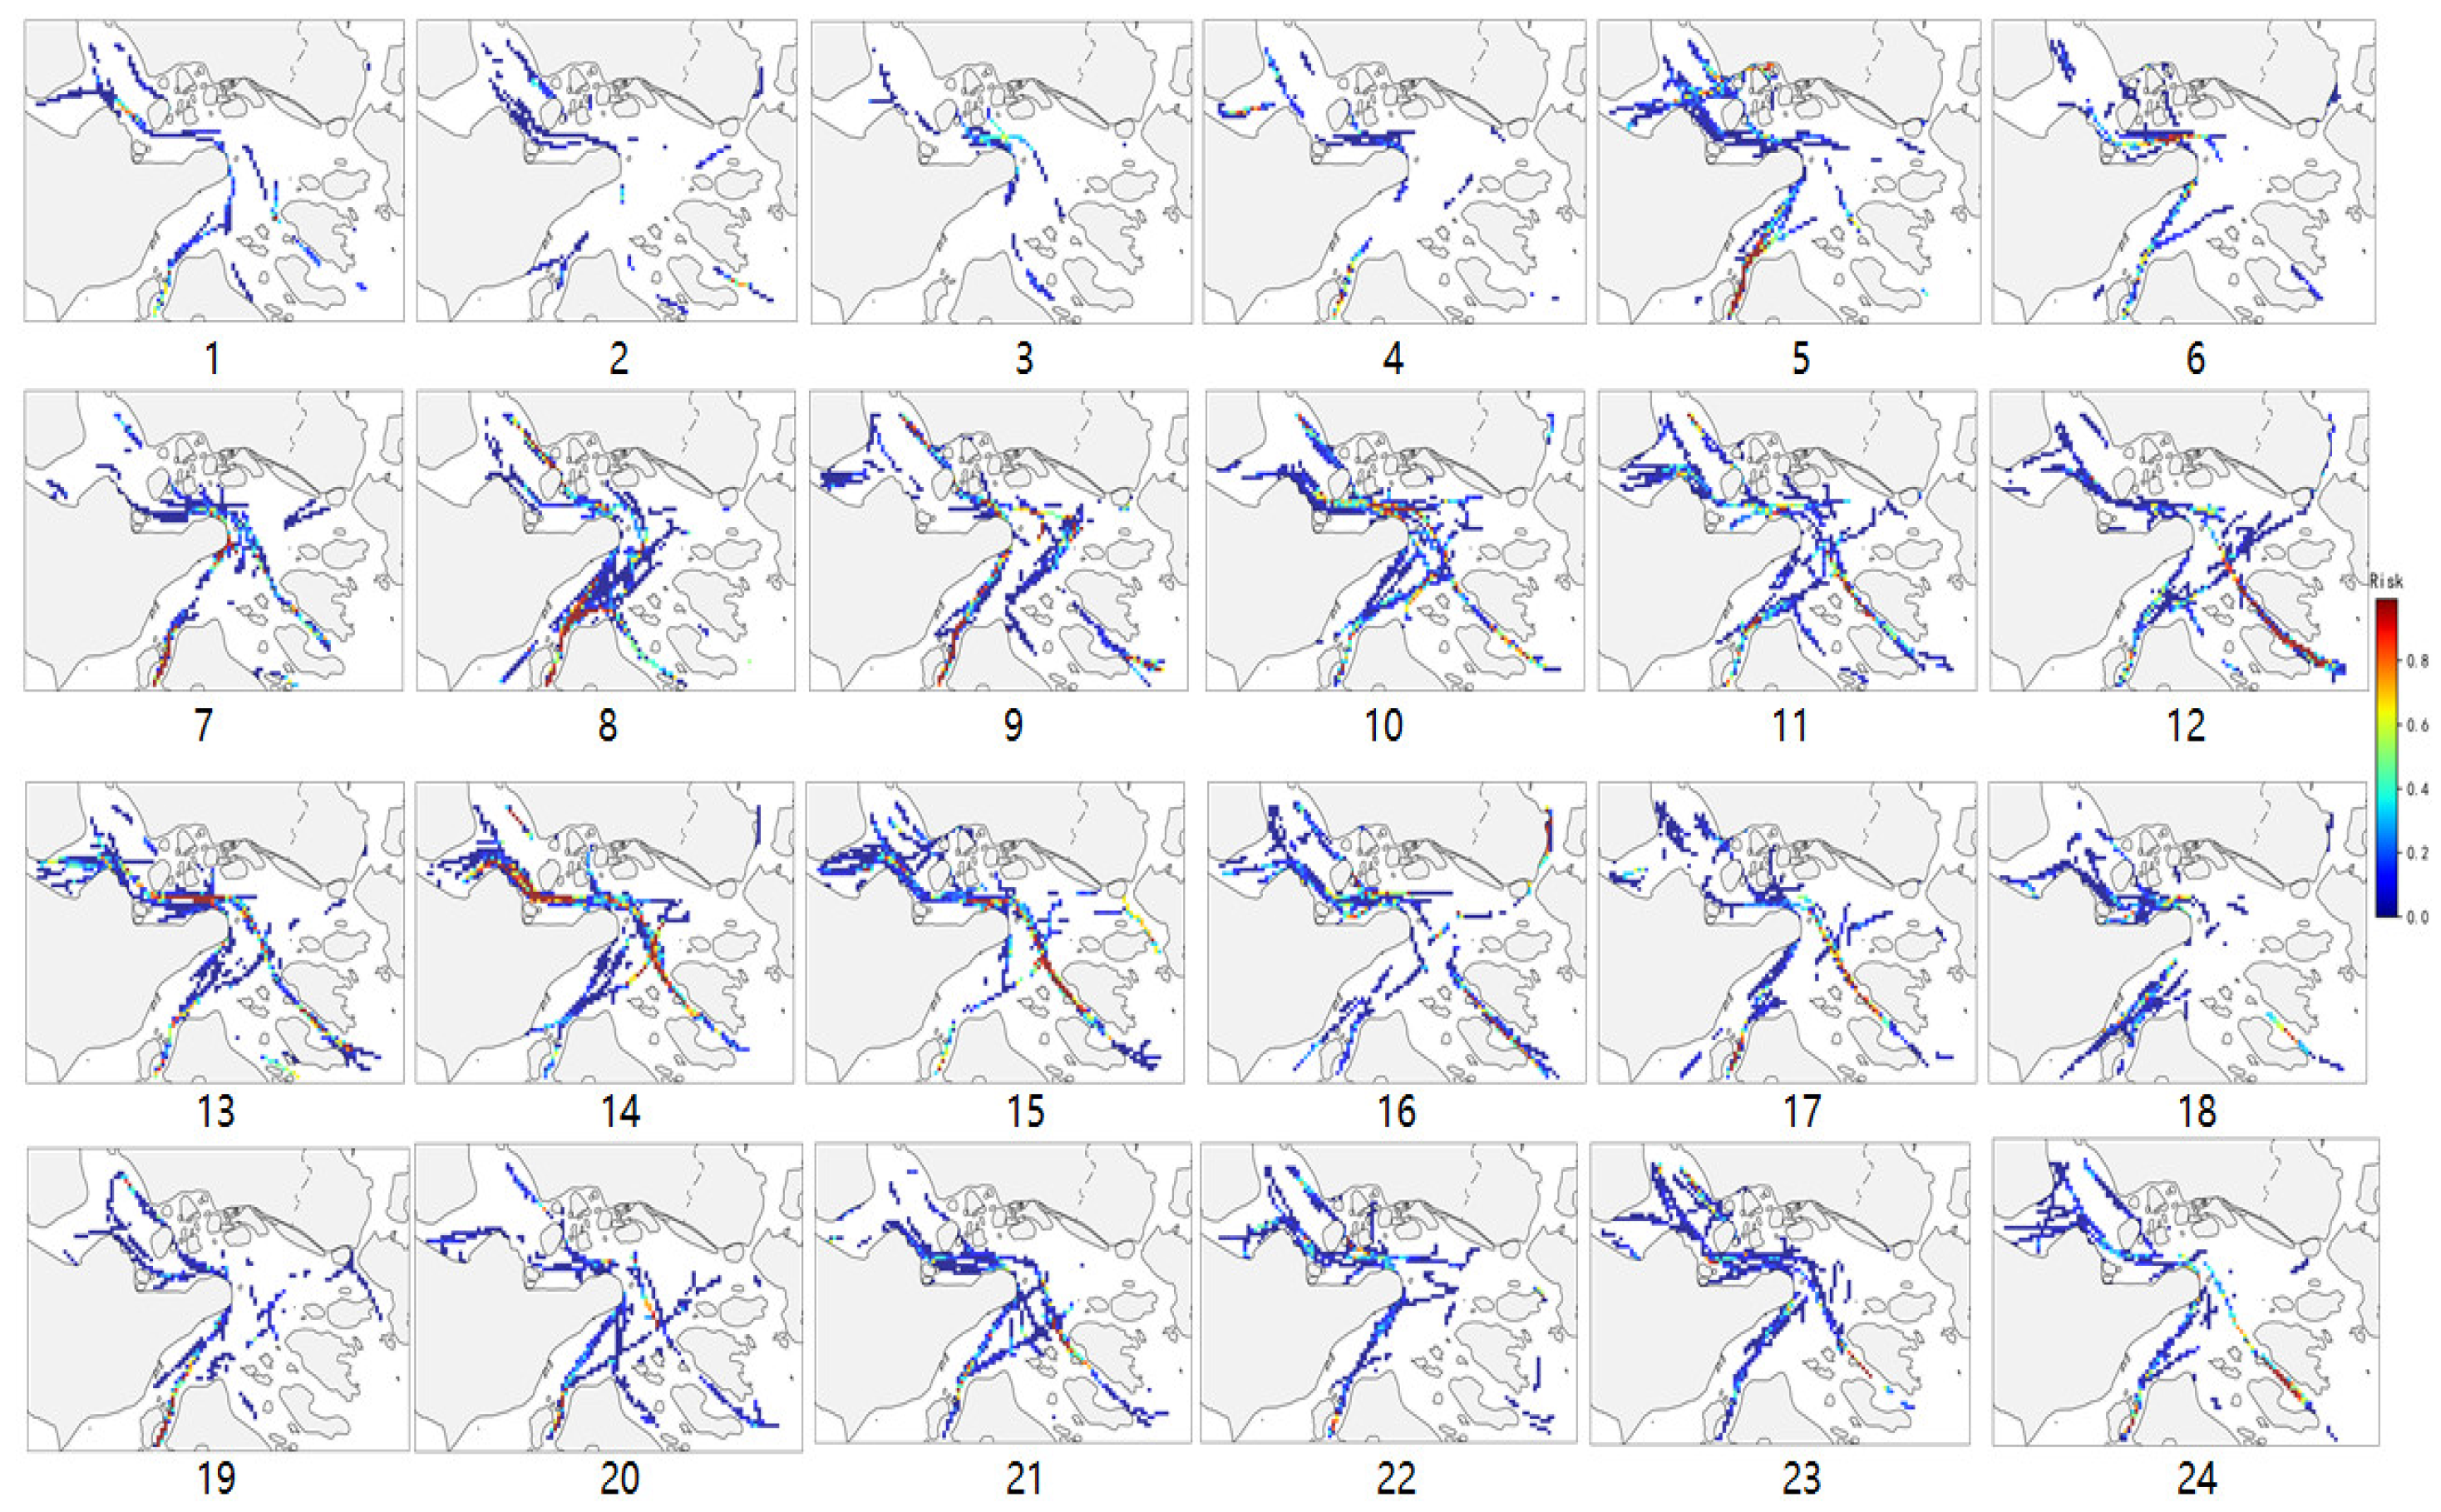
Figure 17.
Visualization of conflict distribution every 12 hours.
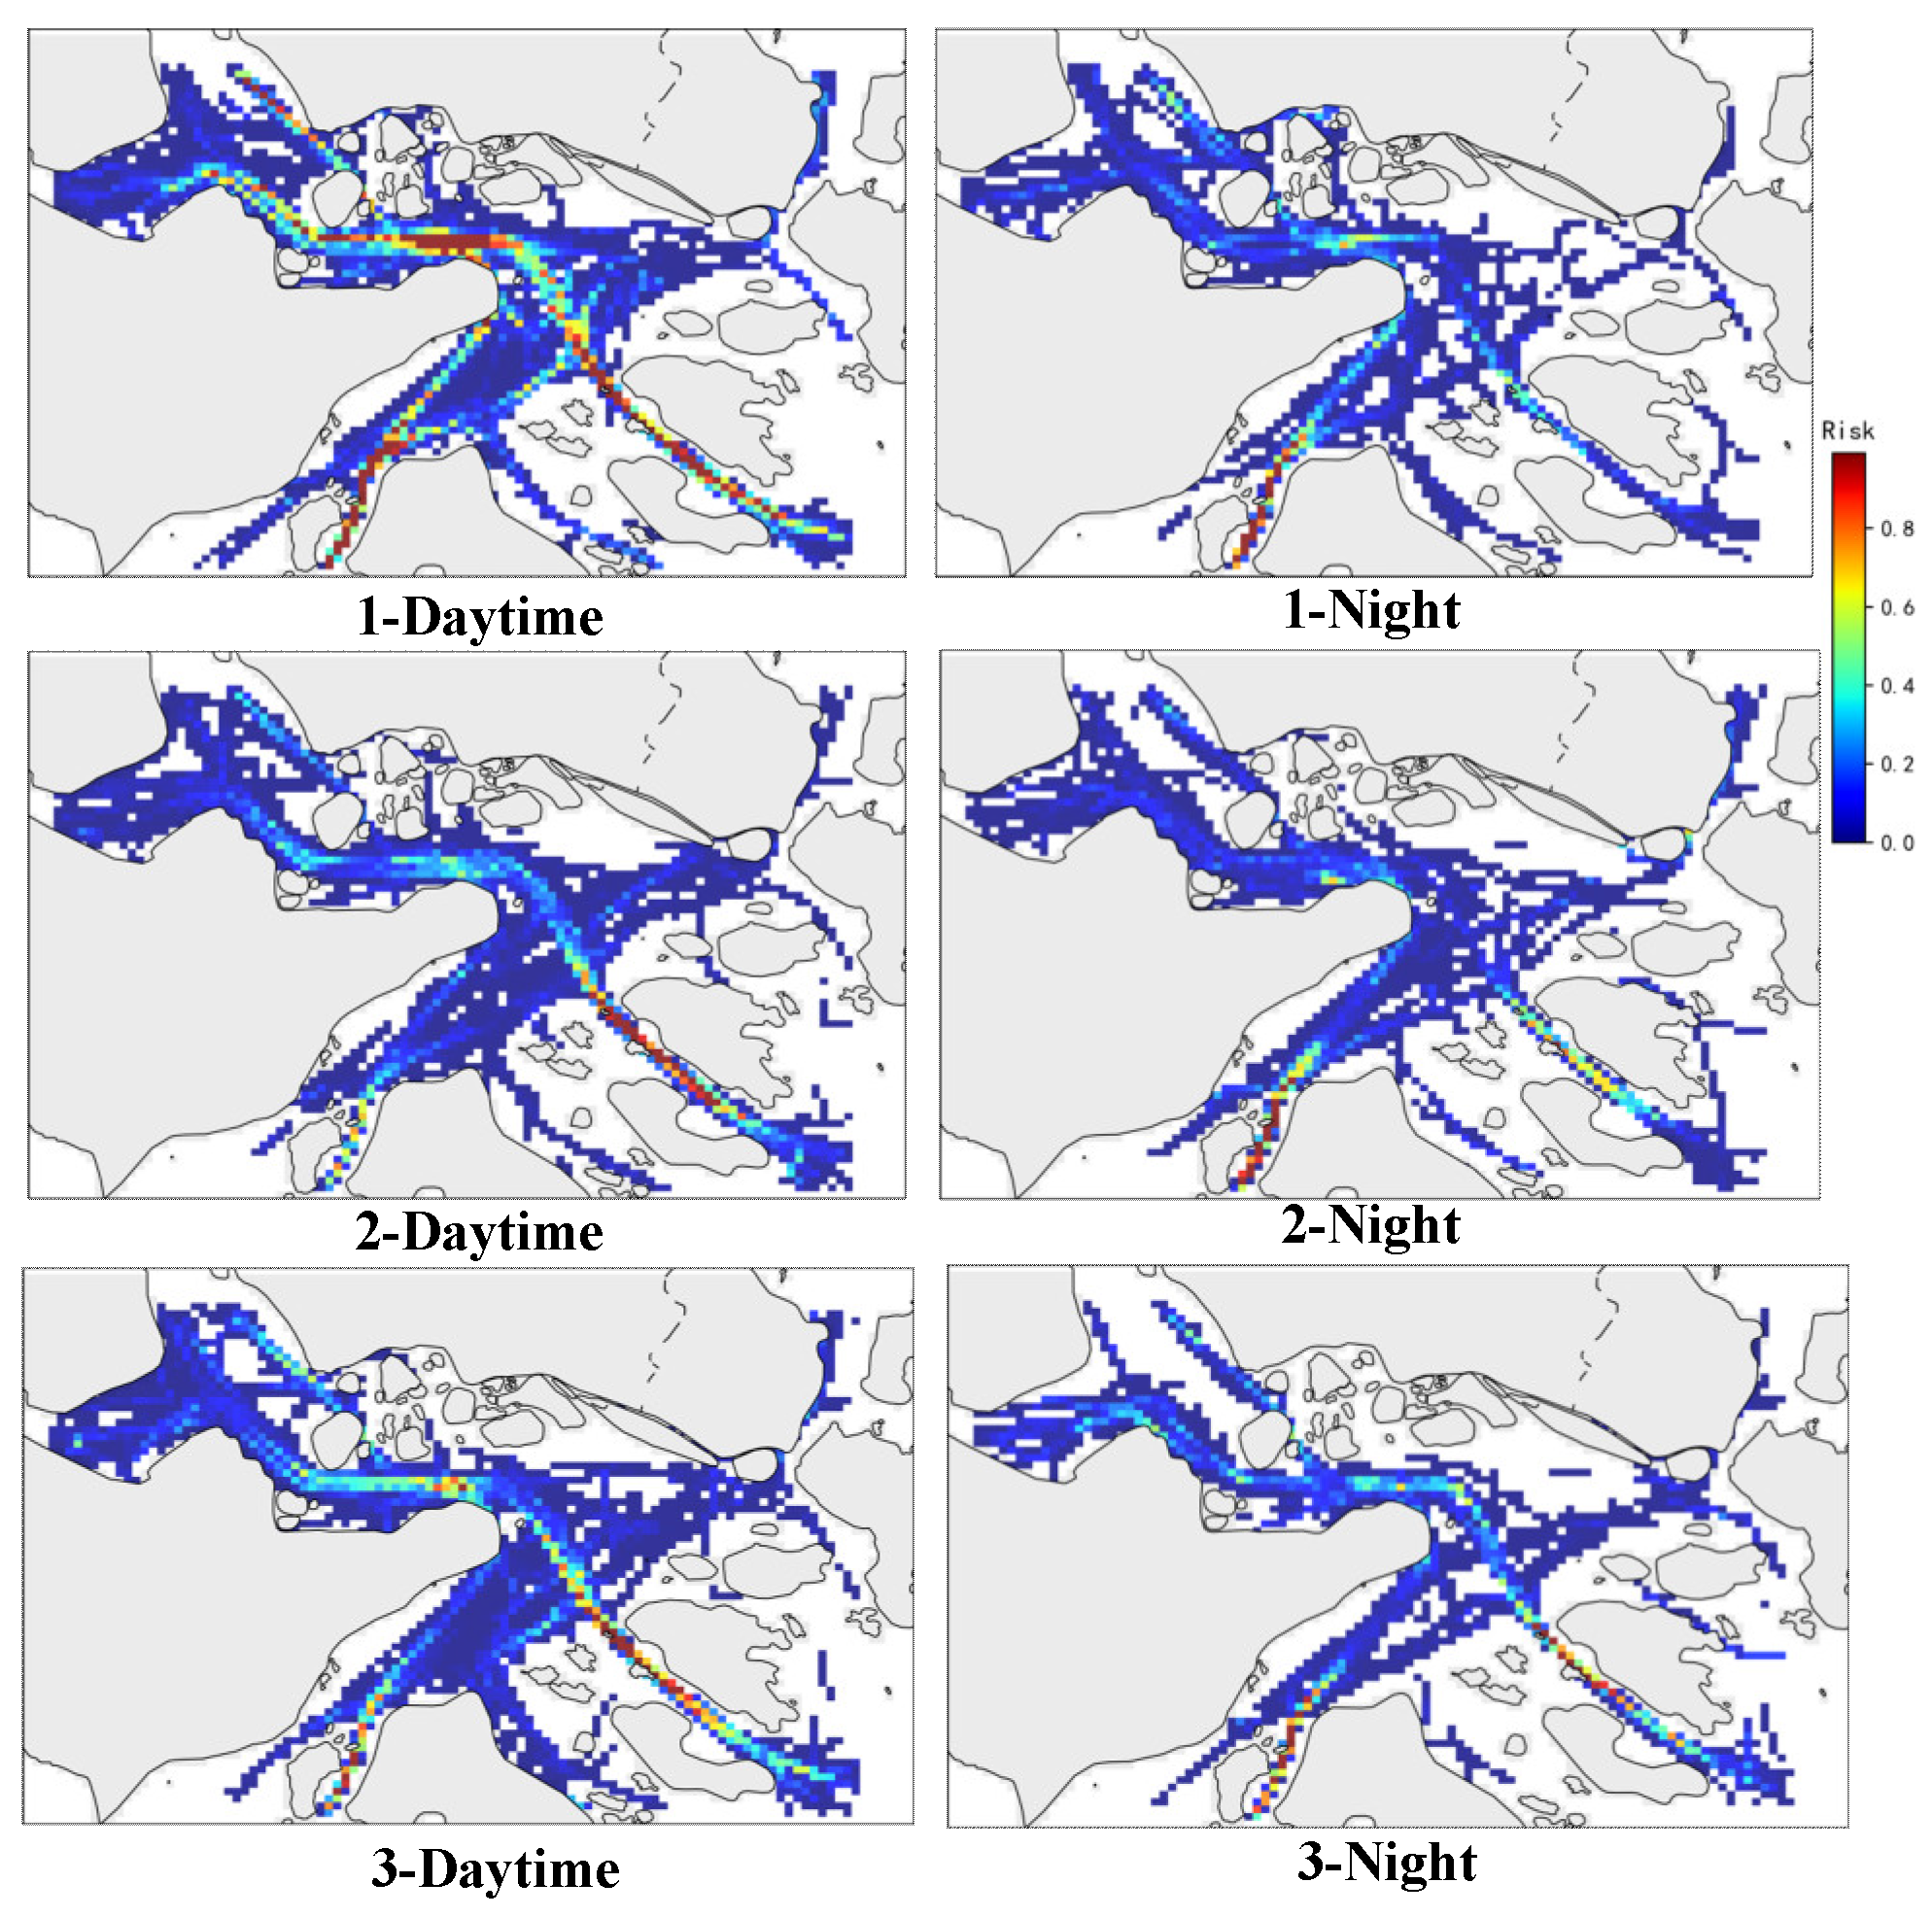
Figure 20.
Conflict severity and CDF.
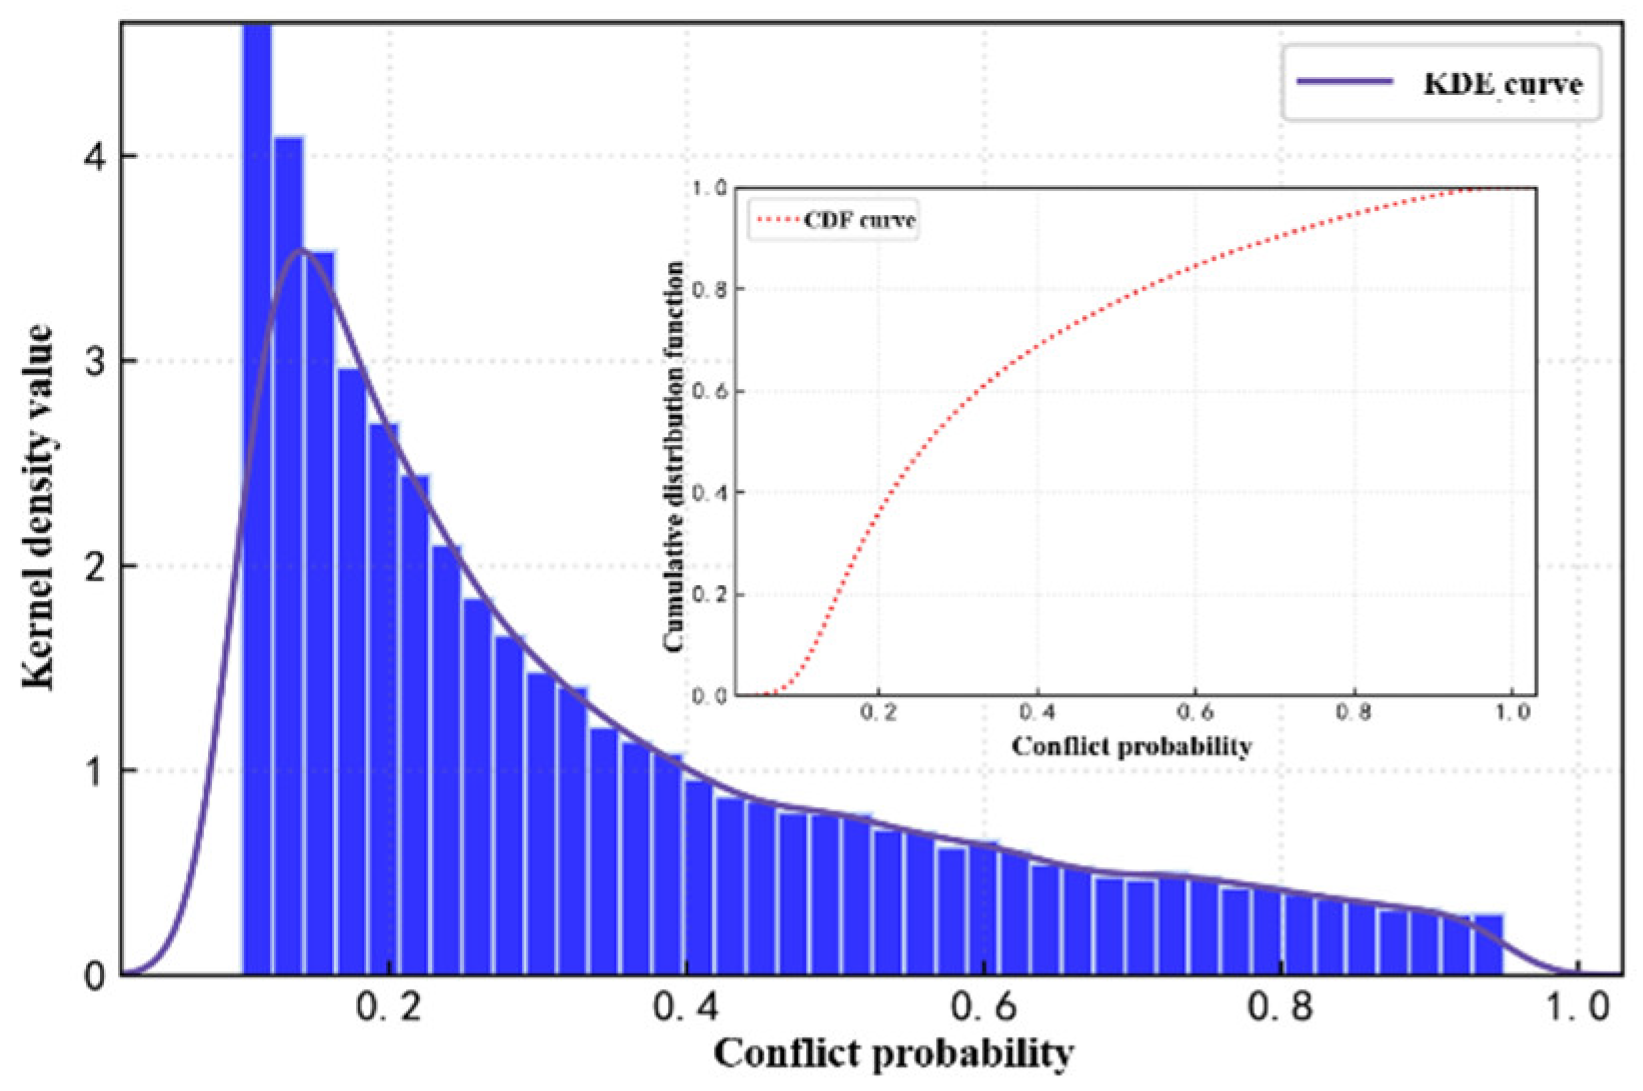
Figure 21.
Number of conflicts between ship types.
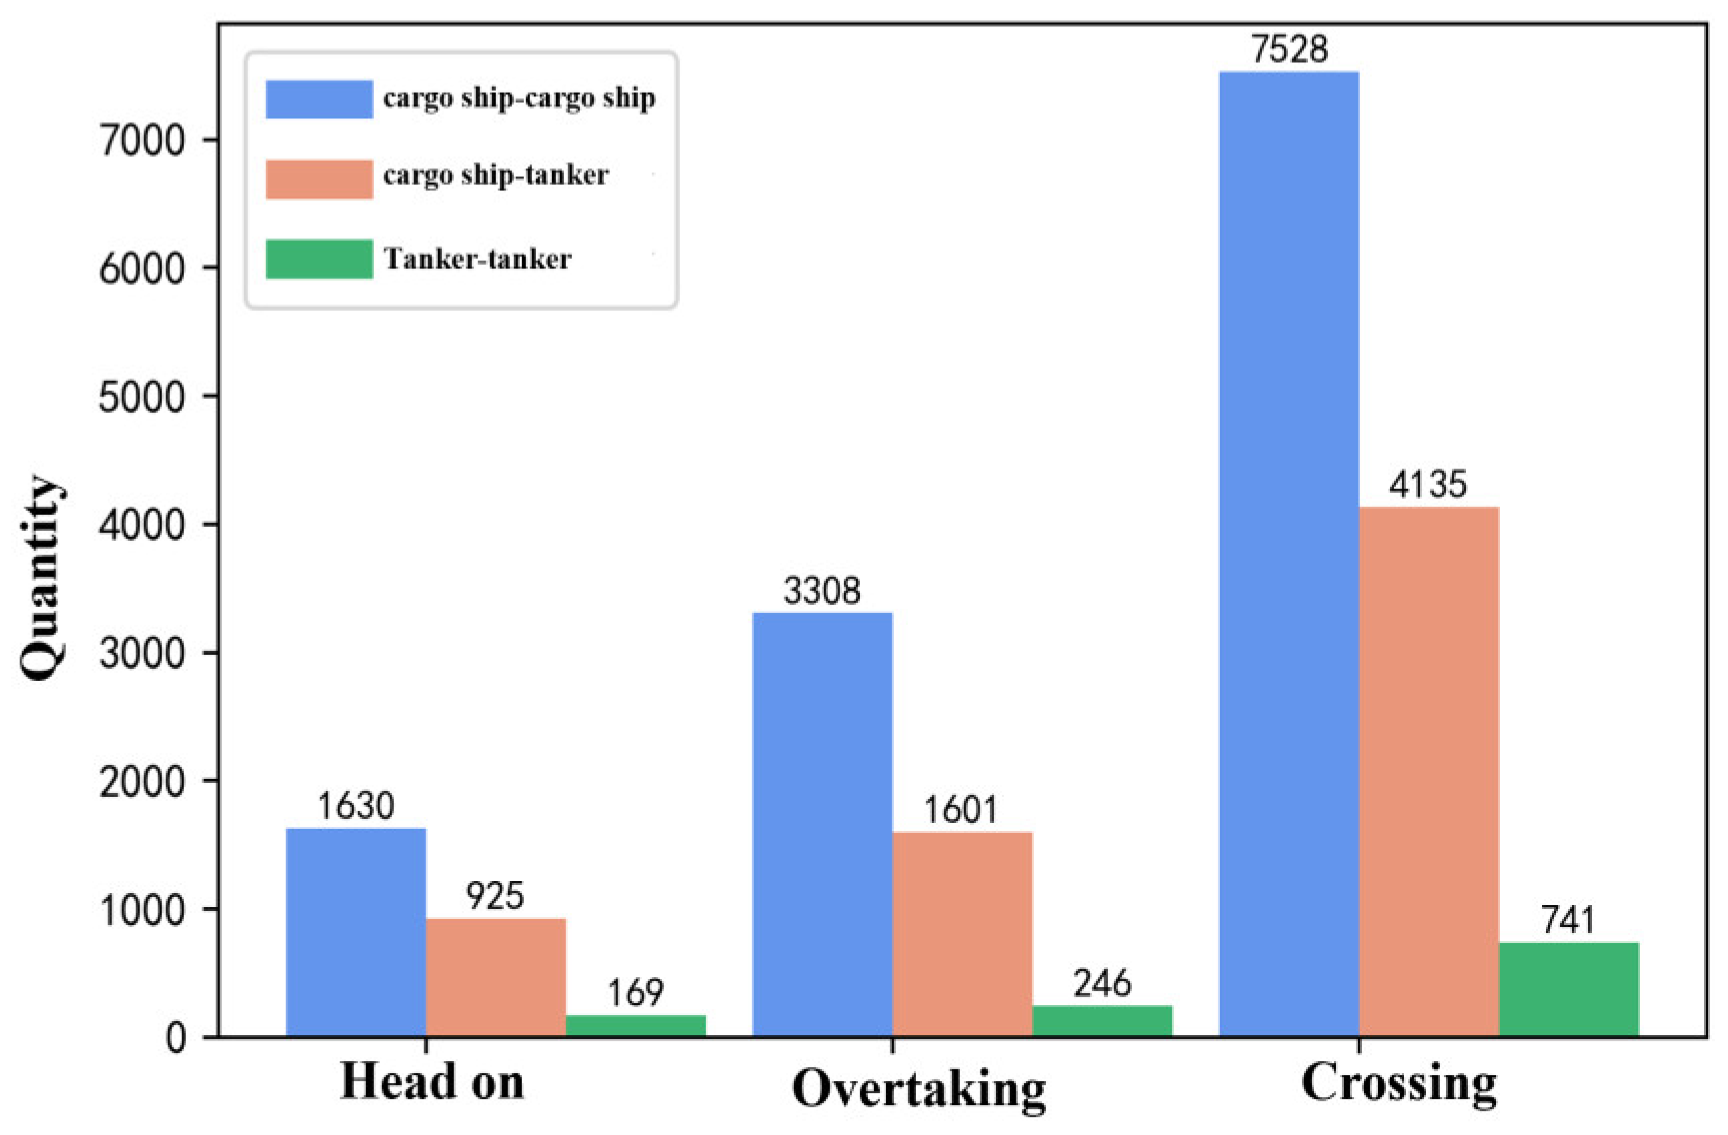
Figure 22.
Results of ship group division.
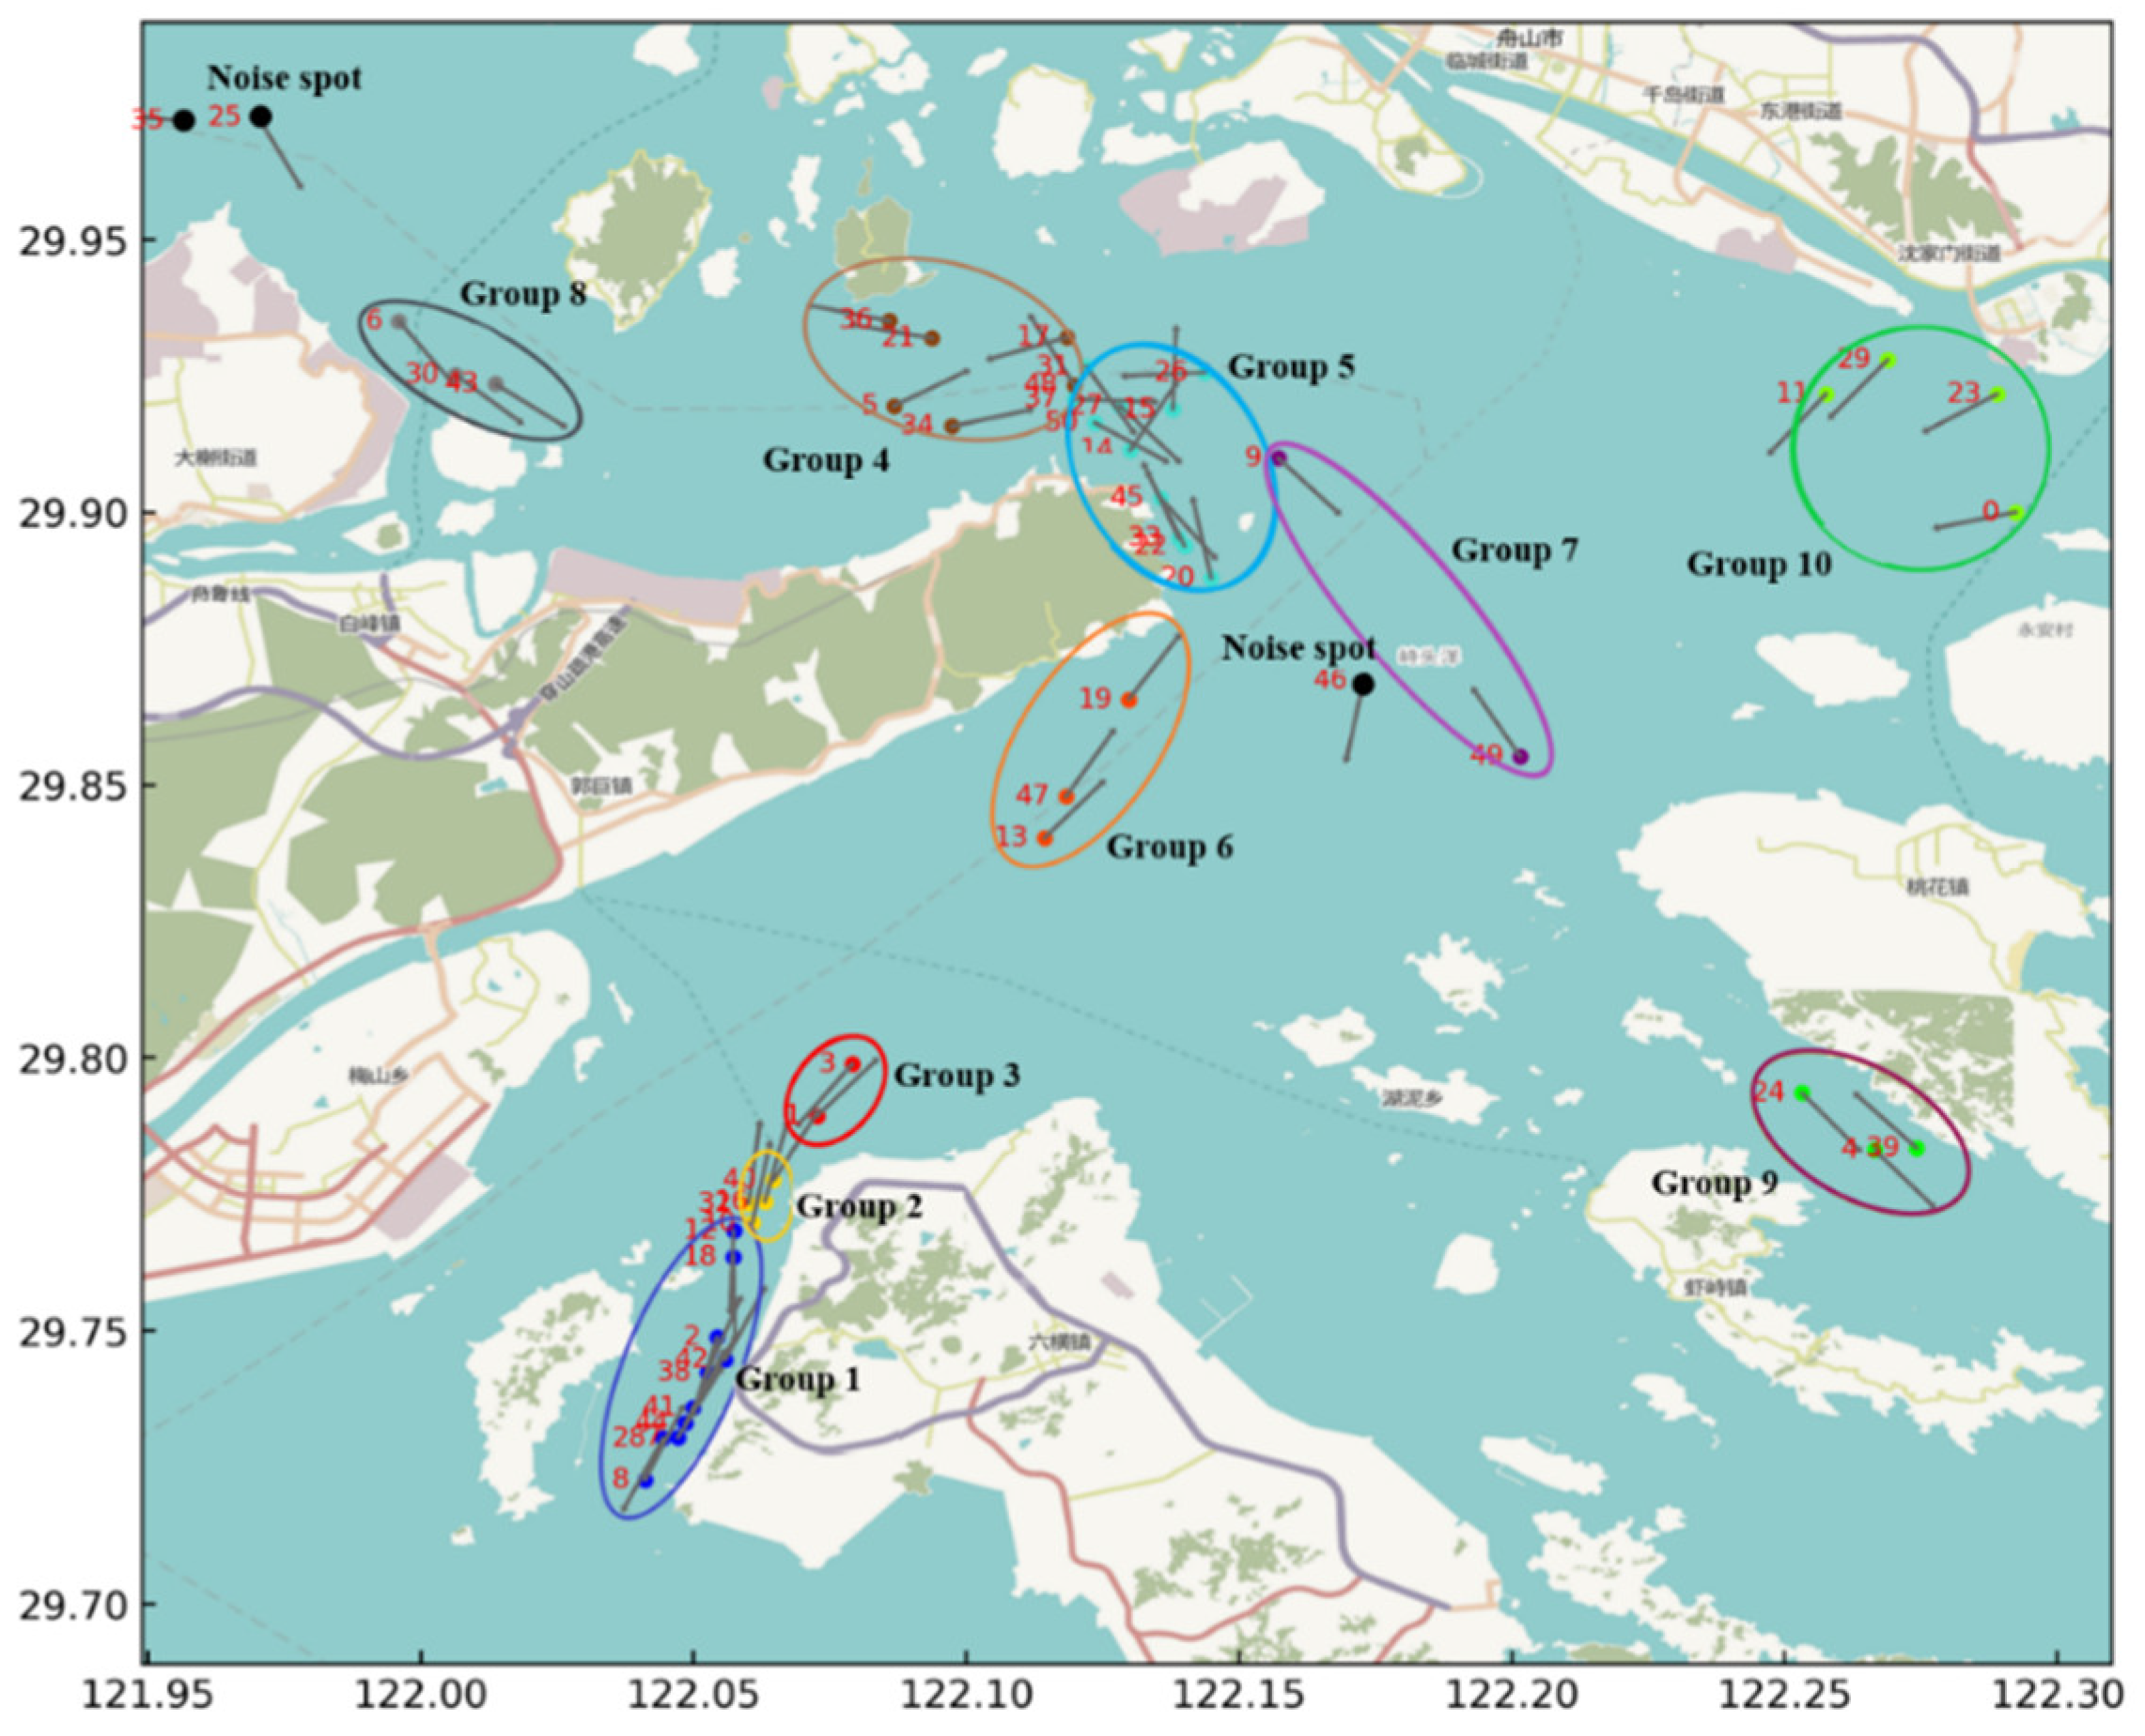
Figure 23.
The contribution of each ship in each group.
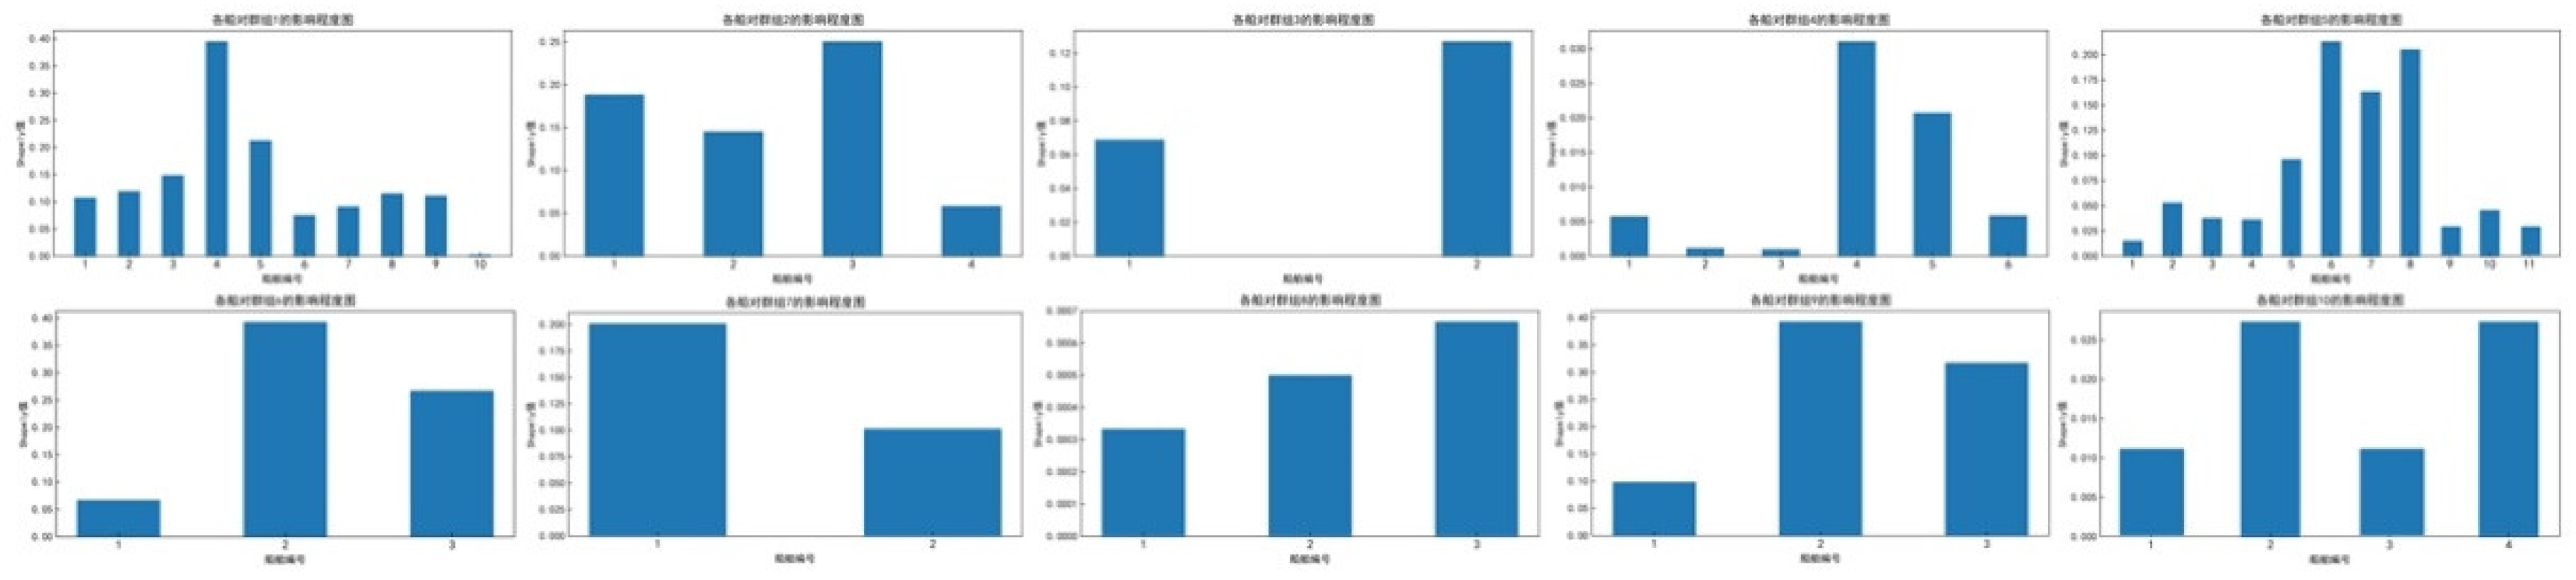
Figure 24.
Collision risk and traffic complexity for each group.
Disclaimer/Publisher’s Note: The statements, opinions and data contained in all publications are solely those of the individual author(s) and contributor(s) and not of MDPI and/or the editor(s). MDPI and/or the editor(s) disclaim responsibility for any injury to people or property resulting from any ideas, methods, instructions or products referred to in the content. |
© 2024 by the authors. Licensee MDPI, Basel, Switzerland. This article is an open access article distributed under the terms and conditions of the Creative Commons Attribution (CC BY) license (http://creativecommons.org/licenses/by/4.0/).
Copyright: This open access article is published under a Creative Commons CC BY 4.0 license, which permit the free download, distribution, and reuse, provided that the author and preprint are cited in any reuse.


