
Submitted:
30 December 2025
Posted:
31 December 2025
You are already at the latest version
Abstract
This study numerically examined the anchorage mechanism of rebar hooks under varying straight development lengths, including high stress levels. A Three-Dimensional Rigid Body Spring Model (3D-RBSM) was used for the investigation, which the model has successfully reproduced the experimental pullout test stress–slip relationships and inner–outer strain distributions for the case of bonded hook part with and without a straight development length. The numerical model, which considered both hook and straight development length was able to output local concrete stresses and internal crack propagation enabling a clear interpretation of how straight development length influences the anchor-age mechanism. The results revealed that increasing straight development length increases stiffness, reduces rebar strains and concrete stresses in the hook region, promotes crack formation around the rebar surface and forms maximum tensile stresses closer to the top surface, ultimately resulting in earlier splitting failure at high rebar stress levels. A comparison of cases with and without hooks shows that combining the hook with straight development length improves stress distribution, delays crack propagation and increases anchorage by reducing tensile stress concentrations near the top surface and side faces. The findings offer insights to support rebar hook anchorage design and review of existing standards.
Keywords:
rebar hook
; straight development length
; high strength rebar
; concrete stress
; rebar strain
; hook deformation
; splitting failure
1. Introduction
Rebar hooks are widely used in reinforced concrete (RC) structures to provide effective anchorage in regions where the available development length for straight reinforcement is insufficient. This anchorage is typically achieved using rebar hooks with bend angles of either 90-, 135- or 180-degree, as specified in design standards [1,2,3,4,5,6]. In hooked bars, the anchorage mechanism is governed by a combination of bond resistance along the straight portion and bond and bearing forces developed within the hooked segment [7,8,9]. The bond component facilitates stress transfer through adhesion, friction, and mechanical interlocking along the bar surface, whereas the bearing component resists pullout through localized compression of the concrete in the hook region [10]. In this context, the straight development length plays a particularly influential role, as it directly affects how the load is transferred along the straight embedment and bearing action in the hook, thereby defining the overall anchorage mechanism of hooked bars.
Development length refers to the required embedment of reinforcing steel needed to fully mobilize its design strength at a critical section, such as the column face in a beam–column joint [11]. In exterior beam–column joints and at the ends of flexural members, hooked reinforcement is commonly employed to shorten the required development length. The design codes [1,2,3,4,5,6] have defined development length using different criteria and have specified the hooked bar development length mainly based on the experiment results. Due to the inherent complexity of the anchorage mechanism in rebar hooks, accurately evaluating their required development length is essential. In this context, a numerical model that is validated against experimental data will be beneficial to have a more understanding of the development length to the anchorage performance. Furthermore, this supports the advancement of more rational design approaches for hooked reinforcement.
Many studies have investigated the development length of straight reinforcing bars [12,13,14,15,16]. However, for rebar hooks, the factors governing anchorage performance are more complex and less well defined. Meantime, research specifically focused on the development length of rebar hooks remains comparatively limited. In rebar hooks, Hwang et al. [17] developed one of the design formulations for hooked bar development length by incorporating the variation of bond stress with the anchorage contribution of the hook. Building on the need to extend design provisions for high-strength reinforcing steel and concrete, subsequent studies by Sperry et al. [18,19] and Ajaam et al. [7] experimentally evaluated beam–column joint specimens reinforced with 90- and 180-degree hooked bars and proposed empirical development length expressions based on their test observations. According to Afroughsabet et al. [20], steel fibers can increase the bond behavior of anchored bars in steel fiber-reinforced concrete (SFRC) and Rossi et al. [13] experimentally demonstrated that the development length of hooked bars can be reduced in high-bond SFRC while maintaining comparable mechanical performance. Despite these advancements, existing research is predominantly experimental and although several numerical simulation studies on rebar hook behaviour have been reported [10,21,22] the influence of straight development length on the anchorage performance of hooked bars has not been systematically investigated. This gap is largely attributed to the complexity of the problem, which requires accurate representation of multiple interacting mechanisms, including bond behavior governed not only by slip but also by radial forces induced by rebar lugs, concrete bearing around the hook region, meso-scale crack development in the surrounding concrete and macro-scale splitting behavior. Therefore, numerical investigations that enable in-depth evaluation of local behavior are essential to overcome these challenges.
In this context, the present discrete numerical investigation was undertaken to evaluate the influence of straight development length on the anchorage performance of 180-degree rebar hooks. A series of pullout tests on hooked bar specimens embedded in concrete were numerically reproduced using the Three-Dimensional Rigid Body Spring Model (3D-RBSM), in which the rebar was modelled using beam elements and adding a fiber element that divides the cross section to reproduce the strains at each point of the rebar. Following successful validation against experimental results, the numerical model was used to examine the effect of development length on anchorage performance. In particular, the numerical results focused on inner and outer strain propagation along the rebar hook, evolution of internal cracking and concrete stress distribution patterns including high stress levels. Moreover, the behavior at high stress levels provided valuable insights into the efficient utilization of high strength rebar.
2. Materials and Methods
2.1. Experiment Program
Pull-out tests were performed to evaluate the influence of straight development length (hereafter referred to as development length) on the anchorage performance of rebar hook. The rebar hook geometry was decided based on the JSCE guideline [6] with an inner radius of 2.5 times the rebar diameter (φ) and a tail extension length of 4φ. Figure 1 illustrates the overview of tested specimens with the size of 550 mm length, 550 mm width and 440 mm height. The development lengths specified in Table 1, 0φ and 9φ, were used to design and prepare the test specimens.
The variation in development length was given by introducing an unbonded area along the straight portion of the rebar hook. This unbonded length was created by filling the rib gaps with clay and wrapping the surface with vinyl tape to prevent bond formation between the rebar and surrounding concrete. Strain gauges were installed on the inner and outer sides of the hook, as shown in Figure 1 to measure the difference in strain propagation between both sides of the rebar hook.
High strength rebars with 1031 MPa with a diameter of 22 mm were used and all the rebar hooks were embedded with 12 φ distance. The Young’s modulus and yield strain of rebar were 201 GPa and 5129 μ respectively. A single stirrup was placed at the top of all specimens with the help of assembly bars to avoid any accident during the failure of the specimen. All the specimens were cast with the early strength concrete with the compressive strength and Young’s modulus of concrete was 31.2 MPa and 25.4 GPa respectively.
The pullout load was applied using a manually operated center-hole type hydraulic jack, as shown in Figure 2. The applied stress was determined by dividing the measured load by the cross-sectional area of the reinforcing bar. The slip at the hook starting point corresponding to each stress level was evaluated based on the displacement recorded by the Linear Variable Differential Transformers (LVDTs) and the strain data obtained from the strain gauges attached on both sides of the straight rebar part. During testing, the strain responses on the inner and outer sides were continuously recorded to identify the strain variation between the two sides. Both specimens were tested until the load cell reached its maximum capacity (500 MPa).
2.2. Numerical Analysis
Numerical analysis was carried out using Three-Dimensional Rigid Body Spring Model (3D RBSM) which is a discrete analysis method. The RBSM was first proposed by Kawai in 1978 [23] and has been further improved and applied by researchers [21,24,25,26,27,28,29,30,31]. In the 3D RBSM, concrete is modeled as 3D Voronoi rigid particles interconnected by springs set on the boundary surface as shown in Figure 3. Since cracks initiate and propagate along particle interfaces, the crack path is highly influenced by the mesh configuration. To minimize mesh dependency and to get more realistic crack propagation, a random particle geometry is generated through Voronoi tessellation. Each rigid particle has been assigned three translational and three rotational degrees of freedom defined at the center of gravity. The interface between adjacent particles is divided into triangles based on the centroids and vertices of the surface. At the centroid of each triangle, one normal spring and two shear springs are set to represent the local stress-transfer across the interface.
The concrete constitutive models for tension and compression of normal springs and for shear springs used in 3D-RBSM for monotonic loading analysis are constructed by uniaxial relationships between stress and strain, as shown in Figure 4. The details of the models and the relevant model parameters have been described and verified in previous studies [25,29,30].
The steel rebar hook was modeled as a series of regular beam elements, as shown in Figure 5. In this rebar beam model, the rebar can be freely arranged within the concrete member, which is independent of the concrete mesh configuration. Each beam node possesses two translational and one rotational degree of freedom, represented by springs. The rebar is connected to the surrounding concrete through zero-size link elements, which are placed between each beam node and the corresponding computational point of a concrete particle to facilitate stress transfer, as shown in Figure 5a. This link element consists of tangential, normal and rotational springs around the rebar axis and the tangential spring represents the shear stress transfer mechanism induced by the rib action and is defined by a nonlinear bond stress–slip relationship. Here, the normal spring, perpendicular to the rebar axis, is assigned a sufficiently large stiffness to restrict displacement normal to the rebar. The stress–strain relationship for the steel rebar is presented in Figure 5b, while the local bond stress–slip relationship adopted in this study is shown in Figure 5c.
In previous work, it was observed that the bond behavior can be effectively captured through the combined use of the beam element rebar model and the Voronoi meshed concrete model, producing results consistent with those from 3D modeling of deformed rebar with rib geometry [34]. Furthermore, employing beam elements facilitates a clearer interpretation of the rebar’s deformation pattern and it is important to consider the local nonlinear bending deformation of the reinforcement in the analysis of rebar hooks [21].
3. Numerical Model (3D-RBSM) Validation
The 3D-RBSM is capable of reproducing both bond behavior and concrete splitting failure [24,33]. For straight rebars, Farooq et al. [25] demonstrated that modeling the rebar using beam elements produces bond behavior comparable to that obtained with detailed 3D rib-shaped rebar modeling, and it successfully captures both splitting and pull-out failure modes within the 3D-RBSM framework. Furthermore, Mori et al. [22] showed that 3D-RBSM can accurately simulate the peak load and splitting failure observed in rebar hook pull-out tests, employing a hook geometry and experimental setup similar to those adopted in the present study. Hence, this study primarily investigates the influence of the straight development length on stiffness and rebar strain distribution prior to the peak load by experimentally due to limitation of load cell capacity and the validated numerical model using the stress-slip relationship, and the rebar hook inner and outer strains will be used to discuss the higher load levels, peak load and the failure.
3.1. Numerical Model
The RBSM models of the tested specimens with random Voronoi mesh are shown in Figure 6, which the support conditions were assigned using plate elements. As shown in Figure 6a, the concrete mesh size was set to 10 mm and gradually increased to 25 mm toward the specimen side edges. The reinforcing bar was modeled using beam elements, as illustrated in Figure 6b. To model the unbonded rebar part, the maximum shear stress (τmax) was reduced to and a considerably low stiffness (scaled by a factor of 0.01) was assigned to the normal spring, allowing displacement normal to the rebar. All material properties of the concrete and rebar were assigned to match those used in the experimental program and the pullout loading applied in the experiments was reproduced by giving a positive displacement on the top link element of the rebar hook. The slip at the hook curve start point was evaluated using the given displacement of the top link element and strain distribution of the development length. Following the model validation, concrete stress patterns and concrete internal crack distribution were produced for the discussion.
3.2. Validation Using Stress-Slip Relationship
Figure 7 presents the stress–slip relationships obtained from both experimental tests (shown in dashed lines) and numerical simulations (shown in solid lines) for the DL0 and DL9 specimens. The stress is calculated as the applied load divided by the cross-sectional area of the rebar, while the slip corresponds to the slip at the hook curve start point. This slip was experimentally determined by subtracting the elongation of the straight development length (obtained from strain gauge measurements) from the measured top displacement. Overall, the numerical results exhibit good agreement with the experimental observations and a significant difference in stiffness can be observed between specimens with different development lengths. The numerical results indicate that increasing the development length leads to a stiffer stress–slip response, while simultaneously reducing the peak stress capacity.
3.3. Validation Using Rebar Inner and Outer Strains
Figure 8 shows the strain distributions for both inner and outer sides of the rebar hook for both experimental and numerical analysis. The vertical dashed lines indicate the start, mid and end points of the hook curvature. The strain distributions were extracted at global strain levels of 500 µ, 1000 µ, 1500 µ, 2000 µ and 2500 µ measured at the top loading point, almost matching the stress levels of 100, 200, 300, 400 and 500 MPa respectively. For both cases, although there are slight differences in the strain values between the numerical results and the experimental results, the numerical results well reproduced the trend observed from the experimental results. These results show that when the hook resists force, it resists the pull-out force while producing complex localized bending deformation behavior starting just before the hook start position (from about 200 mm in Figure 8). The specimen DL0 which does not have development length shows high inner strain at the hook start point and high outer strains at the hook curve part compared to DL9 which has 9φ development length, demonstrating the sensitiveness of strains to the development length. With the introduction of a straight development length, rebar strains on both the inner and outer sides progressively decrease along the straight embedment, thereby reducing the strain demand in the hook curve region. This reduction in strain demand leads to lower slip and improved stiffness. Based on the above results, the applicability of the numerical analysis using 3D-RBSM to simulate the pull-out behavior of deformed rebar with semi-circular hook end is found effective. Hence, the effect from development length at higher stress levels are also investigated numerically in the next chapter which is difficult to obtain directly from the experiment including stresses diagrams and internal cracks.
4. Effect of Development Length
This chapter presents an in-depth numerical study, conducted by varying development length, while keeping all other parameters constant and consistent with the experimental conditions (concrete compressive strength: 31.2 MPa; concrete Young’s modulus: 25.4 GPa; and rebar yield strength: 1031 MPa). The selected cases are shown as Figure 9, considering development lengths ranging from 0φ to 9φ.
4.1. Stress-Slip Relationship
Figure 10 presents the stress–slip relationships for specimens with different development lengths of 0φ (DL0), 3φ (DL3), 6φ (DL6) and 9φ (DL9), while maintaining a constant concrete cover of 12φ. The definition and calculation of stress and slip are same as Figure 7. The results clearly demonstrate the strong influence of development length on anchorage strength and stiffness of the rebar hook curve part.
The specimen with no straight development length (DL0) exhibits the highest peak stress and the largest slip at peak, indicating the hook region carries anchorage force alone. As the development length increases, a progressive reduction in slip at the hook curve part is observed (DL3→DL6→DL9). This trend highlights the stress distribution along the development length, which reduces stress transfer to the hook region. More importantly, for a particular stress level, the reduction in slip at the hook curve part with increasing development length highlights the contribution of effective bond between the development length of the rebar hook and the surrounding concrete. More importantly, a progressive reduction in peak stress is observed (DL3→DL6→DL9) with increase of the development length. It is interesting to note that increasing the development length reduces the force transmission to the hook part, yet the peak stress decreases and failure occurs earlier. This mechanism will be discussed in detail in the failure mechanism evaluation in Section 4.3.3.
4.2. Rebar Hook Inner and Outer Strain Distributions
Figure 11 shows the numerically obtained inner and outer strain distributions along the rebar hook for specimens with varying development lengths of 0φ (DL0), 3φ (DL3), 6φ (DL6), and 9φ (DL9). The strain distributions are shown at multiple strain levels up to peak loading, where strain levels of 1000 μ, 2000 μ, 3000 μ and 4000 μ correspond approximately to stress levels of 200 MPa, 400 MPa, 600 MPa and 800 MPa respectively. The vertical dashed lines indicate the start, mid and end point of the hook curvature. The results clearly demonstrate that the development length has a pronounced influence on the strain profile within the hooked region.
For the specimen (DL0) without a straight development length (0φ), both the inner and outer surfaces exhibit higher strain concentrations near the start of the hook curvature. As the development length increases (DL3 → DL6 → DL9), the strain distributions become gradually smoother, with considerably reduced peak strain values on both inner and outer surfaces. This behavior reflects the contribution of bond along the straight development length, which enables effective stress transfer before the stress reaches the hook curvature. Consequently, the stress transmitted to the hook region is reduced, resulting in lower strain levels along the rebar hook curve part. Hence, the stress and slip at the hook region are reduced, leading to a more uniform distribution of strain, reduced hook deformation, and an increase in overall anchorage stiffness.
4.3. Concrete Stresses and Internal Crack Distribution
In this section, concrete stress fields and internal crack distributions are examined separately at different stress levels and at failure to clarify how the stress transfer mechanism evolves with varying development lengths.
4.3.1. Concrete Stresses and Internal Crack Distribution at Different Stress Levels
Figure 12 demonstrates the numerically obtained stress contours and internal crack distributions at the hook plane at different stress levels for specimens with different development lengths. The concrete stresses shown correspond to the Y-direction, are equal to the pullout load application direction and stresses include both compressive stress (Max. Compressive stress: 50MPa) and tensile stress (Max. Tensile stress: 1.82 MPa) fields. The results clearly demonstrate that the development length plays a vital role in governing the anchorage mechanism of the rebar hook. Specimens with shorter development lengths (e.g., DL0 and DL3) exhibit higher stress concentration around the hook region, as most of the anchorage force is carried directly by the hook region. This localized stress field also leads to the formation of a high density of internal cracks within the hook region. In contrast, specimens with longer development lengths (DL6 and DL9) show more distributed and less intense stress fields, indicating that a significant portion of the stress has already been transferred through bond along the development length before reaching the hook region. According to stress contours and internal crack diagrams, for short lengths, it is generalizable that anchorage is mainly governed by bearing action at the hook region, whereas for longer lengths, the anchorage mechanism affects the bond deterioration of along the development and bearing at the hook region. It is also noted that this behavior becomes more pronounced as the rebar stress increases when high-strength rebars are used.
4.3.2. Peak-Load Concrete Stresses, Internal Crack Development and Deformation at Failure
Figure 13 presents the concrete stress distribution at peak load, along with the internal cracking patterns and failure-stage deformations, for all the specimens to understand the failure mechanism. The stress contours on the XY plane at center which goes through the hook plane (Z = 275 mm) are plotted for the three principal orthogonal directions (Stress-X, Stress-Y, and Stress-Z) and include both compressive stress (Max. Compressive stress: 50MPa) and tensile stress (Max. Tensile stress: 1.82 MPa) fields. For shorter development lengths (DL0 and DL3), the stress fields in all three directions exhibit strong localization around the hook curve part. Highly concentrated tensile stresses form adjacent to the inner bend, indicating that majority of the anchorage force transferred to the hook region (inside). In contrast, specimens with longer development lengths (DL6 and DL9) show different behavior. The stress contours reveal a considerable stress field has generated along the development length of the rebar, with reduced stress concentration at the hook region. This reflects improved bonding along the development length, allowing greater load transfer before the force reaches the hook.
The internal crack distribution and the deformation pattern clearly show the splitting failure in similar manner for all the different development length cases. Even though the stress generation changed with the development length, the failure pattern is similar for all the cases. But the crack width is higher for the shorter development length compared to the longer development length indicating the difference in localized damaged in the hook region. Overall, Figure 13 demonstrates that increasing the development length shifts the anchorage mechanism from hook-dominated concrete bearing to a more distributed, bond-governed stress transfer supported by the development length together with the concrete bearing. Furthermore, it is noted that when a large load is transmitted to the anchorage, as occurs when high-strength rebars are used, splitting failure occurs regardless of the development length, even if the cover is 12φ and there is a sufficient distance of approximately 250 mm from side face. The maximum stress value has a significant effect on when splitting failure occurs, and elucidating the mechanism of splitting failure will provide important insight into the use of high-strength rebars.
4.3.3. Evaluating the Failure Mechanism
As described in Section 4.3.2., all the specimens followed splitting failure. In this section, the influence of development length on peak stress and the associated failure mechanisms is examined based on Figure 14. Because splitting failure is governed primarily by the tensile stress field in concrete, the analysis focuses on concrete tensile stresses perpendicular to the splitting plane and the internal crack evolution for DL0, DL3, DL6, and DL9 at a representative stress level (~650 MPa, close to the lowest peak of DL9) and at their respective peak stresses.
It was already discussed that in the numerical stress–slip responses (Figure 14, top), although increasing the development length enhances the initial stiffness, it simultaneously reduces the peak stress, as indicated by the circled markers. As the development length increases (DL6 and DL9), the location of maximum tensile stress formed closer to the top cover (see stresses in XY and XZ planes at 650 MPa) due to the greater bond demand along the development length. Consequently, cracks begin to form along both development length and the hook. As the load approaches the peak level, it is observed that specimens DL6 and DL9 exhibit high tensile stresses primarily at the top surface, while the hook region does not show pronounced tensile stress concentrations (see stresses in XY and XZ planes at peak stress). This behavior is evidenced by the formation of cracks along the development length, indicating that longer development lengths undergo earlier bond degradation along the embedment (see cracks in XY plane at peak stress). Since cracks have already formed around the rebar surface, leading to stress release, specimen DL9 is the most prone to fail first.
In contrast, shorter development lengths (DL0 and DL3) delay the generation of tensile stresses at the top surface, enabling these specimens to sustain higher peak stresses despite severe localized damage near the hook. At around 650 MPa, specimens with shorter development lengths exhibit concentrated tensile stresses and cracking confined to the hook region in XY plane, which includes rebar plane. At the peak stress, this stress distribution further expands toward the top surface indicating higher tensile stress representation at the top surface (refer stresses in XY and XZ planes at peak stress). The effect of development length is further verified by the stress distribution in the YZ side plane at peak stress, where specimen DL0 exhibits a higher tensile stress distribution compared to DL9.
Therefore, when a straight development length is present, failure is governed primarily by crack formation along the development length and the hook, which releases stress and leads to earlier splitting failure. In contrast, when the development length is excluded, cracks form only in the hook region, delaying the splitting failure formation and resulting in a higher peak stress and larger slip.
5. Anchorage Contributions of the Rebar Hook and Straight Development Length
In this chapter, an analysis was carried out to clarify each contribution to the pull-out behavior until post peak of the rebar hook part and the straight development length part. Therefore, a numerical analysis was carried out for two cases by considering only the development length (12ϕ), (Specimen DL) and both the development length and hook (Specimen DL+H) as shown in Figure 15. The specimen size and the rebar details are similar to that of Figure 1.
5.1. Stress Slip Relationship
Figure 16 compares the stress–slip relationships for the two anchorage configurations: DL (only development length) and DL+H (development length with hook), as shown in Figure 15. The stress corresponds to the applied load divided by the rebar cross sectional area at the loading point, while the slip represents the slip measured at point ‘A’ (end of straight rebar part as shown in Figure 15) and at the top (load application point). This slip at point ‘A’ is calculated by subtracting elongation of the straight embedment (obtained from strain measurements) from the top displacement and the slip at the top is directly related to the given displacement at the top of the rebar link. Both specimens exhibit similar initial stiffness up to approximately 250 MPa and beyond this stress level, however, the DL specimen shows a significant reduction in stiffness, whereas the DL+H specimen maintains a significantly higher resistance to slip. This indicates that, for a given stress level (except at lower stress levels), the slip at point ‘A’ and top is substantially lower when a hook is provided, demonstrating the beneficial influence of both the development length and the hook curve on anchorage performance.
The slip values summarized in Table 2 further quantify this improvement. At the service-level stress of 400 MPa, the slip at point ‘A’ is reduced by approximately 70%, while the slip at the top is reduced by about 30%, due to the addition of the rebar hook. Moreover, when the development length and hook act together, the anchorage performance achieves a noticeably peak stress. In this study, the peak stress increased by approximately 25% when the development length and rebar hook work together, while the slip at peak load was reduced by 57% at point ‘A’ and by 18% at the top. Although the absolute peak stress varies depending on material properties, specimen size and boundary conditions, the observed trend clearly demonstrates the enhanced anchorage efficiency provided by the rebar hook. This improved performance is attributed to the additional mechanical anchorage generated by the hooked region, where concrete bearing and localized confinement contributes to resisting the pullout forces. Overall, the stress–slip behaviour confirms that the combined action of a straight development length and a rebar hook results in proper anchorage and improved deformation control capacity considerably. The findings highlight the significant contribution of the combining action of both development length and hook to both the ultimate anchorage capacity and stiffness under increasing load.
5.2. Strain Distribution
The rebar hook inner and outer strain distributions for specimens with only a development length (DL) and development length with rebar hook (DL+H) are compared in Figure 17. The strain distributions are shown at multiple strain levels up to peak loading, where strain levels of 1000 μ, 2000 μ and 3000 μ correspond approximately to stress levels of 200 MPa, 400 MPa and 600 MPa respectively. For the DL case, both inner and outer strains are almost similar and decrease uniformly along the embedment length, with relatively higher strain concentrations near the loading point and a zero strain toward the free end. In contrast, the DL+H specimen exhibits a different inner and outer strain profile along the rebar, with noticeably strain difference at the hook curve start point. Due to the presence of the hooks, the embedded end of the straight part changes from a free end to a boundary with a certain degree of constraint and the stress gradient in the straight part becomes smaller, allowing for greater force to be transmitted by bond stress. The hook section also transmits force by bond and bearing which exhibits complex bending behavior. Therefore, combined action of the development length and hook results enhanced anchorage capacity.
5.3. Concrete Stress and Internal Crack Distribution
Figure 18 compares the stress distributions in the X, Y, and Z directions together with the internal crack patterns for the two anchorage configurations: DL (straight development length) and DL+H (development length with hook). At 400 MPa, both specimens exhibit stress development and internal cracking. However, the DL+H specimen shows a less stress field across the section, while the DL specimen displays a wider stress spread along the straight bar in all three different directions. Internal cracks along rebar are already visible along the full embedded length of the DL specimen at this stress level, whereas in the DL+H specimen cracking is limited to the upper portion of the straight segment. Moreover, cone shape cracks near the surface are observed and the crack development is higher in DL specimen than DL+H specimen. This indicates that, under normal stress conditions, the presence of a hook substantially reduces damage within the anchorage zone, both in the near-surface concrete and along the rebar.
At 500 MPa, the DL specimen approaches its peak stress, developing extensive tensile stresses and a high density of cracks with larger crack widths concentrated near the top surface, ultimately leading to a splitting failure initiated at the top region with cone shape pull out behavior. In contrast, the DL+H specimen continues to mobilize anchorage resistance, exhibiting strong stress concentration around the hook with comparatively fewer cracks. At the peak load of the DL+H specimen, the hook region engages noticeably, resulting in high stress in all three different directions together with localized cracking around the hook curve part. At this stage, crack widths increase near the top surface as failure initiates at the top and propagates downward in a splitting mode. Overall, the DL+H configuration demonstrates improved stress redistribution, delayed crack propagation, and higher ultimate resistance, whereas the DL specimen undergoes earlier cracking and wider stress dispersion due to the absence of the mechanical anchorage provided by the hook.
5.4. Evaluating the Splitting Failure Mechanism
As described in Section 5.3, both specimens exhibited splitting failure. In this section, the influence of adding a hook to a straight rebar and the resulting changes in the failure mechanism are evaluated based on Figure 19. Figure 19 compares the tensile stress distributions in the Z direction together with the internal crack patterns for the two anchorage configurations, DL and DL+H. At an intermediate high stress level of approximately 450 MPa, the specimen with only a development length (DL) shows a high tensile stress concentration near the top surface. In addition, a relatively large blue region around the rebar (zero tensile stress) particularly close to the top surface is observed in the DL specimen, reflecting extensive cracking with stress release. Adjacent to this cracked zone, a region of high tensile stress develops toward the top surface. Moreover, the tensile stress field spreads more widely toward the side faces (YZ plane) in the DL specimen compared to the DL+H specimen. This difference arises from the additional anchorage provided by the hook through bond along the hook curve part and bearing action against the surrounding concrete. The initiation of internal cracks at the hook curve part in the DL+H specimen further confirms the contribution from the hook. At the peak stress, the tensile stress distributions are nearly identical for both DL+H and DL specimens, indicating that failure in both cases occurs upon reaching the maximum tensile capacity of the concrete.
6. Conclusions
This study investigated the influence of straight development length on the anchorage performance of 180-degree rebar hooks embedded in concrete including high stress level. A Three-Dimensional Rigid Body Spring Model (3D-RBSM) was developed and validated against experimental pullout tests using both the stress–slip relationship and the inner and outer rebar strains. Based on the numerical results and the discussions, the following key findings are highlighted regarding the influence of straight development length on both the anchorage behavior of rebar hooks and associated splitting failure behavior.
- 1)
- The numerical model successfully captured the pullout behavior of rebar hooks with varying straight development lengths, demonstrating good agreement with laboratory experiments. In addition, the model provided detailed insight into local concrete stress fields and internal crack evolution, enabling a clear interpretation of how development length influences the anchorage mechanism.
- 2)
- The strain distribution results of rebar hook pullout demonstrate that increasing the straight development length reduces the magnitude of both inner and outer strains in the hook region, particularly at the hook curve start point. At shorter development lengths, a large disparity exists between the inner and outer strain values, whereas this difference progressively diminishes as the development length increases. This behavior reflects enhanced bond action along the straight development length, which enables effective stress transfer before reaches the hook curvature. Therefore, stress transmitted to the hook region is reduced and resulting in a lower strain level along the rebar hook curve part. Hence, the stress and slip at the hook region are reduced, leading to increase in overall anchorage stiffness.
- 3)
- For a given stress level, specimens with shorter development lengths exhibit higher compressive stress concentration and high density of internal cracks around the hook region. In contrast, specimens with longer development lengths show more distributed compressive stress fields, indicating that a significant portion of the stress has already been transferred through bond along the development length before reaching the hook region. According to stress contours and internal crack diagrams, for short lengths, anchorage is mainly governed by bearing action at the hook region, whereas for longer lengths, the anchorage is governed by the bond deterioration along the development length and the bearing at the hook region. This behavior becomes more pronounced as the rebar stress increases when high-strength rebars are used.
- 4)
- At the splitting failure, the local stress distribution shows that increasing the development length reduces tensile stresses in the hook region. A longer straight development length forms maximum tensile stresses closer to the top surface. At the same time, prior to splitting failure, cracks have already formed around the rebar surface, leading to stress release, where the specimen with the largest development length is the most prone to fail first. As splitting failure occurs regardless of the development length, the anchorage mechanisms elucidate important insights into the use of high-strength rebars.
- 5)
- A comparative analysis of the two anchorage configurations shows that both the development length only case and the development length with hook case exhibit similar initial stiffness under low stress levels. However, when the straight development length acts in combination with the hook, stress distribution is improved and crack propagation is delayed, resulting in higher ultimate resistance, as the development of high tensile stresses toward the top surface and side faces is reduced by the presence of the hook. This result indicates that the use of rebar hooks becomes important when high-strength rebars are used and subjected to high stress levels.
Author Contributions
Conceptualization, N.A. and H.N.; methodology, N.A., H.N. and T.N.; software, N.A.; validation, N.A. and H.N.; formal analysis, N.A., H.N. and T.M.; investigation, N.A. and T.N; resources, H.N. and T.M.; data curation, N.A. and T.N.; writing—original draft preparation, N.A. and H.N.; writing—review and editing, N.A. and H.N.; visualization, N.A. and H.N.; supervision, H.N. and T.M.; project administration, H.N. and T.M.; funding acquisition, H.N. All authors have read and agreed to the published version of the manuscript.
Funding
This research was funded by JSPS KAKENHI Grant Numbers 24K00960 and is part of the Repair and Reinforcement Research Group, which is funded by a donation from the Ueda Memorial Foundation.
Data Availability Statement
Data is available from the corresponding author upon a reasonable request.
Acknowledgments
The authors would like to thank the MEXT scholarship, Japan for supporting PhD studies of N.A.
Conflicts of Interest
The authors declare no conflicts of interest.
References
- ACI, Building Code for Structural Concrete—Code Requirements and Commentary (ACI CODE-318-25), American Concrete Institute, 3880 Country Club Drive, Farmington Hills, Michigan 48331., 2025.
- BS, Scheduling, dimensioning, cutting and bending of steel reinforcement for concrete specification (BS-8666-2020), 2020.
- CEB-FIP, fib Bulletin 65, Model Code 2010 - Final draft volume 1, Case Postale 88, CH-1015 Lausanne, Switzerland., 2012.
- Eurocode 2, Eurocode 2 - Design of concrete structures (BS EN 1992-1-1: 2023), 2023.
- JASS, Japanese Architectural Standard Specification for Reinforced Concrete Work (JASS-RC Standard-2018), 2-19, Ginza 3 Chome, Tokyo, Japan., 2018.
- JSCE, Standard specifications for concrete structure design (JSCE-2022), Yotsuya 1-Chome, Shinjuku-Ku, Tokyo, Japan., 2022.
- A. Ajaam, D. Darwin, and M. O’Reilly, “Anchorage strength of reinforcing bars with standard hooks,” Structural Engineering and Engineering Materials. SM Report, no. 125, p. 372, 2017.
- J. Sperry et al., “Conventional and High-Strength Hooked Bars—Part 1: Anchorage Tests,” ACI Structural Journal, vol. 114, no. 1, Jan. 2016. [CrossRef]
- K.-P. Zhou, W.-J. Yi, F. Yi, J.-M. Sun, Y. Huang, and W.-X. Zhang, “Experimental study on anchorage performance and mechanism of hooked bars with a pre-yield anchorage failure,” Structures, vol. 57, p. 105067, Nov. 2023. [CrossRef]
- L.-L. Yuan, Y.-Z. Yang, B.-C. Sun, and W.-J. Zhao, “Anchorage behavior of large shear reinforcements with anchor heads and 180-degree hooks,” Structures, vol. 44, pp. 647–664, Oct. 2022. [CrossRef]
- ACI 318-19, Building Code Requirements for Structural Concrete (ACI 318M–19) and Commentary, Farmington Hills, MI: American Concrete Institute., 2019.
- H.-J. Hwang, H.-G. Park, and W.-J. Yi, “Development length of compression reinforcing bar based on nonuniform bond stress distribution,” ACI Structural Journal, vol. 115, no. 6, pp. 1695–2A, 2018.
- C. R. Rossi, D. R. Oliveira, M. S. Picanço, B. B. Pompeu Neto, and A. M. Oliveira, “Development length and bond behavior of steel bars in steel fiber–reinforced concrete in flexural test,” Journal of Materials in Civil Engineering, vol. 32, no. 1, p. 04019333, 2020. [CrossRef]
- E. Cosenza, G. Manfredi, and R. Realfonzo, “Development length of FRP straight rebars,” Composites Part B: Engineering, vol. 33, no. 7, pp. 493–504, Oct. 2002. [CrossRef]
- M. A. Saleem, A. Mirmiran, J. Xia, and K. Mackie, “Development length of high-strength steel rebar in ultrahigh performance concrete,” Journal of Materials in Civil Engineering, vol. 25, no. 8, pp. 991–998, 2013.
- H.-J. Hwang, H.-G. Park, and W.-J. Yi, “Nonuniform bond stress distribution model for evaluation of bar development length,” ACI Structural Journal, vol. 114, no. 4, p. 839, 2017.
- H.-J. Hwang, H.-G. Park, and W.-J. Yi, “Development Length of Standard Hooked Bar Based on Non-Uniform Bond Stress Distribution,” SJ, vol. 114, no. 6, pp. 1637–1649, Nov. 2017. [CrossRef]
- J. Sperry et al., “Anchorage of high-strength reinforcing bars with standard hooks,” The University of Kansas Center for Research, Inc., 2015.
- J. Sperry, D. Darwin, M. O’Reilly, and R. D. Lequesne, “Anchorage strength of conventional and high-strength hooked bars in concrete,” University of Kansas Center for Research, Inc., 2015.
- V. Afroughsabet, L. Biolzi, and T. Ozbakkaloglu, “High-performance fiber-reinforced concrete: a review,” Journal of materials science, vol. 51, no. 14, pp. 6517–6551, 2016.
- N. Abeygunawardana, H. Nakamura, T. Miura, and T. Nakashima, “Numerical investigation of anchorage mechanism of rebar hook using 3D-RBSM.pdf,” in Resilient Concrete Structures, Christchurch, New Zealand, 2024, pp. 1950–1960.
- D. Mori, T. Nakashima, H. Nakamura, and T. Miura, “Numerical evaluation of the behavior of lap joints with hooks at the ends,” Annual Proceedings of the Concrete Engineering Society, vol. Vol.44, pp. 829–834, 2022 (in Japanese).
- T. Kawai, “New discrete models and their application to seismic response analysis of structures,” Nuclear Engineering and Design, vol. 48, no. 1, pp. 207–229, Jun. 1978. [CrossRef]
- J. E. Bolander, J. Eliáš, G. Cusatis, and K. Nagai, “Discrete mechanical models of concrete fracture,” Engineering Fracture Mechanics, vol. 257, p. 108030, Nov. 2021. [CrossRef]
- U. Farooq, H. Nakamura, T. Miura, and Y. Yamamoto, “Proposal of bond behavior simulation model by using discretized voronoi mesh for concrete and beam element for reinforcement,” Cement and Concrete Composites, vol. 110, Jul. 2020. [CrossRef]
- Y. H. Gedik, H. Nakamura, Y. Yamamoto, and M. Kunieda, “Evaluation of three-dimensional effects in short deep beams using a rigid-body-spring-model,” 2011. [CrossRef]
- H. Nakamura, Yamamoto, N. Ueda, and M.Kunieda, “Crack Propagation Analysis Using Rigid Body Spring Method with Voronoi Diagram,” 2nd Workshop on Control of cracking in R.C. structures, 2011.
- K. Nagai, Y. Sato, and T. Ueda, “Mesoscopic Simulation of Failure of Mortar and Concrete by 3D RBSM,” vol. 3, no. 3, 2005.
- K. Nagai, Y. Sato, and T. Ueda, “Mesoscopic Simulation of Failure of Mortar and Concrete by 2D RBSM,” vol. 2, no. 3, 2004.
- Y. Yamamoto, H. Nakamura, I. Kuroda, and N. Furuya, “Crack propagation analysis of reinforced concrete wall under cyclic loading using RBSM,” European Journal of Environmental and Civil Engineering, vol. 18, no. 7, pp. 780–792, Aug. 2014. [CrossRef]
- M. Abdullah, H. Nakamura, and T. Miura, “A numerical evaluation on the effect of vertical stirrup legs to shear failure behavior in RC beams based on 3D RBSM,” Engineering Structures, vol. 343, p. 121268, 2025.
- Yamamoto Y., Nakamura H., Kuroda I., and Furuya N., “ANALYSIS OF COMPRESSION FAILURE OF CONCRETE BY THREE DIMENSIONAL RIGID BODY SPRING MODEL,” JSCE JOURNAL OF MATERIALS, CONCRETE STRUCTURES AND PAVEMENTS, vol. 64, no. 4, pp. 612–630, 2008. [CrossRef]
- H. Shima, “Micro and macro models for bond behavior in reinforced concrete,” Jr. of the Faculty of Eng., the Univ. of Tokyo, 1986.
- U. Farooq, H. Nakamura, and T. Miura, “Bond behavior evaluation of deformed rebar dependent on lateral pressure confinement including various structural parameters,” Cement and Concrete Composites, vol. 119, May 2021. [CrossRef]
Figure 1.
Overview of the specimens. (a) Side view. (b) Front view.
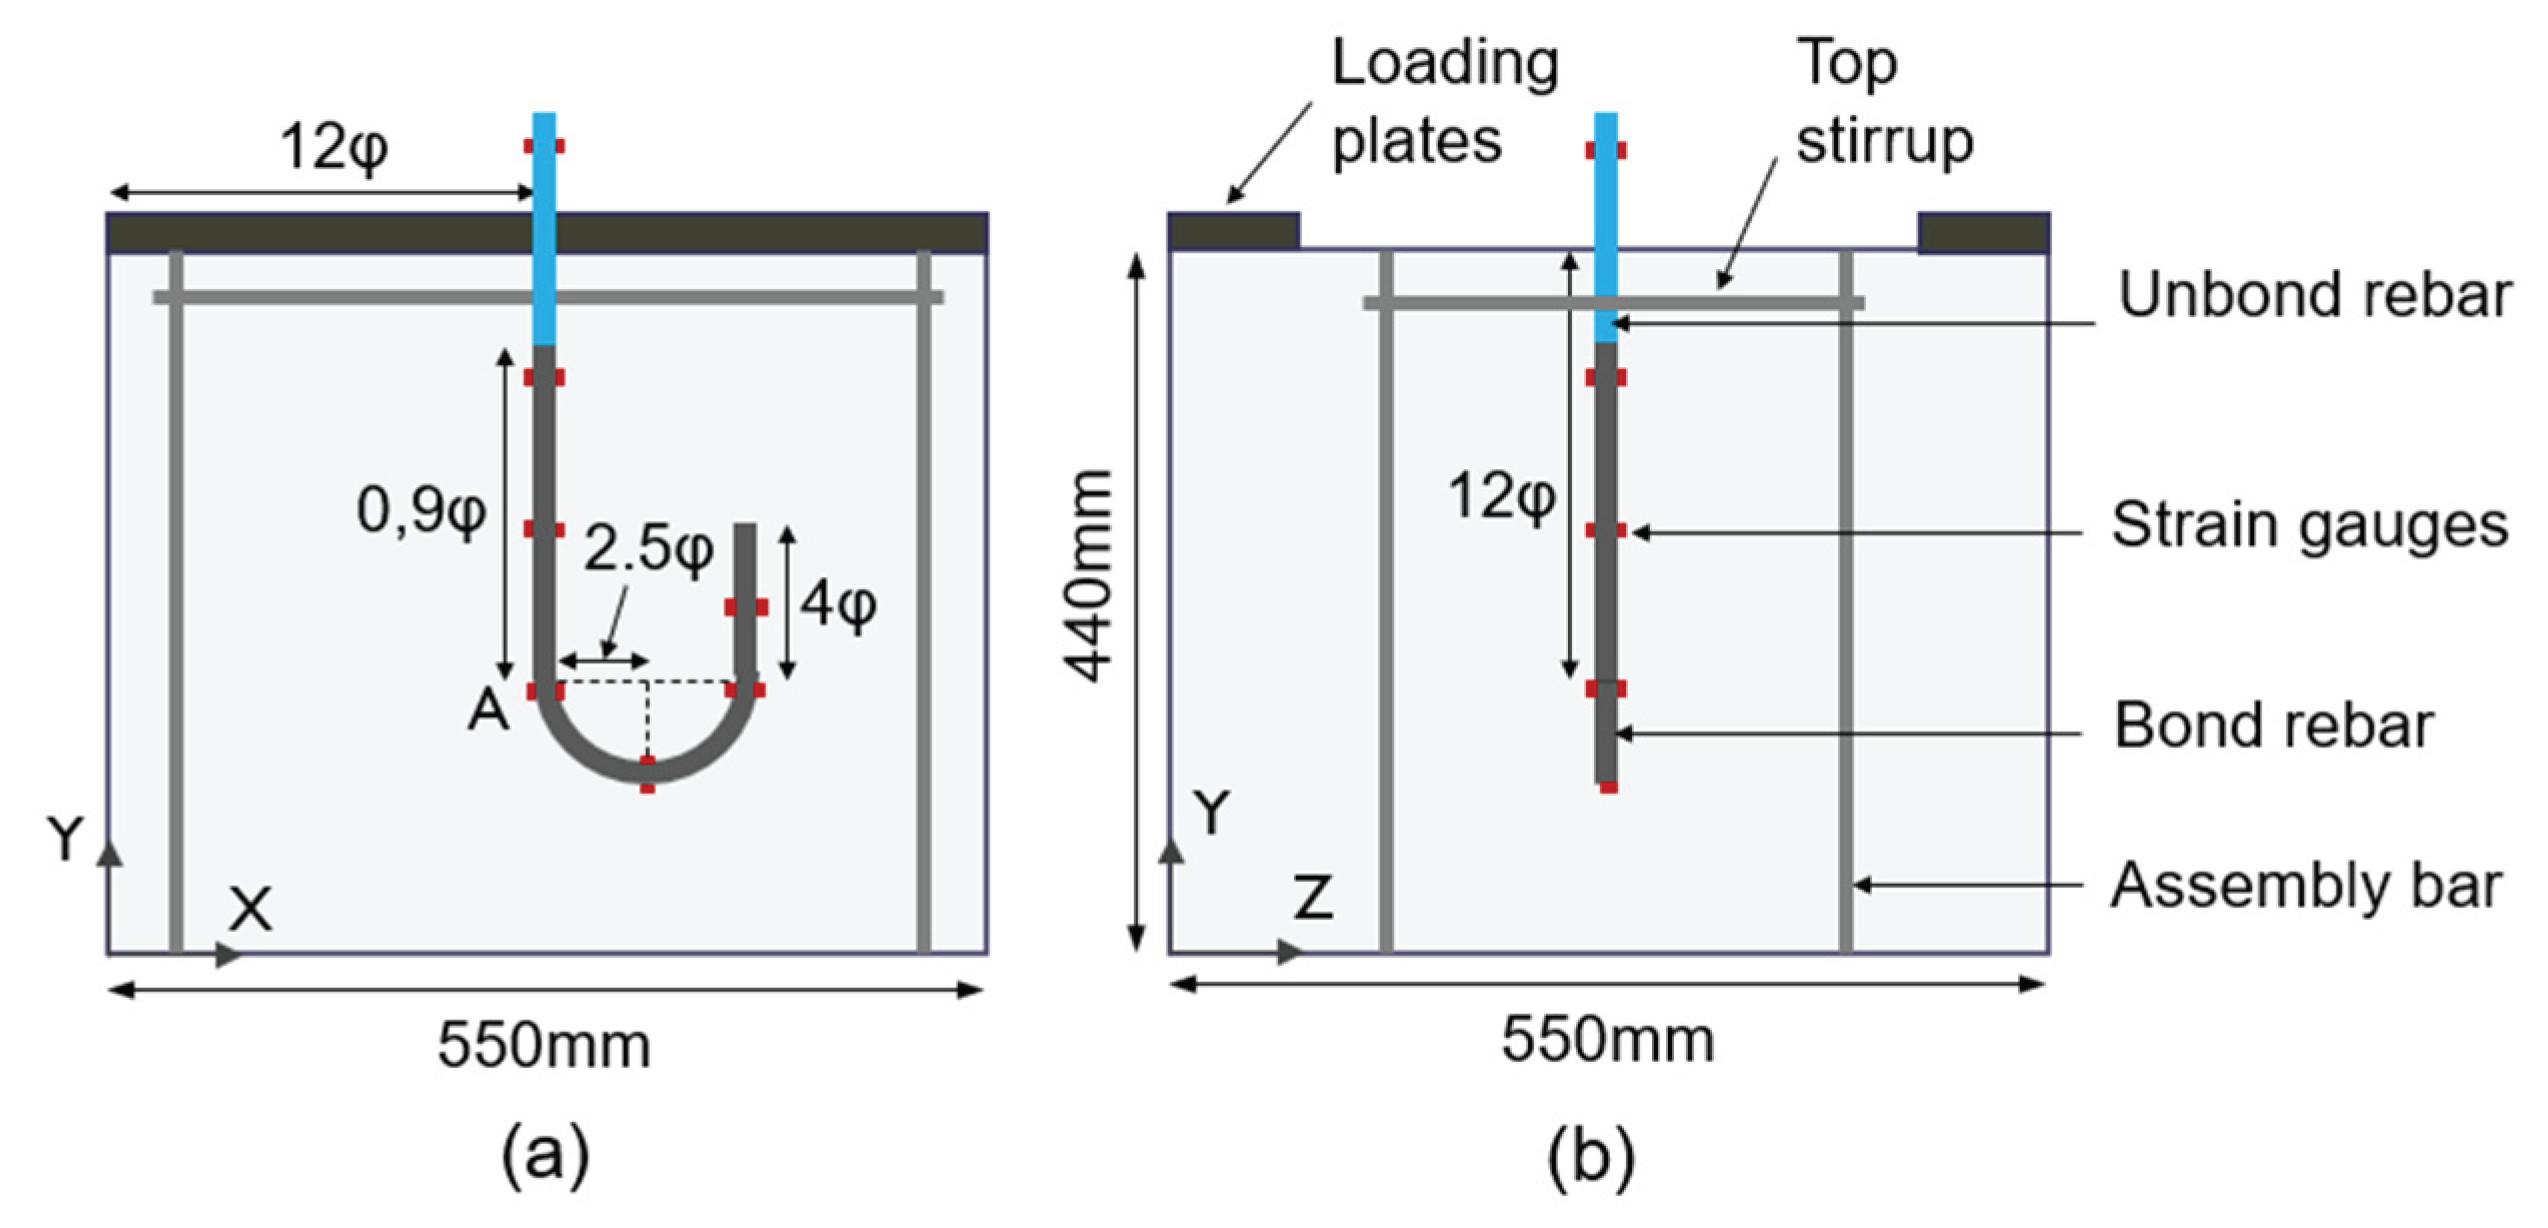
Figure 2.
Experimental setup. (a) Schematic front view. (b) Schematic side view. (c) Actual setup.
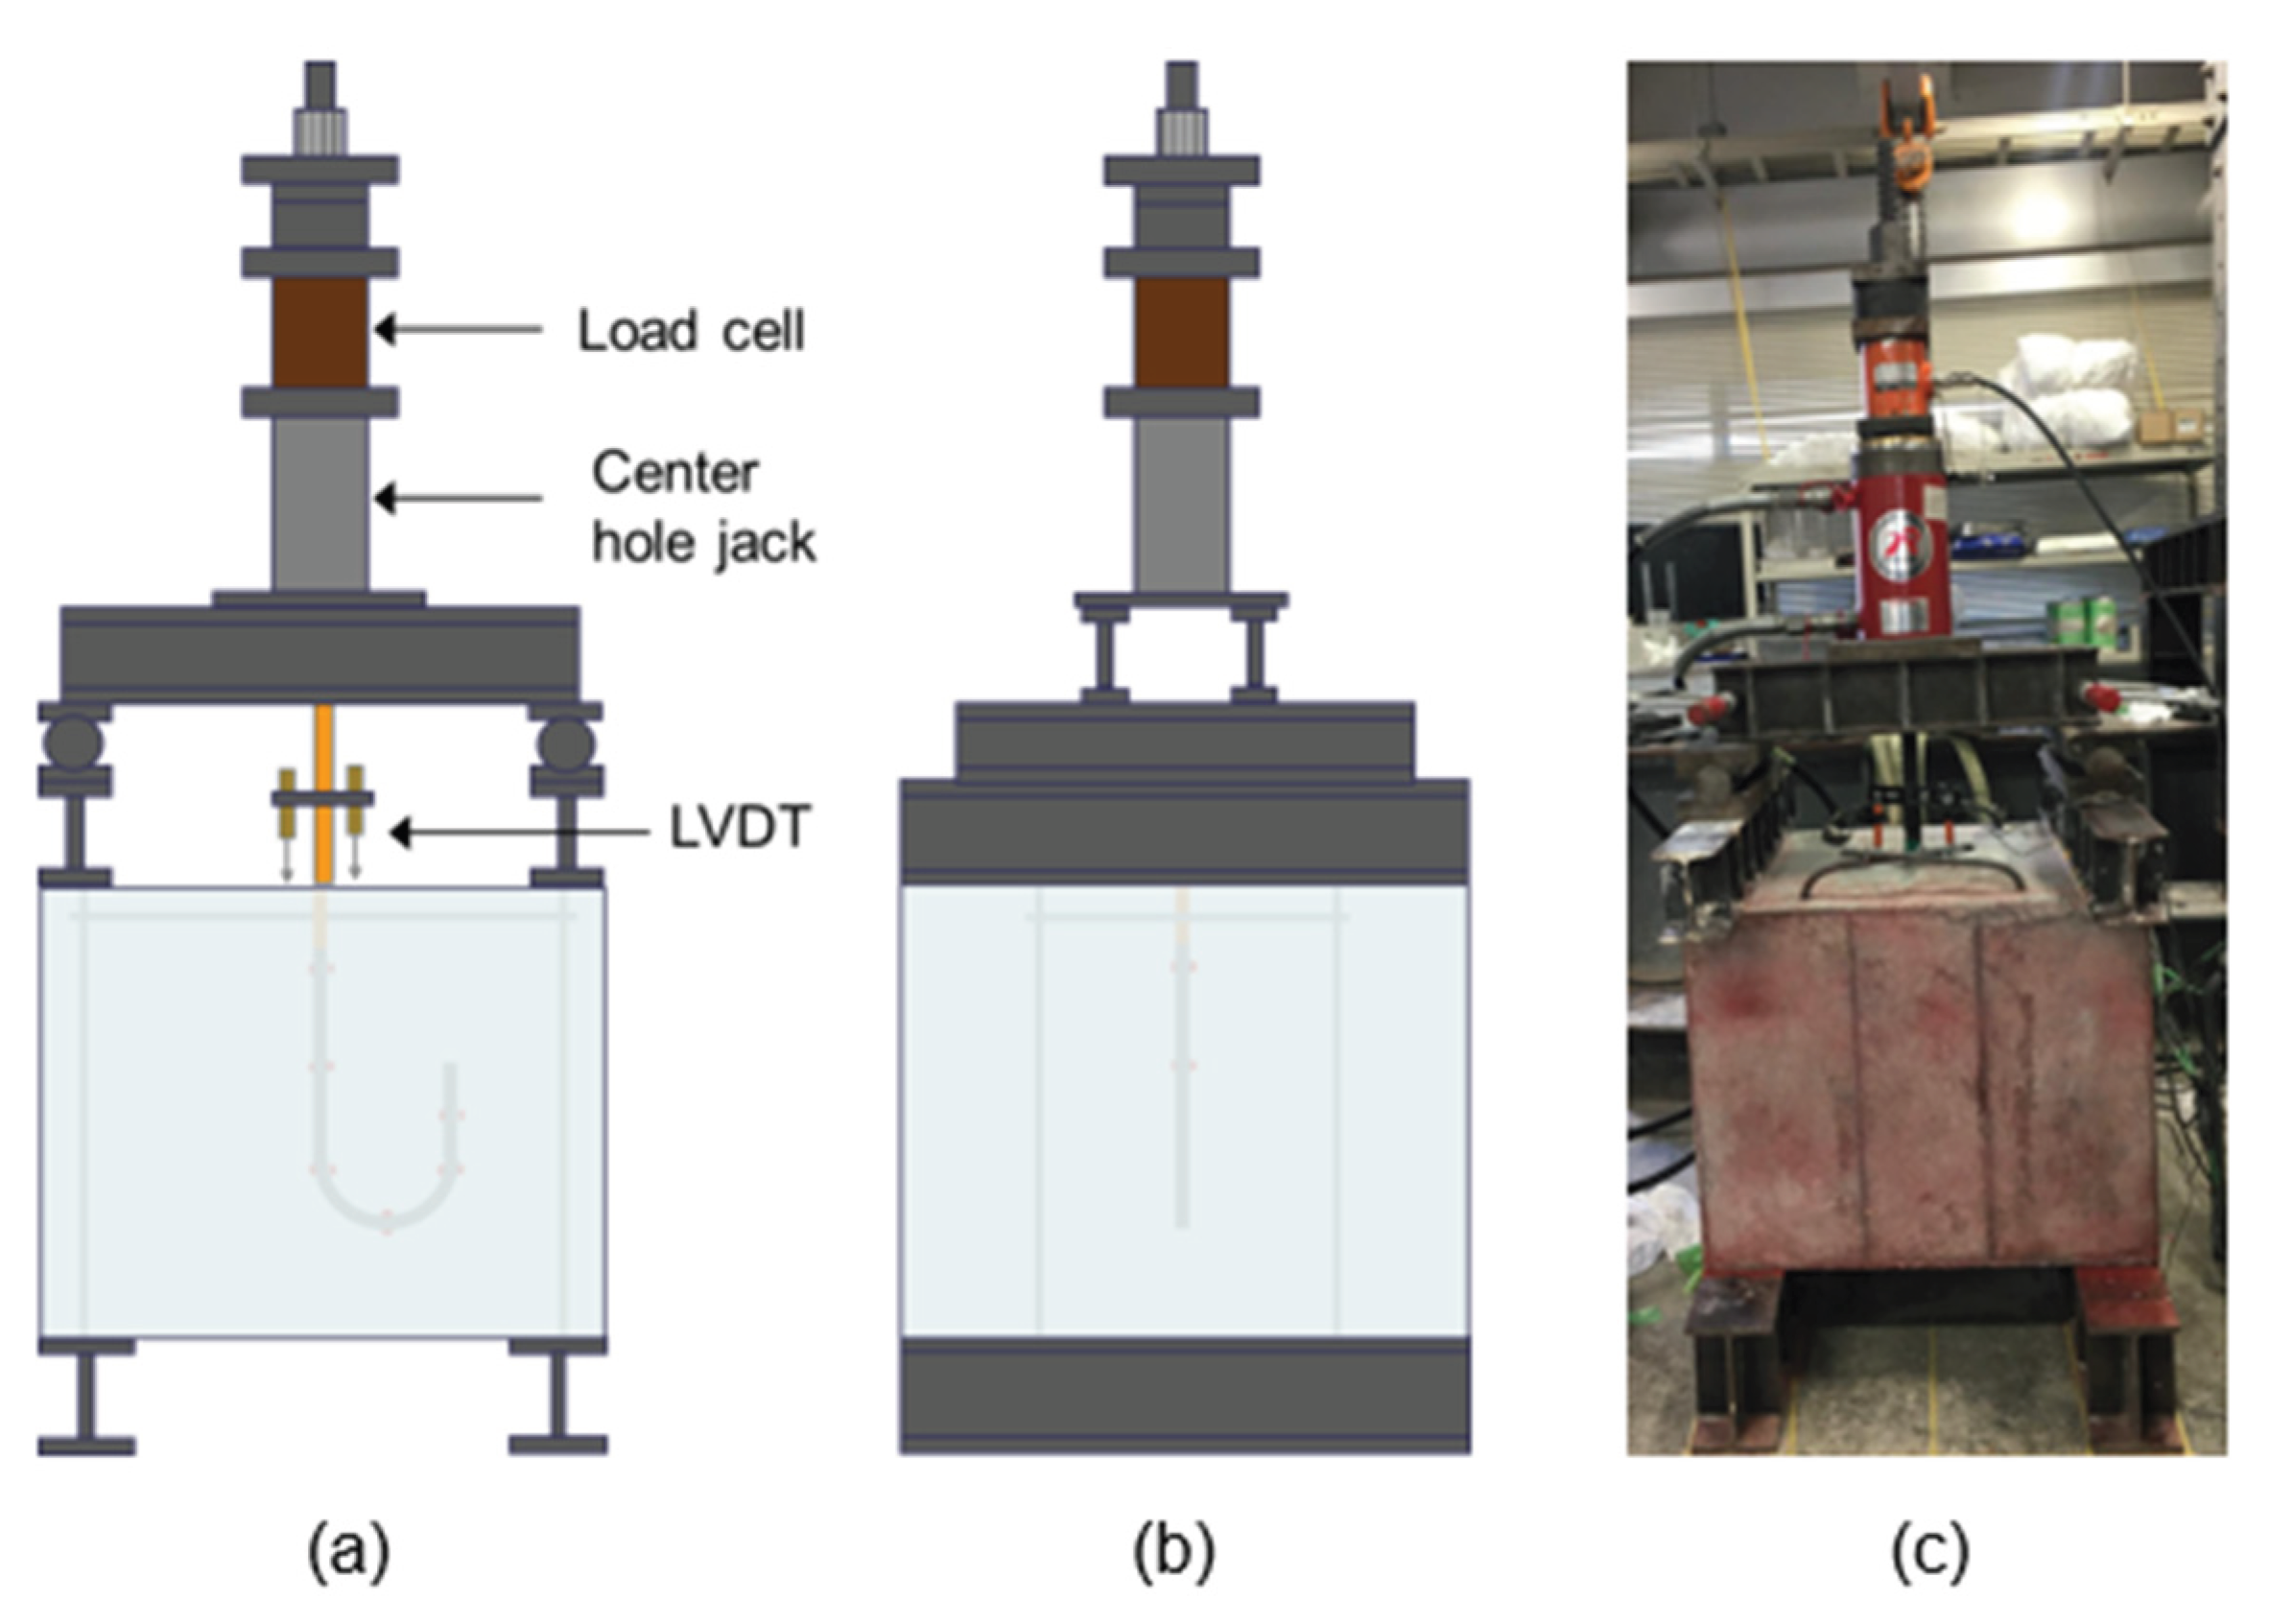
Figure 3.
Concrete model.
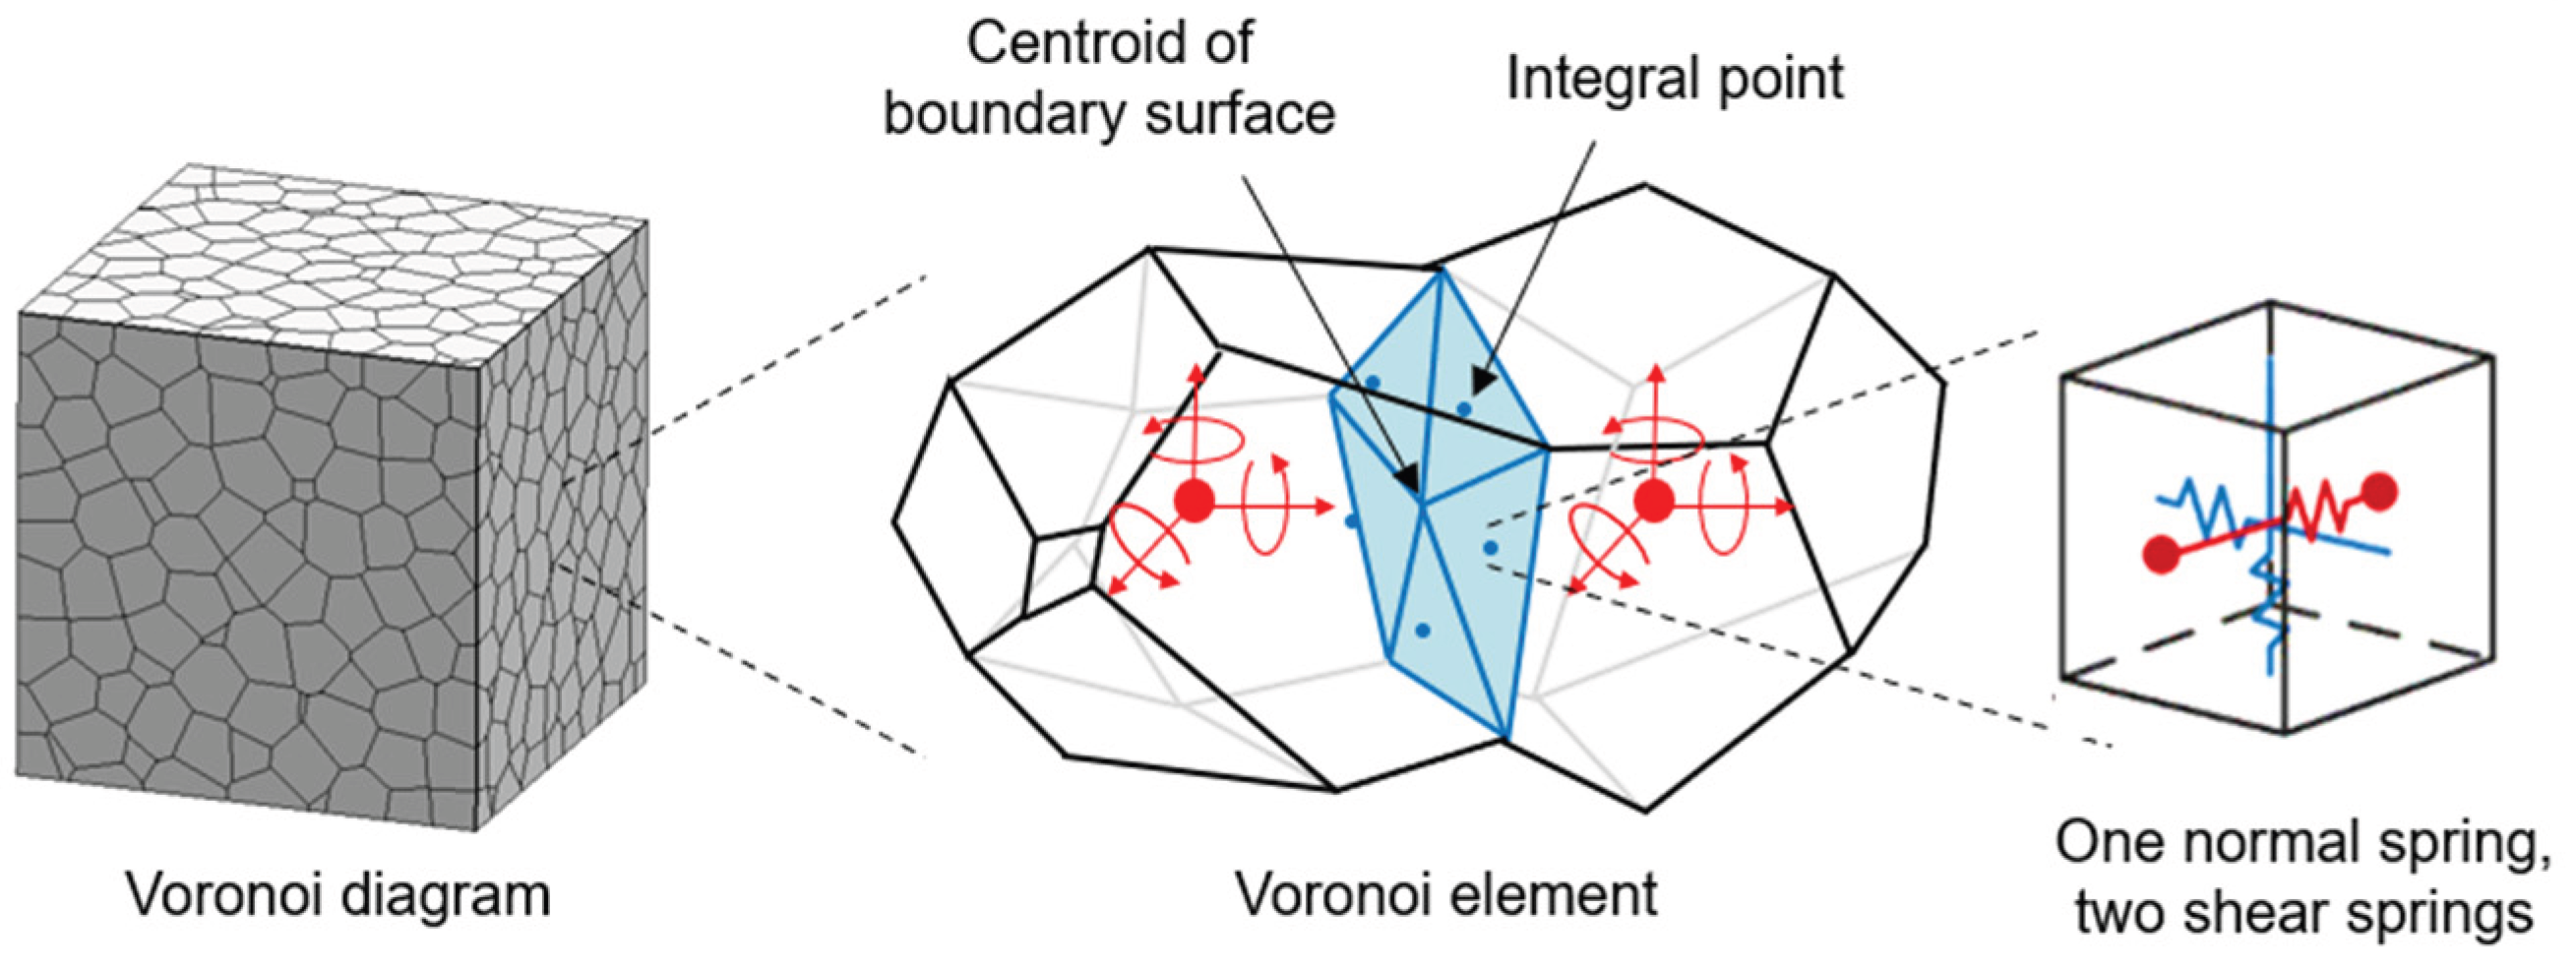
Figure 4.
Constitutive model for concrete. (a) Compression model of normal spring. (b) Tension model of normal spring. (c) Shear spring model. (d) Softening coefficient for shear spring. (e) Mohr-coulomb criterion.
Figure 4.
Constitutive model for concrete. (a) Compression model of normal spring. (b) Tension model of normal spring. (c) Shear spring model. (d) Softening coefficient for shear spring. (e) Mohr-coulomb criterion.
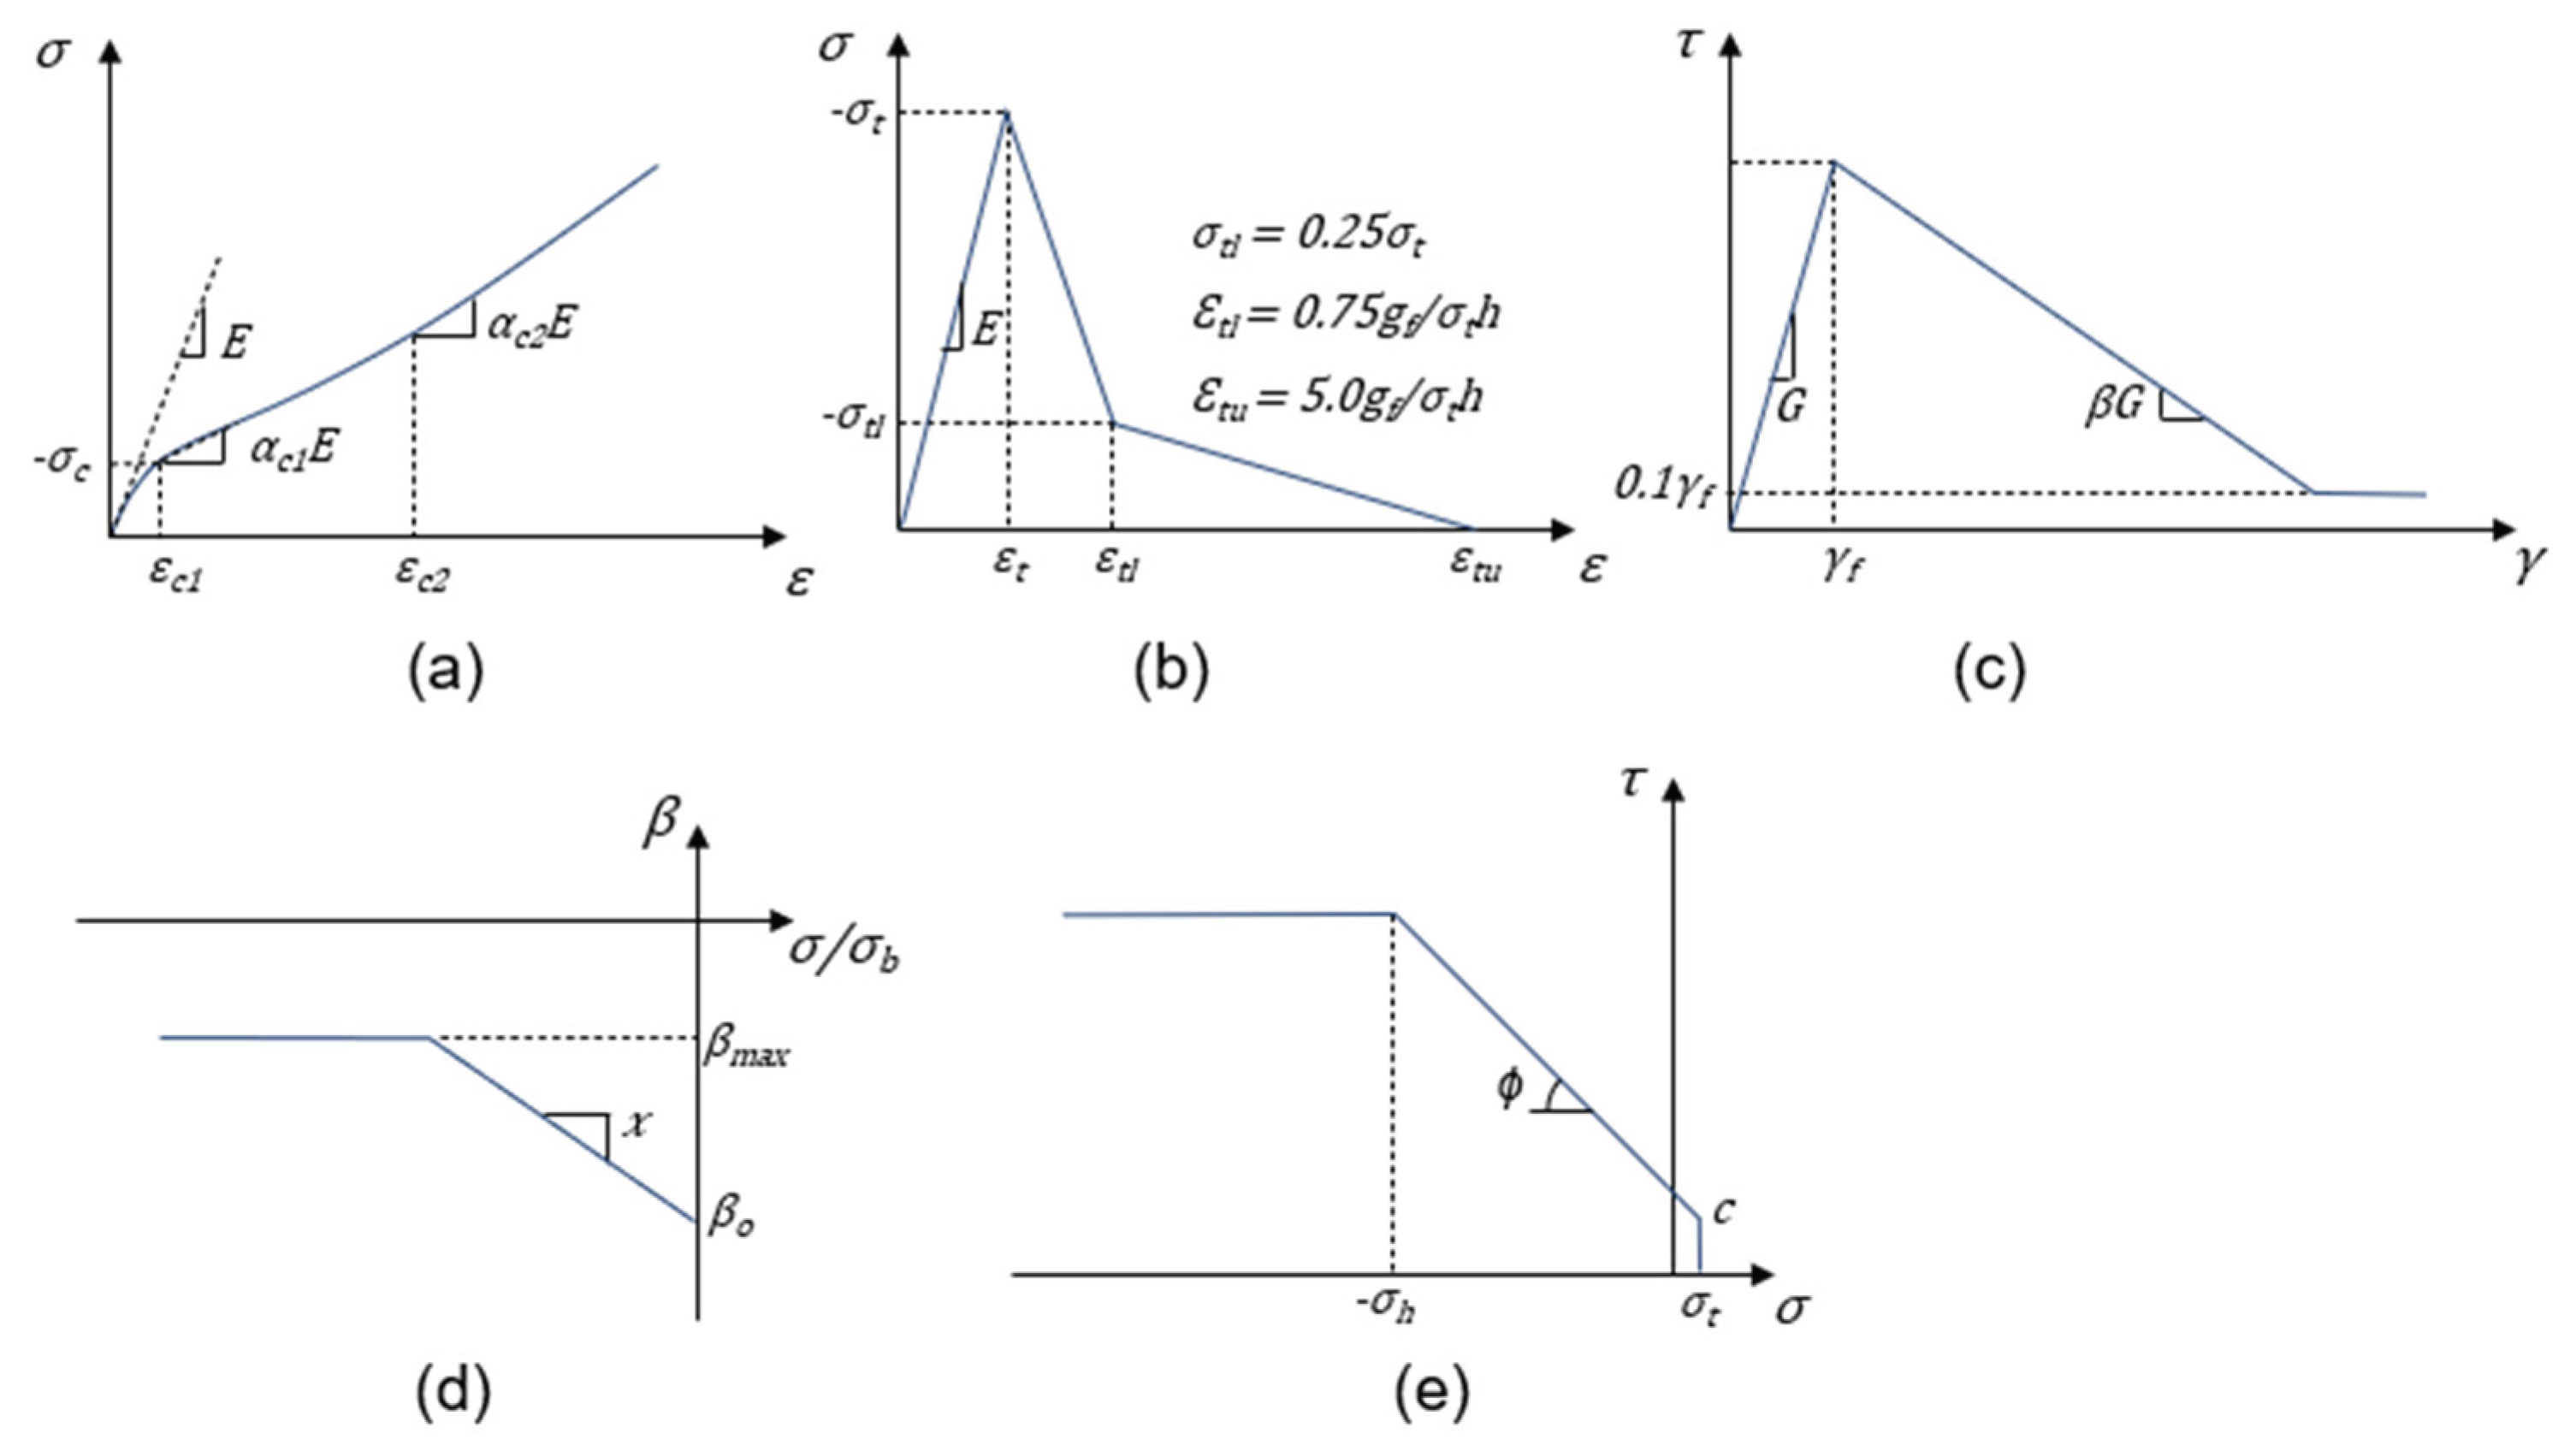
Figure 5.
Rebar model. (a) Beam element and fiber arrangement. (b) Stress-strain relationship [33] (c) Local bond model [25].
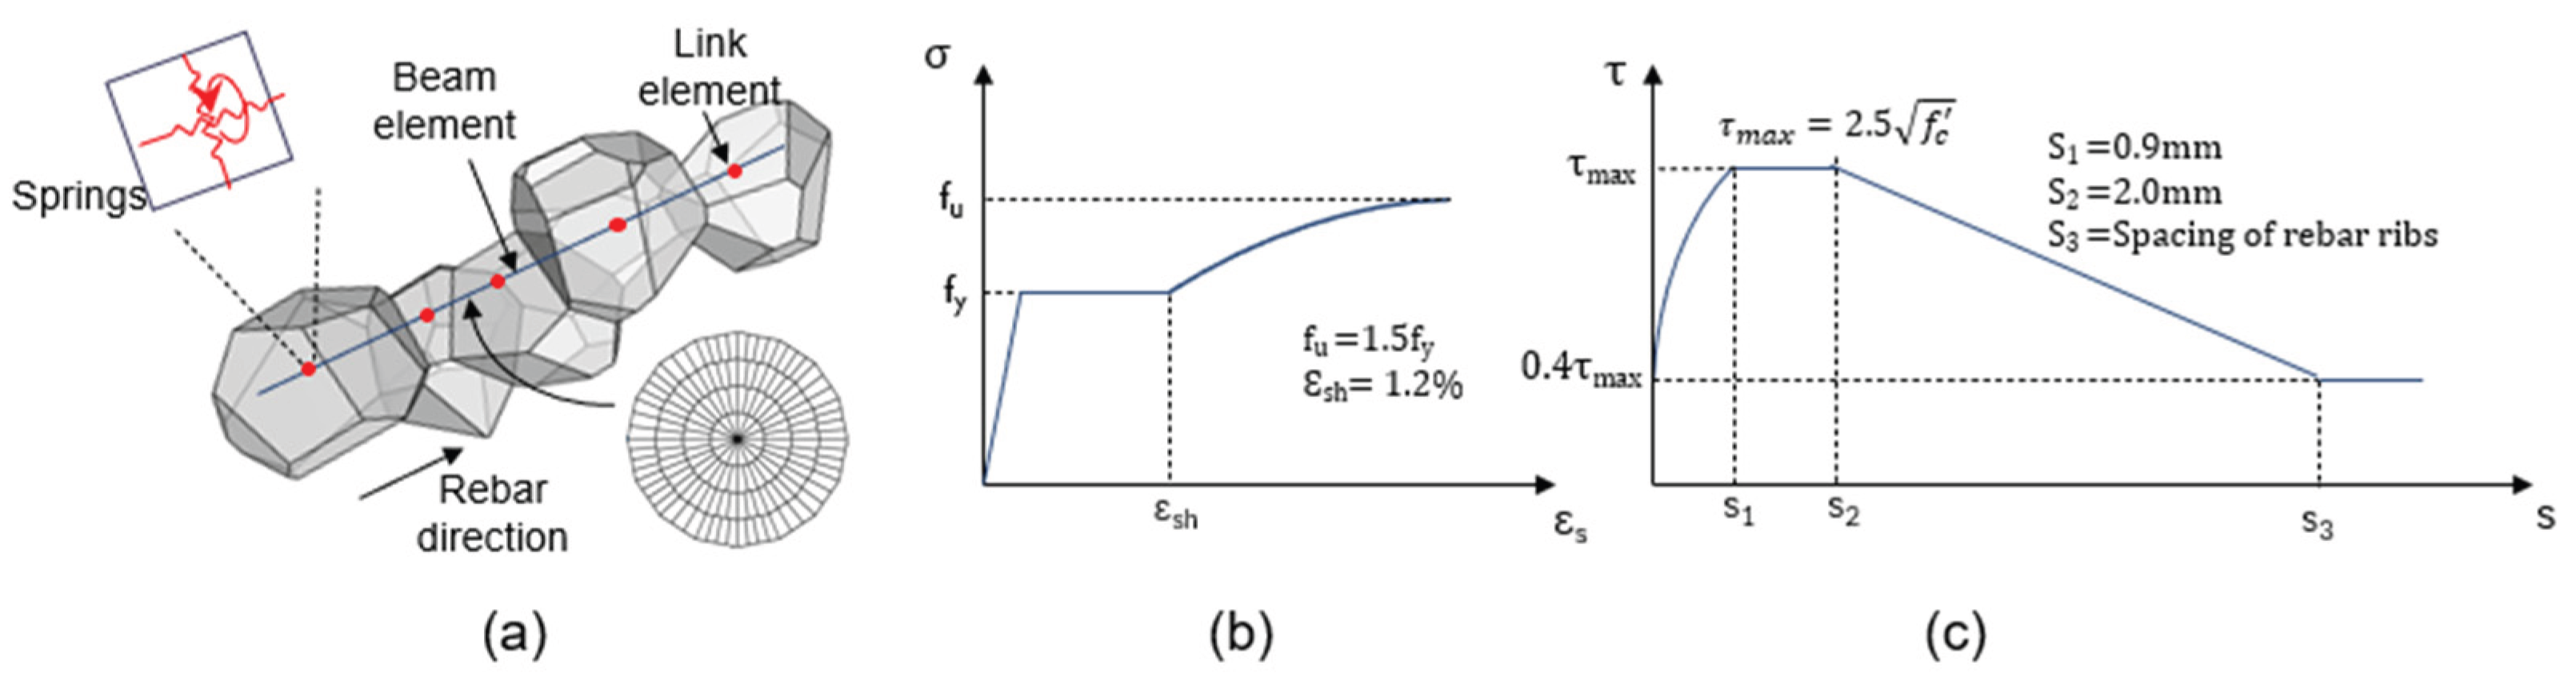
Figure 6.
Numerical model of the tested specimen (DL9). (a) 3D Voronoi mesh diagram. (b) Rebar arrangement.
Figure 6.
Numerical model of the tested specimen (DL9). (a) 3D Voronoi mesh diagram. (b) Rebar arrangement.
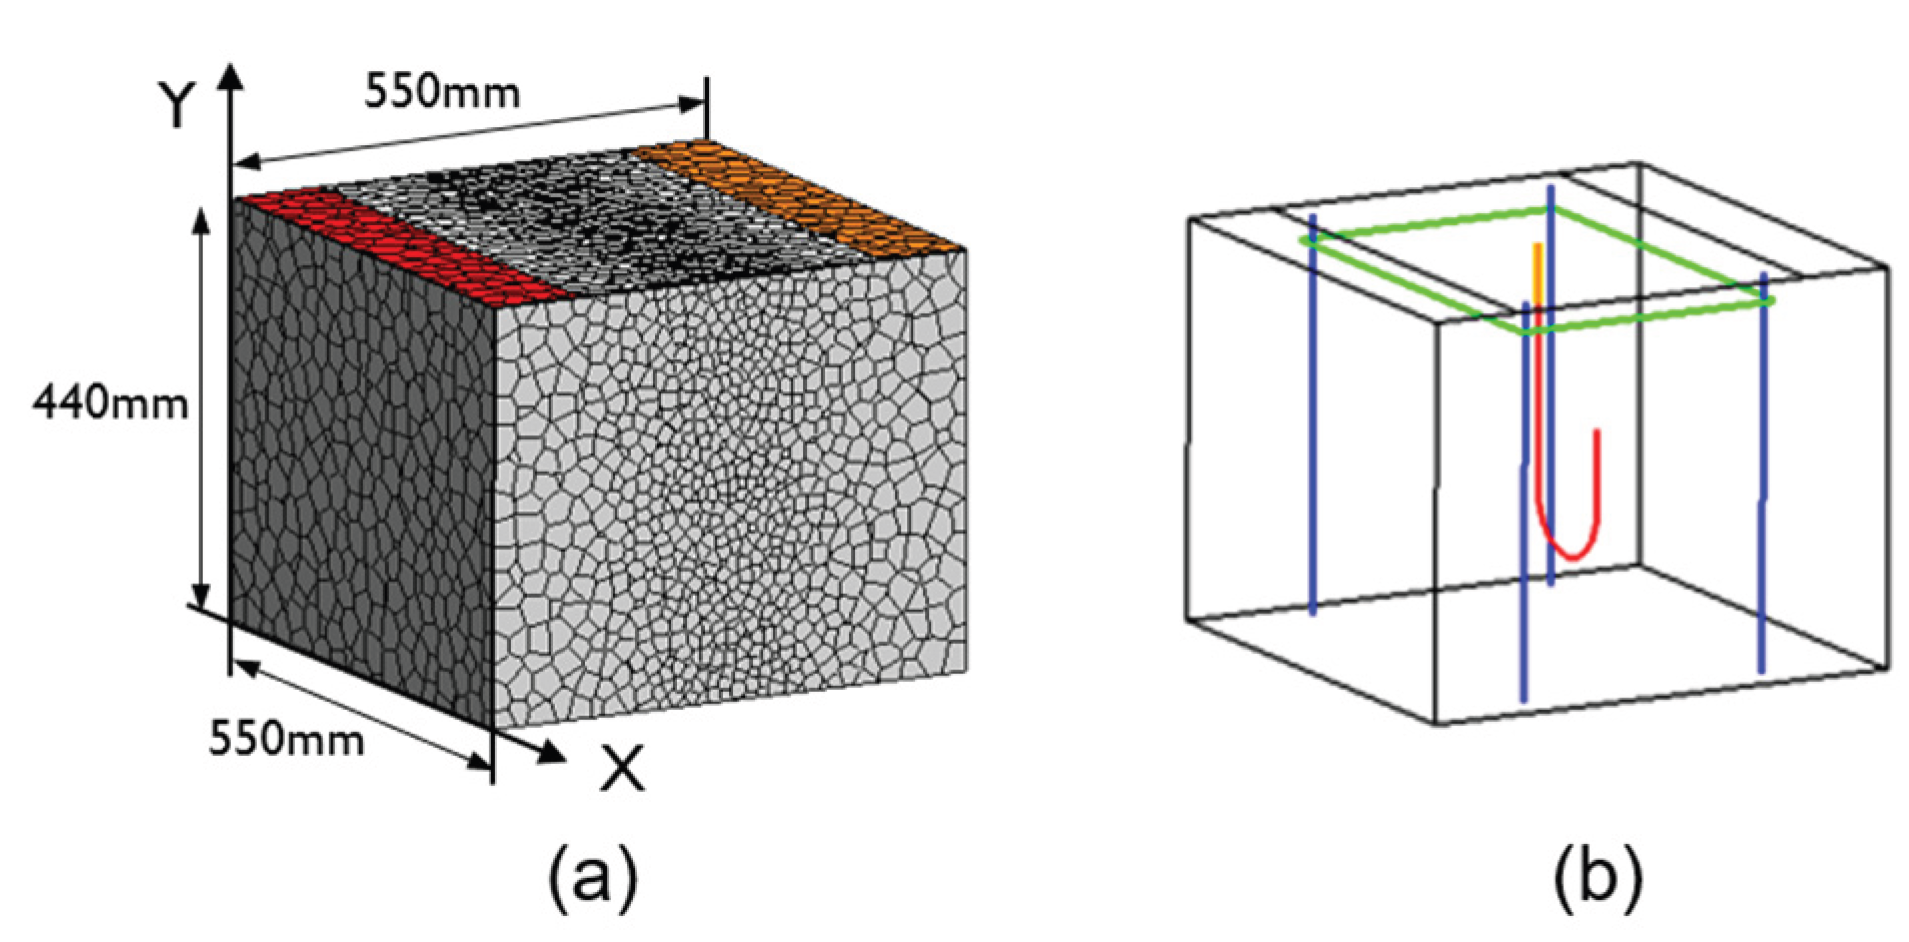
Figure 7.
Stress-slip curves for both experiment and numerical models.
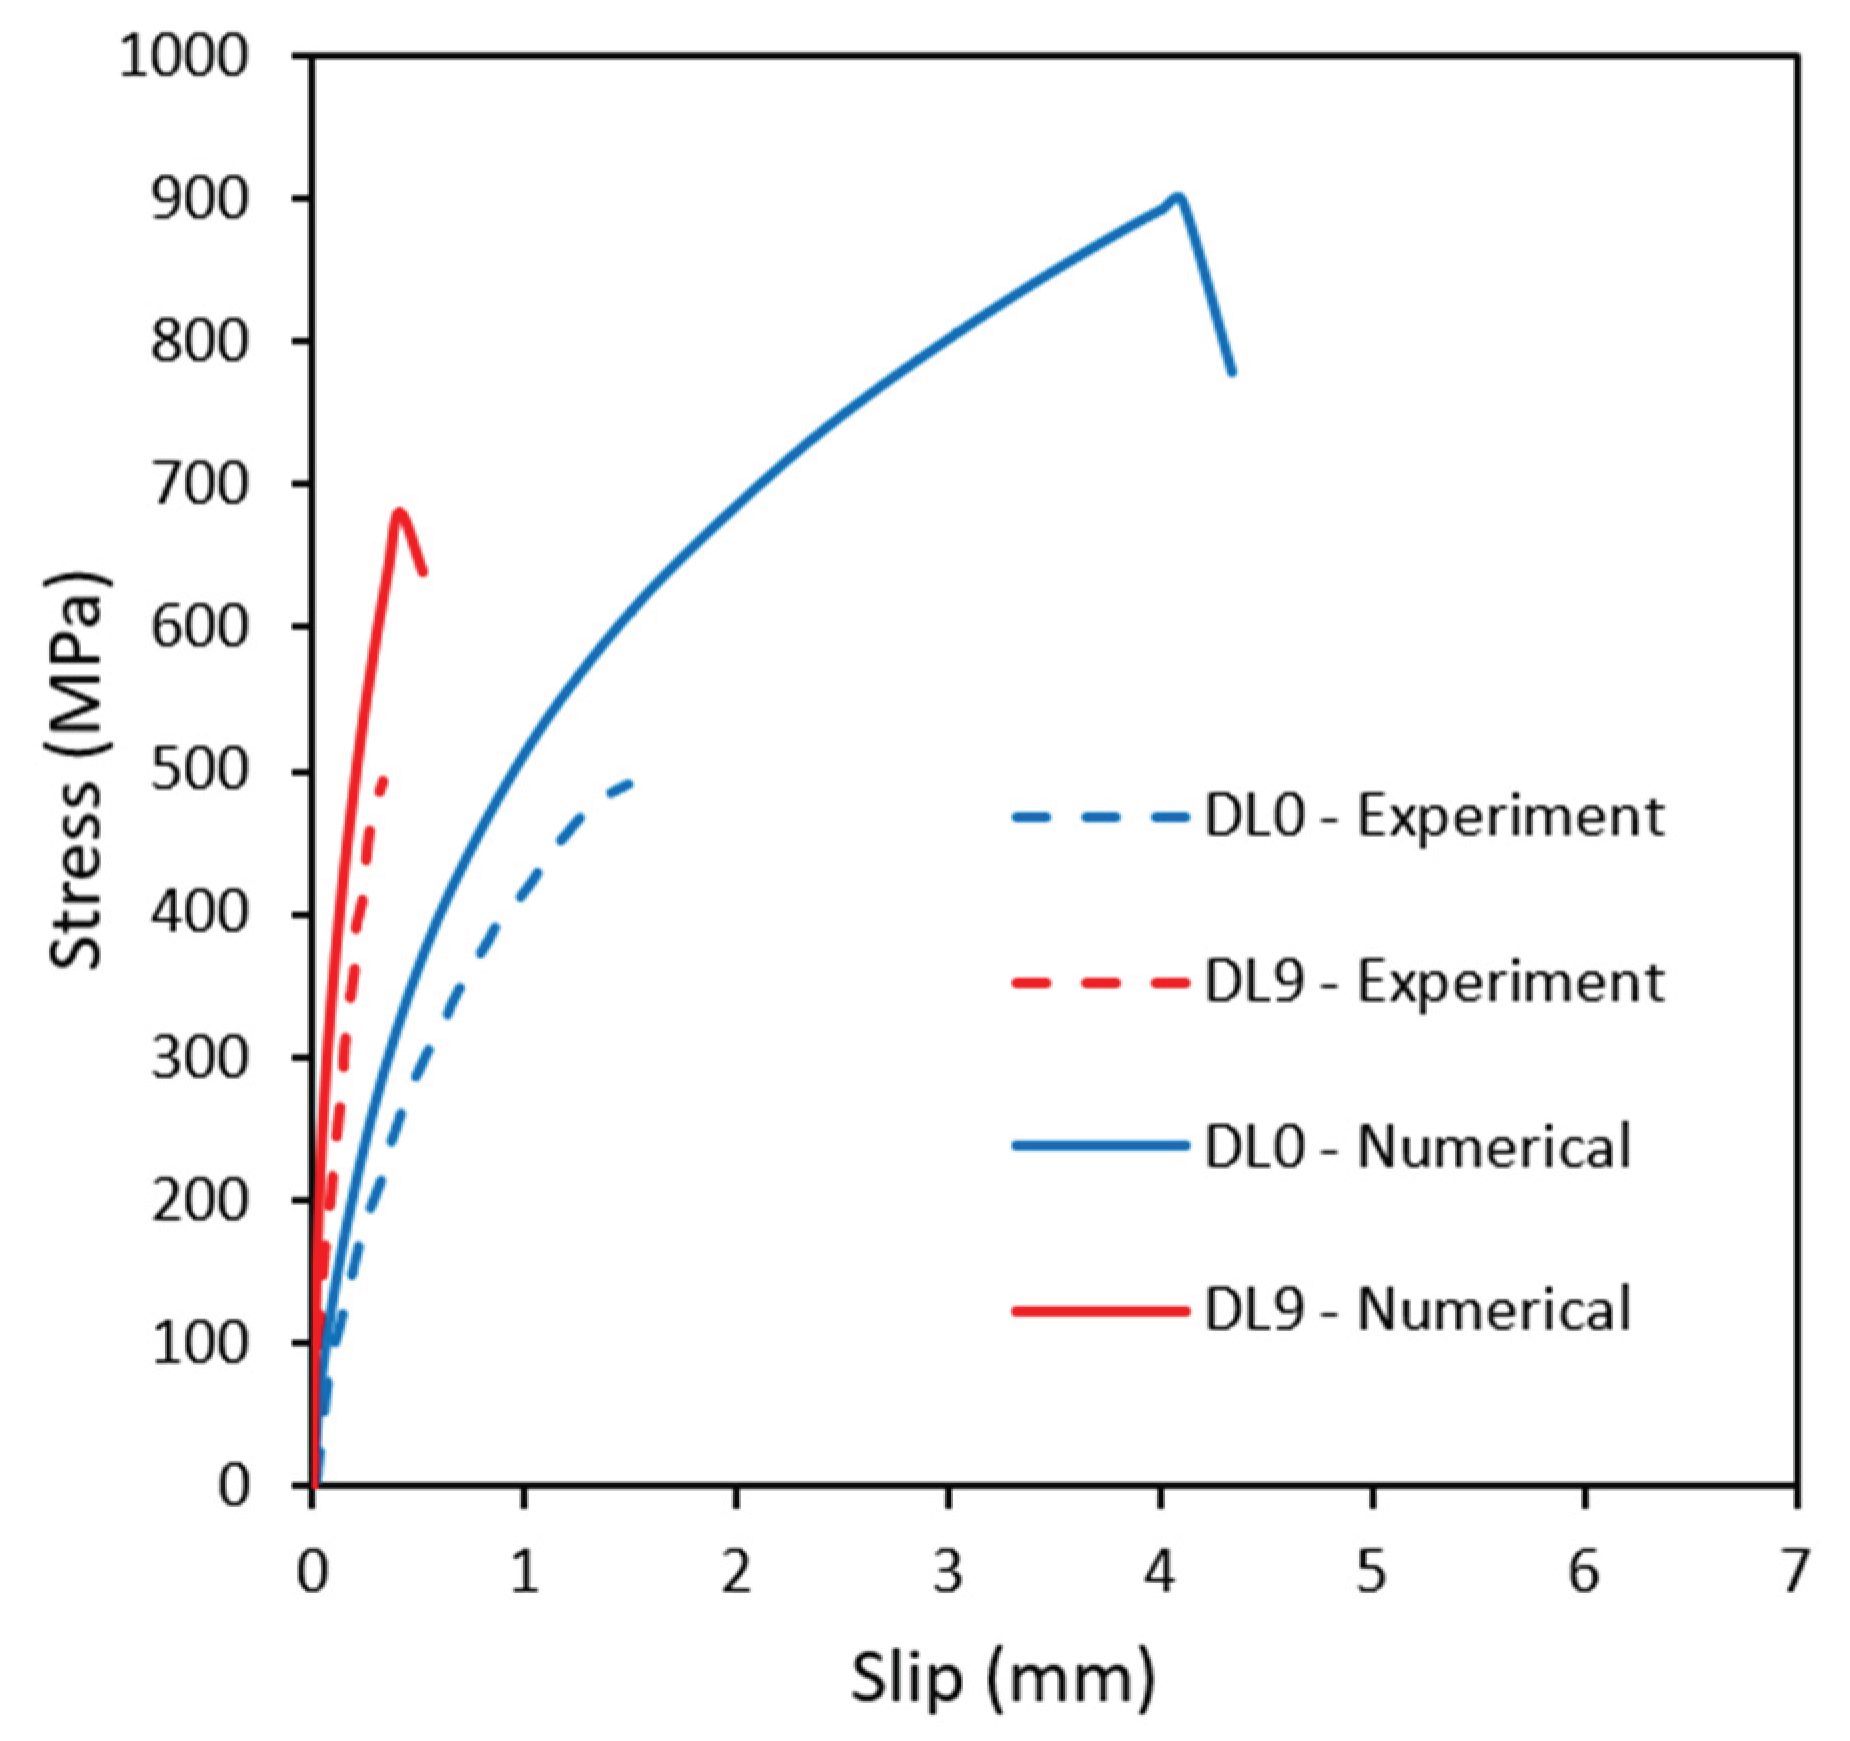
Figure 8.
Rebar hook inner and outer strain distributions.
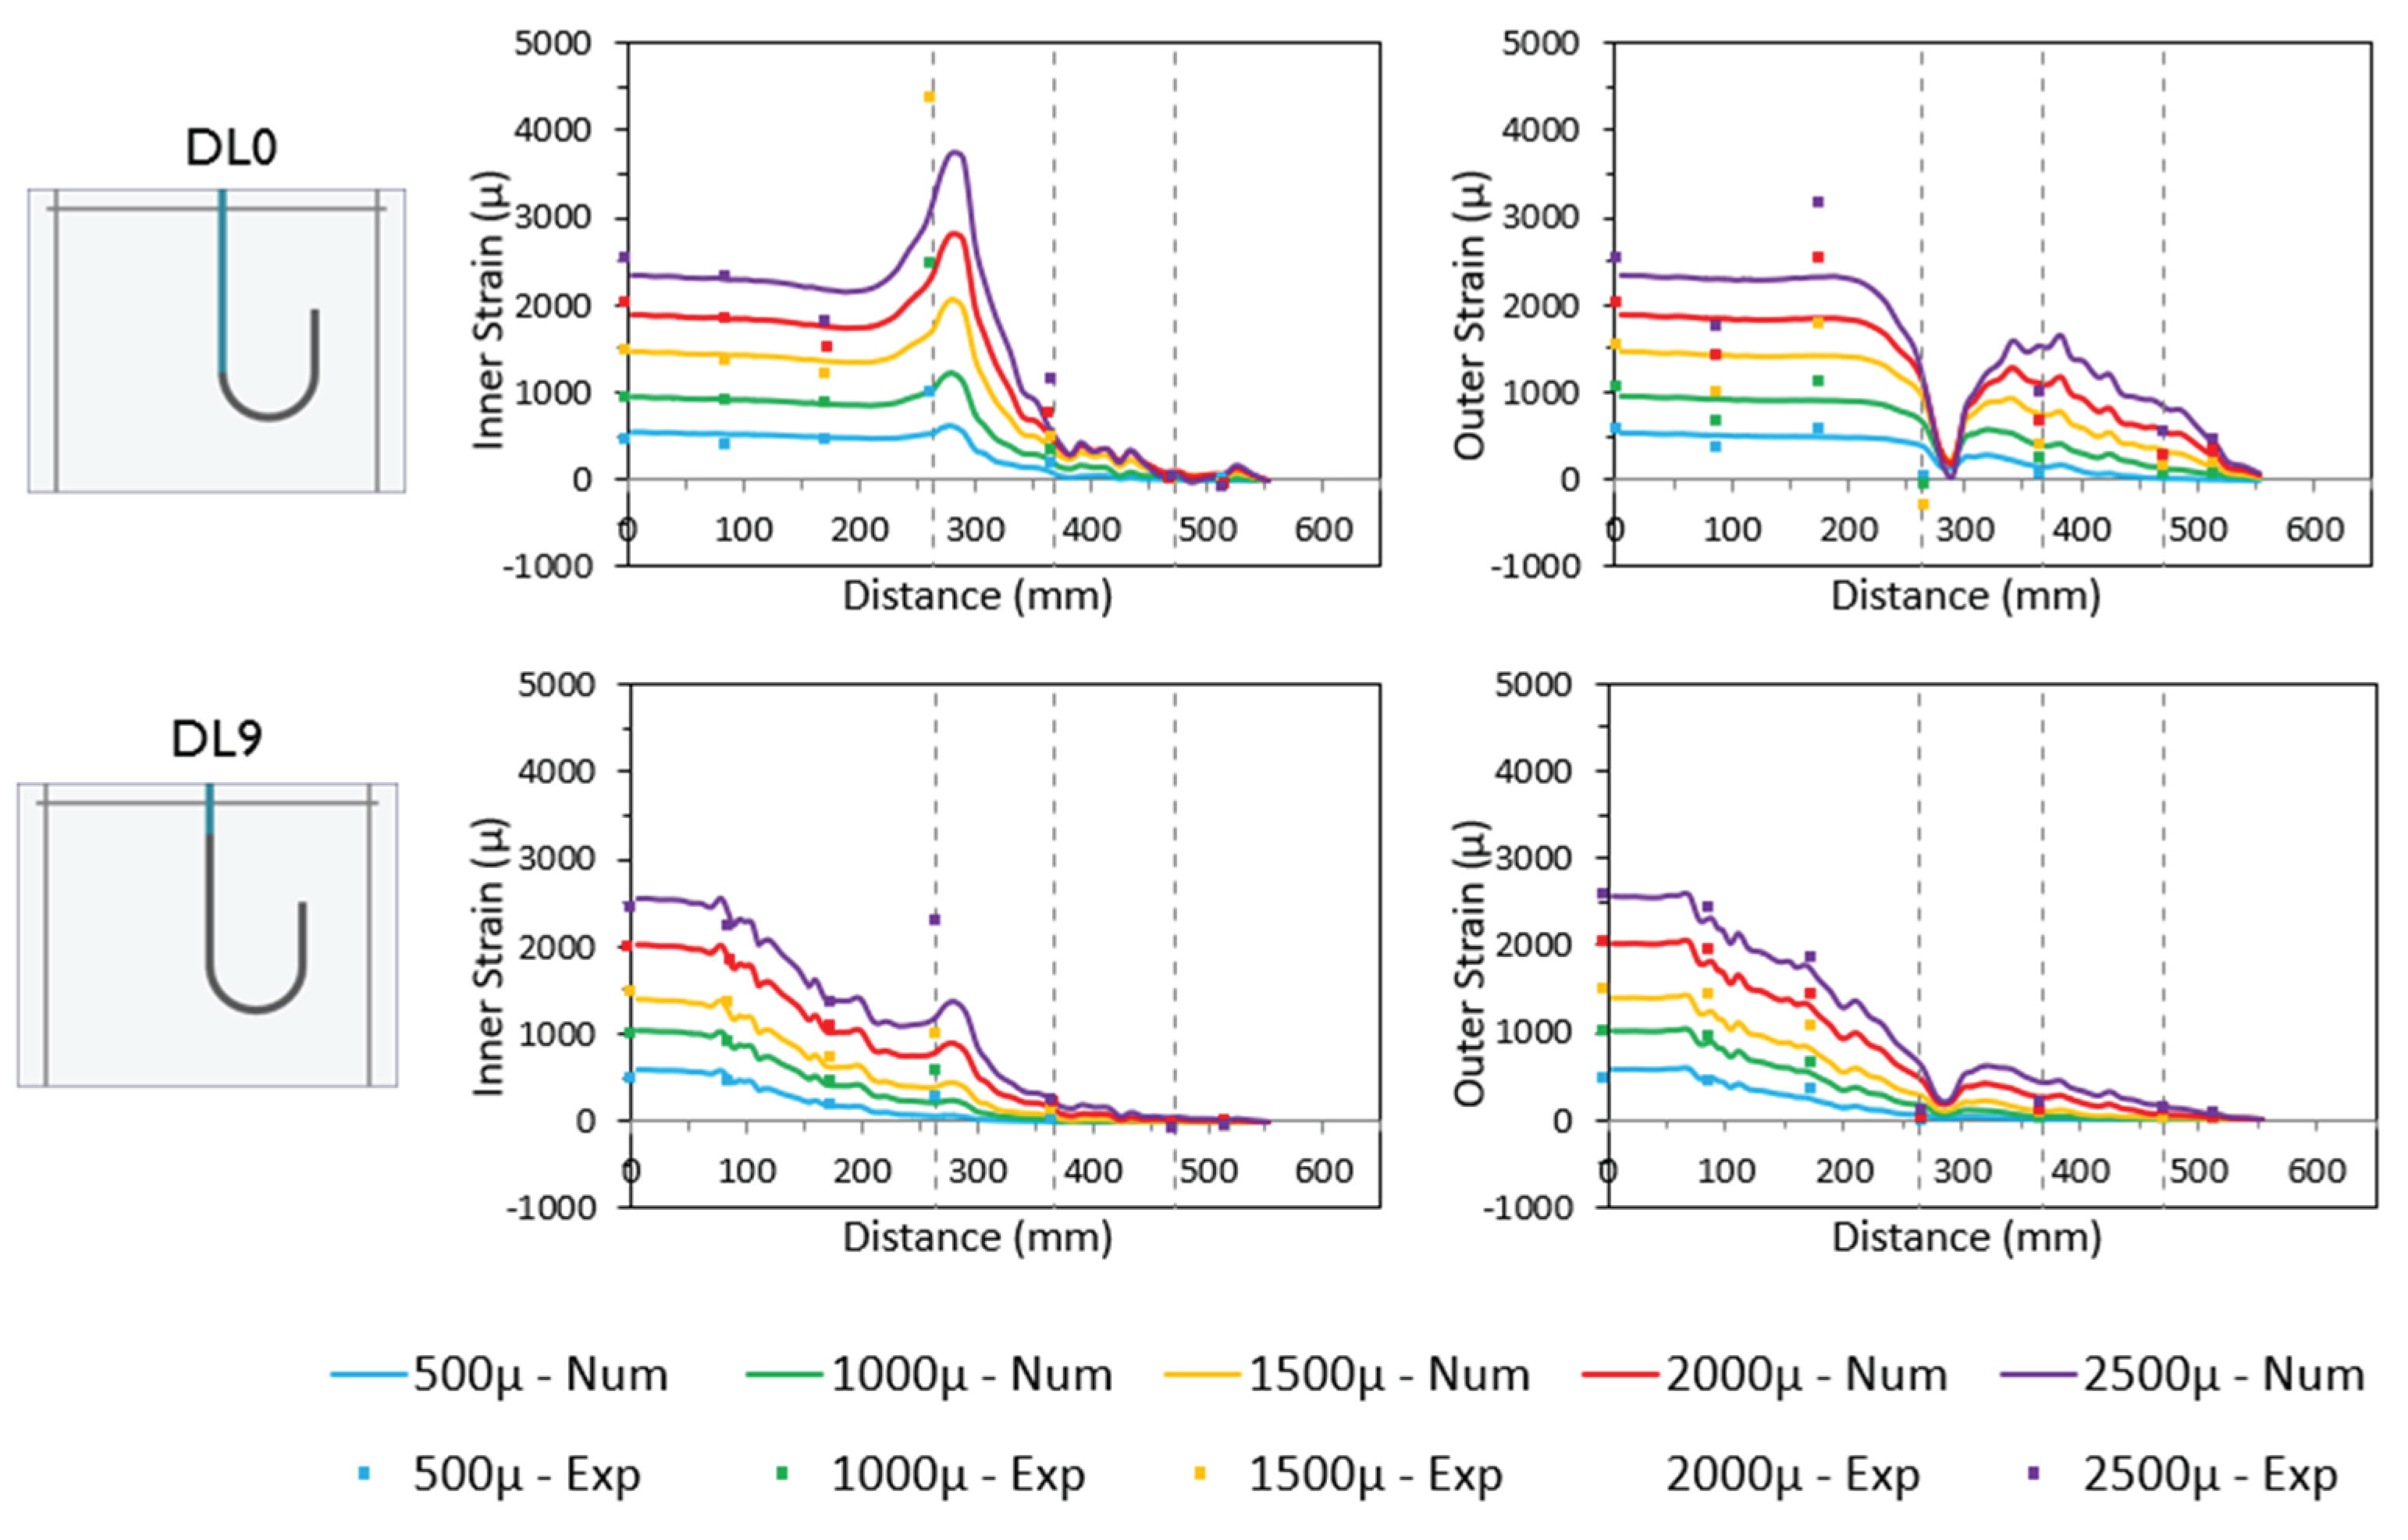
Figure 9.
Selected cases used to examine the effect of development length.
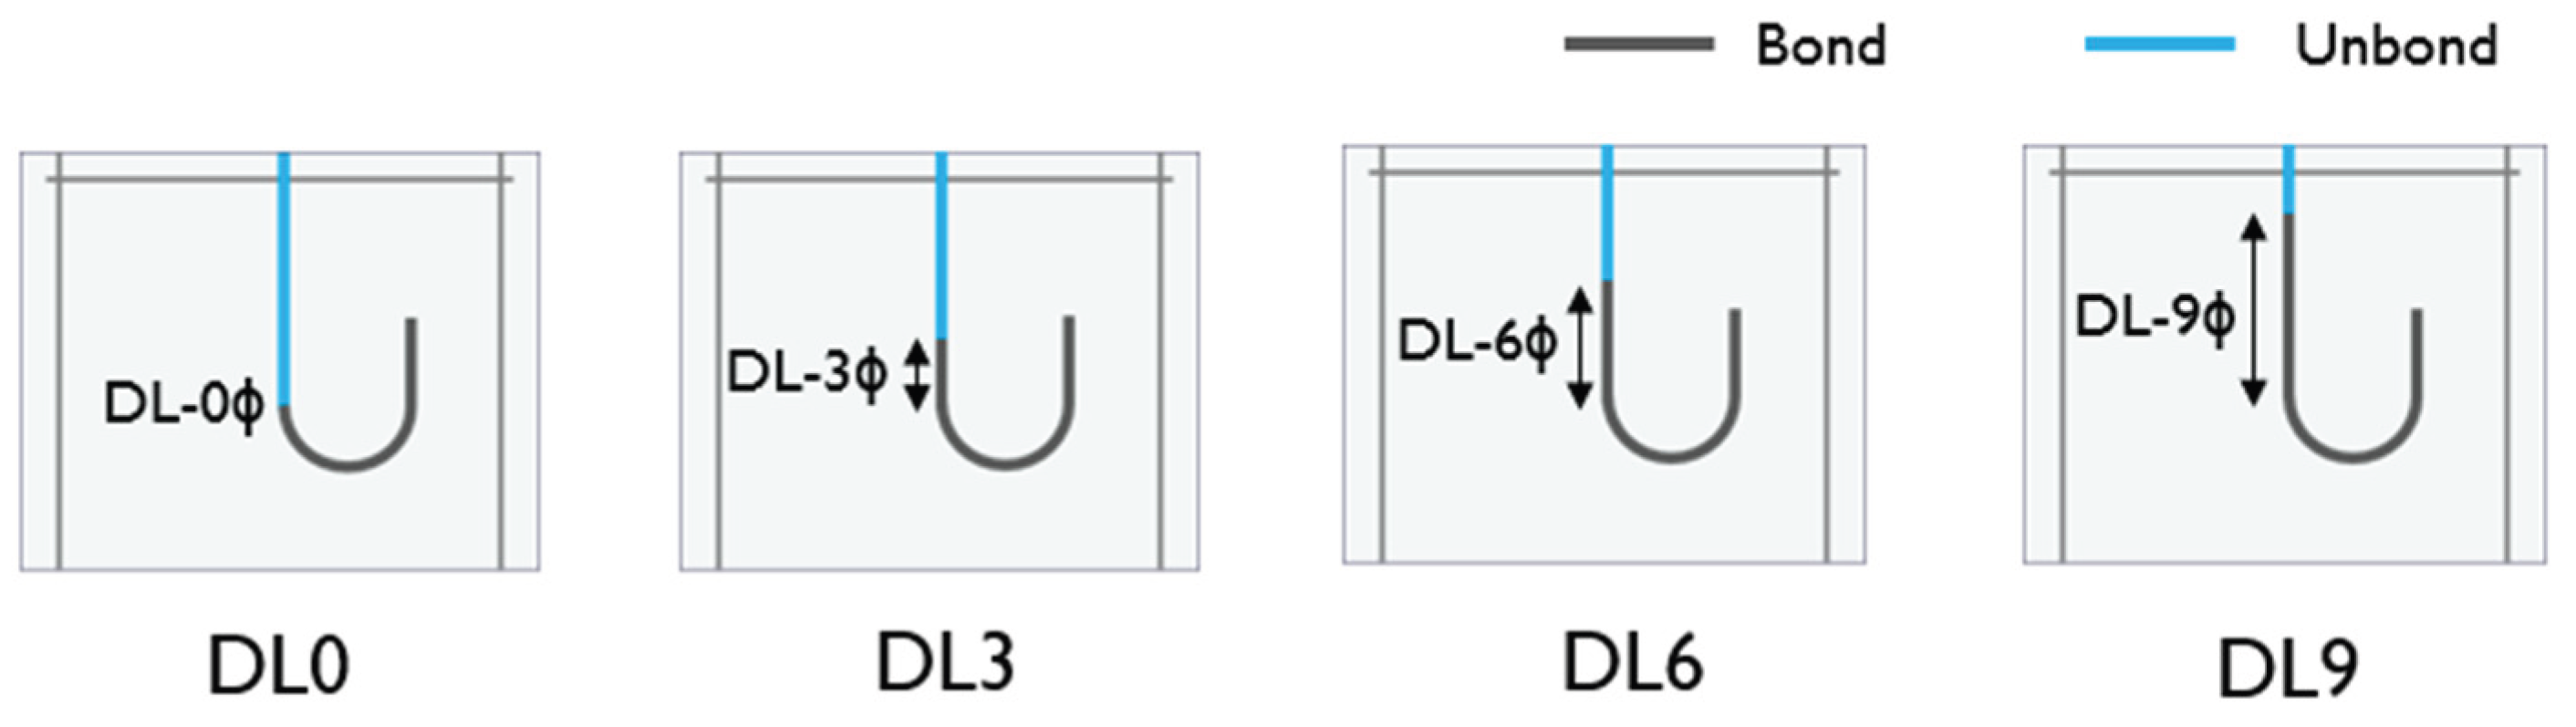
Figure 10.
Stress-slip relationship for different development length.
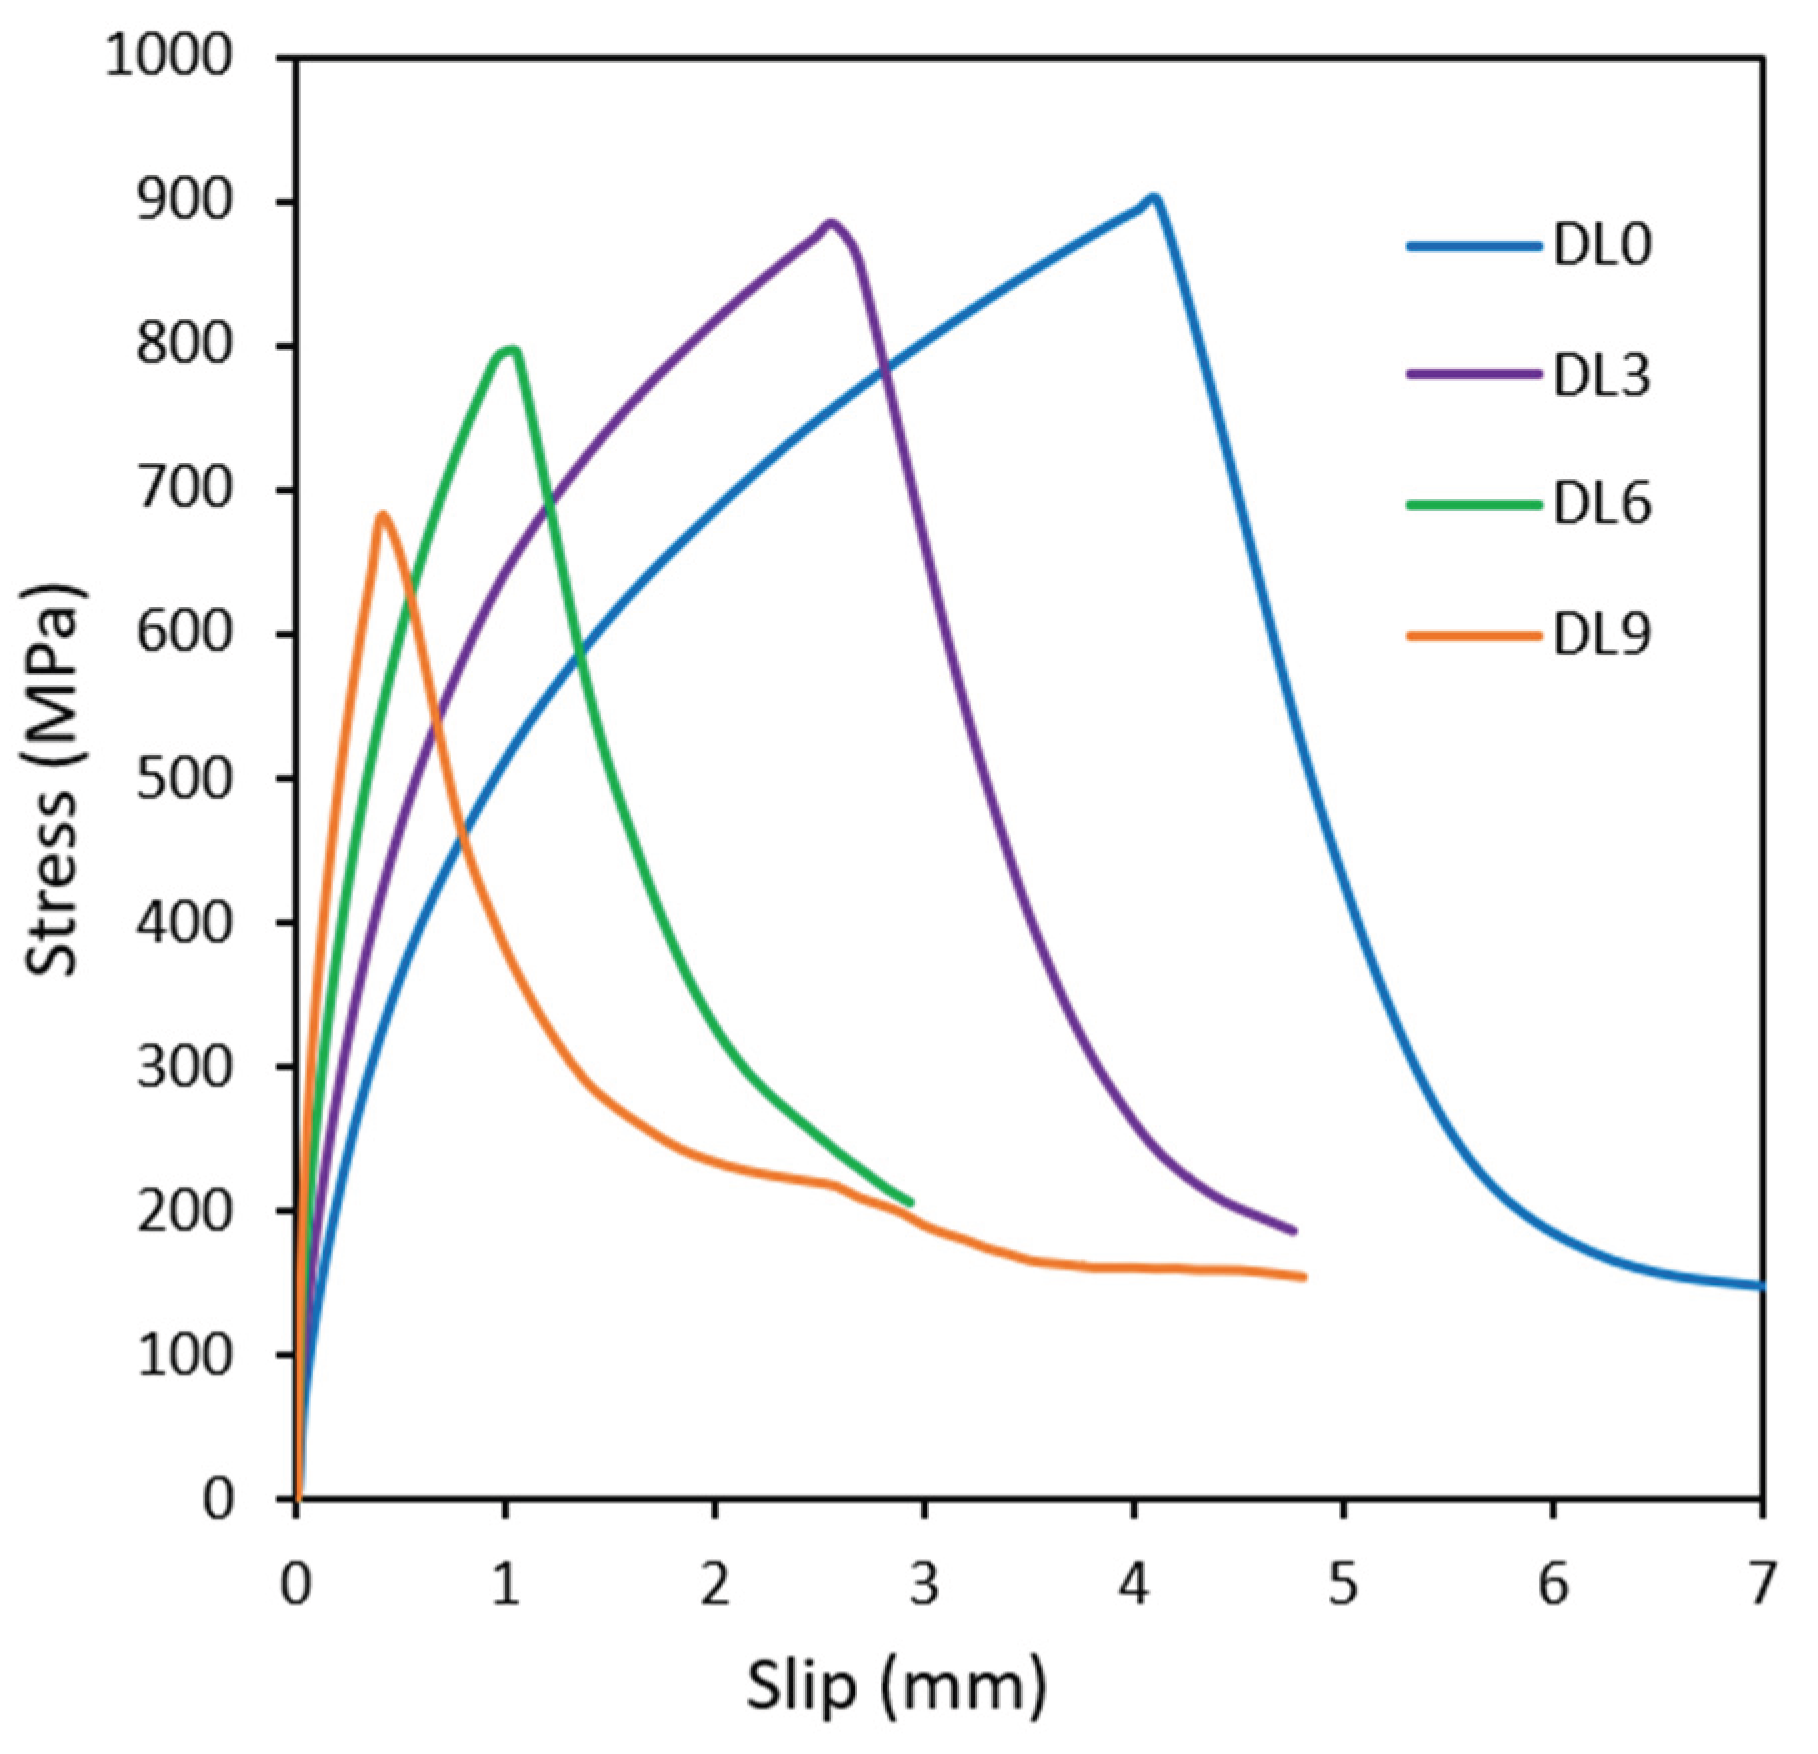
Figure 11.
Rebar hook inner and outer strains for different development lengths.
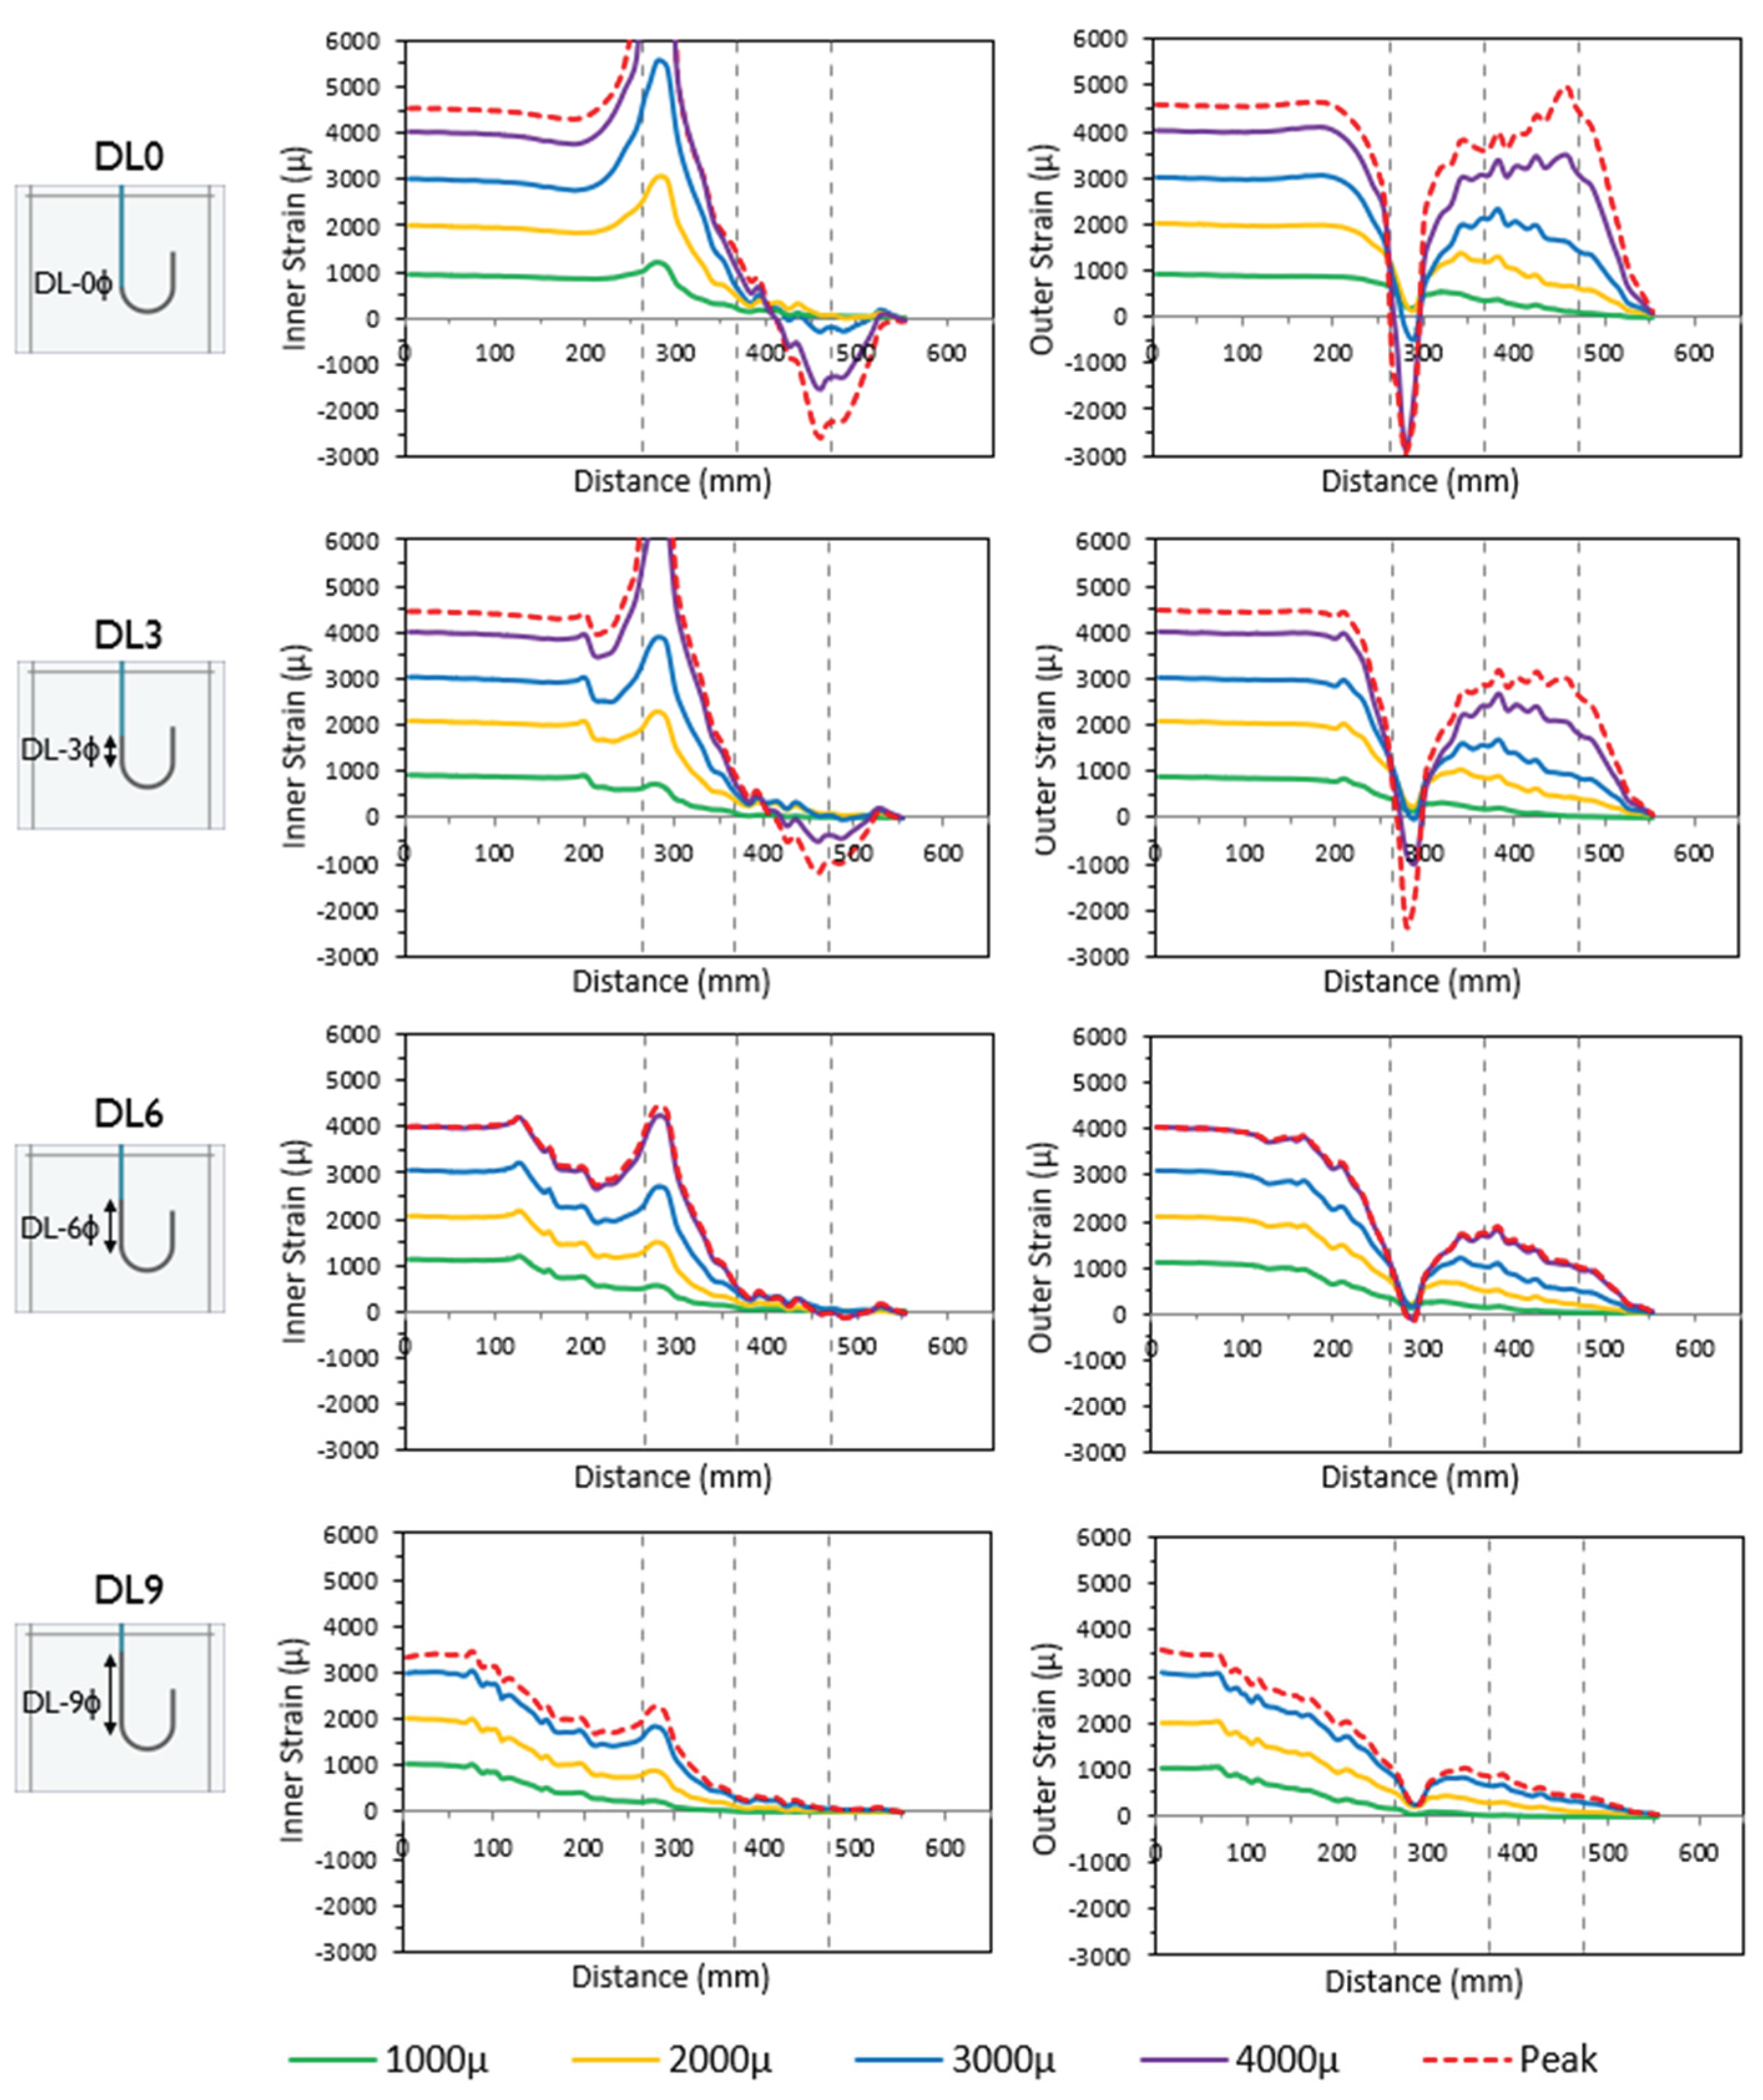
Figure 12.
Concrete stress in Y direction and internal crack patterns at different stress levels (at Z = 275 mm in XY plane).
Figure 12.
Concrete stress in Y direction and internal crack patterns at different stress levels (at Z = 275 mm in XY plane).
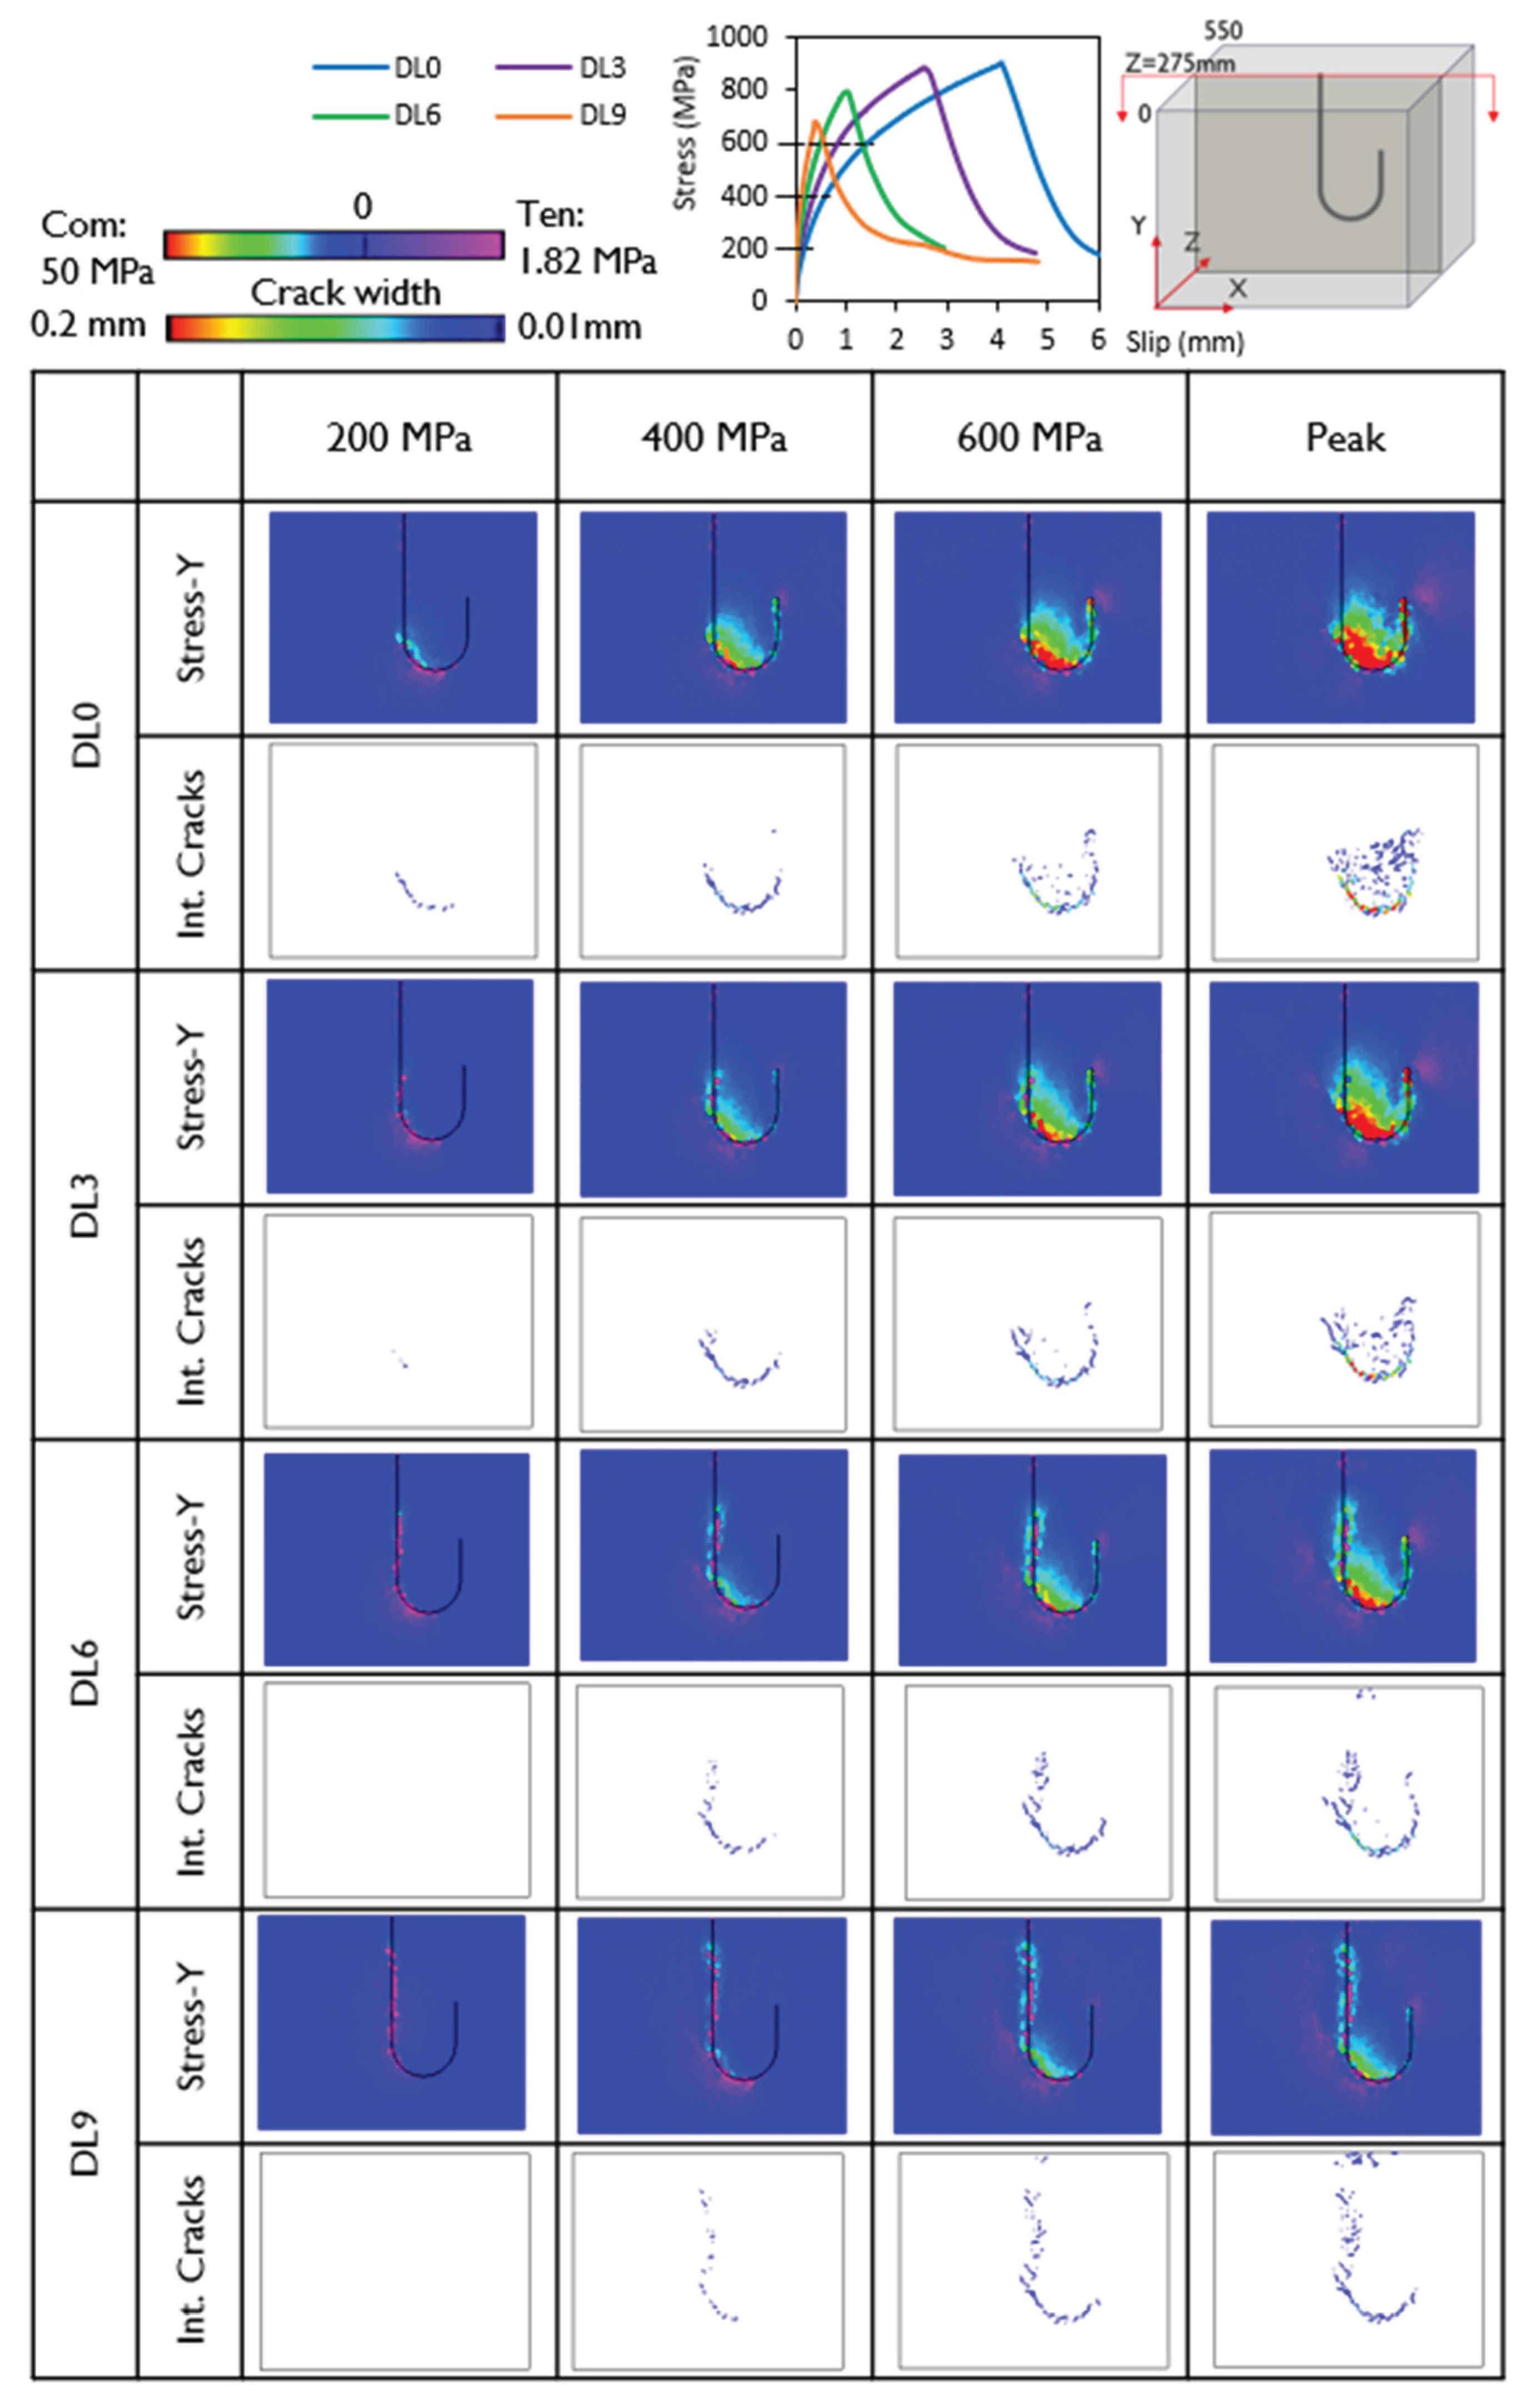
Figure 13.
Concrete stresses in X, Y, Z directions and internal crack patterns at peak stress (Stresses are shown at Z = 275 mm in XY plane and internal crack patterns at XY plane (Z = 275 mm) and YZ plane (X = 275 mm).
Figure 13.
Concrete stresses in X, Y, Z directions and internal crack patterns at peak stress (Stresses are shown at Z = 275 mm in XY plane and internal crack patterns at XY plane (Z = 275 mm) and YZ plane (X = 275 mm).
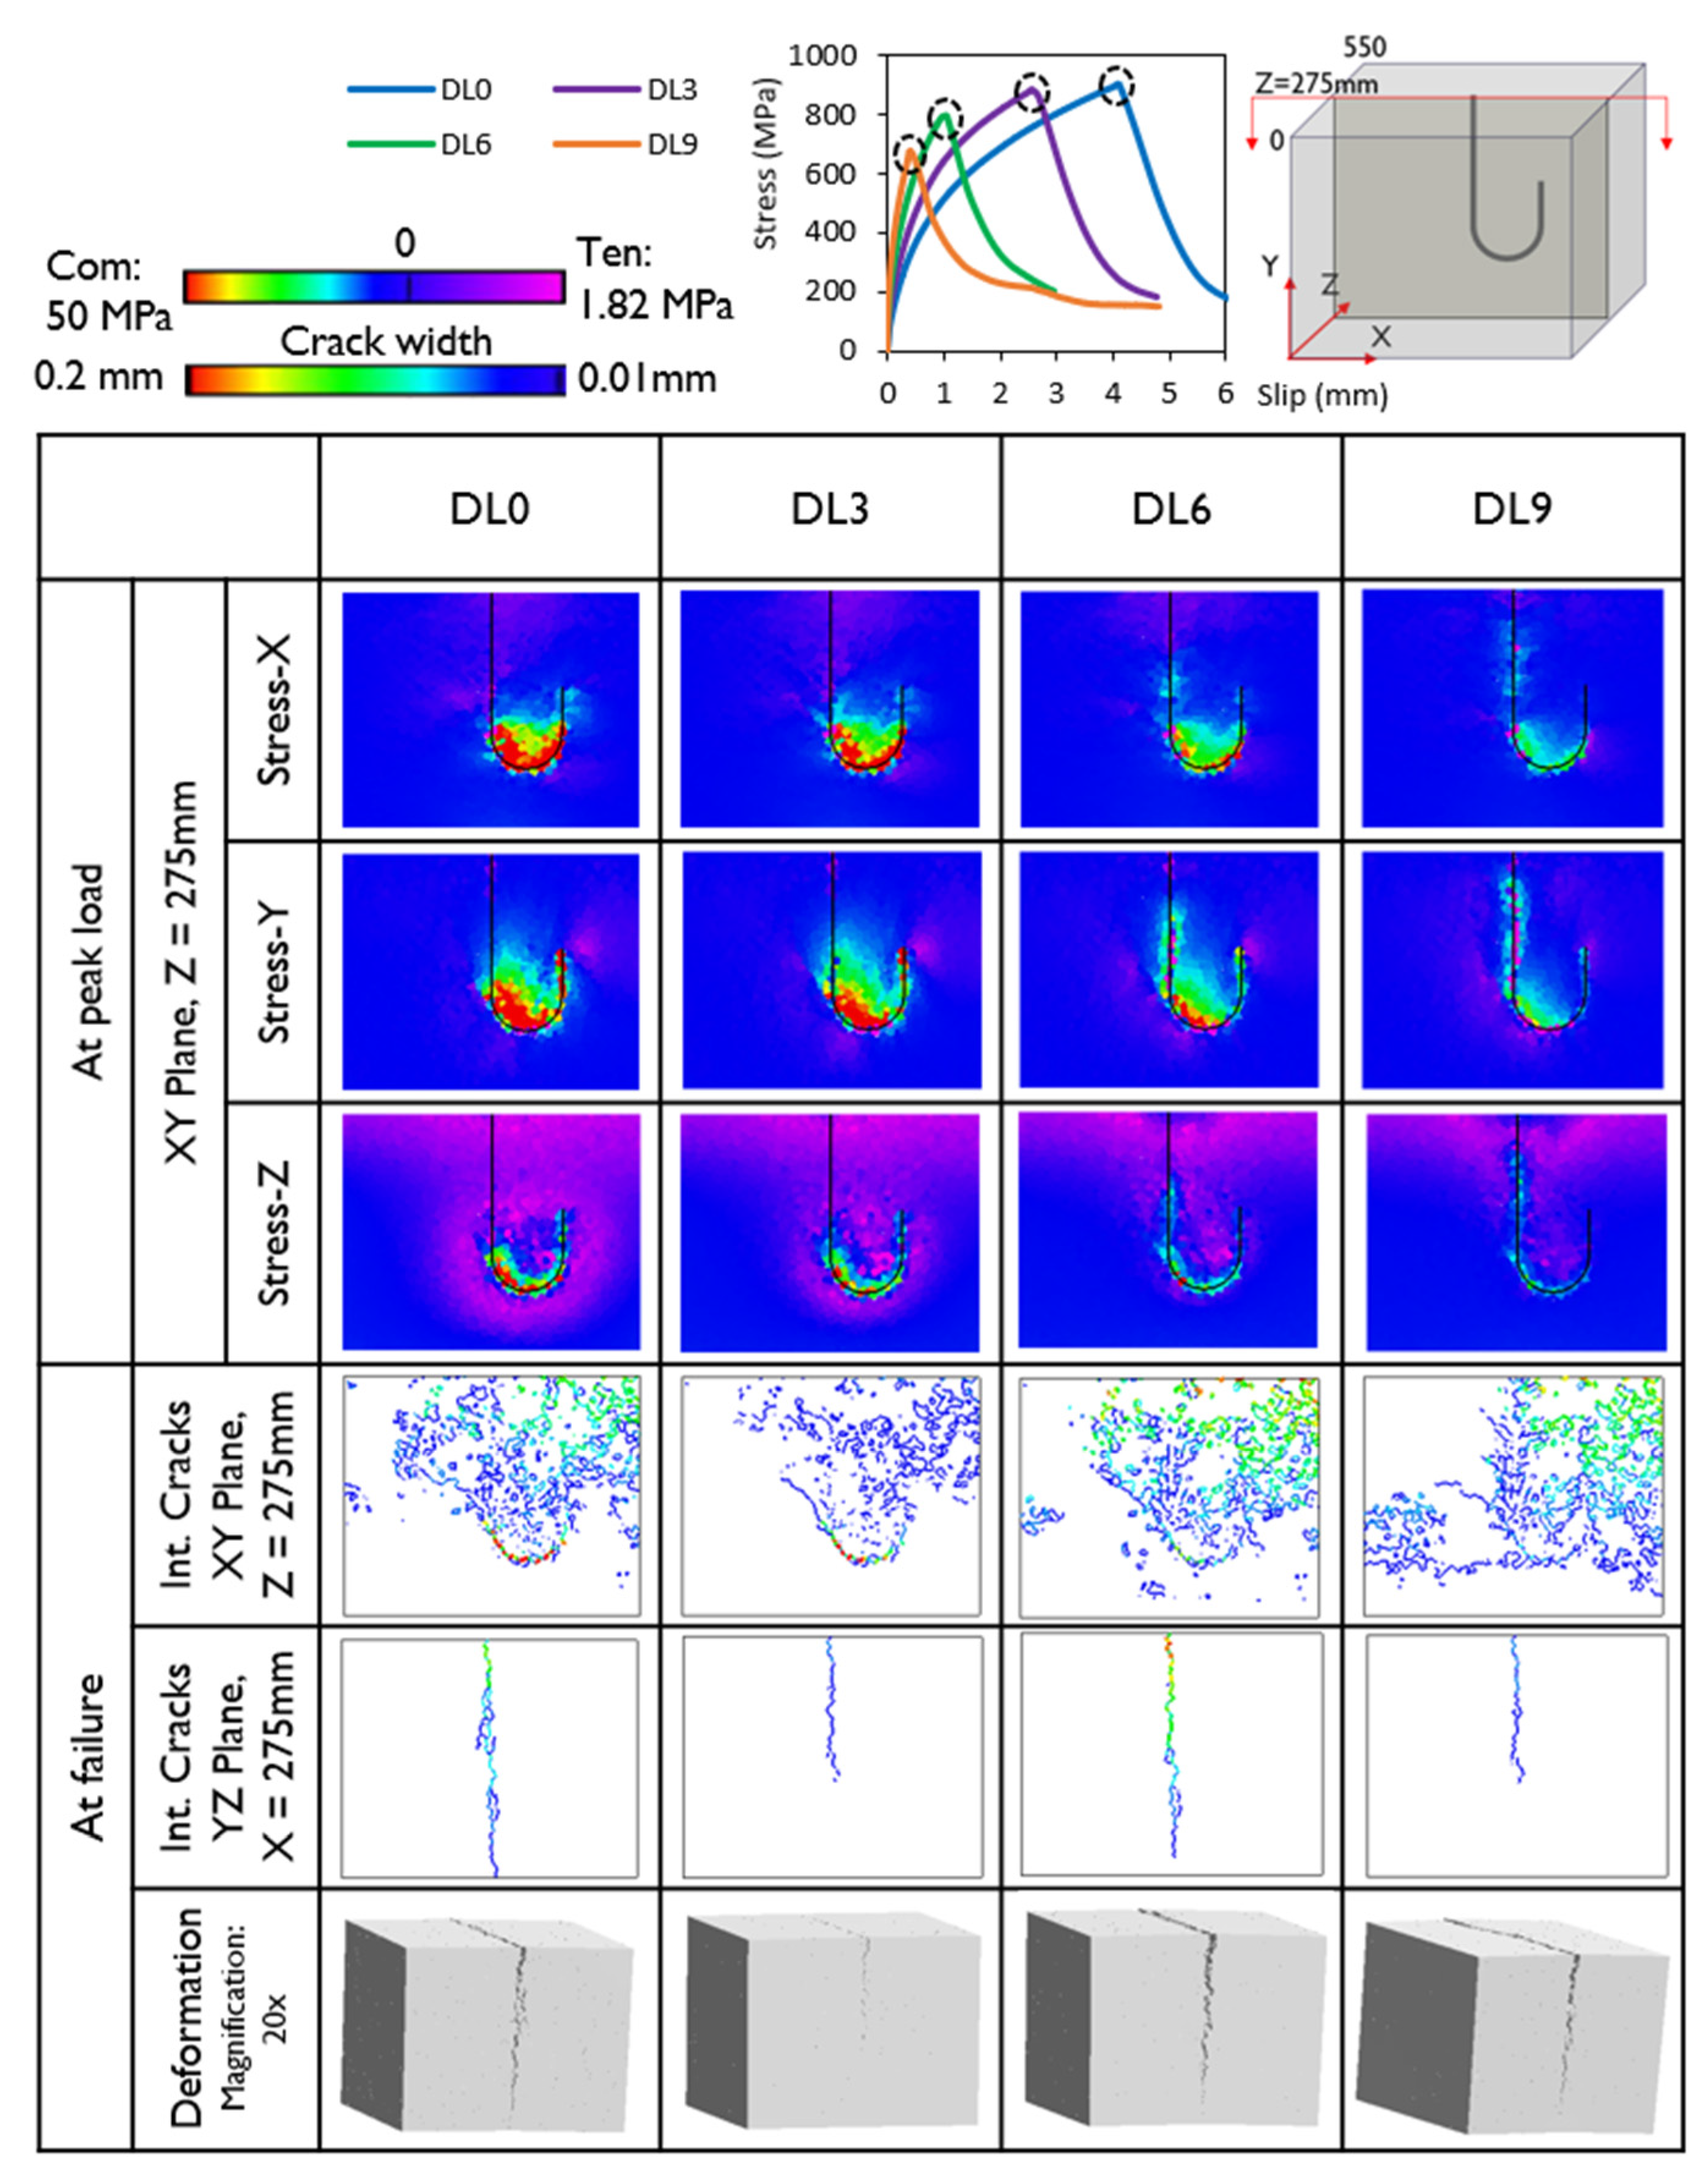
Figure 14.
Concrete stresses perpendicular to splitting failure plane and internal crack patterns at ~650 MPa and peak stresses.
Figure 14.
Concrete stresses perpendicular to splitting failure plane and internal crack patterns at ~650 MPa and peak stresses.
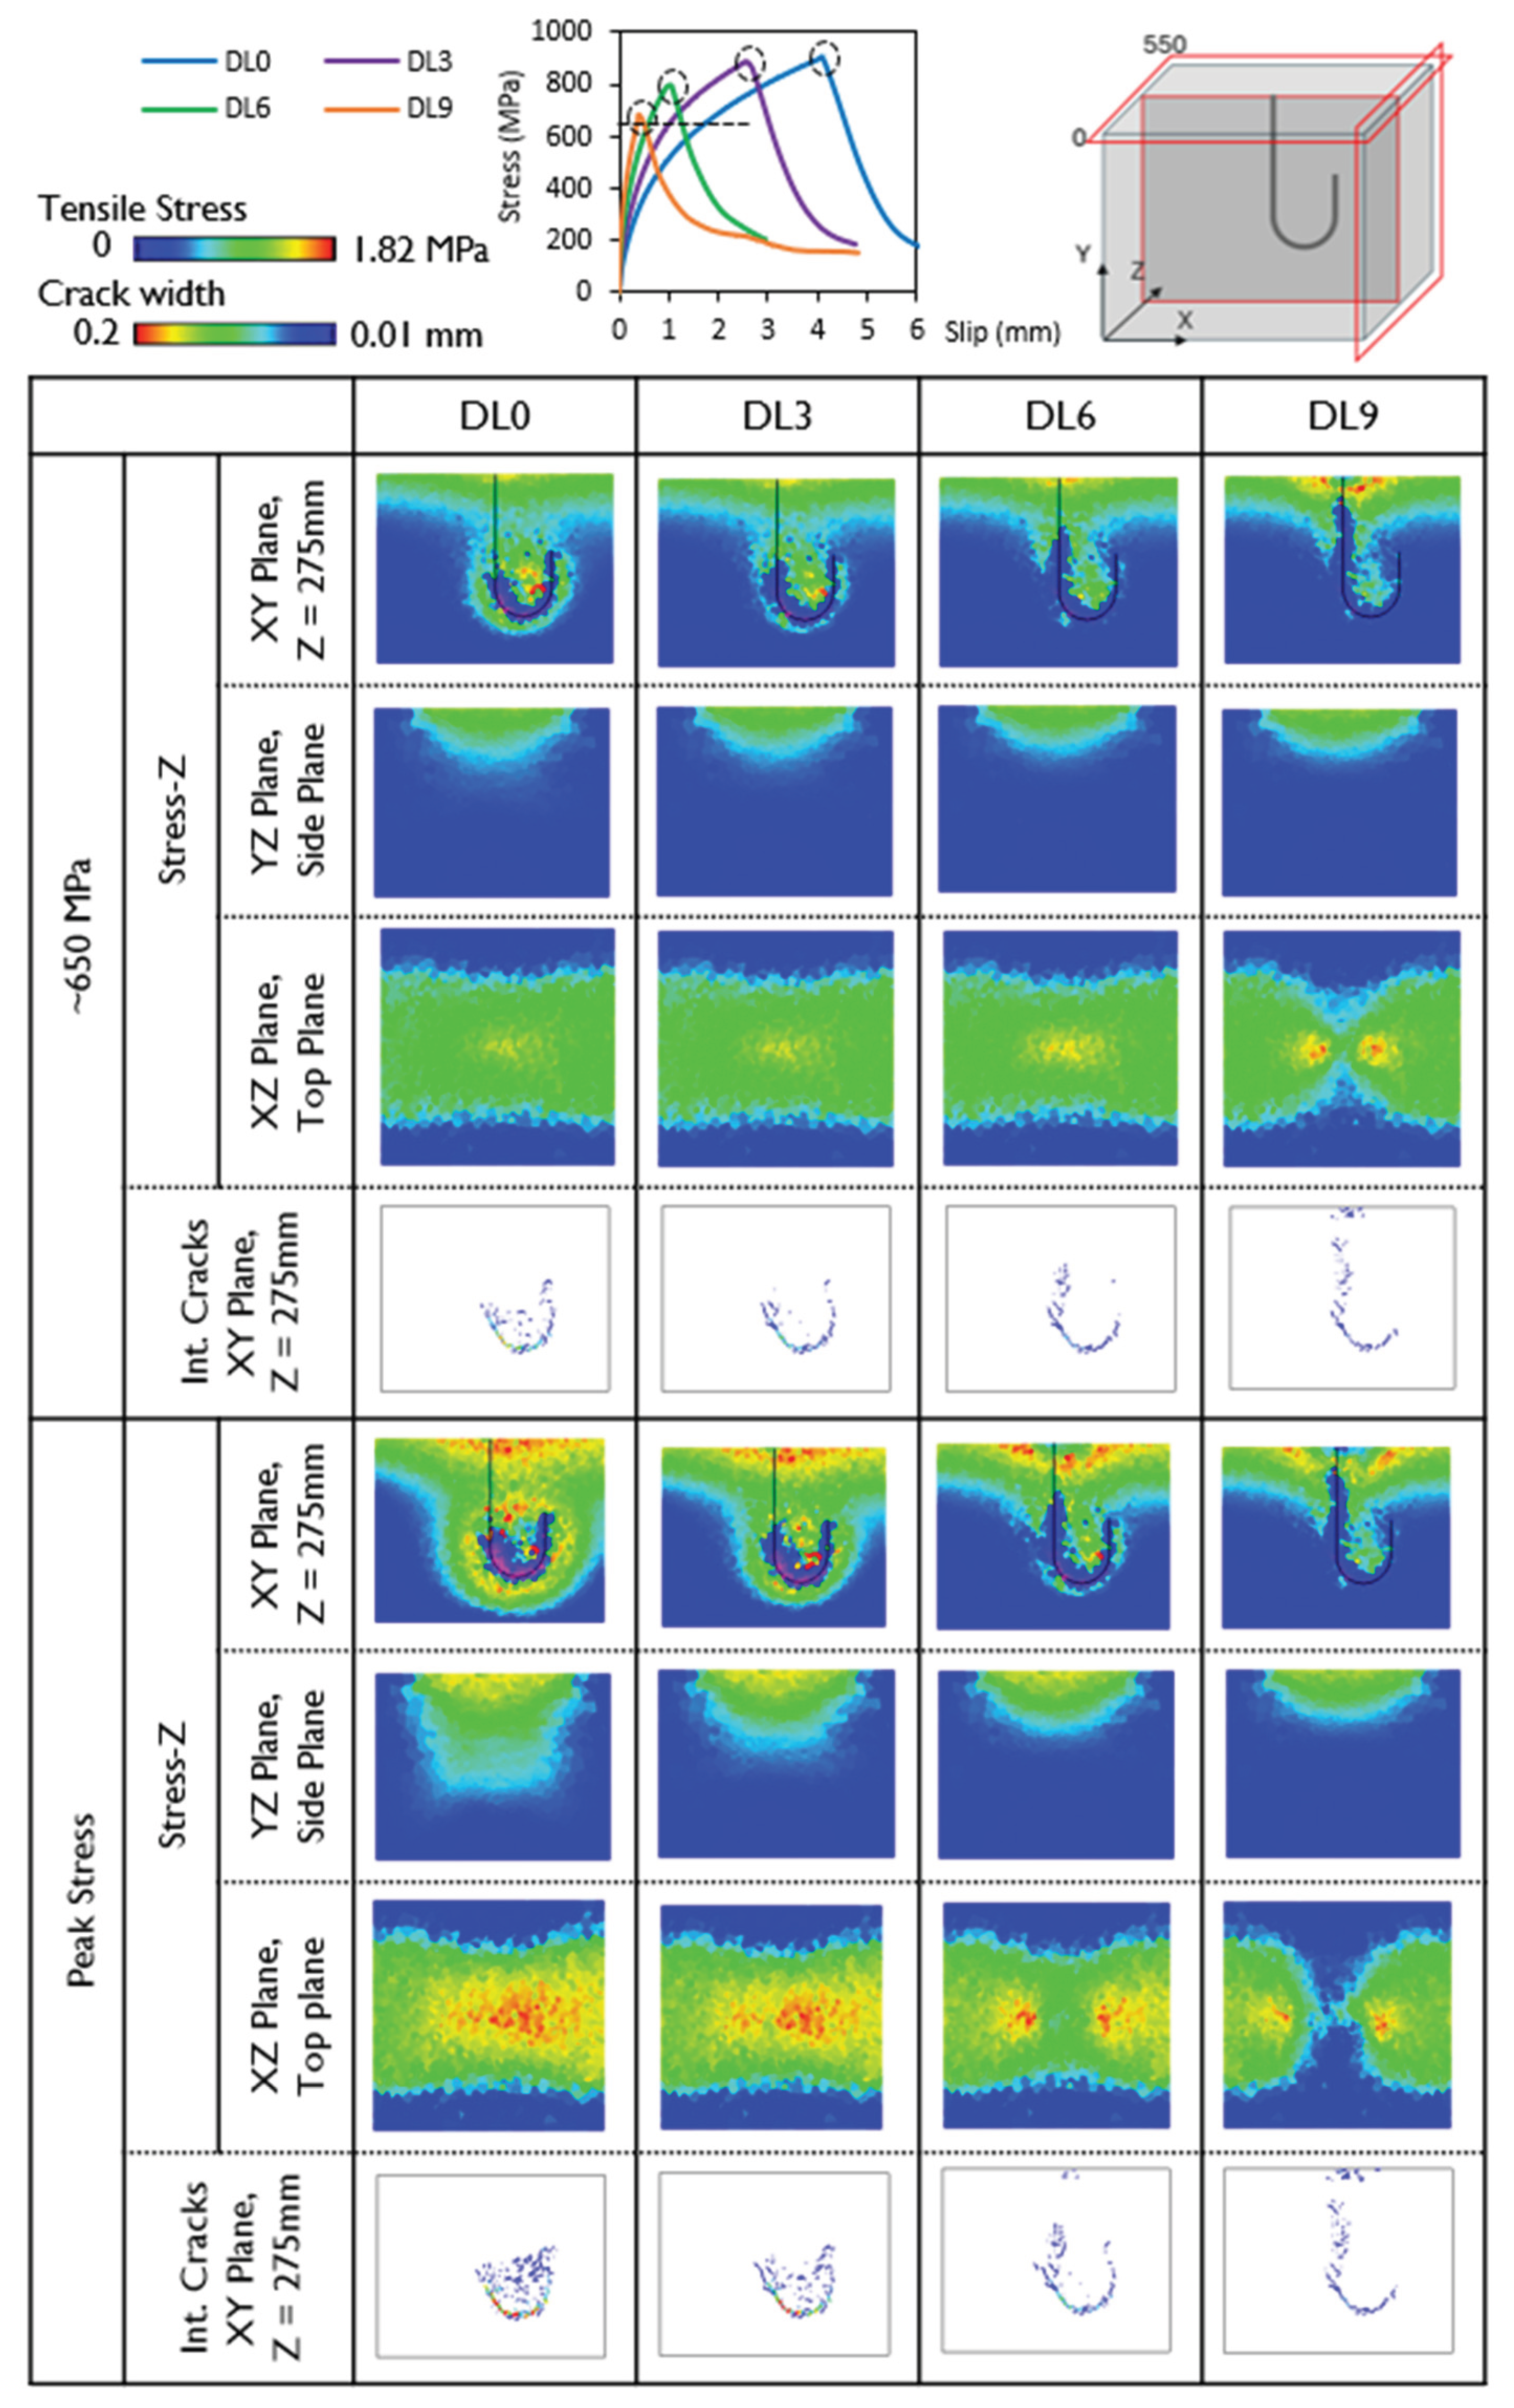
Figure 15.
Specimens identification.
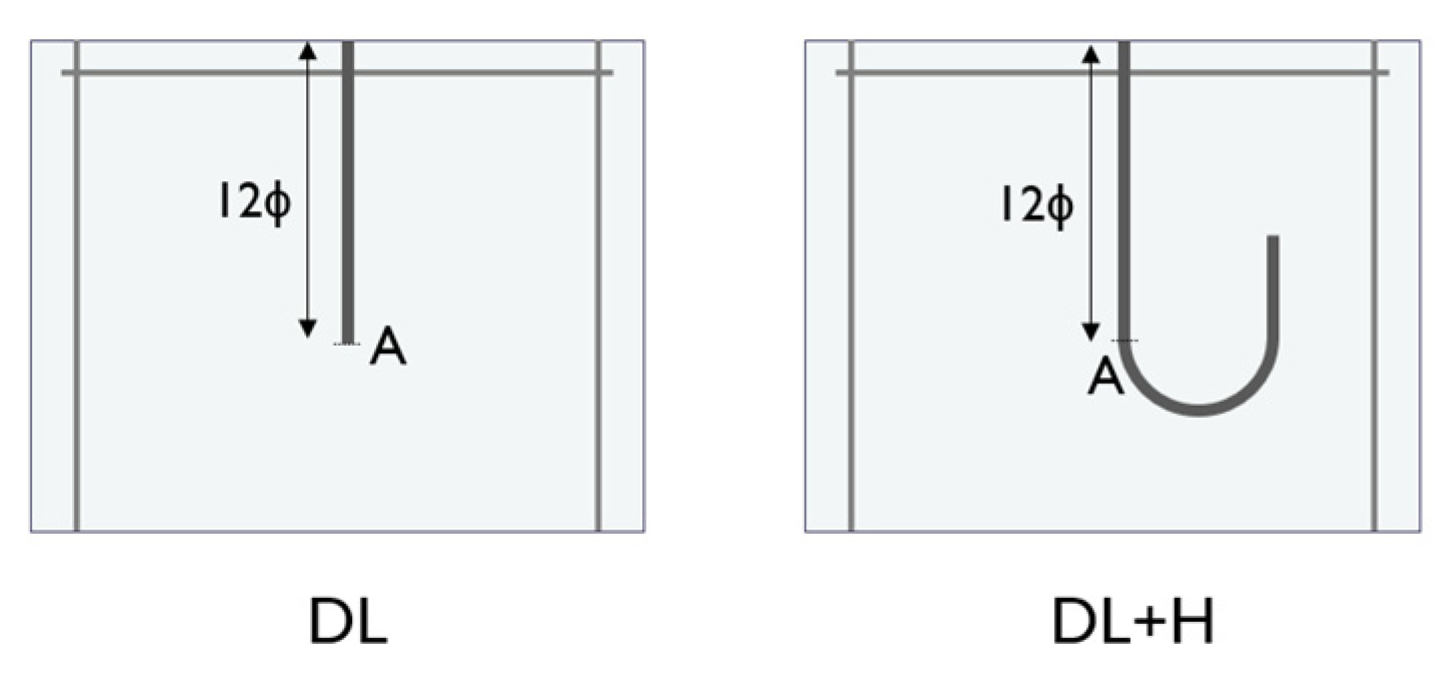
Figure 16.
Stress-slip relationship.
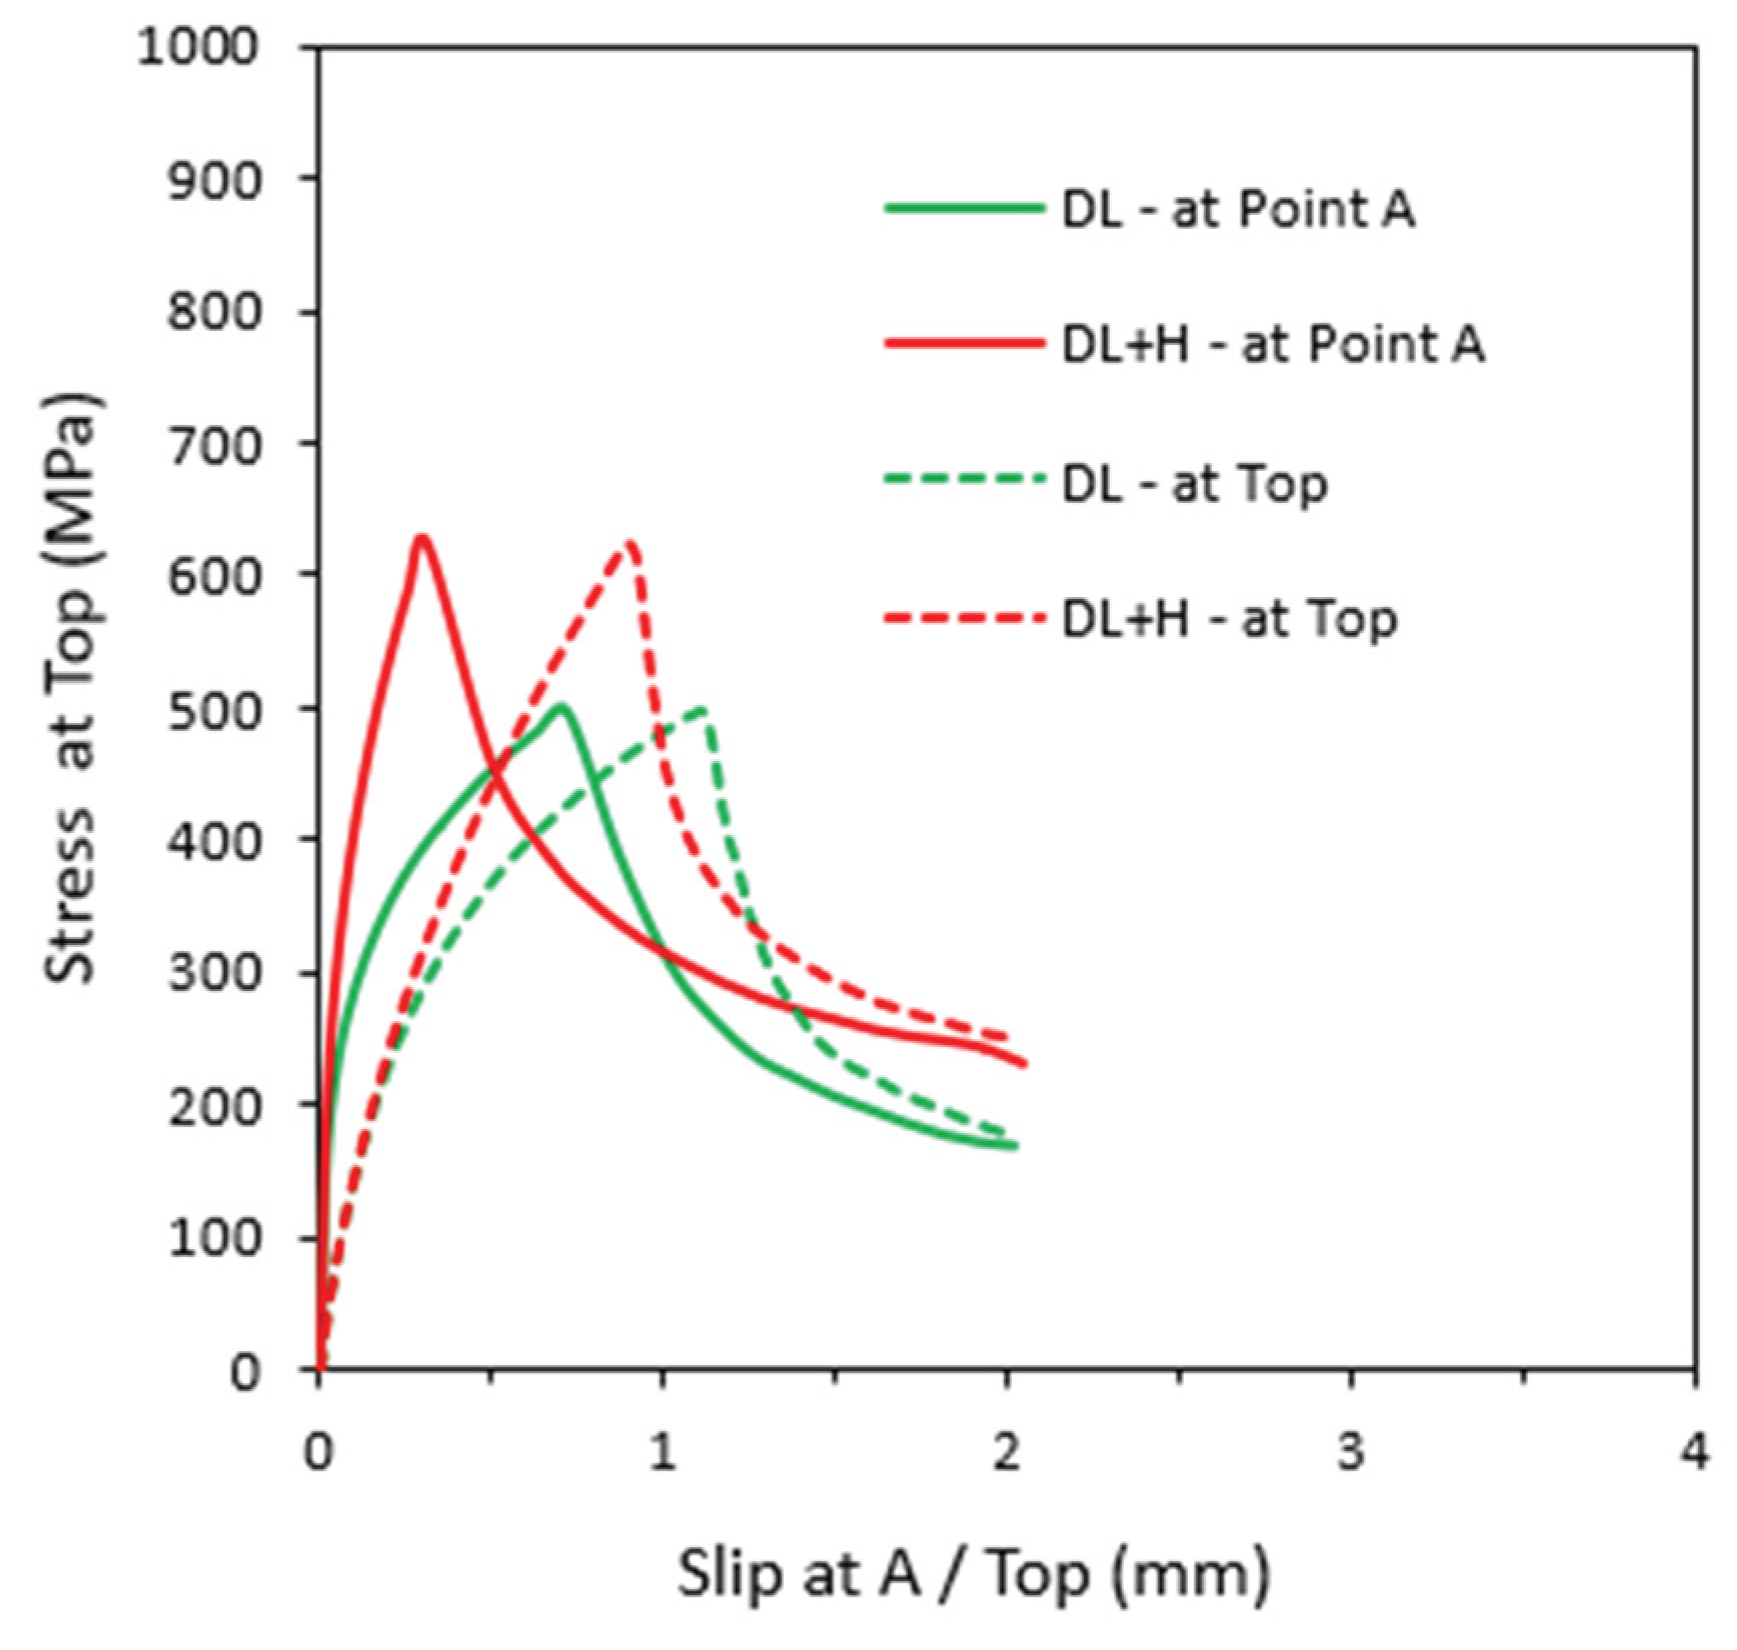
Figure 17.
Rebar inner and outer strain distributions.
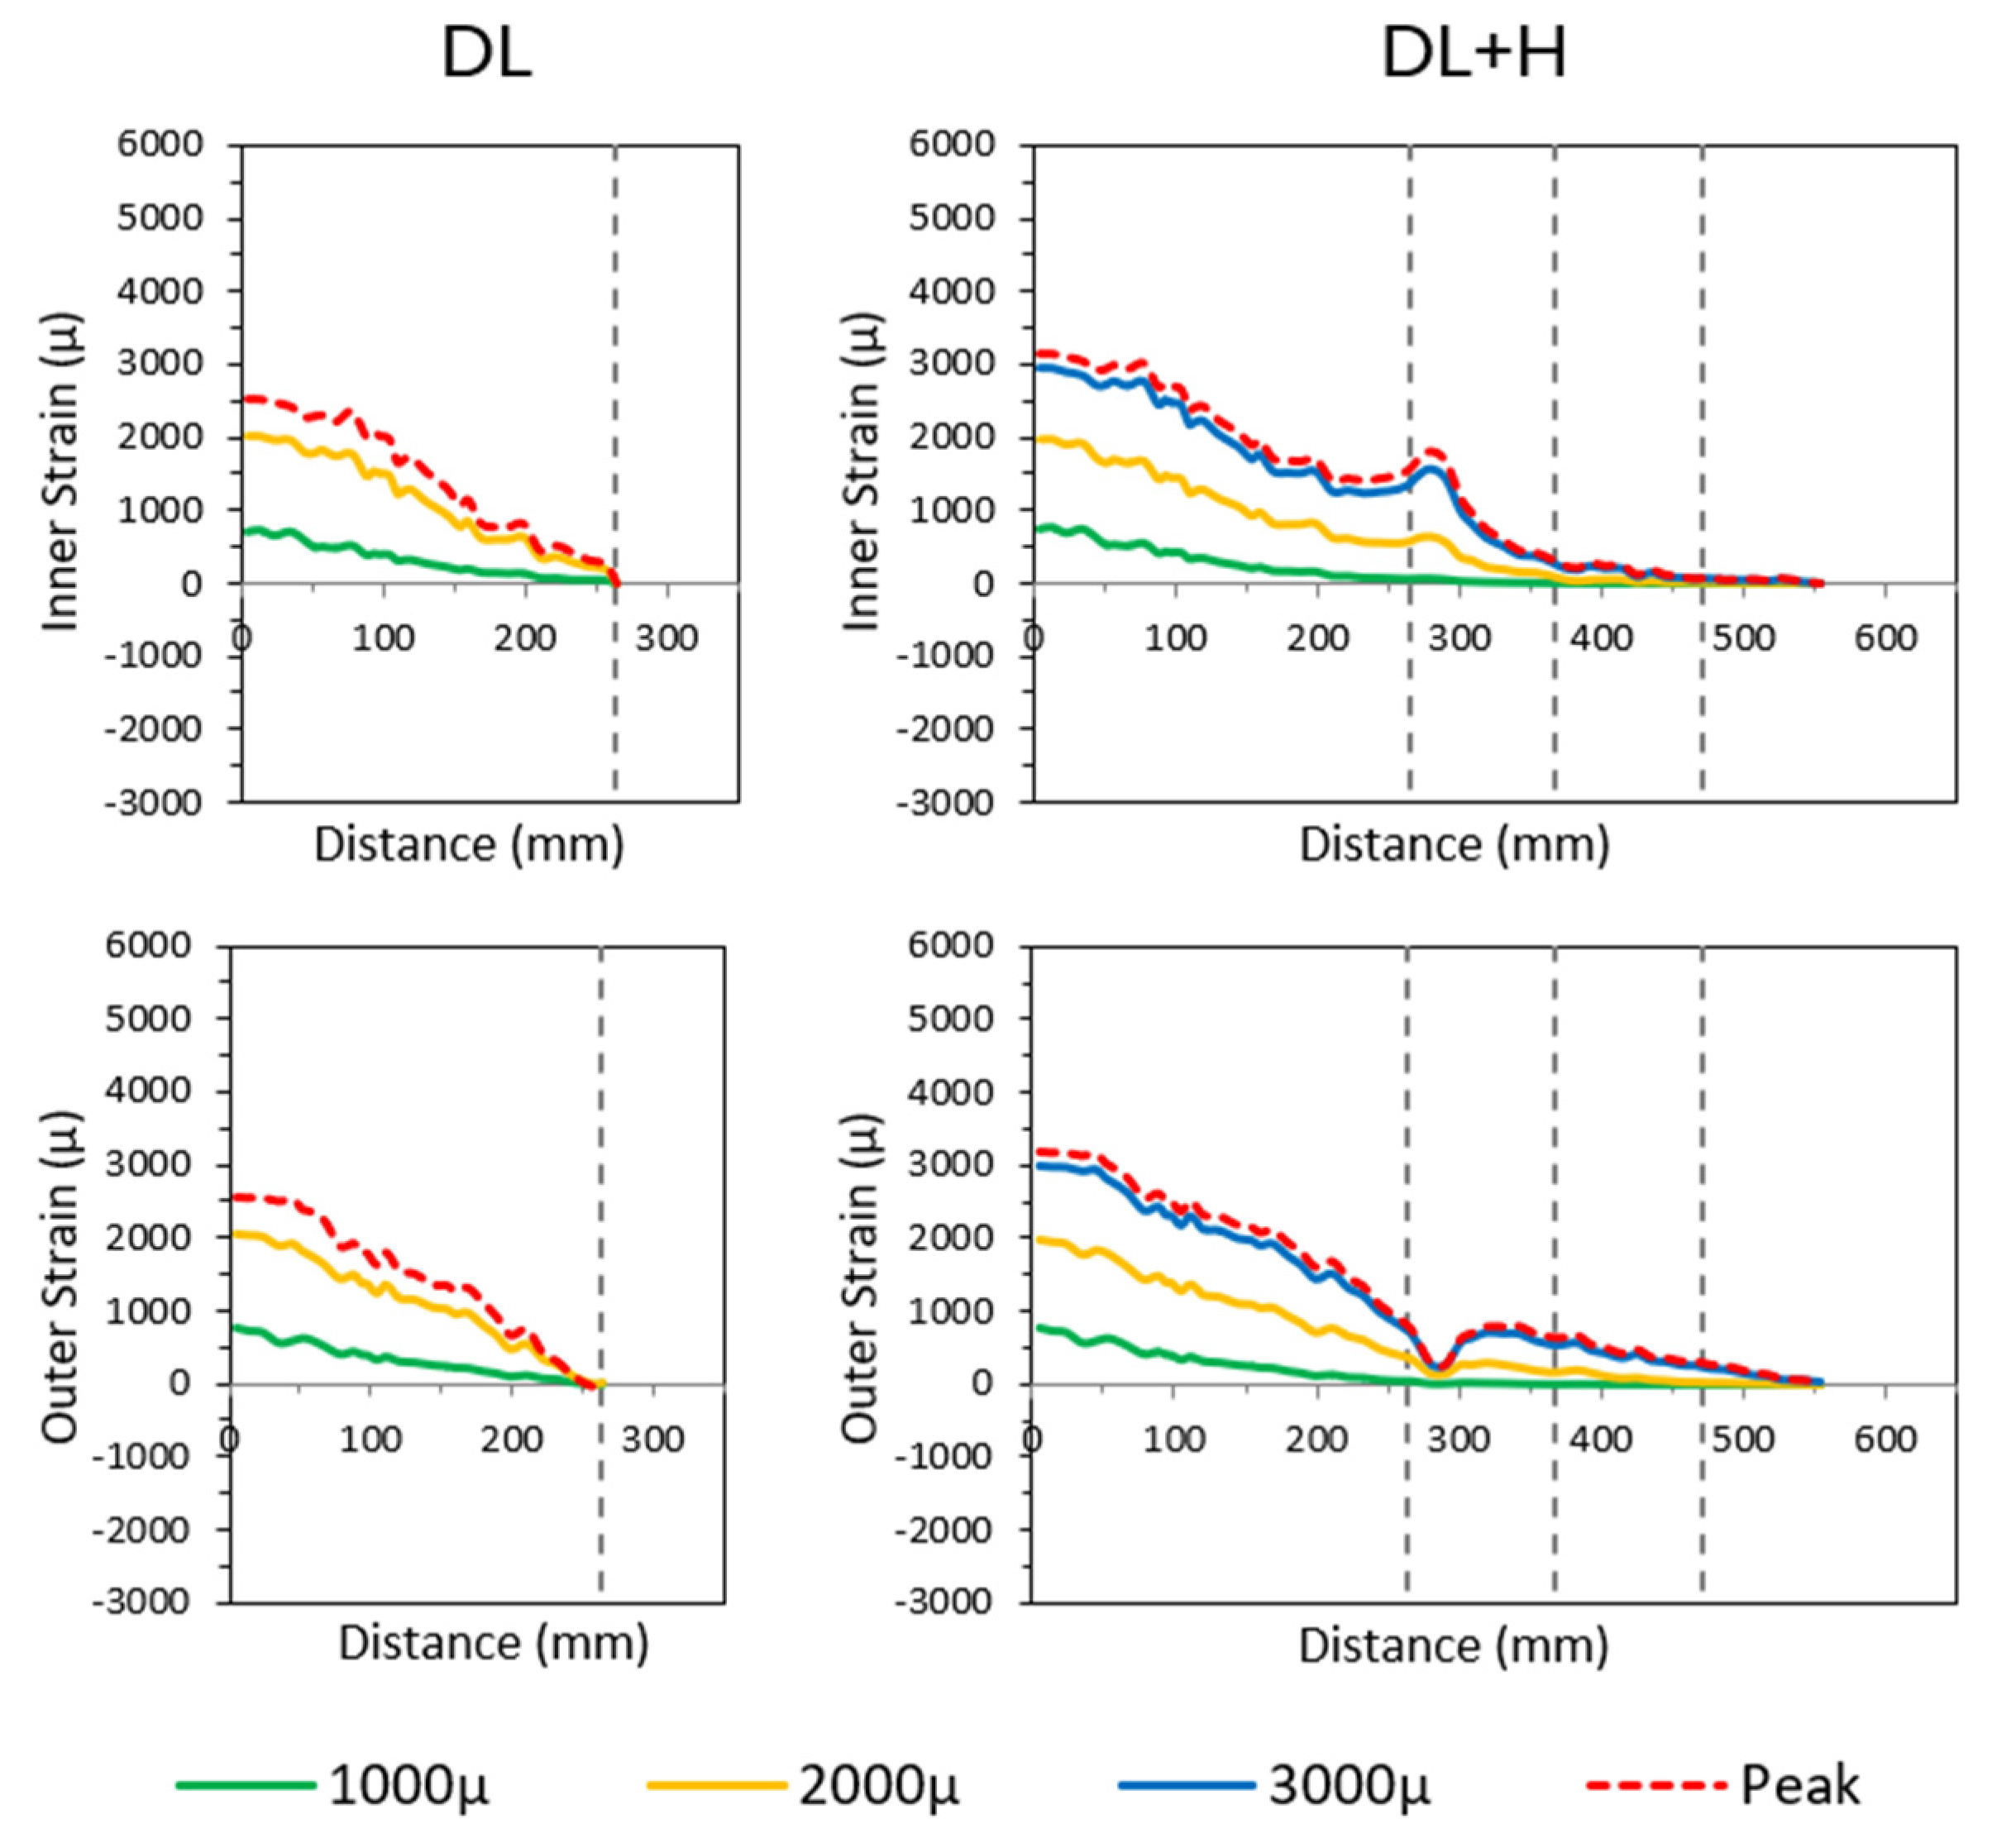
Figure 18.
Concrete stress and internal crack distribution at different stress levels.
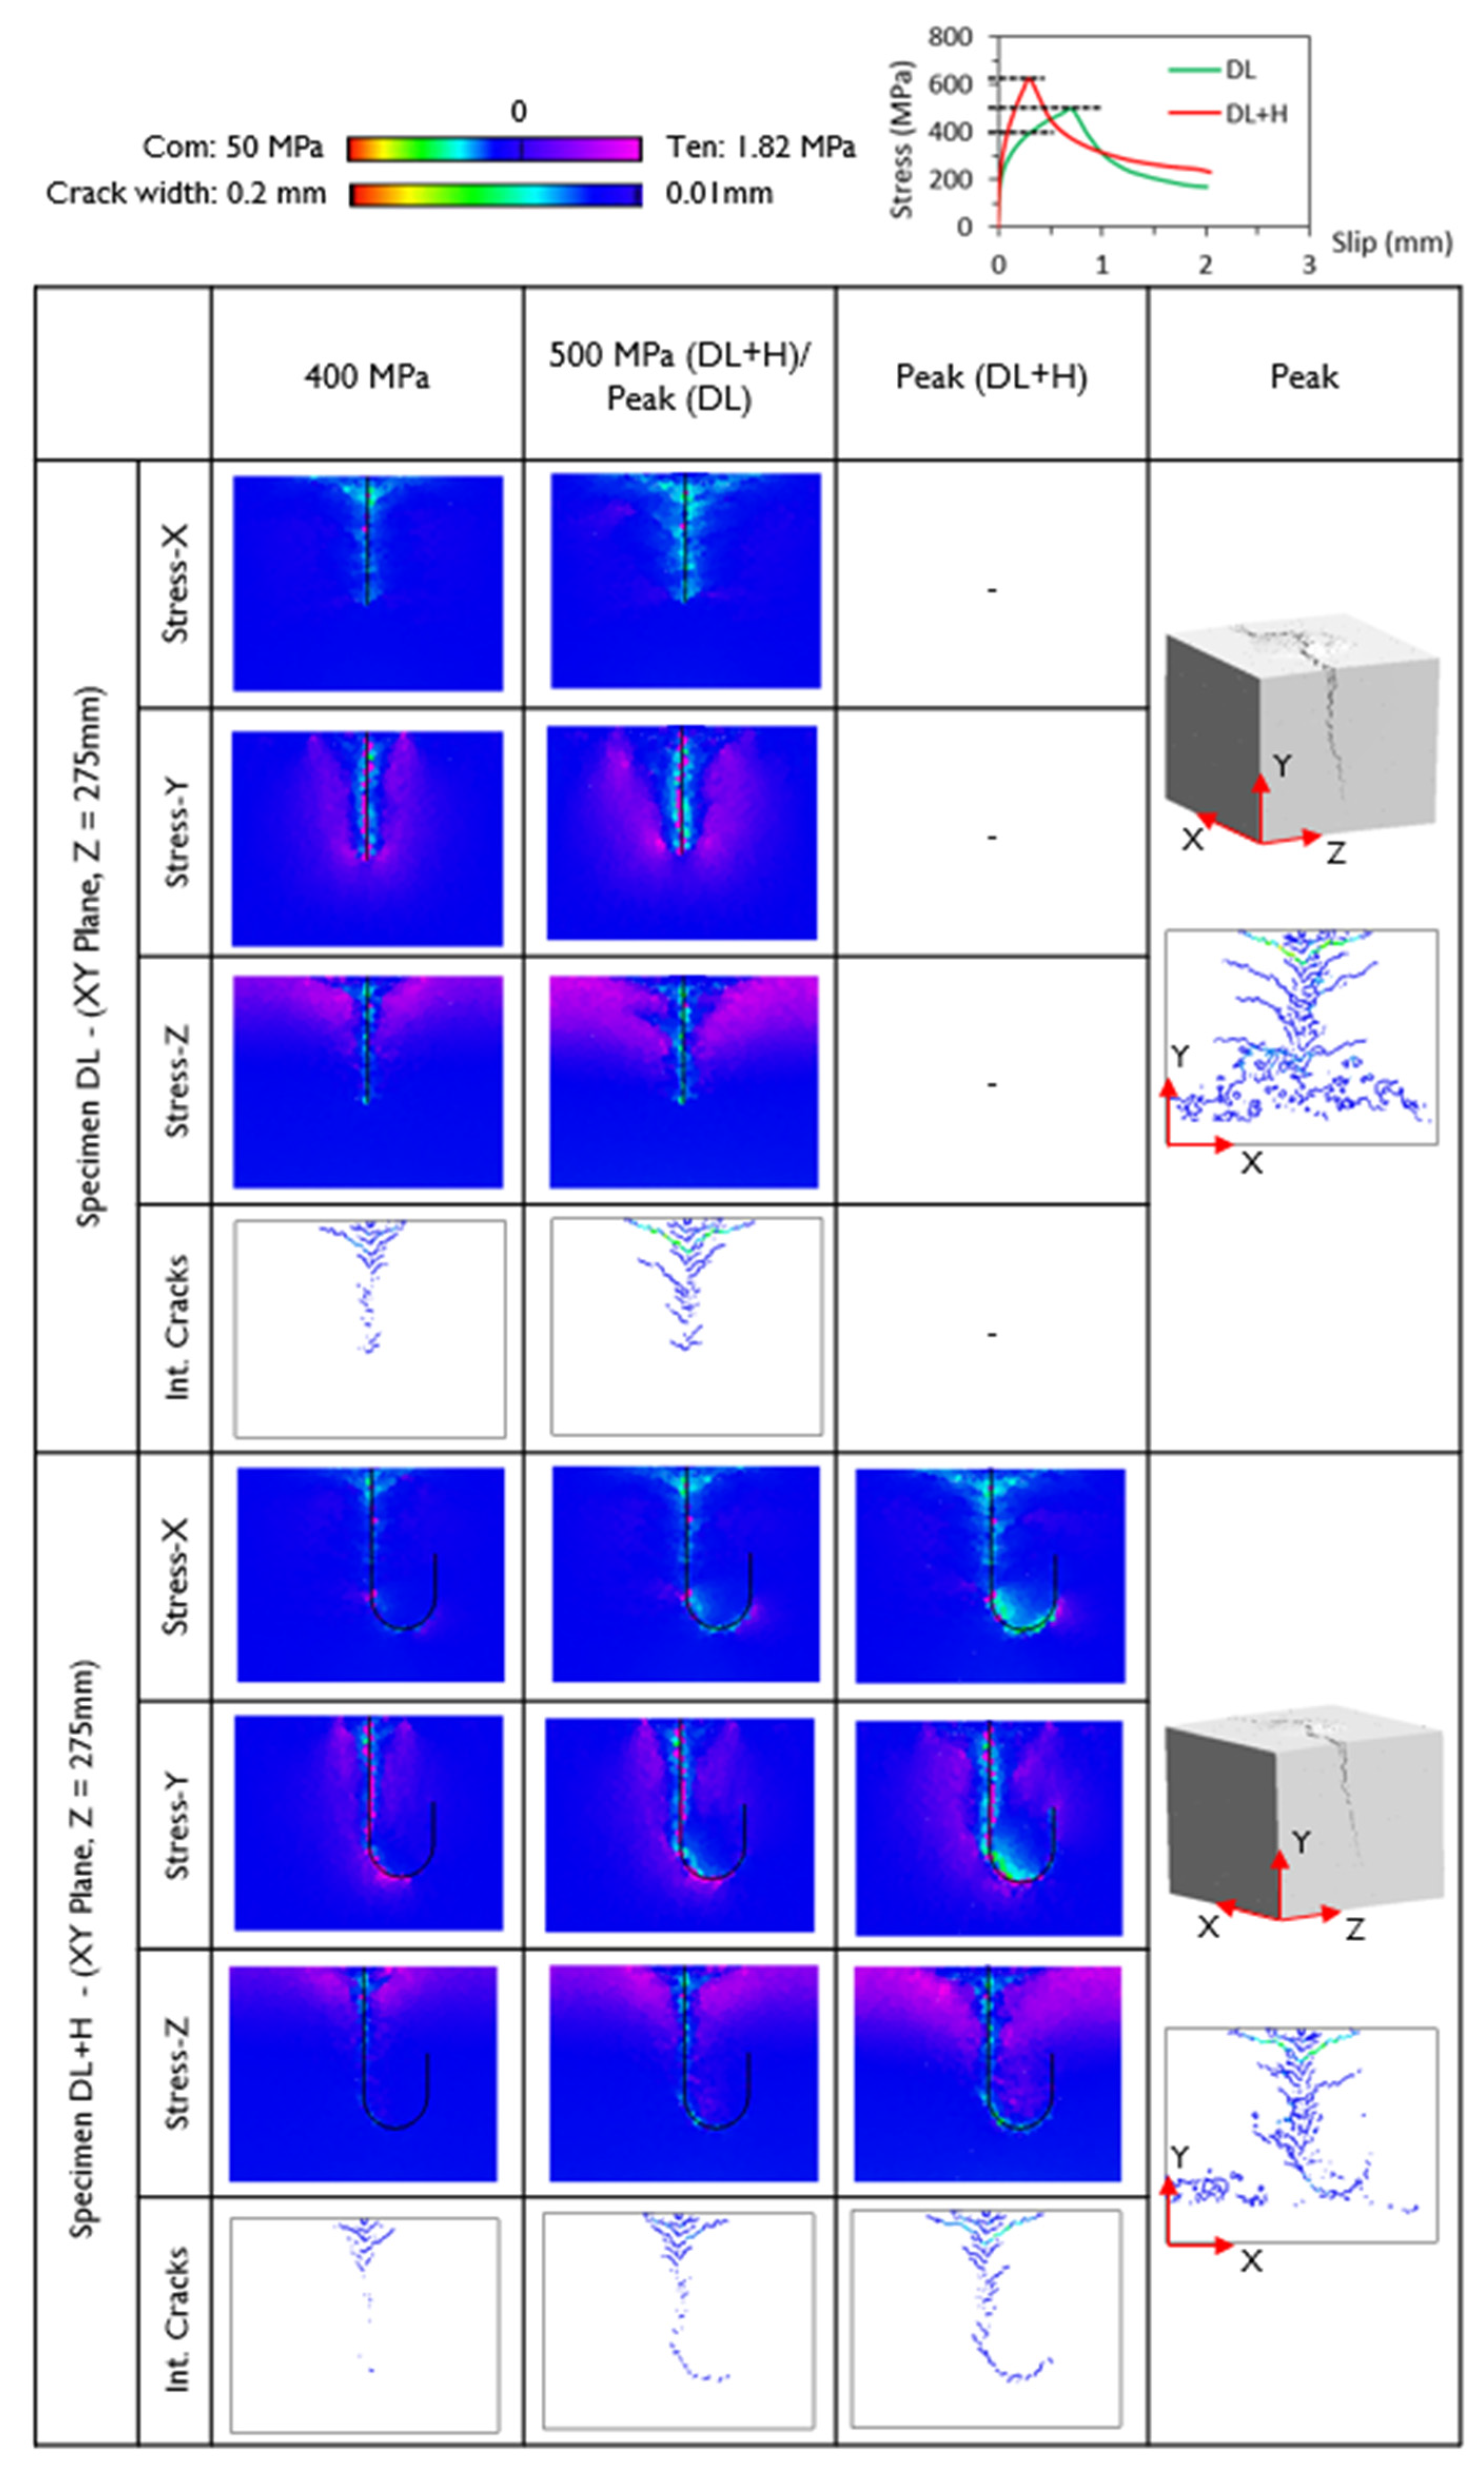
Figure 19.
Concrete stresses perpendicular to splitting failure plane and internal crack patterns at ~650 MPa and peak stresses.
Figure 19.
Concrete stresses perpendicular to splitting failure plane and internal crack patterns at ~650 MPa and peak stresses.
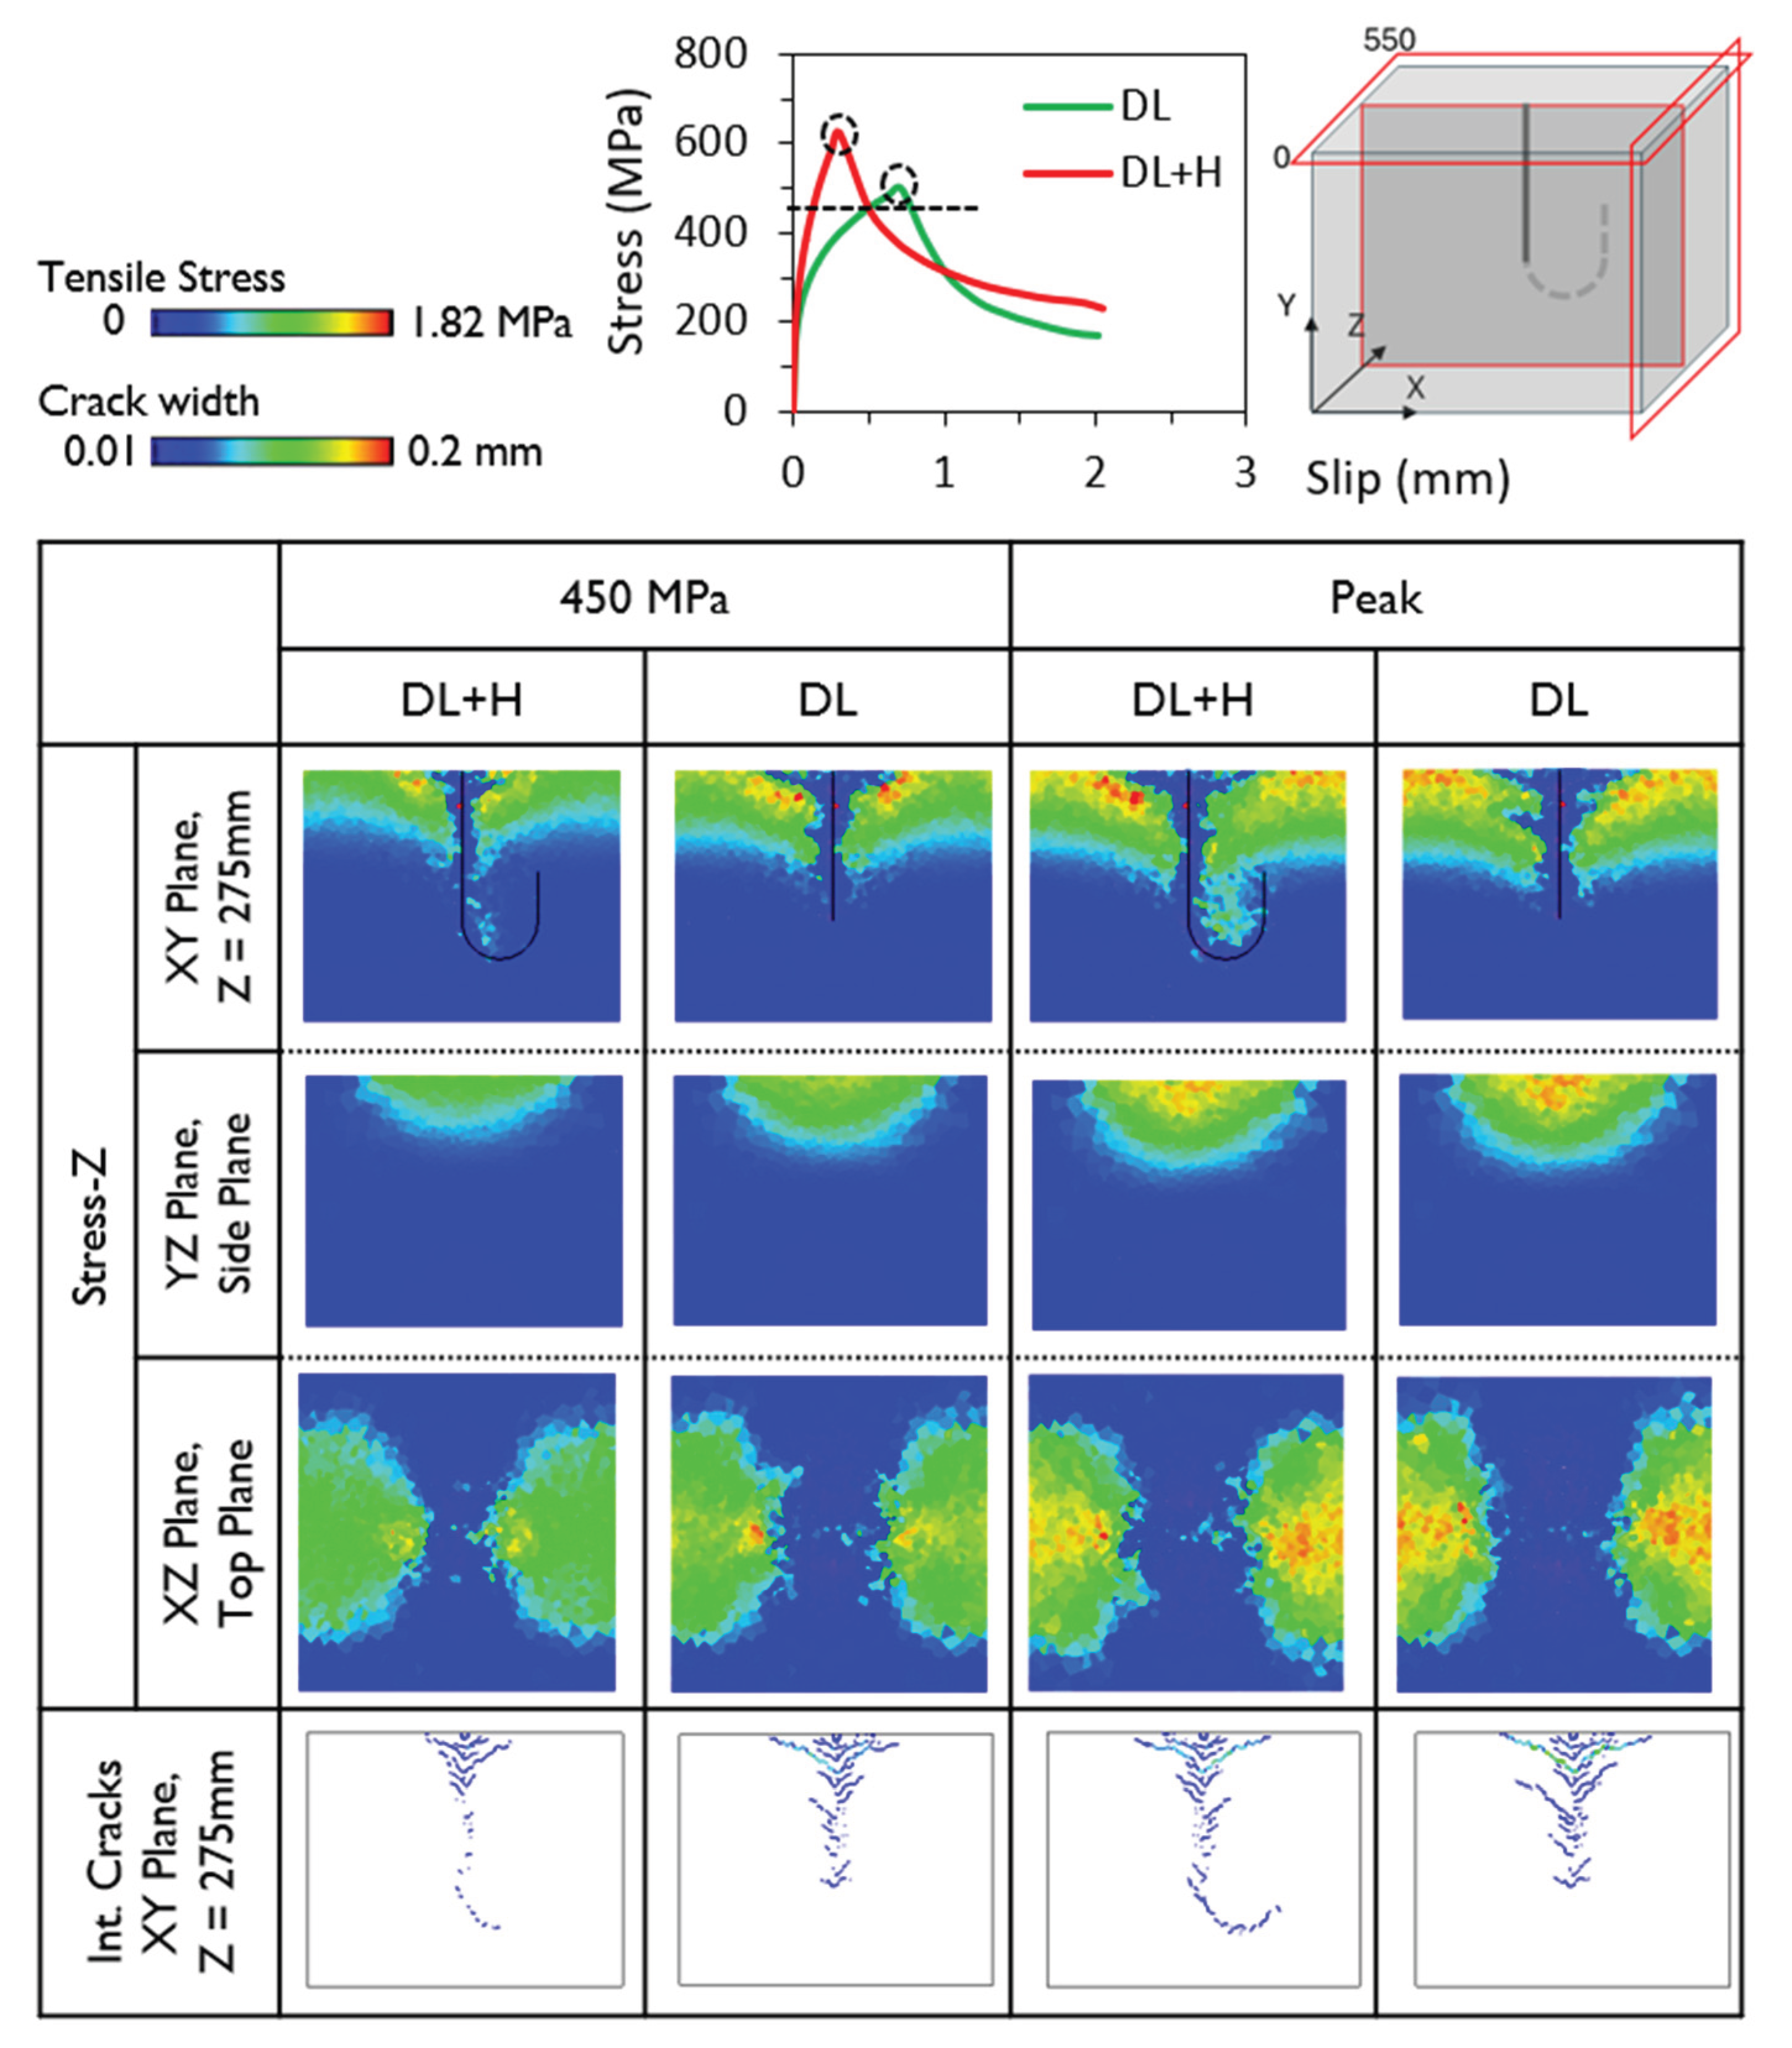

Table 1.
List of tested specimens.
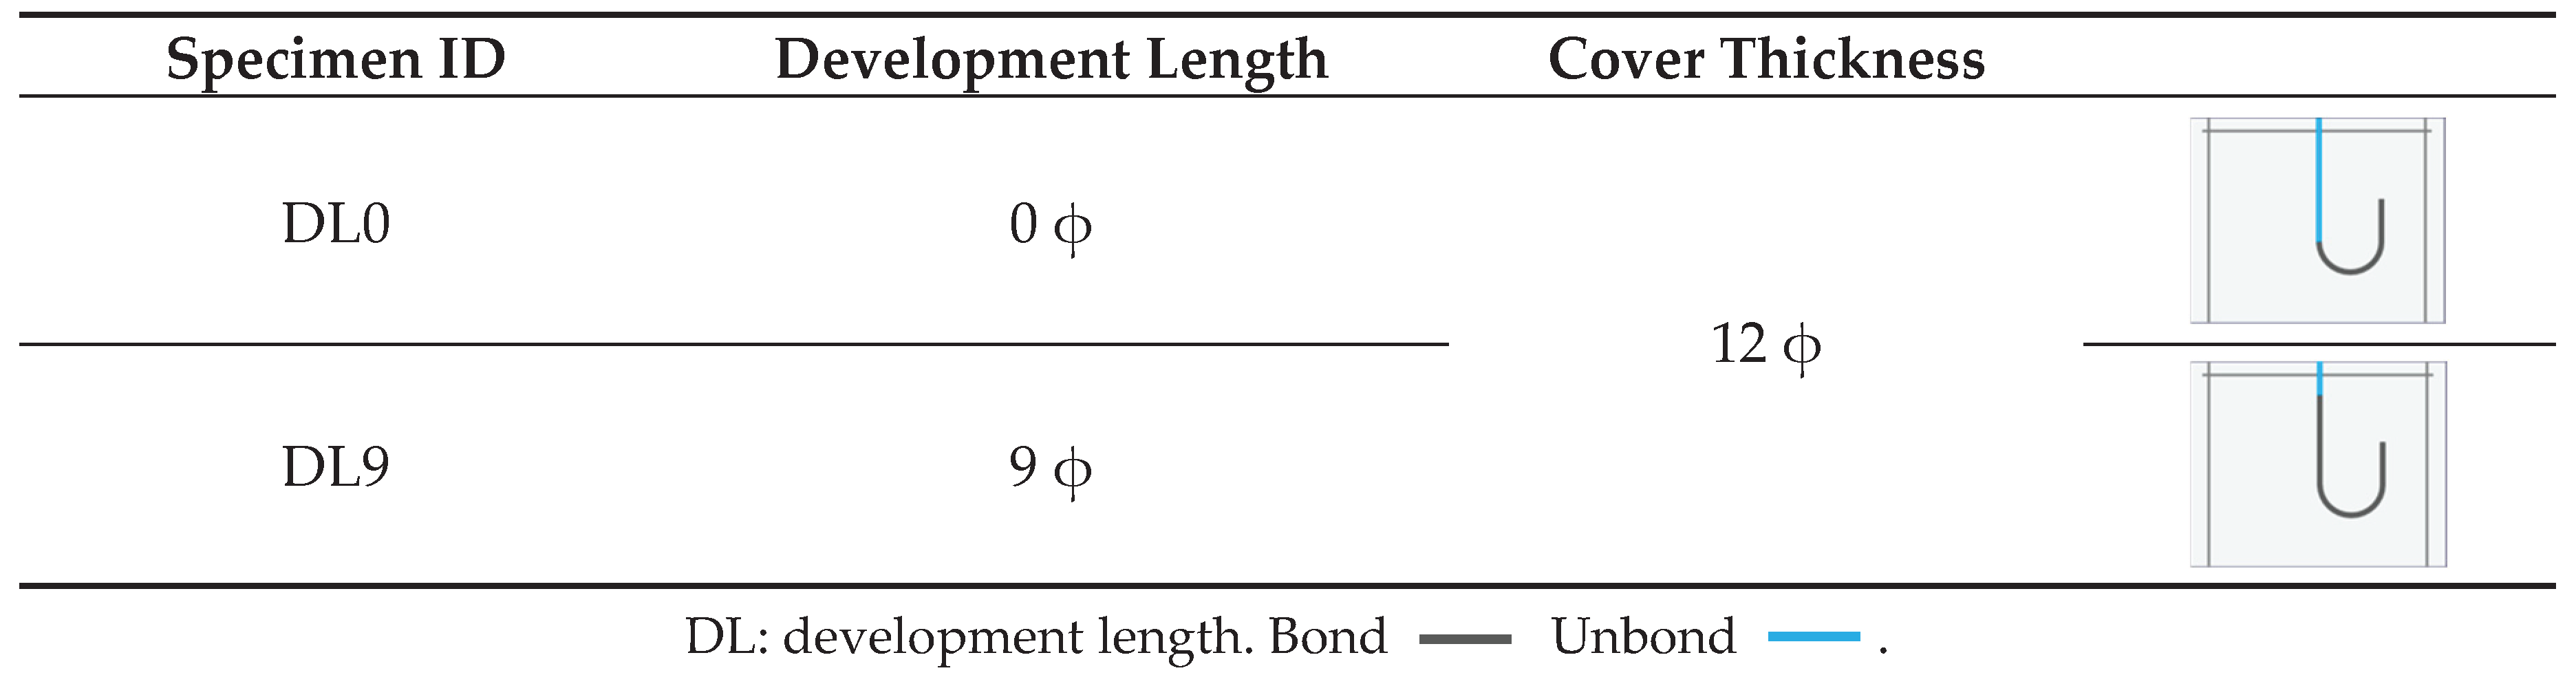 |
Table 2.
Slip values at point ‘A’ for different stress levels.
| Slip at Point ‘A’ | Slip at Top | |||
|---|---|---|---|---|
| 400 MPa | Peak Load | 400 MPa | Peak Load | |
| DL | 0.31 mm | 0.72 mm (499 MPa) | 0.60 mm | 1.1 mm (499 MPa) |
| DL+H | 0.09 mm | 0.31 mm (625 MPa) | 0.42 mm | 0.9 mm (625 MPa) |
Disclaimer/Publisher’s Note: The statements, opinions and data contained in all publications are solely those of the individual author(s) and contributor(s) and not of MDPI and/or the editor(s). MDPI and/or the editor(s) disclaim responsibility for any injury to people or property resulting from any ideas, methods, instructions or products referred to in the content. |
© 2025 by the authors. Licensee MDPI, Basel, Switzerland. This article is an open access article distributed under the terms and conditions of the Creative Commons Attribution (CC BY) license (http://creativecommons.org/licenses/by/4.0/).
Copyright: This open access article is published under a Creative Commons CC BY 4.0 license, which permit the free download, distribution, and reuse, provided that the author and preprint are cited in any reuse.


