Submitted:
22 September 2025
Posted:
23 September 2025
You are already at the latest version
Abstract
Reinforced concrete structures are widely used, and the contact type between steel and concrete directly affects the mechanical properties of the structure. Setting unbonded segments on ordinary rebars can effectively improve the ductility and energy dissipation capacity of the structure. So, in order to study the hysteretic performance of the ordinary rebar with unbonded segment (OR-US) in detail, this study considered the influence of the unbonded length, rebar diameter, rebar strength, concrete strength, and performed hysteretic tests of five specimens aiming to analyze the damage phenomenon, hysteretic characteristics, ductility and energy dissipation capacity. The results indicated that all the specimens exhibited earlier yielding of bonded rebar at the loading end than the unbonded rebar; the decrease of the unbonded length or the increase of the rebar diameter or the rebar strength all resulted in the delayed yielding of bonded rebar at the loading end; compared to the rebar strength, the increase of rebar diameter led to the later yielding of the OR-US specimen; increasing the unbonded length could improve the ductility and energy dissipation capacity of the specimen; the concrete strength, however, had less impact on the ductility and energy dissipation capacity of the specimen. A bond-slip model for the OR-US was put forward, and the errors between theoretical results and test results were within 10%, indicating the theoretical results were in good agreement with the test results, which provides reference for engineering application of the OR-US.
Keywords:
ordinary rebar
; unbonded segment
; ductility
; energy dissipation capacity
; bond-slip
1. Introduction
Reinforced concrete structure is one of the most widely used structural forms in the world, and the bonding properties between rebar and concrete can directly affect the mechanical behavior of the structure [1]. The primary factors influencing the bonding properties between rebar and concrete include the concrete strength, pouring method of concrete, rebar diameter, surface shape of rebar, and constraints around the rebar, and so on [2]. In this paper, the mechanical behavior of the ordinary rebar with unbonded segment (OR-US) was studied. Our research group set the unbonded segments on the vertical rebars of the lower wall panel at the horizontal joint of the precast shear wall (Figure 1), and the research results of quasi-static tests indicated that the unbonded segments of rebars significantly enhanced the ductility and energy dissipation capability of shear wall [3]. Consequently, it is necessary to perform the hysteretic test on a single OR-US in order to better investigate its hysteretic characteristics, which provides a scientific foundation for its design and application.
Regarding the hysteretic performance of rebar, scholars mostly focus on studying ordinary rebar, high-strength rebar, and composite rebar. For ordinary rebar, Qiu et al. [4] introduced an adjustment formula of post-yield stiffness ratio on the Bouc-Wen model and developed a hysteretic constitutive model of rebar considering the influence of buckling. Liu [5] derived the theoretical calculation formulas for the slip and average slip strain of anchored rebar considering the relative slip between rebar and concrete. Xiong et al. [6] put forward the calculation method of slip angle of yield point and failure point on the basis of the existing bond slip moment-angle skeleton curve of two-fold linear rebar. Tripathi et al. [7] proposed a cyclic stress-strain model of rebar considering the influence of rebar buckling, low-cycle fatigue damage, and loading history. Hu et al. [8,9] studied the effects of freezing environment and concrete strength on the bonding properties of rebar in early frozen aged concrete. Albero et al. [10] studied the bonding properties between concrete and unprotected, cold-galvanised, hot-dip galvanised, and stainless-steel bars after exposure to temperatures reaching up to 600 degrees C. In addition, relevant scholars had also studied the bonding properties between rebar and various types of concrete, such as common recycled concrete [11,12], steel-steel fiber recycled aggregate concrete [13], ultra-high performance concrete [14], rubber concrete [15], hybrid basalt-polypropylene fiber concrete [16], high-performance steel fiber reinforced expanded-shale lightweight concrete [17], self-prestressed hybrid steel fiber reinforced concrete [18], 3D printed concrete [19]. Further, the bonding properties between corroded rebar and common concrete [20,21], corroded rebar and recycled concrete [22], stainless rebar and ultra-high performance concrete [23] had also been studied.
For high-strength rebar, relevant scholars mainly studied the bonding properties between 630MPa super-high strength rebar and concrete, analyzed the fatigue life, cyclic response characteristics, and stress-strain hysteretic curve of rebar through the low-cycle fatigue test under constant strain amplitude loading, and established its fatigue life prediction formula [24]. The influence of different test methods and transverse rib spacing on the bonding properties of super-high strength rebar were studied by pull-out test and beam test [25,26]. In addition, relevant scholars had also studied the bonding properties between high-strength rebar with ultra-high performance concrete [27] and steel fiber concrete [28].
For composite rebar, relevant scholars mainly studied the composite rebar with 304 stainless steel clad and HRB400 core steel, analyzed the influence of buckling on the shape of the hysteretic curve, stress-strain performance, and energy dissipation capacity of composite rebar [29], and proposed the skeleton curve of composite rebar with different aspect ratios. A formula for calculating the low-cycle fatigue life of composite rebar considering the influence of length-diameter ratio was proposed [30], and hysteretic and fatigue properties of composite rebar after high temperature were also studied [31].
Compared with fully bonded rebar, the hysteretic properties of OR-US are different due to the presence of unbonded segments. Therefore, in order to study hysteretic properties of OR-US, hysteretic tests were conducted with the variable parameters of the unbonded length, rebar diameter, rebar strength, concrete strength and finally the bond-slip constitutive model of OR-US was established.
2. Test Program
2.1. Design of the Specimens
In this paper, the unbonded length, rebar diameter, rebar strength, and concrete strength were taken as the research variables, and the hysteresis tests of five OR-US specimens were conducted. The test parameters were shown in Table 1, among which JD was the reference specimen, WC, GZ, GQ, HQ were compared with JD for unbonded length, rebar diameter, rebar strength, concrete strength respectively. The specific dimensions of the specimen were shown in Figure 2. The rebar with outer concrete was divided into the anchorage zone, unbonded zone, and bonded zone at the loading end. In order to facilitate the installation of the specimen, the length of the protruding outward rebar at the loading end was set as 300mm, and the length of rebar with outer concrete was set as 1400mm. In order to accurately measure the horizontal displacement of the OR-US, the 50mm overhang length of rebar at the anchor end was reserved for measuring the displacement of the rebar at the anchor end, and the difference between the displacement of the rebar at the loading end and the displacement of the rebar at the anchor end was the exact horizontal displacement of the OR-US.
2.2. Material Properties
2.3. Test Device and Measurement Scheme
The test device included a loading device and a fixing device. The loading device (Figure 4) was mainly arranged at the loading end, including a loading terminal composed of steel plates, the steel jig, and the horse part; the role of the horse part was not only to facilitate the disassembly of the rebar but also the recycling of the steel jigs, and two steel jigs and horse parts made the rebar closely connected with the loading terminal, so that the rebar could effectively transfer force. The fixing device was shown in Figure 5, the specimen was fixed vertically by applying 40kN pressure through 20t jacks and horizontally by the steel beam at the loading end and the steel plate at the anchoring end through four long screws. The steel beam was fixed on the reaction frame at the loading end; furthermore, the 25t MTS actuator was adopted to apply the horizontal load.
The displacement meters were set at the rebar at the loading end, the protruding outward rebar and the concrete at the anchorage end, respectively. In order to facilitate the measurement of the displacement of the rebar at the loading end, a handle-shaped member was set on the rebar at a distance of 3cm from the concrete interface, as shown in Figure 6. The handle-shaped member and the rebar were fixed through bolts, and the measuring end of the displacement meter was close to the handle-shaped member. In order to obtain the yield order of rebar in bonded zone and unbonded zone, three strain gauges with equal spacing were pasted in bonded zone and unbonded zone, respectively, and two strain gauges with equal spacing were pasted in anchored zone, as shown in Figure 7.
2.4. Loading Regime
Displacement loading was adopted in this test. With the increase of loading displacement, the elongation of the rebar increased. Since the rebar was mainly in tension in actual structure, and when the rebar was under pressure, it might be bent, the loading method of positive hysteresis was adopted in this paper, and the tensile direction of the rebar was set to the positive direction. According to 《Standard for test method of concrete structures》(GB/T 50152-2012) and the results of previous numerical simulation, it was stipulated that when the positive tensile displacement was less than 10mm, the tensile displacement of each stage was 1mm, and the positive compression returned to zero; when the positive tensile displacement was 10mm-20mm, the tensile displacement of each stage was 2mm, and the positive compression returned to 1mm; when the positive tensile displacement was 20mm-30mm, the tensile displacement of each stage was 3mm, and the positive compression returned to 2mm, and so on. Each stage was cycled once, and the loading regime was shown in Figure 8. Due to the impact force on the MTS actuator caused by the rebar break, the normal operation of the MTS actuator was affected. Therefore, in order to protect the test equipment and combined with the previous numerical simulation results, the tests were terminated when the specimens were loaded to about 40mm or when both the bonded rebar at the loading end and the unbonded rebar yielded.
3. Test Results and Analysis
3.1. Damage Phenomenon
In order to facilitate comparative analysis, the test phenomena of each specimen were summarized, as shown in Table 4, and the final failure pattern of each specimen was shown in Figure 8.
As can be seen from Table 4 and Figure 9, for all specimens, protruding outward rebar at the loading end yielded first, then the bonded rebar at the loading end yielded, and finally the unbonded rebar yielded. Moreover, the reduction of the unbonded length, the increase of the rebar diameter or the rebar strength all led to the later yielding of the bonded rebar at the loading end, and the decrease of the concrete strength led to the earlier yielding of the bonded rebar at the loading end.
3.2. Hysteresis Characteristics
According to the test results, hysteretic curves and skeleton curves of each specimen were obtained, as shown in Figure 10 and Figure 11.
It should be noted in particular that the yield platform in the hysteretic curve and skeleton curve represented the yield of the protruding outward rebar at the loading end. As can be seen from Figure 10 and Figure 11, by calculation, the cumulative energy consumption of JD, WC, GZ, GQ, and HQ were 2891.3, 2687.1, 3904.0, 3589.5, 3043.5Nm respectively, and the detailed comparative analysis was in Section 3.4. The skeleton curves of each specimen included elastic stage, yield stage and strengthening stage. The increase of rebar strength or the decrease of unbonded length all led to the increase of elastic stiffness of the specimen. Compared with the effect of rebar strength, increasing the rebar diameter could lead to a later yield of specimen. Reducing the unbonded length could lead to an earlier yield of specimen. Concrete strength had little influence on the skeleton curve.
3.3. Ductility
Ductility refers to the ability of a structure or component to resist plastic deformation without a significant reduction in bearing capacity. For ordinary rebar, if the yield platform of the rebar was ignored, that was, the rebar entered the strengthening stage immediately after yielding, the deformation capacity of the rebar would be underestimated, which could not provide an accurate basis for seismic design. Therefore, the yield platform elongation [32] α was adopted in this paper as the ductility index of the rebar, and its calculation formula was as follows.
Where, δyc was the elongation of the rebar when the bonded rebar at the loading end yielded, and l was the sum of the length of protruding outward rebar and the length of bonded rebar at the loading end.
After calculation, the yield platform elongations of each specimen were shown in Table 5.
As can be seen from Table 5, the decrease of unbonded length or the increase of rebar diameter or the rebar strength all led to the ductility reduction of the specimen, and the concrete strength had little influence on the ductility of the specimen.
3.4. Energy Dissipation Capacity
The area of the hysteresis loop in the hysteresis curve reflects the energy dissipation capacity of the structure. The larger the area of the hysteresis loop, the stronger the energy dissipation capacity of the specimen, and the sum of each hysteresis loop area is the cumulative energy dissipation of the specimen [33]. The cumulative energy dissipation of each specimen was shown in Figure 12.
As can be seen from Figure 12, take the cumulative energy consumption of the last level for example, the energy dissipation capacity of specimen GZ was 8.8% larger than that of specimen GQ, that was because compared with GQ, GZ had a higher deformation ability, which led to a higher energy dissipation capacity. The energy dissipation capacity of specimen WC was 7.6% smaller than that of specimen JD, that was because the unbonded length of specimen WC was smaller than that of specimen JD, which led to a smaller displacement. The energy dissipation capacity of JD and HQ was 5% different, which indicated that the concrete strength had little influence on the energy dissipation capacity of the specimen, that was because the concrete strength affected the bond performance between rebar and concrete, when the concrete strength decreased, the bond performance between rebar and concrete also decreased, leading to the increase of rebar displacement and the decrease of bearing capacity, so the area of hysteresis ring might change little.
4. Bond-Slip Constitutive Model of OR-US
Due to the presence of the unbonded segment in OR-US, the bond-slip constitutive model of ordinary rebar could not be directly adopted. Based on the test results, this paper established the bond-slip constitutive model of OR-US by considering the influence of unbonded length, rebar strength, rebar diameter, and concrete strength.
4.1. Proposal of the Bond-Slip Constitutive Model of OR-US
The bond-slip curve of OR-US could be obtained after transforming the load-displacement curve obtained by the OR-US hysteresis test, as shown in Figure 13, where s was the displacement at the loading end, τ was the bonding strength and its calculation formula was as follows.
Where F was the load applied at the loading end, d was the rebar diameter, and
was the length of the rebar in the concrete.
As can be seen from Figure 13, the bond-slip curve of OR-US could be divided into three stages: elastic stage, yield stage and strengthening stage, and its bond-slip constitutive model was as follows.
(1) Elastic stage:
This stage could be regarded as a straight line, and the formula was as follows.
Where β represented the slope at the elastic stage, τ1 was the bonding strength corresponding to the initial yield of the rebar, and s1 was the displacement at the loading end corresponding to the initial yield of the rebar.
(2) Yield stage:
This stage could be approximated as a horizontal line, and the calculation formula was as follows.
Where s2 was the displacement at the loading end corresponding to the starting point of the strengthening stage.
(3) Strengthening stage:
This stage was a curve, and the calculation formula was as follows.
Where, s3 was the displacement at the loading end corresponding to the end point of the strengthening stage, τ2 and τ3 were the bonding strength corresponding to the starting and end point of the strengthening stage, respectively, γ was the shape parameter, which considered comprehensively the influences of the unbonded length, rebar diameter, rebar strength, and concrete strength, where μ was the influence coefficient of the unbonded length, lwc was the unbonded length, ρ was the influence coefficient of rebar diameter, and φ was the comprehensive influence coefficient, reflecting the influence of rebar strength and concrete strength. β, γ, μ, ρ, φ were obtained by fitting according to the test results.
Therefore, the bond-slip constitutive model of OR-US was as follows.
The model reflected the influence of unbonded length, rebar strength, rebar diameter and concrete strength on the bond-slip of OR-US, and was capable of capturing the entire stress-strain process of OR-US.
4.2. Verification of the Bond-Slip Constitutive Model of OR-US
According to the hysteretic test results, the test data of each key point was obtained, as shown in Table 6. The test results were substituted into the formulas of each stage, and the parameters were evaluated reversely and fit, as shown in Table 7.
Put the data in Table 6 and Table 7 into formula (3) to (7), and the bond-slip theoretical curves of all specimens could be obtained, which were compared with the test curve, and the results were shown in Figure 14.
It could be seen from Figure 14 that except the second point of HQ bond-slip model, the errors of other bond-slip models were within 10%, which indicated that the theoretical values were in good agreement with the test values, therefore, the bond-slip constitutive model proposed in this paper could better reflect the bond-slip characteristics of OR-US.
However, in this model, only the influence of unbonded length, rebar strength, rebar diameter and concrete strength were considered, the location of unbonded segment was not considered, moreover, the number of test specimen was small, so it was necessary to conduct a lot of tests to verify the accuracy of the model consider all the influencing factors.
5. Conclusions
In this paper, the hysteretic properties of OR-US were studied by considering the effects of unbonded length, rebar diameter, rebar strength, concrete strength, and the damage phenomenon, hysteretic characteristics, ductility and energy dissipation capacity were analyzed, and finally the bond-slip constitutive model of OR-US was proposed. Specific conclusions are as follows.
(1) All the specimens exhibited earlier yielding of bonded rebar at the loading end than the unbonded rebar. The reduction of the unbonded length, the increase of the rebar diameter and the rebar strength all resulted in the delayed yielding of bonded rebar at the loading end. The reduction of concrete strength led to the earlier yield of bonded steel.
(2) The increase of rebar strength and the decrease of unbonded length all led to the increase of elastic stiffness of the specimen. Compared with the effect of rebar strength, the increase of the rebar diameter led to the later yield of the specimen. The reduction of unbonded length led to the earlier yield of specimen. Concrete strength had little influence on the hysteretic curve and skeleton curve.
(3) The decrease of unbonded length or the increase of rebar diameter or strength all reduced the ductility of the specimen, and the increase of unbonded length improved the energy dissipation capacity of the specimen. The concrete strength had little influence on the ductility and energy dissipation capacity of the specimen.
(4) The three-stage bond-slip model proposed in this paper could better reflect the bond-slip characteristics of OR-US.
Author Contributions
Conceptualization, C.S. and Y.F.; methodology, C.S.; validation, C.S., Y.F. and S.L.; formal analysis, C.S.; investigation, Z.Z.; resources, C.S.; data curation, Y.F.; writing—original draft preparation, Y.F.; writing—review and editing, S.L.; visualization, Z.Z.; supervision, C.S.; funding acquisition, C.S. All authors have read and agreed to the published version of the manuscript.
Funding
This research was funded by the Major Scientific & Technological Innovation Project of Shandong Province, grant number 2021CXGC011204, and the Natural Science Foundation of Shandong Province, grant number ZR2023QE346, and the National Natural Science Foundation of China, grant number 51908336.
Institutional Review Board Statement
Not applicable.
Informed Consent Statement
Not applicable.
Data Availability Statement
The data and materials are included in the manuscript.
Conflicts of Interest
The authors declare no conflicts of interest.
References
- Sun, L.; Wang, C.; Zhang, C.W.; Yang, Z.Y.; Li, C.; Qiao, P.Z. Experimental investigation on the bond performance of sea sand coral concrete with FRP bar reinforcement for marine environments. Adv. Struct. Eng. 2023, 26, 533–546. [Google Scholar] [CrossRef]
- Huang, J.; Lu, W.R.; Yin, C.L.; Fu, C.Q. Review of the impact of corrosion on the bond performance between reinforcement and concrete. Mater. Rep. 2024, 38, 228–239. [Google Scholar]
- Sun, C.F.; Liang, S.T.; Zhu, X.J.; Li, H.; Guo, J.M.; Li, G.; Song, Y.M.; Wu, D.Y. Experimental study and numerical simulation of precast shear wall with rabbet-unbonded horizontal connection. Int. J. Concr. Struct. M. 2020, 14, 1–16. [Google Scholar] [CrossRef]
- Qiu, J.L.; Gong, J.X. Hysteretic constitutive model of reinforcing bars considering effect of buckling. China Civ. Eng. J. 2019, 52, 11–21. [Google Scholar]
- Liu, J. A modified constitutive model of reinforcement considering relative slip between steel bars and concrete. J. Build. Struct. 2021, 42, 448–455. [Google Scholar]
- Xiong, N.; Gu, D.S. A calculation model for the slip moment-rotation of reinforcement bond. Eng. Mech. 2019, 36, 98–105. [Google Scholar]
- Tripathi, M.; Dhakal, R.P. Constitutive model for reinforcing bars including bar buckling and low-cycle fatigue. Eng. Struct. 2023, 295, 1–16. [Google Scholar] [CrossRef]
- Hu, X.P.; Peng, G.; Niu, D.T.; Zhao, N. Bond characteristics of deformed steel bar in early-age frozen concrete during service period. Eng. Struct. 2019, 197, 1–8. [Google Scholar] [CrossRef]
- Hu, X.P.; Peng, G.; Niu, D.T.; Wang, J. Experimental study on bond properties between early-age concrete and deformed steel bars. Constr. Build. Mater. 2020, 236, 1–11. [Google Scholar] [CrossRef]
- Albero, V.; Hernández-Figueirido, D.; Roig-Flores, M.; Melchor-Eixea, A.; Piquer, A. High-temperature effects on bond behaviour between concrete and corrosion resistant steel reinforcements. Constr. Build. Mater. 2024, 447, 1–10. [Google Scholar] [CrossRef]
- Fayed, S.; Madenci, E.; Özkiliç, Y.O.; Mansour, W. Improving bond performance of ribbed steel bars embedded in recycled aggregate concrete using steel mesh fabric confinement. Constr. Build. Mater. 2023, 369, 1–15. [Google Scholar] [CrossRef]
- Su, T.; Wang, C.X.; Cao, F.B.; Zou, Z.H.; Wang, C.G.; Wang, J.; Yi, H.H. An overview of bond behavior of recycled coarse aggregate concrete with steel bar. Rev. Adv. Mater. Sci. 2021, 60, 127–144. [Google Scholar] [CrossRef]
- Ren, R.; Xu, X.J.; Li, D.B.; Fan, L.; Liu, Q.L.; Liu, X.G. Experimental study on the bond-slip behavior of steel-steel fiber recycled aggregate concrete. Buildings-basel 2022, 12, 1–19. [Google Scholar] [CrossRef]
- Wang, Y.H.; Zhang, J.Q.; Tian, Q.L.; Ma, X.B.; Yao, S.F.; Liu, X. Study on influence of different test method on bond-anchorage properties of 630MPa high-strength reinforcement. Build. Struct. 2023, 53, 113–118. [Google Scholar]
- Li, H.; Ping, K.L.; Chen, W.M.; Luo, Y.F.; Cao, Y.G. Study on bonding properties of steel bar and rubber concrete under different loading rates. J. Changjiang River Sci. Res. Inst. 2024, 1–10. [Google Scholar]
- Cheng, Q.J.; Liu, S.T.; Wang, X.Y.; Wen, Y.H.; Wu, M.X.; Kang, Y.K. Study on bonding properties of hybrid basalt-polypropylene fiber concrete and deformed bar. Build. Struct. 2023, 53, 1311–1318. [Google Scholar]
- Zhao, M.S.; Liu, G.R.; Liu, L.L.; Zhang, Y.Y.; Shi, K.; Zhao, S.B. Bond of ribbed steel bar in high-performance steel fiber reinforced expanded-shale lightweight concrete. Buildings 2021, 11, 1–17. [Google Scholar] [CrossRef]
- Chu, S.H.; Unluer, C.; Yoo, D.Y.; Sneed, L.; Kwan, A.K.H. Bond of steel reinforcing bars in self-prestressed hybrid steel fiber reinforced concrete. Eng. Struct. 2023, 291, 1–14. [Google Scholar] [CrossRef]
- Wang, Z.B.; Jia, L.T.; Deng, Z.C.; Zhang, C.; Zhang, Z.D.; Chen, C.; Pan, J.L.; Zhang, Y.M. Bond behavior between steel bars and 3D printed concrete: effect of concrete rheological property, steel bar diameter and paste coating. Constr. Build. Mater. 2022, 349, 1–13. [Google Scholar] [CrossRef]
- Zhang, Y.B.; Zheng, S.S.; Dong, L.G.; Yang, S.; Zheng, Y.; Gao, X. Experimental study on bond behavior of corroded reinforcements in concrete under reversed cyclic loading. J. Build. Struct. 2024, 45, 237–248. [Google Scholar]
- Zheng, Y.; Zheng, S.S.; Yang, L.; Dong, L.G.; Zhang, Y.B. Experimental study and analytical model of the bond behavior of corroded reinforcing steel bars in concrete. Constr. Build. Mater. 2022, 327, 1–16. [Google Scholar] [CrossRef]
- Niu, J.G.; Bian, Y.; Xie, C.B. Interfacial bond properties between recycled concrete and corroded steel bar. Sci. Technol. Eng. 2020, 20, 7845–7851. [Google Scholar]
- Li, H.Y.; Wu, W.H.; Hou, N.; Li, R.; Deng, R.T.; Zhao, J. Study on bonding and anchoring properties of stainless steel bar and UHPC. J. Xi'an Univ. Archit. Technol. (Nat. Sci. Ed.) 2023, 55, 633–642. [Google Scholar]
- Sun, C.Z.; Miao, C.Q.; Li, A.Q.; Qiao, Y. Experimental study on low cycle fatigue properties of 630 MPa super-high strength steel bar. J. Build. Struct. 2021, 42, 194–202. [Google Scholar]
- Wang, R.L.; Ma, B.; Chen, X. Experimental study on bond performance between UHPC and steel bars. J. Build. Eng. 2023, 79, 1–16. [Google Scholar] [CrossRef]
- Wang, Y.H.; Zhao, X.Q.; Yao, S.F.; Liu, X. Experiments on the performance of bond anchorage between high-strength variable rib reinforcement and concrete. J. Chongqing Univ. 2020, 43, 32–40. [Google Scholar]
- Li, Y.Y.; Zhao, Y.L.; Wu, K.; Wang, Q. Bond property and reliability analysis between high strength rebar and ultra-high-performance concrete. Eng. Mech. 2024, 1–10. [Google Scholar]
- Gao, D.Y.; Huang, Y.C.; Chen, G.; Yang, L. Bond stress distribution analysis between steel bar and steel fiber reinforced concrete using midpoint stress interpolation method. Constr. Build. Mater. 2020, 260, 1–12. [Google Scholar] [CrossRef]
- Hua, J.M.; Wang, F.; Xue, X.Y.; Ding, Z.H.; Huang, Y.P. Study on low-cycle fatigue properties of bimetallic steel bar considering buckling. J. Build. Struct. 2023, 44, 129–137. [Google Scholar]
- Qiu, H.; Zhang, S.X.; Li, W.; Li, Y.J. Experimental study on hysteretic behaviors of stainless steel clad rebar considering buckling effect. Eng. Mech. 2024, 1–10. [Google Scholar]
- Hua, J.M.; Wang, F.; Xue, X.Y.; Huang, Y.P.; Chen, Z.S.; Wang, N. Low-cycle fatigue performance of stainless-clad bimetallic steel bars after exposure to elevated temperatures. J. Harbin Inst. Technol. 2022, 54, 150–160. [Google Scholar]
- Liu, H.F. Suggestion and discussion on the seismic steel property based on the ductility concrete structure. J. Qinghai Univ 2011, 29(01), 4–8. [Google Scholar]
- Zhang, J.G.; He, S.F.; Zhao, J.X.; Zhang, S.J.; Song, J.Y.; Liu, Y.Z. Cyclic tests on sub-structure of BRB-RC frame with controllable bending failure mode. J. Build. Struct. 2024, 1–14. [Google Scholar]
Figure 1.
Setup of unbonded segment.
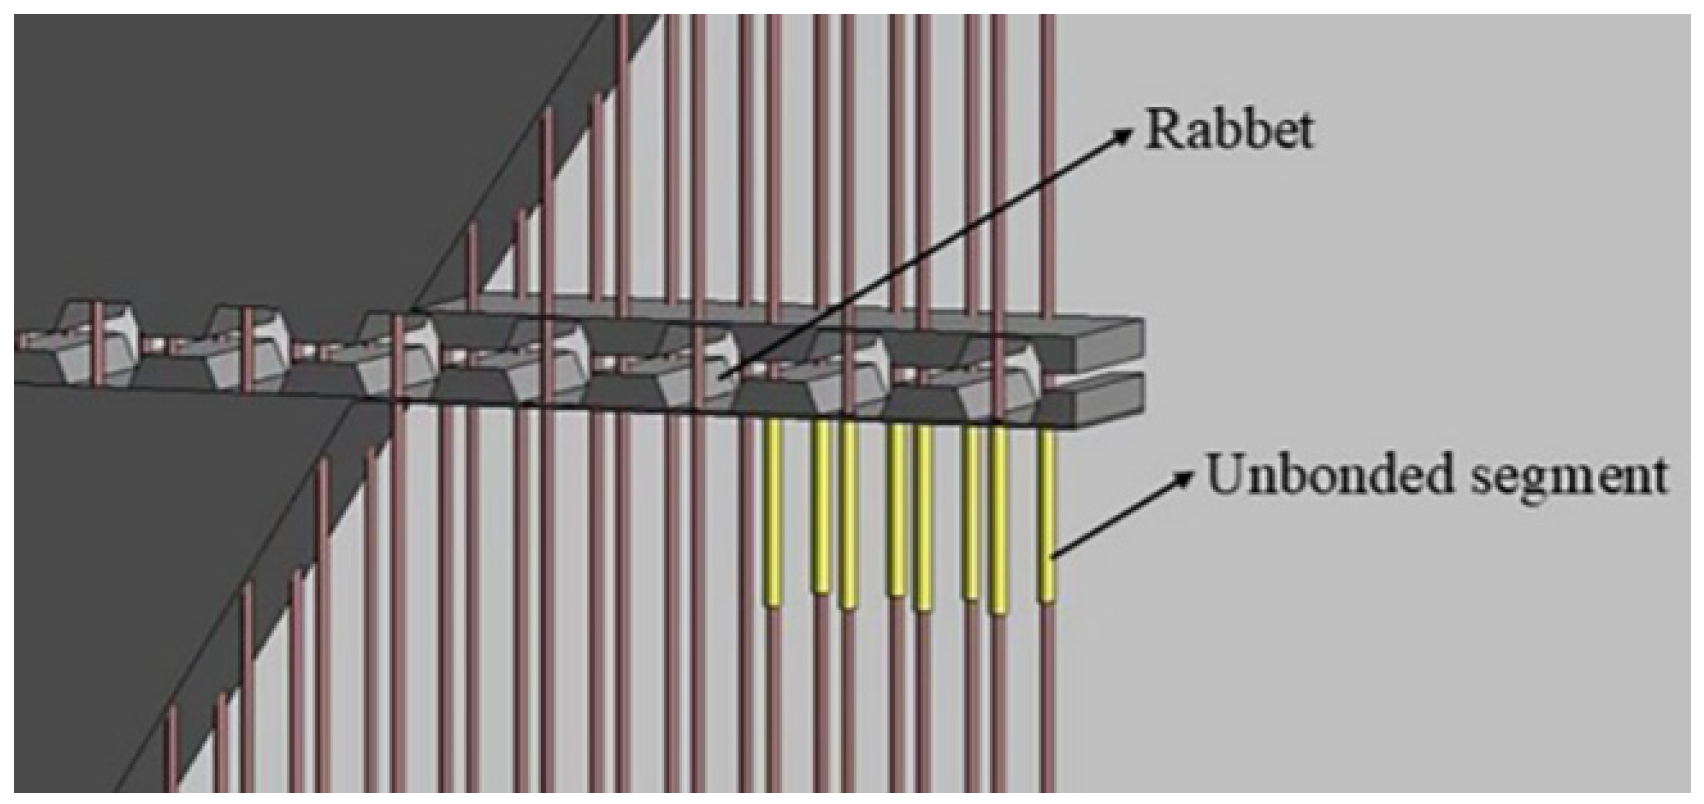
Figure 2.
Geometric dimensions and reinforcement of the specimen (unit: mm).
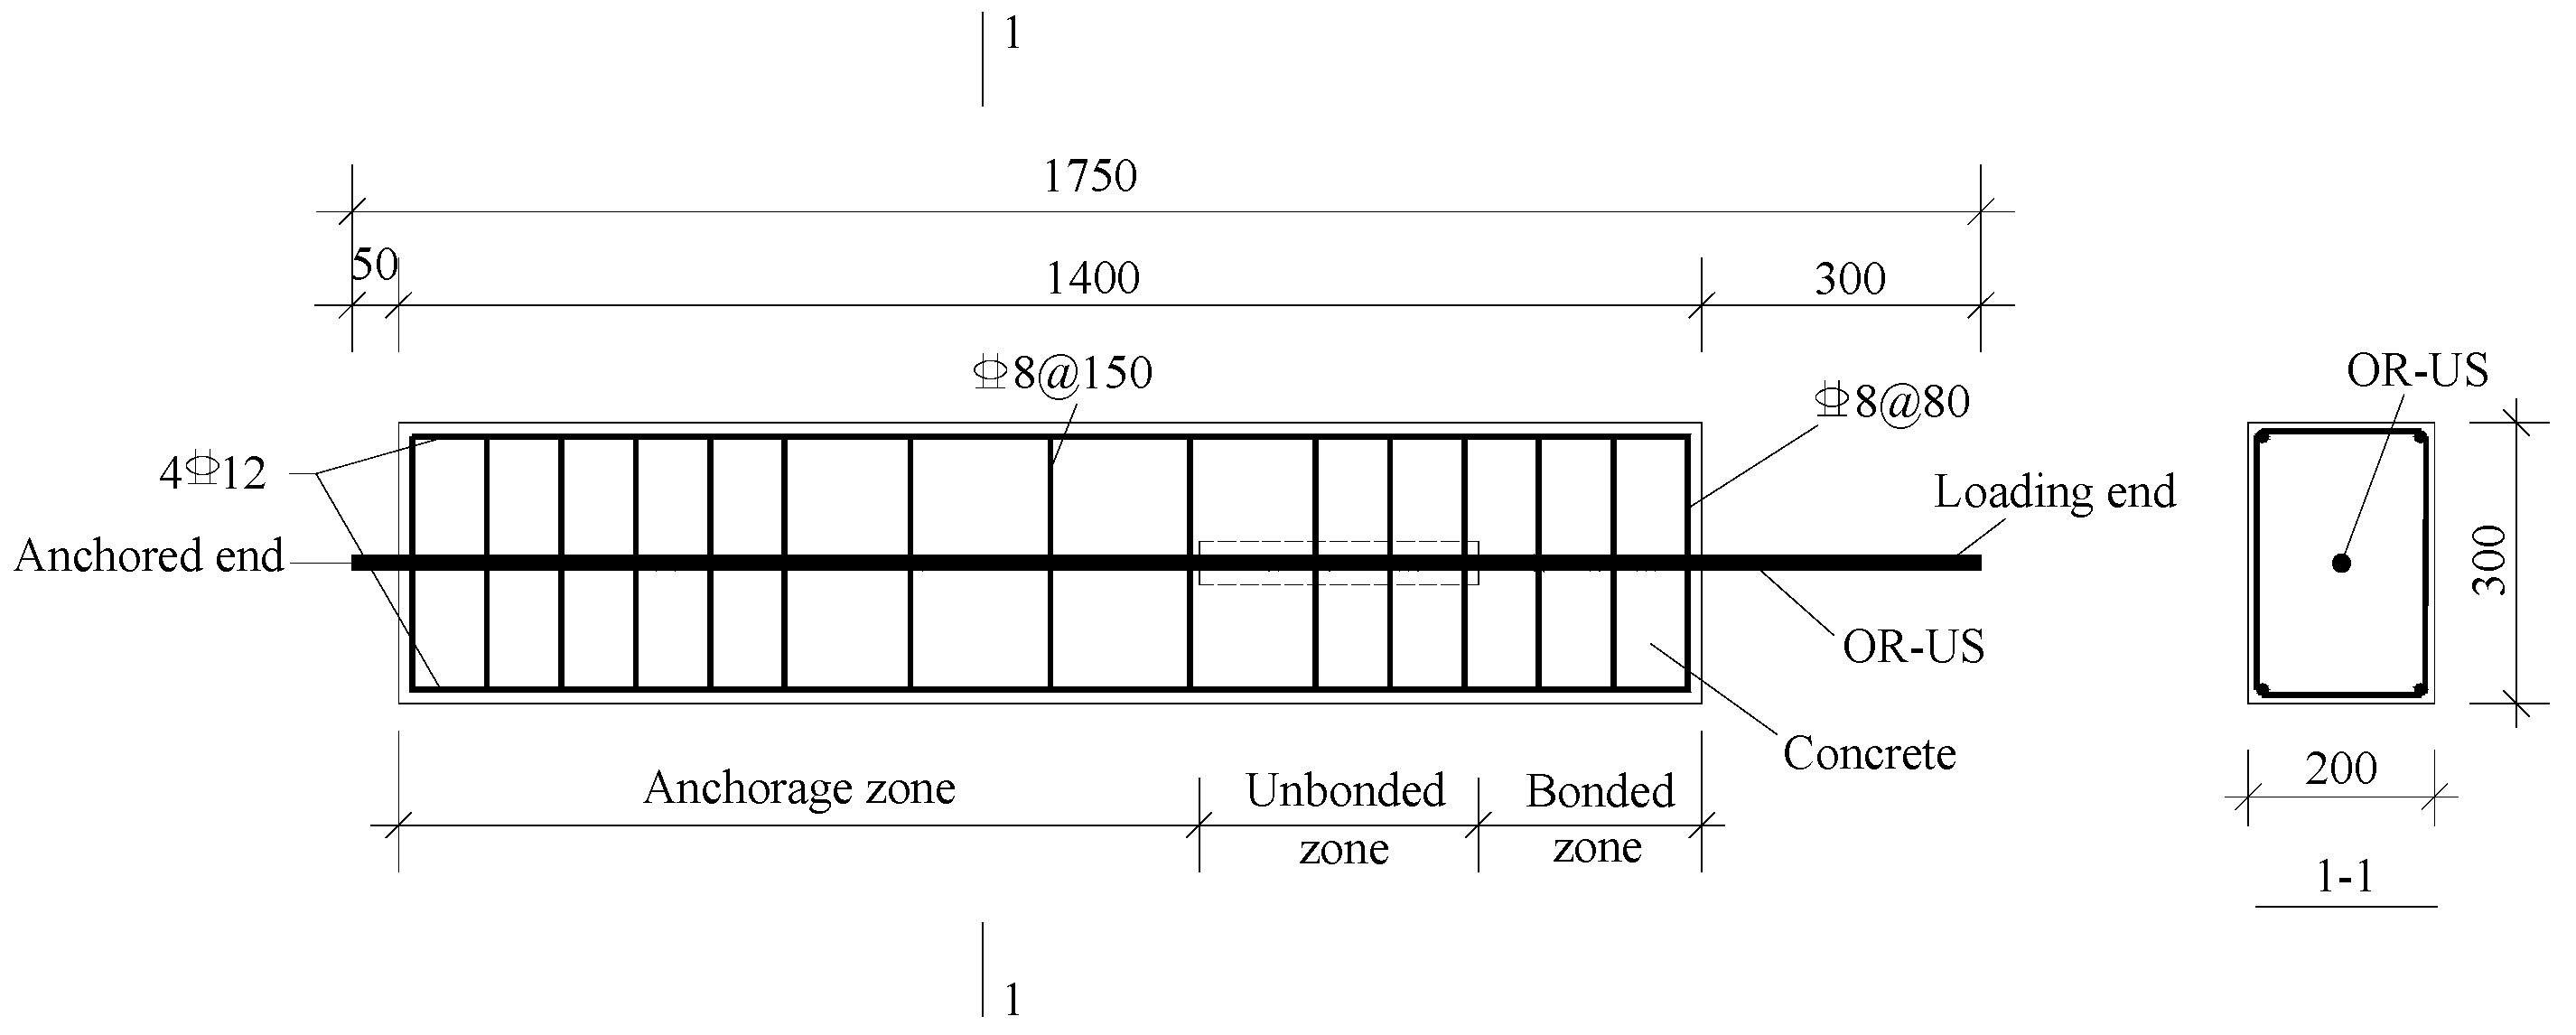
Figure 3.
Tensile test of rebar.
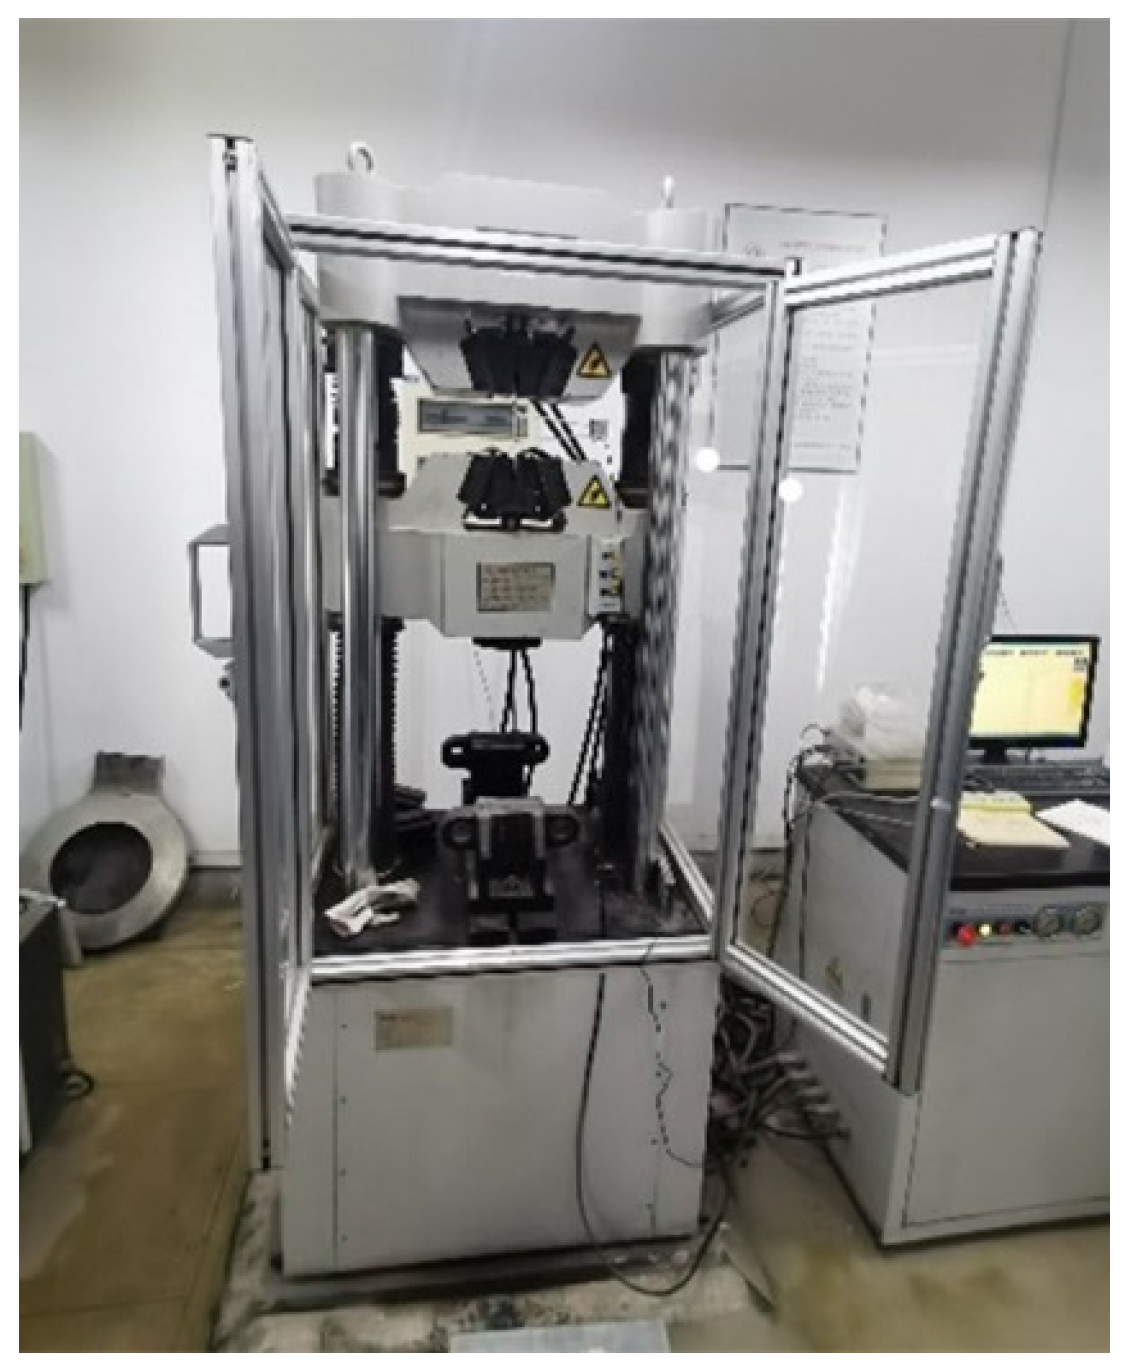
Figure 4.
Test loading device.
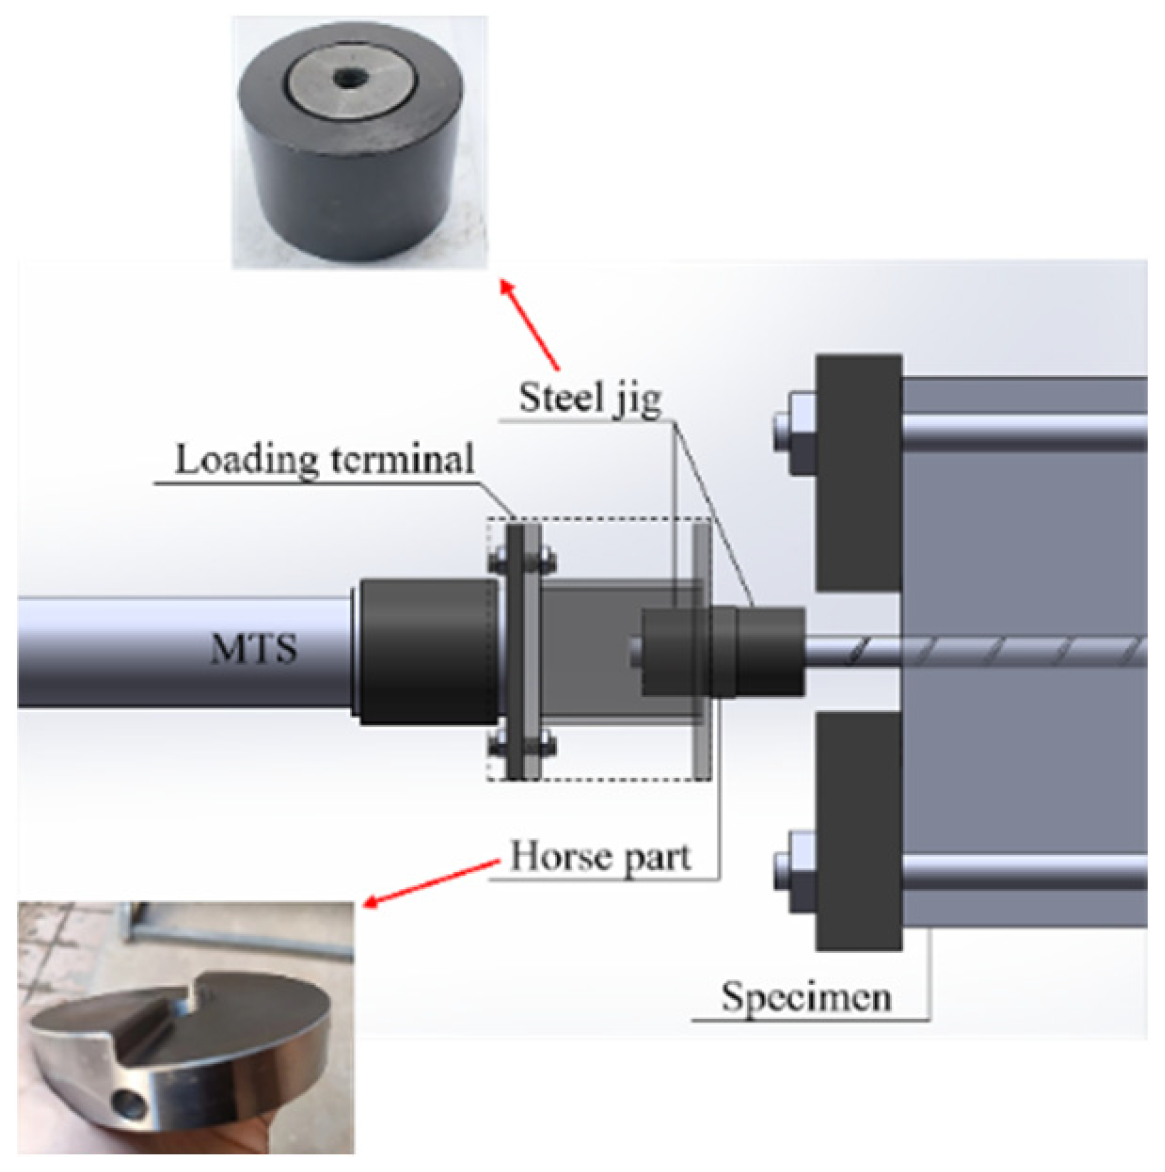
Figure 5.
Test fixing device.

Figure 6.
The handle-shaped member (a) and its position (b).
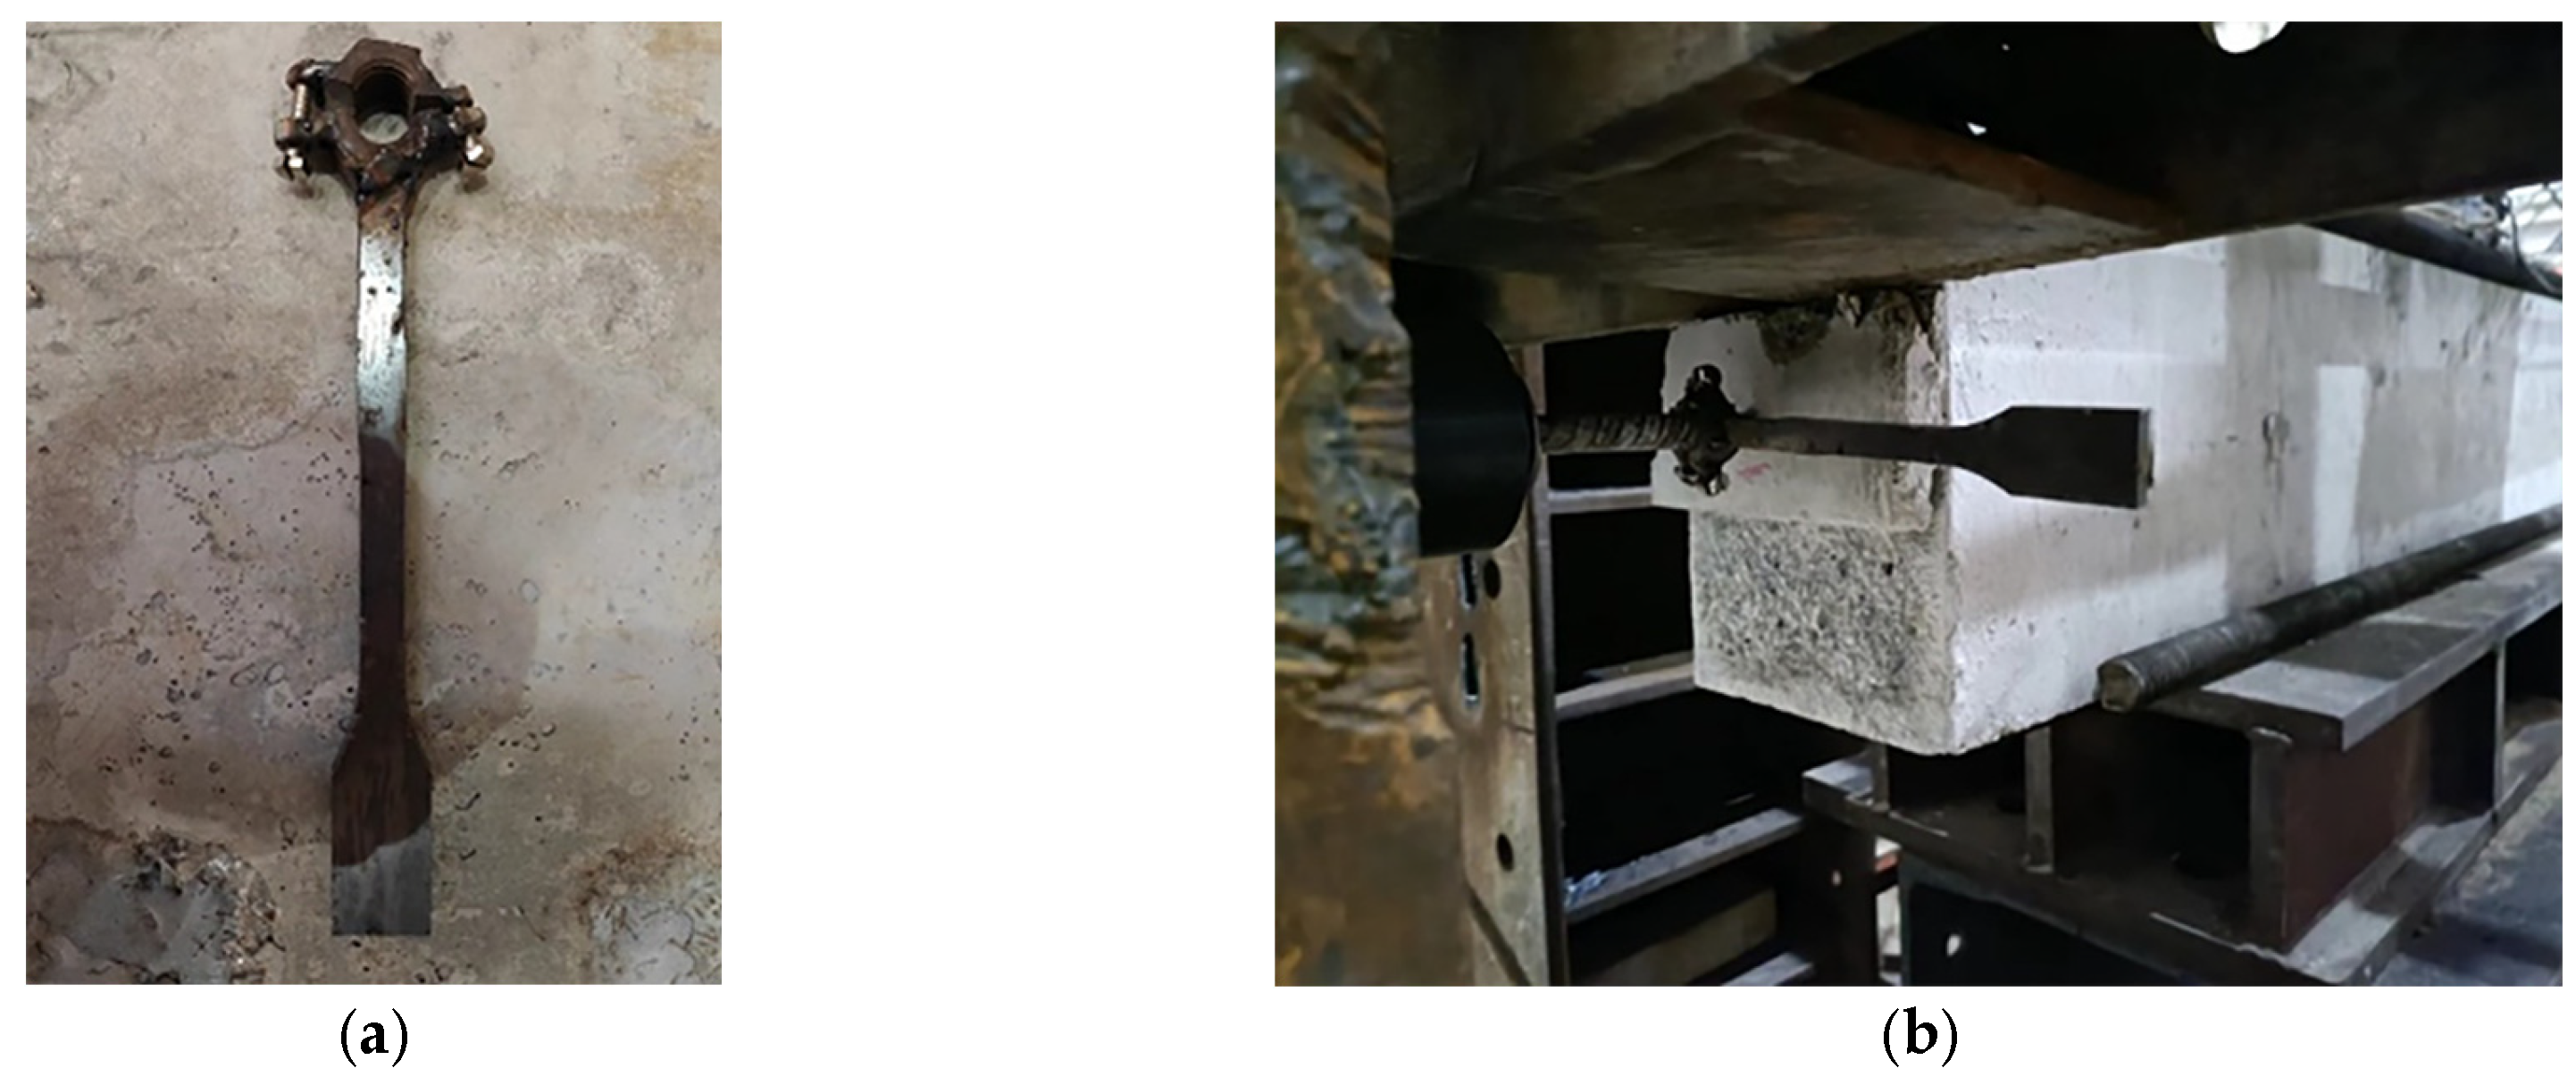
Figure 7.
Position and number of strain gauge (unit: mm).
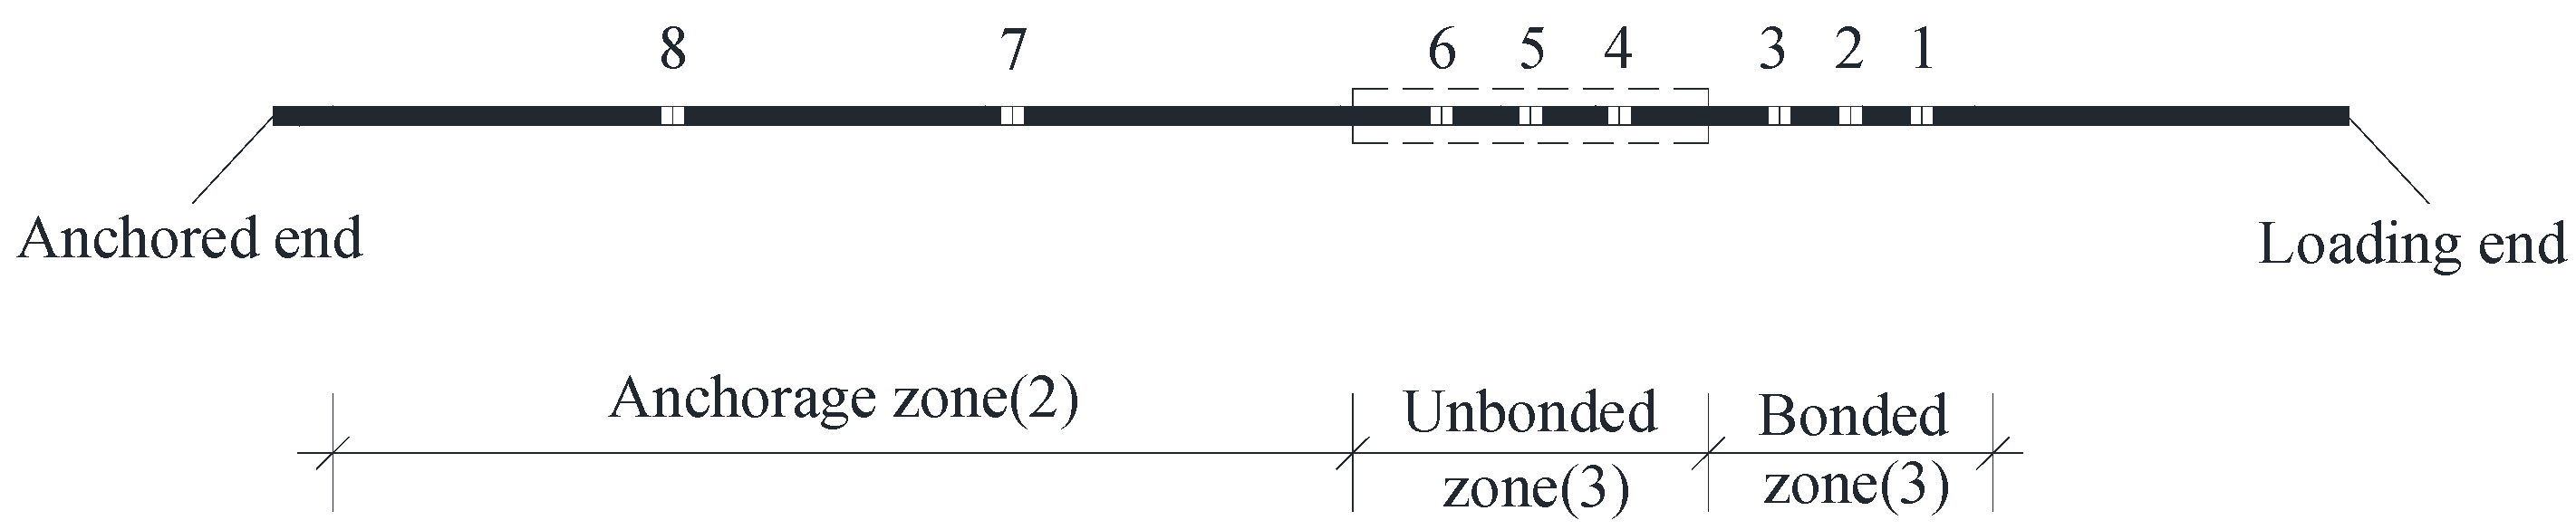
Figure 8.
Diagram of loading regime.
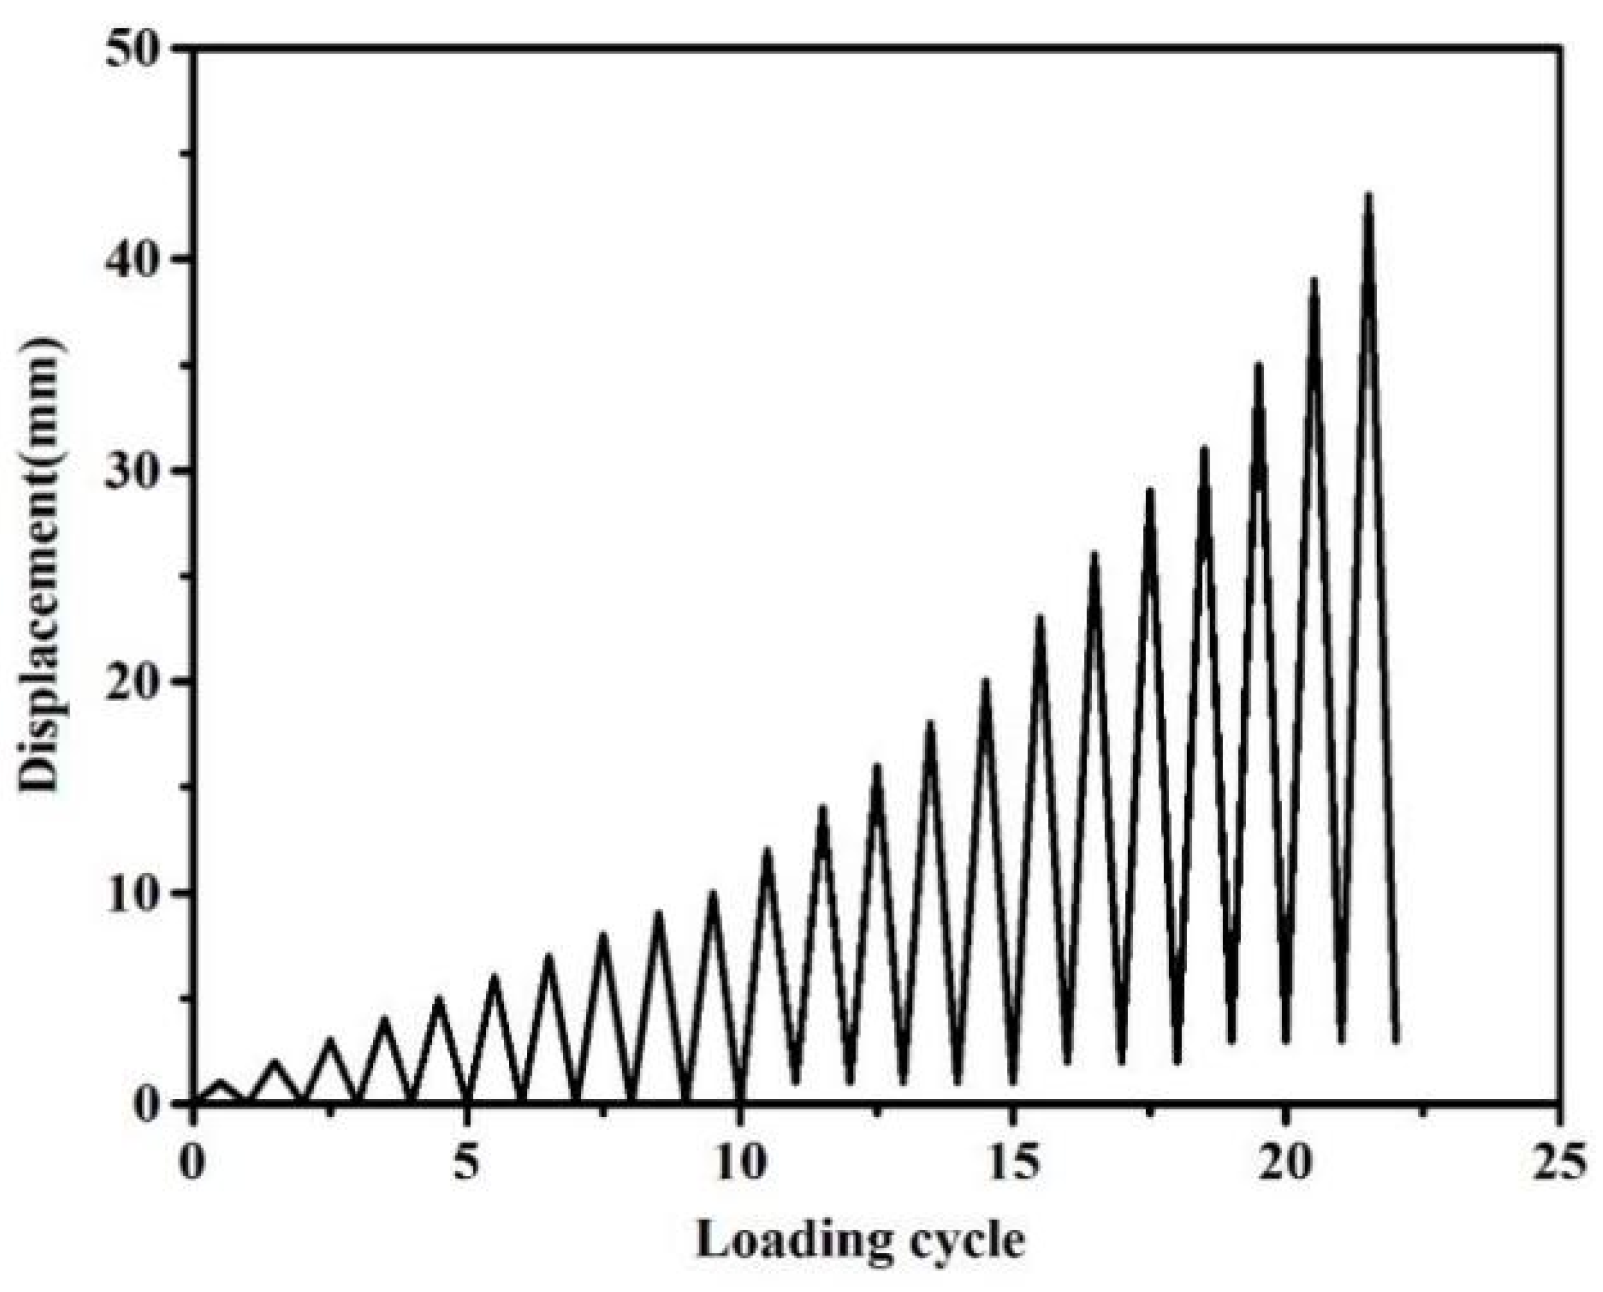
Figure 9.
Final failure patterns of (a) JD, (b) WC, (c) GZ, (d) GQ, and € HQ.
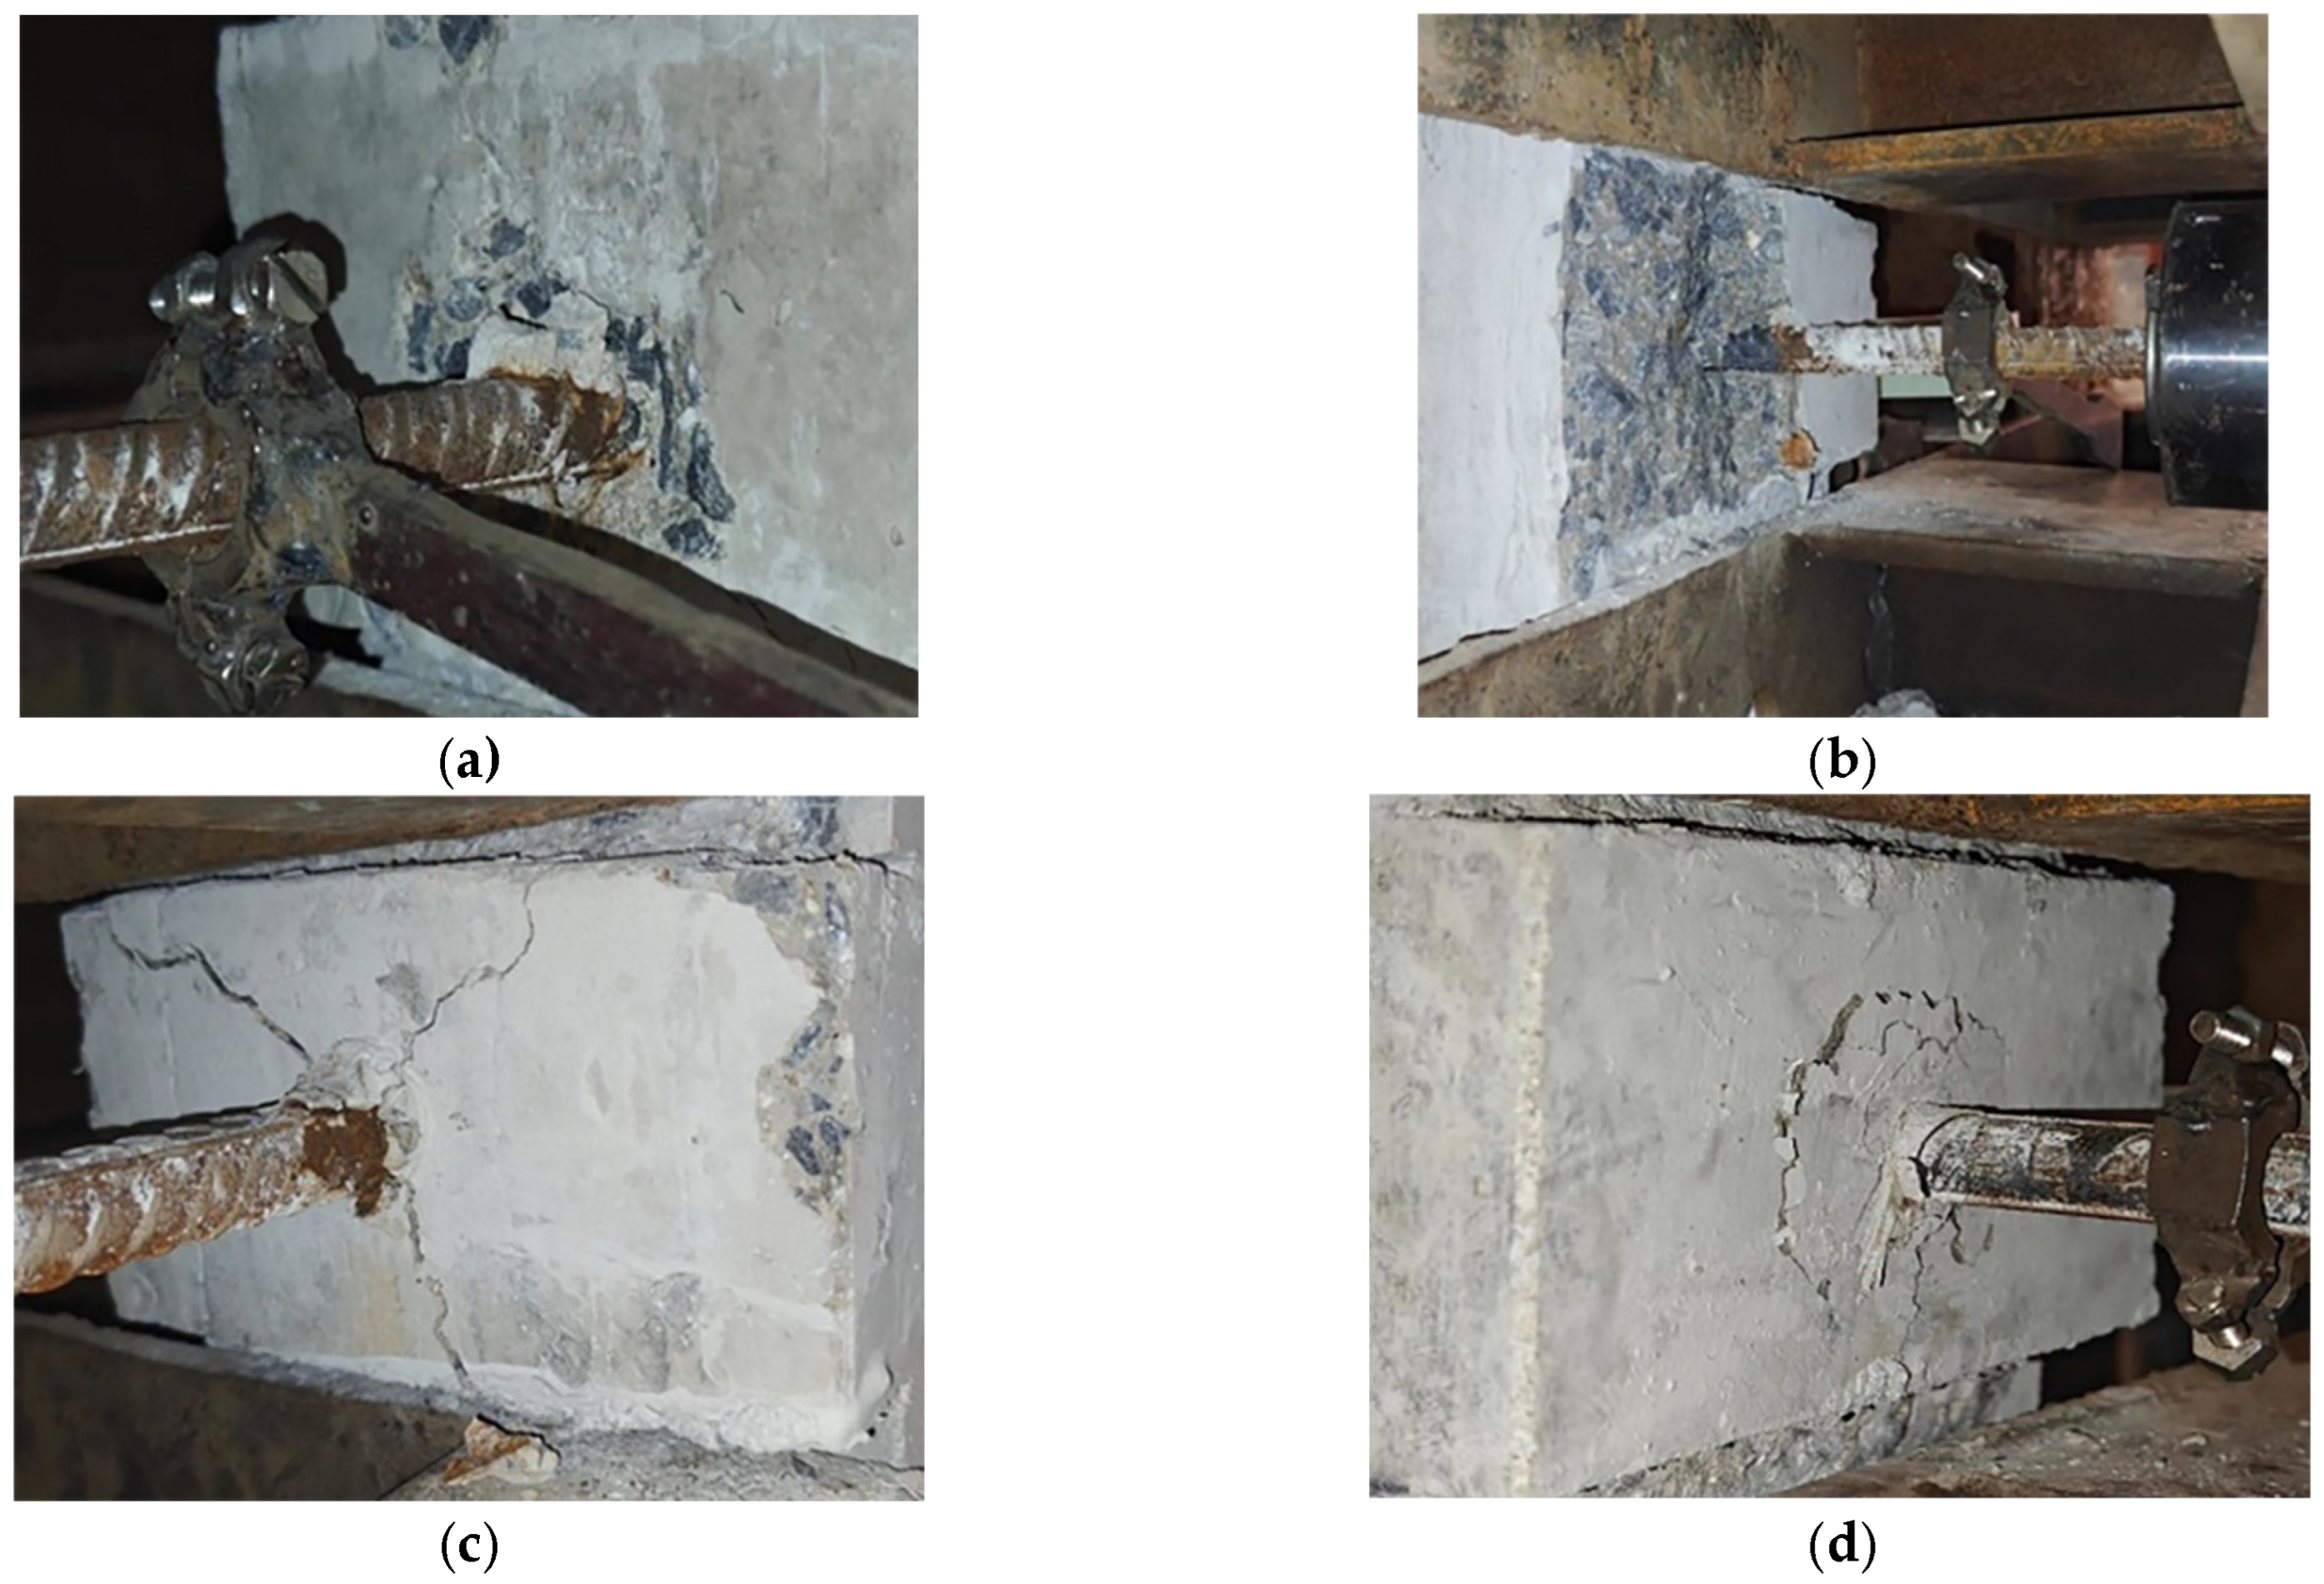
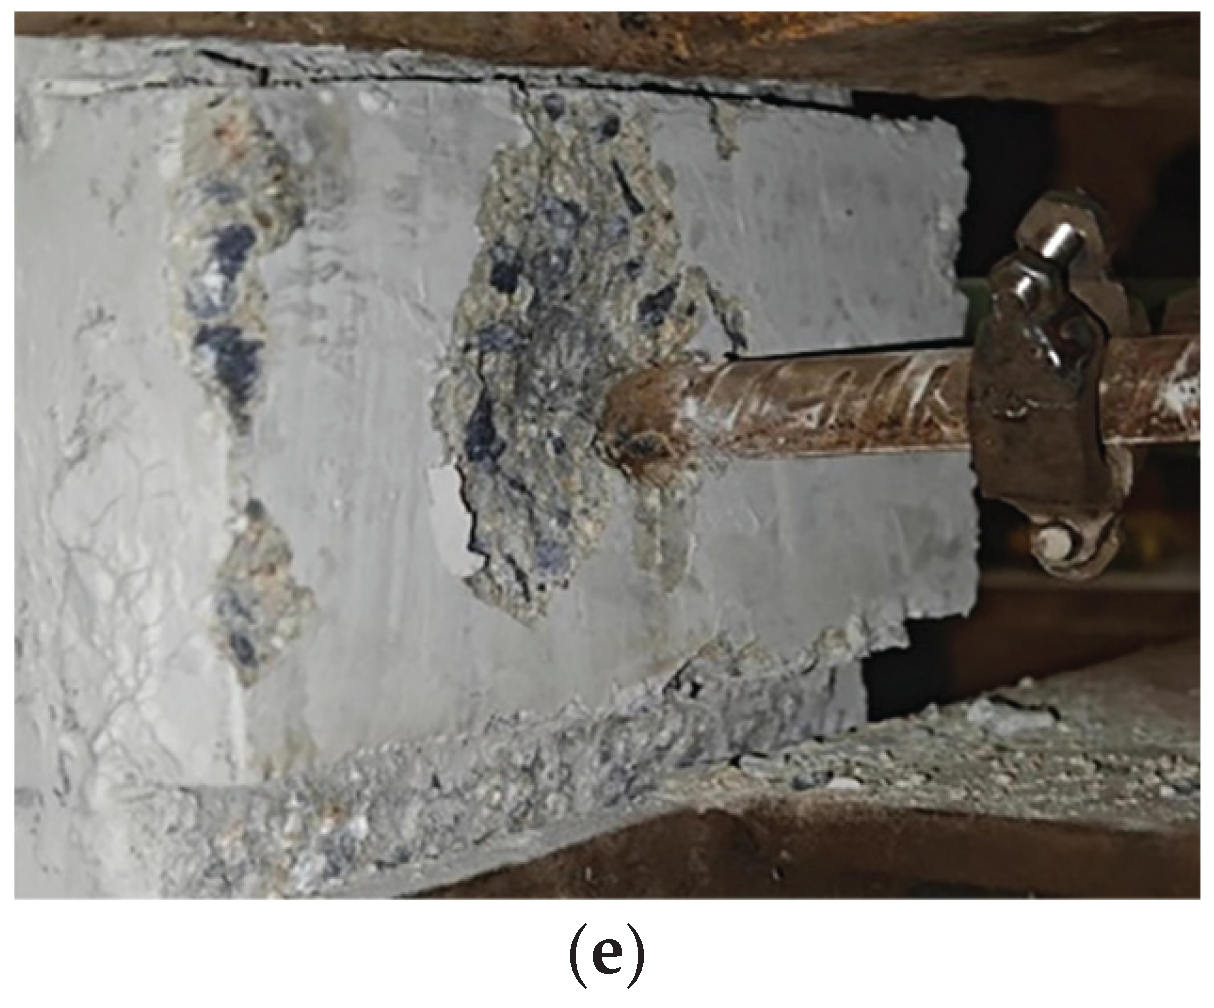
Figure 10.
Hysteresis curves of (a) JD, (b) WC, (c) GZ, (d) GQ, and (e) HQ.
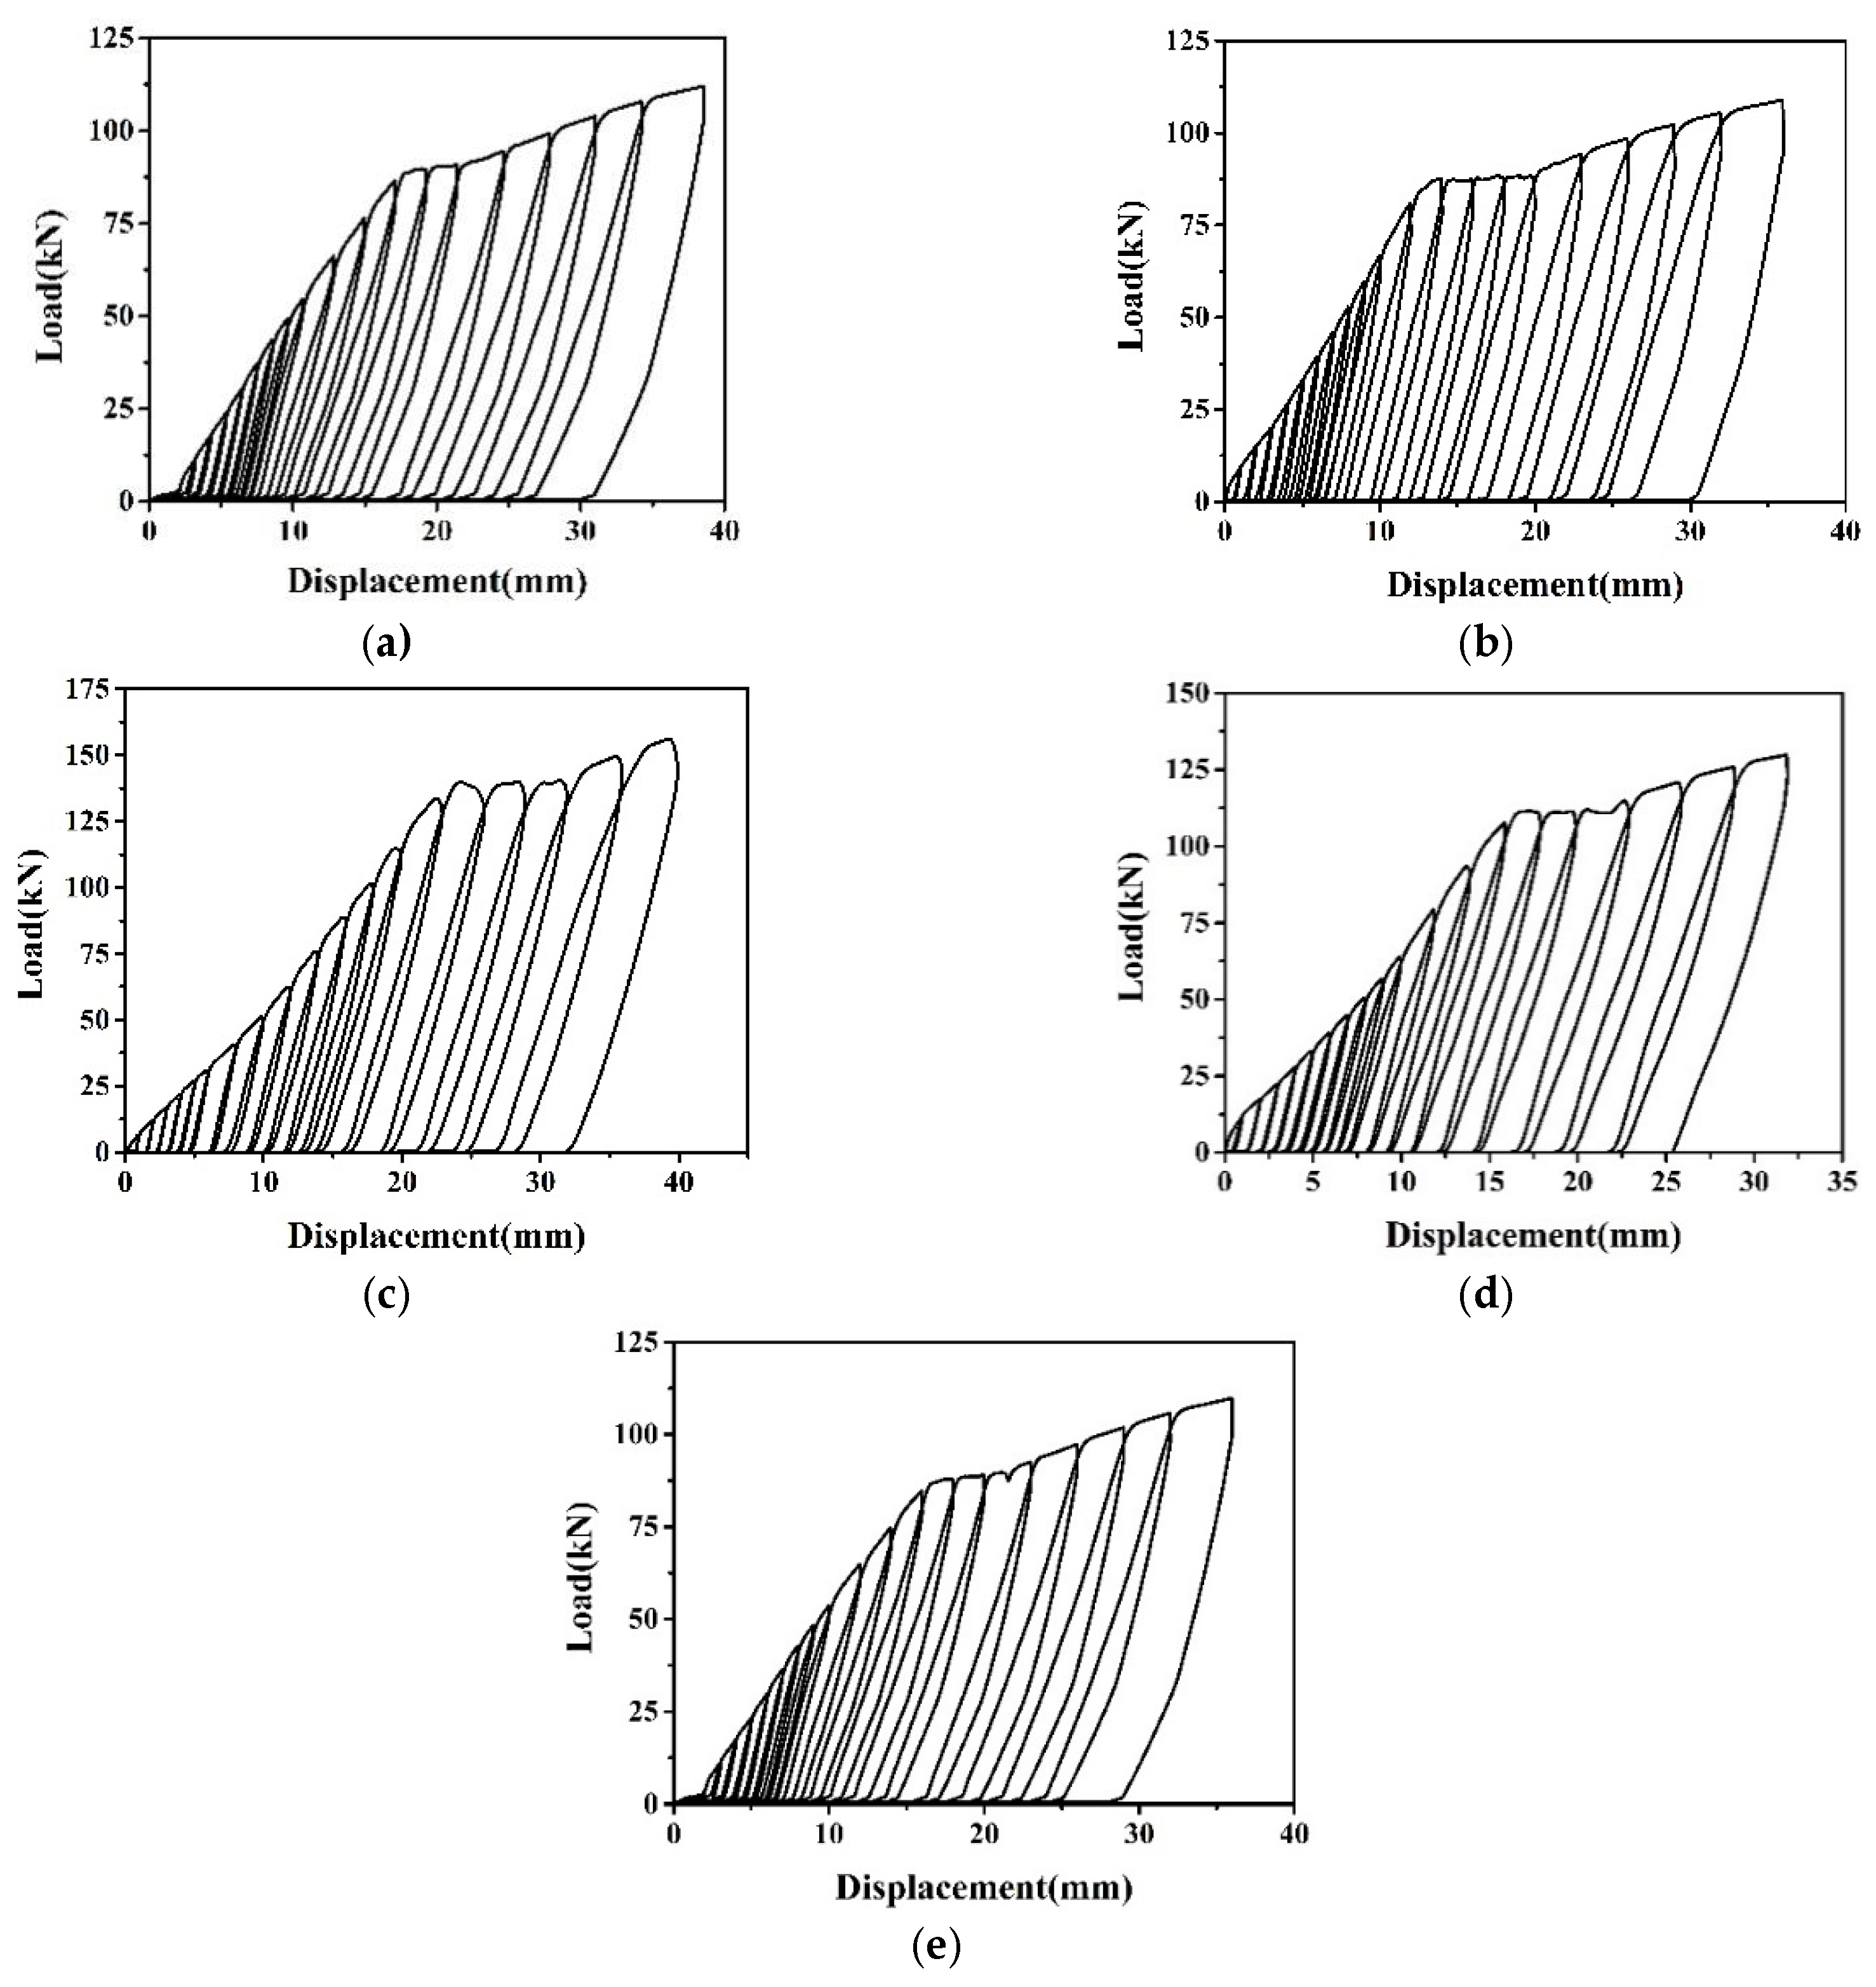
Figure 11.
Skeleton curves of specimens.
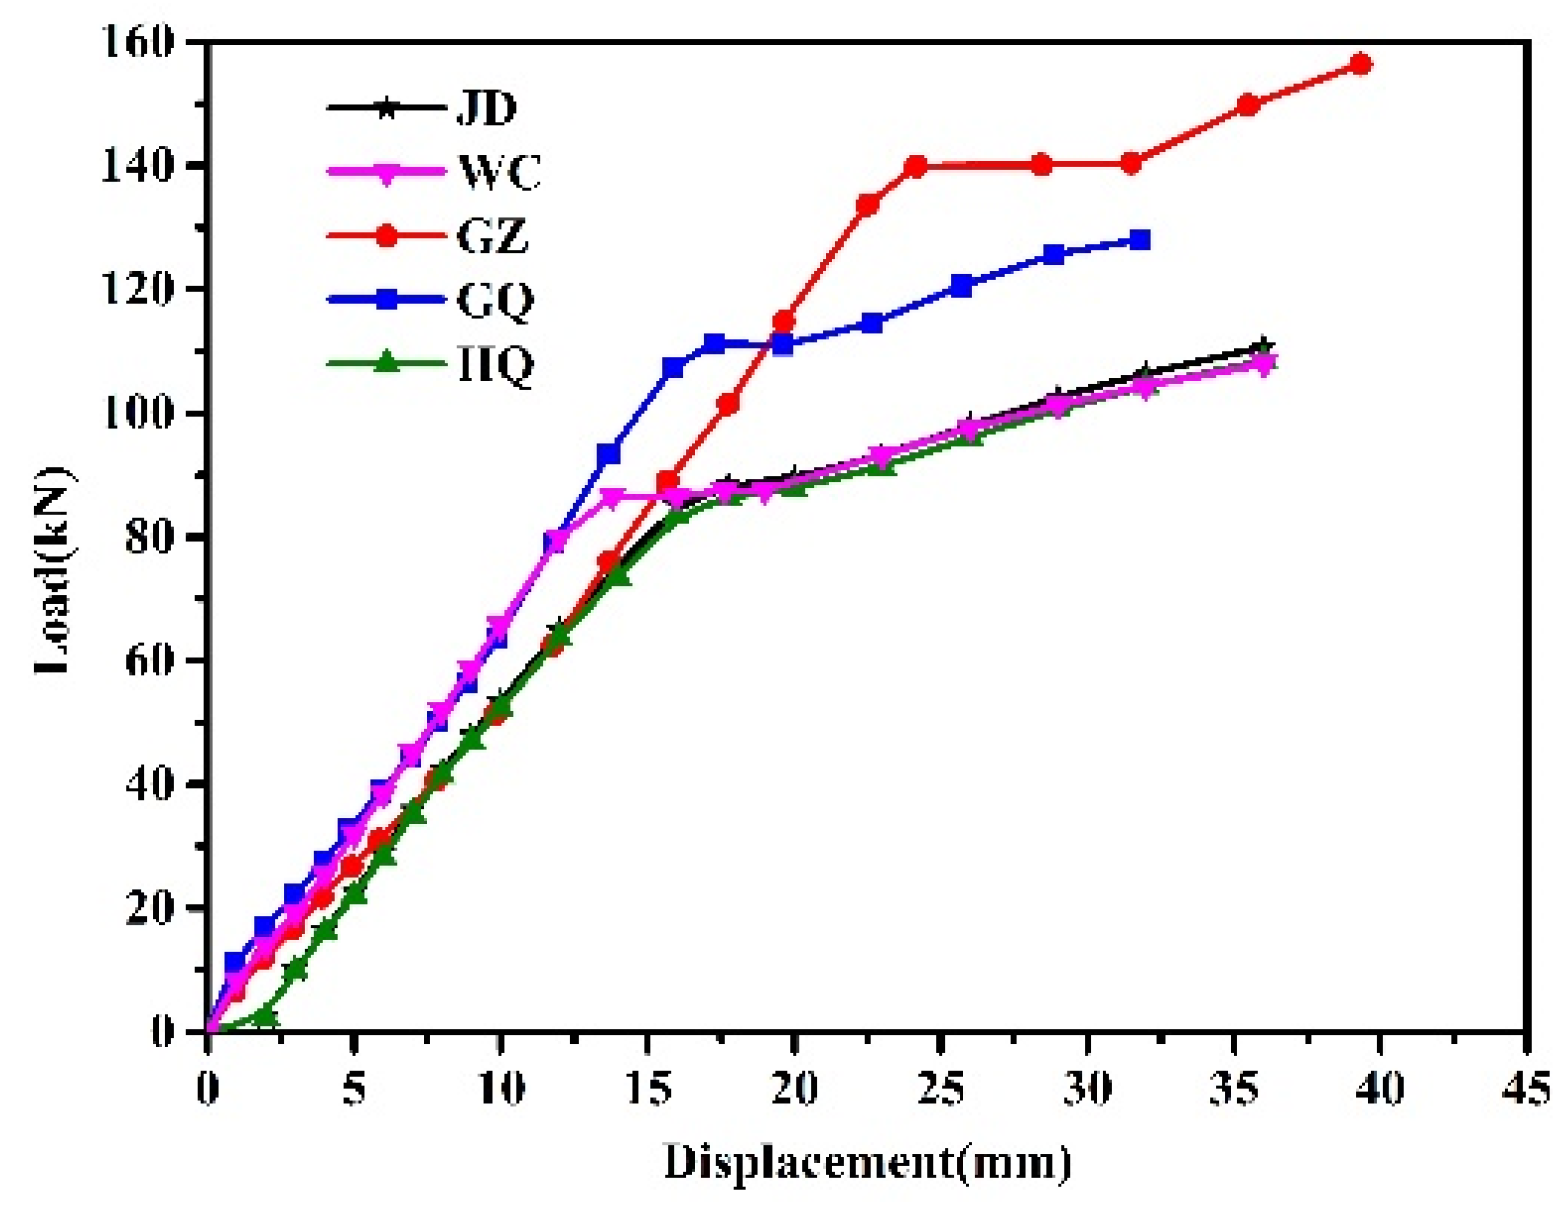
Figure 12.
Energy dissipation capacity of each specimen.
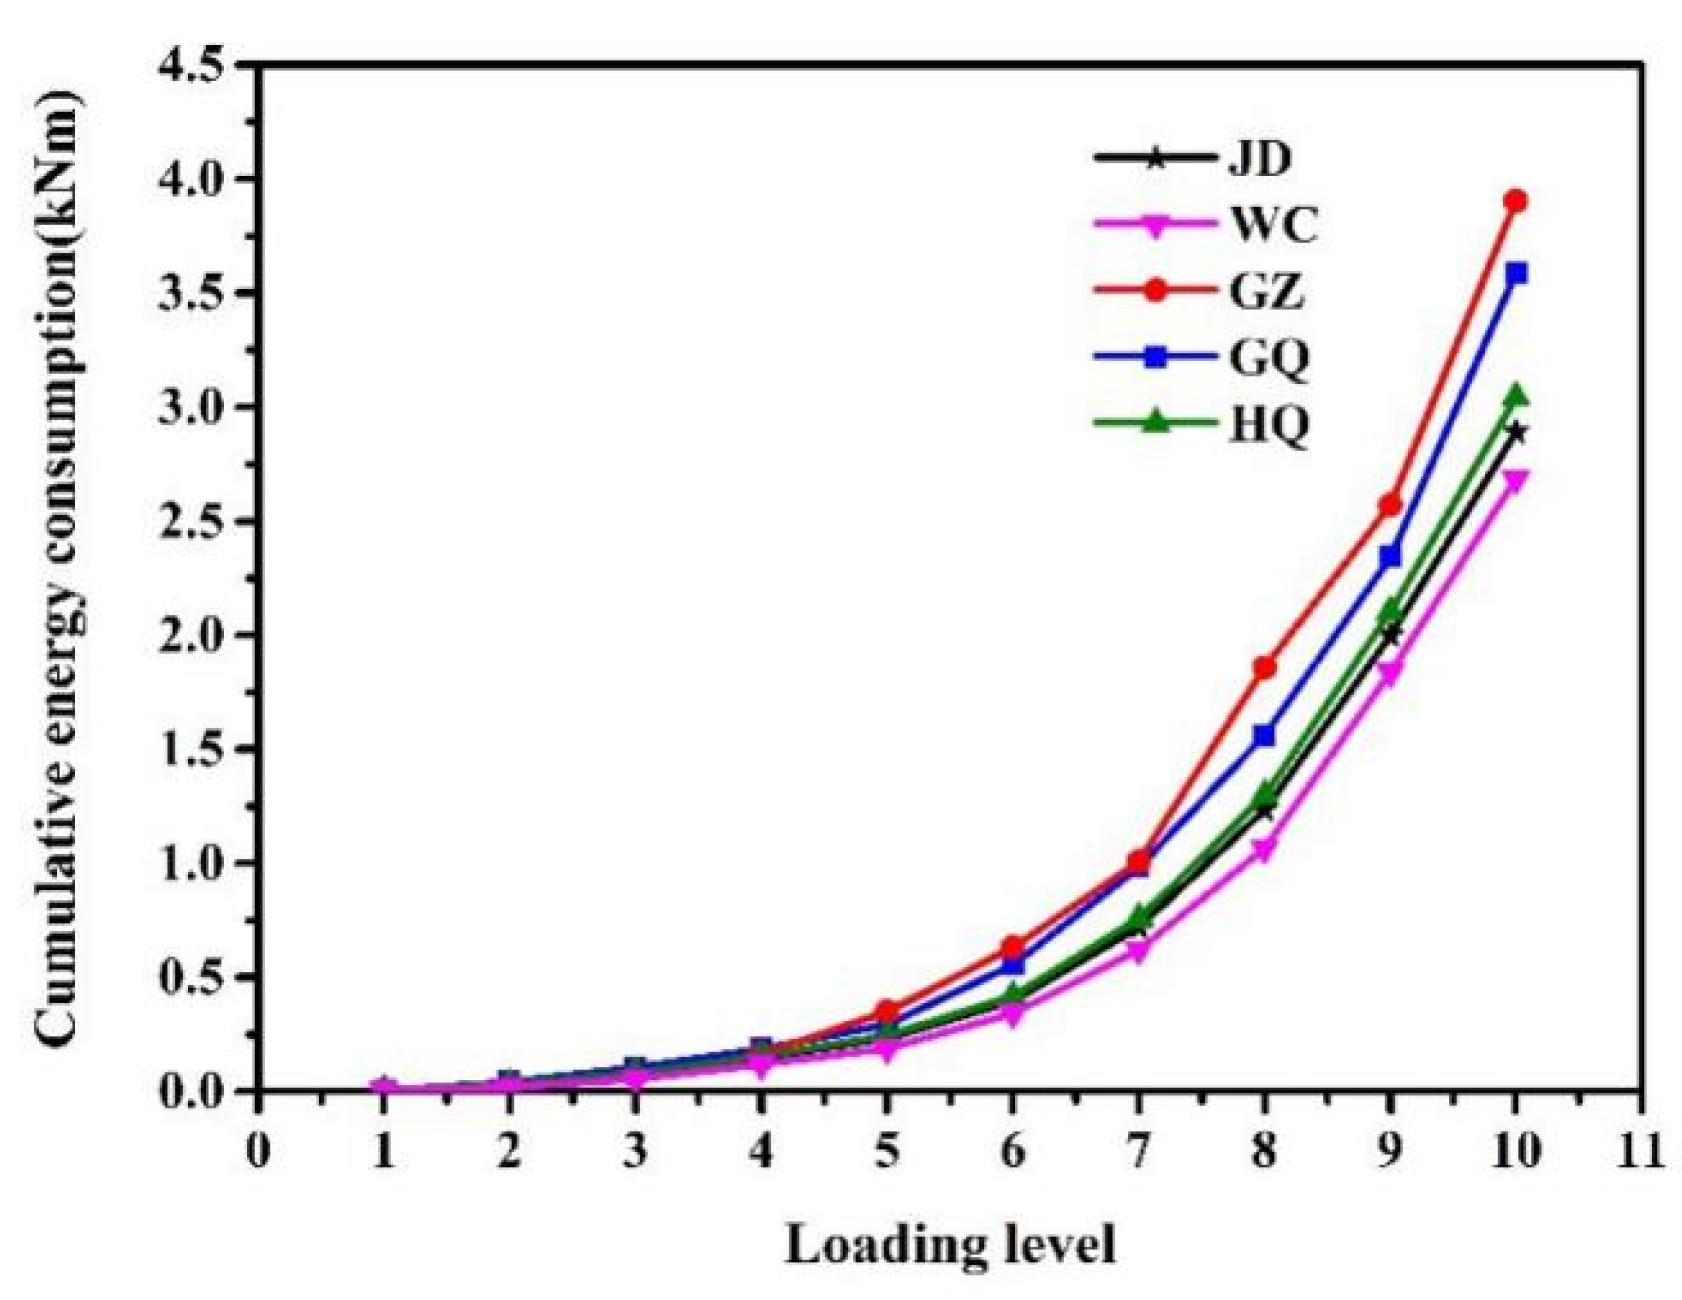
Figure 13.
Bond-slip curve of OR-US.
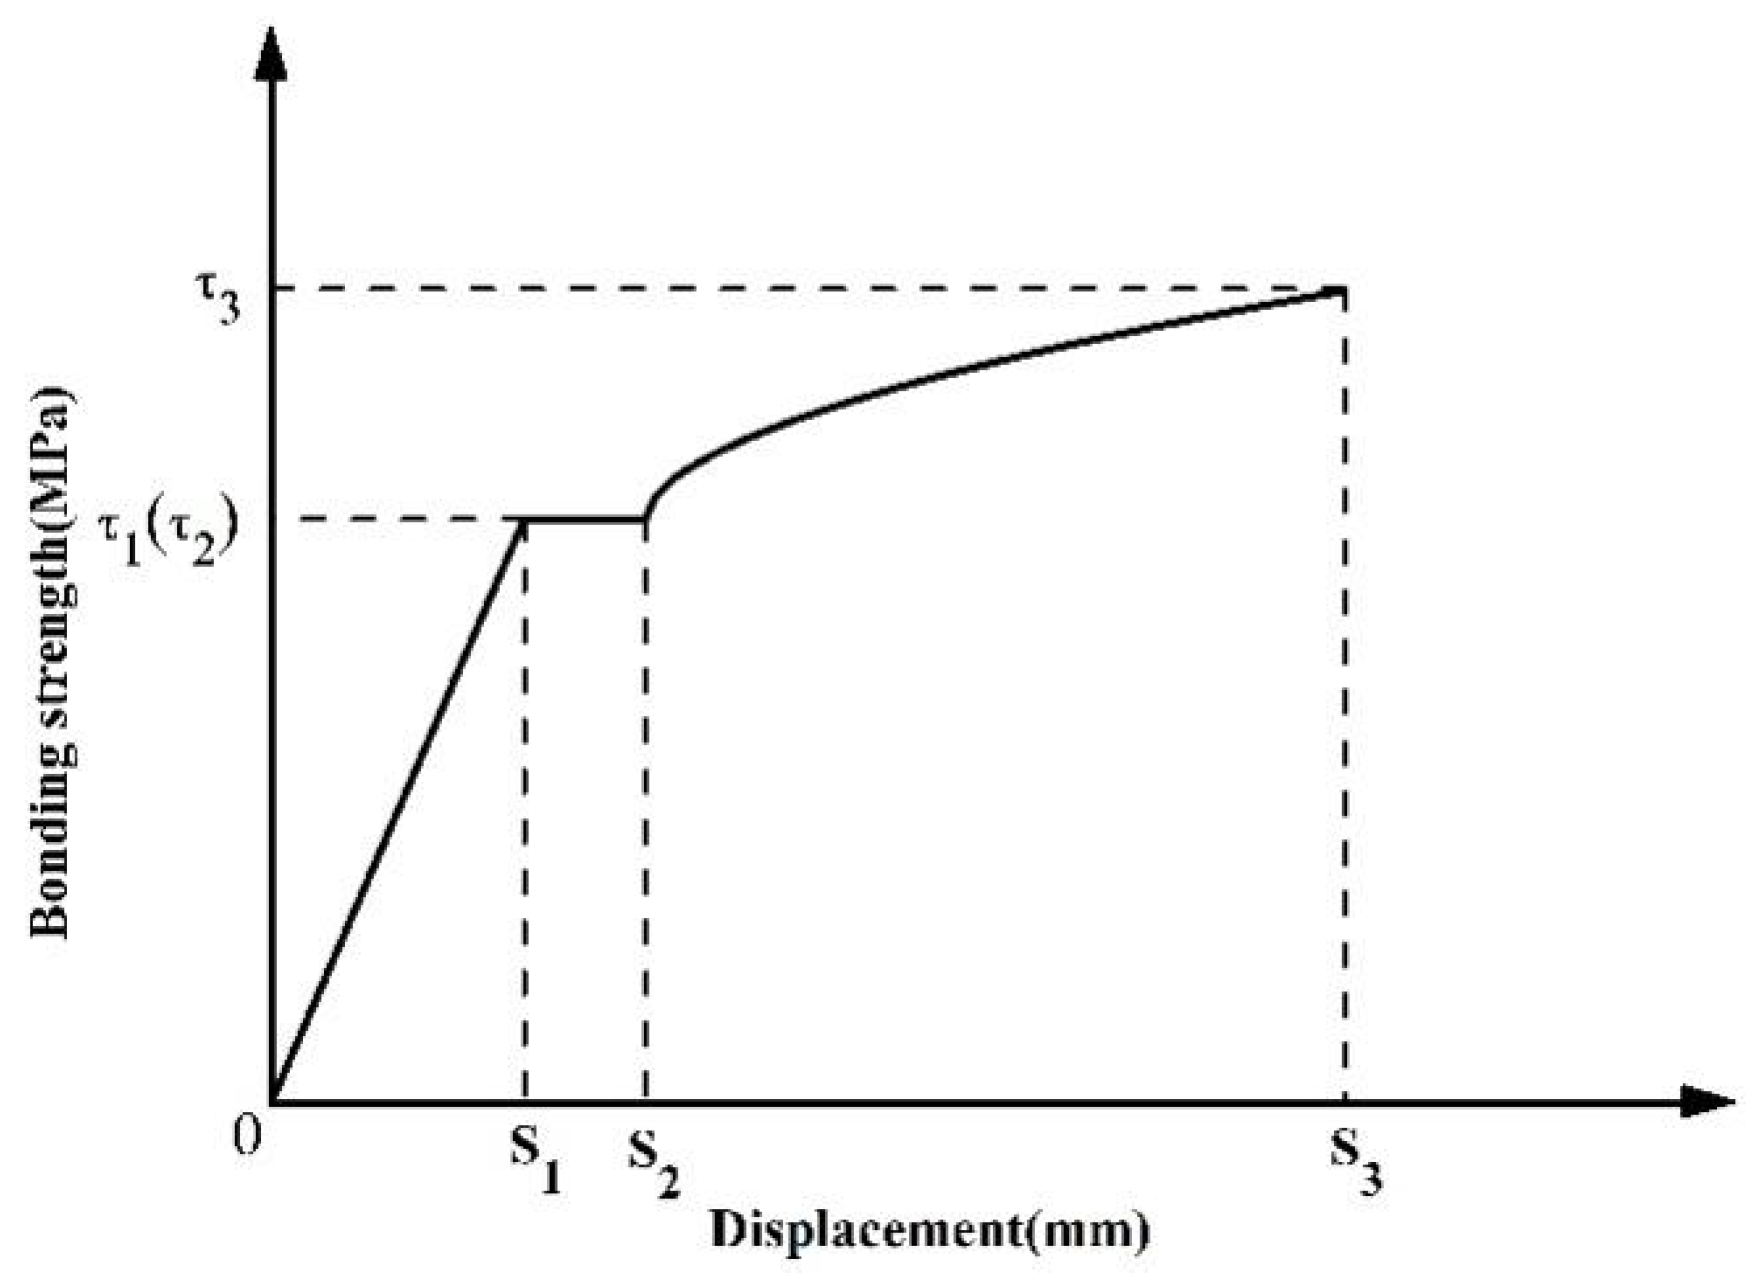
Figure 14.
Verification of bond-slip model of (a) JD, (b) WC, (c) GZ, (d) GQ, and (e) HQ.
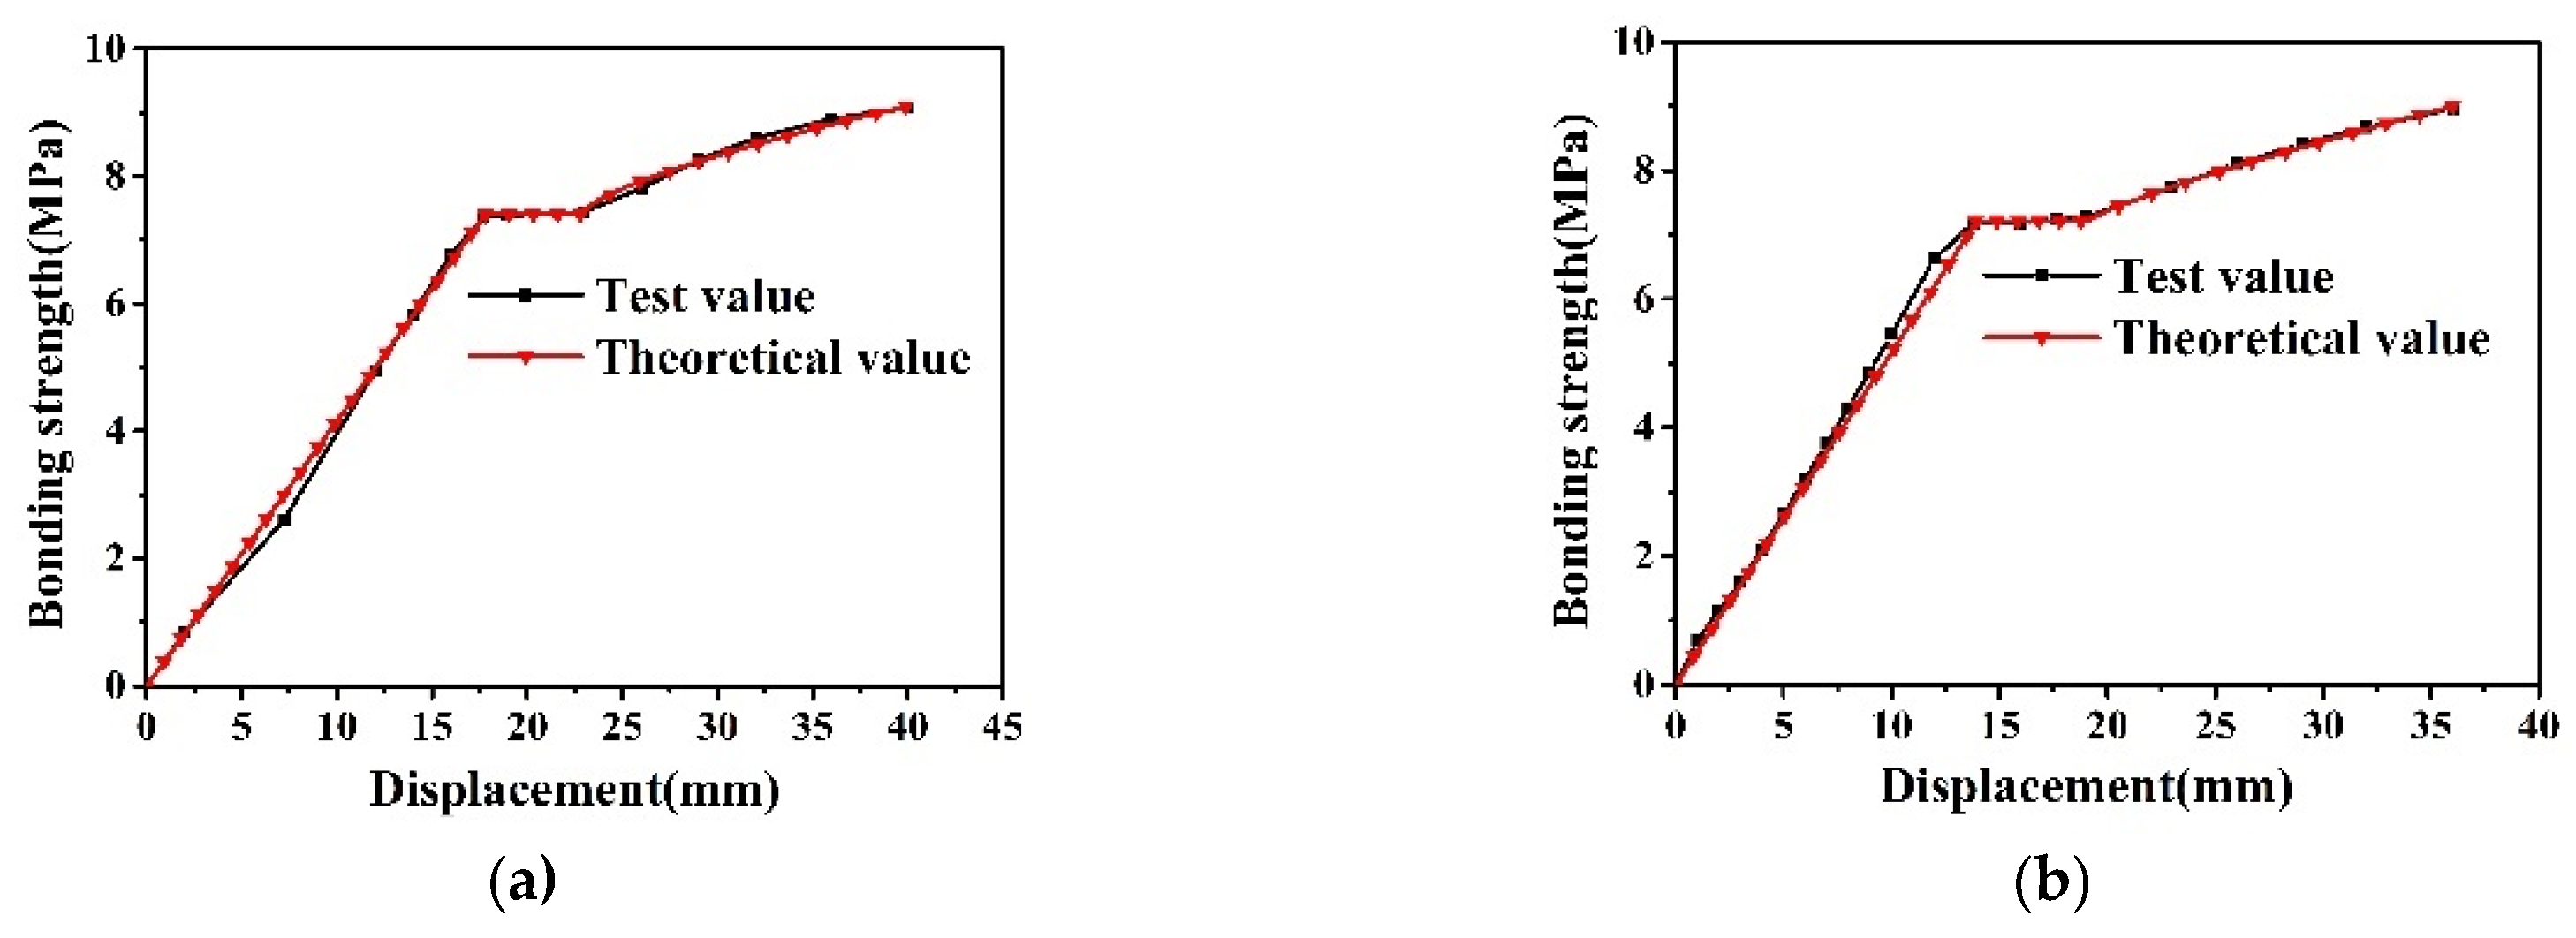
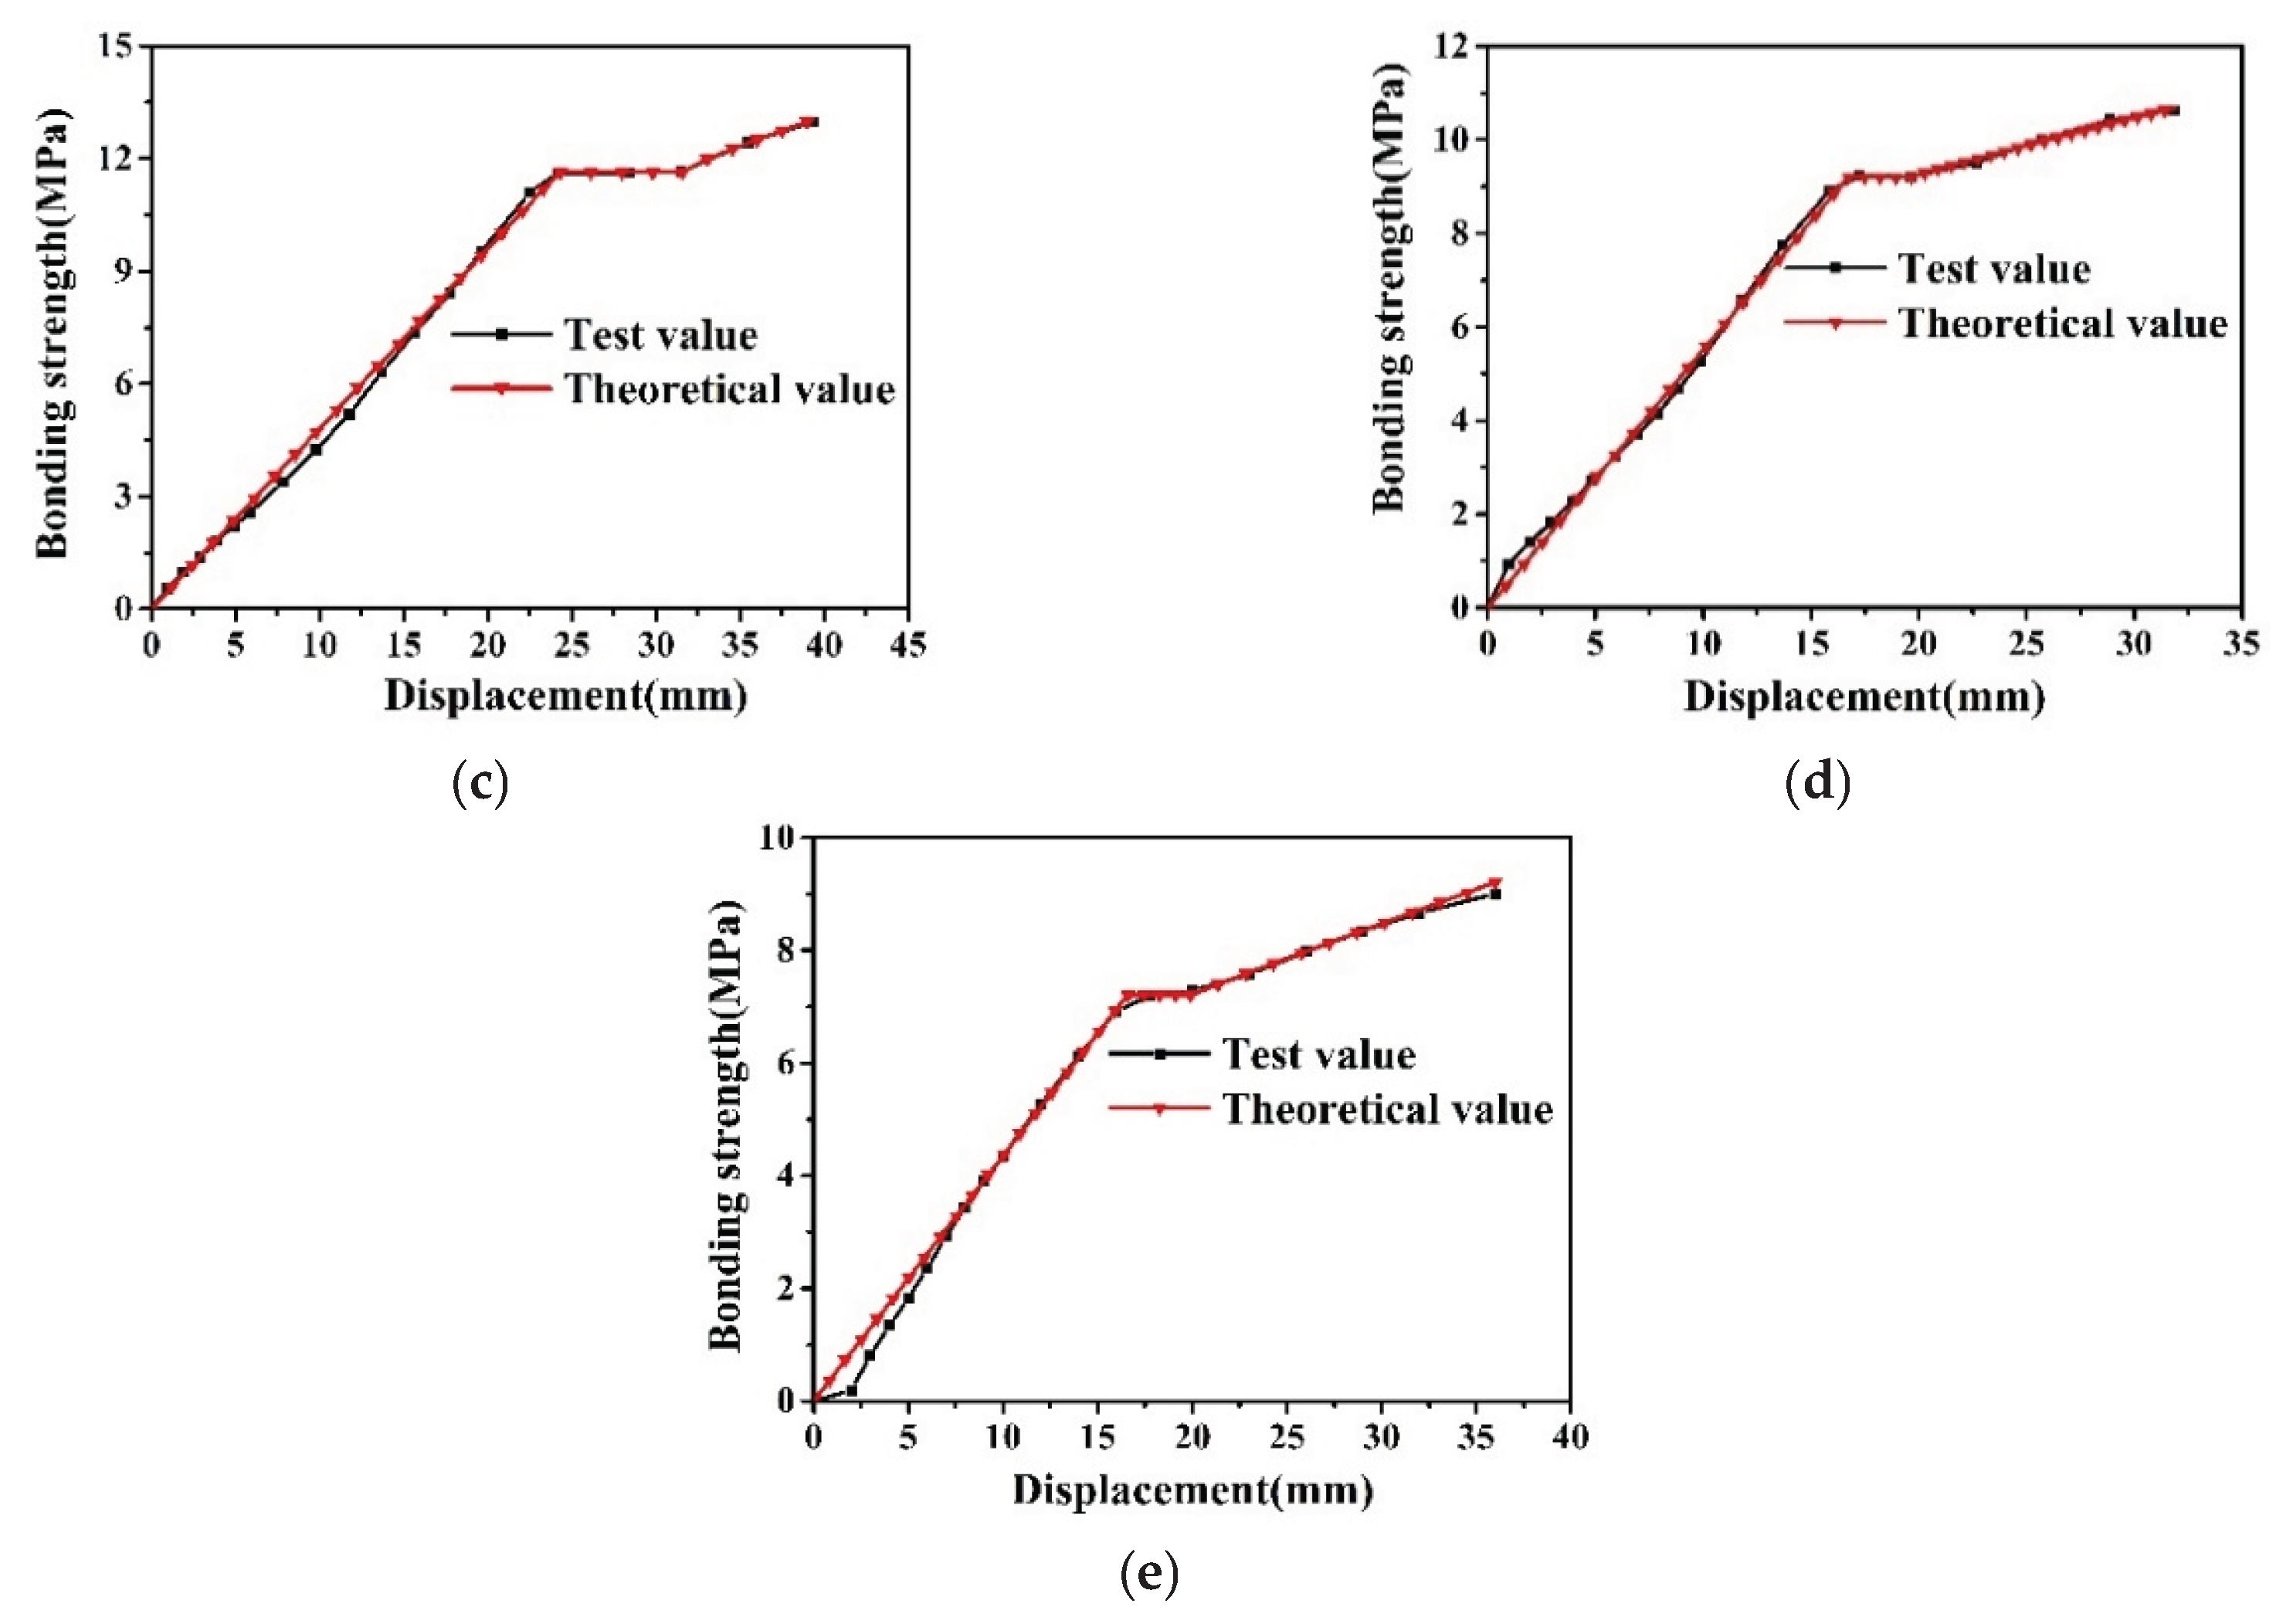

Table 1.
Test specimen parameters.
| Specimen Number | Unbonded Length(mm) | Rebar Diameter(mm) | Rebar Strength | Concrete Strength |
| JD | 300 | 16 | HRB400 | C35 |
| WC | 200 | 16 | HRB400 | C35 |
| GZ | 300 | 20 | HRB400 | C35 |
| GQ | 300 | 16 | HRB500 | C35 |
| HQ | 300 | 16 | HRB400 | C30 |
Table 2.
Mechanical properties of concrete.
| Specimen Number | Concrete Grade | Failure Load (kN) | Compressive Strength (MPa) | Average Compressive Strength (MPa) |
| 1 | C30 | 785.4 | 33.2 | 33.7 |
| 2 | 798.2 | 34.1 | ||
| 3 | 787.5 | 33.8 | ||
| 4 | C35 | 1006.9 | 42.5 | 40.9 |
| 5 | 996.7 | 40.4 | ||
| 6 | 989.9 | 39.7 |
Table 3.
Mechanical properties of rebar.
| Specimen Number | Rebar Grade | Rebar Diameter (mm) | Yield Strength (MPa) | Ultimate Strength (MPa) | Ratio of Yield Strength to Tension Strength | Percentage Elongation After Fracture |
| 1 | HRB400 | 16 | 469.6 | 678.0 | 0.69 | 26% |
| 2 | 456.2 | 670.7 | 0.68 | 26% | ||
| 3 | 465.4 | 676.7 | 0.69 | 26% | ||
| 4 | HRB500 | 16 | 540.6 | 709.7 | 0.76 | 28% |
| 5 | 539.6 | 691.3 | 0.78 | 28% | ||
| 6 | 537.8 | 689.2 | 0.78 | 28% | ||
| 7 | HRB400 | 20 | 455.8 | 610.1 | 0.75 | 23% |
| 8 | 457.1 | 601.9 | 0.76 | 23% | ||
| 9 | 455.3 | 608.7 | 0.75 | 23% |
Table 4.
Test phenomena of specimens.
| Specimen Number | The Time and Location of the Crack | The Yield Time of the Bonded Rebar at the Loading End | The Yield Time of Unbonded Rebar | The Final Failure Pattern and Time | Others |
| JD | When stretched positively to 14mm, cracks appeared in the concrete at the loading end. | When stretched positively to 14mm, the rebars at strain gauges No. 1 and No. 2 yielded; when stretched positively to 18mm, the rebar at strain gauge No. 3 yielded. | When stretched positively to 32mm, the rebar at strain gauge No. 4 yielded; when stretched positively to 40mm, the rebar at strain gauge No. 5 yielded. | When stretched positively to 40mm, a large number of concrete blocks at the loading end fell off. | During the loading process, the tensile and compression sound of the rebar kept appearing, and the cracks kept developing. Finally, the rebar at the loading end appeared to shrink. The cracks of the specimen GQ developed in a ring along the junction of the concrete and the rebar. |
| WC | When stretched positively to 12mm, cracks appeared in the concrete at the loading end. | When stretched positively to 16mm, the rebars at strain gauges No. 1 and No. 2 yielded; when stretched positively to 18mm, the rebar at strain gauge No. 3 yielded. | When stretched positively to 32mm, the rebar at strain gauge No. 4 yielded. | When stretched positively to 36mm, a large number of concrete blocks at the loading end fell off. | |
| GZ | When stretched positively to 16mm, cracks appeared in the concrete at the loading end. | When stretched positively to 26mm, the rebars at strain gauges No. 1, No. 2 and No. 3 yielded. | When stretched positively to 40mm, the rebar at strain gauge No. 4 yielded. | When stretched positively to 40mm, the crack broke through. | |
| GQ | When stretched positively to 14mm, cracks appeared in the concrete at the loading end. | When stretched positively to 16mm, the rebars at strain gauges No. 1 and No. 2 yielded; when stretched positively to 18mm, the rebar at strain gauge No. 3 yielded. | When stretched positively to 29mm, the rebar at strain gauge No. 4 yielded. | When stretched positively to 32mm, the crack broke through. | |
| HQ | When stretched positively to 12mm, cracks appeared in the concrete at the loading end. | When stretched positively to 12mm, the rebars at strain gauges No. 1 and No. 2 yielded; when stretched positively to 16mm, the rebar at strain gauge No. 3 yielded. | When stretched positively to 32mm, the rebar at strain gauge No. 4 yielded. | When stretched positively to 36mm, a large number of concrete blocks at the loading end fell off. |
Table 5.
Ductility comparison of specimens.
| Specimen Number | JD | WC | GZ | GQ | HQ |
| α | 5.4 | 4.3 | 4.8 | 3.3 | 5.5 |
Table 6.
Test data of key points of the bond-slip model.
| Specimen Number | Test Data | |||||
| τ1 (MPa) | s1 (mm) | τ2 (MPa) | s2 (mm) | τ3 (MPa) | s3 (mm) | |
| JD | 7.3 | 16.8 | 7.4 | 20.8 | 9.4 | 40.0 |
| WC | 7.2 | 13.9 | 7.2 | 19.0 | 9.0 | 36.0 |
| GZ | 11.6 | 24.4 | 11.6 | 31.4 | 13.0 | 40.0 |
| GQ | 9.2 | 16.7 | 9.2 | 19.6 | 10.7 | 32.0 |
| HQ | 7.2 | 16.5 | 7.2 | 19.9 | 9.2 | 36.0 |
Table 7.
Parameter fitting values of bond-slip model.
| Specimen Number | Parameters | ||||
| β | γ | μ | ρ | φ | |
| JD | 0.42 | 0.95 | 0.61 | 0.32 | 1.44 |
| WC | 0.52 | 0.83 | 0.54 | 0.33 | 1.55 |
| GZ | 0.48 | 0.84 | 0.42 | 0.58 | 1.43 |
| GQ | 0.55 | 0.96 | 0.44 | 0.55 | 1.83 |
| HQ | 0.44 | 0.98 | 0.64 | 0.29 | 1.48 |
Disclaimer/Publisher’s Note: The statements, opinions and data contained in all publications are solely those of the individual author(s) and contributor(s) and not of MDPI and/or the editor(s). MDPI and/or the editor(s) disclaim responsibility for any injury to people or property resulting from any ideas, methods, instructions or products referred to in the content. |
© 2025 by the authors. Licensee MDPI, Basel, Switzerland. This article is an open access article distributed under the terms and conditions of the Creative Commons Attribution (CC BY) license (http://creativecommons.org/licenses/by/4.0/).
Copyright: This open access article is published under a Creative Commons CC BY 4.0 license, which permit the free download, distribution, and reuse, provided that the author and preprint are cited in any reuse.


