
Submitted:
29 December 2025
Posted:
30 December 2025
You are already at the latest version
Abstract
The growing emphasis on environmental sustainability and the need for advanced manufacturing methods have accelerated progress in materials processing. Aluminum powder metallurgy (APM) is particularly promising due to aluminum’s low density, high strength-to-weight ratio, and the inherent benefits of the powder metallurgy (PM) process. However, the corrosion resistance of sintered aluminum components remains a significant concern. In this study, shot peening (SP) was employed as a surface modification technique to improve the corrosion behavior of Alumix 321 PM alloy. Sampleas of the as-sintered and shot peened Alumix 321 PM alloy, together with the wrought alloy counterpart AA6061, were characterized using non-contact optical profilometry, optical microscopy (OM), and scanning electron microscopy (SEM). Corrosion performance was evaluated in 3.5 wt.% NaCl solution using Tafel extrapolation (TE), cyclic polarization (CP), stair-step polarization (SSP), and electrochemical impedance spectroscopy (EIS). The results revealed that shot peening increased surface roughness and significantly reduced the corrosion rate from 0.079 mmpy to 0.004 mmpy for the unpeened and peened samples, respectively. While pitting was the dominant corrosion mechanism in the wrought alloy, the PM alloy exhibited a combination of pitting, crevice, and intergranular corrosion. These findings highlight the potential of SP in enhancing the durability of aluminum-based PM components, offering valuable insights for industrial applications.
Keywords:
Alumix 321
; powder
; corrosion
; shot peening
; cyclic polarization
; stair step polarization
1. Introduction
The growing emphasis on environmental sustainability continues to drive innovations in alloy production and advanced manufacturing methods. Among these, powder metallurgy (PM) has gained increasing attention as a promising technique for producing aluminum components with enhanced properties and reduced environmental impact. This development in manufacturing techniques is critical in meeting the stringent demands of high-strength applications, as evidenced by recent studies in processing of aluminum powder metallurgy (APM) alloys [1,2,3,4,5,6,7].
APM, in particular, has emerged as an effective approach due to the processing advantages of PM combined with the intrinsic benefits of aluminum. However, a major limitation to the broader application of APM components is their inferior corrosion resistance, primarily attributed to residual porosity remaining after the sintering process. This porosity significantly compromises the integrity and durability of aluminum PM parts in corrosive environments, making corrosion behavior a critical factor in the design and performance of such components [8,9,10,11,12,13].
Judge and Kipouros [14] reported that APM alloys generally exhibit lower corrosion resistance than their wrought and cast counterparts. They attributed the inferior performance to the high surface area and interconnected open porosity inherent in sintered structures. To achieve corrosion resistance comparable to wrought alloys, further densification and post-processing treatments are necessary. Density and porosity are key parameters influencing both mechanical and corrosion behavior in APM alloys. Accurate measurement of these features is essential for optimizing performance. Steedman et al. [15] evaluated two techniques, helium pycnometry and oil impregnation for determining the density of aluminum-silicon PM alloys (Alumix 231 and Dal 6-Si). Their study concluded that helium pycnometry provides more precise results, as conventional oil impregnation fails to account for fine or inaccessible pores. Their work also emphasized the need for improved characterization techniques to quantify pore volume, surface area, and porosity distribution. These factors are critical for understanding corrosion behavior in porous PM alloys. Surface modification and post-sintering treatments are widely used to mitigate the effects of porosity and enhance corrosion resistance in APM materials. Techniques such as anodizing, surface coating, resin impregnation, and heat treatment can alter microstructure, seal pores, and redistribute secondary phases, thus improving corrosion resistance and mechanical performance. The choice of treatment depends on the targeted application and desired property profile [14,16,17].
Among surface treatments, SP is a well-established mechanical surface modification technique, commonly employed to improve the fatigue resistance of wrought aluminum alloys [18,19,20]. For instance, Zupanc and Grum [21] demonstrated that SP treatment on 7075-T651 aluminum alloy increased fatigue threshold stress and reduced surface pitting. The application of SP has also been utilized in the domain of PM materials. Studies have shown that SP can improve fatigue strength by as much as 40% in PM carbon steels with 1.5 wt.% carbon content [22].
Despite its proven benefits, limited research exists on the influence of shot peening on the corrosion and mechanical behavior of APM alloys. Notably, Lynen et al. [23] reported a 10–15% improvement in fatigue strength in Alumix 431 APM alloy following SP at intensities of 12A and 16A. Harding et al. [8] investigated the effect of SP on an Al-Zn-Mg-Cu PM alloy, revealing the development of significant compressive residual stresses (−293 MPa), which contributed to a 29% increase in fatigue strength. These findings highlight the potential of shot peening as a post-processing technique for enhancing the performance of APM components. However, its effect on the corrosion behavior of aluminum-based PM alloys, particularly Alumix 321, remains underexplored as most of the prior studies primarily concentrate on the corrosion resistance of wrought aluminum alloys [24,25,26,27]. This study aims to address this gap by investigating the impact of shot peening on the corrosion characteristics of Alumix 321 PM alloy in a 3.5 wt.% NaCl solution.
2. Materials and Methods
2.1. Materials
All experiments were conducted using a commercially available powder metallurgy alloy known as Alumix 321. This alloy is chemically equivalent to the AA6061 wrought alloy and was supplied by Ecka Granules as a pre-mixed formulation containing 1.5% Licowax C as a lubricant. Chemical composition of the Alumix 321 powder was determined using Atomic Absorption Spectroscopy (AA), and the results are presented in Table 1. Further morphological and compositional analysis was carried out using a Hitachi S-4700 Cold Field Emission Scanning Electron Microscope (SEM). The powder particles exhibited shapes ranging from spherical to irregular, with an average diameter of approximately ±35 µm. This morphological variation is attributed to differences in the powder production techniques. Energy Dispersive X-ray Spectroscopy (EDS) analysis revealed that the spherical particles are predominantly composed of magnesium, whereas the irregularly shaped particles are richer in aluminum and silicon. SEM micrographs and corresponding EDS results are shown in Figure 1 and Figure 2, respectively.
2.2. Powder Metallurgy Processing
All powder metallurgy (PM) samples were fabricated using the conventional press-and-sinter method, which involves compacting a powder mixture in a die followed by sintering under a controlled atmosphere using liquid phase sintering (LPS). The pre-lubricated Alumix 321 powder was first blended in a Turbula T2-F mixer for 20 minutes to ensure uniform homogeneity. The mixture was then compacted uniaxially using an Instron SATEC 5594-200 HVL compression frame at a pressure of 500 MPa to form cylindrical pucks (15 mm diameter) from 2.5 g of powder. These pucks were subsequently used for density measurements, shot peening, and corrosion testing.
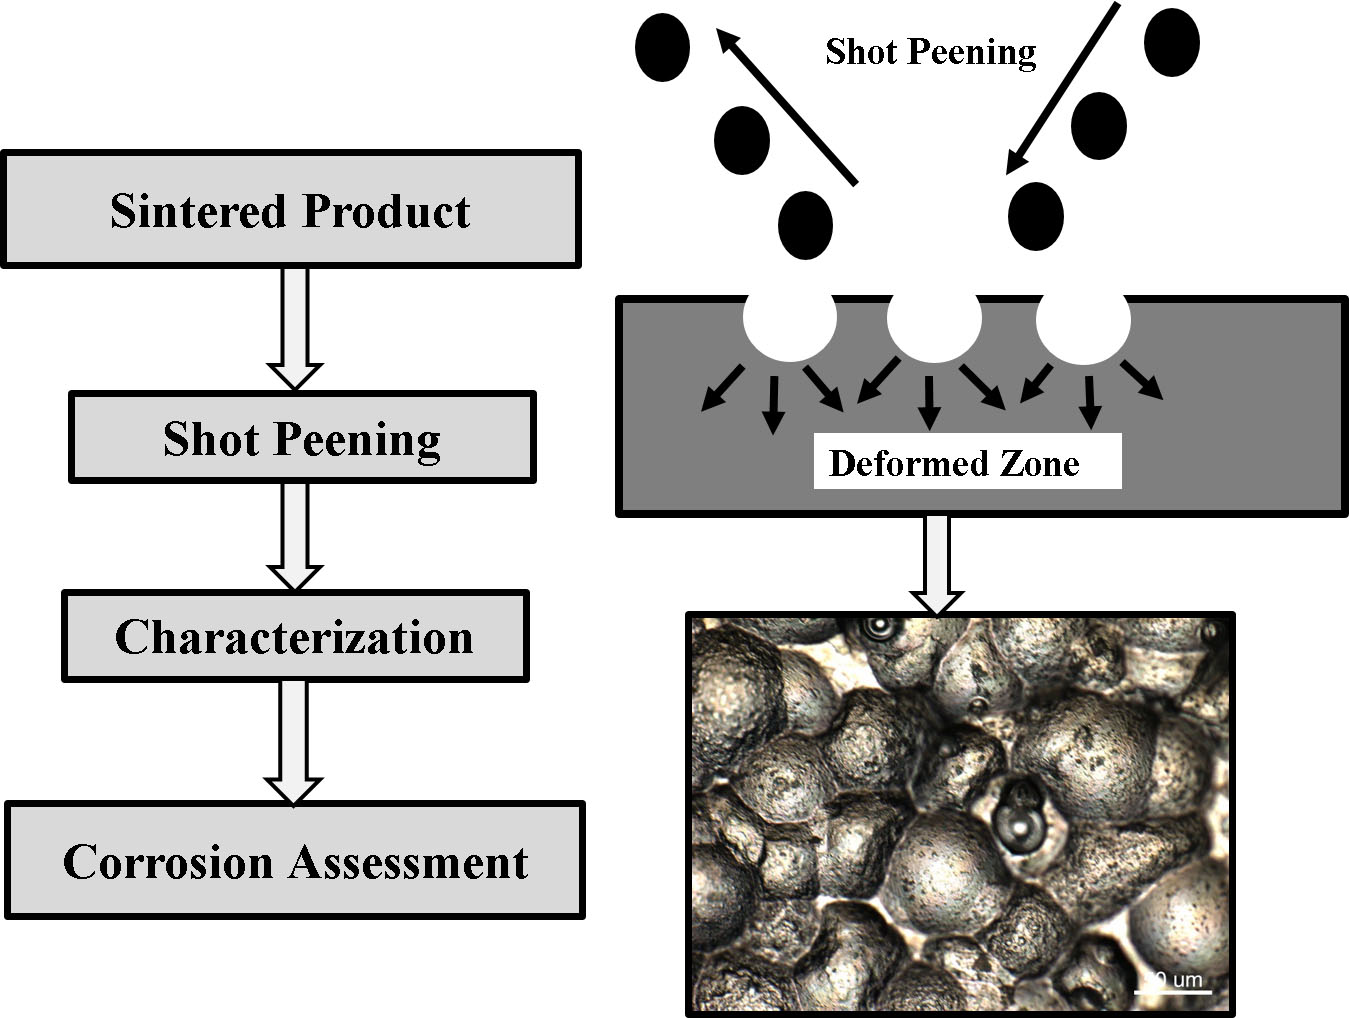
Sintering was conducted in a bell jar furnace (Materials Research Furnaces, MRF) and consisted of three stages: de-lubrication, sintering, and cooling. The process was performed under a continuous flow of ultra-high purity nitrogen gas (>99.999%) to prevent oxidation. The samples were first held isothermally at 390 °C for 30 minutes to remove the lubricant, followed by sintering at 630 °C for 30 minutes. Post-sintering cooling was carried out in a water-jacketed section of the furnace to control the cooling rate. Figure 3 shows a schematic diagram of the powder processing. All sintered Alumix 321 PM samples underwent a T6 heat treatment to enhance their mechanical properties. A detailed sintering protocol for this alloy system is available in our previous publication on the siterability of Alumix 321 PM alloy [28].
2.3. Shot Peening Treatment
Following sintering, the 15 mm pucks underwent secondary processing consisting of heat treatment and shot peening. The heat treatment followed a T6 tempering schedule, beginning with solution treatment at 530 °C for 1 hour, water quenching, and artificial aging at 160 °C for 18 hours. After heat treatment, the sintered samples were subjected to shot peening using a Cana Blast machine manufactured by International Surface Technology (IST Inc.). Prior to peening, the samples were ground, polished, and then cleaned in an ultrasonic bath. The shot peening system consists of a closed peening cabinet designed to precisely control the shot flow. The sample holder was mounted on a movable aluminum ram driven by an electric motor and controlled via an automated actuator system to ensure consistent coverage. Prior to performing the shot peening on the PM samples, standard Almen strips were used to calibrate the system. The arc height of the strips was measured to determine the Almen intensity of the process. Zirconium oxide beads with a diameter of 300 μm were employed as the peening medium. The operating parameters were selected to achieve a peening intensity of 0.4 mmN.
2.4. Surface and Metallographic Characterization
The surface characteristics of the as-sintered, shot-peened, and AA6061-T6 samples were evaluated using a non-contact Nanovea Micro-Profiler (Model PS50) equipped with a 1.2 mm sensor and a resolution of 0.1 µm. Full-surface scans of the disk specimens were performed, and the data were analyzed using the Nanovea 3D software package.
Microstructural examinations were conducted on sintered, shot-peened, and AA6061 samples, as well as on corroded specimens. Mounted samples were ground and polished using a series of diamond pastes ranging from 9 µm to 0.1 µm, followed by rinsing with distilled water and drying. An Olympus BX51-TRF optical microscope, integrated with an Olympus DP71 digital camera, was employed for optical imaging.
High-resolution surface and microstructural analysis were further performed using a Hitachi S4700 Cold Field Emission Scanning Electron Microscope (FESEM). This included examination of both corroded and uncorroded surfaces of the sintered, shot-peened, and AA6061-T6 samples. Elemental composition and qualitative phase identification were carried out using Energy Dispersive X-ray Spectroscopy (EDS) with an Oxford X-Sight 7200 system. EDS analysis was particularly utilized to investigate the phases present in the sintered samples and to assess the composition of corrosion products on the degraded surfaces.
2.5. Corrosion Experiments
Corrosion behavior was evaluated using an EG&G PARC Model 273A potentiostat (Princeton Applied Research), controlled via CorrWare software. Prior to use, the system was calibrated using a laboratory-fabricated “dummy” cell. Electrochemical tests were performed in a standard three-electrode bulb cell configuration. The working electrode (sample) potential was measured against a saturated calomel electrode (SCE) via a Luggin capillary, while a large graphite rod (area = 3.85 cm²) served as the counter electrode.
All experiments were conducted in a synthetic electrolyte composed of 3.5 wt% NaCl (analytical grade) dissolved in deionized water. The solution was naturally aerated, maintained at a constant temperature of 22 ± 1 °C, and its pH was kept between 6.2 and 6.6. A custom Teflon sample holder was designed to accommodate specimens of 1.5 cm diameter, exposing 1.0 cm² of the surface to the test solution.
The materials tested included wrought AA6061 alloy, sintered Alumix 321 PM alloy, and shot-peened Alumix 321 PM alloy. Wrought samples were sectioned from a 15 mm diameter extruded rod perpendicular to the extrusion direction. Sintered and shot-peened samples were used in their original disk form (15 mm diameter), with no additional machining required. Prior to testing, the wrought and sintered samples were prepared using conventional metallographic procedures. In contrast, shot-peened samples were tested as-is to preserve surface conditions resulting from peening.
Before electrochemical measurements, samples were immersed in the electrolyte to allow stabilization of the open circuit potential (OCP): 2 hours for sintered samples and 1 hour for wrought ones. Potentiodynamic polarization tests were employed to investigate electrochemical behavior. Tafel extrapolation (TE), cyclic polarization (CP), and stair-step polarization (SSP) techniques were used to evaluate corrosion current density, pitting susceptibility, and pit propagation under stepped conditions, respectively. A scan rate of 0.1667 mV/s was used for both TE and CP tests. For SSP tests, a step size of 10 mV and a step duration of 2500 seconds were applied.
Electrochemical impedance spectroscopy (EIS) was conducted using a Gamry 600 poteniostat with a flat cell configuration. Experiments were conducted using Gamry's Electrochemist software, and data fitting and circuit modeling were performed using Chemo Plot. EIS measurements were performed over a frequency range of 100 kHz to 10 mHz, with a 10 mV AC amplitude superimposed on the OCP. Prior to each EIS test, samples were allowed to stabilize in the electrolyte for 1 hour to ensure a steady-state OCP was established.
3. Results and Discussion
3.1. Surface Topography Assessment
SP significantly altered the surface topography of the tested samples. Surface scans of the Alumix 321 PM samples before and after shot peening, as well as the wrought AA6061-T6 samples are presented in Figure 4. Prior to shot peening, residual surface porosity was evident on the sintered specimens. The 3D surface images are color coded to reflect height variations, with blue indicating lower elevations and red representing higher features. These images clearly demonstrate the morphological changes induced by the peening process on the PM samples.
Figure 5 displays the surface profile scans of three sample types: wrought AA6061-T6, as-sintered Alumix 321 PM, and Alumix 321 PM peened to an intensity of 0.4 mmN. Surface roughness measurements were extracted from the profile data. The results showed consistent agreement with the visual output of the micro profilometer.
For both the as sintered and wrought samples, the surface roughness values were nearly identical 0.033 ± 0.003 µm and 0.034 ± 0.004 µm, respectively. This similarity can be attributed to the absence of any surface modification and the use of a common metallographic preparation procedure. In contrast, the roughness of the shot peened samples was significantly higher, reaching 3.95 ± 0.252 µm. This marked increase confirms the substantial surface deformation introduced by the peening process.
3.2. Microstructural Evaluation
The densification achieved after compaction and sintering is notably high, as illustrated in Figure 6. The microstructure is dominated by the aluminum α-phase, with visible precipitates along the grain boundaries. These features are characteristic of sintered materials, including the presence of closed, rounded pores, signifying effective densification. This enhanced densification can be attributed to the combined effect of the high compaction pressure (500 MPa) and liquid phase sintering (LPS), which promotes efficient mass transport within the alloy matrix [29,30]. As a result, the density increased from 2.576 g/cm³ in the green compact to 2.645 g/cm³ after sintering, corresponding to a relative density of 98.4% of the theoretical density (TD).
Figure 7a presents a high-magnification optical micrograph revealing the effects of shot peening on the microstructure of the Alumix 321 PM alloy. The image displays a dimple-like surface morphology, generated by the intense mechanical impact of the shot peening process. Although shot peening can deform and partially close surface voids, residual porosity remains evident. These pores are often irregular, interconnected, and extend beneath the modified surface layer. Figure 7b further shows that smaller pores undergo significant deformation and partial closure, which reduces their size and mitigates their role as potential stress concentrators and corrosion initiation sites.
Figure 8a and Figure 8b present SEM micrographs of the shot-peened Alumix 321 PM alloy, clearly demonstrating the alteration in surface topography due to the peening process. The observed dimple structure appears as valleys and peaks is a direct result of the impact from the peening media. While literature reports that shot peening may introduce microcracks that can compromise material performance [31,32], no such defects were observed in the current study. This absence of surface cracking is likely due to the unique characteristics of the pressed and sintered structure, which, due to its inherent porosity, can absorb a portion of the impact energy during peening.
3.3. Electrochemical Behaviour
OCP measurements were performed on Alumix 321 PM samples before and after the application of shot peening. The variation of potential versus time is presented in Figure 9. The shot peened samples exhibited a more active electrochemical potential, as evidenced by a lower Eocp compared to the as sintered condition. Specifically, the measured OCP values were -0.753 ± 0.005 V/SCE for the as sintered samples and -0.769 ± 0.020 V/SCE for the shot peened counterparts. This shift to more negative potential is attributed to the increased surface energy and residual stress introduced by the mechanical deformation during shot peening, which alters surface characteristics and promotes higher reactivity [33,34].
To assess the corrosion kinetics, TE tests were conducted. Figure 10 illustrates the polarization curves for both peened and unpeened specimens. The polarization response can be divided into two distinct regimes: a near corrosion potential region and a higher anodic potential region ranging from approximately -0.6 to -0.4 V/SCE. Notably, the unpeened samples exhibited a sharp current rise near their corrosion potential (-0.753 V/SCE), indicating early pitting initiation. This is verified by the calculated ΔE (ΔE = Ecorr − Epit), which was ~0.00 V, implying negligible passivation range and confirming pitting initiation at Ecorr. In contrast, the shot peened samples exhibited a delayed pitting onset at -0.716 V/SCE, resulting in a ΔE of 0.046 V. A large difference between the two values usually indicates a wider passive region and possibly a better pitting resistance, signifying improved resistance to localized corrosion [35].
The second polarization zone, corresponding to potentials between -0.6 and -0.4 V/SCE, is characterized by current densities on the order of 10⁻² A/cm². In this region, the anodic curve of both peened and unpeened samples converge, indicating the breakdown of the passive film and the onset of active metal dissolution. At these higher anodic potentials, the similarity in current response suggests that passivity is lost for both conditions, and the corrosion behavior becomes dominated by uniform metal dissolution rather than localized attack.
Shot peening also markedly influenced the corrosion current density, reducing it from 7.86 × 10⁻⁶ A/cm² (un peened) to 3.20 × 10⁻⁷ A/cm² (shot peened), which corresponded to a corrosion rate reduction from 0.079 mmpy to 0.004 mmpy. These values indicate a substantial improvement in corrosion resistance. Interestingly, the corrosion current of the shot peened samples was even lower than that of wrought AA6061, as shown in Figure 11. This enhancement is attributed to surface densification, reduction in accessible porosity, and potential enhancement of passive film formation. Furthermore, the possible effect on porosity and probable closing off of the interconnected pores caused by peening may have contributed to better corrosion resistance by minimizing the likelihood for localized corrosion sites.
One of the main challenges in PM alloys is the presence of open and interconnected porosity, which adversely affects both mechanical and corrosion performance. These pores act as micro crevices, promoting differential aeration cells that are highly conducive to localized corrosion [13]. When exposed to a chloride containing environment (e.g., 3.5 wt% NaCl), these crevices can trap stagnant electrolyte, creating acidic micro environments rich in chloride ions that prevent stable passivation. Porosity in PM materials are categorized into isolated and interconnected pores [36]. The interconnected pores are particularly problematic for corrosion resistance since these pores form networks and offering extensive pathway for corrosion reactions to accelerate. Shot peening mechanically deforms the surface, effectively sealing many of the interconnected pores and thus impeding the access of electrolyte into the bulk. This sealing effect likely plays a fundamental role in the observed enhancement in corrosion resistance.
Aluminum and its alloys, particularly Al-Mg-Si are known for their susceptibility to localized corrosion [37,38,39]. To evaluate the tendency for pitting and crevice corrosion in Alumix 321 PM alloy, both peened and un peened samples were tested. Figure 12 shows the cyclic polarization curves for both shot peened and unpeened samples. The shot peened samples exhibited a more gradual increase in anodic current density, indicating improved passivity. Although both conditions showed a sharp rise in current density indicating pitting initiation, this transition occurred at a slightly higher potential in the peened samples (-0.716 ± 0.011 V/SCE) compared to the unpeened (-0.714 V/SCE). The re passivation potential remained nearly identical for both conditions at -1.050 ± 0.001 V/SCE. The corrosion potential (Ecorr) of the shot peened samples was also more negative (-0.762 ± 0.025 V/SCE) compared to the unpenned (-0.719 ± 0.016 V/SCE), consistent with the OCP results.
In contrast to our results, Chen et al. [33] reported that shot peening shifted the Ecorr of AA6061 toward more positive values following shot peening, which they attributed to the formation of an ultra-fine nanocrystalline surface layer. The discrepancy is likely due to the distinct microstructural characteristics between wrought AA6061 and the porous structure of Alumix 321 PM alloy. In the latter, the predominant effects arise from porosity modification and residual stress redistribution rather than grain refinement. This conclusion is in agreement with findings reported by other researchers [26,40].
The development of localized corrosion, particularly crevice corrosion, exhibits pronounced time dependent behavior [41]. This aspect is critical for understanding both the extent and severity of corrosion within the micro crevices associated with the inherent porosity of APM alloys. Consequently, the long-term exposure of sintered components, such as Alumix 321 PM, must be carefully considered when evaluating their corrosion resistance and service life. Although a relatively slow scan rate of 0.1667 mV/s was employed in this study, there remains a concern that such a rate may not sufficiently capture the time dependent nature of crevice corrosion initiation, especially within subsurface pores. To overcome this limitation, an advanced electrochemical technique utilizing an even slower scan rate was adopted to better simulate the conditions conducive to the onset and propagation of localized corrosion within porous structures. This approach enhances the reliability and accuracy of corrosion assessment, particularly in determining the susceptibility of Alumix 321 PM alloy to localized attack under prolonged exposure. For this purpose, stair step polarization (SSP) was employed. This technique is characterized by exceptionally slow potential increments with periods of approximately 41 minutes per step. Figure 13 presents the SSP results, illustrating both the potential variation over time and the corresponding current response for peened and unpeened Alumix 321 PM samples. At lower potentials, both sample types exhibited similarly low current densities, indicating stable passive behavior. However, at a distinct potential threshold, a sharp increase in current density was observed, signifying the initiation of localized corrosion. Importantly, this transition occurred at a more anodic potential in the shot peened samples (-0.690 V/SCE) compared to the unpeened ones (-0.711 V/SCE), indicating an enhancement in pitting resistance due to the surface modification. The observed difference in pitting potential underscores the sensitivity and effectiveness of the SSP technique in evaluating localized corrosion resistance, offering potentially greater resolution than conventional cyclic polarization methods. The clear separation in pitting behavior supports the argument that the extended dwell times inherent in SSP are critical for establishing the electrochemical conditions necessary for pit initiation. This work is the first to employ the SSP technique for the assessment of localized corrosion in aluminum powder metallurgy alloys.
Comprehensive electrochemical parameters derived from these analyses are summarized in Table 2, offering a detailed comparison of the corrosion behavior of the investigated alloy in both peened and unpeened states.
To gain a deeper understanding of the corrosion behaviour of Alumix 321 PM alloy, Electrochemical Impedance Spectroscopy measurments(EIS) were carried out. Figure 14 presents the Nyquist plots, and the equivalent circuit parameters are summarized in Table 3. The Nyquist plot shows that post sintering shot peening process has influenced the electrochemical behaviour of Alumix 321 PM alloy. The data shows that the Ypo increases from 24.42 μsnΩ−1cm-2 for the unpenned samples to 155.8 μsnΩ−1cm-2 for the peened sample, reflecting the impact of shot peening on the surface, which may have led to more heterogeneity showing an increase in the effective capacitance. Additionally, the exponent (n) decreases from 0.901 for the un peened sample to 0.757, for the peened sample indicating the deviation from the ideal capacitive behaviour to more heterogeneous conditions due to the shot peening. The charge transfer resistance (Rct) was recorded to be 9754 Ω·cm² and 12400 Ω·cm² for the un peened and peened samples, respectively. This rise in Rct indicates a lowr rate of electrochemical reaction at the electrolyte/material interface, reflecting a more protective passive film and reduced tendency to localized corrosion. This improvement can be attributed to the partial closure porosity and localized densification of the surface/subsurface layer induced by shot peening, which limits electrolyte ingress and hinders transport a cross the metal/electrolyte boundary. The Warburg impedance (W) also changed dramatically because of shot peening. Warburg impedance increases from 7.46 μsnΩ−1cm−2 in the un-peened samples to 264.9 μsnΩ−1cm−2 after shot peening, likely due to increased surface complexity and hindered diffusion paths resulting from the severe surface modification after shot peening deformation. Micro roughness, dimple microstructure, and deformation after shot peening could have led to this complexity and interaction between the electrolyte and the peened surface. In addition to the previous parameters, pore resistance (Rpo), a measure of the oxide integrity of the investigated alloys, shows significant changes in the oxide layer’s nature. The Rpo shows a reduction from 6830 Ω·cm² in the un peened samples to 1311 Ω·cm² in the shot-peened sample, suggesting that shot peening disrupted the oxide layer integrity, possibly a result of roughening and structural changes in the porous network. This complex interplay between improved surface sealing and altered passive layer morphology ultimately defines the corrosion performance of shot peened Alumix 321 PM alloys.
3.4. Characterization of the Corroded Samples
Figure 15a presents the optical micrograph of the corroded surface of the shot peened Alumix 321 PM sample. Ideally, the shot peening process is expected to uniformly impact the entire surface, resulting in full coverage. However, the micrograph reveals the presence of isolated regions "islands" of undeformed material indicating incomplete peening. These unpeened areas suggest that achieving 100% surface coverage was not feasible in this case. Image analysis confirmed a coverage of approximately 95%. These strain-free regions are likely to exhibit different electrochemical behavior compared to the plastically deformed zones, introducing heterogeneity that could influence the overall corrosion response of the alloy. Notably, visible pitting was observed within these undeformed regions, as well as within the dimpled features generated by peening. However, corrosion within the dimples appears comparatively minor, supporting the hypothesis that the peening induced compressive stresses and potential pore closure may enhance localized corrosion resistance. High magnification optical micrograph shown in Figure 15b provides clearer evidence of this phenomenon, showing pits both within the dimples and on the unaffected surface. This suggests that while shot peening improves surface characteristics, incomplete coverage may still allow for preferential localized attack in unpeened regions.
Figure 16 shows the corroded surfaces of the as sintered and shot peened Alumix 321 PM samples. Shot peening appears to be effective in reducing the number of corrosion sites, a finding supported by the observed decrease in corrosion current density following the treatment. This improvement may be attributed, in part, to the partial collapse of interconnected pores during peening, which likely sealed some previously open pathways and reduced the overall surface area exposed to the electrolyte.
Figure 17a and Figure 17b present low and high magnification SEM micrographs of the corroded Alumix 321 PM alloy after shot peening. The higher magnification image reveals rounded pits on the surface, some of which are located within the dimples created by peening. Additionally, evidence of corrosion within larger, interconnected pores indicative of crevice-like attack is present, alongside signs of intergranular corrosion (IGC).
To gain deeper insight into the corrosion behavior of the Alumix 321 PM alloy, samples were immersed in a 3.5 wt.% NaCl solution and subsequently examined. Detailed surface analysis revealed fragmentation of the oxide layer. EDS confirmed that the detached fragments were enriched in iron. Further SEM examination performed on gently polished surfaces showed that pitting predomi-nantly initiated in the vicinity of second-phase particles containing iron, silicon, and copper. These results indicate that pitting corrosion is characterized by the formation of hemispherical pits nucleating at or near Fe-rich intermetallic particles. The pit initiation is attributed to localized micro-galvanic corrosion cell between these cathodic particles and the surrounding α-aluminum matrix. Representative pitting morphologies are shown in Figure 18a, while Figure 18b presents the corresponding EDS elemental maps, confirming the association between pit formation and Fe-containing phases.
A similar analytical approach was employed to investigate the pitting behavior of the wrought AA6061 alloy. As shown in Figure 19, pits were likewise observed to form preferentially around iron-rich second-phase particles. Despite differences in processing route and microstructural characteristics, both Alumix 321 PM and AA6061 alloys exhibited pitting corrosion governed by the same micro-galvanic corrosion mechanism involving Fe-rich intermetallics and the aluminum matrix. Notably, no signs of IGC were observed in the AA6061 samples. In contrast, the Alumix 321 PM samples exhibited clear features of intergranular corrosion. Figure 20 illustrates SEM evidence and elemental line mapping highlighting the IGC attack. The presence of IGC alongside pitting indicates that the PM alloy is susceptible to multiple corrosion modes in contrast to AA6061 which showed only pitting corrosion.
For further clarification of the corrosion mechanism, selected corroded Alumix 321 PM samples were sectioned, mounted in epoxy, and carefully polished to reveal the cross-sectional morphology. Figure 21 presents the schematic of the cross-sectioned sample, while Figure 22 shows the microstructural features of the cross section after corrosion.
The micrograph illustrated in Figure 22a shows a cross-sectional view of the shot peened Alumix 321 PM alloy after exposure to a 3.5 wt% NaCl solution. A continuous corrosion layer was observed along the surface, extending to a depth of approximately 10 µm. The presence of this relatively thin corrosion layer indicates that shot peening effectively enhanced the surface integrity of the alloy by closing or sealing most of the open pores. As a result, the penetration of the corrosive medium into the subsurface region was significantly reduced, and the majority of the corrosion damage remained limited to the outer surface. Nevertheless, localized regions exhibited evidence of intergranular corrosion, extending to depths of approximately 50 µm along certain grain boundaries. This observation suggests that a small number of unsealed or partially closed pores may have persisted after the shot peening treatment, providing preferential initiation sites or transport channels that facilitated the ingress of chloride ions and subsequent attack along the grain boundaries. These defects likely acted as pathways for localized electrolyte penetration, promoting the observed intergranular corrosion despite the overall improvement in surface densification. EDS analyses was conducted at several points along the affected grain boundaries, as shown in Figure 22b. The spectra revealed elevated concentrations of oxygen and aluminum, consistent with the formation of aluminum oxide (Al₂O₃) corrosion products along the corroded grain boundaries. This compositional evidence confirms that corrosion propagation occurred preferentially at these localized regions, likely driven by microstructural heterogeneities and residual surface pores that remained even after shot peening.
4. Conclusions
hot peening at an intensity of 0.4 mm N produced a uniform dimpled surface microstructure on the Alumix 321 PM alloy, indicating localized plastic deformation and pore closure. This treatment increased surface roughness while significantly reducing the corrosion rate from 0.079 to 0.004 mmpy, highlighting a marked improvement in corrosion resistance. Electrochemical testing revealed a decrease in corrosion current density and a shift of both corrosion and open-circuit potentials toward more negative values. The stair-step polarization technique, using a slower scan rate, confirmed superior pitting resistance in shot-peened samples compared to unpeened ones, offering a more representative assessment of corrosion behavior. Compared to the wrought AA6061 alloy, the Alumix 321 PM alloy exhibited distinct corrosion mechanisms due to its porous powder metallurgy microstructure. Overall, shot peening proved highly effective in improving the corrosion performance of the sintered Alumix 321 PM alloy.
Author Contributions
Conceptualization, A.I.; methodology, A.I., G.K. and P.B.; validation, A.I., G.K. and P.B.; formal analysis, A.I., G.K.; investigation, A.I., G.K.; resources, A.I., P.B. and G.K.; data curation, A.I; writing—original draft preparation, A.I.; writing—review and editing, A.I., P.B. and G.K,; supervision, G.K. and P.B.; project administration, G.K.; funding acquisition, G.K. and P.B.. All authors have read and agreed to the published version of the manuscript.
Funding
This research was partially funded by the Natural Sciences and Engineering Research Council (NSERC) of Canada.
Institutional Review Board Statement
Not applicable.
Informed Consent Statement
Not applicable.
Data Availability Statement
The raw data supporting the conclusions of this article will be made.
Acknowledgments
The authors sincerely acknowledge the late Dr. Georges Kipouros for his valuable insights and dedicated efforts during the revision of this work. His passing represents a great loss to the materials science community. The authors also thank the Natural Sciences and Engineering Research Council (NSERC) of Canada for financial support and the Powder Metallurgy Group and Minerals Engineering Centre (MEC) at Dalhousie University for their technical assistance.
Conflicts of Interest
The authors declare no conflicts of interest.
References
- Tian, H.; Zhao, F.; Ma, D.; Zhao, X.; Meng, J.; Zhang, G.; Wu, F. An Improved Process for Solving the Sintering Problem of Al-Si Alloy Powder Metallurgy. Metals 2024, 14(11), 1295. [Google Scholar] [CrossRef]
- Parveez, B.; Jamal, N. A.; Anuar, H.; Ahmad, Y.; Aabid, A.; Baig, M. Microstructure and mechanical properties of metal foams fabricated via melt foaming and powder metallurgy technique: a review. Materials 2022, 15(15), 5302. [Google Scholar] [CrossRef]
- Edosa, O. O.; Tekweme, F. K.; Gupta, K. A review on the influence of process parameters on powder metallurgy parts. Engineering and Applied Science Research 2022, 49(3), 433–443. [Google Scholar]
- Nassef, A.; El-Garaihy, W. H.; El-Hadek, M. Characteristics of cold and hot pressed iron aluminum powder metallurgical alloys. Metals 2017, 7(5), 170. [Google Scholar] [CrossRef]
- Wu, L.; Yu, Z.; Liu, C.; Ma, Y.; Huang, Y.; Wang, T.; Liu, W. Microstructure and tensile properties of aluminum powder metallurgy alloy prepared by a novel low-pressure sintering. Journal of Materials Research and Technology 2021, 14, 1419–1429. [Google Scholar] [CrossRef]
- Wang, T.; Huang, Y.; Ma, Y.; Wu, L.; Yan, H.; Liu, C.; Liu, W. Microstructure and mechanical properties of powder metallurgy 2024 aluminum alloy during cold rolling. Journal of Materials Research and Technology 2021, 15, 3337–3348. [Google Scholar] [CrossRef]
- Sweet, G. A.; Amirkhiz, B. S.; Williams, B. W.; Taylor, A.; Hexemer, R. L.; Donaldson, I. W.; Bishop, D. P. Microstructural evolution of a forged 2XXX series aluminum powder metallurgy alloy. Materials Characterization 2019, 151, 342–350. [Google Scholar] [CrossRef]
- Harding, M. D.; Donaldson, I. W.; Hexemer Junior, R. L.; Bishop, D. P. Effects of post-sinter processing on an Al–Zn–Mg–Cu powder metallurgy alloy. Metals 2017, 7(9), 370. [Google Scholar]
- Tünçay, M. M.; Muñiz-Lerma, J. A.; Bishop, D. P.; Brochu, M. Spark plasma sintering and spark plasma upsetting of an Al-Zn-Mg-Cu alloy. Materials Science and Engineering: A 2017, 704, 154–163. [Google Scholar]
- Monchoux, J. P.; Couret, A.; Durand, L.; Voisin, T.; Trzaska, Z.; Thomas, M. Elaboration of metallic materials by SPS: processing, microstructures, properties, and shaping. Metals 2021, 11(2), 322. [Google Scholar] [CrossRef]
- Wilson, M. F.; Donaldson, I. W.; Bishop, D. P. Sinter-swage processing of an Al-Si-Mg-Cu powder metallurgy alloy. Canadian Metallurgical Quarterly 2022, 61(1), 94–107. [Google Scholar] [CrossRef]
- Kipouros, G. J.; Caley, W. F.; Bishop, D. P. On the advantages of using powder metallurgy in new light metal alloy design. Metall Mater Trans B 2006, 37(12), 3429–3436. [Google Scholar] [CrossRef]
- Klar, E.; Samal, P. K. Powder Metallurgy Stainless Steels: Processing, Microstructures, and Properties; ASM International: Materials Park, OH, 2007. [Google Scholar]
- Judge, W.; Kipouros, G. Powder Metallurgy Aluminum Alloys: Structure and Porosity. In Encyclopedia of Aluminum and Its Alloys; CRC Press Taylor & Francis Group: New York, 2018; pp. 1977–1995. [Google Scholar]
- Steedman, G.; Bishop, D. P.; Caley, W. F.; Kipouros, G. J. Surface porosity investigation of aluminum–silicon PM alloys. Powder technology 2012, 226, 225–230. [Google Scholar] [CrossRef]
- Valizade, N.; Jarjoura, G.; Kipouros, G. J.; Plucknett, K.; Shakerin, S.; Mohammadi, M. Microstructure, hardness, and tribological properties of AA2014 powder metallurgy alloys: A sizing mechanical surface treatment study. Engineering Failure Analysis 2025, 174, 109550. [Google Scholar] [CrossRef]
- Yehia, H. M.; Elkady, O. A.; Reda, Y.; Ashraf, K. E. Electrochemical surface modification of aluminum sheets prepared by powder metallurgy and casting techniques for printed circuit applications. Transactions of the Indian Institute of Metals 2019, 72, 85–92. [Google Scholar] [CrossRef]
- Žagar, S.; Markoli, B.; Naglič, I.; Šturm, R. The Influence of Age hardening and shot peening on the surface properties of 7075 aluminium alloy. Materials 2021, 14(9), 2220. [Google Scholar] [CrossRef]
- Jambor, M.; Trško, L.; Klusák, J.; Fintová, S.; Kajánek, D.; Nový, F.; Bokůvka, O. Effect of severe shot peening on the very-high cycle notch fatigue of an AW 7075 alloy. Metals 2020, 10(9), 1262. [Google Scholar] [CrossRef]
- Ravnikar, D.; Šturm, R.; Žagar, S. Effect of shot peening on the strength and corrosion properties of 6082-T651 aluminium alloy. Materials 2023, 16(14), 4976. [Google Scholar] [CrossRef]
- Zupanc, U.; Grum, J. Effect of pitting corrosion on fatigue performance of shot-peened aluminum alloy 7075-T651. J. Matter. Process. Technol. 2010, 210(9), 1197–1202. [Google Scholar] [CrossRef]
- German, R. M. Powder Metallurgy Science, 2nd ed.; Metal powder industrial federation, 1994. [Google Scholar]
- O. Lynen; Eksi, A.; Bircan, D.; Dilek, M. The effects of sintering and shot peening processes on the fatigue strength. MaterialWiss Werkest 2010, 41(4), 202–212. [Google Scholar]
- Sun, Q.; Han, Q.; Xu, R.; Zhao, K.; Li, J. Localized corrosion behaviour of AA7150 after ultrasonic shot peening: Corrosion depth vs. impact energy. Corros.Sci 2018, 130, 218–230. [Google Scholar] [CrossRef]
- Pandey, Vaibhav; Singh, J. K.; Chattopadhyay, K.; Santhi Srinivas, NC; Singh, Vakil. Influence of ultrasonic shot peening on corrosion behavior of 7075 aluminum alloy. J. Alloys Compd. 2017, 723, 826–840. [Google Scholar] [CrossRef]
- Huang, Hao; Niu, Jintao; Xing, Xiangtao; Lin, Qichao; Chen, Hongtang; Qiao, Yang. Effects of the Shot Peening Process on Corrosion Resistance of Aluminum Alloy: A Review. Coatings 2022, 12(5), 629. [Google Scholar] [CrossRef]
- Trdan, Uroš; Grum, Janez. SEM/EDS characterization of laser shock peening effect on localized corrosion of Al alloy in a near natural chloride environment. Corros.Sci 2014, 82, 328–338. [Google Scholar] [CrossRef]
- Ibrahim, A.; Bishop, D. P.; Kipouros, G. J. Sinterability and characterization of commercial aluminum powder metallurgy alloy Alumix 321. Powder Technology 2015, 279, 106–112. [Google Scholar] [CrossRef]
- Martı́n, M.; Castro, F. Liquid phase sintering of P/M aluminum alloys: Effect of processing conditions. J. Matter. Process. Technol. 2003, 143–144(0), 814–821. [Google Scholar]
- Youseffi, M. Sintering and mechanical properties of prealloyed 6061 Al powder with and without common lubricants and sintering aids. Powder Metall. 2006, 49(1), 86–95. [Google Scholar]
- Qin, Z.; Li, B.; Zhang, H.; Wilfried, T. Y. A.; Gao, T.; Xue, H. Effects of shot peening with different coverage on surface integrity and fatigue crack growth properties of 7B50-T7751 aluminum alloy. Engineering Failure Analysis 2022, 133, 106010. [Google Scholar] [CrossRef]
- Černý, I.; Sís, J.; Mikulova, D. Short fatigue crack growth in an aircraft Al-alloy of a 7075 type after shot peening. Surface and Coatings Technology 2014, 243, 20–27. [Google Scholar] [CrossRef]
- Chen, B.; Hang, B.; Liu, H.; Li, X.; Ni, M; Lu, C. Surface nanocrystallization induced by shot peening and its effect on corrosion resistance of 6061 aluminum alloy. J. Mater. Res. 2014, 29(24), 3002–3010. [Google Scholar] [CrossRef]
- Harding, M.; Donaldson, I.; Hexemer, R.; Gharghouri, M.; Bishop, D. Characterization of the microstructure, mechanical properties, and shot peening response of an industrially processed Al–Zn–Mg–Cu PM alloy. J. Matter. Process. Technol. 2015, 221, 31–39. [Google Scholar] [CrossRef]
- Rodič, P.; Milošev, I.; Frankel, G. S. Corrosion of Synthetic Intermetallic Compounds and AA7075-T6 in Dilute Harrison’s Solution and Inhibition by Cerium (III) Salts. Journal of The Electrochemical Society 2023, 170(3), 031503. [Google Scholar]
- Seah, K. H.; Thampuran, R.; Teoh, S. H. The influence of pore morphology on corrosion. Corros. Sci. 1998, 40(4), 547–556. [Google Scholar] [CrossRef]
- Zaid, B. Effects of pH and chloride concentration on pitting corrosion of AA6061 aluminum alloy. Corros.Sci 2008, 50(7), 1841–1847. [Google Scholar] [CrossRef]
- Aylor, D. M.; Patrick, P.J. Pitting corrosion behavior of 6061 aluminum alloy foils in sea water. J.Electrochem. Soc. 1986, 133(5), 949–951. [Google Scholar] [CrossRef]
- Ahmad, Z. A review of corrosion and pitting resistance of Al 6061 and 6013 silicon carbide composites in neutral salt solution and seawater. Corros. Rev. 2001, 19(2), 119–156. [Google Scholar] [CrossRef]
- Peltz, J. D. S.; Beltrami, L. V. R.; Kunst, S. R.; Brandolt, C.; Malfatti, C. D. F. Effect of the shot peening process on the corrosion and oxidation resistance of AISI430 stainless steel. Materials Research 2015, 18, 538–545. [Google Scholar] [CrossRef]
- Pan, C. Q.; Zhong, Q. D.; Yang, J.; Cheng, Y. F.; Li, Y. L. Investigating crevice corrosion behavior of 6061 Al alloy using wire beam electrode. Journal of Materials Research and Technology 2021, 14, 93–107. [Google Scholar] [CrossRef]
Figure 1.
SEM micrograph shows the morphology of the as received Alumix 321 powder.
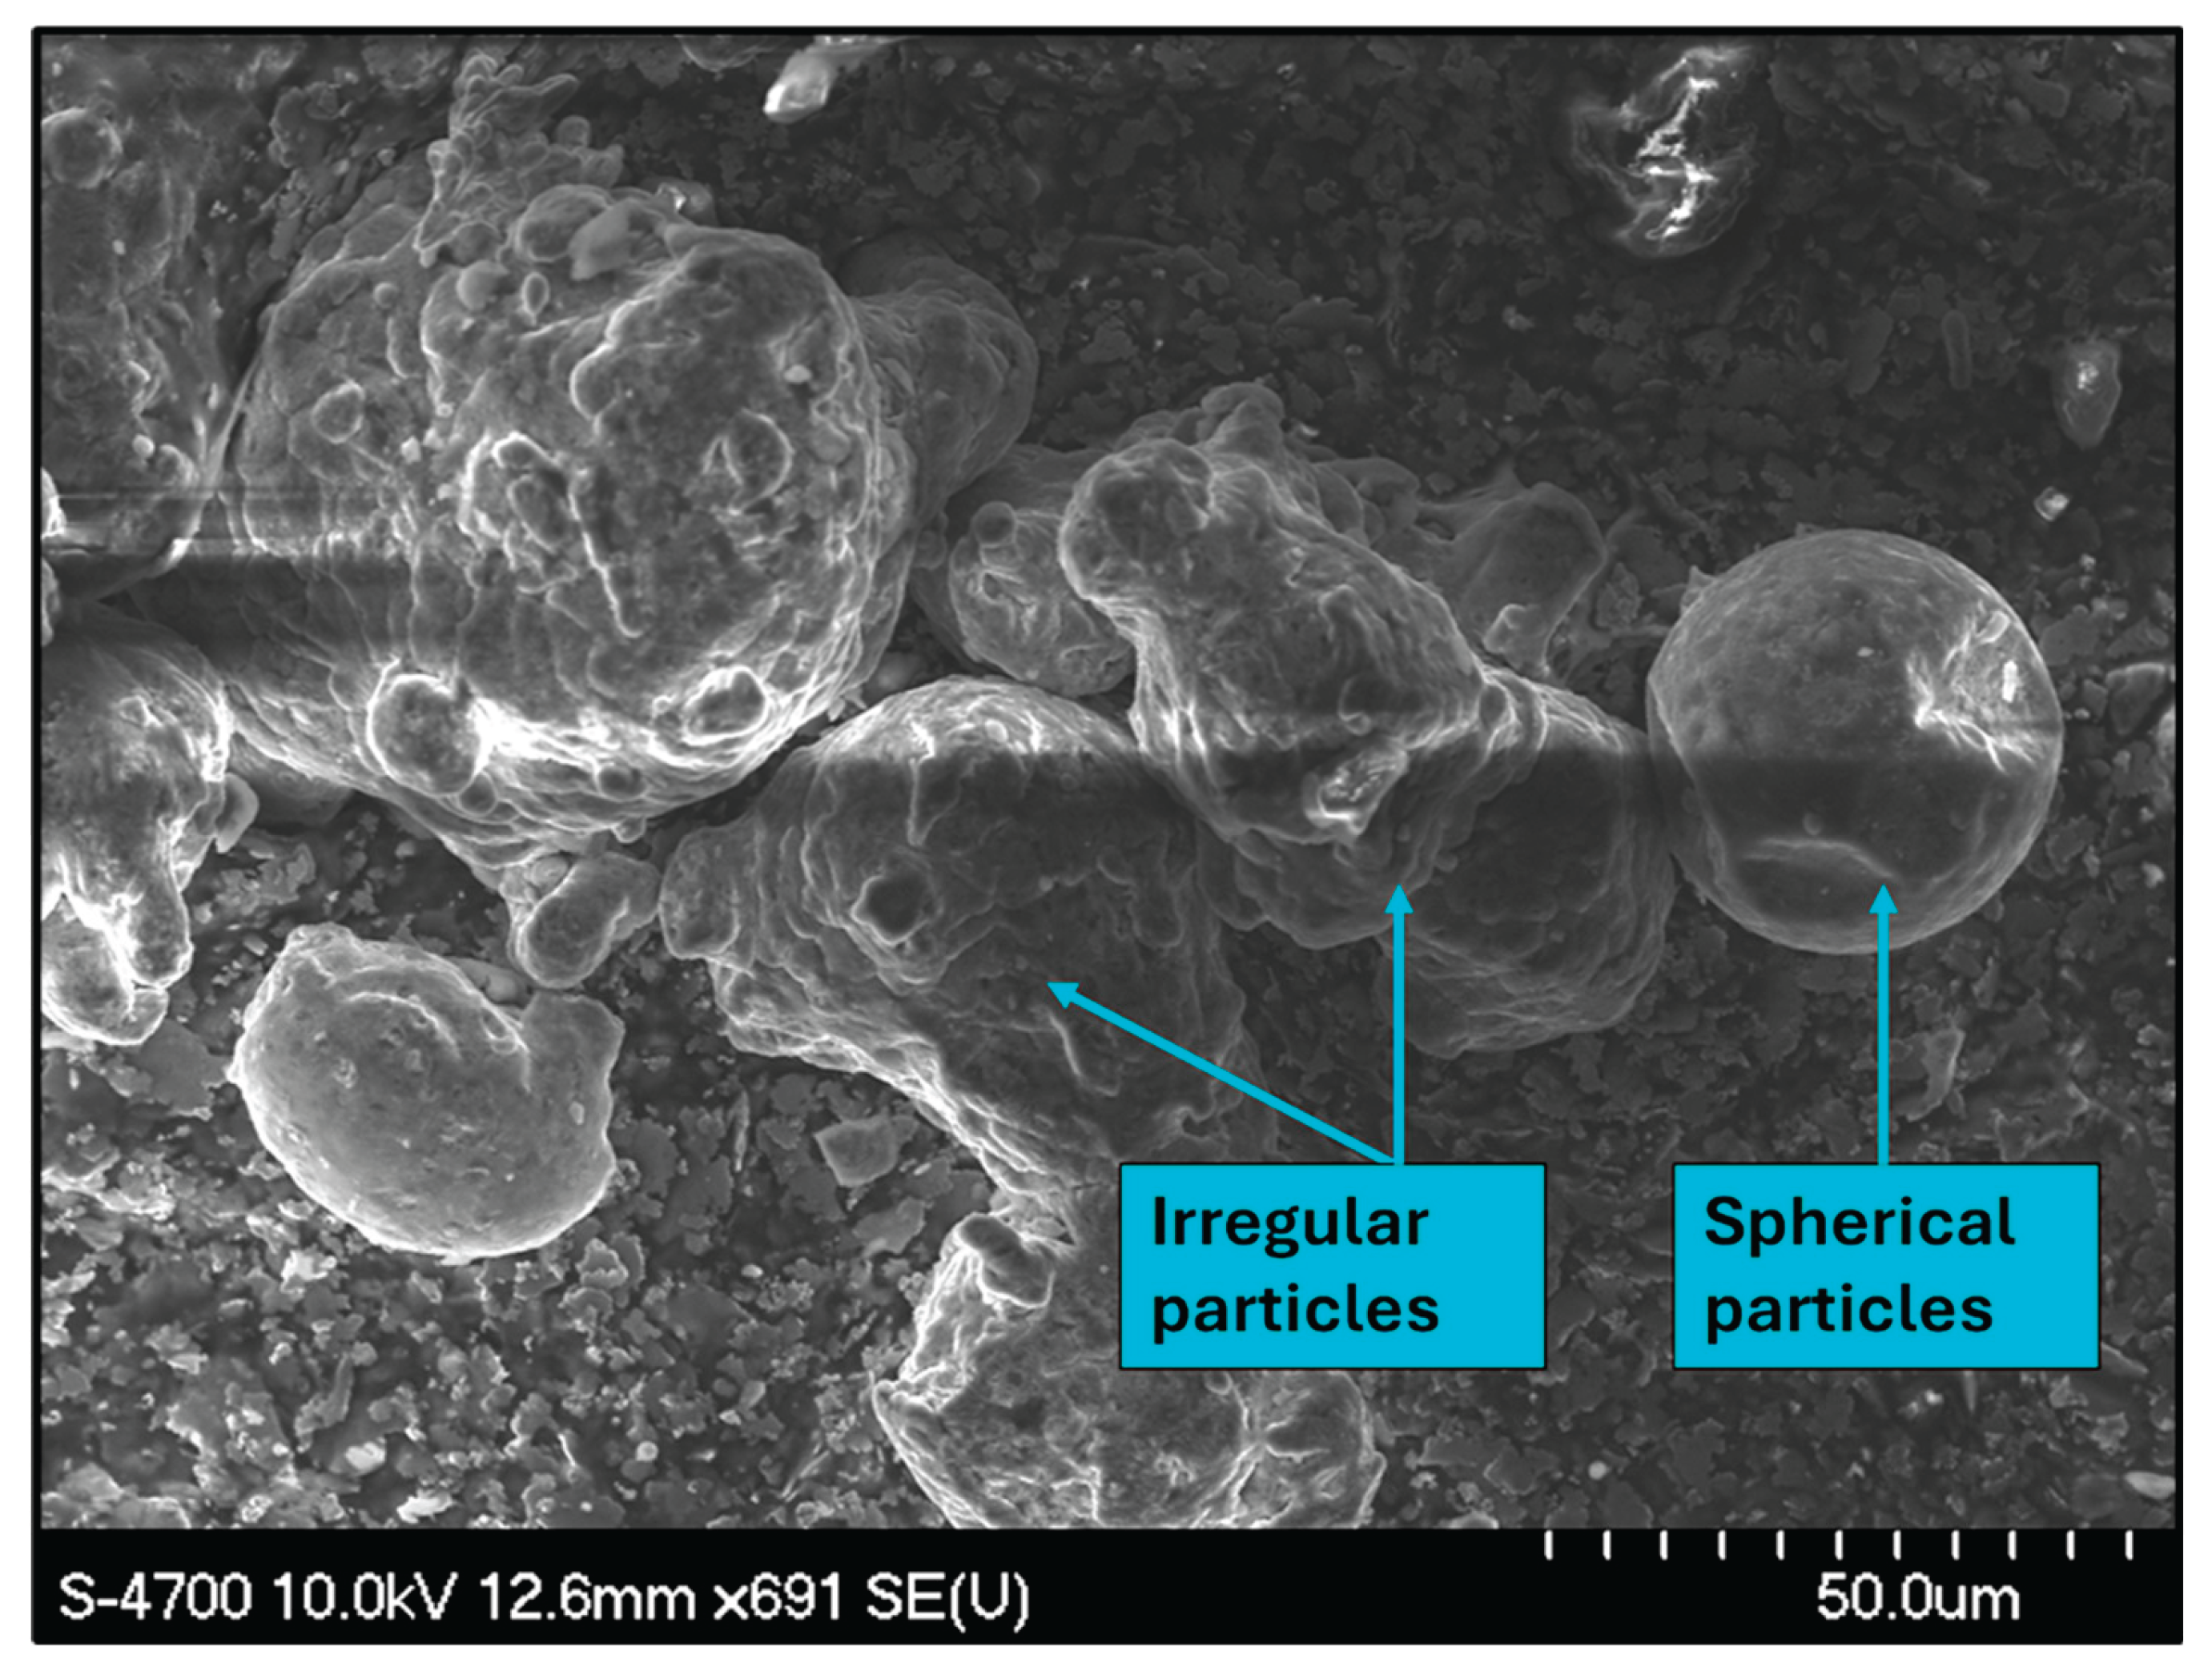
Figure 2.
EDS spectra acquired from: (a) spherical Alumix 321 particles; (b) irregular Alumix 321 particles.
Figure 2.
EDS spectra acquired from: (a) spherical Alumix 321 particles; (b) irregular Alumix 321 particles.
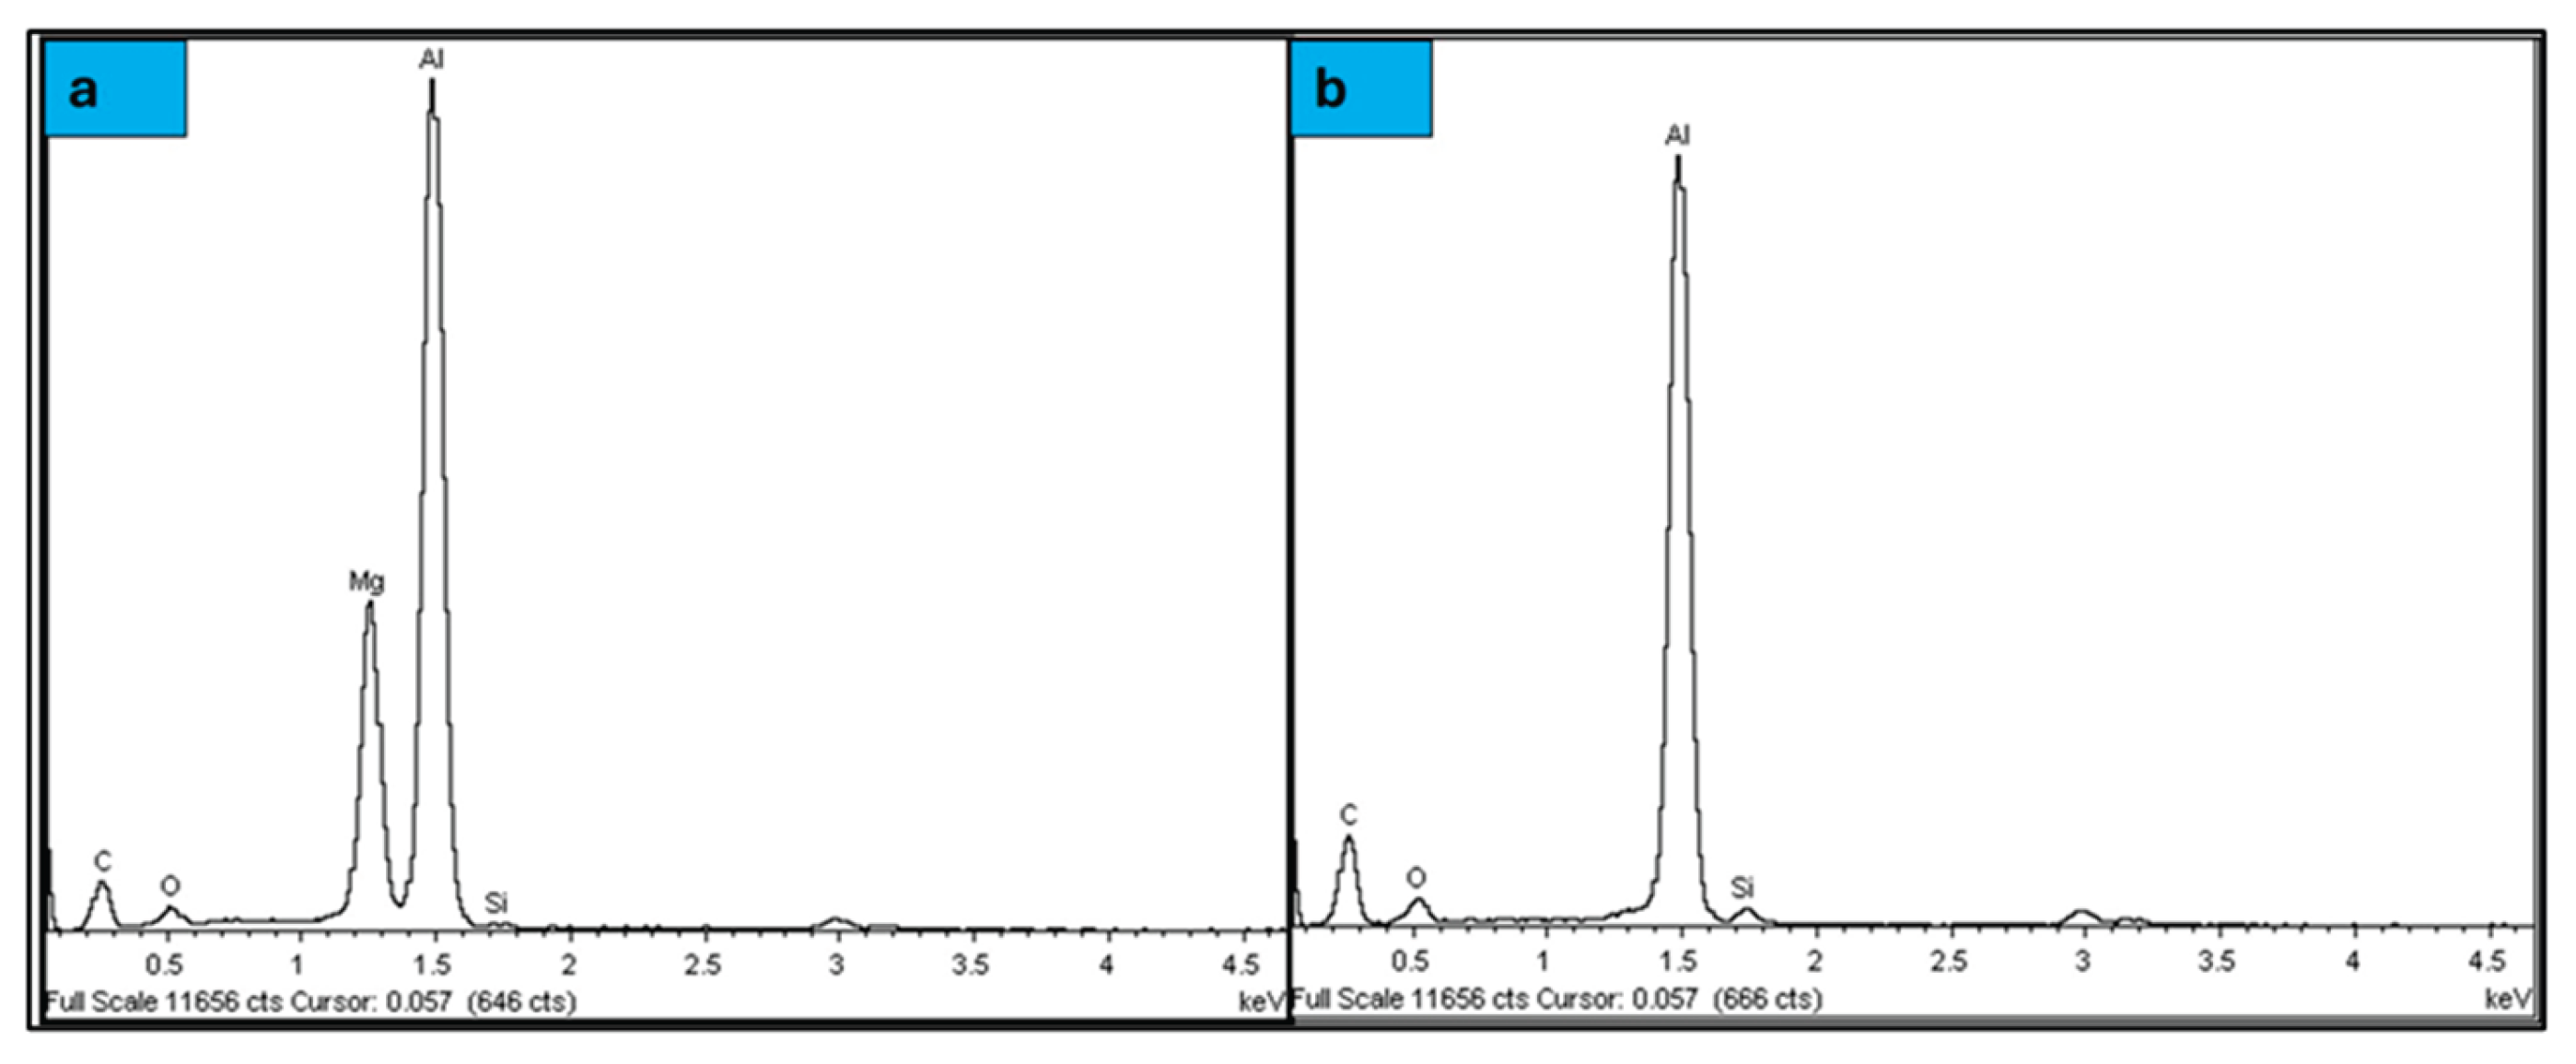
Figure 3.
Schematic diagram of powder metallurgy processing.

Figure 4.
Schematic illustration of the test samples surface analysis: (a) 6061 alloy; (b) un peened Alumix 321 PM alloy; (c) Shot peened Alumix 321 PM alloy; (d) 3D surface topography; (e) real surface, and (f) surface roughness parameters.
Figure 4.
Schematic illustration of the test samples surface analysis: (a) 6061 alloy; (b) un peened Alumix 321 PM alloy; (c) Shot peened Alumix 321 PM alloy; (d) 3D surface topography; (e) real surface, and (f) surface roughness parameters.
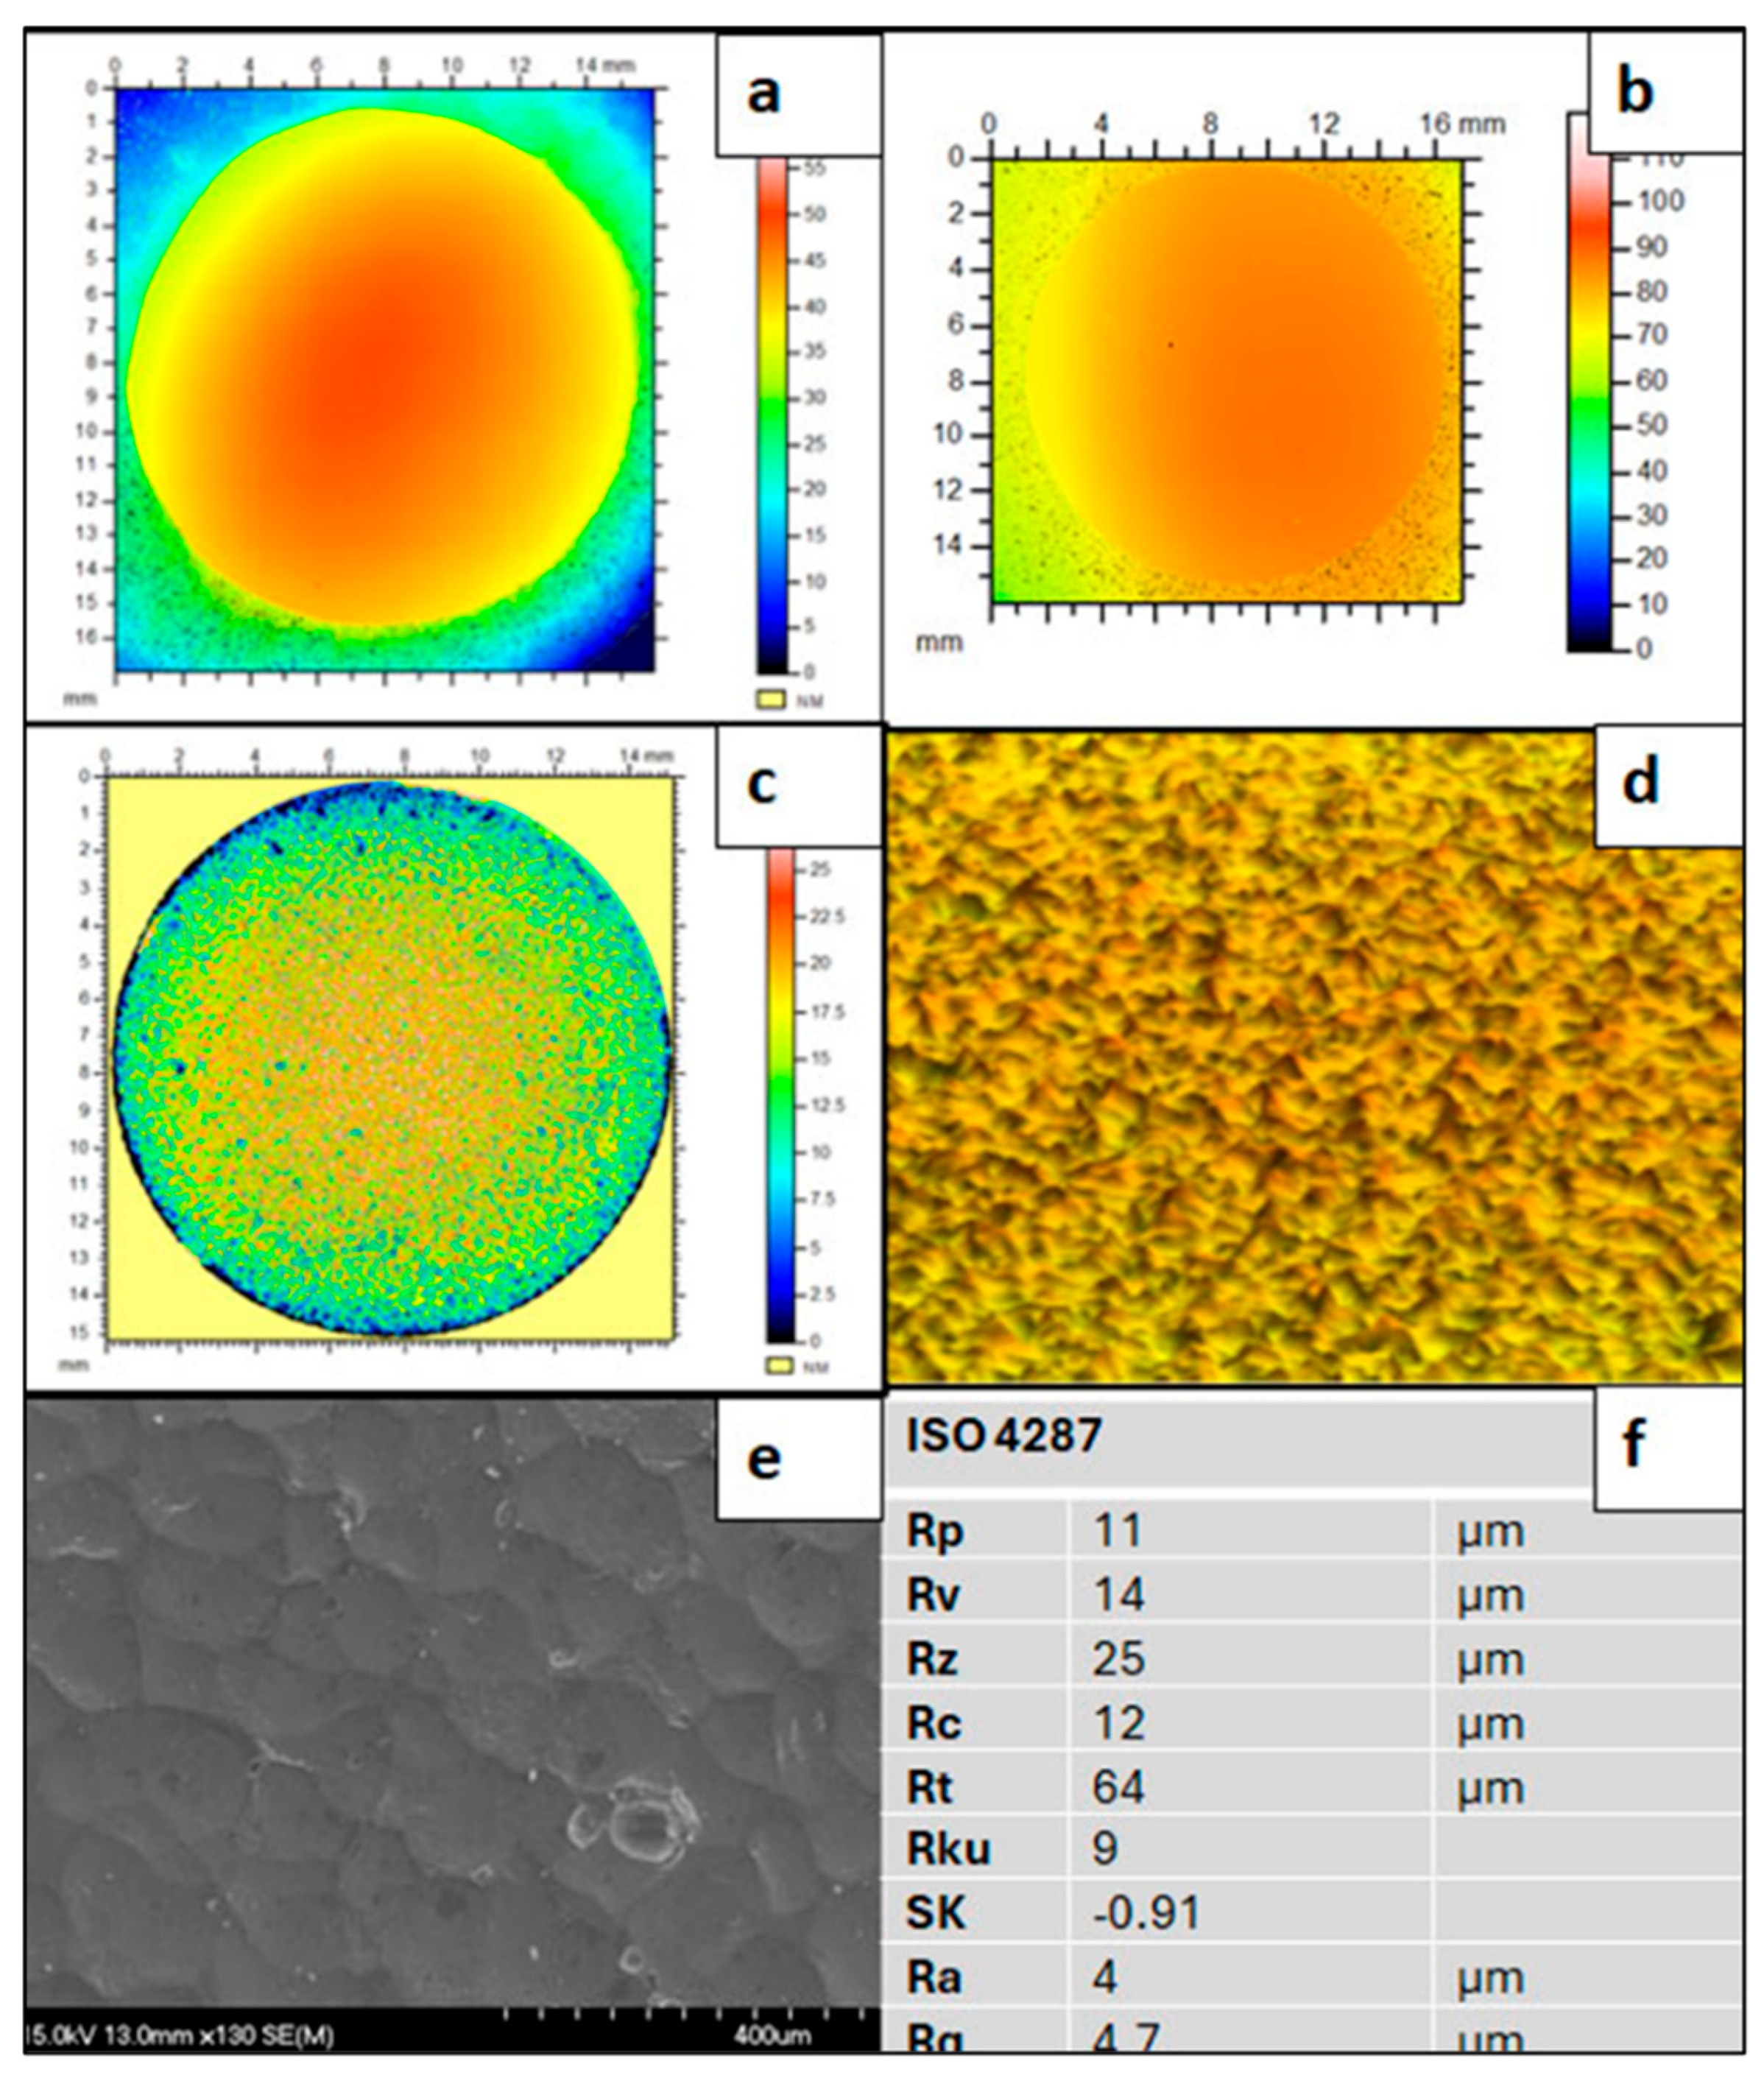
Figure 5.
Profile scan of: (a) Alumix 321-peened; (b) Alumix 321 PM-unpeened; (c) wrought AA6061 alloy.
Figure 5.
Profile scan of: (a) Alumix 321-peened; (b) Alumix 321 PM-unpeened; (c) wrought AA6061 alloy.

Figure 6.
Optical micrograph of Alumix 321 in as sintered material condition.
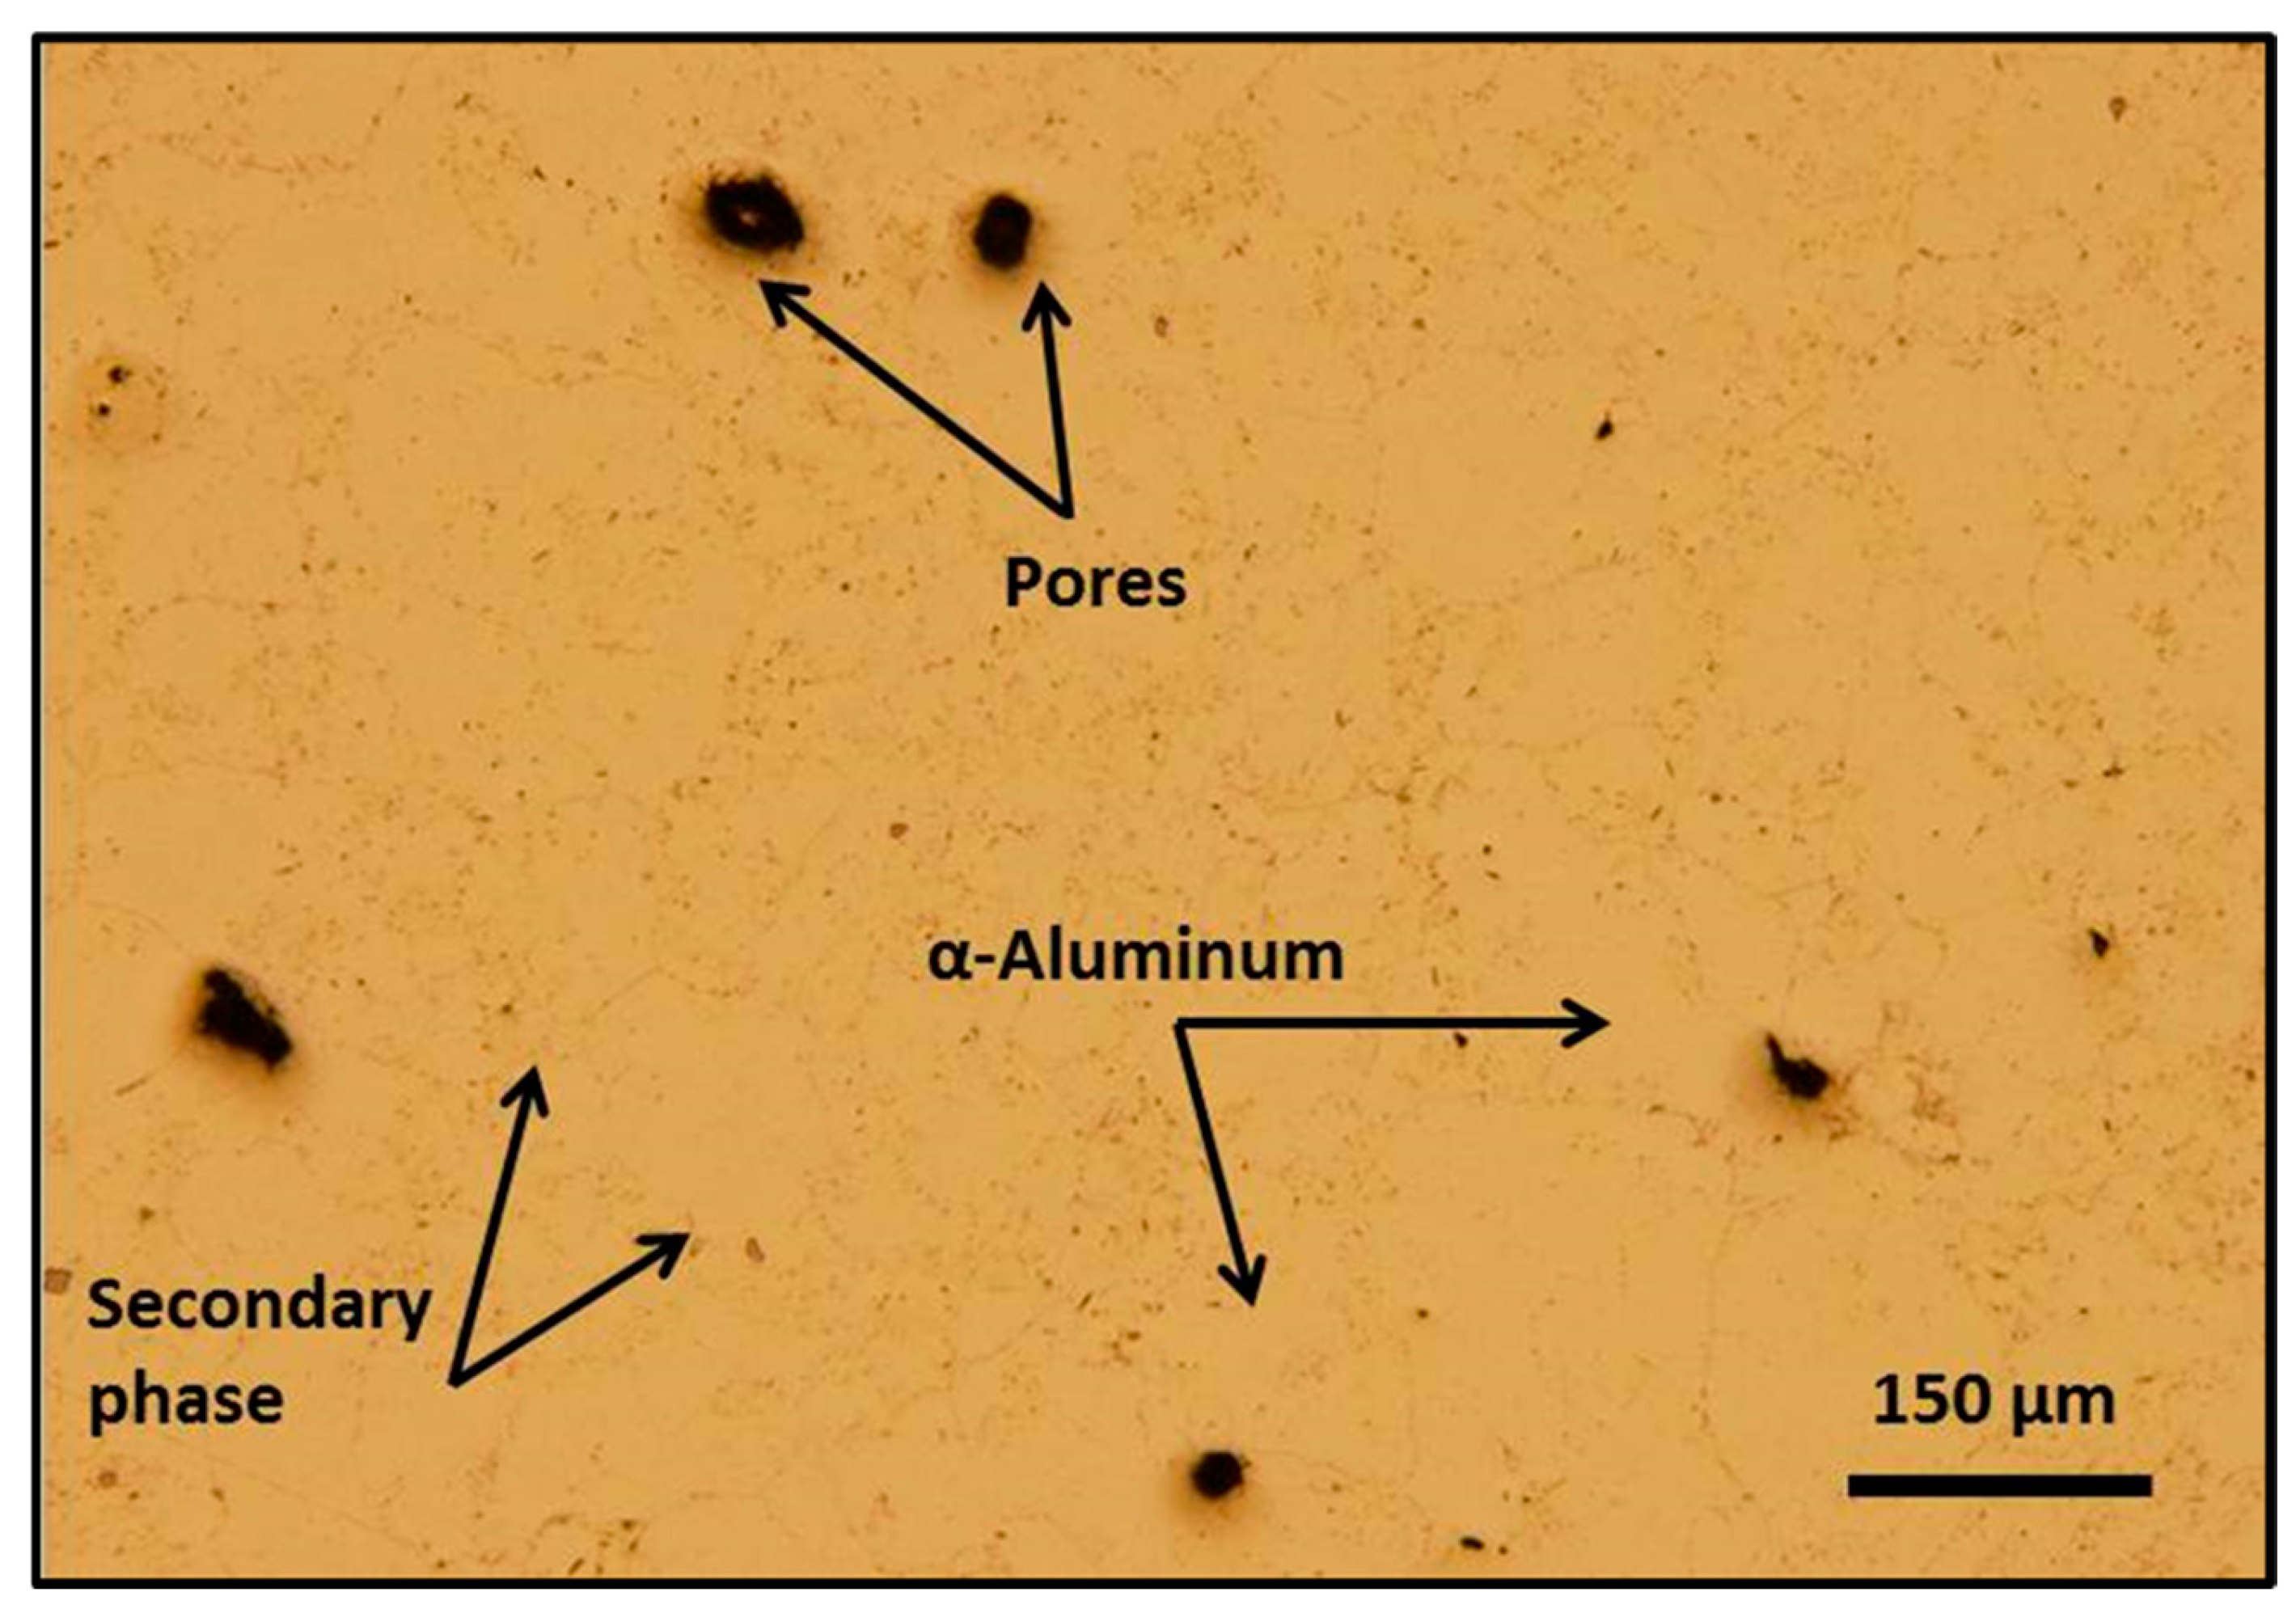
Figure 7.
High magnification optical micrographs of shot peened Alumix 321 PM alloy: (a) Dimple microstructure; (b) retained porosity after peening.
Figure 7.
High magnification optical micrographs of shot peened Alumix 321 PM alloy: (a) Dimple microstructure; (b) retained porosity after peening.
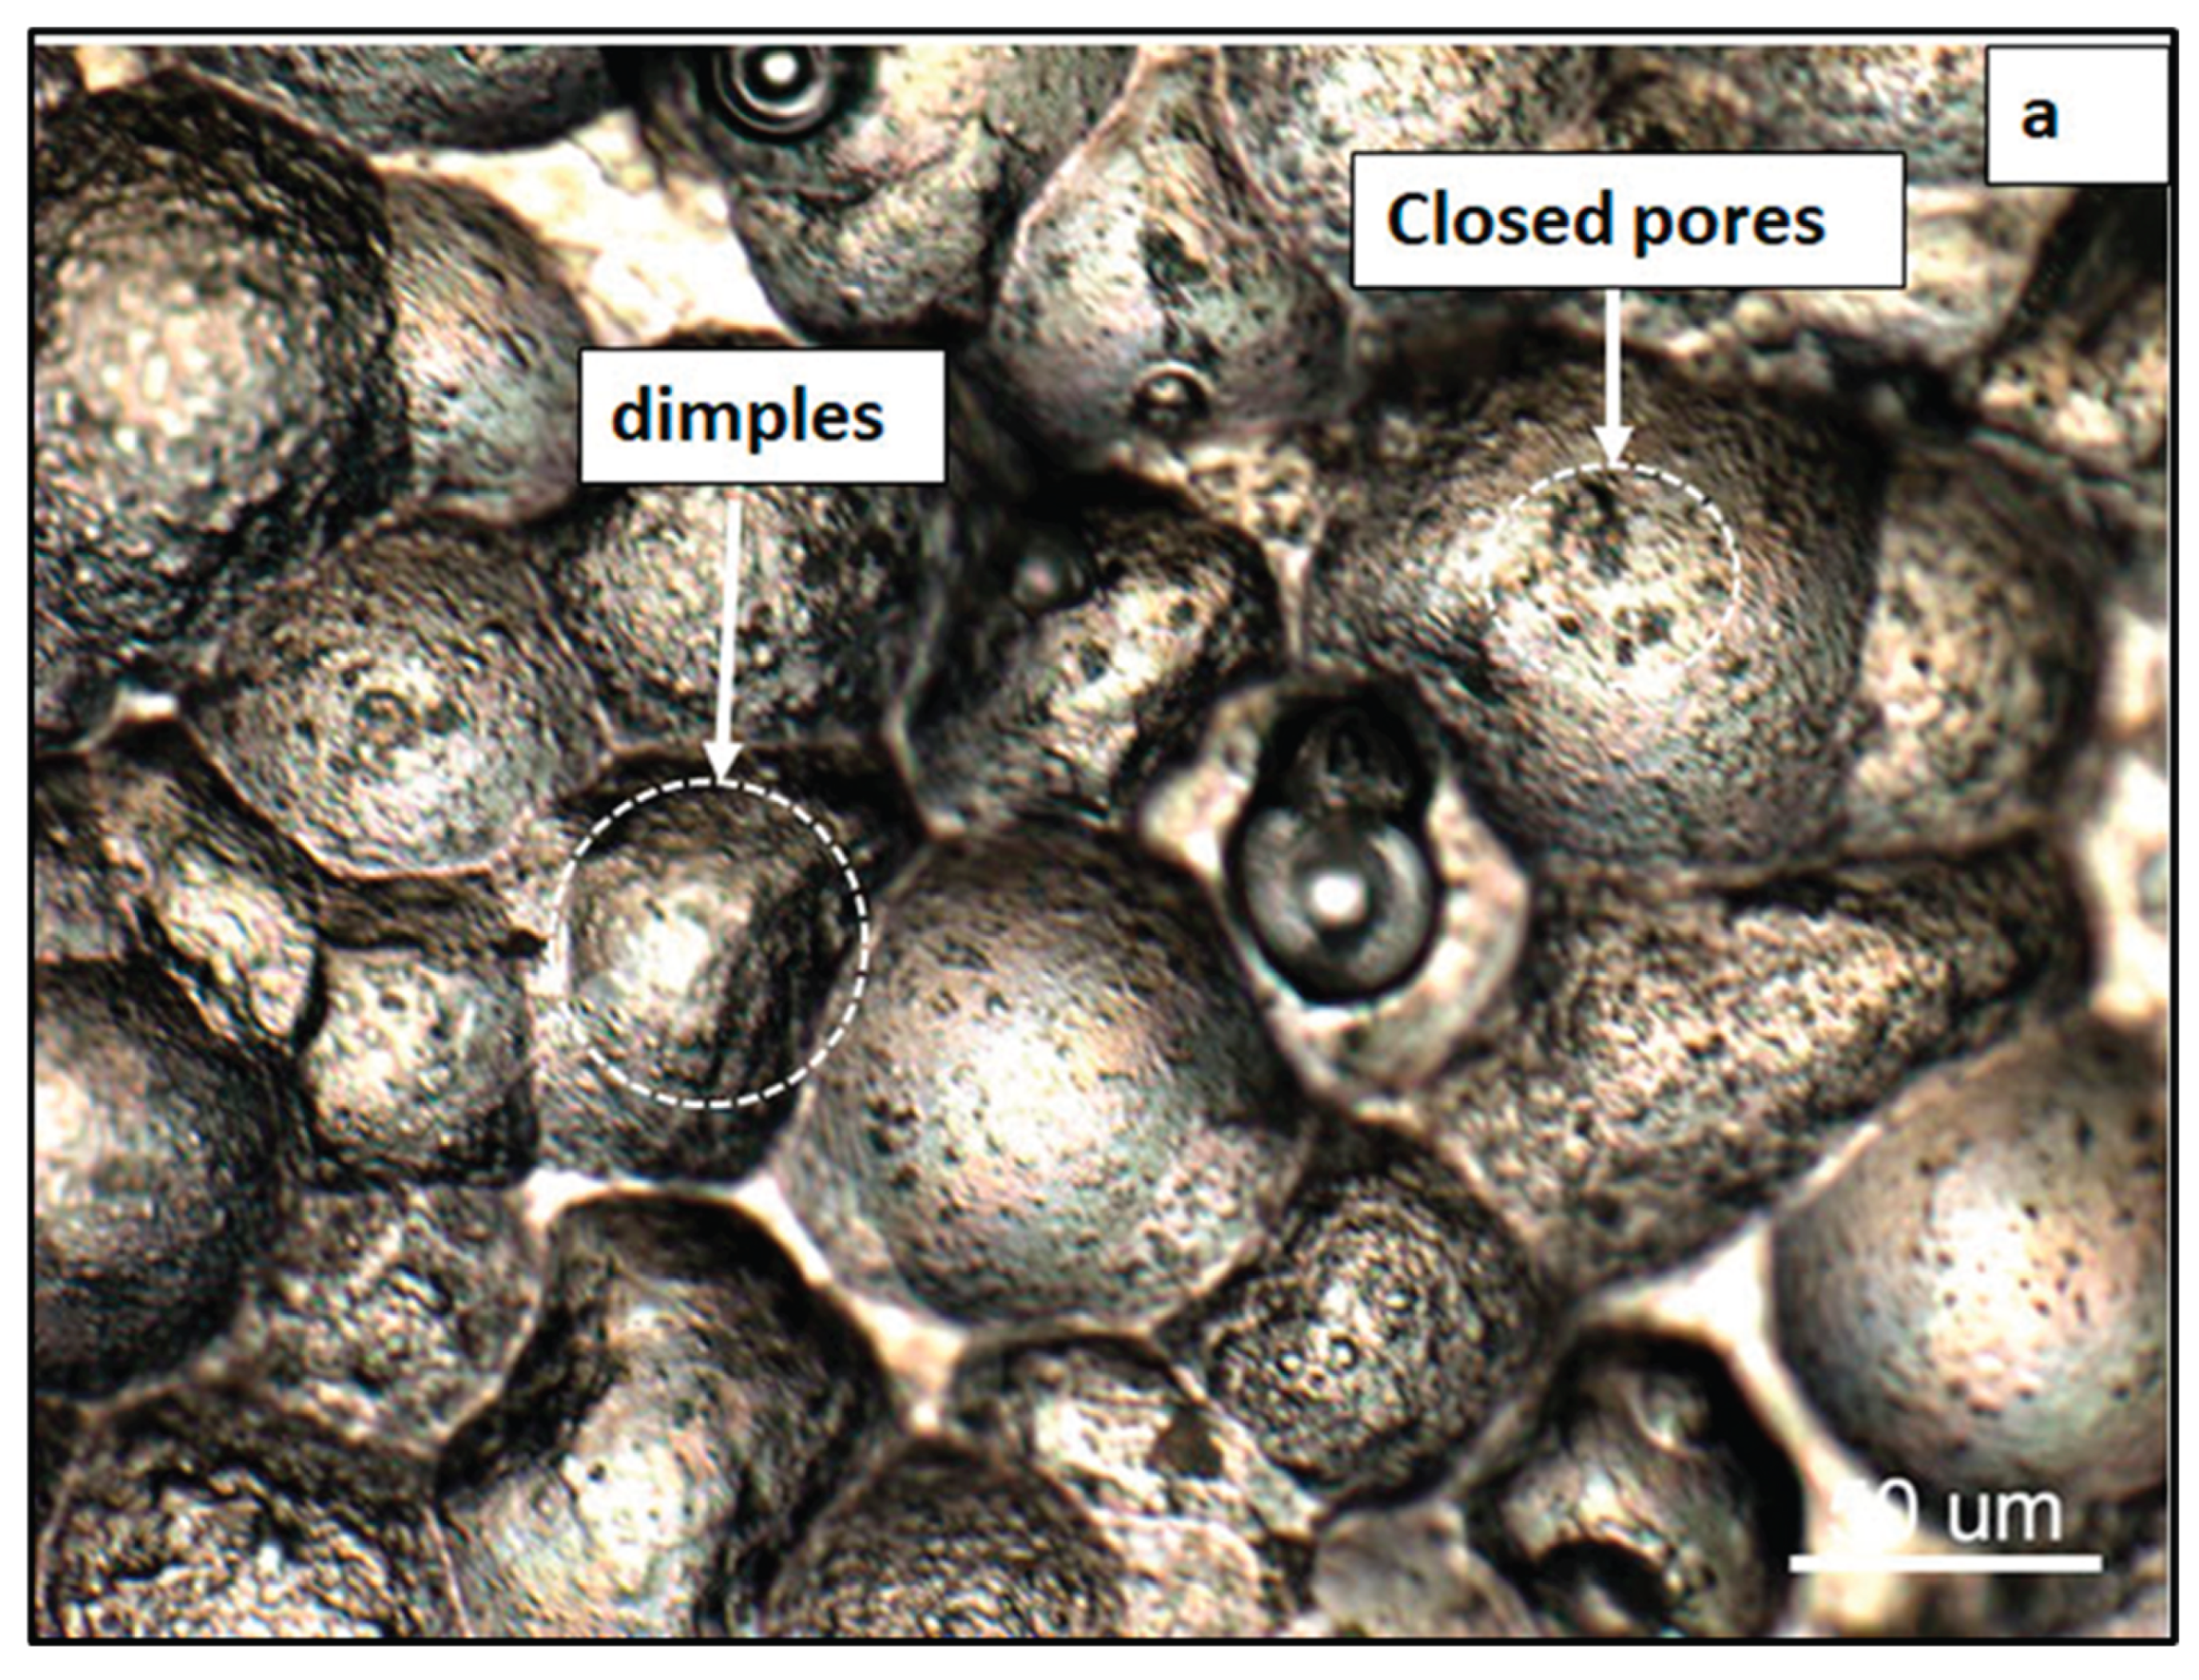
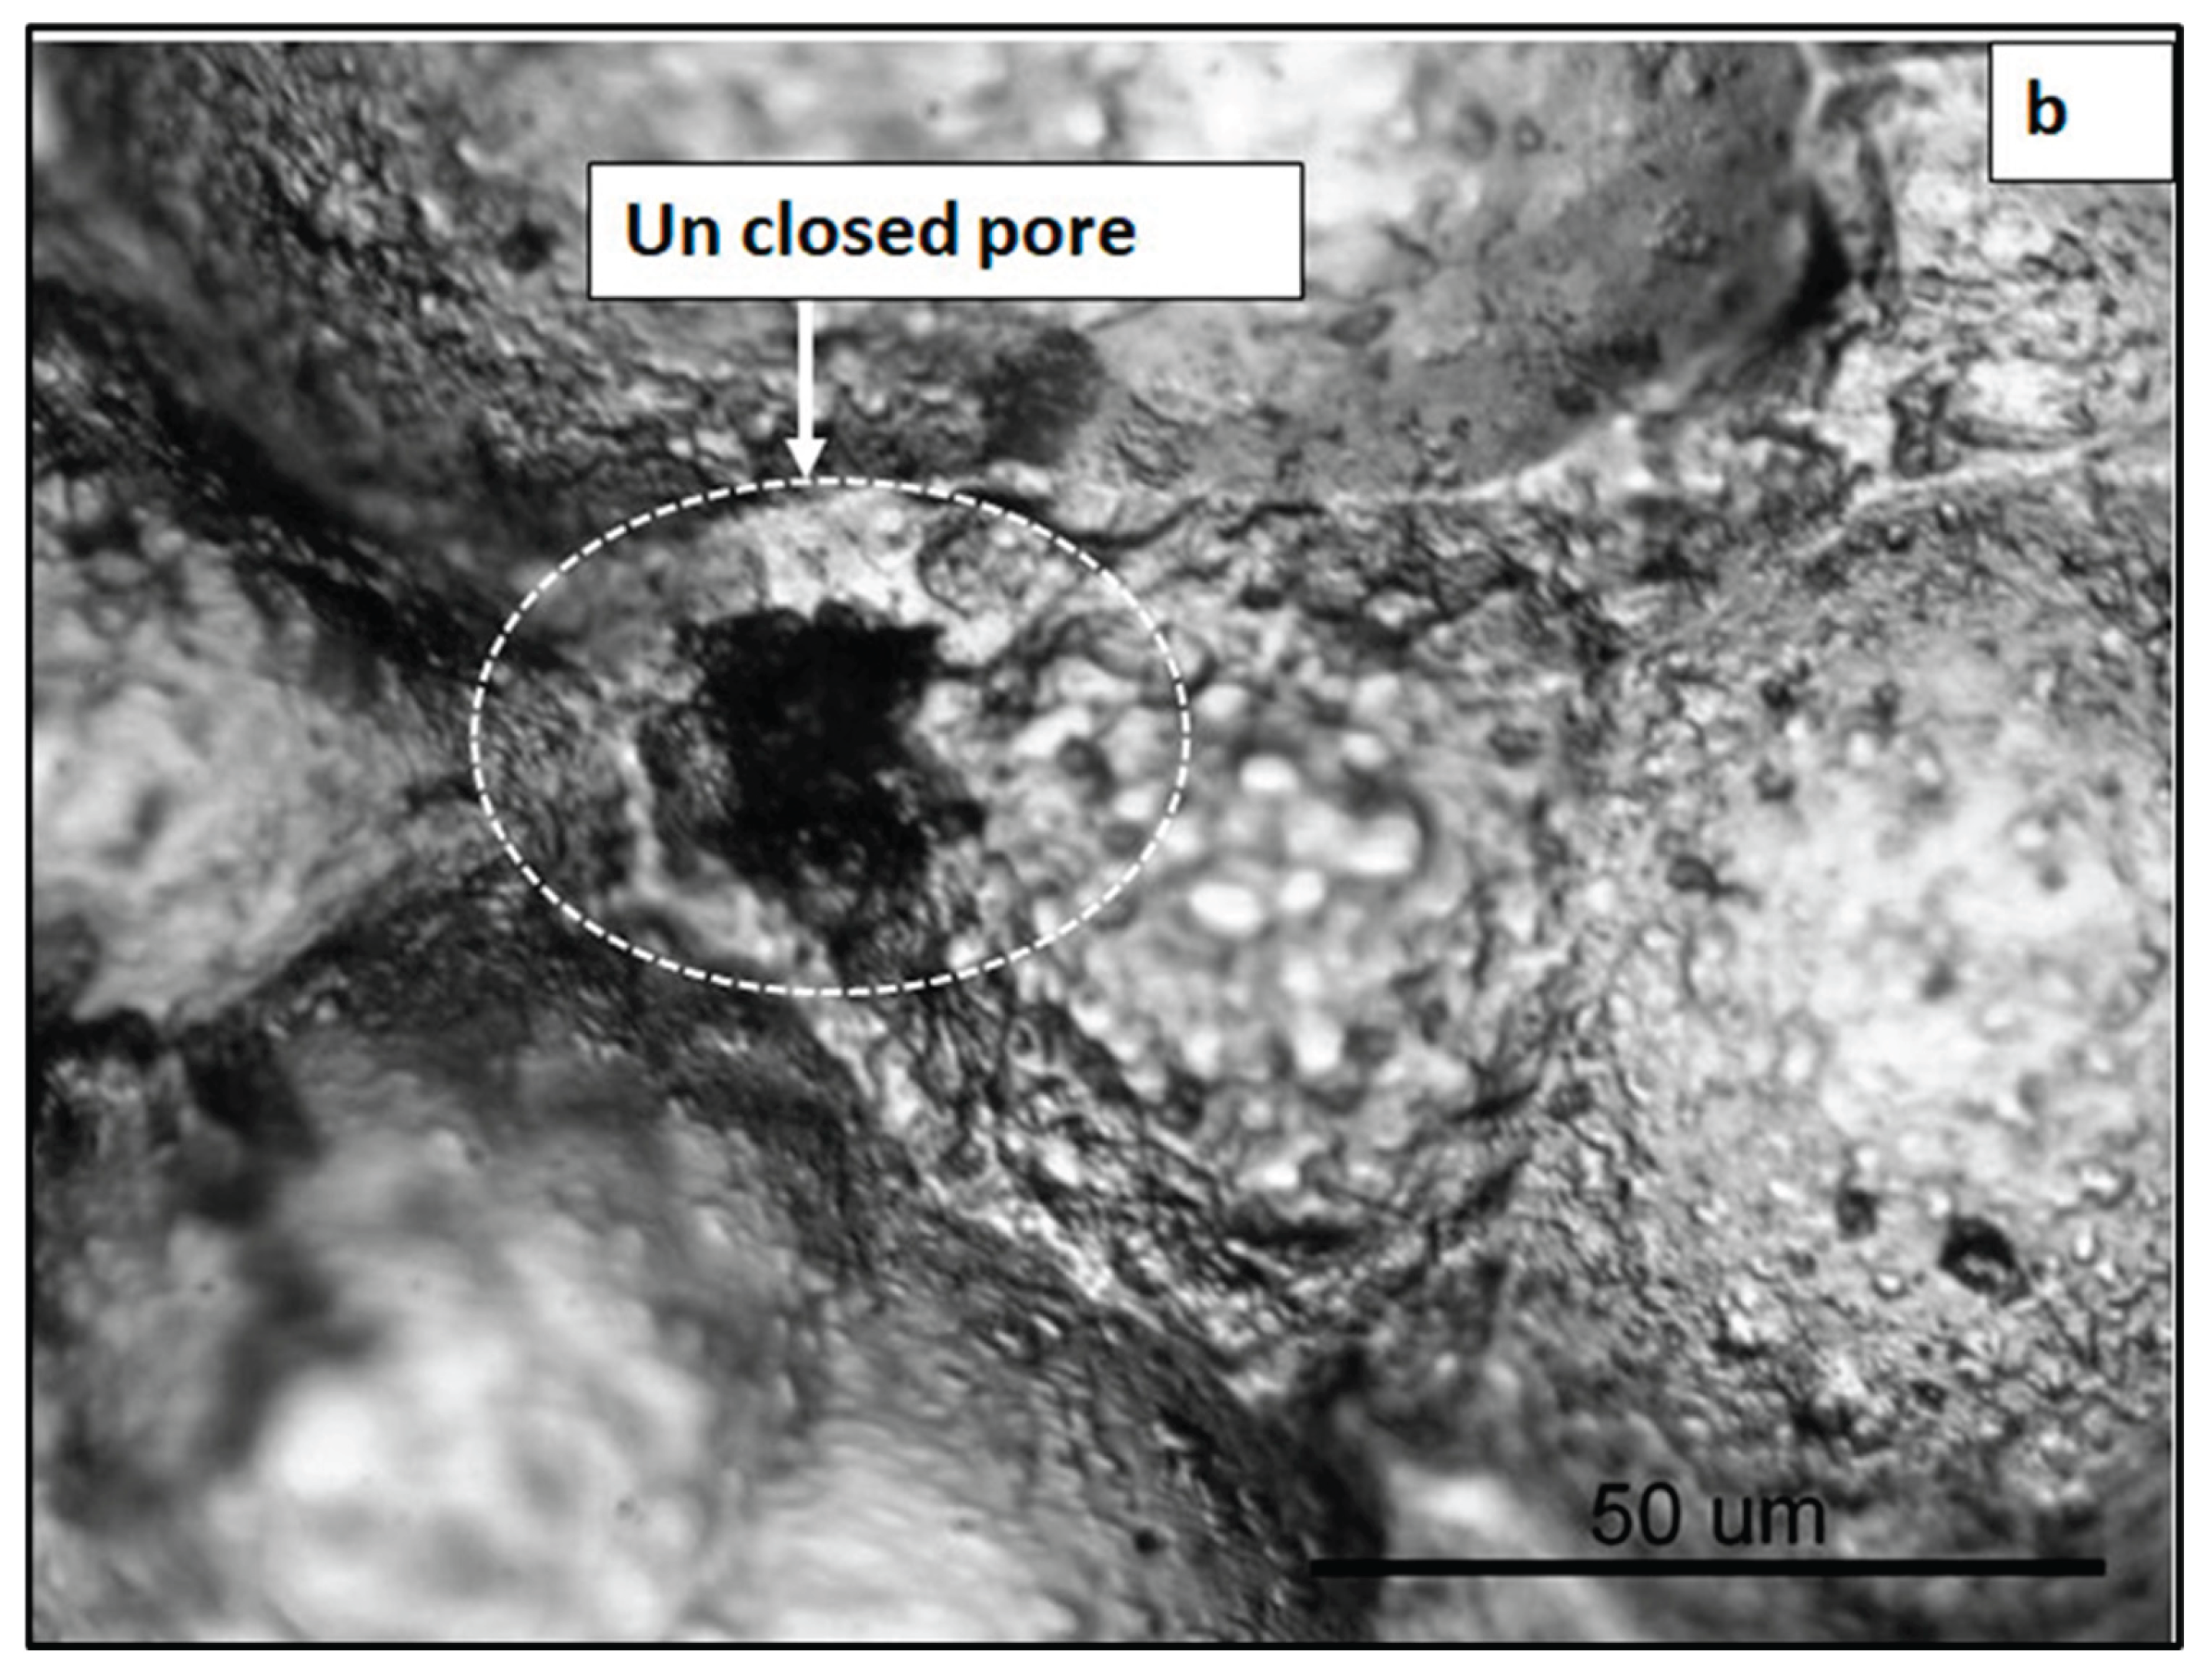
Figure 8.
SEM micrograph of Alumix 321 PM alloy: (a) low magnification shows dimple structure; (b) high magnification shows sealing of possible pores.
Figure 8.
SEM micrograph of Alumix 321 PM alloy: (a) low magnification shows dimple structure; (b) high magnification shows sealing of possible pores.


Figure 9.
OCP variation as a function of time of Alumix 321 PM alloy before (A), and after shot peening (B).
Figure 9.
OCP variation as a function of time of Alumix 321 PM alloy before (A), and after shot peening (B).
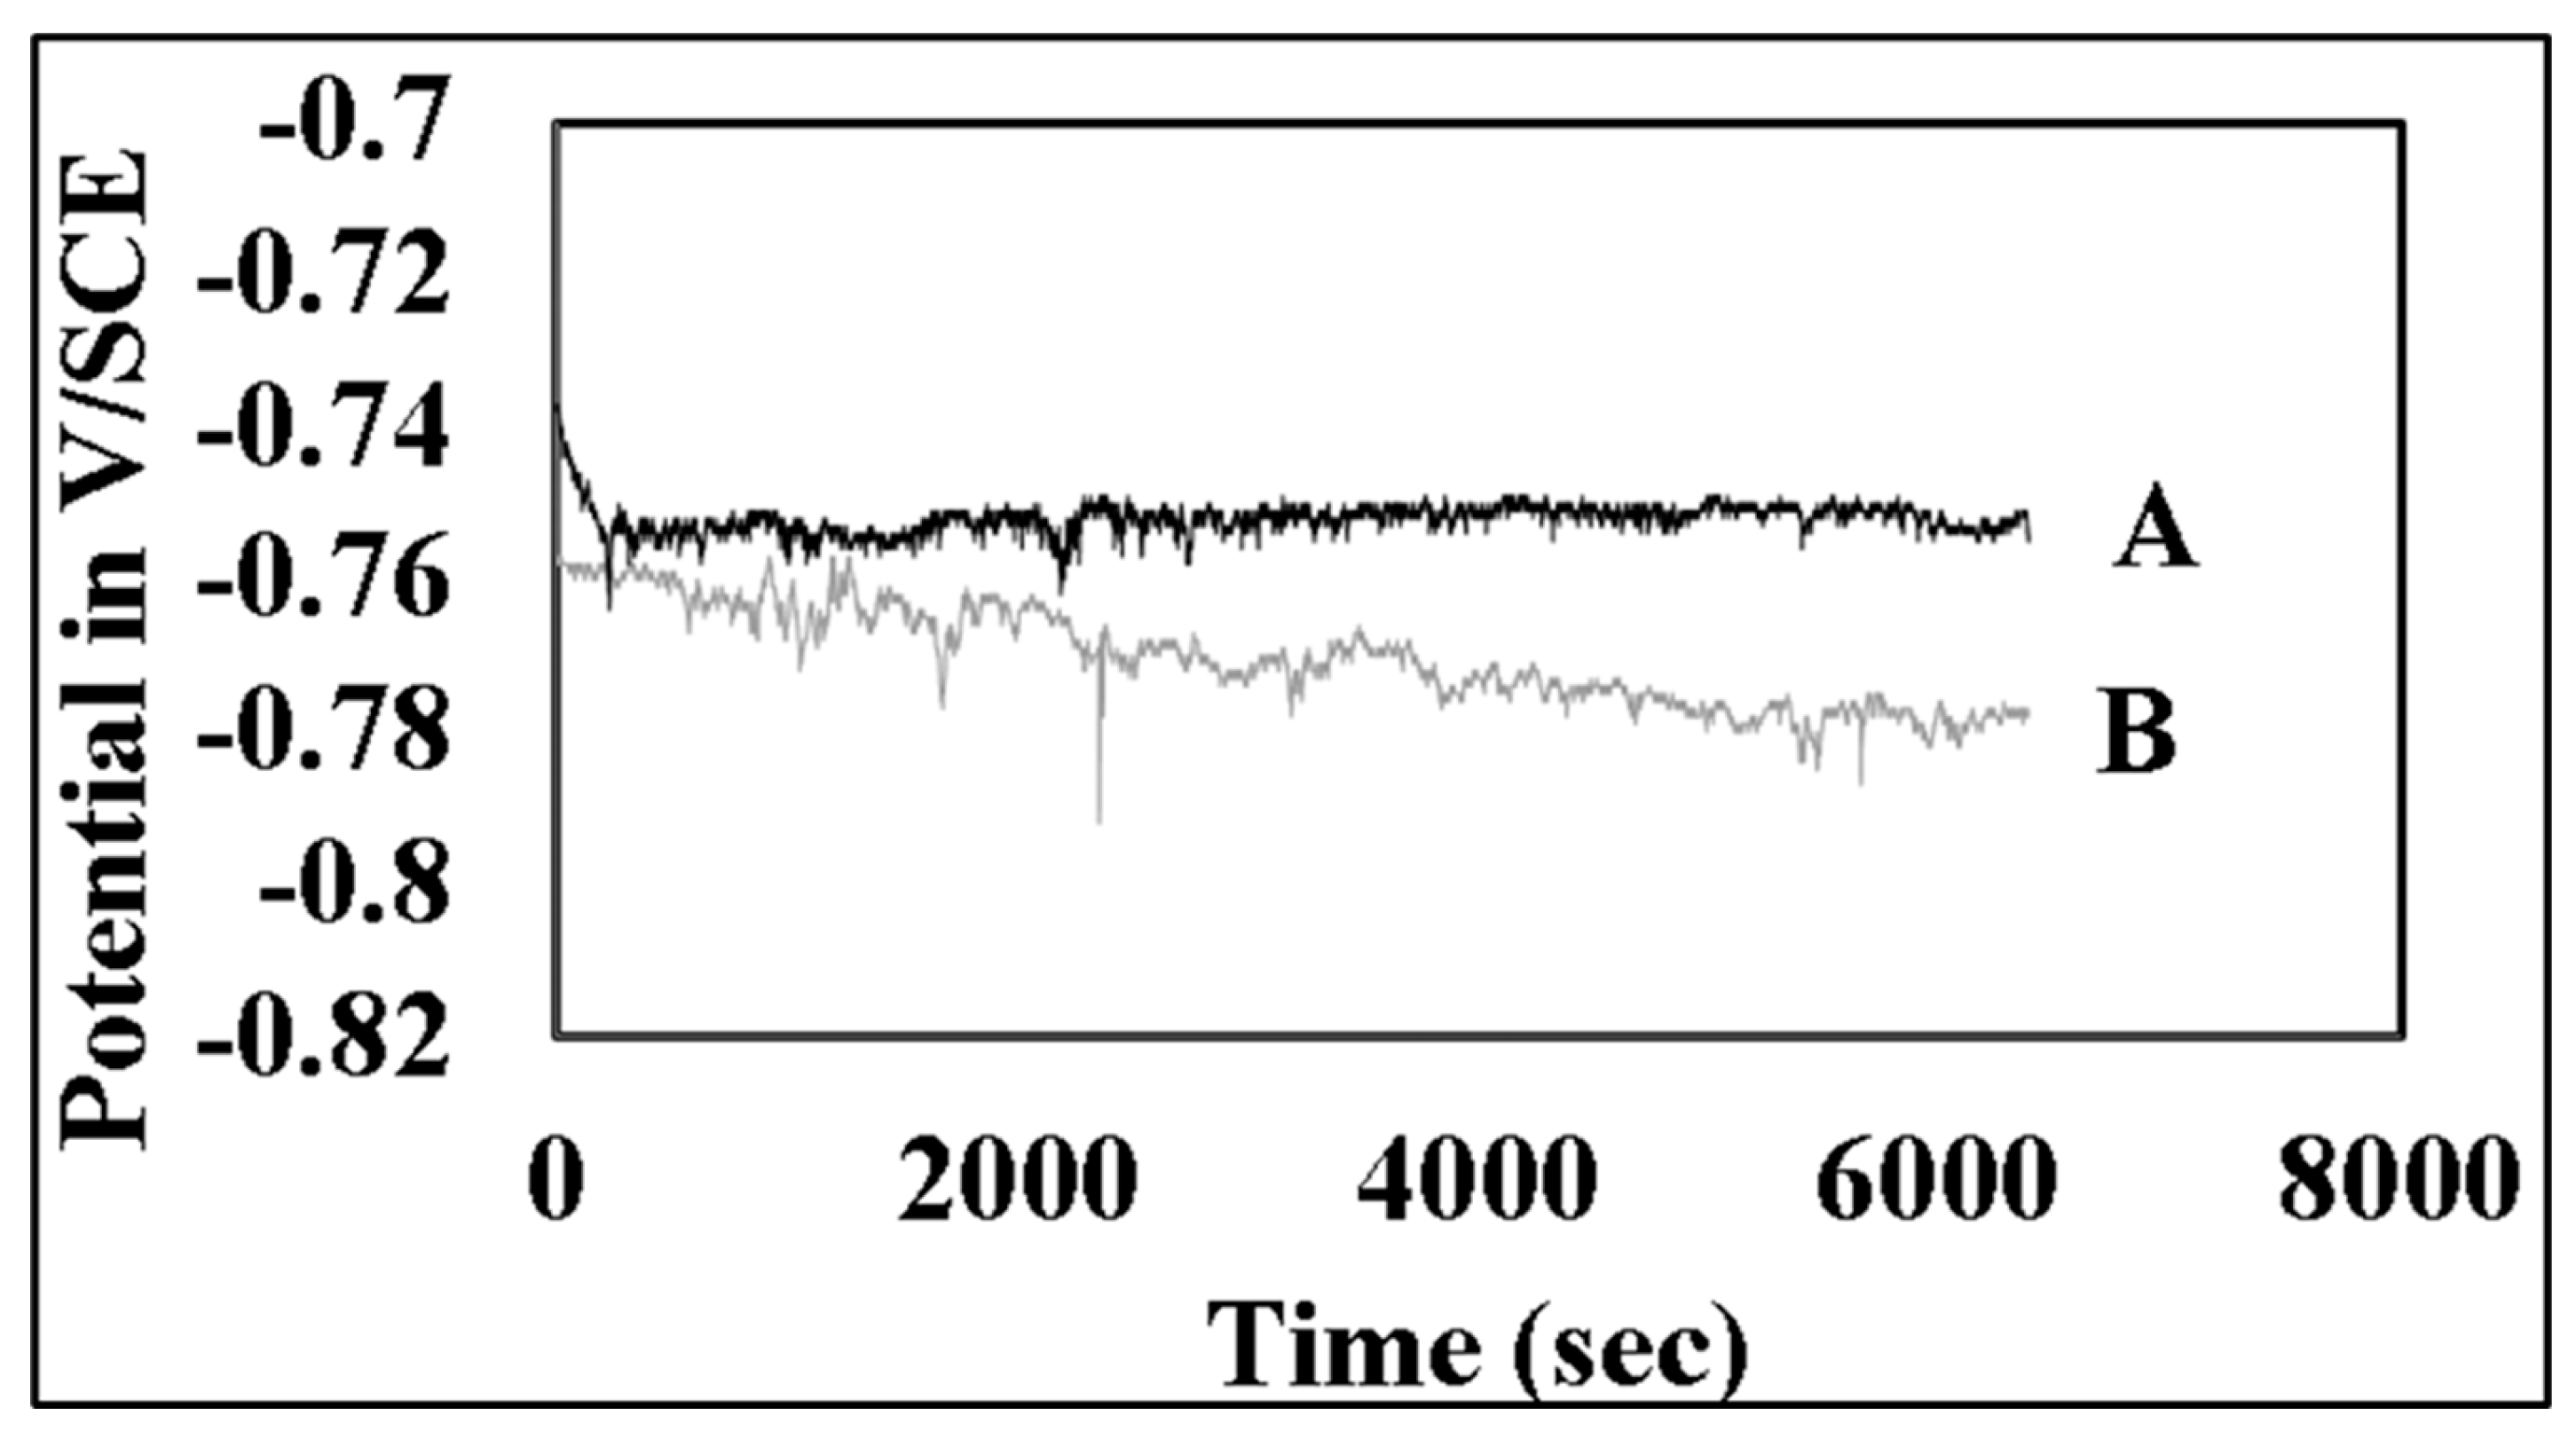
Figure 10.
Figure 6. Tafel extrapolation plot of Alumix 321 PM alloy before and after shot peening.
Figure 10.
Figure 6. Tafel extrapolation plot of Alumix 321 PM alloy before and after shot peening.
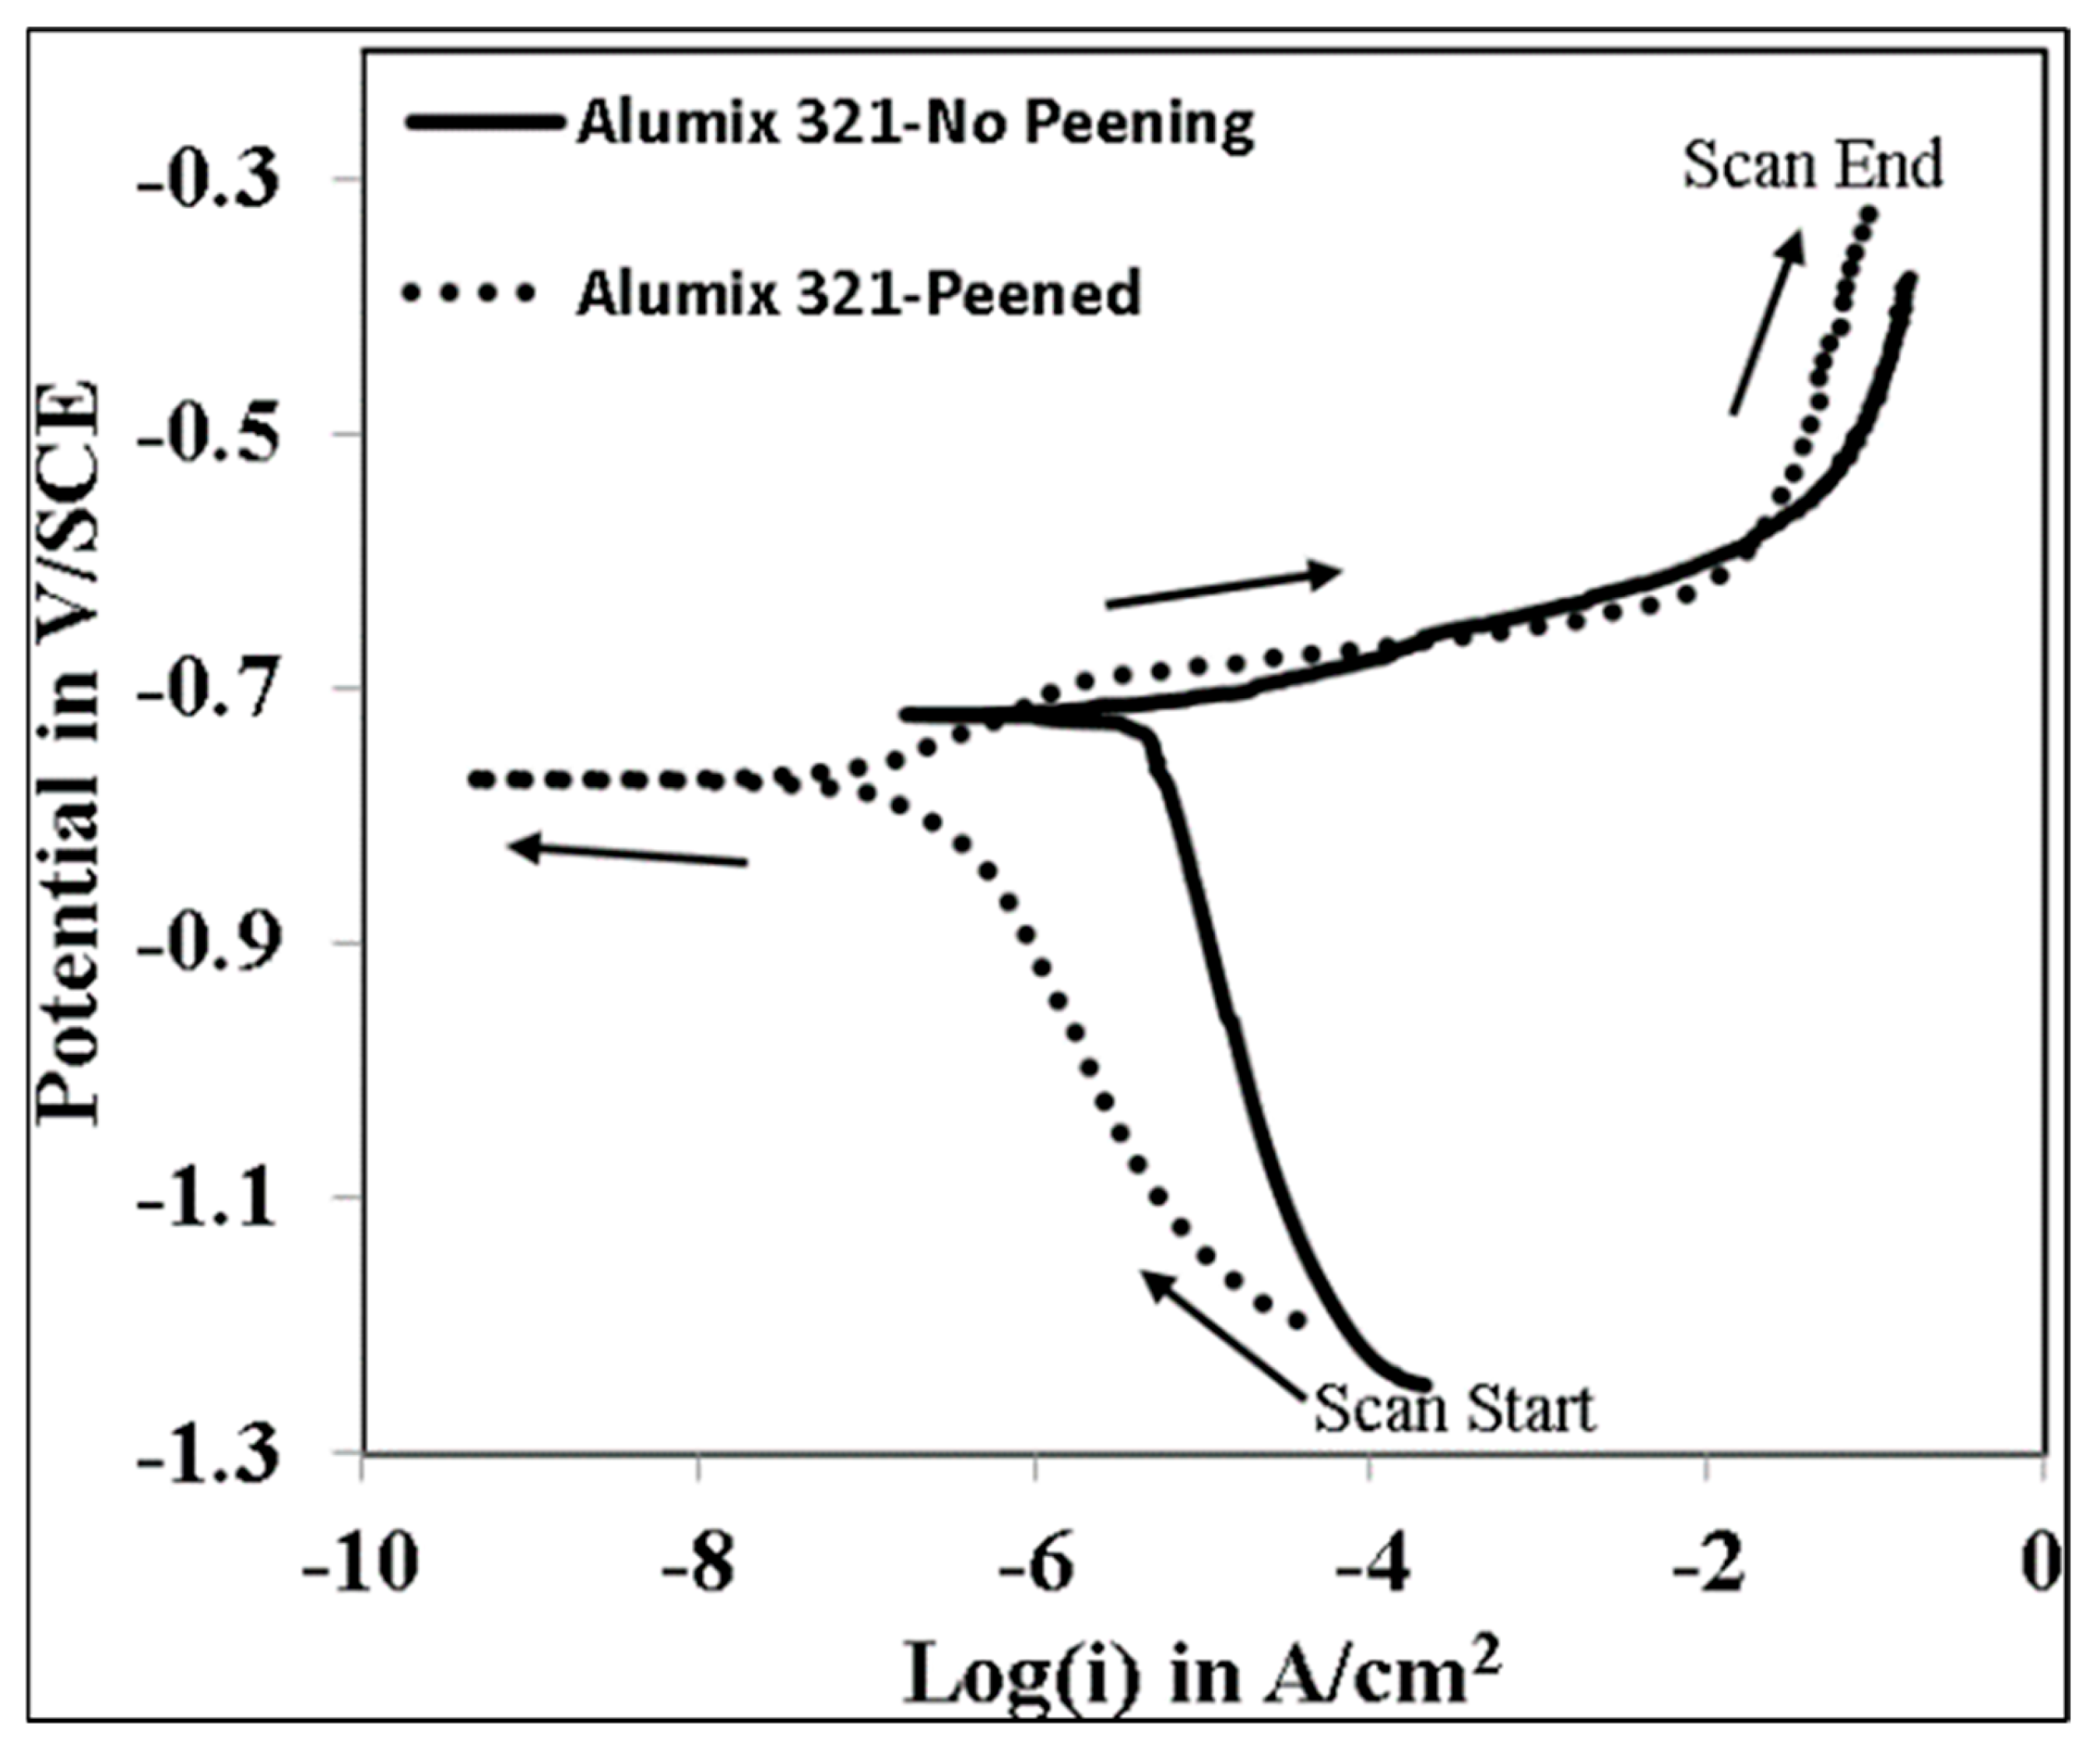
Figure 11.
Comparison of the corrosion current of sintered unpeened Alumix 321, peened Alumix 321, and wrought AA6061.
Figure 11.
Comparison of the corrosion current of sintered unpeened Alumix 321, peened Alumix 321, and wrought AA6061.
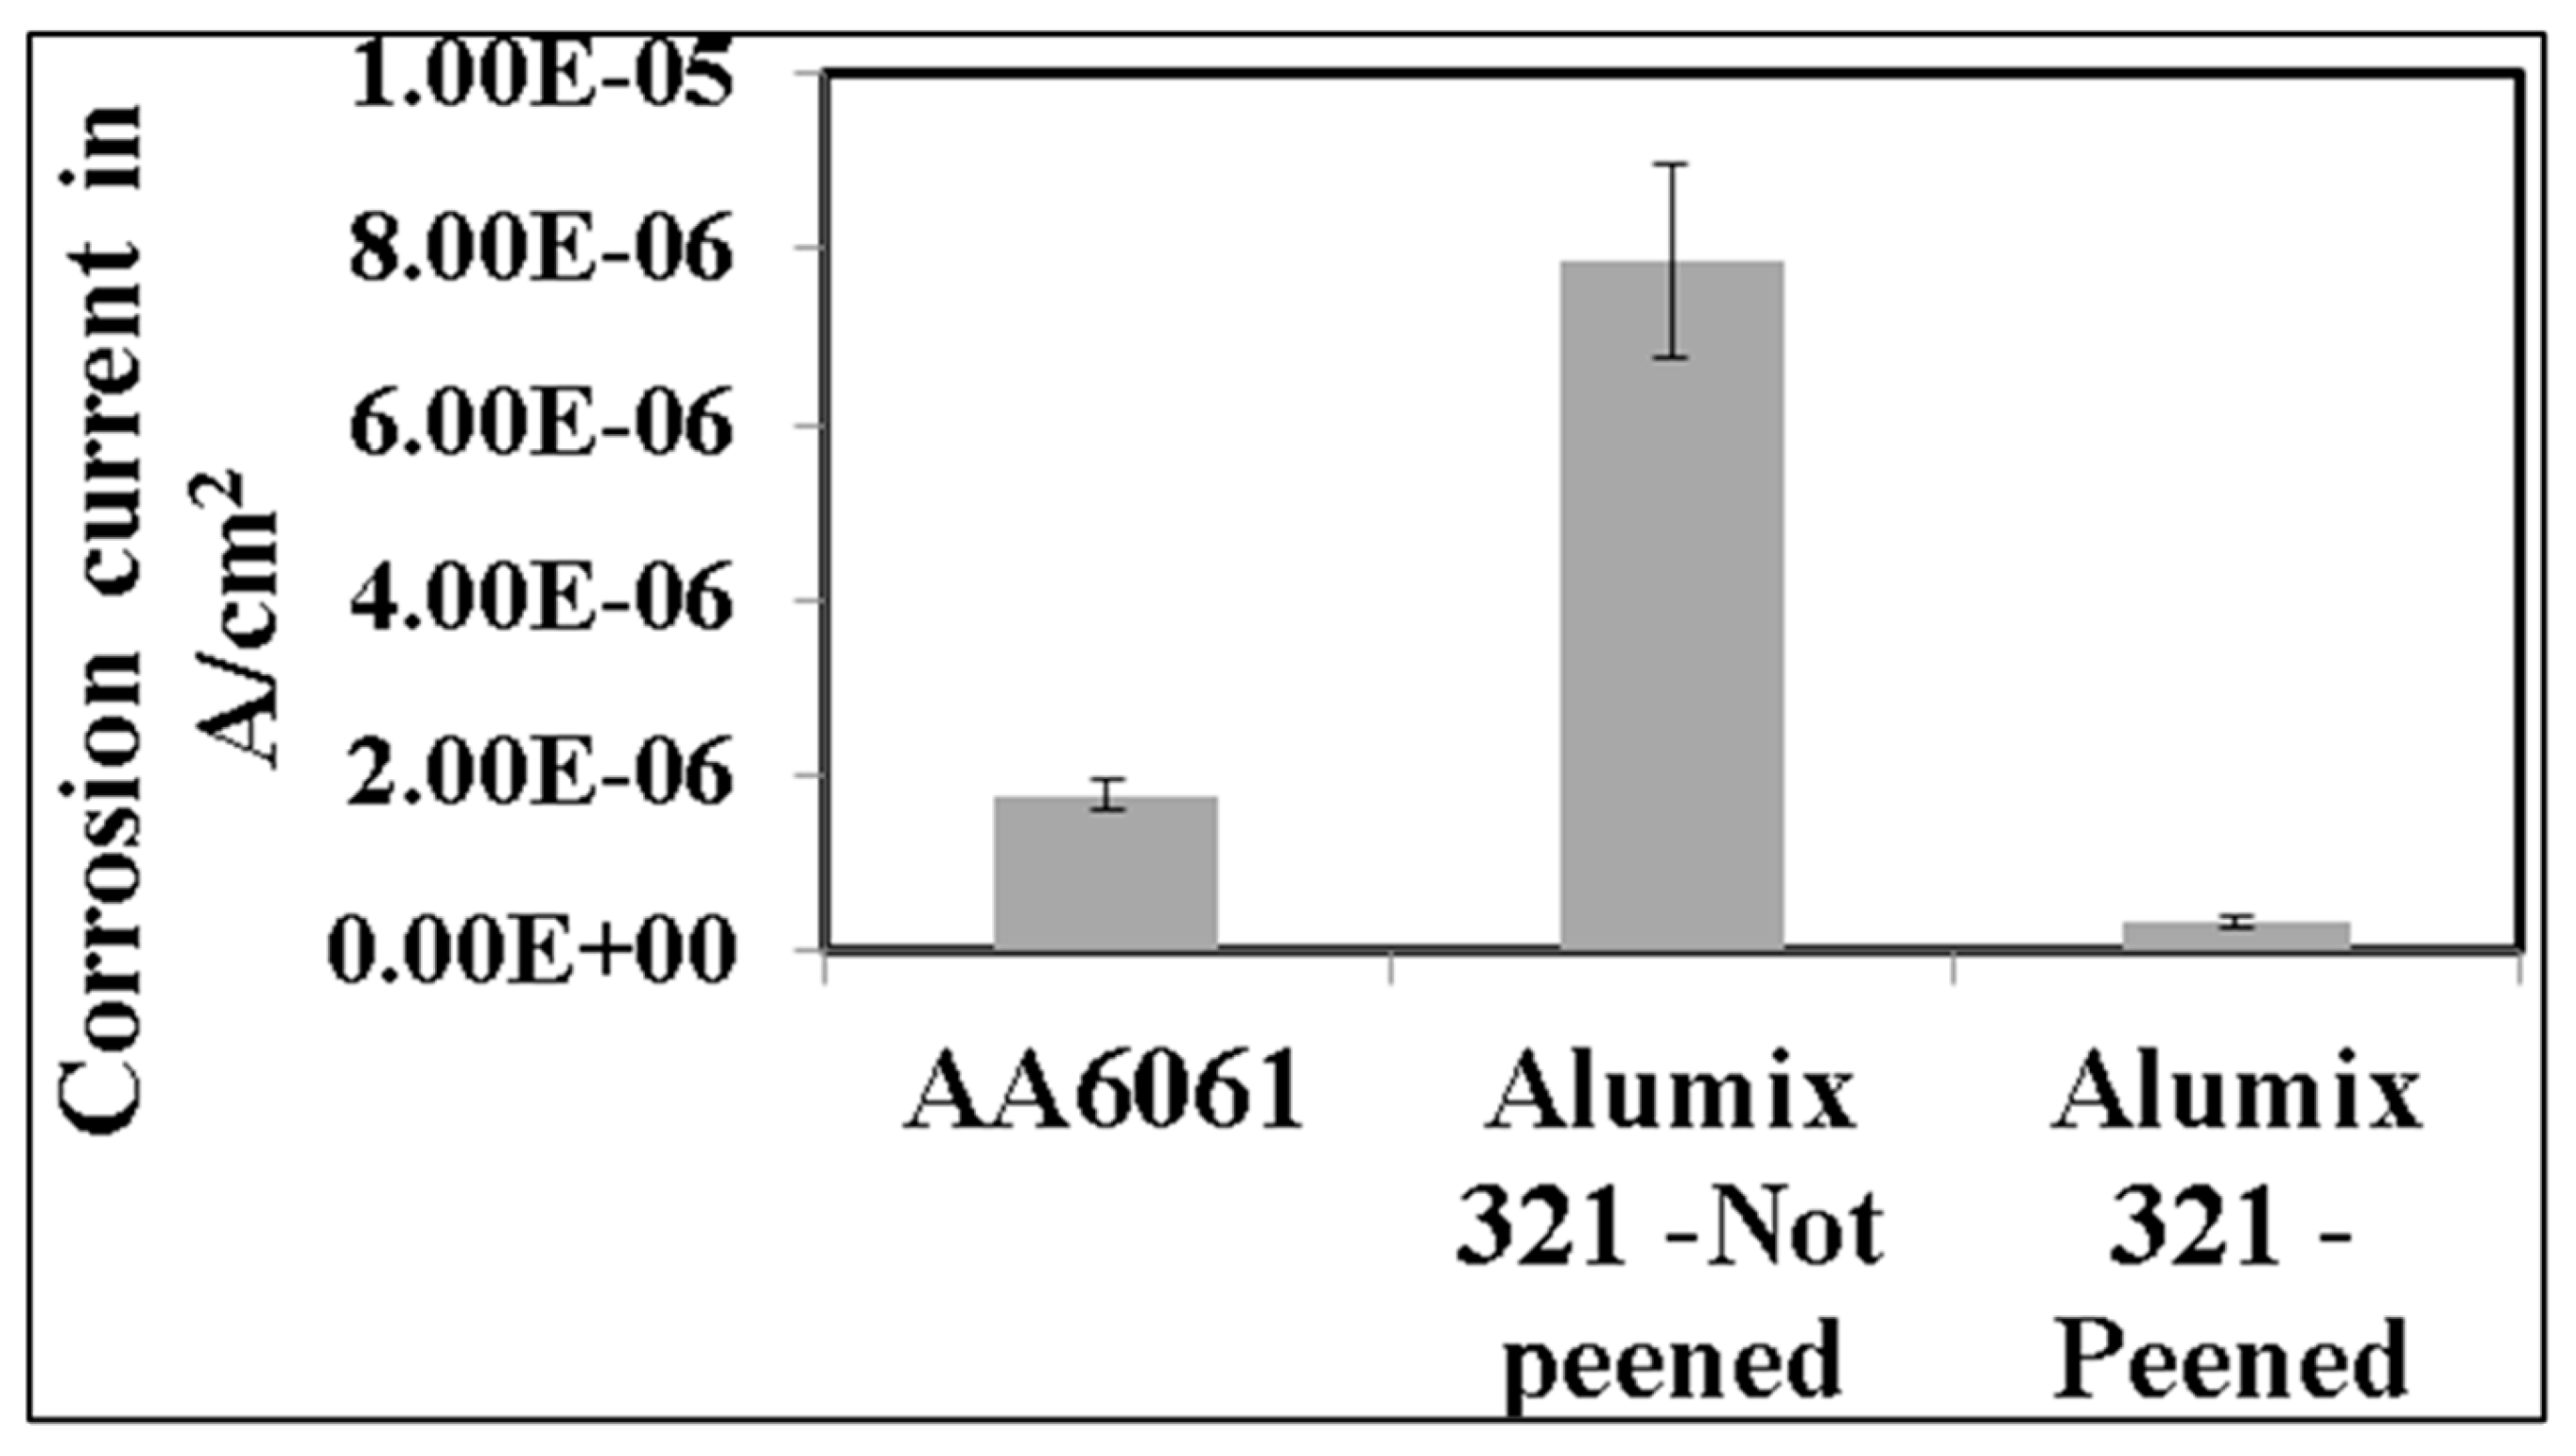
Figure 12.
Cyclic polarization plot of peened and unpeened Alumix 321 PM alloy in 3.5 wt% NaCl solution.
Figure 12.
Cyclic polarization plot of peened and unpeened Alumix 321 PM alloy in 3.5 wt% NaCl solution.
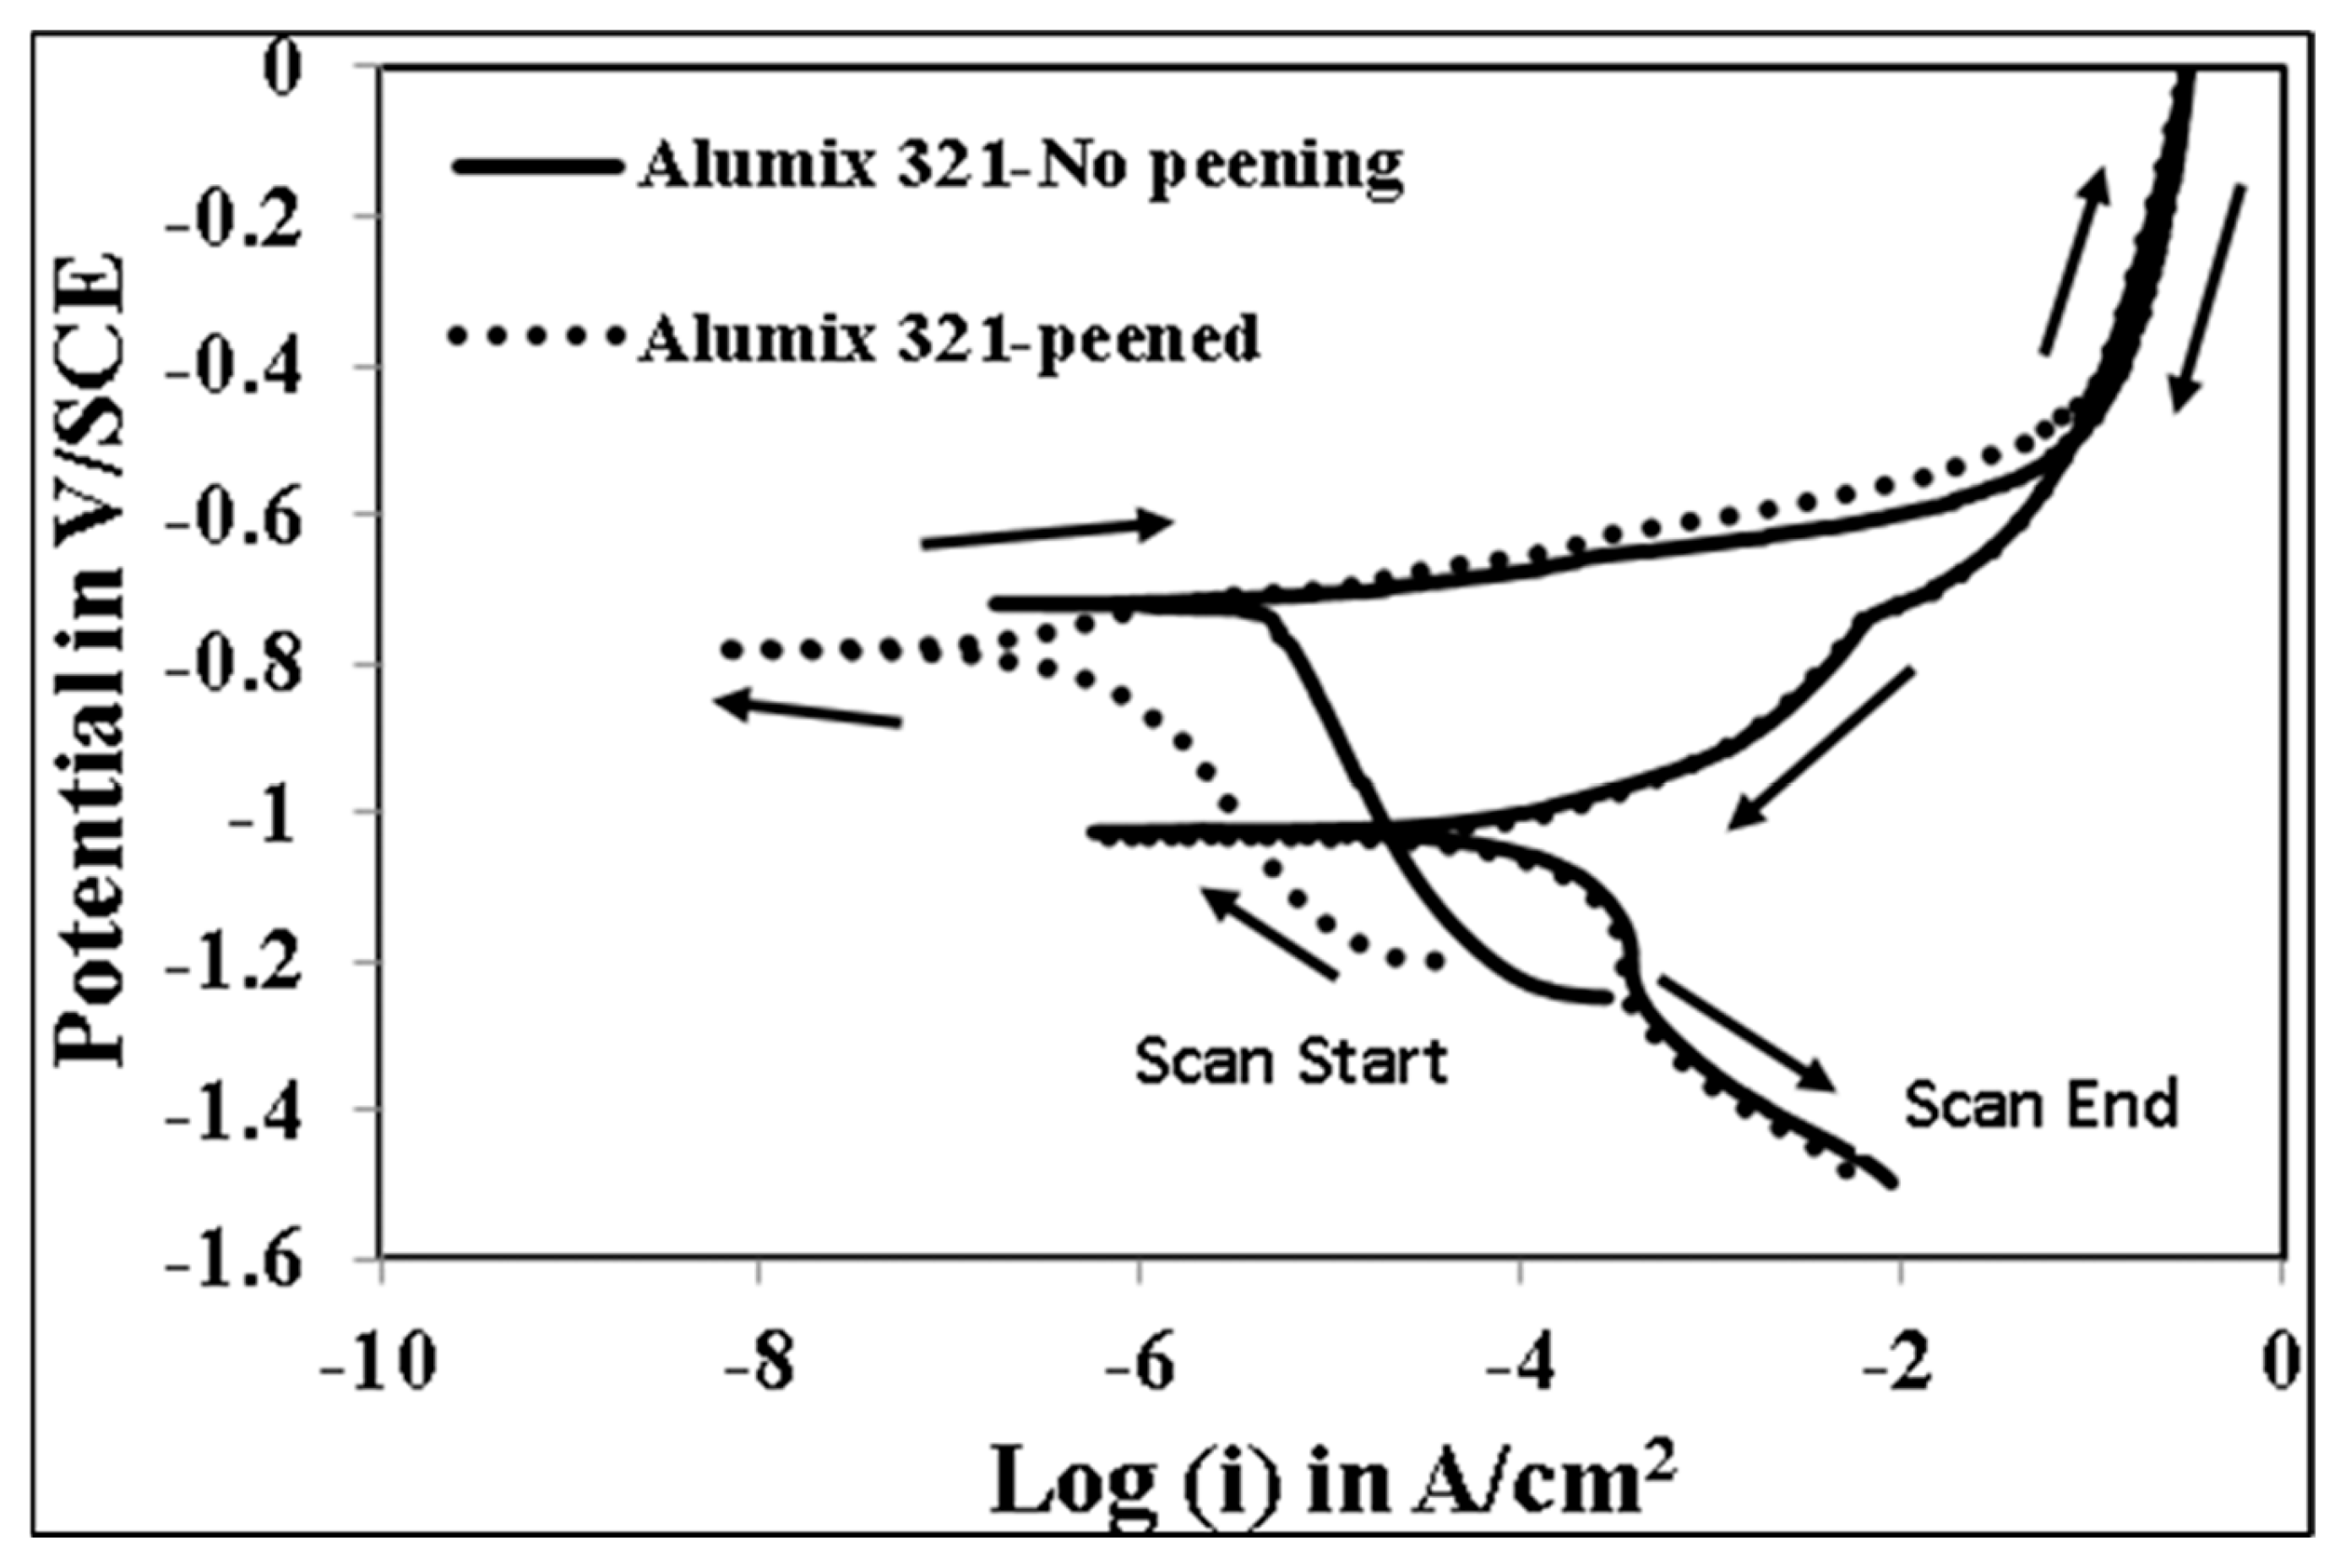
Figure 13.
Stair step polarization plot of peened and unpeened Alumix 321 PM alloy in 3.5 wt% NaCl solution.
Figure 13.
Stair step polarization plot of peened and unpeened Alumix 321 PM alloy in 3.5 wt% NaCl solution.
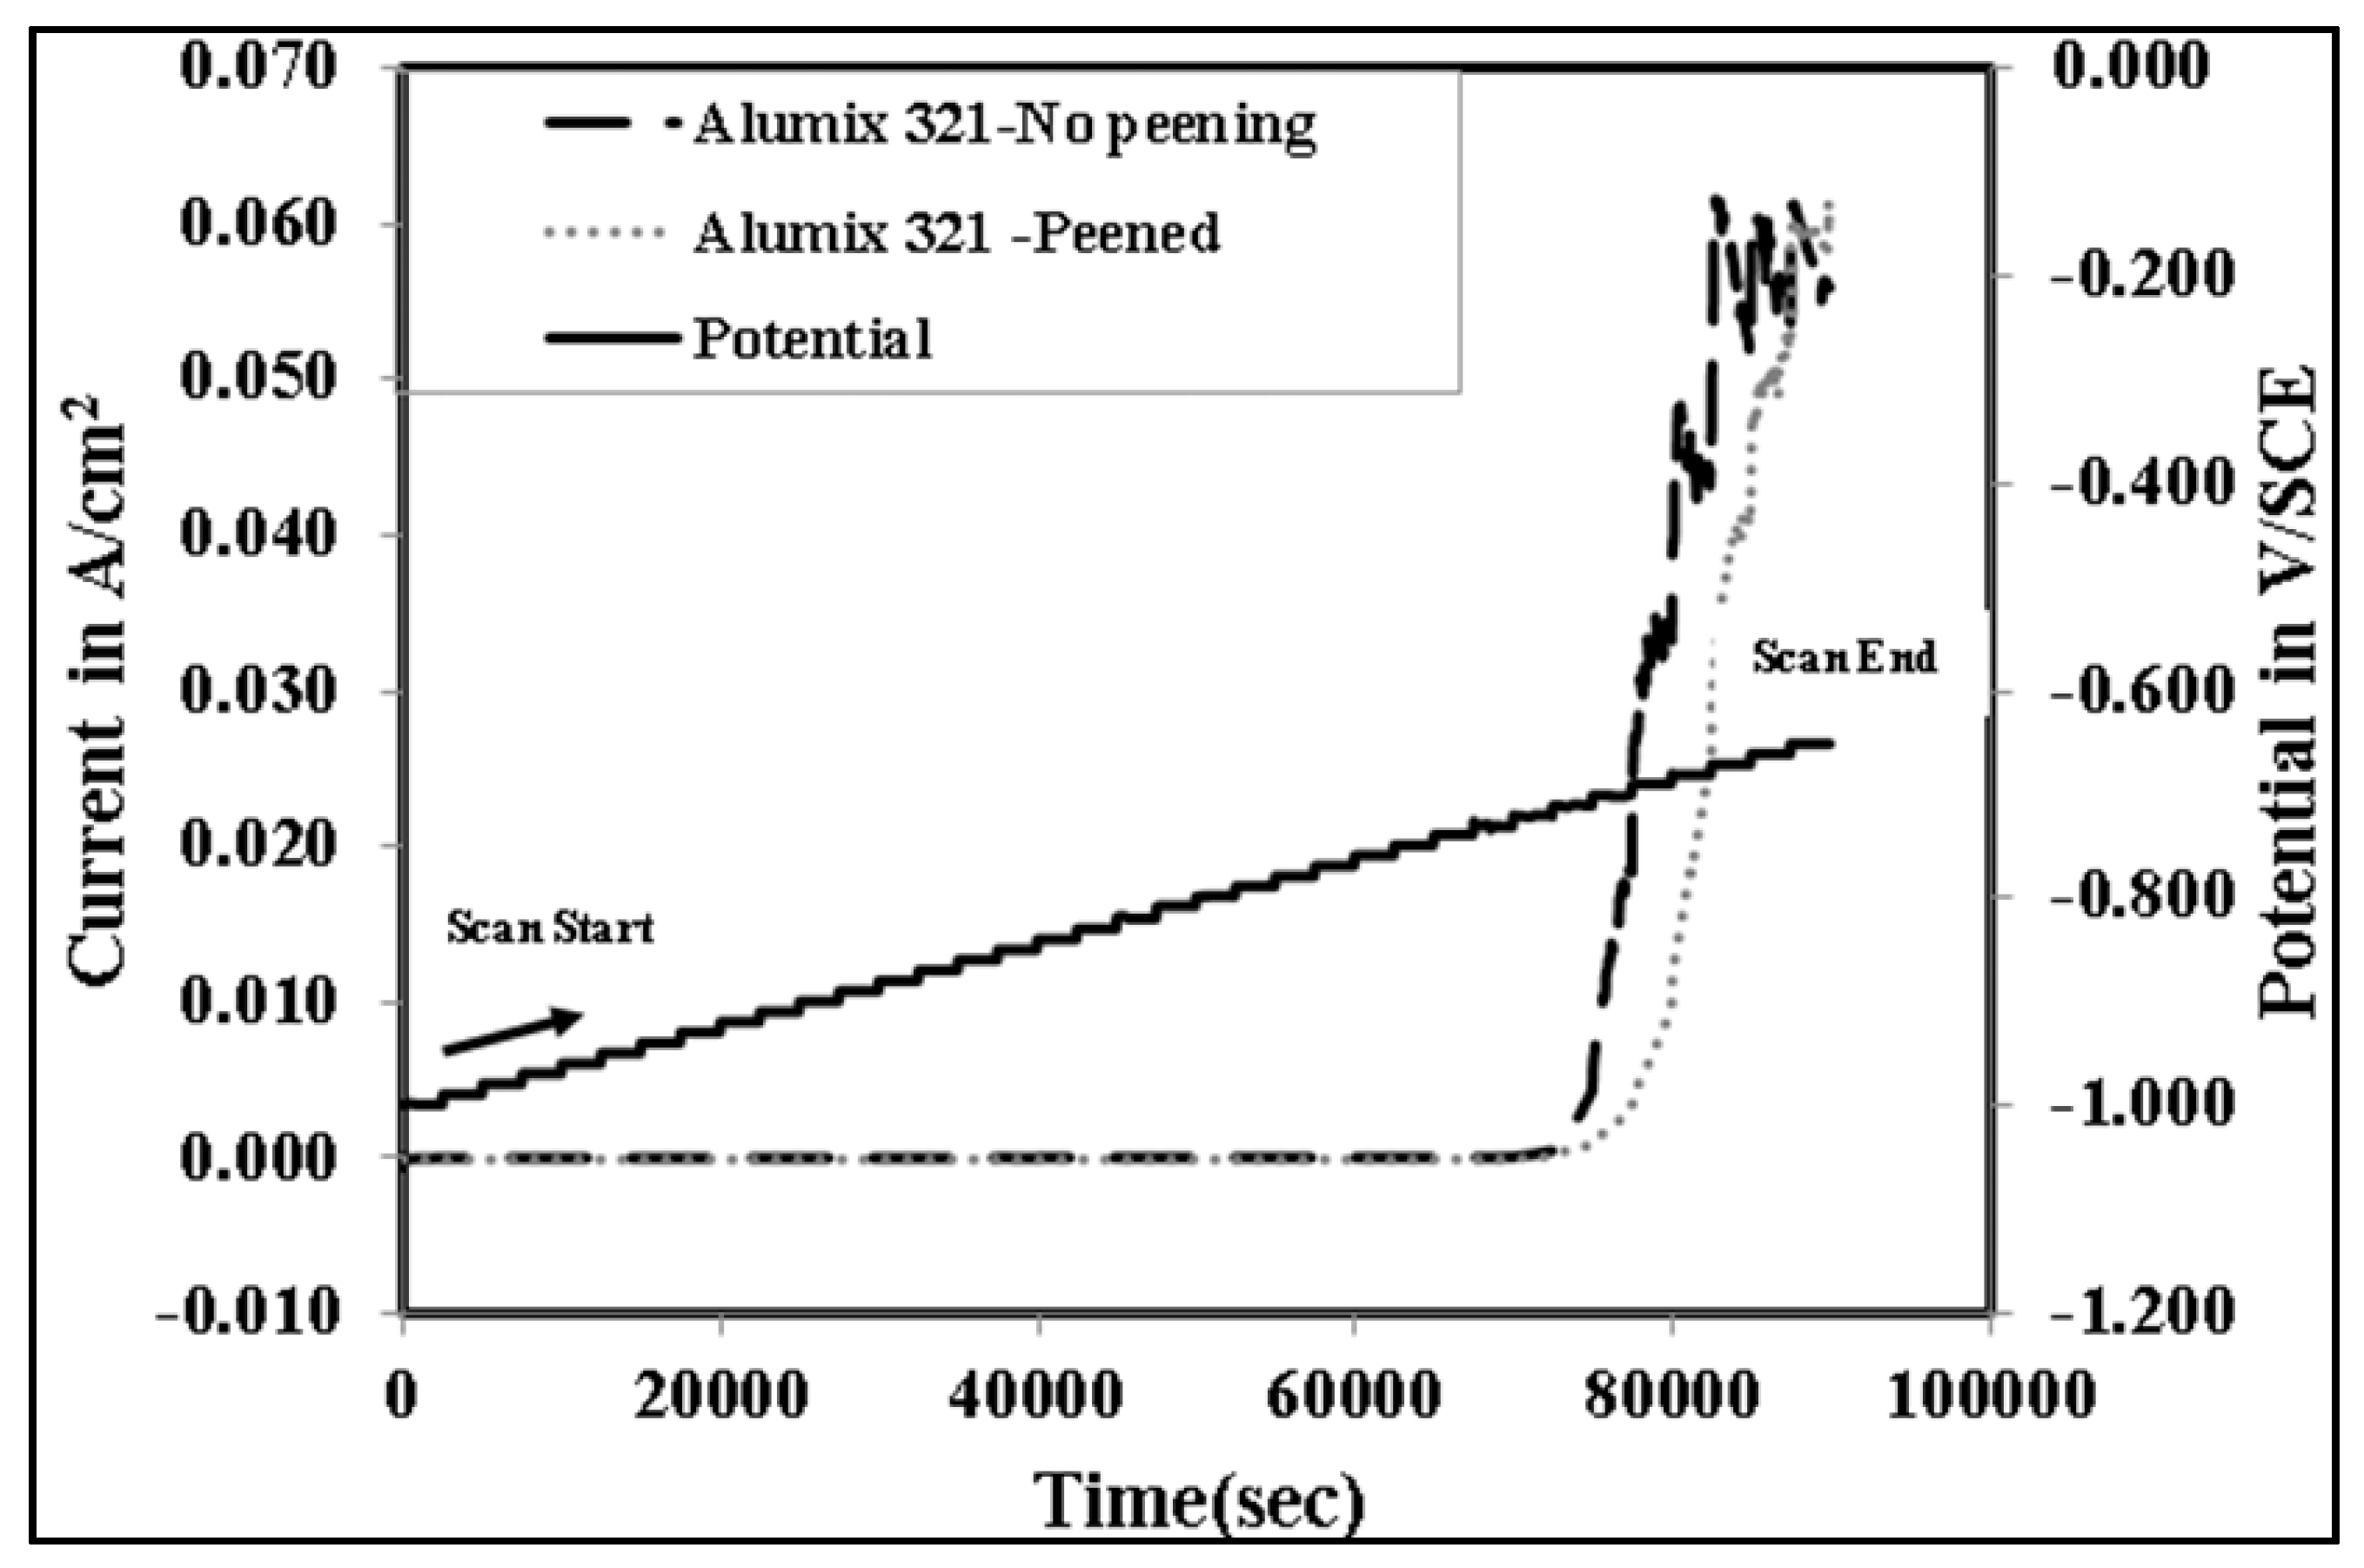
Figure 14.
Nyquis plot for Alumix 321 PM un peened, and shot peened Alumix 321 PM alloys.

Figure 15.
Optical micrographs of corroded surface of shot peened Alumix 321 PM alloy in 3.5 w% NaCl solution: (a) low magnification shows dimple structure and un deformed islands; (b) high magnification shows intergranular corrosion attack.
Figure 15.
Optical micrographs of corroded surface of shot peened Alumix 321 PM alloy in 3.5 w% NaCl solution: (a) low magnification shows dimple structure and un deformed islands; (b) high magnification shows intergranular corrosion attack.
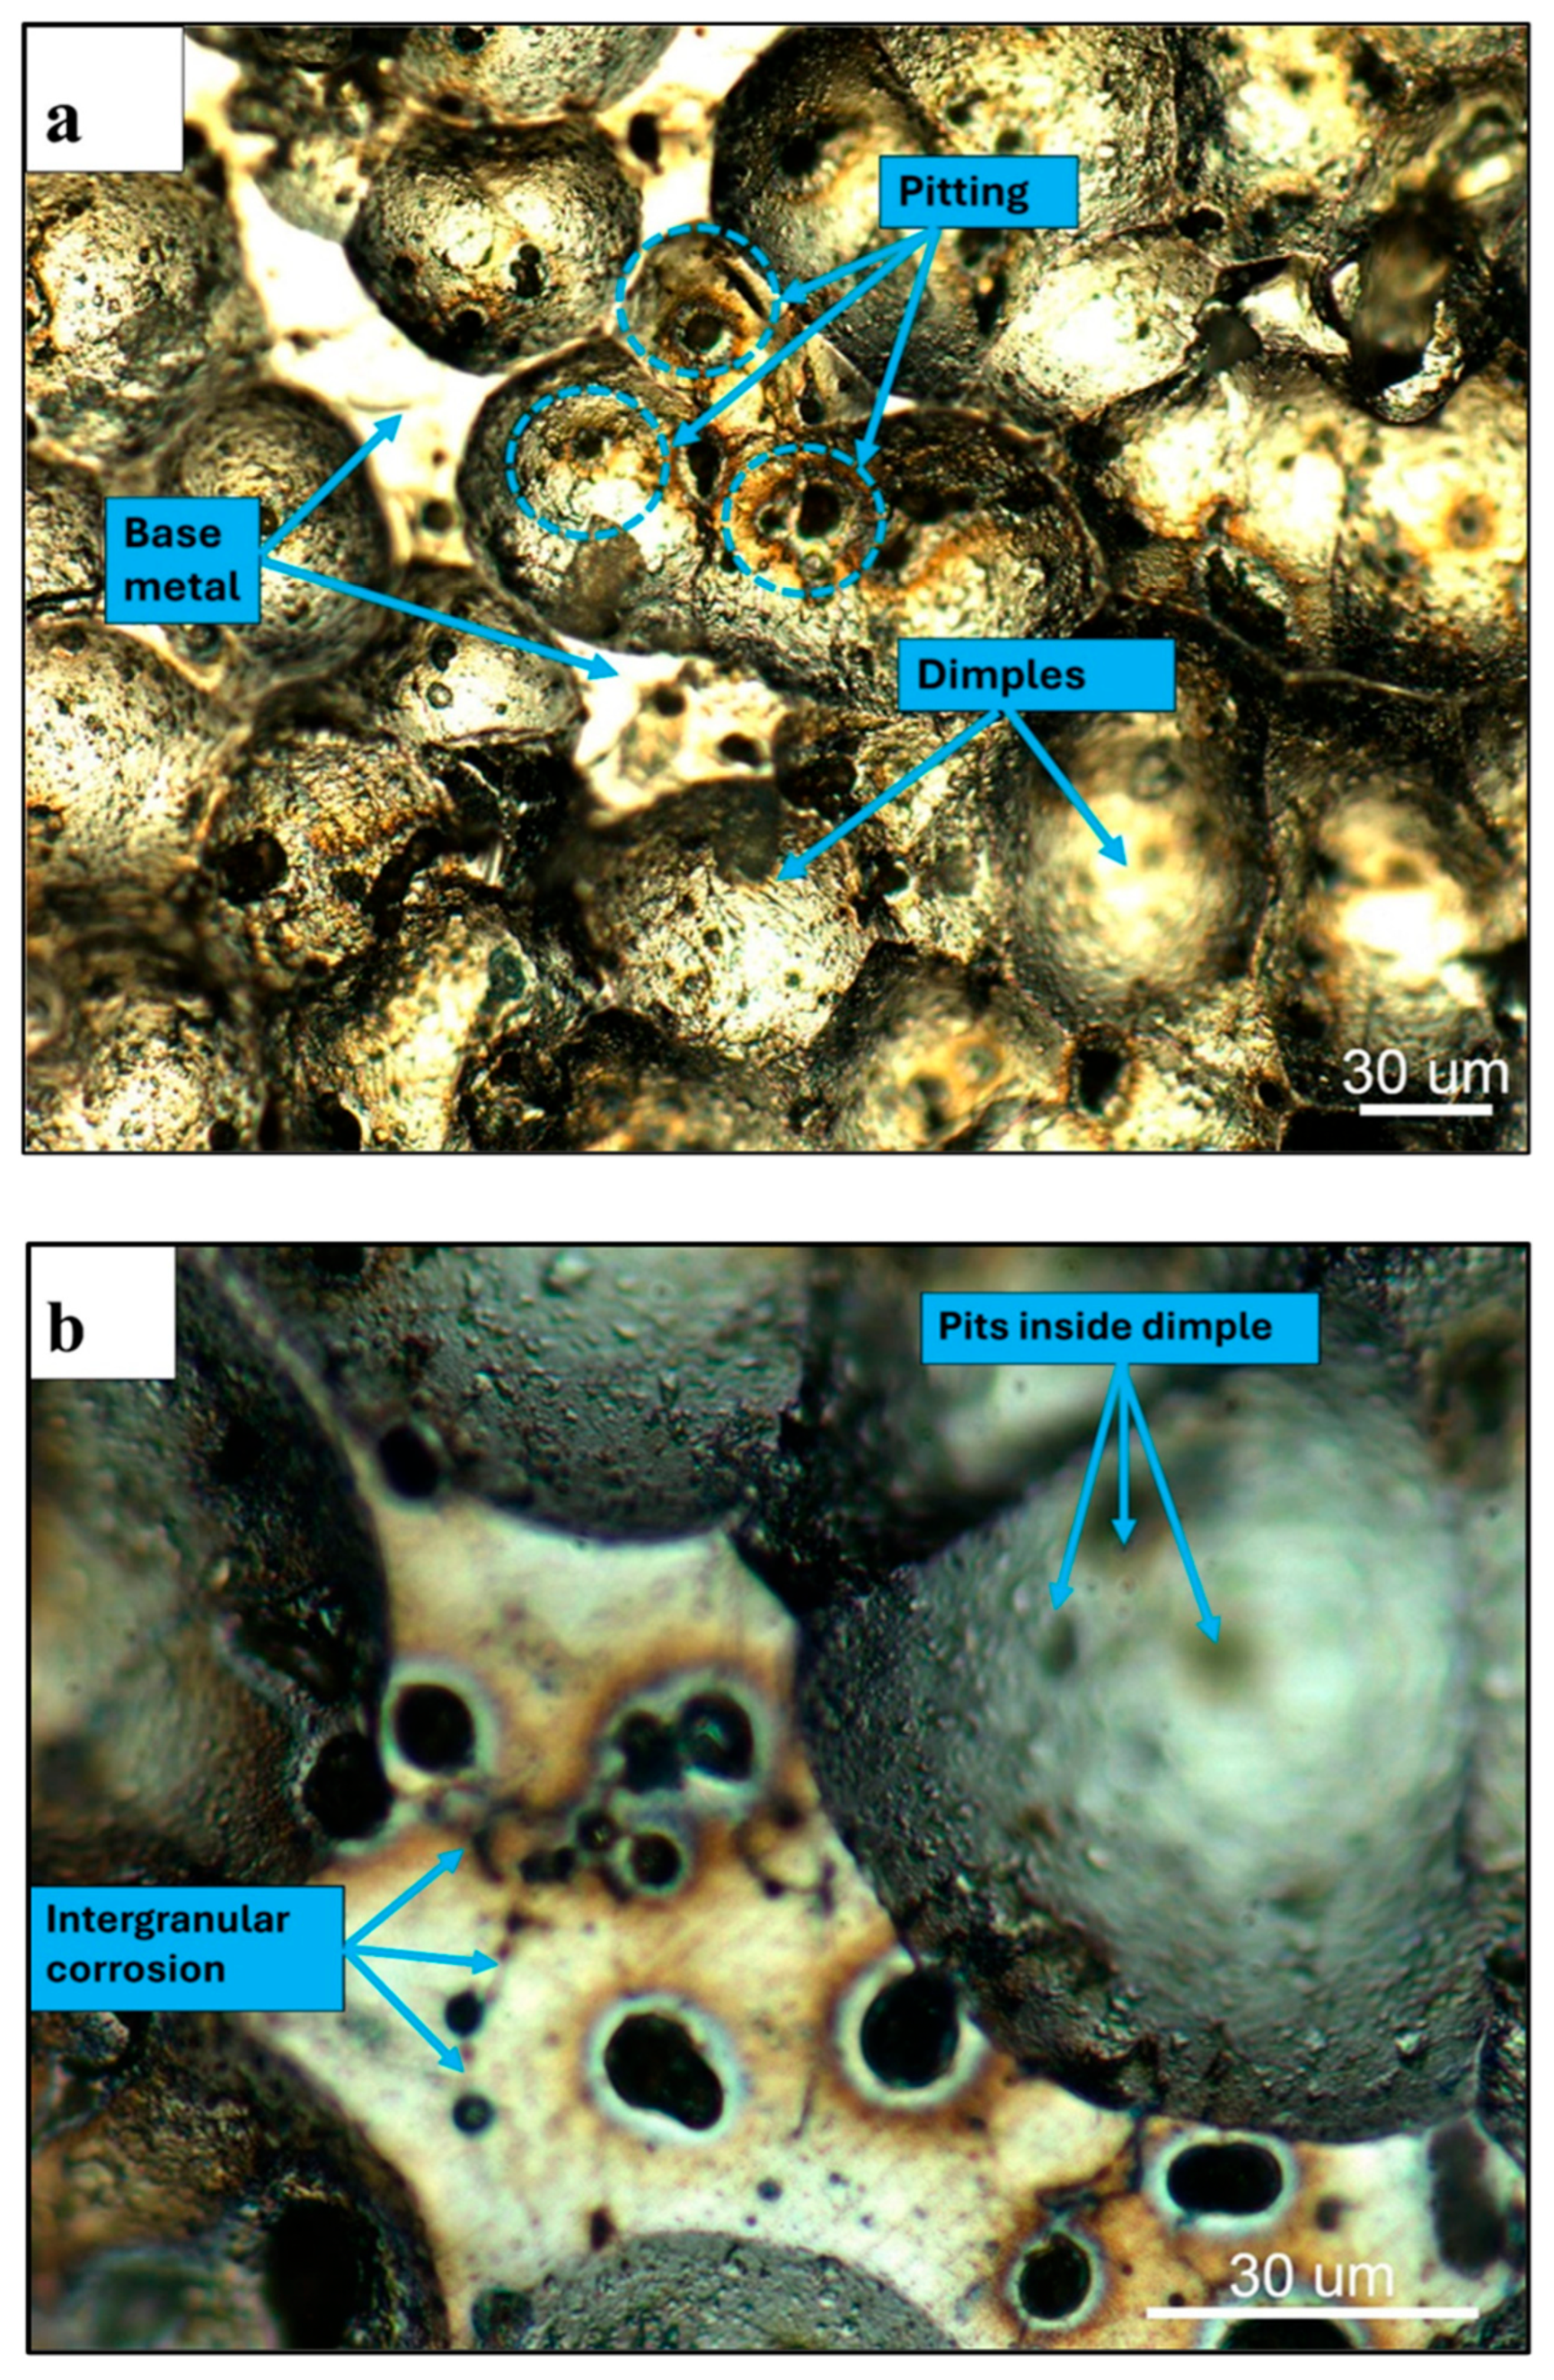
Figure 16.
Optical micrograph of corroded surface of Alumix 321 PM alloy in 3.5 w% NaCl solution: (a) unpeened; (b) peened.
Figure 16.
Optical micrograph of corroded surface of Alumix 321 PM alloy in 3.5 w% NaCl solution: (a) unpeened; (b) peened.
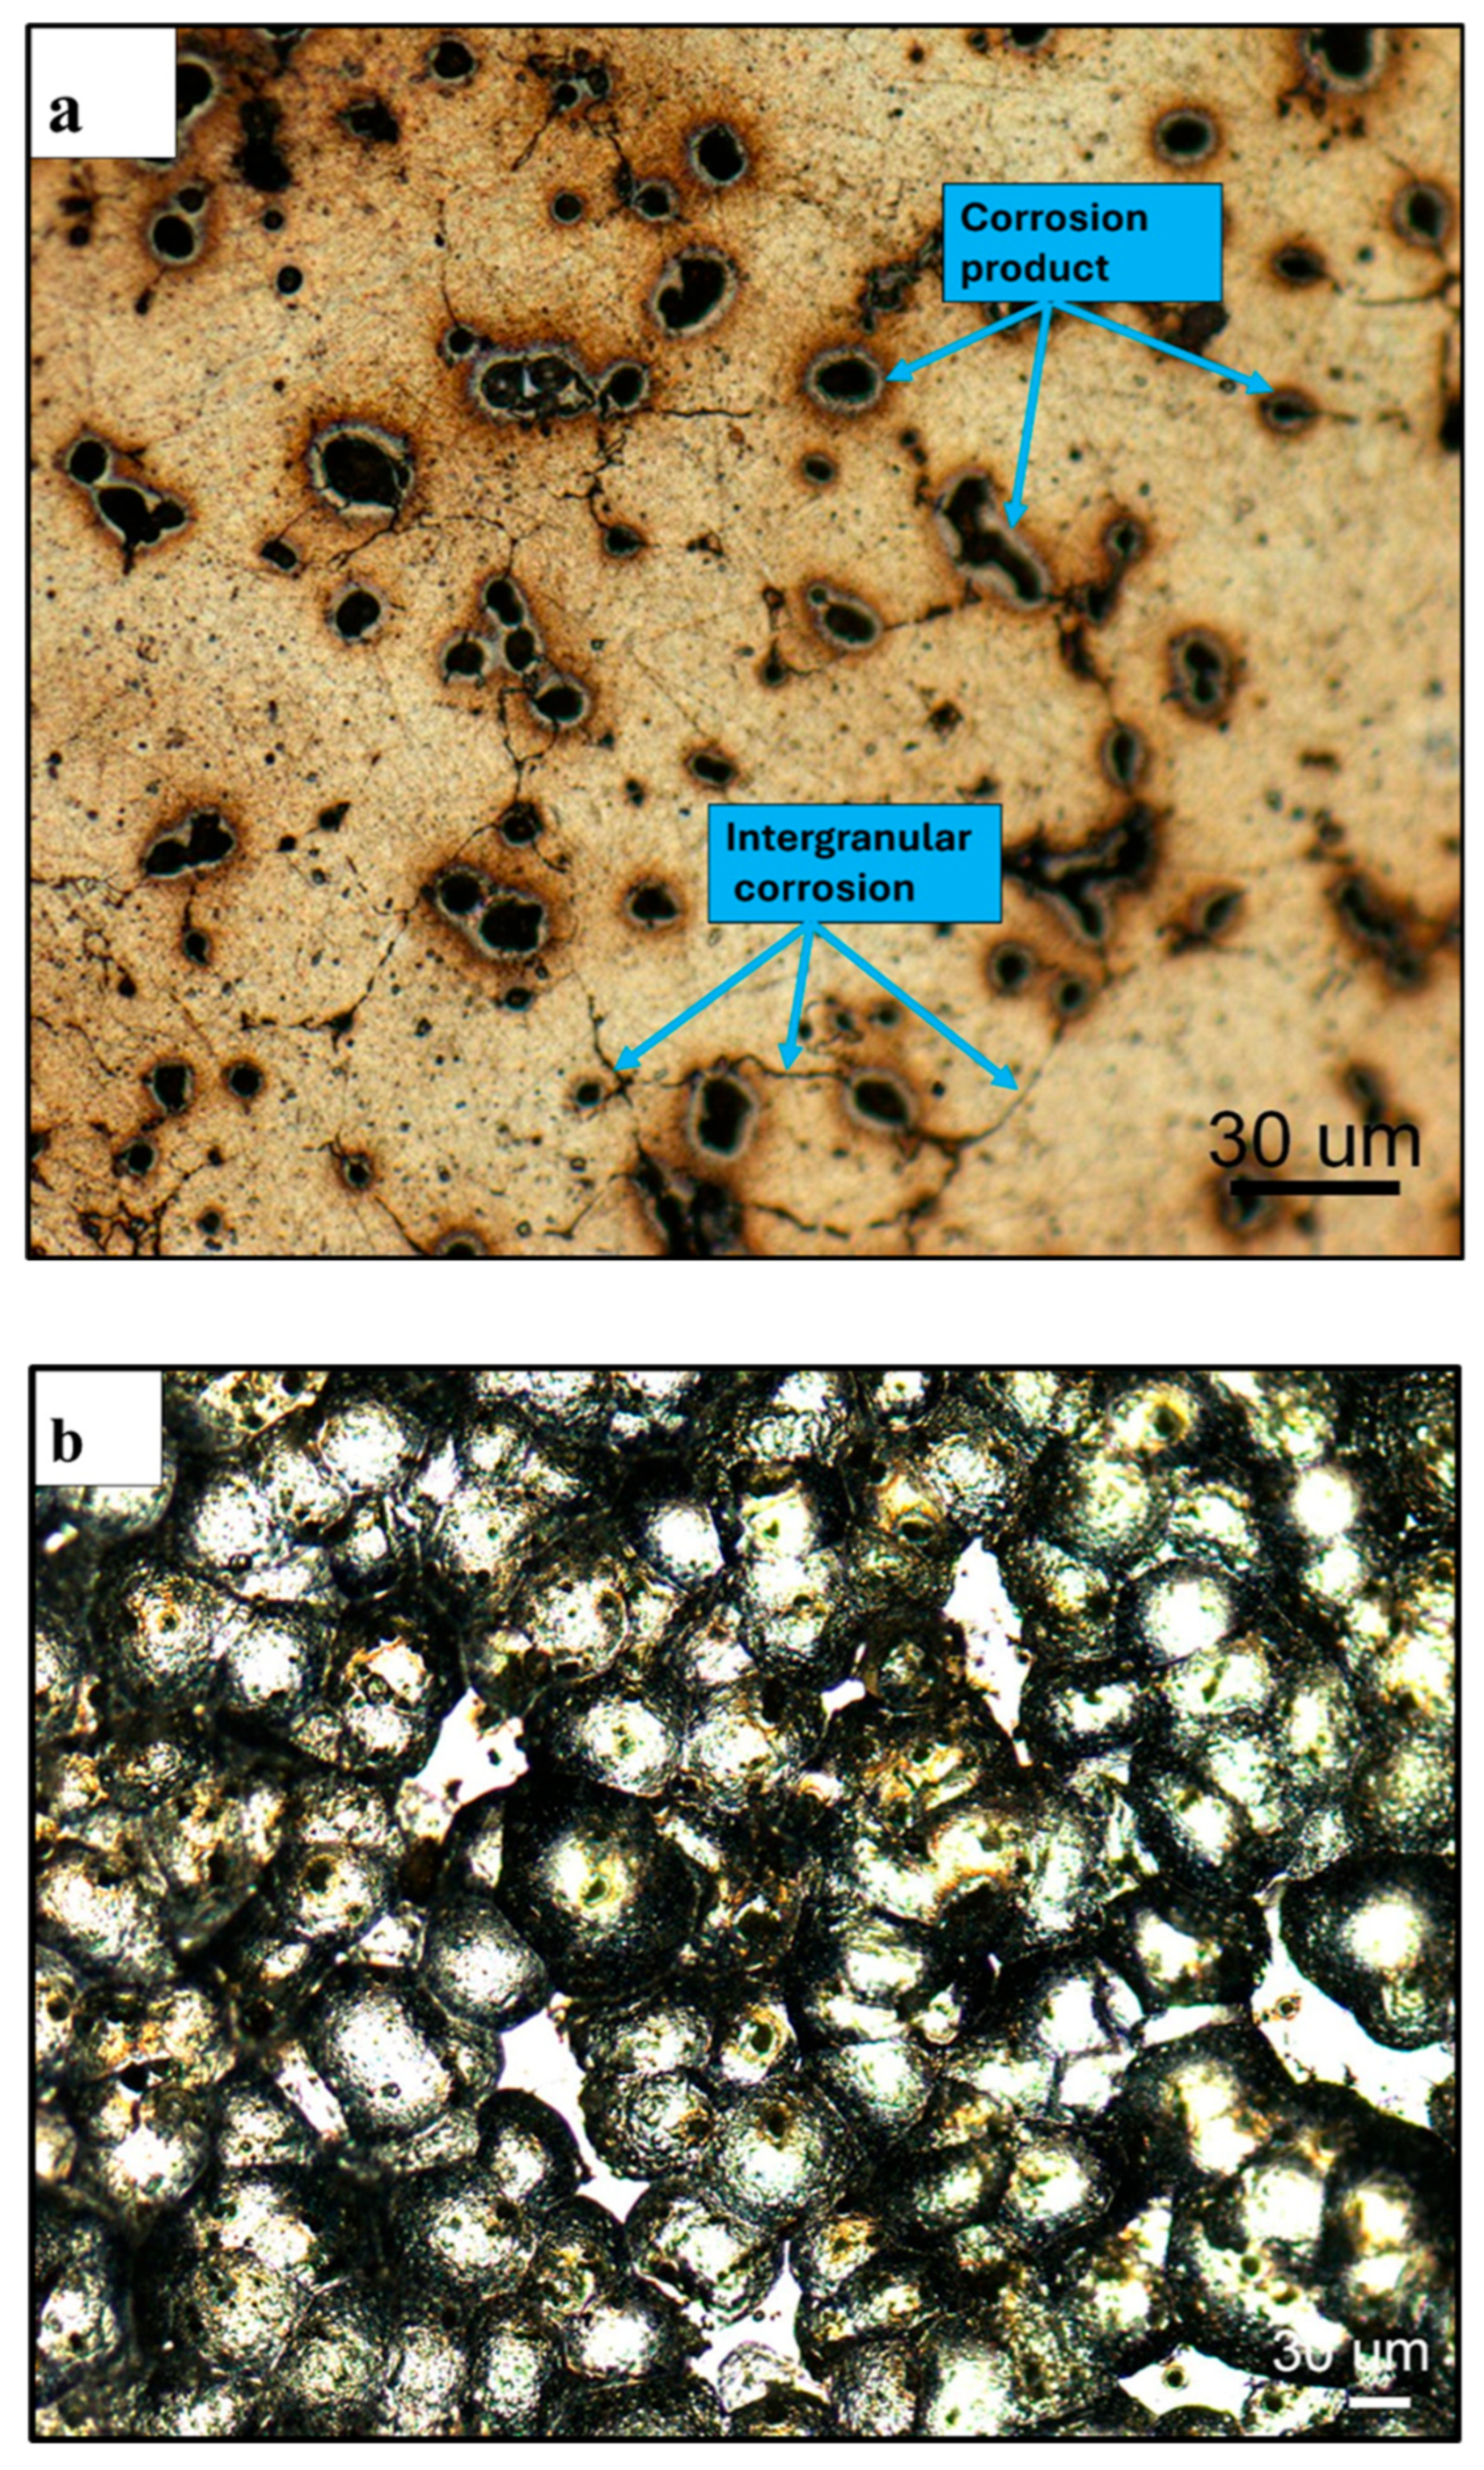
Figure 17.
Figure 18. Corrosion morphology of shot peened Alumix 321 PM alloy: (a) low magnification; (b) High magnification shows pitting, crevice and IGC.
Figure 17.
Figure 18. Corrosion morphology of shot peened Alumix 321 PM alloy: (a) low magnification; (b) High magnification shows pitting, crevice and IGC.
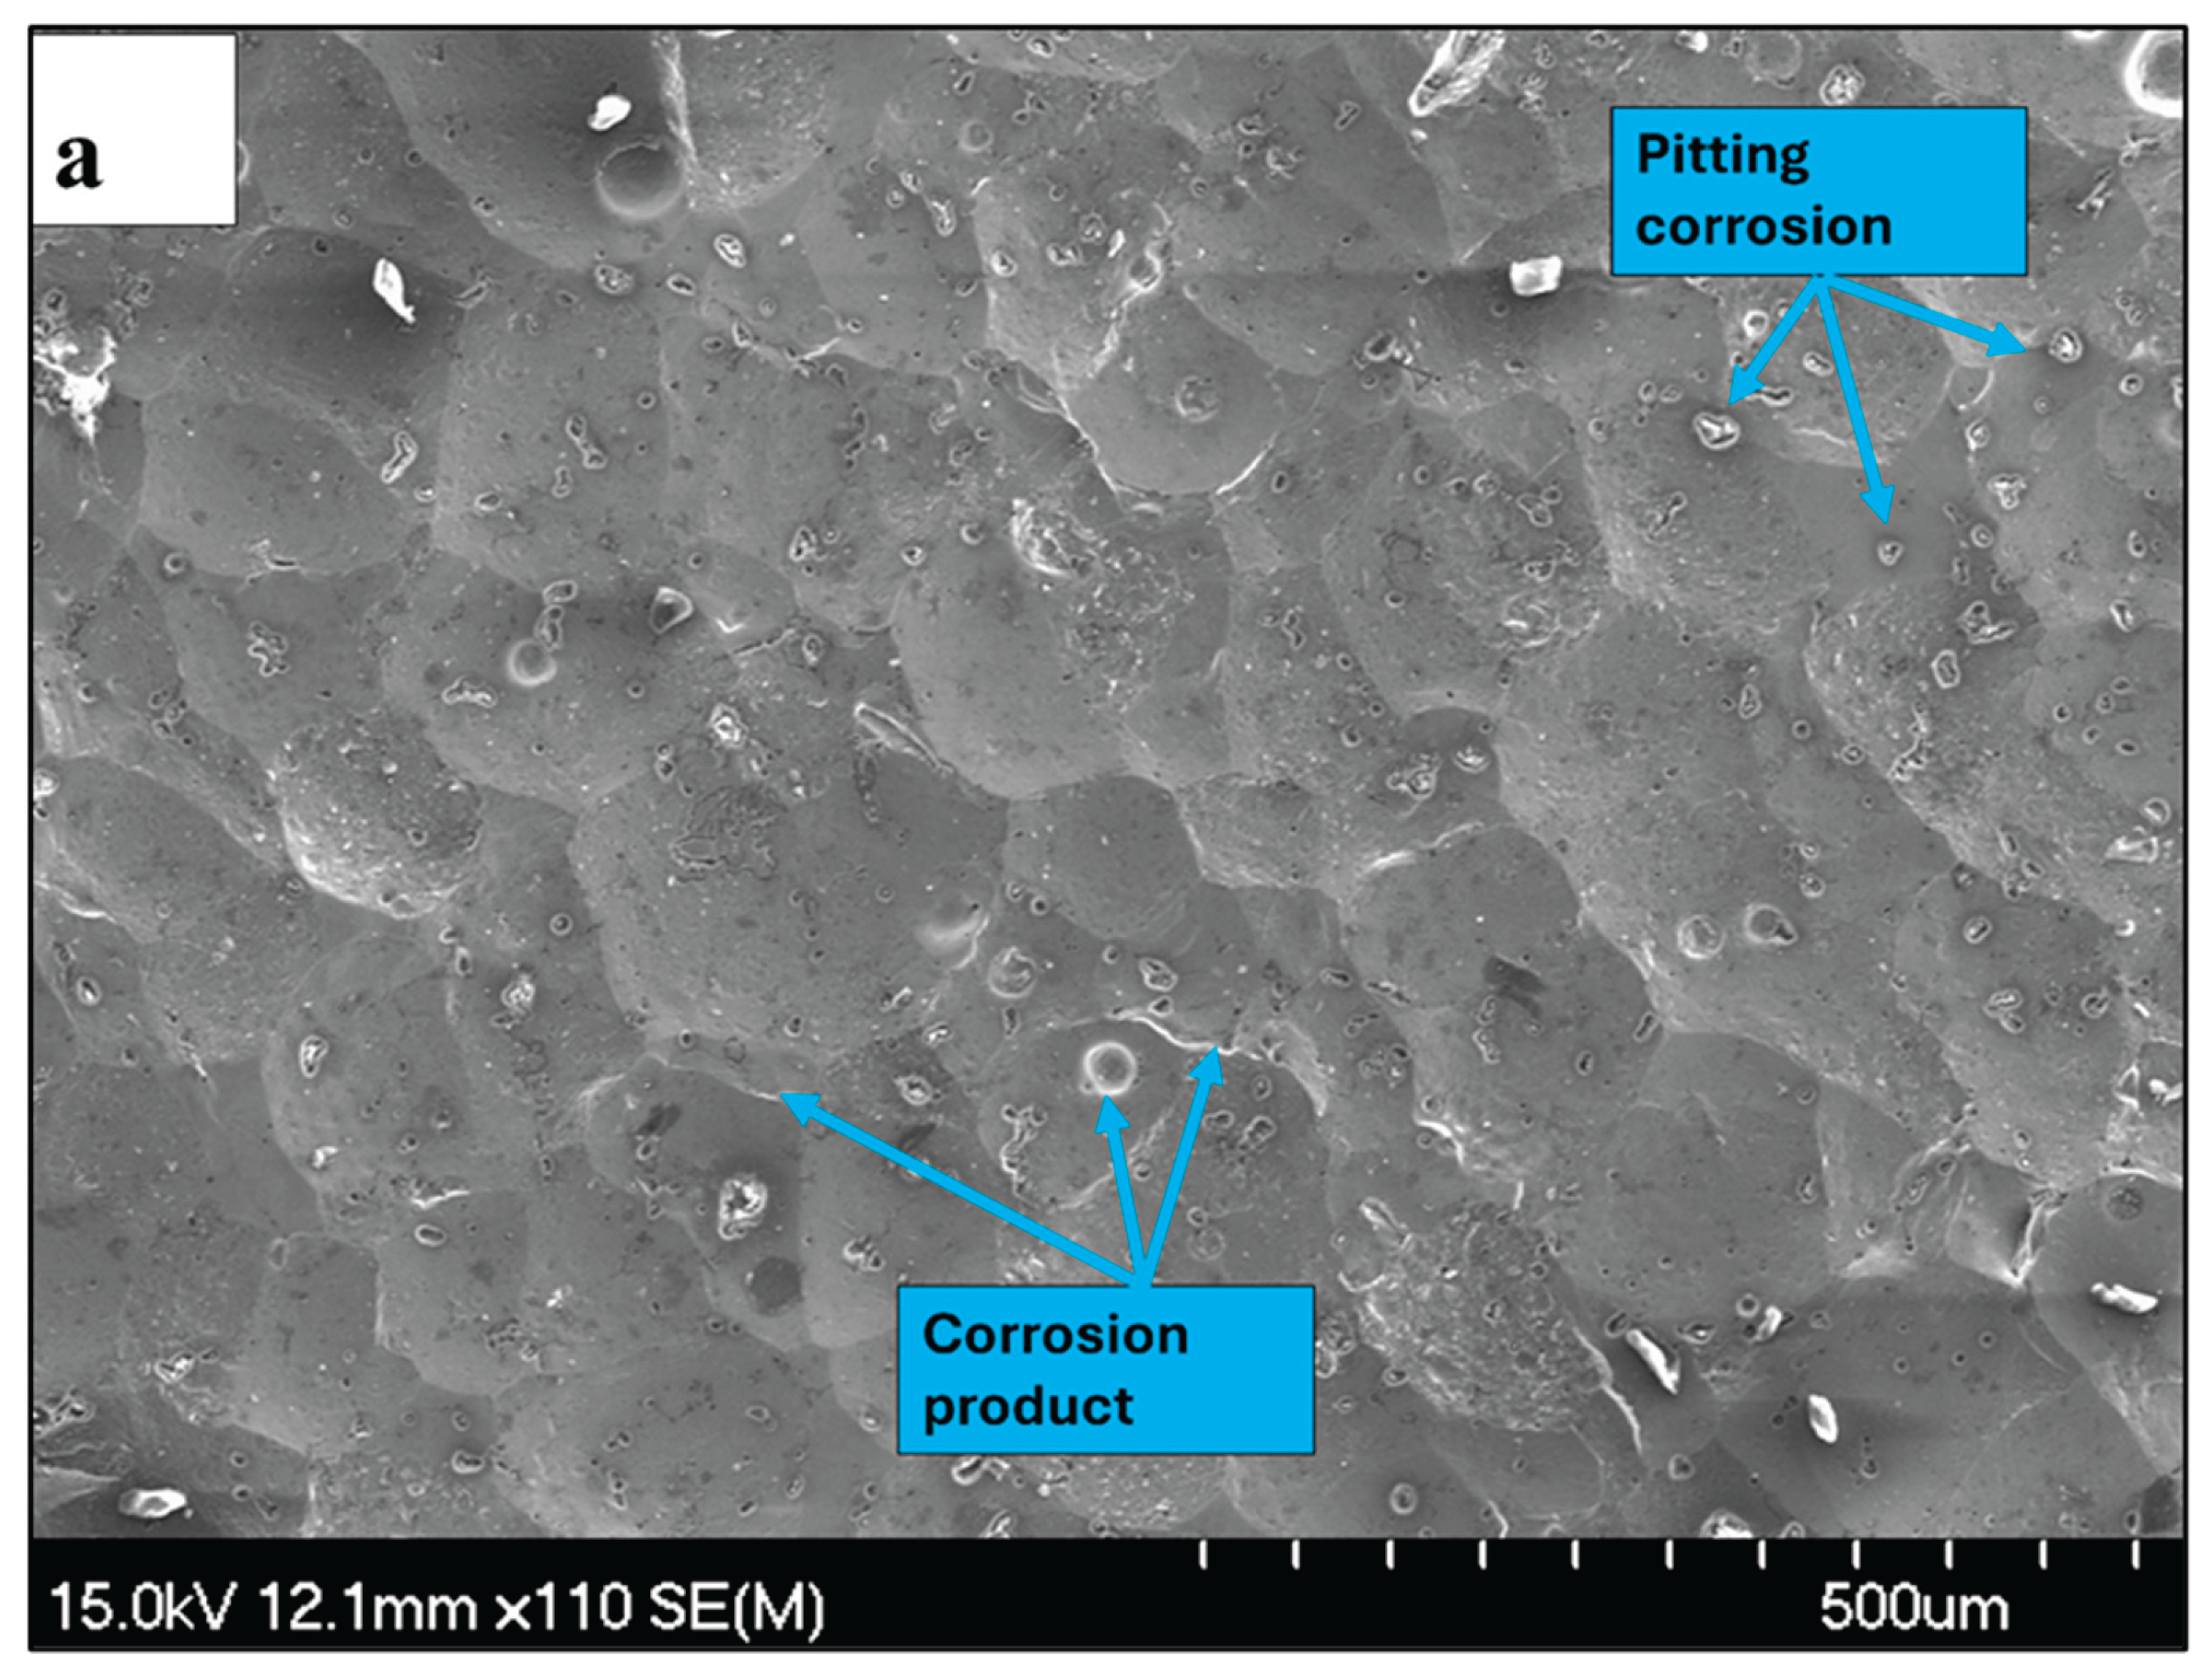
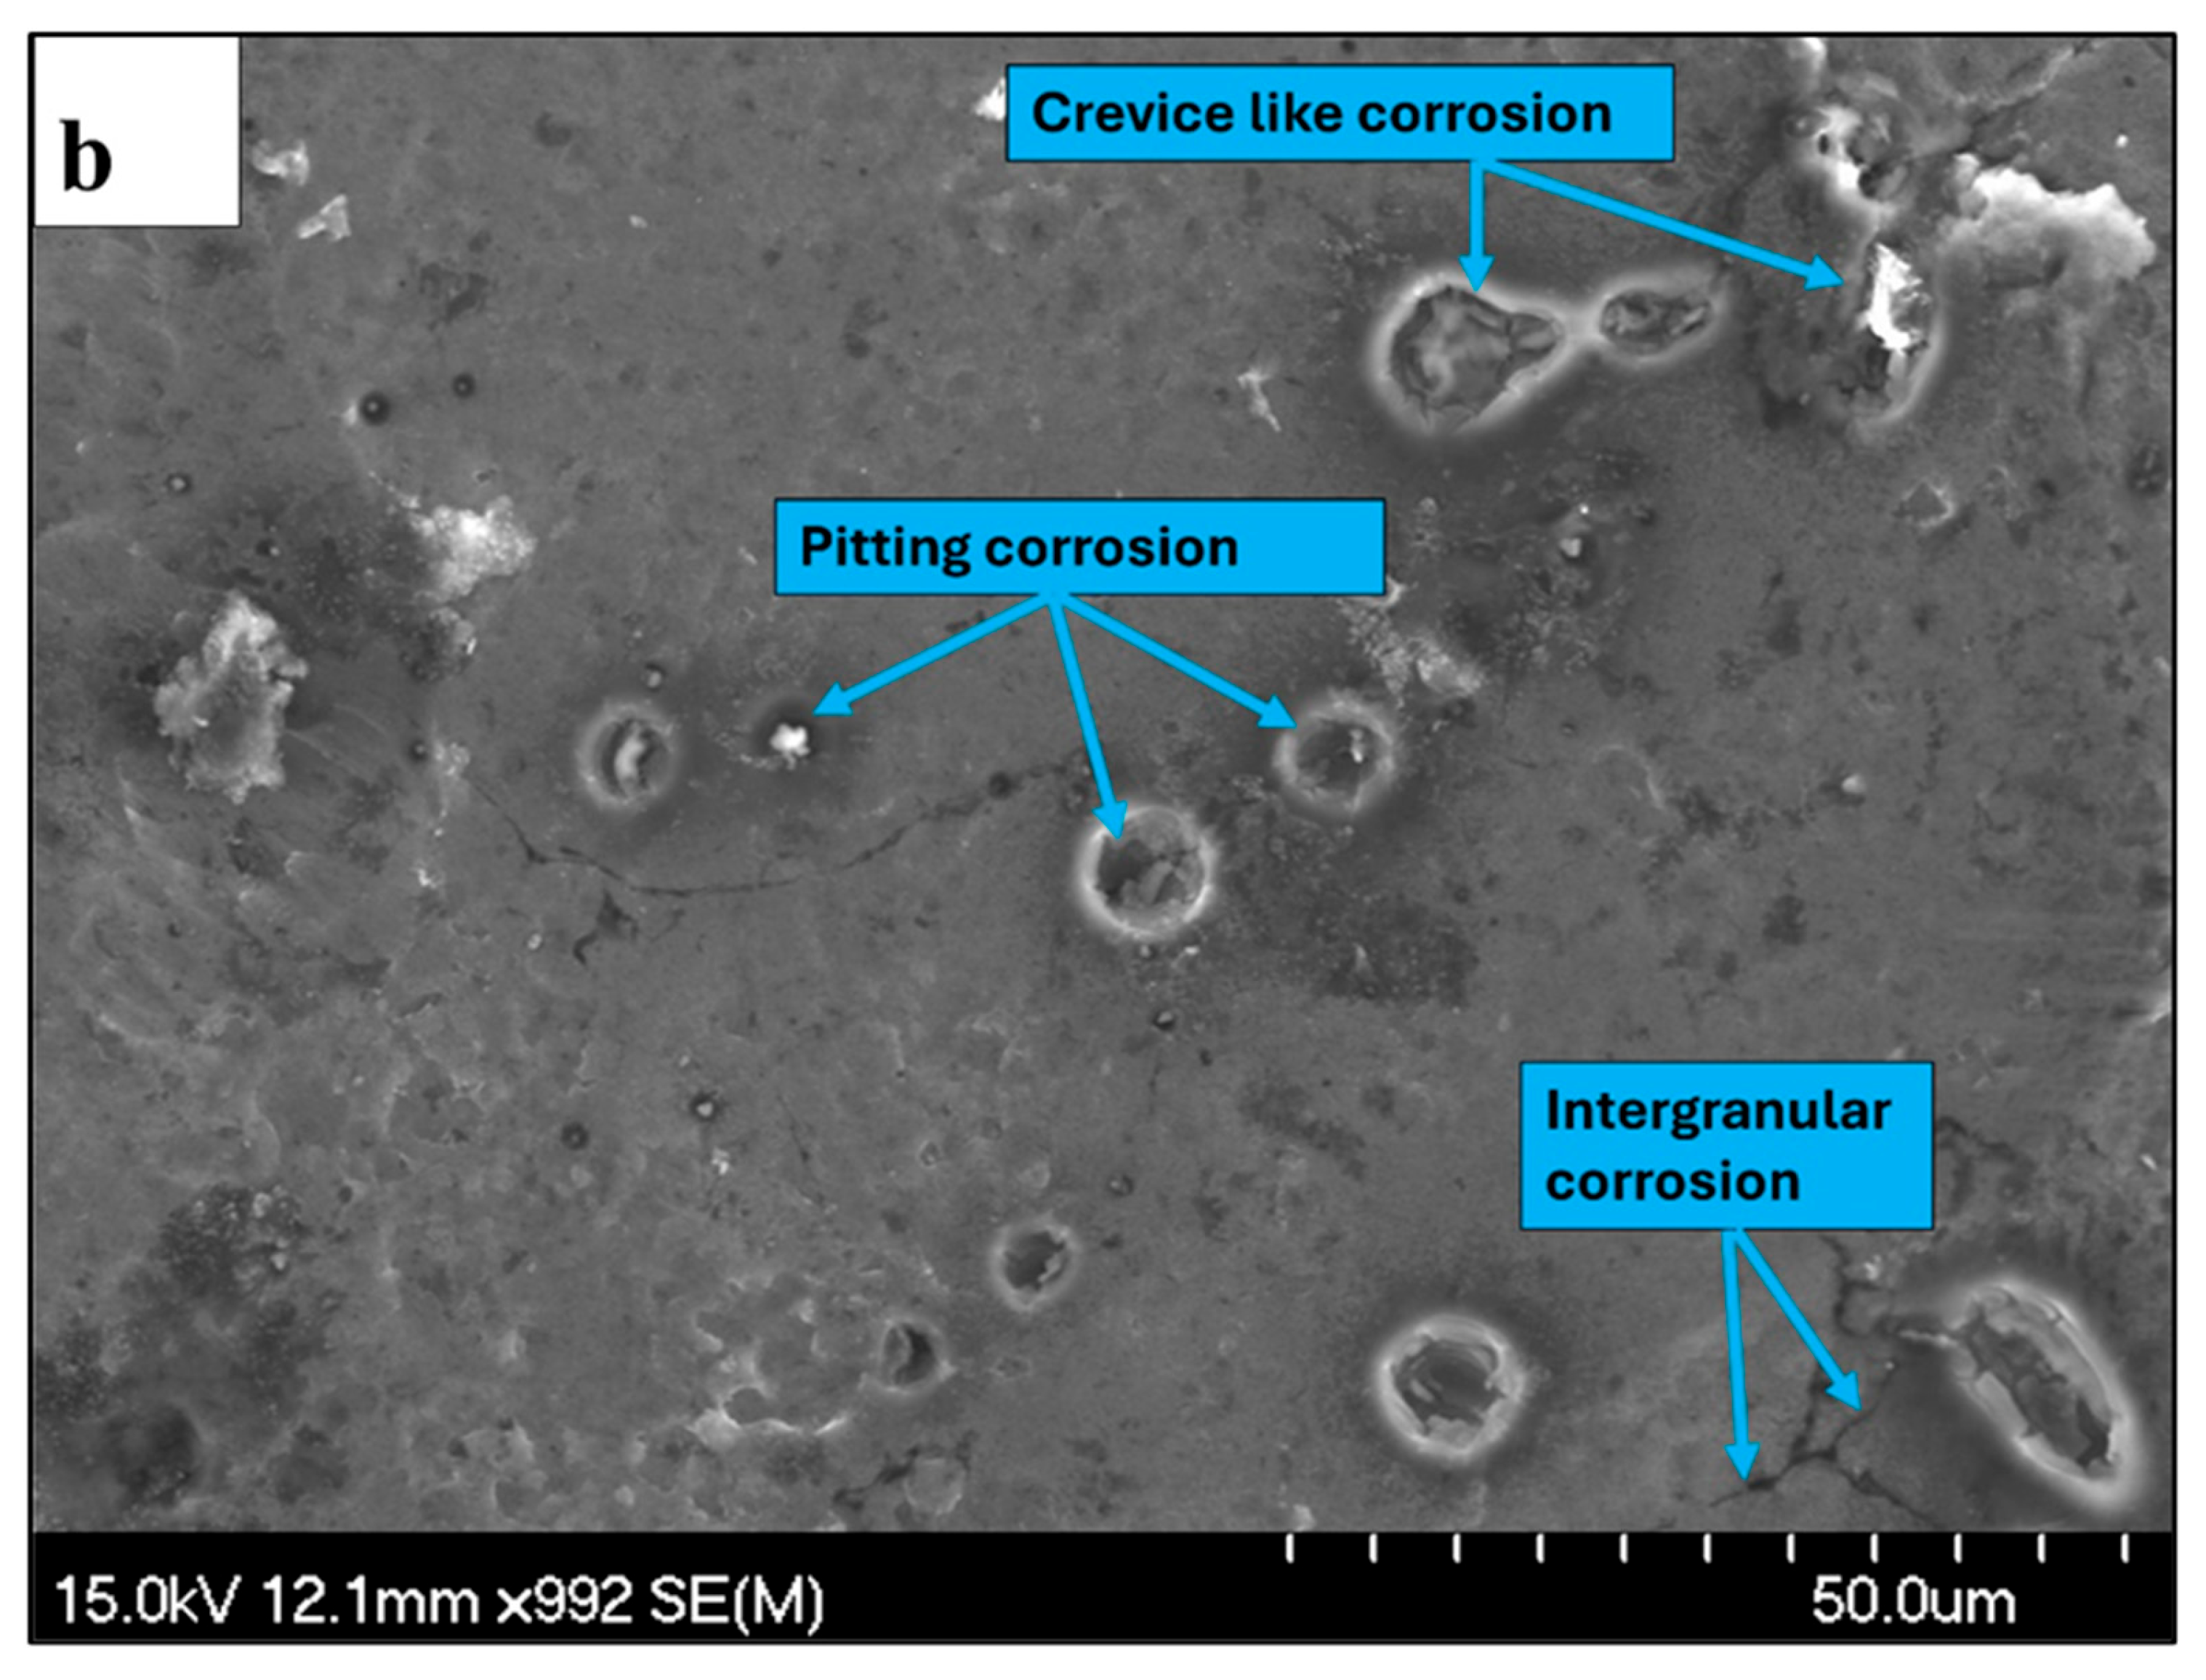
Figure 18.
Corrosion morphology of Alumix 321 PM alloy: (a) pitting morphology; (b) EDS analysis of iron containing particles.
Figure 18.
Corrosion morphology of Alumix 321 PM alloy: (a) pitting morphology; (b) EDS analysis of iron containing particles.
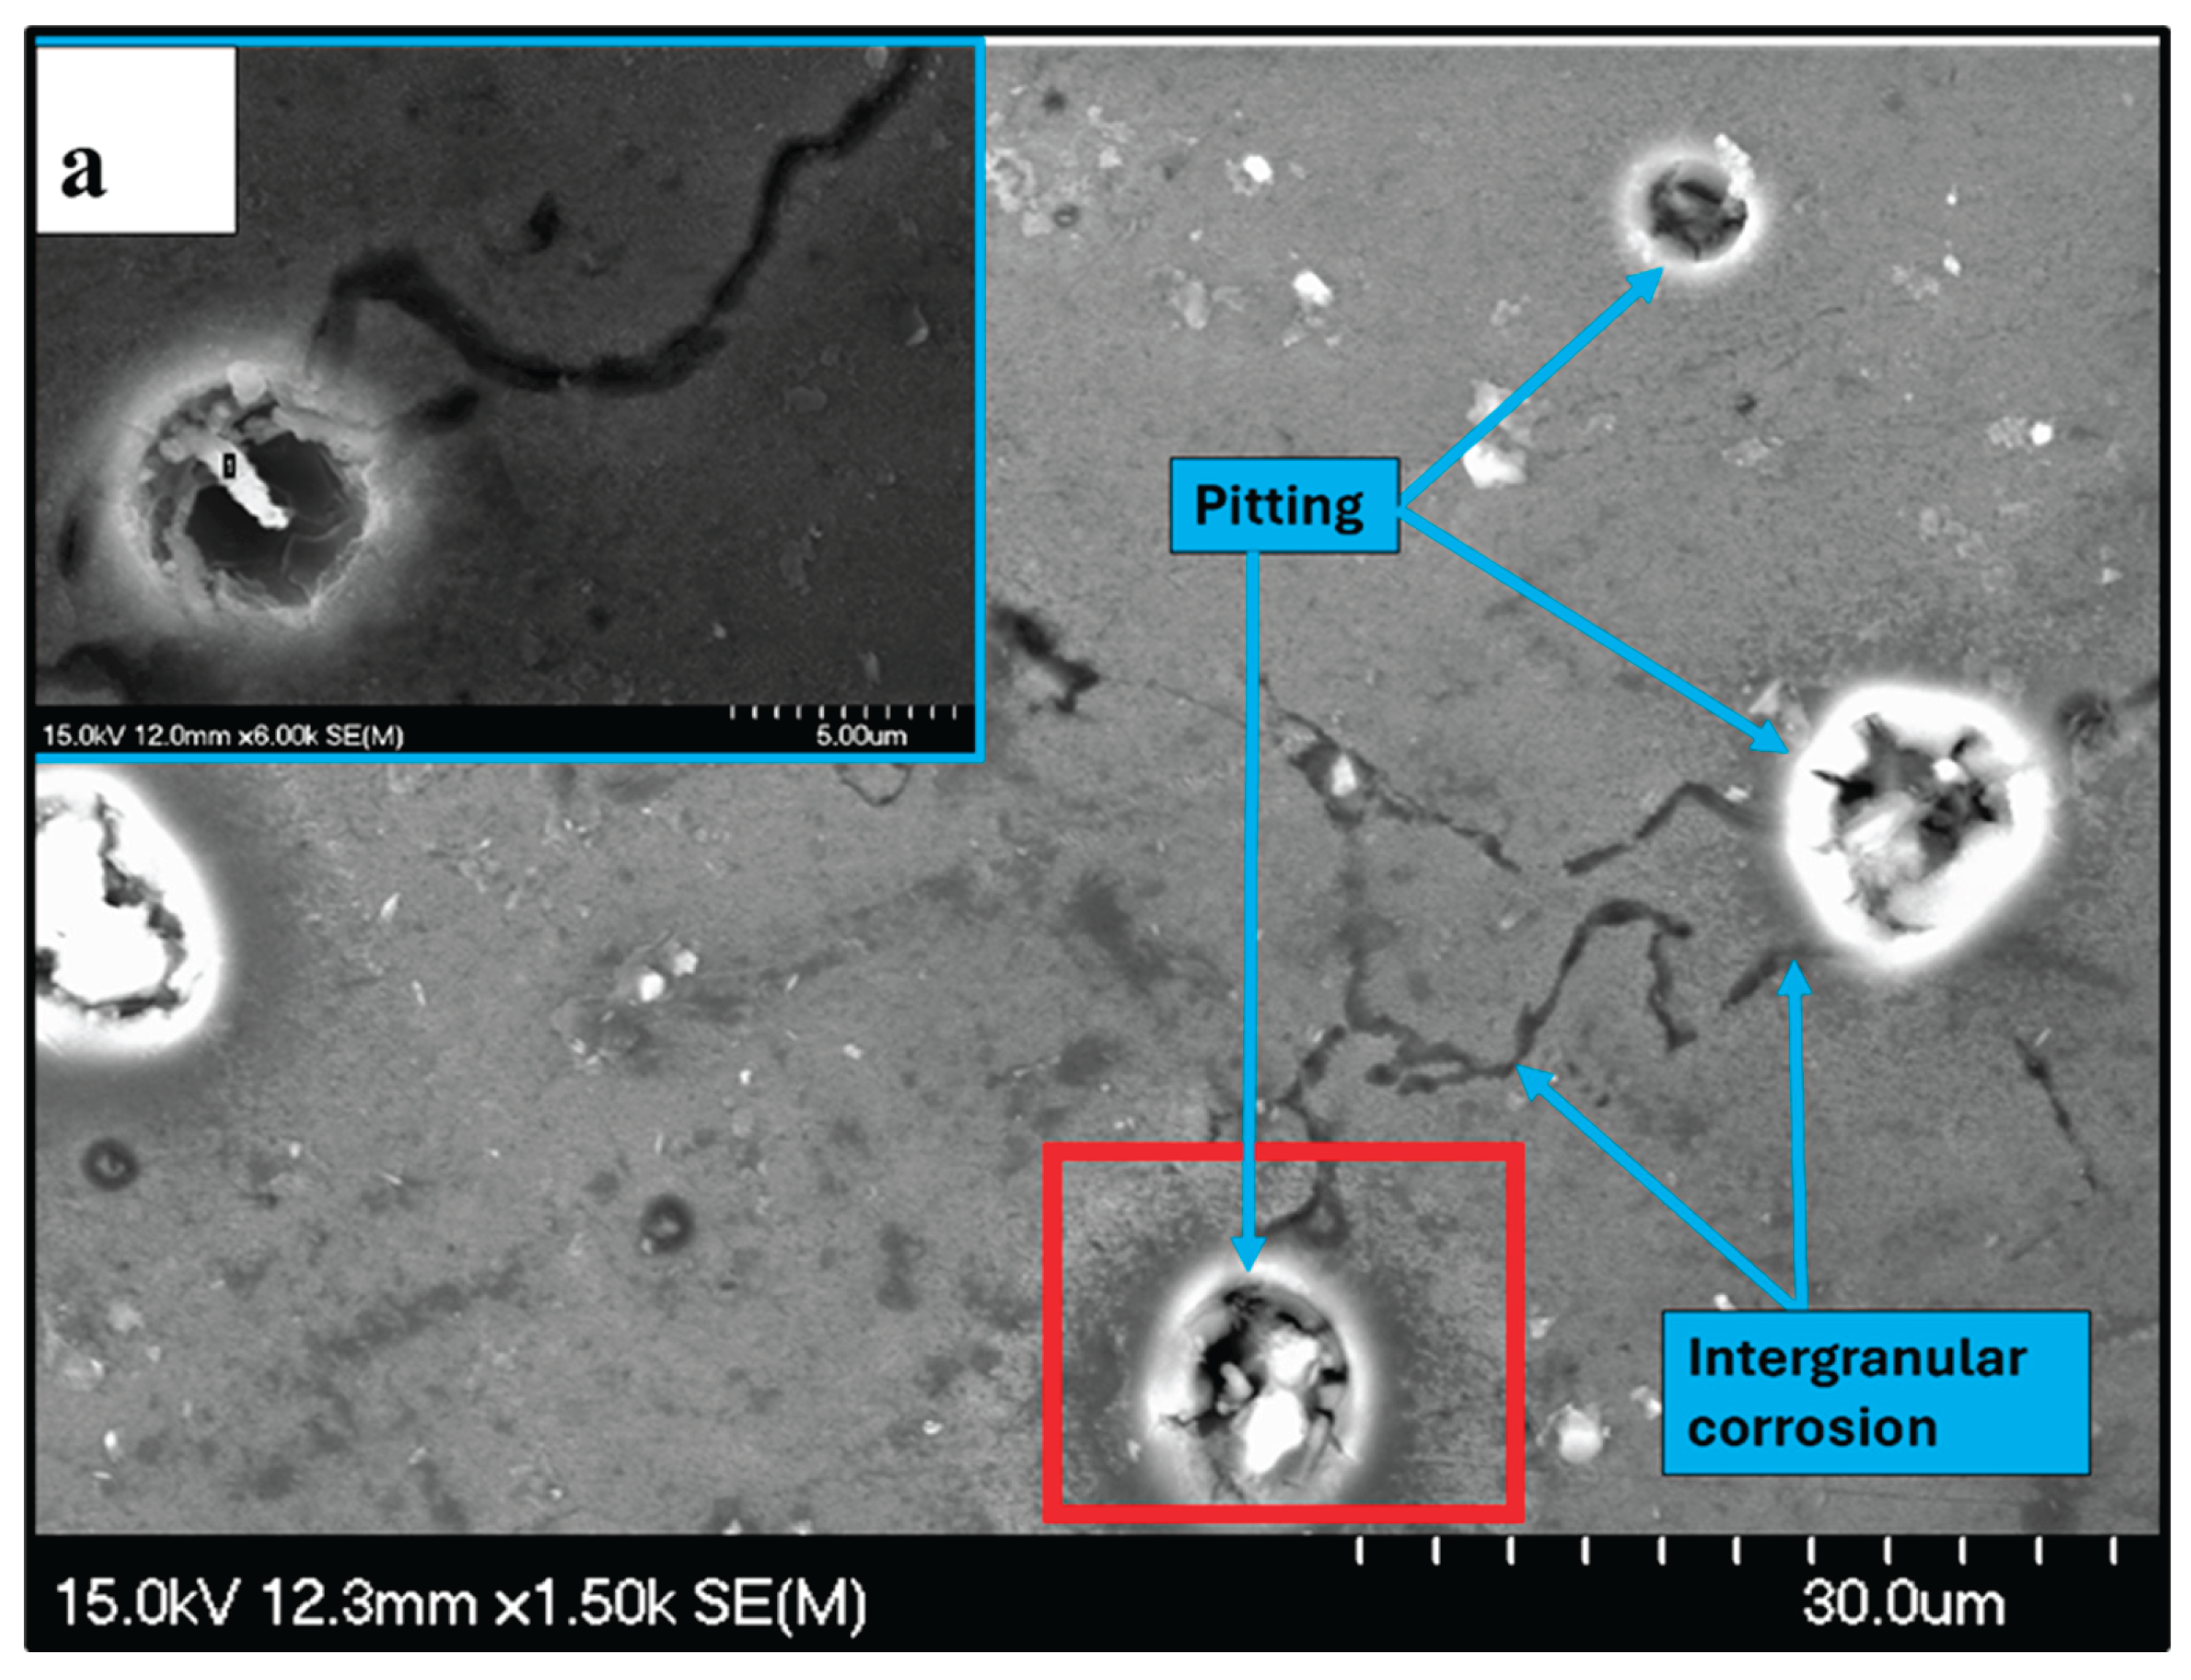
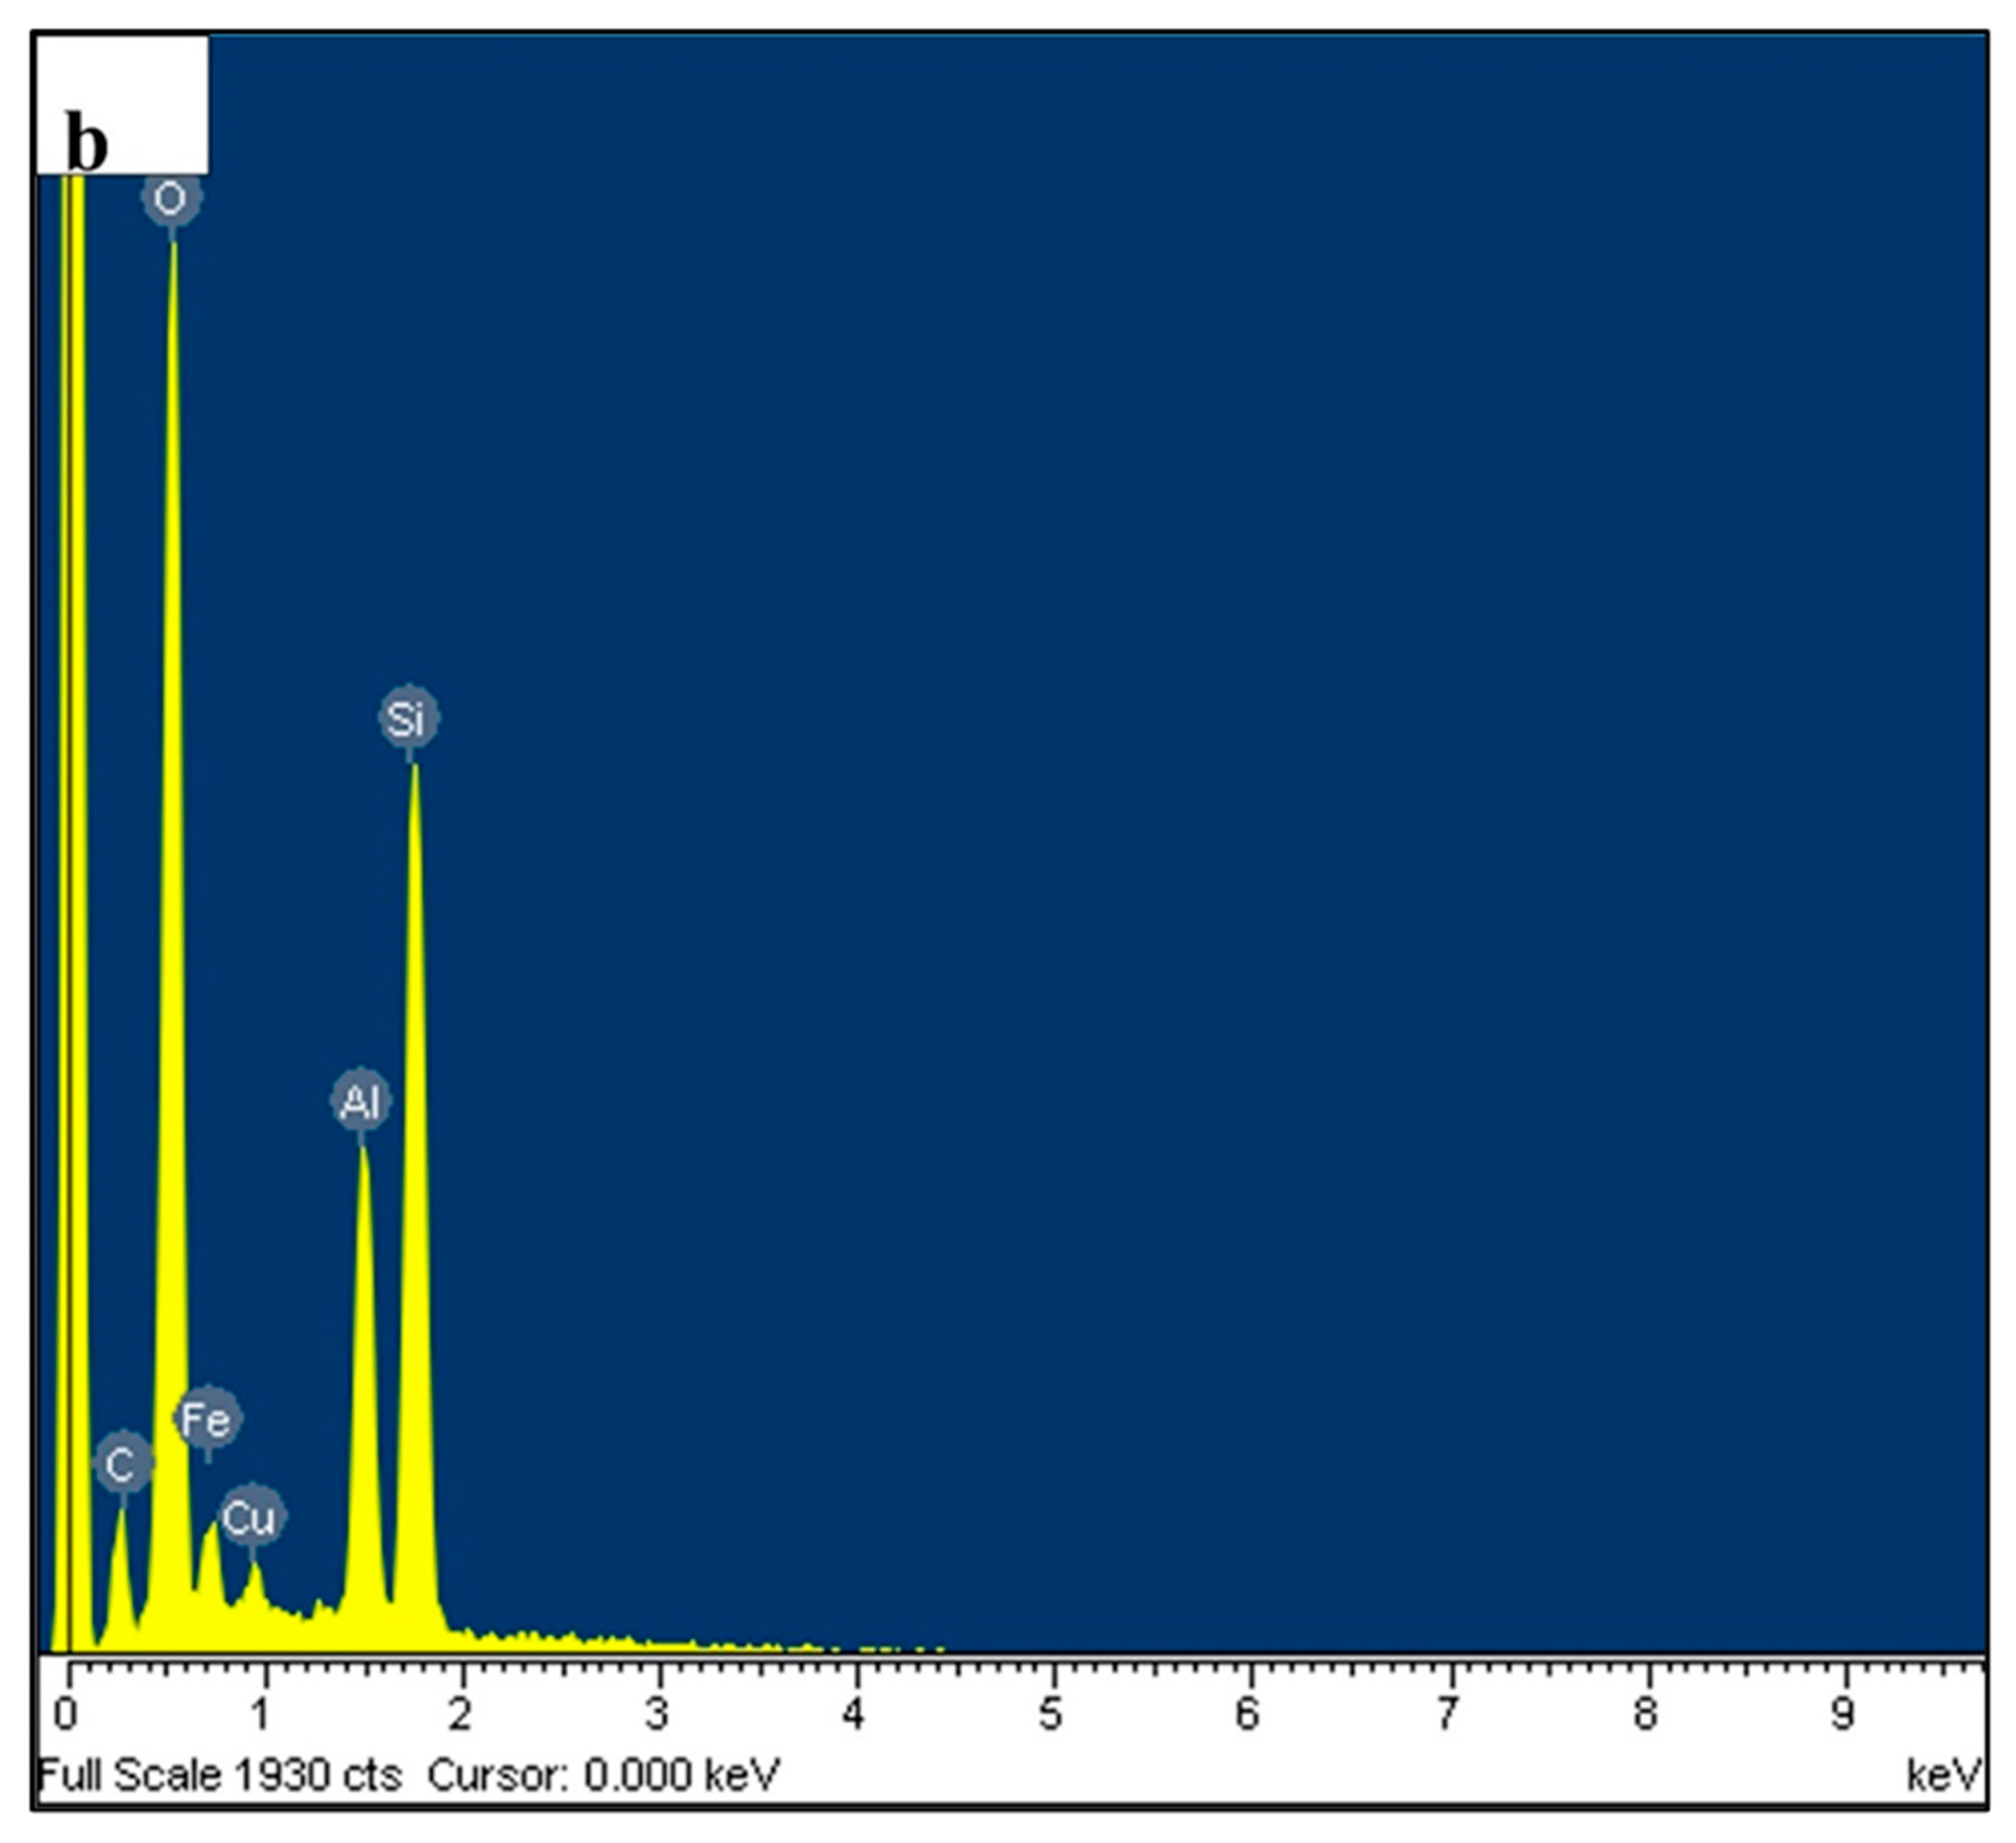
Figure 19.
SEM micrograph shows corrosion pit formed around iron rich particle in wrought AA6061 alloy.
Figure 19.
SEM micrograph shows corrosion pit formed around iron rich particle in wrought AA6061 alloy.
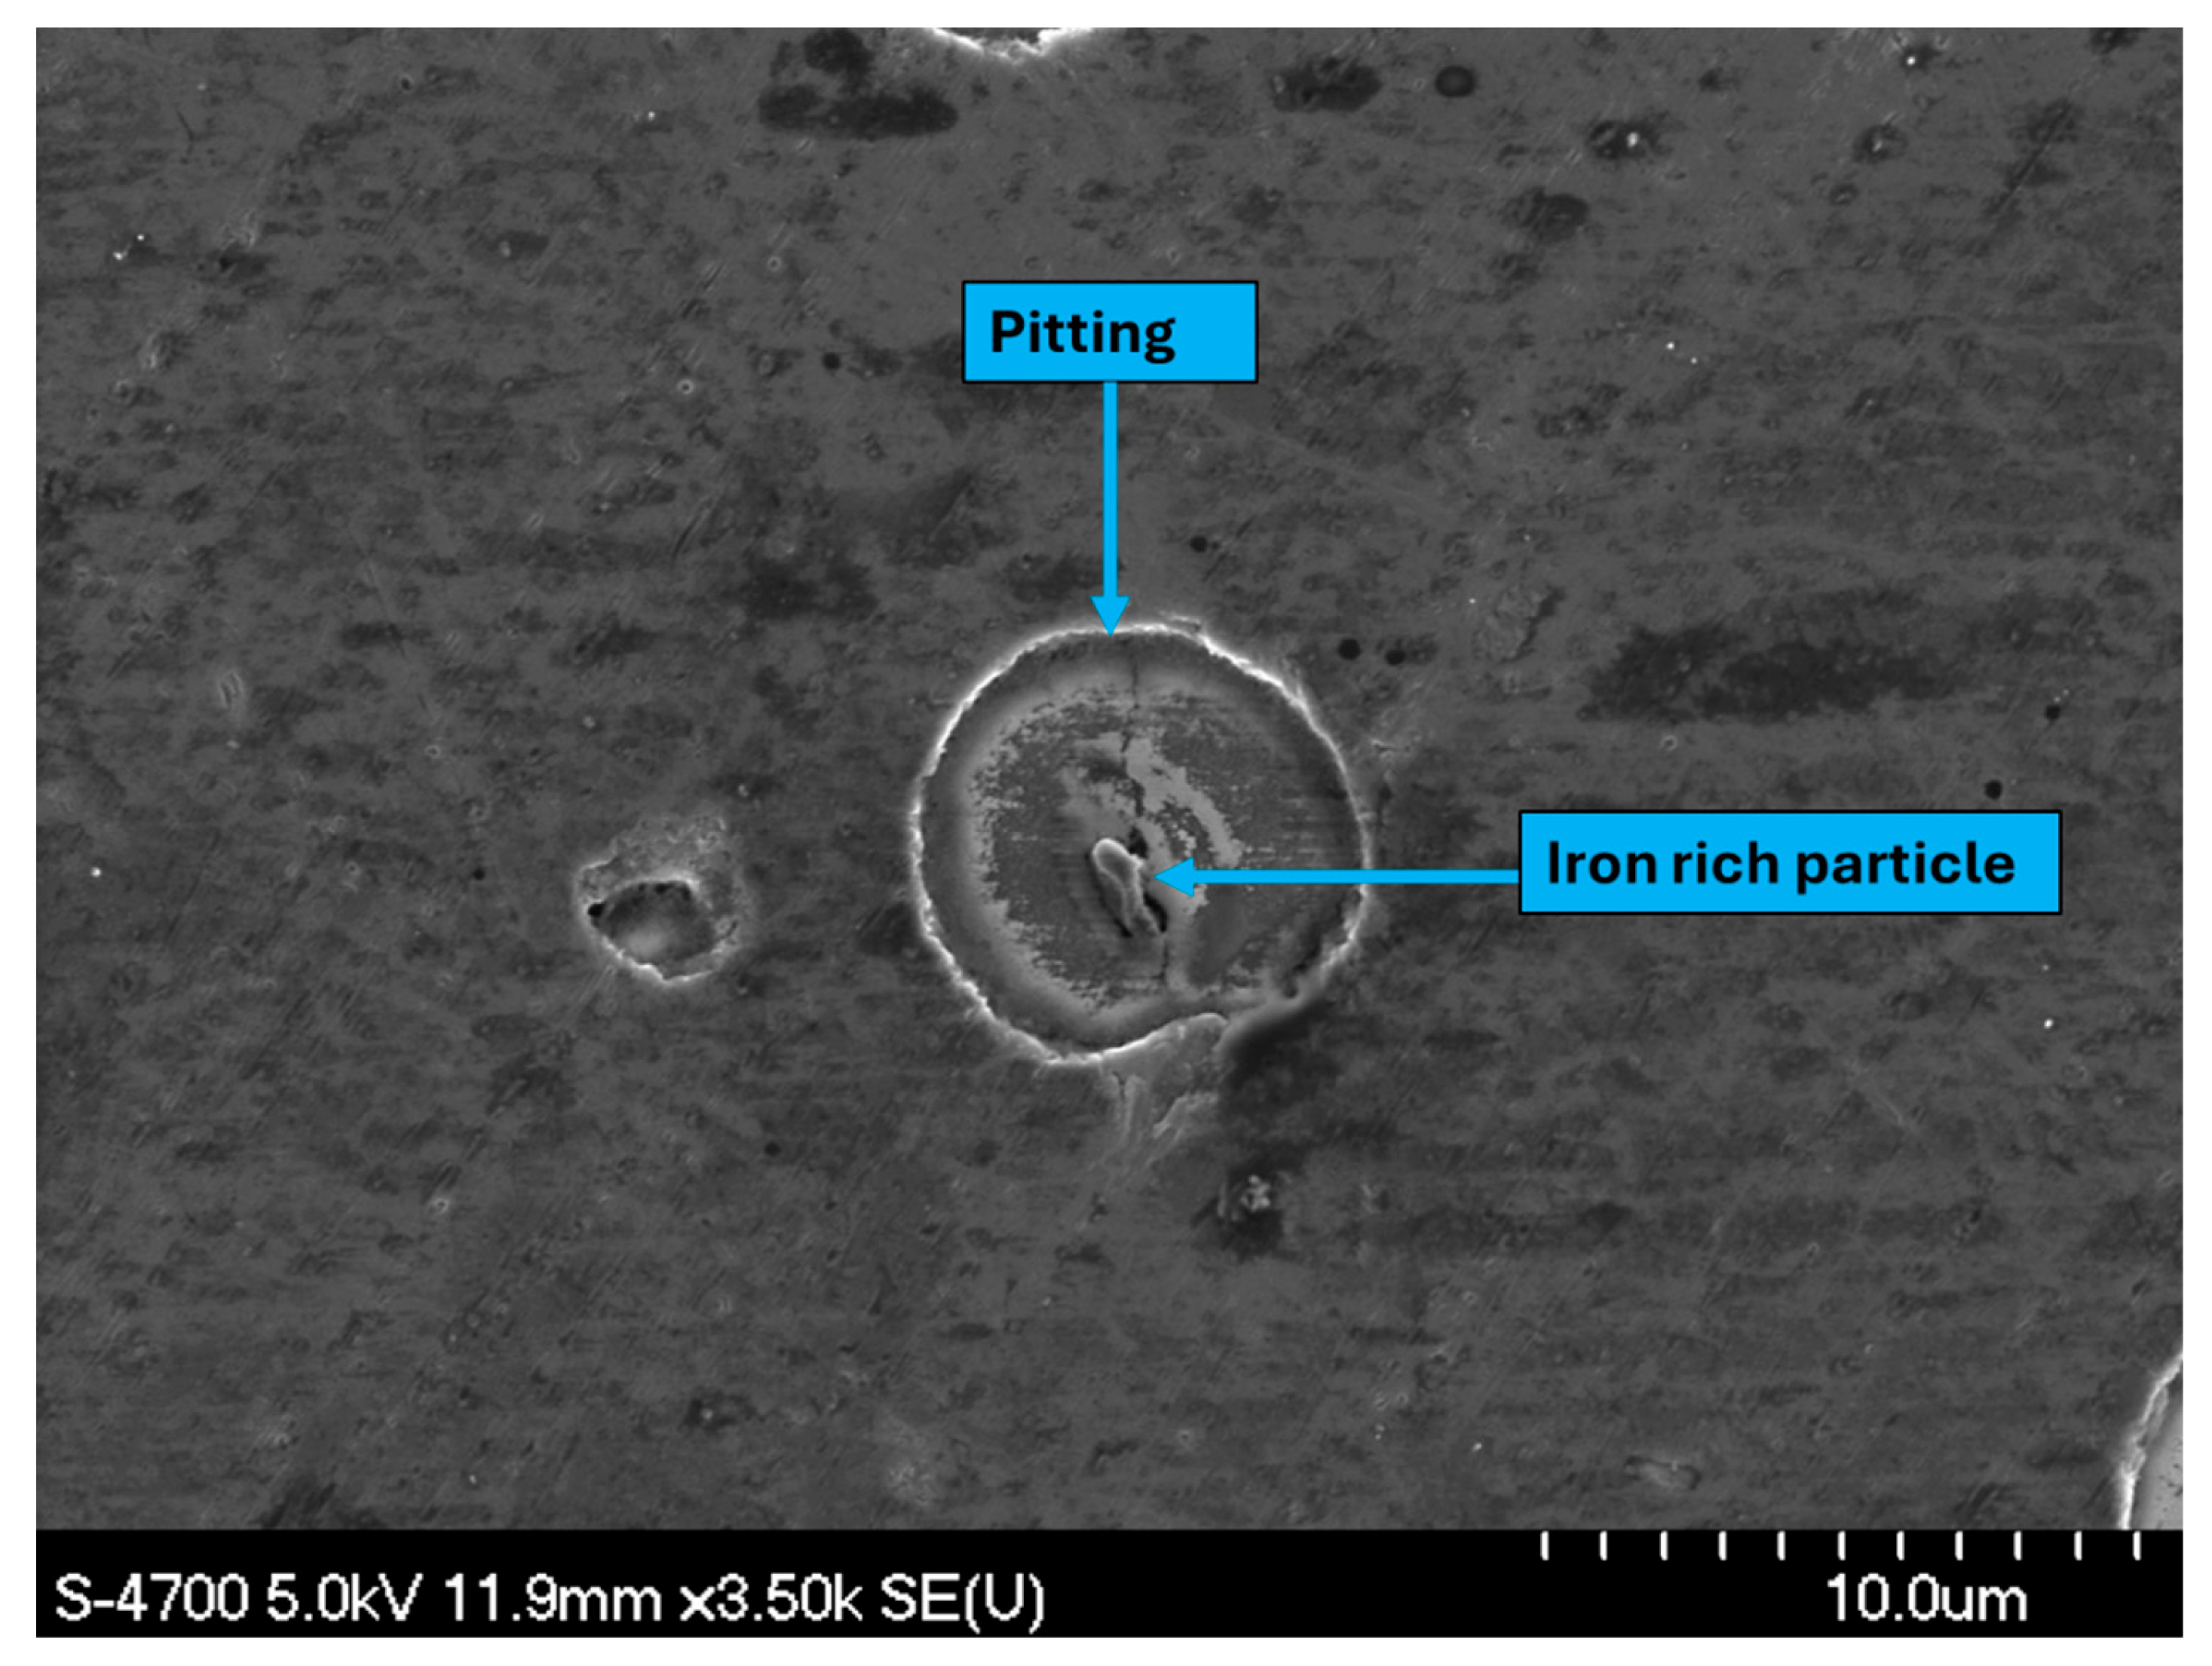
Figure 20.
Line scan mapping shows corrosion at the grain boundary of Alumix 321 PM alloy.
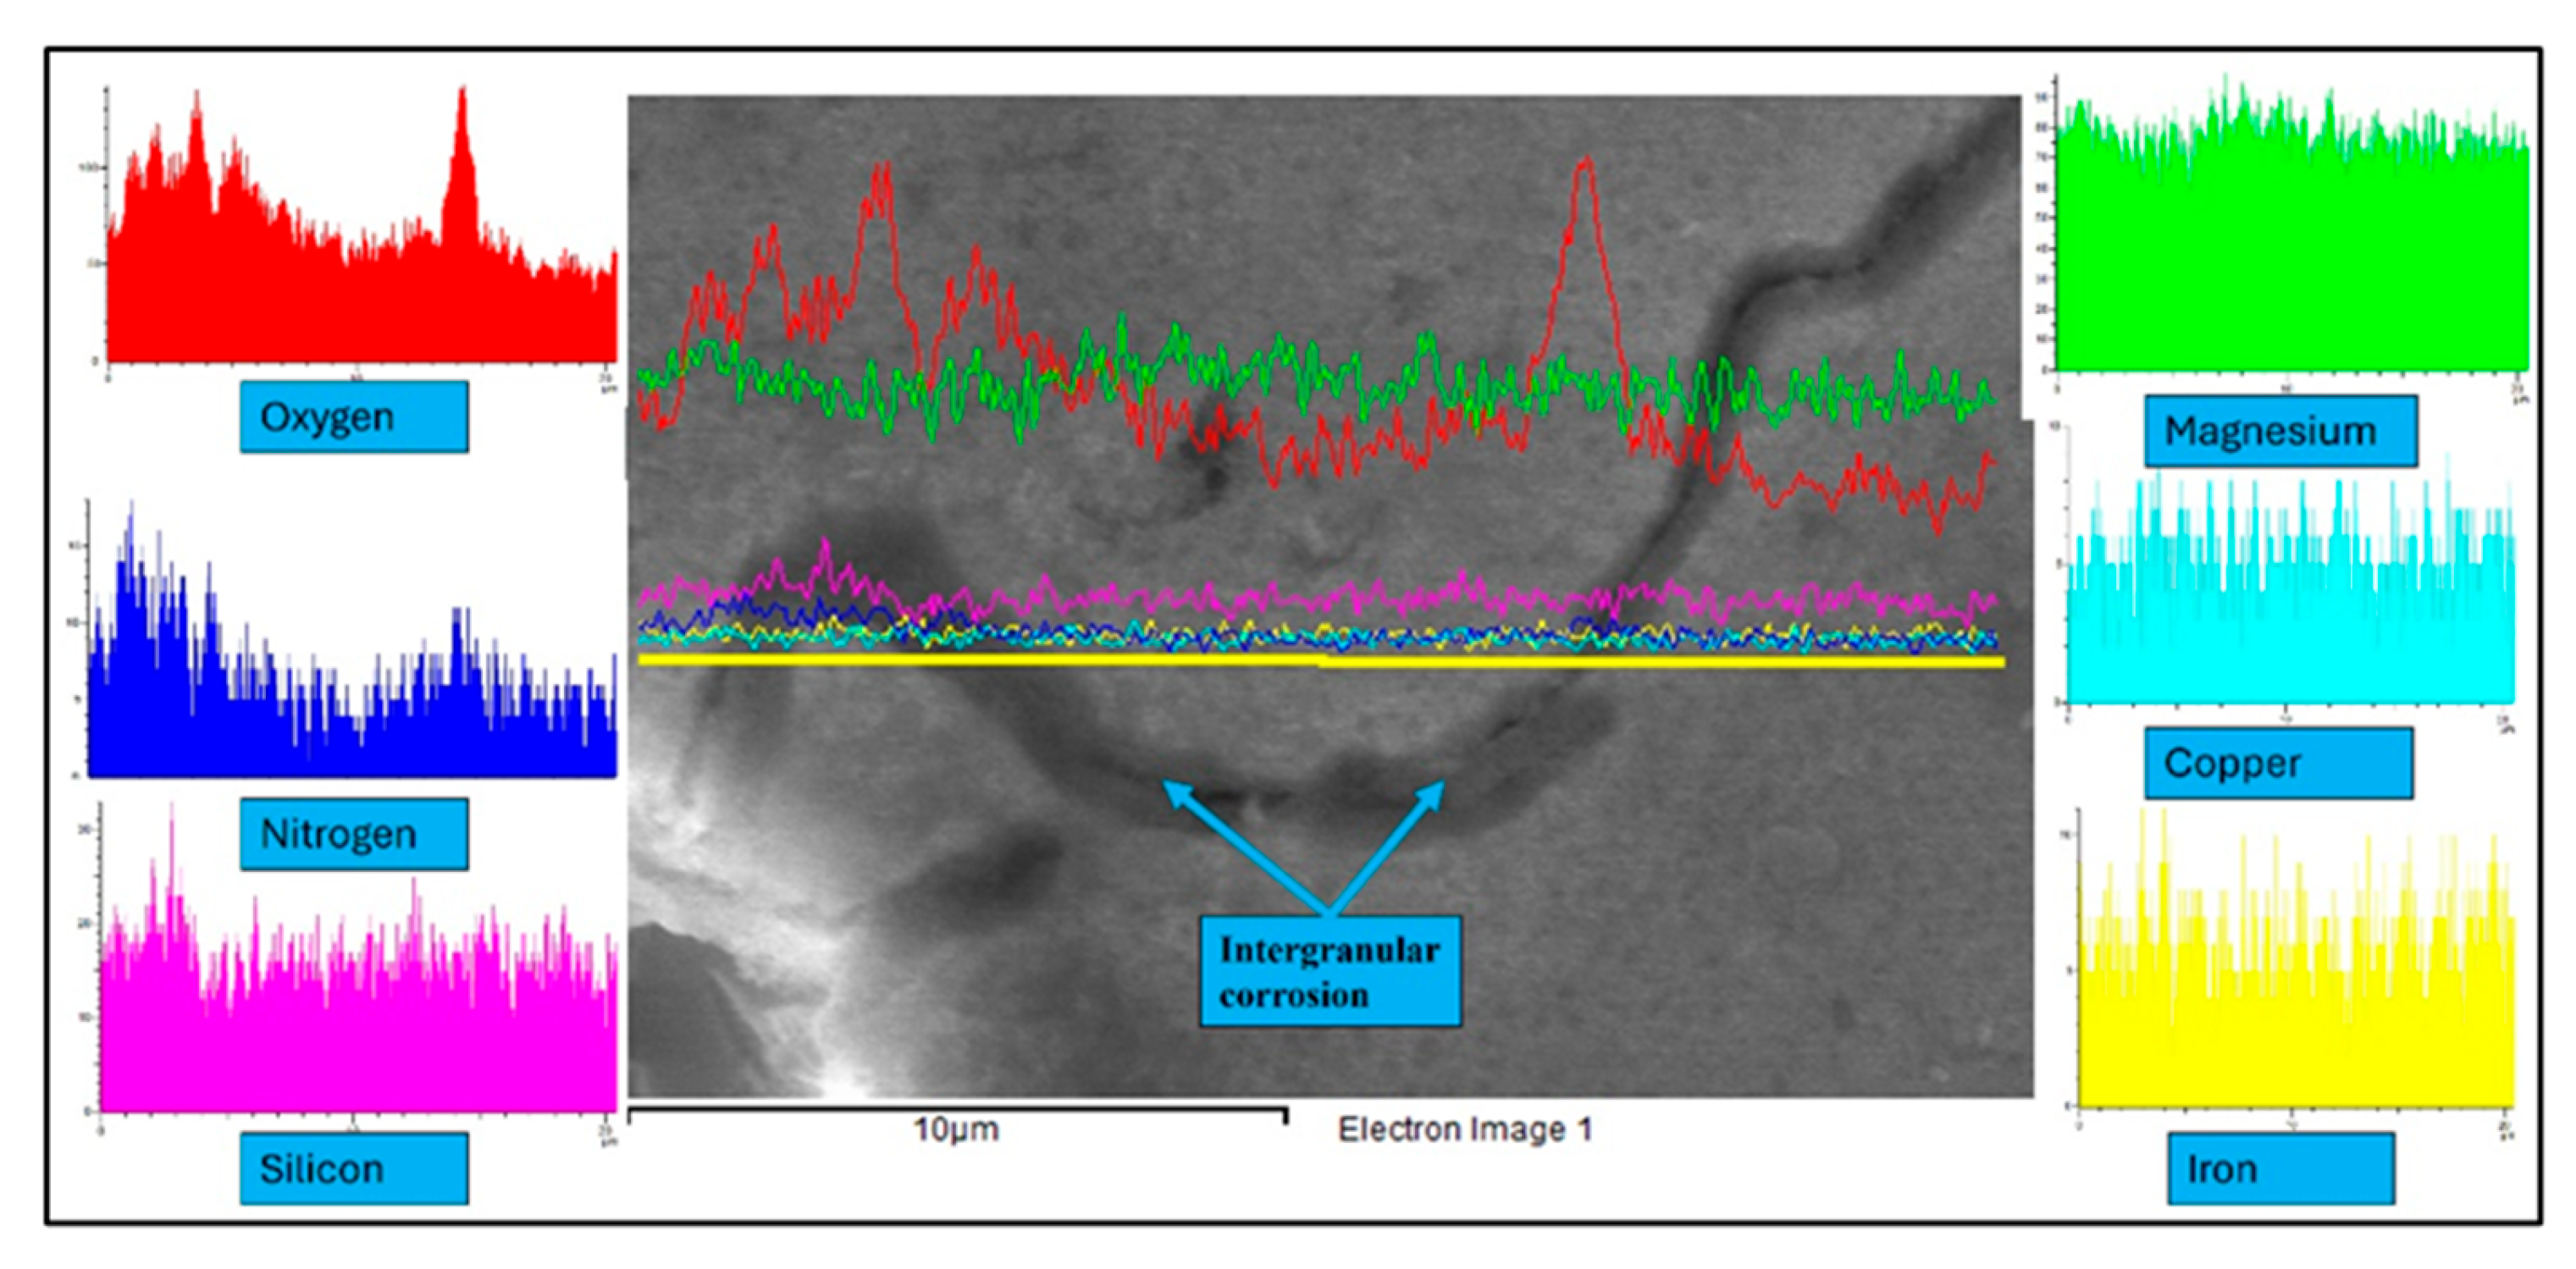
Figure 21.
Schematic diagram shows the steps for examination a cross-sectional sample.
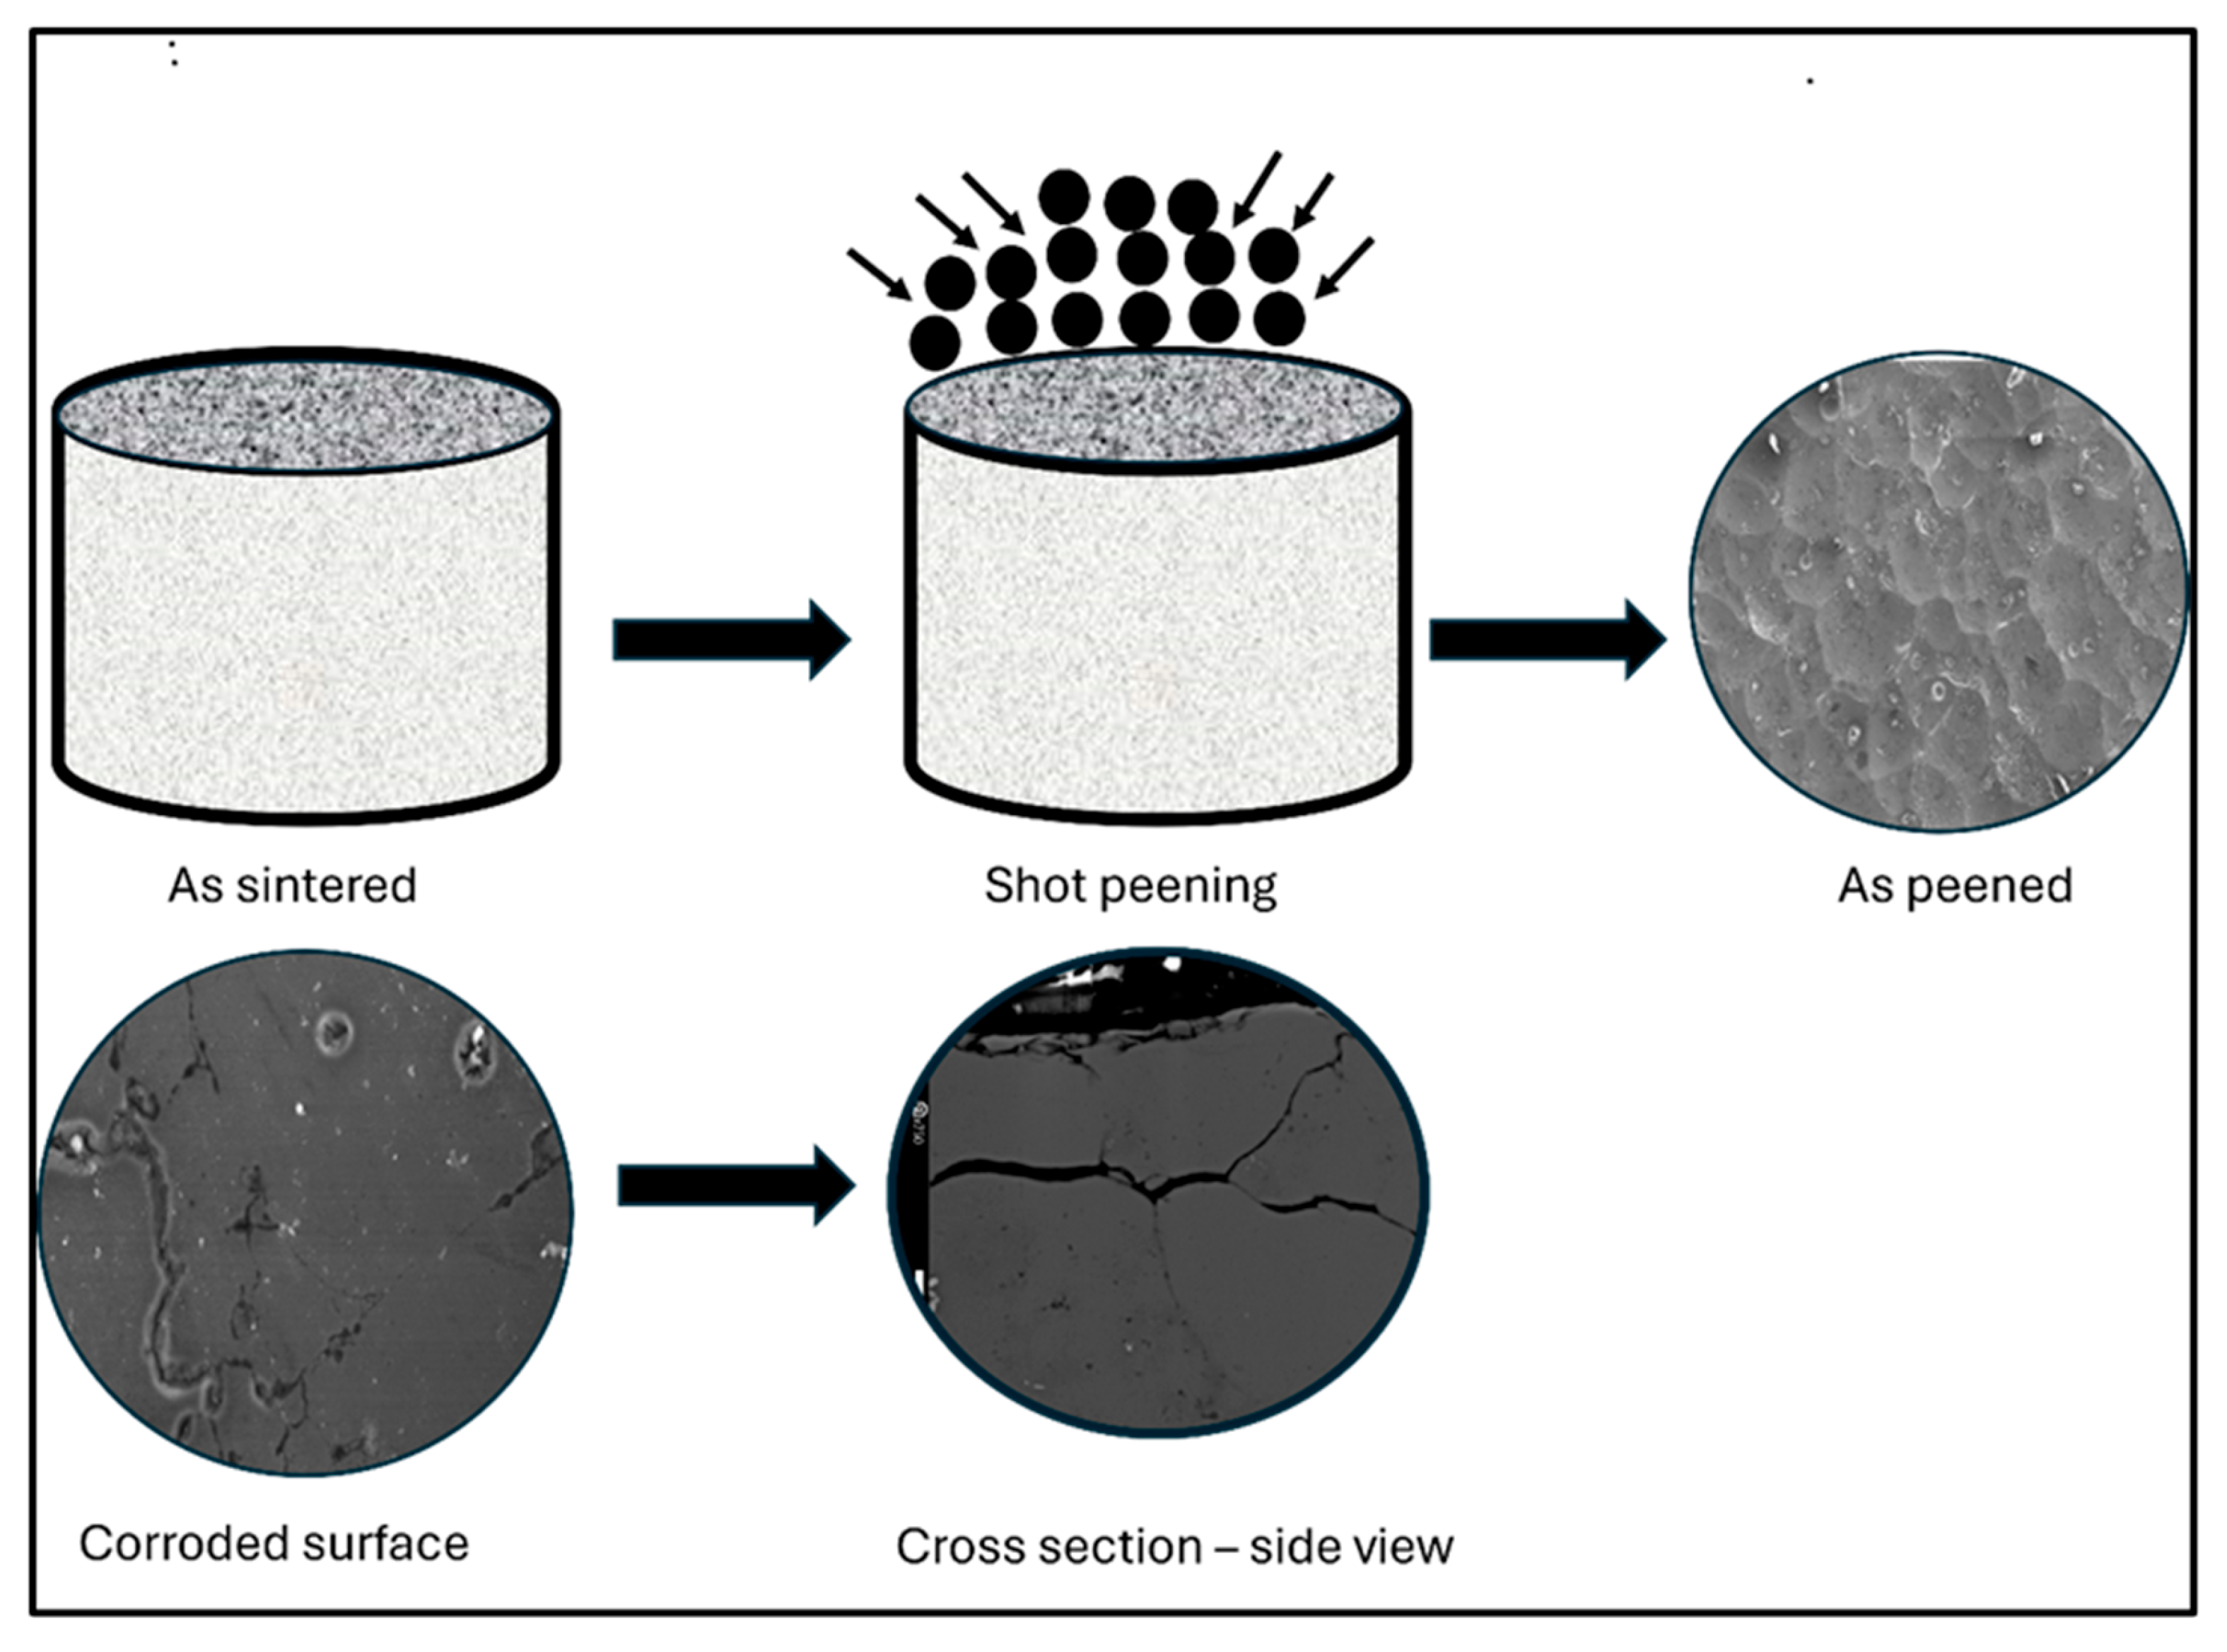
Figure 22.
(a) SEM micrograph through a cross section of corroded Alumix 321 PM alloy; (b) EDS spectrum acquired from the inter granular zone, denoted by X.
Figure 22.
(a) SEM micrograph through a cross section of corroded Alumix 321 PM alloy; (b) EDS spectrum acquired from the inter granular zone, denoted by X.
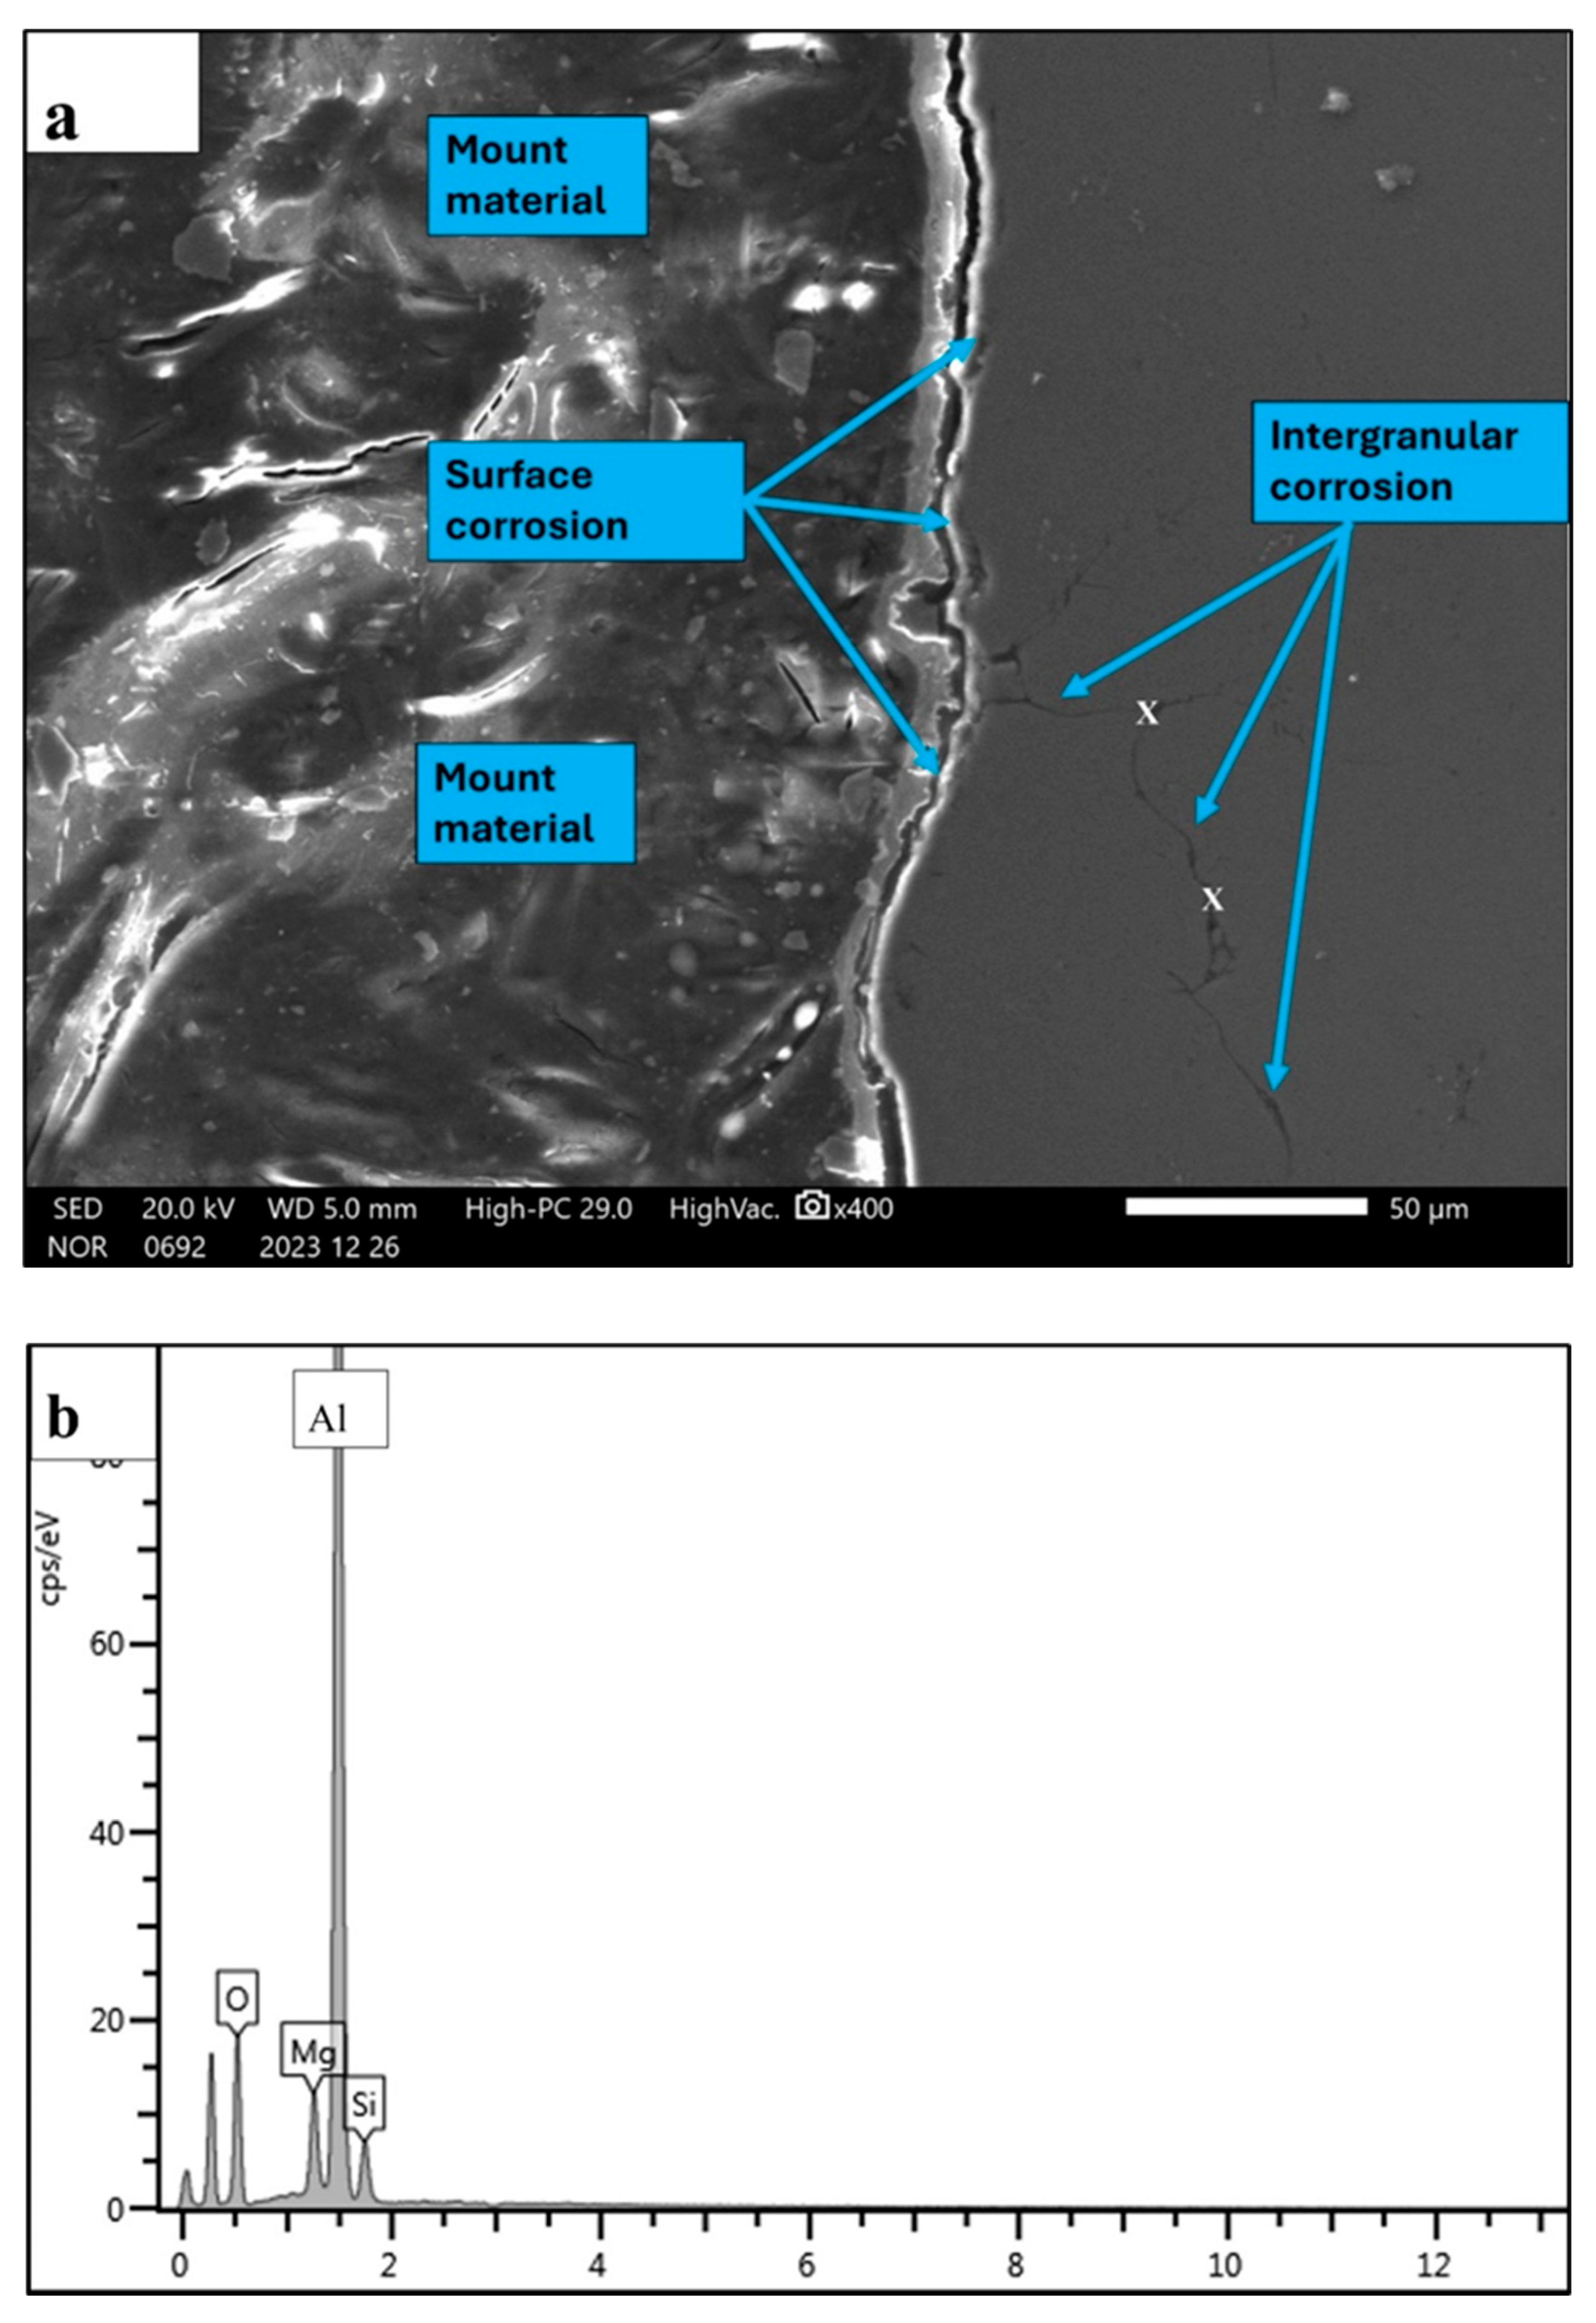

Table 1.
Chemical analysis of as received Alumix 321 raw powder.
| Element | Mg | Si | Cu | Fe | Bi | Sn | V | Al |
| Wt-% | 1.31 | 0.5 | 0.32 | 0.10 | 0.01 | 0.03 | 0.01 | Bal |
Table 2.
Corrosion parameters of the alloys investigated.
| Corrosion parameter | OCP (V.vs.SCE) | Ecorr (V vs.SCE) |
Epit (V vs.SCE) |
Epit -SSP (V vs.SCE) |
Corrosion Current | Corrosion rate (mmpy) |
| Alloy | density (A.cm-2) |
|||||
| AA6061 | -0.736± 0.004 |
-0.714± 0.003 |
-0.714± 0.003 |
------- | 1.77X10-06 | 0.019 |
| Alumix 321 (un-peened) |
-0.753± 0.005 |
-0.719± 0.016 |
-0.714± 0.004 |
-0.711±0.05 | 7.86 X10-06 | 0.079 |
| Alumix 321 (shot peened) |
-0.769± 0.020 |
-0.762± 0.025 |
-0.716± 0.011 |
-0.690±0.03 | 3.20 X10-07 | 0.004 |
Table 3.
Fitting paramters for Alumix 321 PM , and shot peened Alumix 321 PM alloy.
| Material | Rs Ω cm2 |
Rpo Ω cm2 |
CPE | Rct Ω cm2 |
CPE | ||||
| Ypo μsnΩ−1cm-2 |
n | Yct | n | W μsnΩ−1cm−2 |
|||||
| Alumix 321 PM Unpeened | 6.92 | 6830 | 24.42 | 0.901 | 9754 | 281.3 | 0.991 | 7.46 | |
| Alumix 321 PM Shot peened | 7.98 | 1311 |
155.8 | 0.757 | 12400 | 101.1 | 0.746 | 264.9 | |
Disclaimer/Publisher’s Note: The statements, opinions and data contained in all publications are solely those of the individual author(s) and contributor(s) and not of MDPI and/or the editor(s). MDPI and/or the editor(s) disclaim responsibility for any injury to people or property resulting from any ideas, methods, instructions or products referred to in the content. |
© 2025 by the authors. Licensee MDPI, Basel, Switzerland. This article is an open access article distributed under the terms and conditions of the Creative Commons Attribution (CC BY) license (http://creativecommons.org/licenses/by/4.0/).
Copyright: This open access article is published under a Creative Commons CC BY 4.0 license, which permit the free download, distribution, and reuse, provided that the author and preprint are cited in any reuse.


