
Submitted:
29 December 2025
Posted:
31 December 2025
You are already at the latest version
Abstract
The importance of the infrastructure is associated with the value of the infrastructure, the greater the importance of infrastructure, the greater its value. The concept of the importance of road infrastructure can take on a different value instead of different points of view. For example, roads can be evaluated from an economic, social, political, and military, among others. In 2021, the Lazio Regional Road Authority (ASTRAL) requested assistance from the Research Center for Transport and Logistics (CTL) to develop a composite scoring index (Regional Index, Ri) that would rank the relative importance of ASTRAL–maintained roadway network. The Ri index is expressed numerically between values from 1 to 5 (with 5 representing the highest importance). It includes the following variables: Population density, AADT, road traffic crashes, accessibility to point of interest, maintenance cost, air emissions, and noise pollution. The methodology includes the following steps. First, the variables were selected on the basis of their reliability, measurability, coverage and relevance to the phenomenon to be measured. Then, the data collection and normalization of the variables on a scale of 1 to 5 were carried out. Subsequently, through a multicriteria analysis, the variables were weighted and added. Finally, a sensitivity analysis was performed to evaluate which variables had the most influence on the final output of the formula. The methodology proposed has been implemented on the Region Lazio roadway network in order to obtain the Ri of the road segments.
Keywords:
road management
; infrastructure index
; road composite index
; road assessment
1. Introduction
The Rapid growth and development of the roadway infrastructure leads to larger road networks that need to be maintained and higher maintenance expenses to keep them in adequate condition. Limited funds and higher numbers of deteriorated roads require experts to be careful when allocating resources for road reconstruction. As expenses to keep roads in adequate condition increase, it is important to disburse limited funds carefully and efficiently. In a study conducted by [1], the authors emphasize the importance of efficient allocation of limited funds due to increased challenges in maintenance and rehabilitation of roadway infrastructure.
The importance of the infrastructure is associated with the value of the infrastructure, the greater the importance of infrastructure, the greater its value. The concept of the importance of road infrastructure can take on a different value instead of different points of view [2]. For example, roads can be evaluated from an economic, social, political, and military, among others (Figure 1).
From the transport point of view, the value of a road is relevant for the movement of goods and people. The importance of a section of the road network depends mainly on the importance of the places that are connected by the road element itself [3]. This aspect is captured by the functional classification of the road network which defines the categories of roads with reference to various criteria such as the measures of the average daily traffic, the size of the cities that the roads connect and the importance of the key places that the roads serve as airports, seaports, hospitals or tourist sites. These criteria reflect the economic and social dimensions, recognizing the economic and place function of roads. Regarding the type of vehicle, from the point of view of infrastructure, different studies have pointed out the differences between passenger cars and heavy vehicles [4].
In this regard, [5] proposed a method for ranking relative importance of structures to Virginia’s Roadway Network, administered by the Structure and Bridge Division of the Virginia Department of Transportation (DOT). The index does not consider the condition or age of the infrastructure, i.e., not the maintenance needs, but informs decision makers about the connection a structure provides in the road system. It provides the relative importance of infrastructure in moving people and goods on the road network. The index considers the following explanatory variables: the total annual average daily traffic (AADT); the AADT of heavy vehicles; the annualized growth rate of the AADT, to capture the evolution of traffic on the road and therefore the role that the road will have in the near future; the “bypass” impact indicator, which provides a measure of the costs that the user must bear if the section is closed, and the accessibility impact indicator, in terms of points of interest (number of hospitals, schools, fire stations) in the vicinity of the section in question.
On the other hand, [6] proposed the theoretical framework focuses on the relationship between the street, the related activities that produce goods and services, and the resources consumed to generate those goods/services. The focus is not on the efficiency of the transport network, which has a different objective (for example: optimal speed, road safety, travel times, accessibility, among others), focusing on the importance of the road for the economic activities of the area crossed. The theoretical framework is based on three types of indicators deemed relevant to understand the importance of a road: Input indicators, output indicators, and productivity indicators.
In Italy, the Ministerial Decree of June 14, 1965, and later revisions established the “Ki” coefficient in relation to the importance of highways of national interest managed by ANAS (National Road Authority). The Ki is defined as “the coefficient of increase relating to the importance of the road, already in use for fuel systems, referred to in D.M. 14.06.1965 and subsequent updates, which are commensurate on a scale from 1 to 5, in relation to the importance of the road, the distance of the inhabited centers, and the importance of the same”. The coefficient Ki is one of the parameters for determining the fees for concessions: Crossings (transverse and longitudinal, underground, and aerial), advertising along or in view of roads, and commercial access with attached fuel distributor systems. ANAS updates and publishes the formulas and a series of accompanying tables with dedicated provisions for the relative calculation of these concession fees. However, the basic assumption behind the idea of transferability is that “what proved to be effective in a place may be also useful in another place” [7], but the translation of this concept into practice is more challenging and, in some cases, even complex [8]., the full methodology for calculating Ki has not yet been published.
Thus, the objective of this paper is to present the proposed methodology to calculate a composite score index (Regional Index, Ri) that would rank the relative importance of ASTRAL–maintained roadway network (RVR).
2. Methodology
This section gives an overview of the methodology proposed to rank the relative importance of Lazio roadway network (Figure 2). The process started with the selection of the variables. The regional Ri coefficients are functional to the evaluation of the cost of some appurtenances of the road such as private accesses and billboards. In addition to the importance of the road and the insistent traffic, there are other factors that can influence the value of the regional Ri. For example, due to the possible link with road accidents as a source of distraction, signage should be prohibited or limited on sections with a high risk of accidents. The variables were selected among those adopted for classification and on the basis of their reliability, measurability, coverage and relevance for the phenomenon to be measured. Next, the dataset was prepared. In addition to the RVR network, for which information is already available, further sections of the ANAS network were evaluated to be included in the analysis to be used in the subsequent phase of comparison with the ANAS Ki values. Then, the variables were normalized according to the 1-5 scale to make them comparable. The analysis considered the normal distribution of the variables. After that, weighting and aggregation of the variables was performed. Weights were defined through multi-criteria analysis. Finally, a sensitivity analysis was carried out to evaluate the different variables considered, analyzing which are the ones that most influence the final output.
2.1. Selection of the Variables
The goal of the work is to create a regional surcharge coefficient Ri that includes more than only features linked to the road’s functional relevance and takes into consideration other elements. To achieve this, it is thought to be helpful to relate the concept of "road value" to the Ri coefficient, which can thus capture elements related to the resources used to produce the transportation service and to the costs incurred by users and non-users connected to the externalities of the road.
It is assumed that the value of a road is linked to two main concepts: functional importance and transport costs, based on what has been reported in the literature, for the purpose of identifying the variables that contribute to the value of a road section expressed as Ri, “regional increase coefficient”. The greater the functional importance of the road, the greater its value. And, the higher the costs of road transport, the higher the value of the road.
Road transport costs can be divided into three components: user input costs, infrastructure and maintenance costs, and the costs of negative externalities [9]. In addition to transport, the road can provide access to additional services, the presence of which increases their value. The services can be related to transport (for example a rest area or a service station) or not related (for example access to different commercial activities) For the end user, that is, those who use the road to get around, the value depends on the level of service, accessibility, travel comfort, the presence of additional services and the level of safety.
Figure 3 illustrates the theoretical reference framework for calculating the increase coefficient Ri.
The choice of each factor is based on the evaluation of the one able to best measure the variable identified in the theoretical model also on the basis of the data actually available within the project.
2.2. Preparation of the Dataset
Data collection constitutes the most time-consuming activity during the calculation of the index [10]. This operation required the division of the road network into road segments, the acquisition of the data necessary for the calculation of the factors and the processing of the data in order to prepare the set of data useful for the calculation of the composite index Ri.
2.2.1. Road Segments
The road graph was taken from OpenStreetMap. The RVR on the graph has over 4000 road arcs. The average arc length of the RVR on this graph is about 250 m. For the purpose of practical use of the Ri coefficients, it was decided to significantly reduce the number of road arcs of the graph.
For the aggregation of RVR arcs, the following criteria were used: A road segment must be at least one kilometer long, the beginning and end of a road segment must be an intersection of regional level or higher, a road segment is delimited by crossing of an inhabited center (sign of beginning/end of the inhabited center).
At the end of the aggregation, 262 road segments belonging to the RVR with an average length of 6 kilometers were obtained. 28 road segments of the ANAS network have been added to this list for which the Ki coefficients are known for comparison purposes.
2.2.2. Annual Average Daily Traffic (AADT)
The annual average daily traffic (AADT) for 2020-2021, for the category of passenger cars and heavy vehicles was estimated using TransCAD. The sample O-D matrices of a typical weekday were reconstructed, using as input: FCD data broken down by type of vehicle (passenger/heavy) relating to a weekday, and traffic counts carried out on the RVR in October 2020 and in the months of March, April, May and June 2021 divided by type of vehicle (passenger/heavy). For five road segments (SR 666 of Sora (ID 2), SR 509 of Forca di-Acero (ID 3), SR 509 (ID 4 and ID 5), and SP 151 Strada Ortana (ID 339656)), it was not possible to estimate the traffic flow. Overall, therefore, 257 road segments were subjected to analysis.
2.2.3. Attraction Built Up Areas
The indicator provides a measure of the importance of inhabited centers served by a road. It is calculated as the sum of the population of the inhabited centers that fall within a strip of two kilometers from the road axis of the road segment considered. The population and localization data of inhabited centers were acquired from Istat (Italian National institute of Statistics). The data on the population refers to 1 January 2021.
2.2.4. Accessibility to Point of Interest
The indicator is calculated as the number of points of interest that fall within a band of one kilometer from the road axis of the road segment analyzed. The points of interest examined are hospitals, schools and fire stations. The points of interest data were sourced from the OpenStreetMap geographic database.
2.2.5. Number of Road Traffic Crashes
A road traffic crash results from a combination of several factors, in particular, the accident risk, in terms of repeatability, localization, and severity, is related to three concurrent factors: infrastructure, vehicle, and human factors [11]. However, linking the crash causation factors and countermeasures is not simple and must be carefully considered [12]. The indicator expresses the road traffic crashes with injuries per kilometer and refers only to road traffic crashes with injuries. There is no obligation to notify the police in the event of a road accident without injuries and these, being highly underestimated, were not considered for the purposes of the analysis. The data relating to road traffic crashes with injuries in the three-year period 2018-2020 were acquired by the Road Safety Monitoring Center of the Lazio Region (CEREMSS).
2.2.6. Traffic Emissions
Traffic emissions depend on the type of vehicle, the fuel used, the state of the engine and the driving speed [13,14]. Therefore, the information necessary for the development of traffic models is the composition of the vehicle fleet in circulation and the distances traveled.
In order to obtain average emission factors for the two vehicle types under examination, reference was made to the most up-to-date value of the ISPRA database of average emission factors for road transport in Italy, estimated using the COPERT software version 5.2.2. The average emission factors of each pollutant had been considered for the two types of vehicles, passenger cars and heavy vehicles referred to the extra-urban area.
The pollutants analyzed in COPERT are 10: NOx, N2O, SOx, CH4, CO, CO2, NH3, NMVOC, Pb and particulate matter (PM). For the purposes of this study, the following pollutants were considered: CO, HC, Nox and PM.
The annual emissions on each road segment were calculated using the following equation:
Daily emission [g] = Emission factor [g/km veh] * Number of vehicles [veh] * Kilometers per period [km]
2.2.7. Noise Pollution
The NMPB standard (Nouvelle Methode de Prevision de Bruit) Routes 1996 was used for the estimation of noise emissions from vehicular traffic since a standard model for this type of assessment has not been developed in Italy. The NMPB Routes 96 model was applied to each road segment assuming acoustic homogeneity within each segment considered. Each road segment has been assigned a single LAwi sound power level value. Equation 2 was used to obtain the LAwi sound power level on each road segment.
LAwi = [(EVL + 10 LogQVL) ⊕ (EPL + 10 LogQPL)] + 20 + 10 Log(li) + R(j)
Where: EVL and EPL are the noise emission levels for passenger cars and heavy vehicles which can be obtained from the abacus of the Guide du Bruit; QVL and QPL are the AADT of passenger cars and heavy vehicles respectively; li is the length of the I road segment expressed in metres; R(j) expressed in dBA is the value of the A-weighted normalized road noise spectrum and tabulated according to the octave band; and ⊕ represents the energy sum symbol.
2.2.8. Operation and Maintenance Cost
According to Yarmukhamedov & Swärdh [15], the operating and maintenance costs largely depend on the length/surface of the road and the total length of the existing buildings (bridges, viaducts, and tunnels). In the context of this study, these two variables were used to estimate the operating and maintenance costs, the total area of the section in square kilometers and the total length of the existing buildings present along the section of the road segments were considered.
The data relating to the width of the RVR roads and the lengths of viaducts, bridges and tunnels were acquired from ASTRAL. For each road section, the following were therefore calculated:
- the values of the surface area of the section, in square kilometers, by multiplying the average width of the road section with its length;
- the values of the total length of the buildings (bridges, viaducts and tunnels).
2.3. Normalization
The normalization required the adaptation of the values of the indicators, measured on different scales, to a common scale from 1 to 5. For example, the AADT raw values for passenger cars were organized in percentiles of order 10, 20, 30, 40, 50, 60, 70, 80, 90 and 100. Subsequently 10 values on the scale from 1 to 5 were assigned to each of the 10 intervals. From the trend line a continuous function was determined for increasing values of the indicator. AADT values less than 531 were assigned a normalized value of 0, while values greater than 11,722 were assigned a normalized value of 5.0 (Figure 4). The percentiles were calculated from the collected data for all the factors.
2.4. Weighting and Aggregation
The Analytic Hierarchy Process (AHP), introduced by Saaty [16], is a tool that allows individuals to rationally weigh attributes and evaluate the alternatives presented to them. The assignment of weighting factors makes it possible to determine which groups of factors are considered more important than others by ASTRAL’s experts.
In AHP, pairwise comparisons are made with judgments that use numerical values to evaluate the relative importance of an attribute. Relative importance is coded as follows:
- 9: Extremely more important (or extremely less important)
- 7: Much more important (or much less important)
- 5: Most important (or least important)
- 3: Slightly more important (or slightly less important)
- 1: Equally important
- 2, 4, 6, and 8 are intermediate values.
A survey was then conducted involving seven ASTRAL experts out of 10 contacted. The data processing of the questionnaires was carried out using the "ahpsurvey" package of the "R" statistical software.
2.5. Sensitivity Analysis
Sensitivity analysis is used to quantify the effects of key study variables on outcomes. In the specific case, the impact on the regional composite index Ri was assessed as the indicators that make up the index varied. A reference scenario formed by the median values of each indicator was defined. The next step was to select pairs of indicators and define the input values to be tested based on the order percentiles 10, 20, 30, 40, 50, 60, 70, 80, 90 and 100. The value of the index Ri as the two indicators vary. For each pair of factors, the minimum and maximum deviation from the reference median value was calculated.
3. Results
Once the methodology has been defined, it has been applied to the RVR network in order to calculate the Ri on the 257 road segments. The regional Ri coefficient was calculated according to the following equation.
Ri= [WF ×[(wAADTl×UAADTl)+(wAADTp+UAADTp)+(wPOI×UPOI)+(wPOP×UPOP)] ]
+ [WC×[(wACC×UACC)+(wnoise+Unoise)+(wEmis×UEmis)+(wMain×UMain)] ](3)
+ [WC×[(wACC×UACC)+(wnoise+Unoise)+(wEmis×UEmis)+(wMain×UMain)] ](3)
Where: Wf = Weight of functional Importance (0.304); Wc = Weight of Transportation Cost (0.696); wAADTl = Weight of AADT for passenger cars (0.189); UAADTl = Categorization of AADT for passenger cars; wAADTP = Weight of AADT for Heavy (0.344); UAADTp = Categorization of AADT for Heavy vehicles; wPOI = Weight of Point of Interest (0.181); UPOI = Categorization for Point of Interest; WPOP = Weight of Population (0.286); UPOP = Categorization of Population; WAcc = Weight of Accidents (0.058); UAcc = Categorization of Accidents; wnoise = Weight of Noise Pollution (0.541); Unoise = Categorization for Noise Pollution; Wemis = Weight of Emission Pollutants (0.207); Uemis = Categorization for Emission Pollutants; W main = Weight of Maintenance Cost (0.195); and U main = Categorization of Maintenance Cost.
Figure 5 shows the number of road segments per final score of the regional Ri index considering intervals of 0.5 points. It was observed that out of 257 road segments belonging to the RVR, 44 segments (17.9%) received final scores above 4 on the 1 to 5 value scale. On the other hand, 17 segments (6.6%) have a Ri score between 1 and 1.5.
3.1. Comparison with National Ki Values
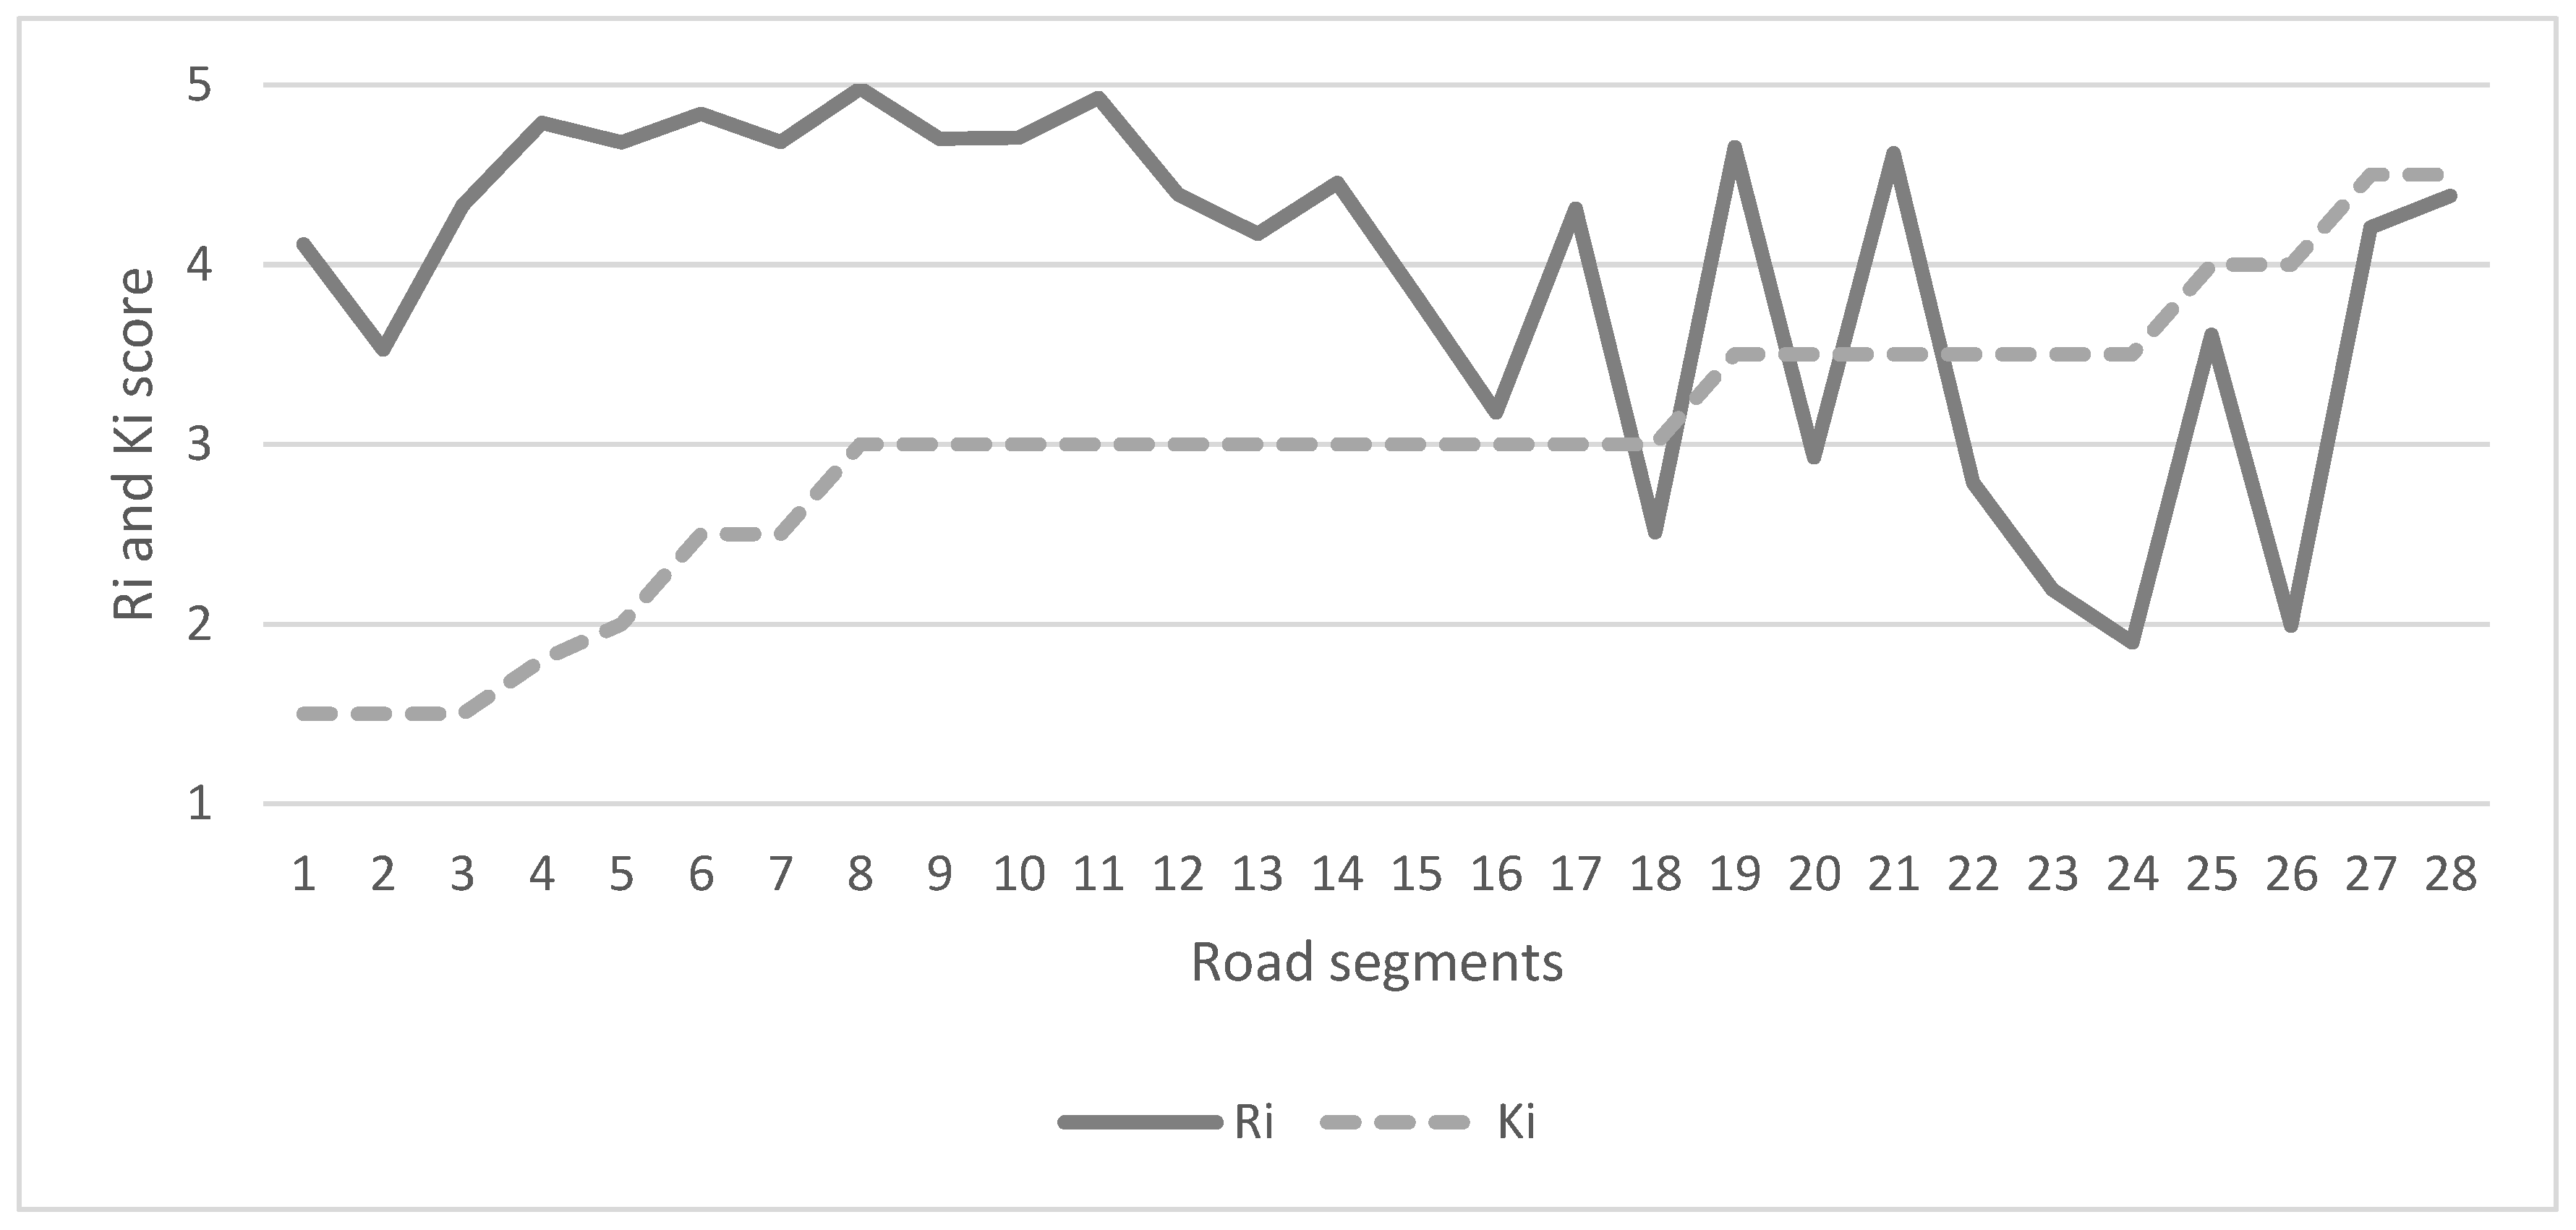
In order to make a comparison with the National Ki values (ANAS), 28 road segments of the ANAS network were included during the process. For these road segments, the value Ri was calculated so that they can be compared with Ki. Figure 6 shows the results of this comparison.
In general, no correspondence was observed between the two indicators Ki and Ri. For Ki values equal to or lower than 3, Ri values between 4 and 5 were observed. For Ki values greater than 3, the difference is on average smaller.
4. Discussion and Conclusions
This research was conducted to develop a composite scoring index (Regional Index, Ri) that rank the relative importance of ASTRAL maintained roadway network (RVR). The Ri index is expressed numerically between values from 1 to 5 (with 5 representing the highest importance). The regional Ri index concept connects the value of a road infrastructure to its use / function and transportation costs in terms of atmospheric and noise emissions, road traffic crashes, and management and maintenance costs.
If factors such as population density do not remain constant, the importance values assigned to each road segment can change over time. Road condition assessments will decline at different rates, influencing prioritization results in the coming year. As a result, future research studies to evaluate and expand existing models to address the dynamics of the previously mentioned criteria may be recommended.
The methodology has been applied to the RVR network and the Ri has been calculated for 257 road segments. Finally, in order to make a comparison with the National Ki values (ANAS), 28 road segments of the ANAS network were included during the process. In general, no correspondence was observed between the two indicators Ki and Ri.
Author Contributions
The authors confirm contribution to the paper as follows: Conceptualization, B-GH and DS-U; methodology, B-GH and DS-U; formal analysis, B-GH and DS-U; data curation B-GH and DS-U; writing—original draft preparation, B-GH and DS-U; writing—review and editing, B-GH, DS-U and LP; supervision, LP; funding acquisition, DS-U and LP. All authors have read and agreed to the published version of the manuscript.
Funding
The study presented in this paper is part of the project titled “Technical and scientific support for the planning and management of regional transport systems”, funded by Lazio Region.
Data Availability Statement
Data will be made available on request.
Acknowledgments
None.
Conflicts of Interest
The authors declare no conflicts of interest. The funders had no role in the design of the study; in the collection, analyses, or interpretation of data; in the writing of the manuscript; or in the decision to publish the results.
References
- Gupta; Kumar, P.; Rastogi, R. Pavement deterioration and maintenance model for low volume roads. Int. J. Pavement Res. Technol. 2011, 4, 195. [Google Scholar]
- K. Opara, Road asset evaluation models, Inst. Badań Syustemowych Pol. Akad. Nauk. Warsaw, Pol. (2012).
- Friedrich, M. Functional Structuring of Road Networks. Transp. Res. Procedia 2017, 25, 568–581. [Google Scholar] [CrossRef]
- González-Hernández; Llopis-Castelló, D.; Garcia, A. Operating speed models for heavy vehicles on tangents of two-lane rural roads. Adv. Transp. Stud. 2020, 50. [Google Scholar]
- Moruza, A.K.; Matteo, A.D.; Mallard, J.C.; Milton, J.L.; Nallapaneni, P.L.; Pearce, R.L. Method for ranking relative importance of structures to Virginia’s roadway network. Transp. Res. Rec. 2017, 2612, 20–28. [Google Scholar] [CrossRef]
- G. Stiven, M. Luen, C. Will, Measuring the value of the movement of people and goods to inform the One Network Road Classification functional categories criteria September 2016, 2016.
- Macário, R.; Marques, C.F. Transferability of sustainable urban mobility measures. Res. Transp. Econ. 2008, 22, 146–156. [Google Scholar] [CrossRef]
- González-Hernández; Meta, E.; Usami, D.S.; Cardoso, J.L.; Persia, L. Development of a methodology to transfer road safety good practices in African Countries. Adv. Transp. Stud. 2021, 55. [Google Scholar]
- H. Braconier, M. Pisu, D. Bloch, The performance of road transport infrastructure and its links to policies, OECD Econ. Dep. Work. Pap. (2013).
- González-Hernández, B.; Ngwah, E.C.; Usami, D.S.; Persia, L. In-built network-wide road safety assessment methodologies for rural roads. Traffic Inj. Prev. 2024, 1–7. [Google Scholar] [CrossRef] [PubMed]
- Elvik, R.; Vaa, T.; Hoye, A.; Sorensen, M. The handbook of road safety measures; Emerald Group Publishing, 2009. [Google Scholar]
- S.K. Fondzenyuy, D.S. Usami, B. González-Hernández, L. Brown, A. Morris, L. Persia, Developing improved crash prevention approaches through in-depth investigation of motorcycle crash causation patterns, Heliyon. (2024).
- Pant, P.; Harrison, R.M. Estimation of the contribution of road traffic emissions to particulate matter concentrations from field measurements: A review. Atmos. Environ. 2013, 77, 78–97. [Google Scholar] [CrossRef]
- Smit, R.; Ntziachristos, L.; Boulter, P. Validation of road vehicle and traffic emission models–A review and meta-analysis. Atmos. Environ. 2010, 44, 2943–2953. [Google Scholar] [CrossRef]
- Yarmukhamedov, S.; Swärdh, J.-E. Marginal cost of road maintenance and operation: Swedish estimates based on data from 2004 to 2014, Statens väg-och transportforskningsinstitut, 2016.
- Saaty, R.W. The analytic hierarchy process—what it is and how it is used. Math. Model. 1987, 9, 161–176. [Google Scholar] [CrossRef]
Figure 1.
Different perspectives on assessing the value of a road (Opara, 2012).
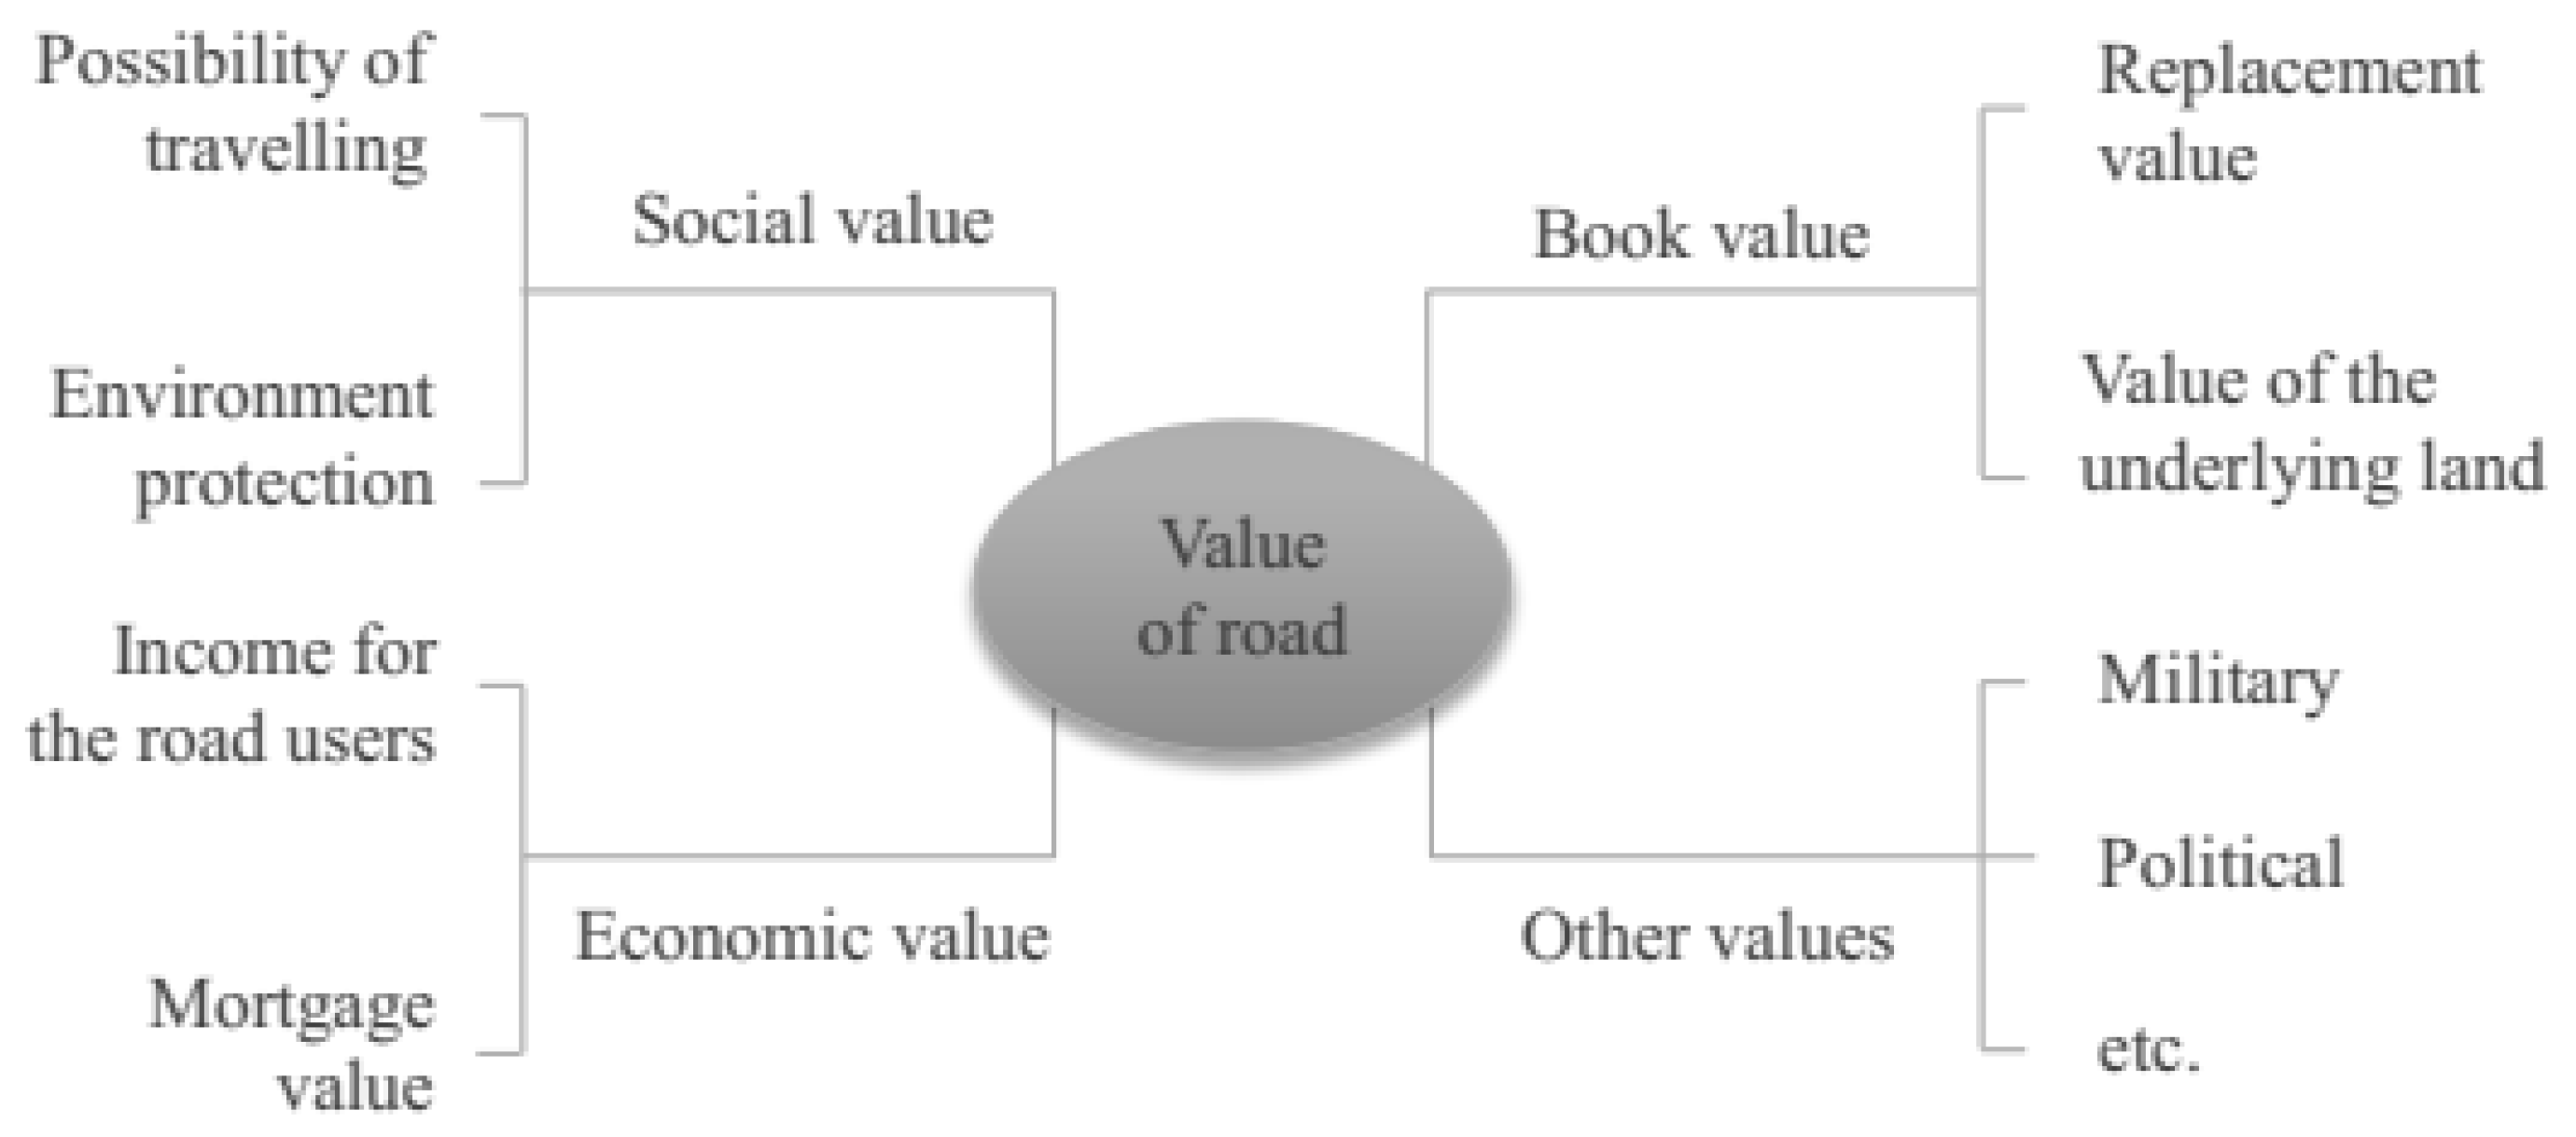
Figure 2.
Proposed Ri methodology.

Figure 3.
Framework of factors affecting the value of road.
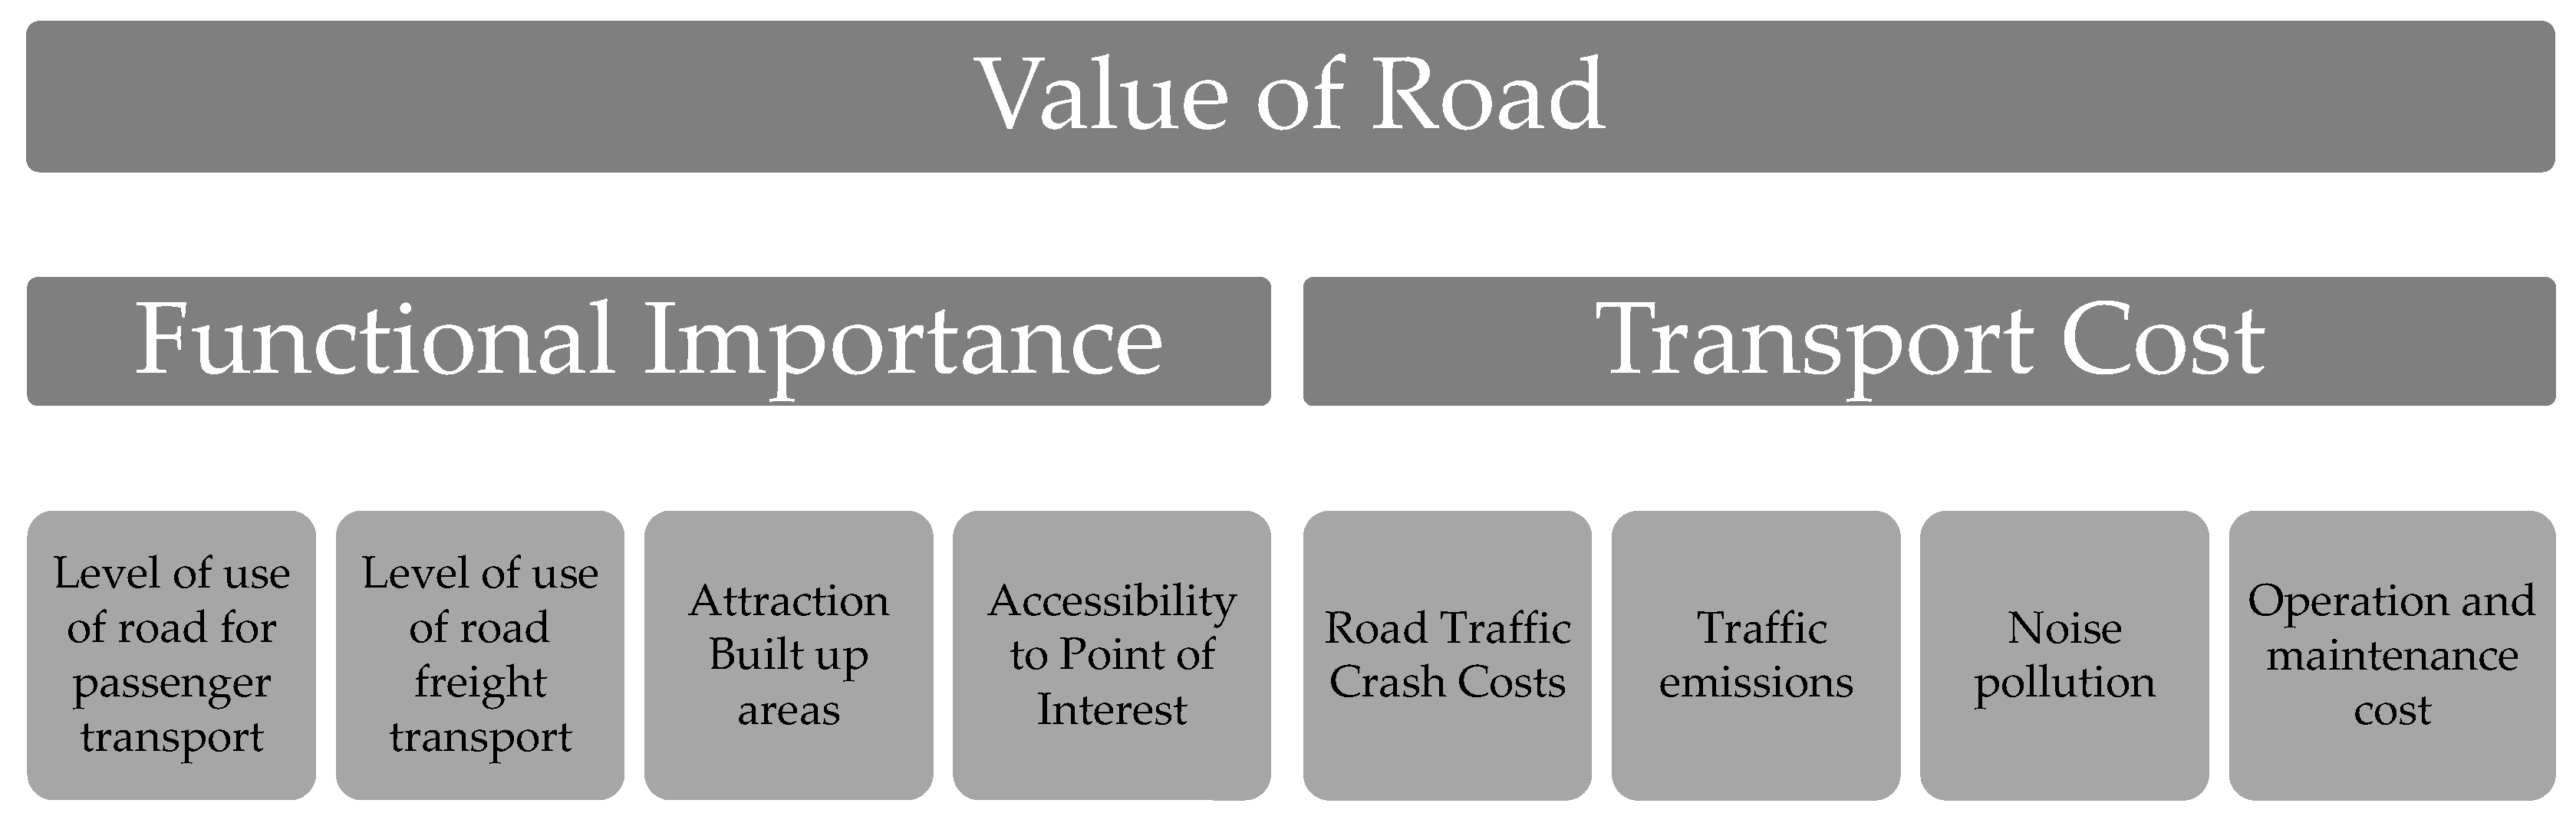
Figure 4.
Function for AADT of passenger cars factor.
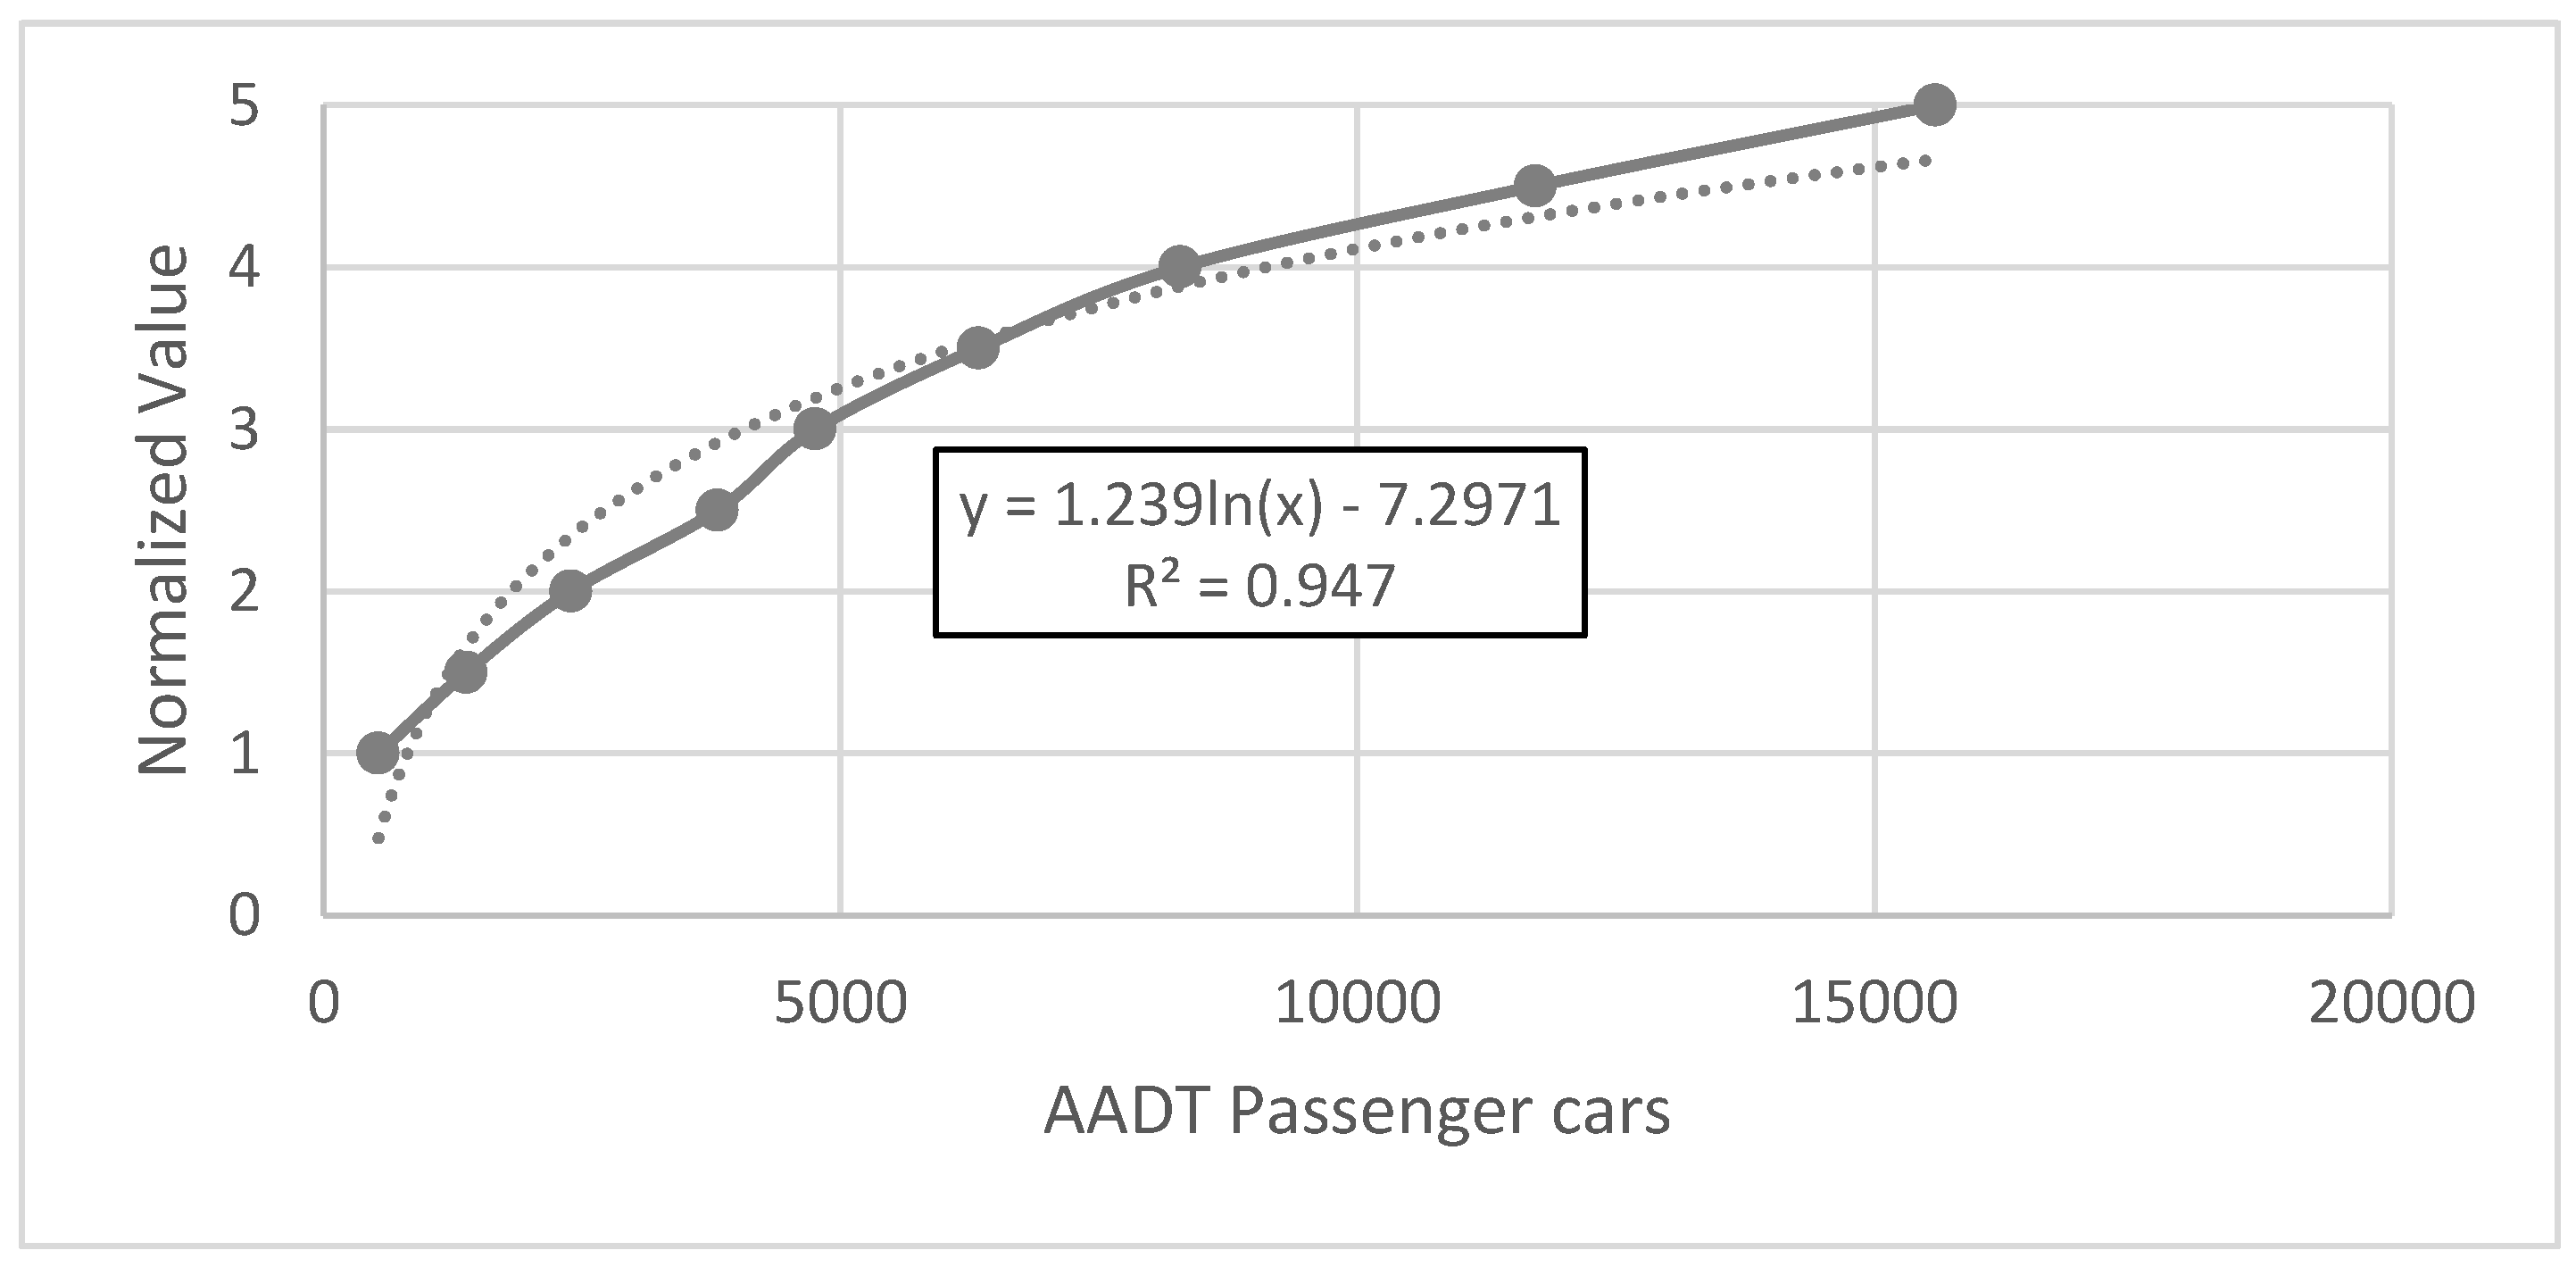
Figure 5.
Distribution of road segments by Ri values.
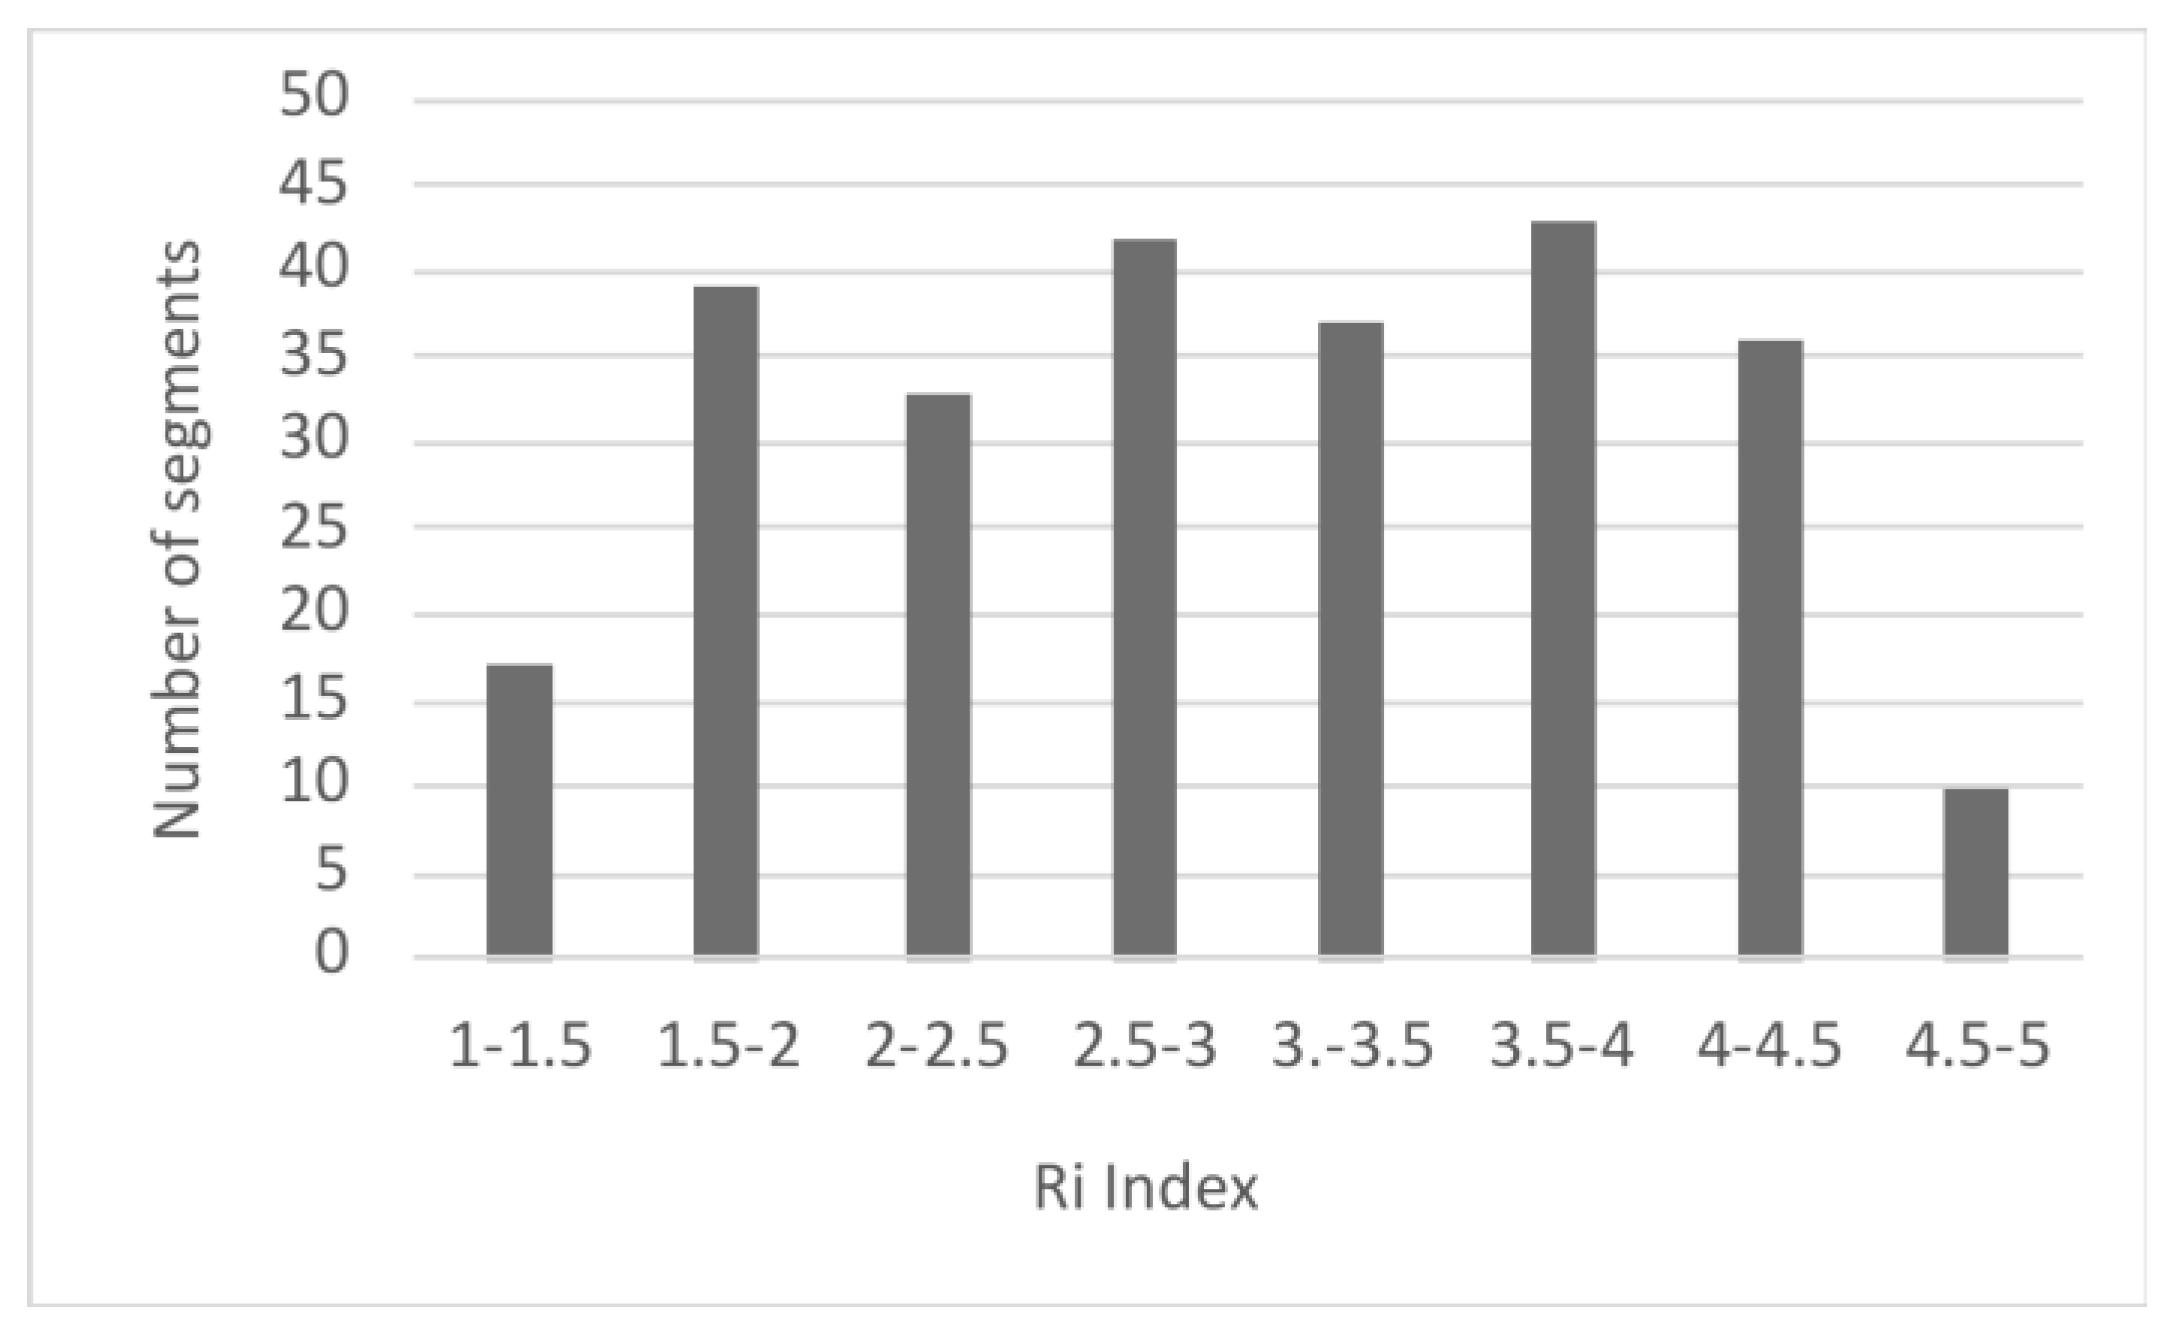
Figure 6.
Comparison of national Ki values with regional Ri values.
Disclaimer/Publisher’s Note: The statements, opinions and data contained in all publications are solely those of the individual author(s) and contributor(s) and not of MDPI and/or the editor(s). MDPI and/or the editor(s) disclaim responsibility for any injury to people or property resulting from any ideas, methods, instructions or products referred to in the content. |
© 2025 by the authors. Licensee MDPI, Basel, Switzerland. This article is an open access article distributed under the terms and conditions of the Creative Commons Attribution (CC BY) license.
Copyright: This open access article is published under a Creative Commons CC BY 4.0 license, which permit the free download, distribution, and reuse, provided that the author and preprint are cited in any reuse.


