Submitted:
29 December 2025
Posted:
30 December 2025
You are already at the latest version
Abstract
Hazard risk monitoring of groundwater depletion and land subsidence due to excessive groundwater extraction is crucial for groundwater resource development, especially in densely populated, small-island developing sites. The island of Bali, Indonesia, represents such an urban environment at risk of land subsidence arising from groundwater depletion. The total percentage of groundwater depletion was calculated and interpolated spatially using measurements of groundwater level from 2008 to 2017 at 18 monitoring well sites available in the area. Furthermore, time-series synthetic-aperture radar (SAR) interferometry processing was applied to estimate the temporal change in land displacement using the Phased Array type L-band SAR (PALSAR) data from 2007 to 2010. The result of downward displacement, signifying subsidence, corresponded with the Global Navigation Satellite System (GNSS) data measurements at stations distributed in the observed subsided areas, i.e., CDNP and CPBI. The displacement varied consistently with changes in groundwater level. In regard to maintaining groundwater utilization, the hazard–risk relation of the groundwater depletion, i.e., low (0–25%), moderate (25–50%), and high (>50%), and the presence/absence of subsidence were utilized to classify groundwater conservation into safe, vulnerable, critical, and damaged zones. This application can be considered effective in providing spatial information for sustainable groundwater management.
Keywords:
geoinformation
; groundwater depletion
; land displacement
; SAR remote sensing
; spatial data analysis
; water conservation
1. Introduction
In recent decades, groundwater has become one of the most important sources of water among the available resources throughout the world [1,2]. The importance of groundwater as a water resource is increasing as a result of the continuous growth of the global population, which is predicted to exceed 11 billion in 2100 [2]. Nevertheless, many cities are currently facing severe water resource instability [3], with developing and poor urban areas being the most vulnerable to such instability. A total of 21 of the world’s 33 megacities are located on the coast, and in Asia, for example, more than one billion people live within 100 km of the sea [4]. The impact of climate change on water resources and their management has already been seen in various regions around the globe [5]. In 2010, one-fifth of the world’s population, roughly 1.2 billion people, were living in areas with water scarcity. Following projected urban and industrial water use, this number will double to 2.4 billion by 2050 [4]. From these figures, it is clear that sustainable water resource management, particularly of groundwater, is critical to maintaining water demand. In many areas, a lack of management measures for groundwater utilization has led to the extensive over-exploitation of this resource, inducing groundwater depletion and thereby becoming a threat to the sustainable development of socioeconomic and ecological health [1,3].
Concerning groundwater resource management, the development and integration of pilot case studies on hazard–damage relationships at local or regional scales are essential to provide information for relevant agency managers and policy makers [6,7,8]. Despite its criticality, the relationship between hazards and damage is poorly studied [6]. Regarding the inter-correlation of water-related hazards with damage to land, such as land subsidence, it is considered advantageous as a parameter in assessing the phenomenon of groundwater depletion. Land subsidence can be defined as a geological phenomenon that causes a slow lowering of ground surface elevation [9]. One of the factors responsible for land subsidence is groundwater extraction [10,11]. Land subsidence also impacts groundwater, in that it reduces the capacity of aquifers to store water [12].
Land deformation measurements extracted from interferometric synthetic-aperture radar (InSAR) data processing [13,14] provide a method to estimate groundwater level, particularly in confined aquifers below the land surface [15,16]. Land deformation is the process of soil compression as a result of the increase in effective stress [17]. Groundwater extraction removes the water pressure that increases the effective stress developed by the soil skeleton, resulting in the compaction of aquifers and aquitards [17,18]. The elevation change of the groundwater surface is comparable to the total compaction throughout the confined aquifer system [9]; put simply, groundwater draw-down produces a time constant that delays compaction, which is expressed as subsidence of the ground surface above the aquifer. Therefore, land deformation measurements above a confined aquifer over time enable the estimation of the change in water level over that specific period [18]. Due to the lack of conventional groundwater level measurement owing to inherent shortcomings, InSAR-derived land deformation data present a novel technique that is efficient for producing information necessary for groundwater-related estimation.
The utilization of the InSAR technique, which facilitates measurements with centimeter-scale accuracy, makes it possible to assess deformation due to groundwater pumping activities. For instance, elastic storage coefficients have been effectively estimated using collocated InSAR and well measurements [19,20]. Furthermore, it was possible to perform a long-term analysis of aquifer system responses to pumping based on InSAR time-series analysis using the Persistent Scatterer (PS) method [21,22] and Small Baseline Subset (SBAS) method [18,23,24,25]. These methods highlight the advantages of the advanced InSAR technique for obtaining groundwater levels based on time-series land deformation measurements. Moreover, regarding the evaluation of InSAR results, centimeter-scale elevation accuracy can be achieved through measurement of continuous satellite navigation technology such as a Global Navigation Satellite System (GNSS) [26,27,28].
Groundwater is primarily supplied for domestic usage in urban areas and for irrigation in agricultural areas [2]. The application of InSAR can be challenging in different areas, such as urban and agricultural regions. Conventional InSAR processing encompasses decorrelation of the interferometric signal. Moreover, the characteristic electrical changes of scatterers lead to the appearance of temporal and geometric decorrelations. Time-series SAR interferometry represents an advanced technique of differential InSAR. It involves processing multiple SAR images acquired at different times over the same area through an effective data processing and analysis procedure to extract information on phase displacement from the other phase components [29]. The analysis enables a decrease in atmospheric and topographic errors to reduce signal decorrelation and residuals. The PS [30,31,32] and SBAS [33,34] methods of time-series InSAR have been mainly applied to the study of the temporal evolution of land deformation. These methods offer a temporal solution based on the principle of dominant reflectivity of centers of permanent scatterers to dilute the uncorrelated phenomena [31]. The PS method mainly records Persistent Scatterer (PSs) reflectors, such as those found in urban areas, whereas the SBAS method responds to Distributed Scatterers (DSs), which are typically found in agricultural regions [29]. Thus, the extracted measurement of subsidence distribution can be employed to evaluate groundwater level information in areas with wide area coverage.
In this study, the utilization of time-series InSAR to retrieve land displacement is proposed to assess the change in groundwater level in urban and agricultural regions on the island of Bali, Indonesia. Despite its importance, groundwater has become an issue on the island due to risks related to large-scale groundwater extraction [35,36,37,38,39]. Appropriate water management is crucial for sustainable groundwater development. Information regarding the groundwater condition, such as the water level, is fundamental for resource development strategies in the area [39]. In this regard, in this study, the distribution of land displacement generated from time-series InSAR processing using the PS and SBAS methods is integrated with the distribution of groundwater level interpolated from monitoring well site data in order to evaluate the correlation of land subsidence with groundwater depletion in the area. Geospatial information on groundwater depletion throughout Bali Province, Indonesia, is presented based on the analysis, with this information being essential for the development of groundwater utilization strategies for sustainable water management.
2. Materials and Methods
2.1. Study Area
The study area of Bali (Figure 1) extends from 8°03′140” to 8°50′48” S and 114°25′53” to 115°20′2” E. Administratively, as a province, Bali covers an area of 5632 km2, including surrounding smaller islands, i.e., Nusa Penida, Nusa Lembongan, Nusa Ceningan, Serangan, and Menjangan. The area consists of Denpasar City as the provincial capital and eight regencies. The land use comprises 61.3% dryland agriculture, 23.4% forest, and 14.3% wetland rice fields, with alluvial, Regosol, Andosol, Latosol, and Mediterranean soil types. The alluvial soil is distributed on the western side of the island, for example, in the Jembrana Regency. Latosol is generally found in the southern regions, such as the Badung Regency and Denpasar City. Regosol is present in the northern region of the Karangasem Regency, in addition to the Singaraja Regency [40].
2.2. Data Sources and Instruments
Well data and satellite data were used as data sources for analysis. The well data consists of groundwater level measurements at monitoring wells. A report on groundwater level measurement from 2008 to 2013 at 18 monitoring wells in the study area was provided by the Ministry of Mining and Natural Resources (ESDM) of Indonesia in Bali Province (see Table 1). The monitoring wells (see Figure 1) are distributed within the groundwater basin boundaries. A groundwater level measurement was conducted in 2017 at the monitoring wells through field observation by utilizing a water-level measurement tool. Additionally, a handheld GPS was used to record and check the position information of the wells.
The primary data used for generating land subsidence information was satellite data, i.e., SAR data of the PALSAR from the Advanced Land Observing Satellite (ALOS) satellite, Digital Elevation Model (DEM) data from the Shuttle Radar Topography Mission (SRTM), and GNSS-CORS data. Open-source computer software was employed for the processing of satellite data. InSAR processing was conducted using GMT5SAR software (Scripps Institution of Oceanography, University of California, San Diego, CA, USA); this software runs on the UNIX operating system using C codes [41,42]. RTKLIB software (Tokyo University of Marine Science and Technology, Tokyo, Japan) was specifically utilized for GNSS positioning based on the CORS data [44,45]. Moreover, the QGIS image processing software (Spatial Planning and Information, Department of Land Affairs, Eastern Cape, South Africa) was used to view, edit, and analyze geospatial information from the processed satellite data [45,46].
Seven ALOS PALSAR track acquisitions cover the entire study area (see Figure 1), with a total of 63 scenes from 2007 to 2010. The tracks consist of three paths, i.e., path numbers 422, 423, and 424, with two, three, and two rows, respectively (see Table 2). The data characteristics used for the analysis were fine mode, single polarization (HH), processing level of 1.0, 236 mm wavelength, 46-day orbital revisit period, ascending, 34.3° incidence angle, and 13.1 km critical baseline [47,48,49,50]. Based on the look-direction characteristic of PALSAR, the azimuth (compass) direction of the radar illumination is perpendicular to and orientated toward the right of the satellite track [49]. Put simply, based on Figure 1, the illumination azimuth direction is East North East (ENE). Moreover, one scene of the SRTM DEM data was utilized for topographic phase removal of InSAR processing. The data was SRTM 1 Arc-Second Global elevation data that extends to latitudes of +/−60° and has a resolution of 1 arc-second, or approximately 30 m [51,52]. In order to evaluate the InSAR-derived land displacement, data recorded at three CORS stations, i.e., CSRJ, CDNP, and CPBI (see Table 3), that provide GNSS data consisting of carrier phase and code range measurements was used to generate ground surface elevation in subsided areas. GNSS enables autonomous global geospatial positioning [27,53]. CORS networks have been rapidly installed in Indonesia to provide practical measurement capabilities, in addition to high-accuracy positioning [54].
2.3. Research Scheme
A research scheme (see Figure 2) was developed for the hazard risk assessment of groundwater depletion due to land subsidence. The method was applied to the study area of Bali, Indonesia, which represents a small-island developing site with limited water resources. Information on InSAR-derived subsidence distribution was integrated with groundwater depletion information calculated from monitoring well data. Specifically, the InSAR result was compared with GNSS-CORS data measurement. Lastly, a map was produced to present the conservation zones that were found to be vulnerable to land subsidence as a result of groundwater utilization, based on spatial information of groundwater depletion. Such measures are essential for sustainable groundwater management.
2.4. Groundwater Depletion Monitoring
Groundwater depletion was calculated using the collected secondary data of groundwater level from 2008 to 2013 and field observation data from 2017. The percentage of groundwater depletion (Δh) was determined using groundwater level in the initial year (h1) and groundwater level in the final year (h2) of the data in 2008 and 2017, as follows:
The total groundwater depletion was determined by subtracting the final groundwater level from the initial level in the period 2008–2017 for each monitoring well. The values of total groundwater depletion (in percent) were input into the monitoring well points as vector data. The information was then interpolated to create a map of the distribution of groundwater depletion throughout the study area.
Spatial interpolation involves the use of vector points with known values to estimate values at locations where the value is unknown to create a raster surface covering an entire area. The interpolation result is typically a raster layer. It is important to find a suitable interpolation method to optimally estimate values for unknown locations [46]. For the distribution of groundwater depletion, the interpolation was performed in the QGIS application using the Inverse Distance Weighting (IDW) method. In this method, the sample points are weighted during interpolation such that the influence of one point relative to others declines with distance from the unknown point that will be created. Weighting is assigned to sample points through the use of a weighting coefficient that controls how the weighting influence will decline as the distance from the new point increases. The greater the weighting coefficient, the less influence distant points from the unknown point will have during the interpolation process. As the coefficient increases, the value of the unknown point approaches the value of the nearest observational point [55]. In general, values greater or equal to 1 are used for the coefficient. The weighting coefficient was set to 2, which represents the default value known as the inverse distance squared weighted interpolation. The coefficient was adjusted to the number suitable for analysis. The set value resulted in a few different surfaces at a larger distance from nearby points.
2.5. Land Displacement Measurement
Measurements of land subsidence were mainly derived from InSAR analysis. Fundamentally, the InSAR technique combines two SAR scenes acquired at different times in the same area, which are then used to generate an interferometric pair [56]. For the measurement of the phase difference caused by ground movement, the differential interferometric (DInSAR) phase for a pixel is composed of phase components as follows [56,57]:
ϕDInSAR = ϕdefo + ϕres_topo + ϕatmo + ϕnoise
More recently, advanced time-series InSAR has been developed to overcome some of the limitations of conventional InSAR. The technique involves the use of multi-temporal SAR scenes to reduce atmospheric effects by stacking multiple interferograms. The most common time-series InSAR techniques are PS and SBAS, which are able to provide millimeter-scale precision in deformation mapping [30]. PS is appropriate for retrieving PSs with a single master for baseline configuration and pixel selection criteria based on amplitude dispersion [29,31,32,58]. Conversely, SBAS is suitable for deriving DSs by executing a small baseline configuration and a coherence-based pixel selection criterion [33,34]. In this study, the PS and SBAS methods were combined (see Figure 3) in order to enable displacement to be observed both in urban and agricultural regions. The data processing step conducted using GMT5SAR consists of preprocessing, focus and alignment, pair selection, topographic phase removal, phase filtering and unwrapping, and layer stacking. The time-series technique in GMT5SAR is generated by performing a layer-stacking process whereby the input interferograms are processed using batch processing. The characteristics of the data type affect the parameter values for processing [48].
The first step of the InSAR process was the preprocessing of raw SAR data and orbital information to extract orbit and baseline estimation, i.e., orbital position, velocity, near range, and Doppler centroid. Secondly, the images were focused to create two single look complex (SLC) images, and the repeat images were aligned with the reference image. The third step was pair selection of the interferograms based on the PS and SBAS methods. One scene was selected as a super master (reference scene) that was common to the other scenes employed as slaves (repeat scenes) following the PS method. Each surrogate master needs to be aligned with the super master before it can provide a surrogate. Conversely, certain maximum baselines are required for pair selection in the SBAS method. The baselines for SBAS pair selection were determined at 2500 days for the temporal baseline and 1000 m for the perpendicular baseline. Considering the long wavelength of ALOS PALSAR data [47,48,49,50], the large baselines are acceptable for the process.
The subsequent step after pair selection was DEM generation for topography removal and to transform the DEM from longitude, latitude, and topography into range, azimuth, and topography. The next step involved handling the reference and repeat SLCs using the DEM generated from the topographic phase removal, followed by filtering, unwrapping, and geocoding. The processes of interfering, filtering, and unwrapping computed amplitude, phase, and coherence images of the interferograms without the effect of topographic phase. Specifically, the geocoding process transformed all of the products from the range/azimuth coordinate system to longitude and latitude. The parameters of the Gaussian filter wavelength, perform land mask, and unwrap and geocode threshold that needed to be set in the configuration file were Gauss 300, 1 (perform), and 0.45, respectively, for both the PS and SBAS interferograms. Subsequently, layer stacking was conducted to stack the generated interferograms. For SBAS layer-stacking, the other parameters for the smoothing factors, namely, wavelength, incidence angle, range, and atmospheric correction, were 0.2362 m, 34.3°, 850014–848965, and 1 (perform), respectively.
A comparison of the InSAR result with RTK-GNSS measurements as a reference was carried out for evaluation. Fundamentally, RTK is able to perform measurements with up to centimeter-level accuracy by employing phase measurements of the signals’ carrier wave and relying on a single reference station or interpolated virtual station to perform real-time corrections [57,59]. The time required for a signal to travel from the satellite to the receiver is used to calculate the distance between the receiver and the satellite [26]. The data format of GNSS-CORS data downloaded from a receiver was converted into ASCII format of Receiver Independent Exchange Format (RINEX).
In regard to the data in the study area (see Table 3), the observation type of L1, L2, C1, P2, S1, and S2 recorded every 30 min can be processed using RTKLIB software. The input for the data consisted of rover, base station, navigation, precise clock, and Earth Orientation Parameters (EOPs). Parameters for running the calculation through the RTK-post tool of RTKLIB, i.e., positioning mode, frequencies/filter type, elevation mask/SNR mask, ionosphere correction, troposphere correction, and satellite ephemeris/clock, were set into static, L1+2 (combined), 15, estimate Slant Total Electron Content (STEC), estimate Standard Deviation (STD), and precise, respectively [43,44].
3. Results
Hazard risk spatial information of groundwater depletion and land displacement was extracted from the data analysis. The distribution of land displacement was constructed based on a mean velocity map of InSAR time-series displacement for approximately three years (February/October 2007 to February/December 2010). The result was evaluated with the trend of GNSS-CORS land surface elevation measurements at stations located in subsided areas. Furthermore, a map of groundwater depletion percentage was established to represent the changes in groundwater level based on the observed land subsidence. In order to present essential information for water conservation measures, vulnerability levels of high, moderate, and low were determined, corresponding to the hazard risk assessment.
3.1. Spatial Information of Groundwater Depletion
The percentage of total groundwater depletion from 2008 to 2017 at 18 monitoring wells was interpolated and mapped (see Figure 4) to present spatial information of the distribution of groundwater depletion throughout the study area. The total percentage of groundwater depletion ranged from −66.24 to 25.24% (positive values indicate an increase in groundwater level and negative values indicate a decrease).
3.2. Distribution of Land Subsidence
Subsidence was defined based on the InSAR time-series displacement. The InSAR products were estimated using multi-temporal interferograms generated through time-series analysis using the PS and SBAS methods. In regard to the PS pairs, eight interferograms for each track (providing a total of 58 interferograms for the seven tracks) were generated, with scenes 05750, 09343, and 05565 (see Table 1) as the super masters for paths 422, 423, and 424, respectively. The scenes were chosen with the criteria of being able to cover the area of interest and minimize perpendicular baselines between interferometric pairs [49,51]. In correspondence to the scatter chart of the baseline distribution (see Figure 5), the super master scene was located in the middle with a value close to 0.
In the case of SBAS pairs, a total of 84 interferograms were extracted within 1000 m of the perpendicular baseline and within 950 days of the temporal baseline. A different number of interferogram pairs was generated for each track, i.e., 31, 31, 25, 27, 28, 28, and 29 interferogram pairs for path 422 row 7010, path 422 row 7020, path 423 row 7000, path 423 row 7010, path 423 row 7020, path 424 row 7010, and path 424 row 7020, respectively. The time-series of cumulative displacement and mean velocity of the InSAR results indicated upward (+) and downward (−) displacement from 2007 to 2010 in the entire study area (see Figure 6).
The calculated mean displacement velocity (see Figure 7), which ranged from –8.4 to 8.4 mm/yr, was used to estimate subsided and non-subsided sites. Areas with upward (+) displacements (i.e., with no subsidence) were observed in the northern and eastern regions of Bali. Downward (−) displacements (i.e., subsidence) were distributed in the southern coastal areas, including an area of Denpasar City and the Badung Regency. These areas have been the center of development activity on the island, i.e., settlements and tourism accommodation. Groundwater is mainly utilized to meet domestic water needs [60]. Likewise, subsidence was also measured on the western side of the island. This area contains irrigated paddy fields that use groundwater as their main irrigation source due to limited water resources [40].
Furthermore, the InSAR measurements were evaluated with GNSS-CORS measurements as reference data. Referring to the line-of-sight (LOS) displacement equation [50], the vertical displacement was calculated by dividing the LOS value of InSAR-derived time-series cumulative displacement by the cosine of the incidence angle. Considering that the LOS displacement is proportional to the vertical displacement, regardless of the effect of horizontal displacement, the downward displacement was considered sufficient to represent subsidence in the study area. Therefore, the calculated vertical displacement was employed for further evaluation with GNSS measurements, in addition to analysis of groundwater depletion.
Regarding the GNSS-CORS measurement, the height that represents the land surface elevation in the subsided area was estimated through the RTK-post tool of RTKLIB processing program using available and processable data. The position of a rover station in the subsided area was measured based on the position of a base station located in the non-subsided area. The distribution of the GNSS-CORS stations is shown in the mean displacement velocity map (see Figure 7), which signifies stations in areas with downward (subsided) and upward (non-subsided) displacements. As shown on the map, there are two stations in the subsided area, i.e., CDNP and CPBI, and one station in the non-subsided area, i.e., CSRJ. Based on the distribution of the GNSS-CORS stations, stations CDNP and CPBI were designated as rover stations, with station CSRJ as the base station for both rover stations. The reference or base position of the selected base station was set by referring to the latest recorded information of latitude, longitude, and height of the station (see Table 3). The base station also meets the distance criteria of a base station to rover station distance of less than 80 km [50].
The significant decreasing trend of height changes at stations distributed in the subsided area, i.e., CDNP and CPBI (see Figure 8), corresponded with the subsidence trend of the cumulative displacement time series. In regard to the evaluation result that highlighted subsidence at stations on the southern side of Bali, the InSAR-derived displacement was confirmed to represent the subsidence distribution.
3.3. Hazard Risk Geospatial-Based Assessment of Groundwater Depletion and Land Subsidence
The values of the average percentage of groundwater level change integrated with the values of downward displacement at each monitoring well were plotted on a graph (see Figure 9) to present a quantitative estimation of the hazard risk correlation between groundwater depletion and land subsidence. Monitoring wells with a decreasing trend of groundwater level changes exhibited downward displacement, denoting subsidence. Based on monitoring well MW04-BD04, which is located in a subsided area, the average groundwater depletion between 2008 and 2017 was 8.03%; in comparison, the average subsidence rate between 2007 and 2010 was 5.58 mm/yr. Conversely, in non-subsided (uplifted) areas, monitoring wells were found to exhibit no trend of decreasing groundwater level. For instance, monitoring well MW12-BL01, which had a negative average groundwater depletion of –0.60%, exhibited a subsidence rate (i.e., uplift) of 3.3 mm/yr.
Furthermore, hazard risk assessment for the zonation of groundwater conservation was performed based on the values of groundwater depletion and land subsidence. The changes in groundwater level related to groundwater depletion and downward displacement, which were considered as subsidence, were classified into four conditions, i.e., safe, vulnerable, critical, and damage zones. Concerning a publication by the local agency of Public Works (DPU) related to the zonation of groundwater conservation [56], the criteria for the zonation (see Figure 9) were determined by considering the significance levels of the decreasing trends of groundwater level or the values of the average percentage of groundwater depletion and the presence/absence of land subsidence.
Based on the groundwater conservation zones derived from the hazard risk for land subsidence caused by groundwater depletion (see Figure 10), areas with no groundwater depletion or subsidence, including non-groundwater basin areas, were classified into safe zones. A settlement area with low population density dominated by vegetation such as forests in the northern region of Bali was assigned to this category, for instance, the areas of Tejakula Sub-District, Tejakula District, Buleleng Regency. Regarding vulnerable zones, areas with subsidence and low (<10%) groundwater depletion in the western region of Bali were classified as vulnerable areas, for instance, a paddy field area in Manis Tutu Sub-District, Melaya District, Jembrana Regency. In 2017, the total area of paddy fields reached 6,757 ha in the Jembrana Regency. Groundwater is mainly utilized in the area for irrigation systems, with a total requirement of 10,135.50 L [40].
Subsided areas with moderate (10–25%) and high (>25%) groundwater depletion were categorized as critical and damage zones, respectively. Such areas were observed in the southern and eastern regions of Bali, such as Kesiman Sub-District, East Denpasar District, for the critical zone and Sanur Sub-District, South Denpasar District, for the damage zone that was located in Denpasar City. Besides being developed as a settlement center, the area has also been extended for tourism accommodation, e.g., hotels and villas. The average water requirement for a hotel is 1500 L/room/day, and that for a villa is 2500 L/room/day [28].
4. Discussion
Water resources in the province of Bali, Indonesia, are quite abundant, consisting of groundwater, river water, lakes, reservoirs, and springs. Groundwater in groundwater basins represents the second-largest water resource in Bali, supplying roughly 1598 million m3/year of water [61]. This factor signifies the importance of groundwater as an alternative water resource in the area. The usage of groundwater for water supply has increased following an increase in population and economic activities in Bali. The population of Bali exhibited an annual growth of 1.23% between 2010 and 2015. Agriculture, industries, and services, including tourism, are the main economic activities in the area [47]. Groundwater has largely been used to meet domestic needs, in addition to irrigation for agricultural areas with limited water resources [40].
Several problems have arisen due to the over-extraction of groundwater in the region of Bali, i.e., the risk of land subsidence and saline water intrusion [27,28,38,40,60,62]. Groundwater depletion was observed in the southern region of Bali from groundwater level monitoring from 2001 to 2015 at wells located in four different area classifications, i.e., tourism, river basin, settlement area, and wetland [38]. Seawater intrusion has also been shown to increase groundwater salinity in the Candidasa region in the eastern part of Bali [39]. In addition to climate change, groundwater depletion and land subsidence are considered as causes of seawater intrusion [60,63,64,65,66].
Based on the results of the InSAR analysis, the shortcomings of the technique can be identified from several inconsistencies in the displacement on the InSAR images. InSAR essentially measures object directions and vertical movements with an angle based on the distances to different objects on the Earth’s surface [63]. The inconsistencies indicate that the technique may be inadequate for indicating exact amounts of subsidence, as it also estimates the object movements [30]. The accuracy of the result can be improved by employing more datasets in both ascending and descending orbits. Research has shown the effectiveness of the utilization of multi-track data for extracting a substantial value of vertical displacement [64,65,66]. Moreover, the trend of height changes at GNSS-CORS stations, i.e., CDNP and CPBI, demonstrated good agreement with the subsidence areas identified by means of InSAR. In another study, continuous GPS measurement at stations CDNP and CPBI showed negative deformation in the northern and southern regions of Bali; in comparison, a positive trend was shown in the central region. Station CSRJ was also used as a reference, considering that the area is free from earthquake effects and bias [66].
Furthermore, spatial information on the distribution of groundwater depletion can be derived through data interpolation and mapping that cover the entire study area. The groundwater level measurement from institutional data was provided for a five-year period from 2008 to 2013; however, there was a lack of data covering the subsequent period. Regarding this matter, continuous measurement is necessary to monitor the changes in groundwater level. Concerning the lack of conventional groundwater level measurement due to its shortcomings, InSAR-derived land displacement could be employed to estimate groundwater level with higher temporal resolution [13,14,15,16,17,18].
The application of geospatial analysis for hazard risk assessment offers rapid and low-cost processing [67,68,69]. Moreover, the information can also be integrated with other parameters as input for groundwater utilization plans. As detailed in the groundwater utilization plan provided by the Ministry of Public Works in Bali Province in 2013, designated protection and utilization zones for groundwater have been developed. The protected zone covers groundwater recharge areas, whereas the utilization zone consists of safe, vulnerable, critical, and damage zones. The amount of groundwater discharge is limited to 150 m3/day in the safety zone and 72 m3/day in the vulnerable zone, and groundwater use is restricted in the critical and damage zones [61,62]. Based on the results of this study, groundwater conservation zoning can be used to guide the planning of utilization zones.
5. Conclusions
In this study, a hazard risk assessment was performed using spatial information of land subsidence distribution and groundwater depletion. The risk of subsidence due to groundwater depletion can be assessed and confirmed according to the conformity of the groundwater level changes based on monitoring well data and subsidence sites identified through InSAR analysis. This type of information is important in supporting the planning of sustainable groundwater development in the area, as it considers the condition of the groundwater and the risk related to it. Concerning its advantages of quick and low-cost processing, InSAR is considered appropriate for establishing continuous spatial information of groundwater conservation zoning based on the risk of land subsidence caused by groundwater depletion. In supporting sustainable groundwater development, the information can be considered appropriate as input for related water management planning, such as groundwater conservation zonation.
Author Contributions
Conceptualization, N.M.P.J. and M.N.; Methodology, N.M.P.J.; Software, N.M.P.J.; Validation, N.M.P.J. and M.N.; Formal Analysis, N.M.P.J.; Investigation, N.M.P.J.; Resources, N.M.P.J.; Data Curation, N.M.P.J.; Writing—Original Draft Preparation, N.M.P.J.; Writing—Review and Editing, N.M.P.J.; Visualization, N.M.P.J.; Supervision, M.N.; Project Administration, M.N.; Funding Acquisition, M.N. All authors have read and agreed to the published version of the manuscript.
Funding
This research was partially supported by a scholarship from the Iwatani Naoji Foundation from 2017 to 2019, and the APC was partially funded by Udayana University through the Directorate General of Research and Development, Ministry of Higher Education, Science, and Technology of Indonesia, in 2025.
Data Availability Statement
The monitoring well data from the Ministry of Mining and Natural Resources (ESDM) of Indonesia in Bali and the GNSS-CORS data from the Geospatial Information Agency (BIG) of Indonesia were provided by the agencies in response to a formal research request. The Advanced Land Observing Satellite (ALOS) PALSAR data provided by the Alaska Satellite Facility (ASF) Distributed Active Archive Center (DAAC) is available for download at https://asf.alaska.edu/. The Shuttle Radar Topography Mission (SRTM) DEM data, available from the USGS Earth Explorer data portal, can be downloaded at https://earthexplorer.usgs.gov/.
Acknowledgments
The study was carried out using ALOS PALSAR data provided by the Japan Aerospace Exploration Agency (JAXA) through a joint research program with Yamaguchi University. The data collection for GNSS-CORS and monitoring wells was facilitated by the Geospatial Information Agency (BIG) and the Ministry of Mining and Mineral Resources (ESDM) in Bali Province, respectively. Moreover, to the authors sincerely thank the reviewers for their contribution to refining the paper.
Conflicts of Interest
The authors declare no conflicts of interest.
References
- Zhou, Q.; Chen, C.; Zhang, G.; Chen, H.; Chen, D.; Yan, Y.; Shen, J.; Zhou, R. Real-Time Management of Groundwater Resources Based on Wireless Sensors Networks. J. Sens. Actuator Netw. 2018, 7, 3–11. [Google Scholar] [CrossRef]
- World Population Prospects: The 2017 Revision, United Nation Population Database (June 21, 2017) by United Nations. Available online: https://www.un.org/development/desa/publications/world-population-prospects-the-2017-revision.html (accessed on 1 July 2018).
- Olli, V. Megacities, Development and Water. Int. J. Water Resour. D 2006, 22, 199–225. [Google Scholar]
- Brown, S.; Nicholls, R.; Woodroffe, C.; Hanson, S.; Hinkel, J.; Kebede, A.S.; Neumann, B.; Vafeidis, A.T. Sea-Level Rise Impacts and Responses: A Global Perspective; Springer: The Netherlands, 2013; pp. 117–149. [Google Scholar]
- Amarnath, G.; Ameer, M.; Aggarwal, P.; Smakhtin, V. Detecting Spatio-Temporal Changes in the Extent of Seasonal and Annual Flooding in South Asia Using Multi-resolution Satellite Data. In Earth Resources and Environmental Remote Sensing/GIS Applications III: Proceedings of the International Society for Optics and Photonics (SPIE), 1–6 July 2012; Amsterdam, The Netherlands, Civco, D.L., Ehlers, M., Habib, S., Maltese, A., Messinger, D., Michel, U., Nikolakopoulos, K.G., Schulz, K., Eds.; International Society for Optics and Photonics (SPIE): Bellingham, WA, USA, 2012; pp. 853818-1–853818-11. [Google Scholar]
- ADPC. Assessing the Risk. In Disaster Risk Management in Asia; Asian Disaster Preparedness Center (ADPC): Bangkok, Thailand, 2013; Ch. 3; pp. 71–100. [Google Scholar]
- Smith, K. The Nature of Hazards. In Environmental Hazards: Assessing Risk and Reducing Disaster, 4th ed.; Routledge: London, UK, 2004; Ch. 1, Sec. 3; pp. 36–54. [Google Scholar]
- UNISDR. Trends from the Cases. In From a Reactive to Proactive then People Centered Approach to DDR: Taking Inspiration from the Hyogo Framework for Action to Implement the Sendai Framework for Disaster Risk Reduction; United Nations International Strategy for Disaster Reduction (UNISDR): Geneva, Switzerland, 2016; pp. 4–7. Available online: https://www.unisdr.org/files/49574_hfacelebrationreport7082015verdana.pdf (accessed on 1 July 2018).
- Chen, B.B.; Gong, H.L.; Li, X.J.; Lei, K.C.; Ke, Y.H.; Duan, G.Y.; Zhou, C.F. Spatial Correlation Between Land Subsidence and Urbanization in Beijing, China. Nat. Hazards 2014, 75, 2637–2652. [Google Scholar] [CrossRef]
- Corapcioglu, M.Y.; Bear, J.A. Mathematical Model for Regional Land Subsidence Due to Pumping: 3. Integrated Equations for a Phreatic Aquifer. Water Resour. Res. 1983, 19, 895–908. [Google Scholar] [CrossRef]
- Strozzi, T.; Wegmiiller, U.; Tosl, L.; Bitelli, G.; Spreckels, V. Land Subsidence Monitoring with Differential SAR Interferometry. Photogramm. Eng. Remote Sens. 2001, 67, 1261–1270. [Google Scholar]
- Holzer, T.L.; Galloway, D.L. Impacts of Land Subsidence Caused by Withdrawal of Underground Fluids in the United States. In Humans as Geologic Agents; Ehlen, J., Haneberg, W.C., Larson, R.A., Eds.; Geological Survey of America Reviews in Engineering Geology: Boulder, CO, USA, 2005; Volume XVI, pp. 87–99. [Google Scholar]
- Rosen, P.A.; Hensley, S.; Joughin, I.R.; Li, F.K.; Madsen, S.N.; Rodríguez, E.; Goldstein, R.M. Synthetic Aperture Radar Interferometry. In Proceedings of the IEEE, New York, NY, USA, 28 March 2000; pp. 333–382. [Google Scholar]
- Hanssen, R.F. Radar System Theory and Interferometric Processing. In Radar Interferometry: Data Interpretation and Error Analysis, Remote Sensing Digital Image Process, 1st ed.; Kluwer Academic Publishers: Dordrecht, The Netherland, 2001; pp. 9–42. [Google Scholar]
- Galloway, D.; Hoffmann, J. The Application of Satellite Differential SAR Interferometry-Derived Ground Displacements in Hydrogeology. Hydrogeol. J. 2006, 15, 133–154. [Google Scholar] [CrossRef]
- Galloway, D.L.; Burbey, T.J. Review: Regional Land Subsidence Accompanying Groundwater Extraction. Hydrogeol. J. 2011, 19, 1459–1486. [Google Scholar] [CrossRef]
- Ljungdahl, J. Analysis of Groundwater Level Changes and Land Subsidence in Gothenburg, SW Sweden. Master’s Thesis, Department of Earth Sciences, University of Gothenburg, Gothenburg, Sweden, 2015. [Google Scholar]
- Chen, J.; Knight, R.; Zebker, H.A.; Schreuder, W.A. Confined Aquifer Head Measurements and Storage Properties in the San Luis Valley, Colorado, From Spaceborne InSAR Observations. Water Resour. Res. 2016, 52, 3623–3636. [Google Scholar] [CrossRef]
- Amelung, F.; Galloway, D.L.; Bell, J.W.; Zebker, H.A.; Laczniak, R.J. Sensing the Ups and Downs of Las Vegas: InSAR Reveals Structural Control of Land Subsidence and Aquifer-System Deformation. Geology 1999, 27, 483–486. [Google Scholar] [CrossRef]
- Hoffmann, J.; Zebker, H.A.; Galloway, D.L.; Amelung, F. Seasonal Subsidence and Rebound in Las Vegas Valley, Nevada, Observed by Synthetic Aperture Radar Interferometry. Water Resour. Res. 2001, 37, 1551–1566. [Google Scholar] [CrossRef]
- Bell, J.W.; Amelung, F.; Ferretti, A.; Bianchi, M.; Novali, F. Permanent Scatterer InSAR Reveals Seasonal and Long-Term Aquifer-System Response to Groundwater Pumping and Artificial Recharge. Water Resour. Res. 2008, 44, 1–18. [Google Scholar] [CrossRef]
- Schmidt, D.A.; Bürgmann, R. Time-Dependent Land Uplift and Subsidence in the Santa Clara Valley, California, From a Large Interferometric Synthetic Aperture Radar Data Set. J. Geophys. Res. 2003, 108, 2416–2419. [Google Scholar] [CrossRef]
- Chaussard, E.; Bürgmann, R.; Shirzaei, M.; Fielding, E.J.; Baker, B. Predictability of Hydraulic Head Changes and Characterization of Aquifer-System and Fault Properties from InSAR-Derived Ground Deformation. J. Geophys. Res. 2014, 119, 6572–6590. [Google Scholar] [CrossRef]
- Reeves, J.A.; Knight, R.; Zebker, H.A.; Schreüder, W.A.; Agram, P.S.; Lauknes, T.R. High quality InSAR Data Linked to Seasonal Change in Hydraulic Head for an Agricultural Area in the San Luis Valley, Colorado. Water Resour. Res. 2011, 47, 1029–1039. [Google Scholar] [CrossRef]
- Reeves, J.A.; Knight, R.; Zebker, H.A.; Kitanidis, P.K.; Schreüder, W.A. Estimating Temporal Changes in Hydraulic Head Using InSAR Data in the San Luis Valley, Colorado. Water Resour. Res. 2014, 50, 4459–4473. [Google Scholar] [CrossRef]
- Kizil, U.; Tisor, L.J. Evaluation of RTK-GPS and Total Station for Application in Land Surveying. J. Earth Syst. Sci. 2011, 120, 215–221. [Google Scholar] [CrossRef]
- Sickle, J.V. GPS for Land Surveyors, 4th ed.; Taylor & Francis Group: Northwest Florida, FL, USA, 2015; Ch. 1; pp. 5–22. [Google Scholar]
- Saghravani, S.R.; Mustapha, S.; Saghravani, S.F. Accuracy comparison of RTK-GPS and automatic level for height determination in land surveying. MASAUM J. Rev. Surv. 2009, 1, 10–13. [Google Scholar]
- Bouraoui, S. Time Series Analysis of SAR Images Using Persistent Scatterer (PS), Small Baseline (SB) and Merged Approaches in Regions with Small Surface Deformation. Ph.D. Dissertation, Department of Earth Sciences, Université de Strasbourg, Strasbourg, France, 2013. [Google Scholar]
- Crosetto, M.; Monserrat, O.; Cuevas-González, M.; Devanthéry, N.; Crippa, B. Persistent Scatterer Interferometry: A Review. ISPRS J. Photogramm. Remote Sens. 2016, 115, 78–89. [Google Scholar] [CrossRef]
- Kampes, B.M. Displacement Parameter Estimation Using Permanent Scatterer Interferometry. Ph.D. Dissertation, Faculty Civil Engineering and Geosciences, Delft University of Technology, Delft, The Netherlands, 2005. [Google Scholar]
- Hooper, A.; Zebker, H.; Segall, P.; Kampes, B. A New Method for Measuring Deformation on Volcanoes and Other Natural Terrains Using InSAR Persistent Scatterers. Geophy. Res. Lett. 2004, 31, 1–5. [Google Scholar] [CrossRef]
- Vander Kooij, M.; Hughes, W.; Sato, S.; Poncos, V. Coherent Target Monitoring at High Spatial Density: Examples of Validation Results. In Proceedings of Fringe 2005 Workshop. Frascati, Italy, 28 November–2 December 2005; Available online: http://earth.esa.int/fringe2005/proceedings (accessed on 1 July 2018).
- Berardino, P.; Fornaro, G.; Lanari, R.; Sansosti, E. A New Algorithm for Surface Deformation Monitoring Based on Small Baseline Differential SAR Interferograms. IEEE Trans. Geosci. Remote Sens. 2002, 40, 2375–2383. [Google Scholar] [CrossRef]
- Bali is Sinking Faster, Sea Water Intrusion Has Reached Sanglah Region (13 January 2013) by Bali Post. Available online: http://www.balipost.com/bali (accessed on 1 July 2018).
- Bali is Predicted Encountering Severe Water Crisis; Sea Water Intrusion is Getting Worse (15 January 2013) by Bali Post. Available online: http://www.balipost.com/bali (accessed on 1 July 2018).
- Sukearsana, I.M.; Dharma, I.G.B.S.; Nuarsa, I.W. Regional Study on Sea Water Intrusion in the Coastal Area in North Kuta District of Badung Regency. ECOTROPHIC J. Environ. Sci. 2016, 9, 72–78. [Google Scholar] [CrossRef]
- Wijayantari, I.A.M. Study on Sea Water Intrusion in Candidasa Region of Karangasem (11 January 2017) by Faculty of Engineering, Udayana University, Bali, Indonesia. Available online: https://www.unud.ac.id/en/ (accessed on 1 July 2018).
- BWSBP. Planning of the Improvement and Rehabilitation of Freshwater and Groundwater Supply Networks in Bali Province; River Basin Agency (BWS) of Bali-Penida: Denpasar, Bali, Indonesia, 2017; pp. 2–37. [Google Scholar]
- BPS. Bali Province in Figures; Statistics Agency (BPS) of Bali Province: Denpasar, Bali, Indonesia, 2017; pp. 12–110. [Google Scholar]
- Zebker, H.A.; Hensley, S.; Shanker, P.; Wortham, C. Geodetically Accurate InSAR Data Processor. IEEE Trans. Geosci. Remote Sens. 2010, 48, 4309–4321. [Google Scholar] [CrossRef]
- Rosenqvist, A.; Shimada, M.; Watanabe, M. ALOS PALSAR: Technical Outline and Mission Concepts. In Proceedings of the 4th International Symposium on Retrieval of Bio- and Geophysical Parameters from SAR Data for Land Applications, Innsbruck, Austria, 16–24 November 2004; Available online: https://www.eorc.jaxa.jp/ALOS/en/kyoto/ref (accessed on 1 July 2018).
- Sandwell, D.T.; Myer, D.; Mellors, R.; Shimada, M.; Brooks, B.; Foster, J. Accuracy and Resolution of ALOS Interferometry: Vector Deformation Maps of the Father’s Day Intrusion at Kilauea. IEEE Trans. Geosci. Remote Sens. 2008, 46, 3524–3534. [Google Scholar] [CrossRef]
- Geodetic Methods—Lab 3: Pseudorange Position Estimation (8 September 2015) by UNAVCO. Available online: http://www.grapenthin.org/teaching/geop572_2015/LAB03_position_estimation.html (accessed on 1 July 2018).
- United States Geological Survey (USGS). USGS EROS Archive—Digital Elevation—Shuttle Radar Topography Mission (SRTM). Available online: https://www.usgs.gov/centers/eros/science/usgs-eros-archive-digital-elevation-shuttle-radar-topography-mission-srtm (accessed on 1 July 2018).
- GMTSAR. Generate DEM Files for Use with GMTSAR. Available online: http://topex.ucsd.edu/gmtsar/demgen (accessed on 1 July 2018).
- Adhitya, A.; Effendi, J.; Syafii, A. InaCORS: Infrastructure of GNSS CORS in Indonesia. In Proceedings of the FIG Congress 2014, Kuala Lumpur, Malaysia, 16–21 June 2014; pp. 6853-1–6853-13. [Google Scholar]
- Maciuk, K.; Szombara, S. Annual Crustal Deformation Based on GNSS Observations Between 1996 and 2016. Arab. J. Geosci. 2018, 11, 667–679. [Google Scholar] [CrossRef]
- Ghiglia, D.C.; Pritt, M.D. Two-Dimensional Phase Unwrapping: Theory, Algorithms, and Software; Wiley: New York, NY, USA, 1998; Ch. 3; pp. 206–298. [Google Scholar]
- Riley, S.; Talbot, N.; Kirk, G. A New System for RTK Performance Evaluation. In Proceedings of the IEEE Position Location and Navigation Symposium (PLANS), San Diego, CA, USA, 20–23 April 2000; pp. 231–236. [Google Scholar]
- Ferretti, A.; Prati, C.; Rocca, F. Permanent Scatterers in SAR Interferometry. IEEE Trans. Geosci. Remote Sens. 2001, 39, 8–20. [Google Scholar] [CrossRef]
- Aykut, N.O.; Gülal, E.; Akpinar, B. Performance of Single Base RTK GNSS Method versus Network RTK. Earth Sci. Res. J. 2015, 19, 135–139. [Google Scholar] [CrossRef]
- QGIS. A Gentle Introduction to GIS. Available online: https://docs.qgis.org/testing/en/docs/gentle_gis_introduction/ (accessed on 1 July 2018).
- Mitas, L.; Mitasova, H. Spatial Interpolation. In Geographical Information Systems: Principles, Techniques, Management and Applications; Wiley: New York, NY, USA, 1999; Ch. 34; pp. 481–492. [Google Scholar]
- Putra, A.A.G.P.; Handayani, C.I.M.; Mustafa, F.; Jasmini, M.; Rahmaeni, N.K.D.; Sukarji, M.A.; Amer, L. Status of Ecoregion Environment (SLHE) in Bali and Nusa Tenggara; Center for Ecoregion Management in Bali and Nusa Tenggara: Bali, Indonesia, 2014; pp. 40–68. [Google Scholar]
- DPU. Zonation Map of Groundwater Usage in Bali Province, 2014 Fiscal Year; Public Work Agency (DPU) of Bali Province: Bali, Indonesia, 2014; pp. 71–96. [Google Scholar]
- ESDM. Recapitulation of Groundwater Level at Monitoring Wells, Electrical Conductivity, Total Dissolved Solid, and Salinity Level in 2008–2012; Ministry of Mining and Mineral Resource (ESDM) of Bali Province: Bali, Indonesia, 2013; pp. 16–22. [Google Scholar]
- Lång, L.; Ojala, L.; Åsman, M. Groundwater Resources in Sweden; Geological Survey of Sweden (SGU): Uppsala, Sweden, 2005. Available online: https://www.bgr.bund.de/EN/ (accessed on 1 July 2018).
- Pratt, W.E.; Johnson, D.W. Local Subsidence of the Goose Creek Oil Field. J. Geol. 1926, 34, 577–590. [Google Scholar] [CrossRef]
- Paleologos, K.; Mertikas, S.P. Evidence and Implications of Extensive Groundwater Overdraft-Induced Land Subsidence in Greece. Eur. Water 2013, 43, 3–11. [Google Scholar]
- USGS. Land Subsidence; United States Geological Survey (USGS): Reston, VA, USA, 2017. Available online: http://water.usgs.gov/edu/earthgwlandsubside.html (accessed on 1 July 2018).
- Engdahl, M.; Cecilia, J. Geohazard Description for Göteborg; Version 1; European Geological Data Infrastructure (EDGI): 2013. Available online: http://www.pangeoproject.eu (accessed on 1 July 2018).
- Deo, R.; Rossi, C.; Eineder, M. Framework for Fusion of Ascending and Descending Pass Tandem-X Raw DEMs. IEEE J. Sel. Top. Appl. Earth Obs. Remote Sens. 2015, 8, 2247–3355. [Google Scholar] [CrossRef]
- Pepe, A.; Calò, F. A Review of Interferometric Synthetic Aperture Radar (InSAR) Multi-Track Approaches for the Retrieval of Earth’s Surface Displacements. Appl. Sci. 2017, 7, 1264–1304. [Google Scholar] [CrossRef]
- Ezquerro, P.; Guardiola-Albert, C.; Herrera, G.; Fernández-Merodo, J.A.; Béjar-Pizarro, M.; Bonì, R. Groundwater and Subsidence Modeling Combining Geological and Multi-Satellite SAR Data over the Alto Guadalentín Aquifer (SE Spain). Geofluids 2017, 2017, 1–17. [Google Scholar] [CrossRef]
- Sarsito, D.A.; Susilo; Andreas, H.; Pradipta, D.; Gumilar, I. Regional Phenomena of Vertical Deformation in Southern Part of Indonesia. In IOP Conference Series: Earth and Environmental Science, Proceedings of the 2nd Geoplanning-International Conference on Geomatics and Planning, Surakarta, Indonesia, 9–10 August 2017; IOP Publishing: Bristol, UK; pp. 1–7. [Google Scholar]
- Mahendra, R.S.; Mohanty, P.C.; Bisoyi, H.; Kumar, T.S.; Nayak, S. Assessment and Management of Coastal Multi-Hazard Vulnerability Along the Cuddalore Villupuram, East Coast of India Using Geospatial Techniques. Ocean Coast. Manag. 2011, 54, 302–311. [Google Scholar] [CrossRef]
- Chini, M.; Alessandro, P.; Francesca, R.C.; Stefania, A.; Rosa, N.; Paolo, M.D.M. The 2011 Tohoku (Japan) Tsunami Inundation and Liquefaction Investigated Through Optical, Thermal, and SAR Data. IEEE Geosci. Remote Sens. Lett. 2013, 10, 347–351. [Google Scholar] [CrossRef]
- Joyce, K.E.; Belliss, S.E.; Samsonov, S.V.; McNeill, S.J.; Glassey, P.J. A Review of the Status of Satellite Remote Sensing and Image Processing Techniques for Mapping Natural Hazards and Disasters. Prog. Phys. Geogr. 2009, 33, 183–207. [Google Scholar] [CrossRef]
Figure 1.
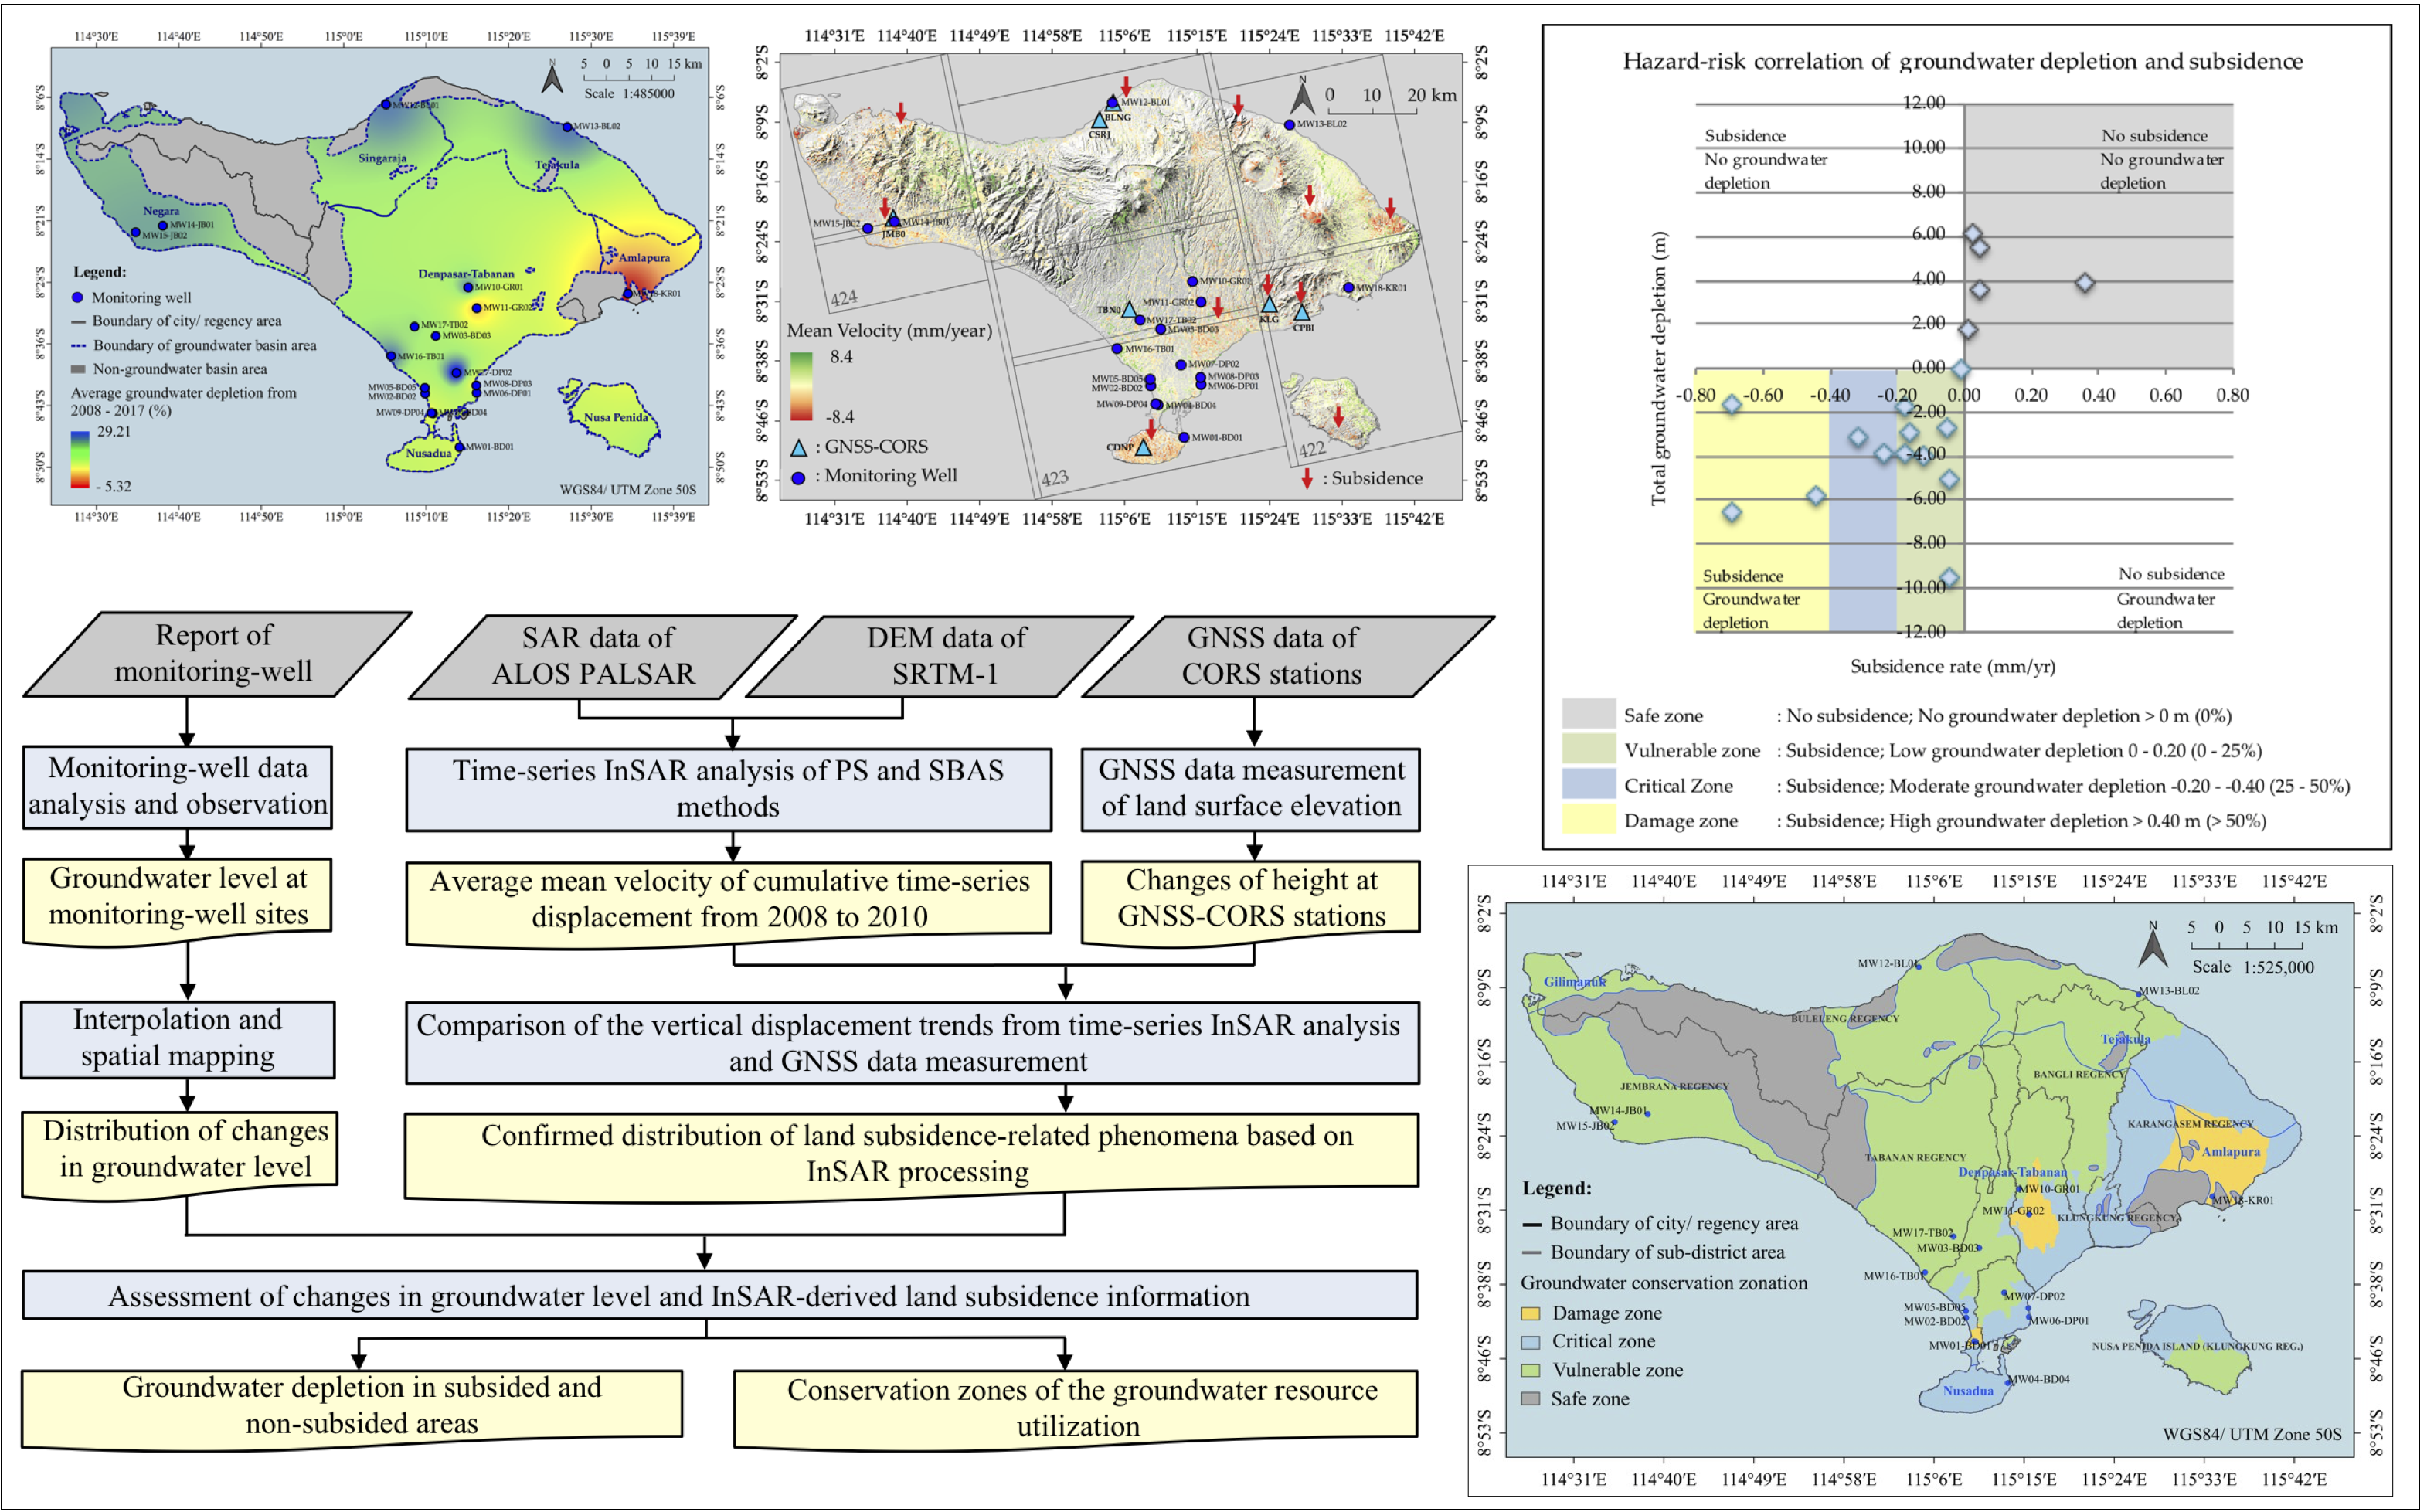
Map of the study area in Bali, Indonesia. The groundwater basin is delineated into eight basins based on the Presidential Law of Indonesia Number 26 Year 2011. There are seven Continuously Operating Reference Stations (CORSs) of the Global Navigation Satellite System (GNSS) and 18 monitoring wells distributed in the area.
Figure 1.
Map of the study area in Bali, Indonesia. The groundwater basin is delineated into eight basins based on the Presidential Law of Indonesia Number 26 Year 2011. There are seven Continuously Operating Reference Stations (CORSs) of the Global Navigation Satellite System (GNSS) and 18 monitoring wells distributed in the area.
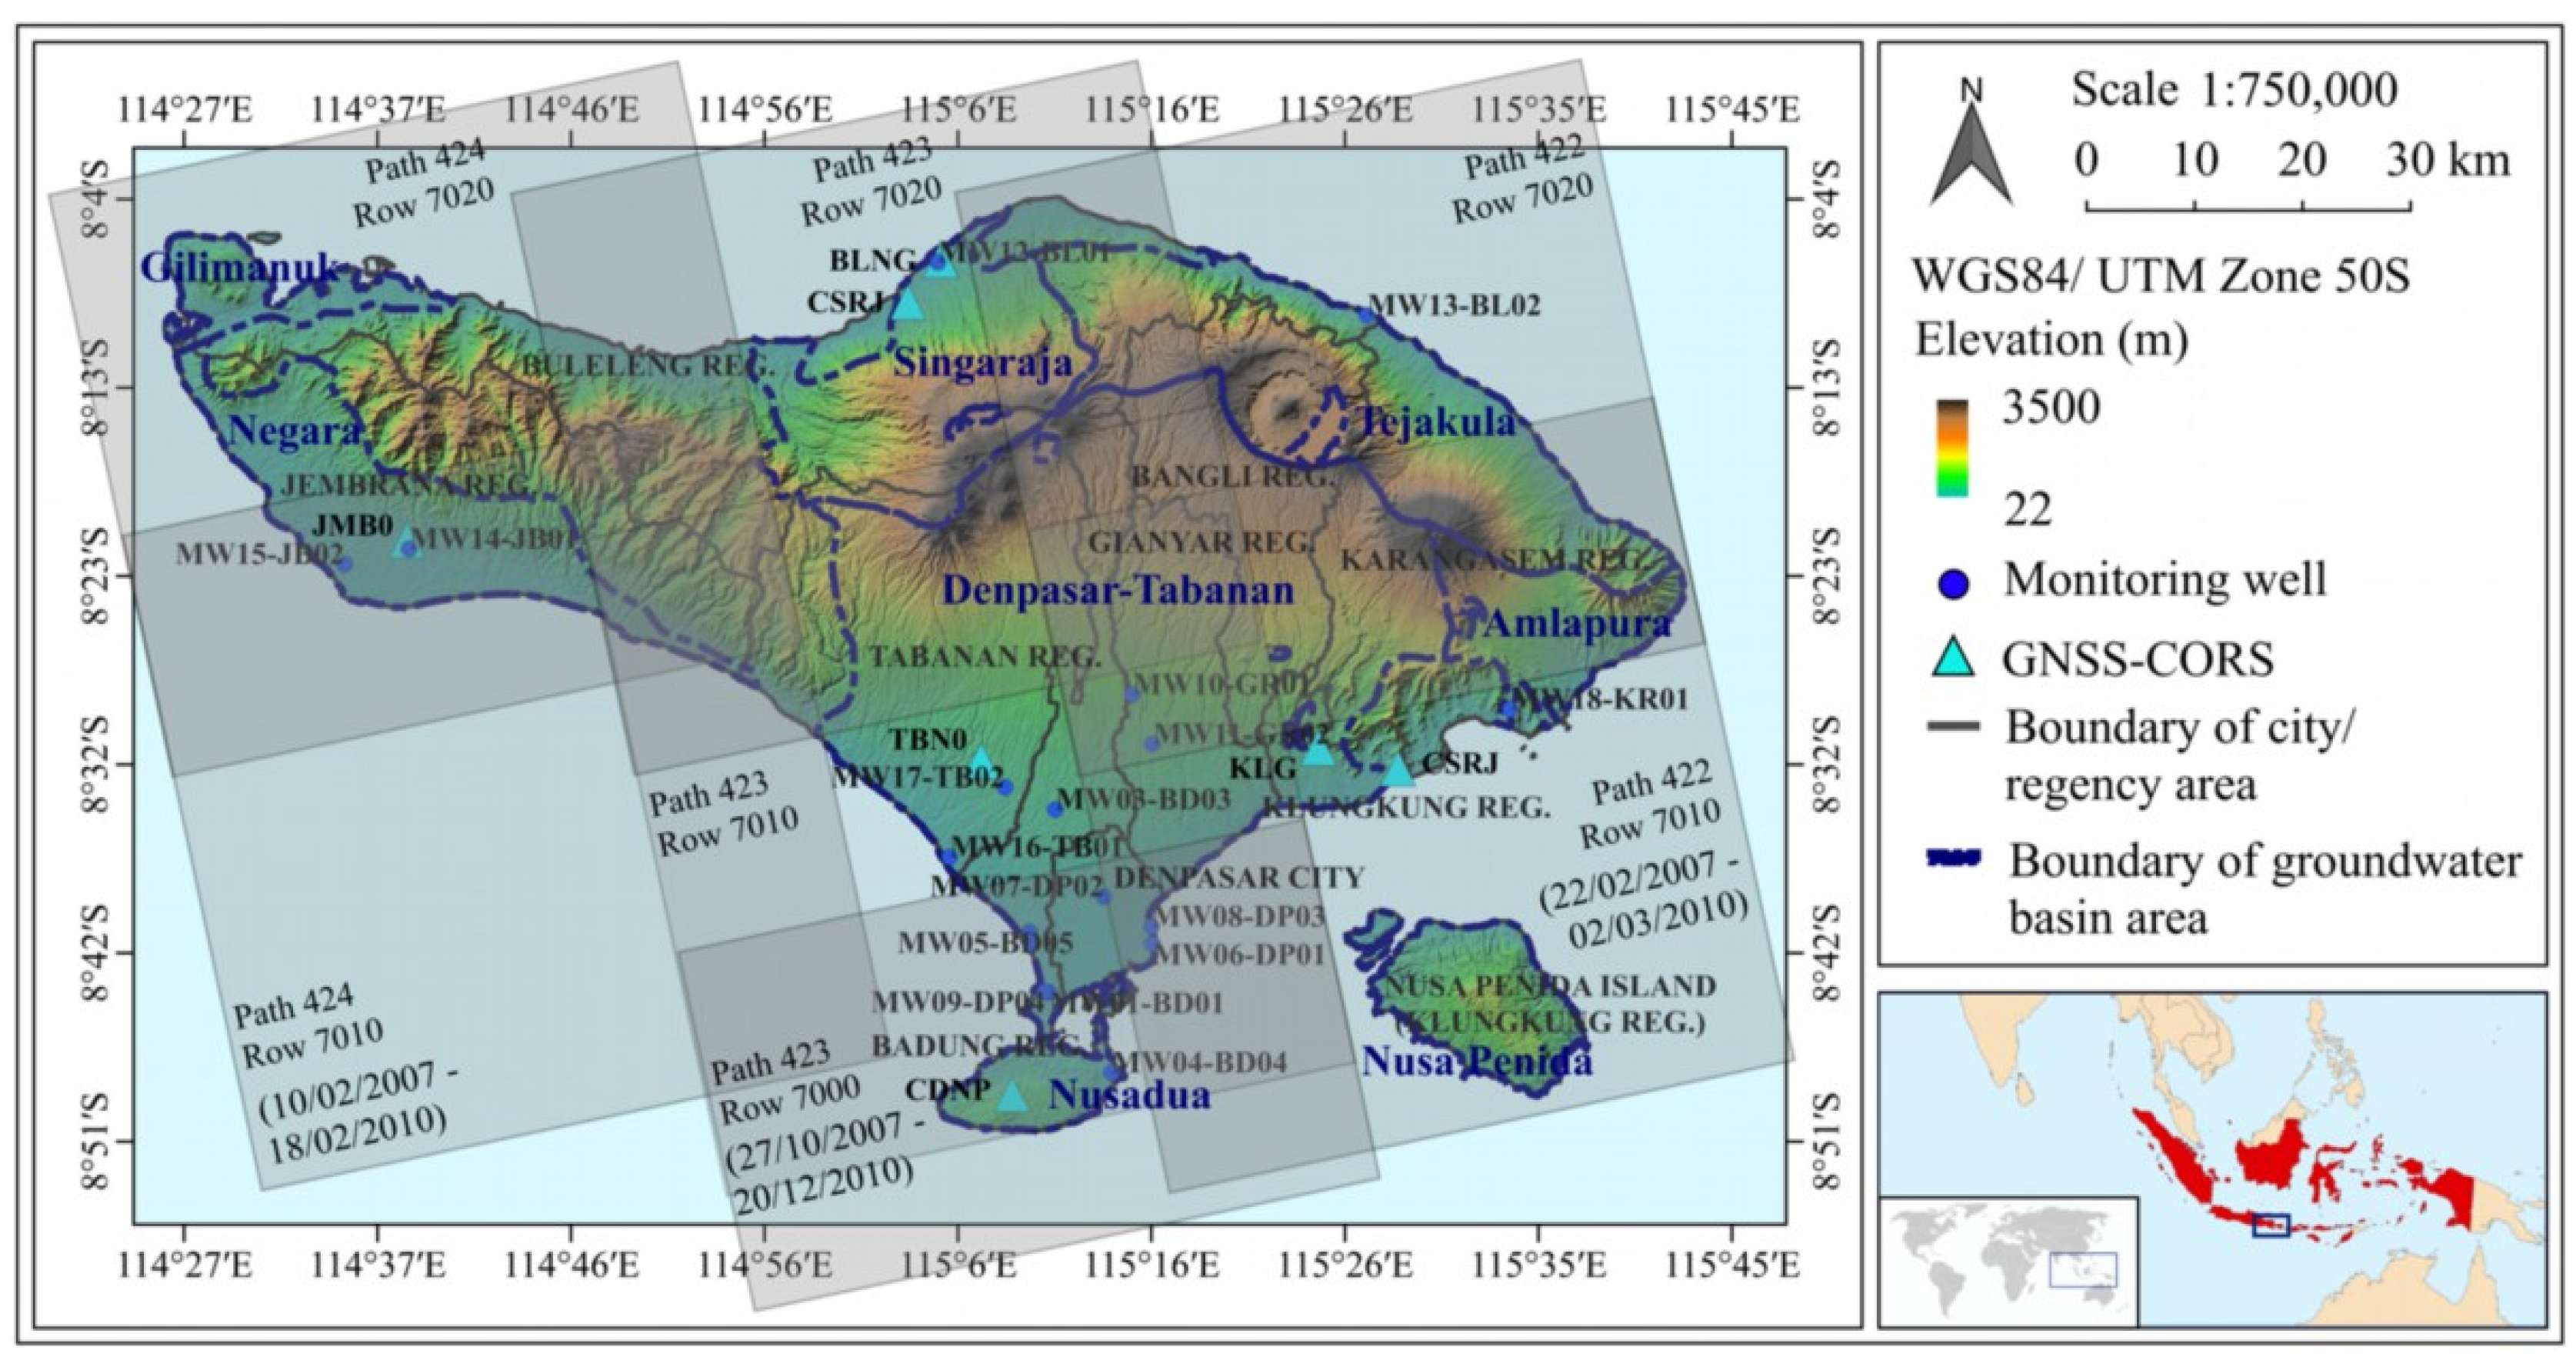
Figure 2.
The research scheme of hazard risk assessment for land subsidence caused by groundwater depletion. SAR: synthetic-aperture radar; ALOS: Advanced Land Observing Satellite; PALSAR: Phased Array type L-band SAR; DEM: Digital Elevation Model; SRTM: Shuttle Radar Topography Mission; GNSS: Global Navigation Satellite System; CORS: Continuously Operating Reference Station; InSAR: interferometric SAR; PS: Persistent Scatterer; SBAS: Small Baseline Subset.
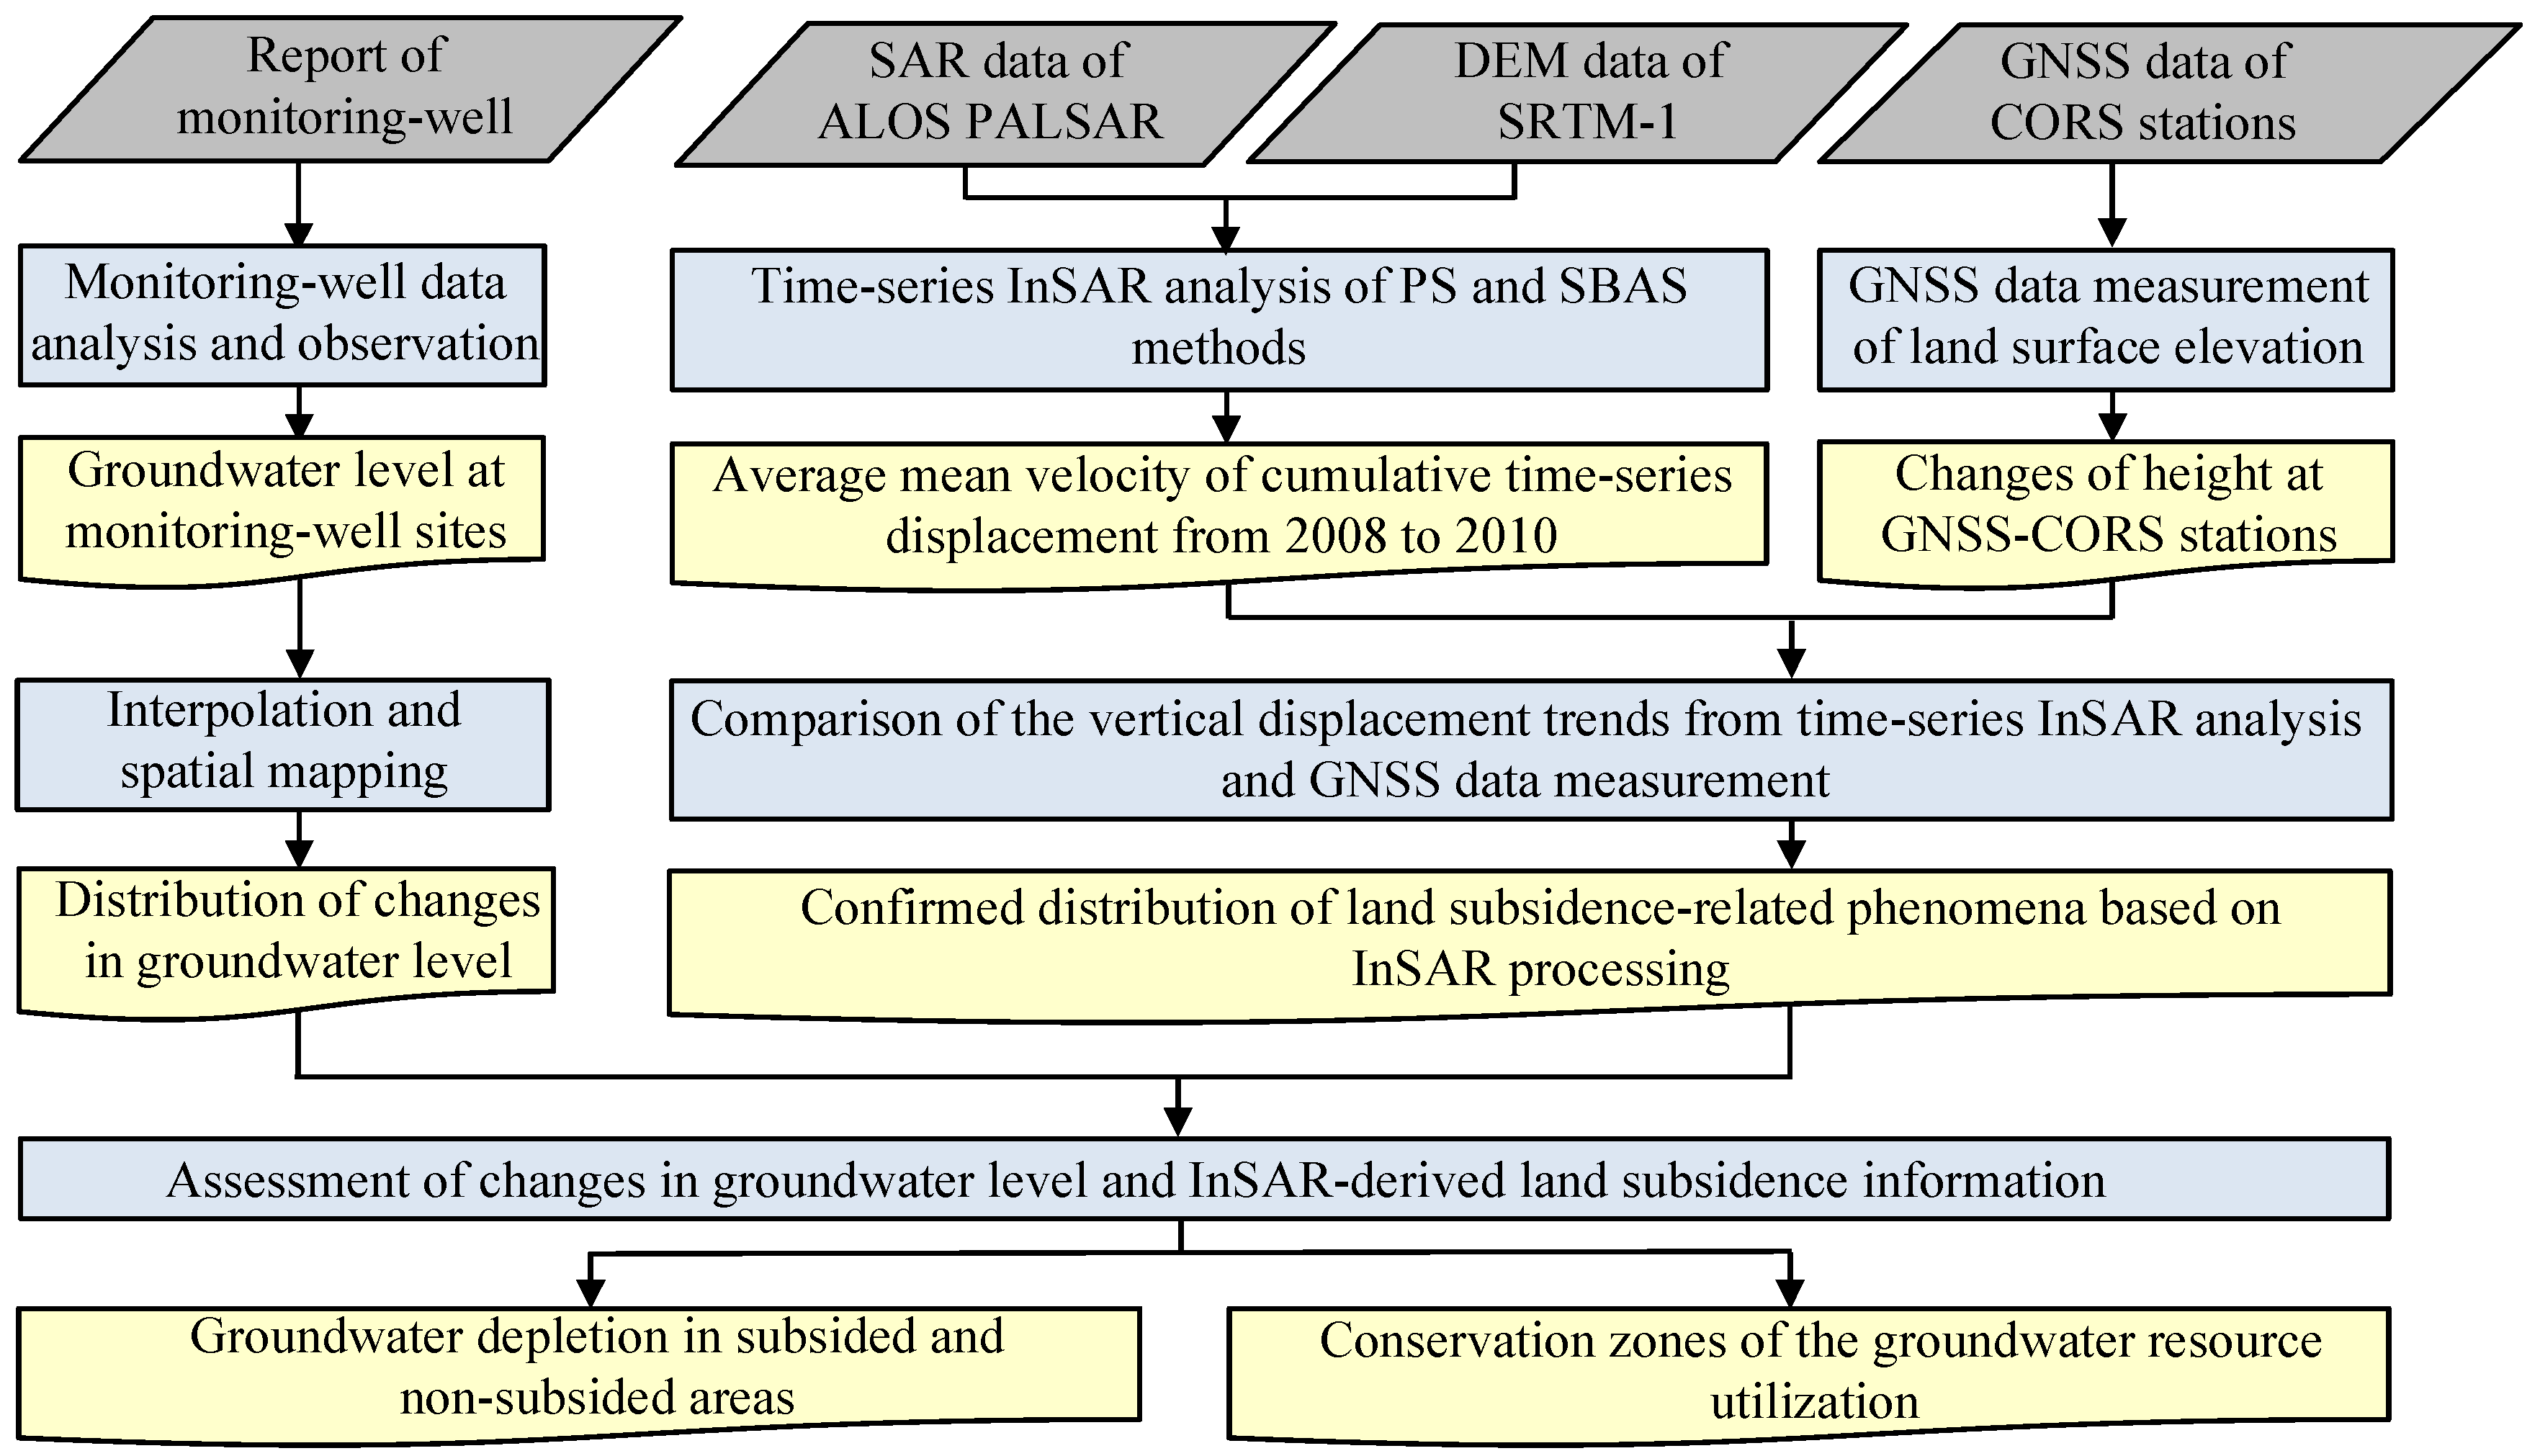
Figure 3.
Extraction of time-series displacement based on the PS and SBAS InSAR methods. SAR: synthetic-aperture radar; ALOS: Advanced Land Observing Satellite; PALSAR: Phased Array type L-band SAR; DEM: Digital Elevation Model; SRTM: Shuttle Radar Topography Mission; PS: Persistent Scatterer; SBAS: Small Baseline Subset; PSs: Persistent Scatterer; DSs: Distributed Scatterers.
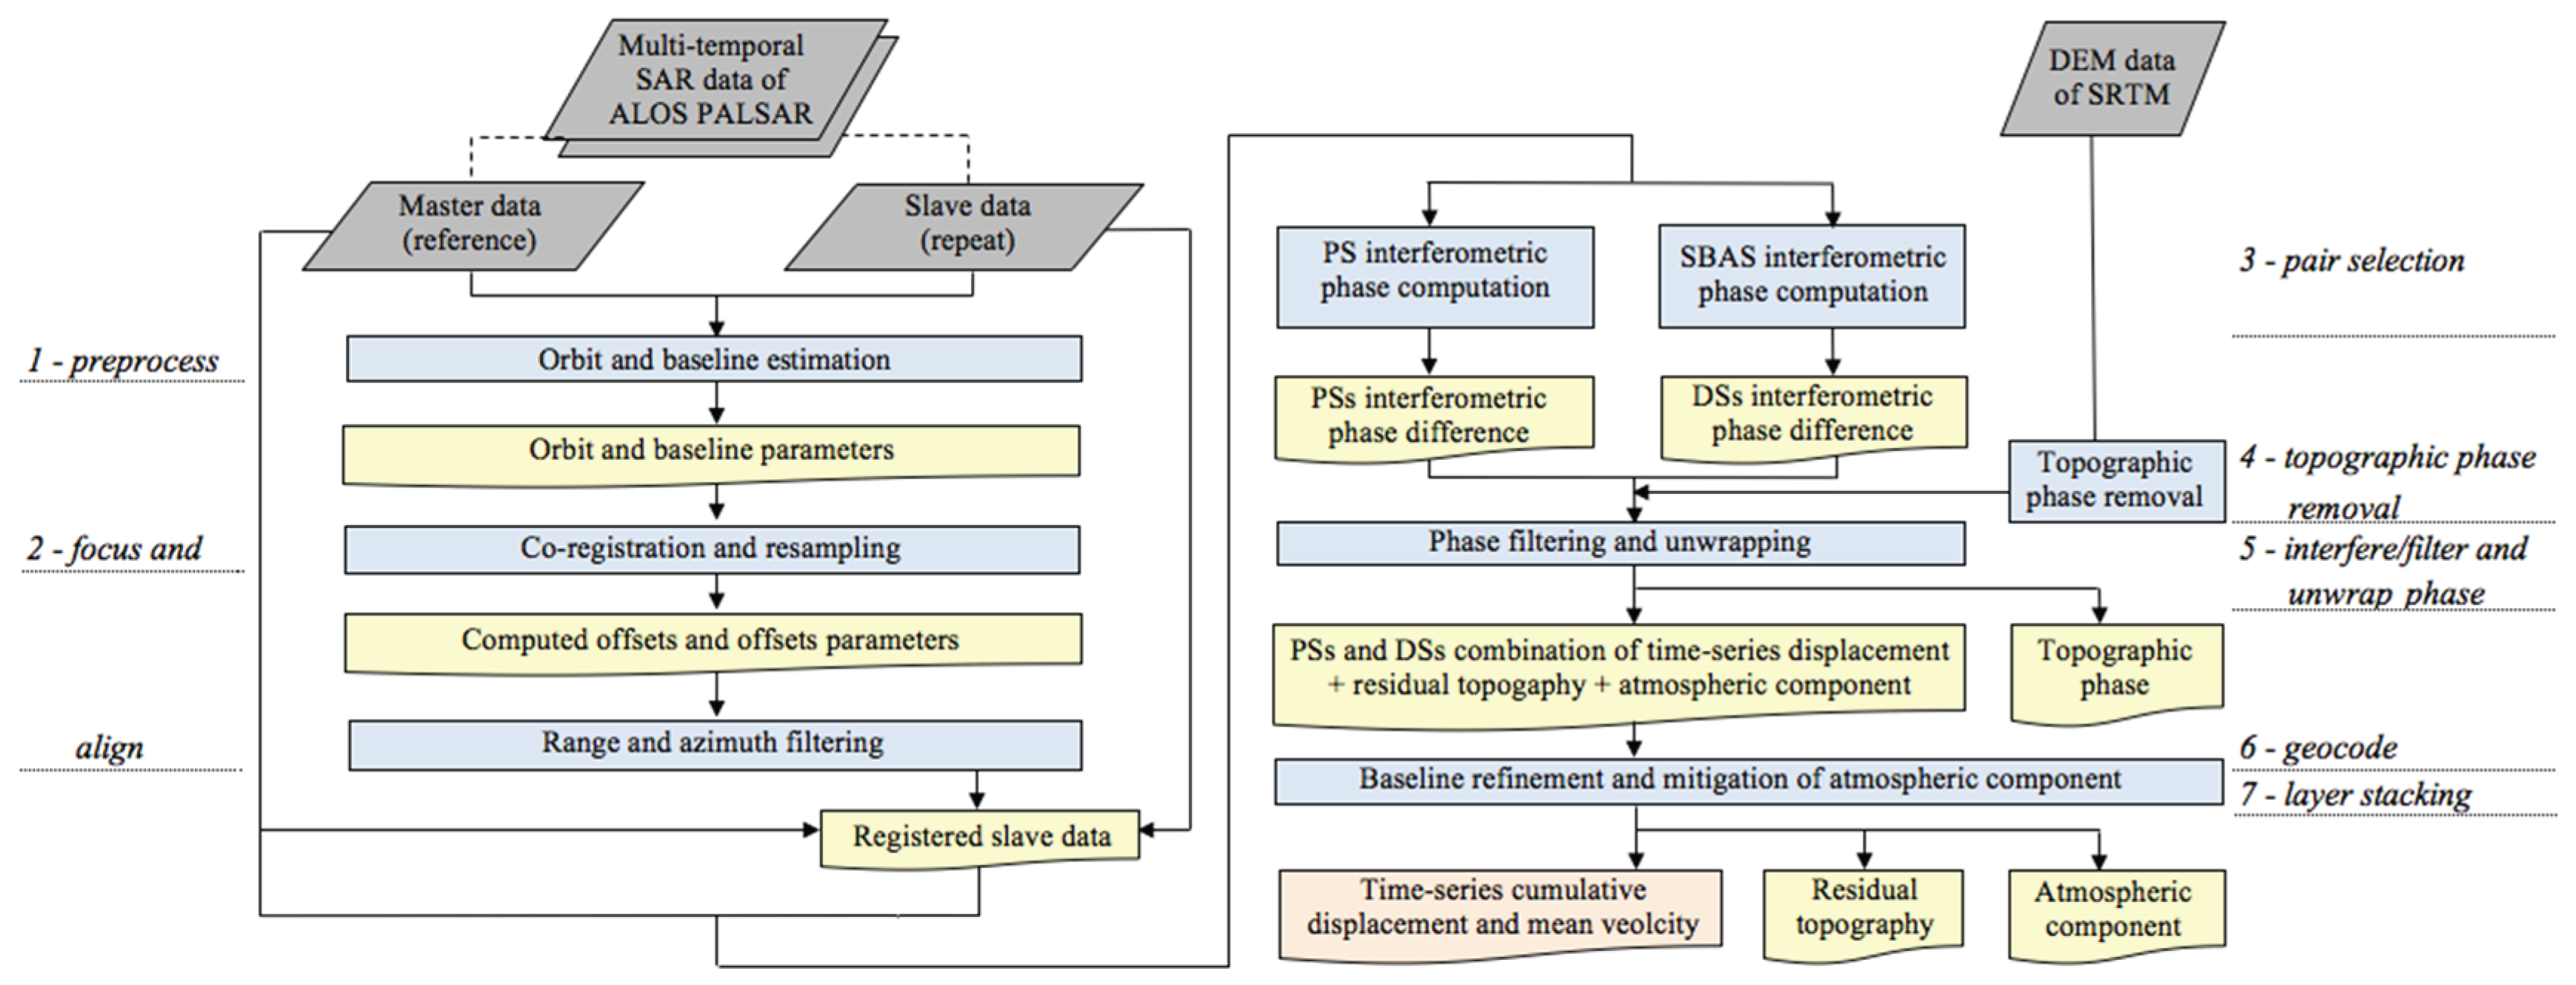
Figure 4.
Map of the spatial distribution of groundwater depletion in Bali, Indonesia, from 2008–2017. The color range from red, yellow, green, and blue indicates groundwater level changes from a decrease value of −66.24% (negative) to an increasing value of 25.44% (positive). The area with grey color represents a non-groundwater basin with no groundwater level change. WGS84: World Geodetic System 1984; UTM: Universal Transverse Mercator.
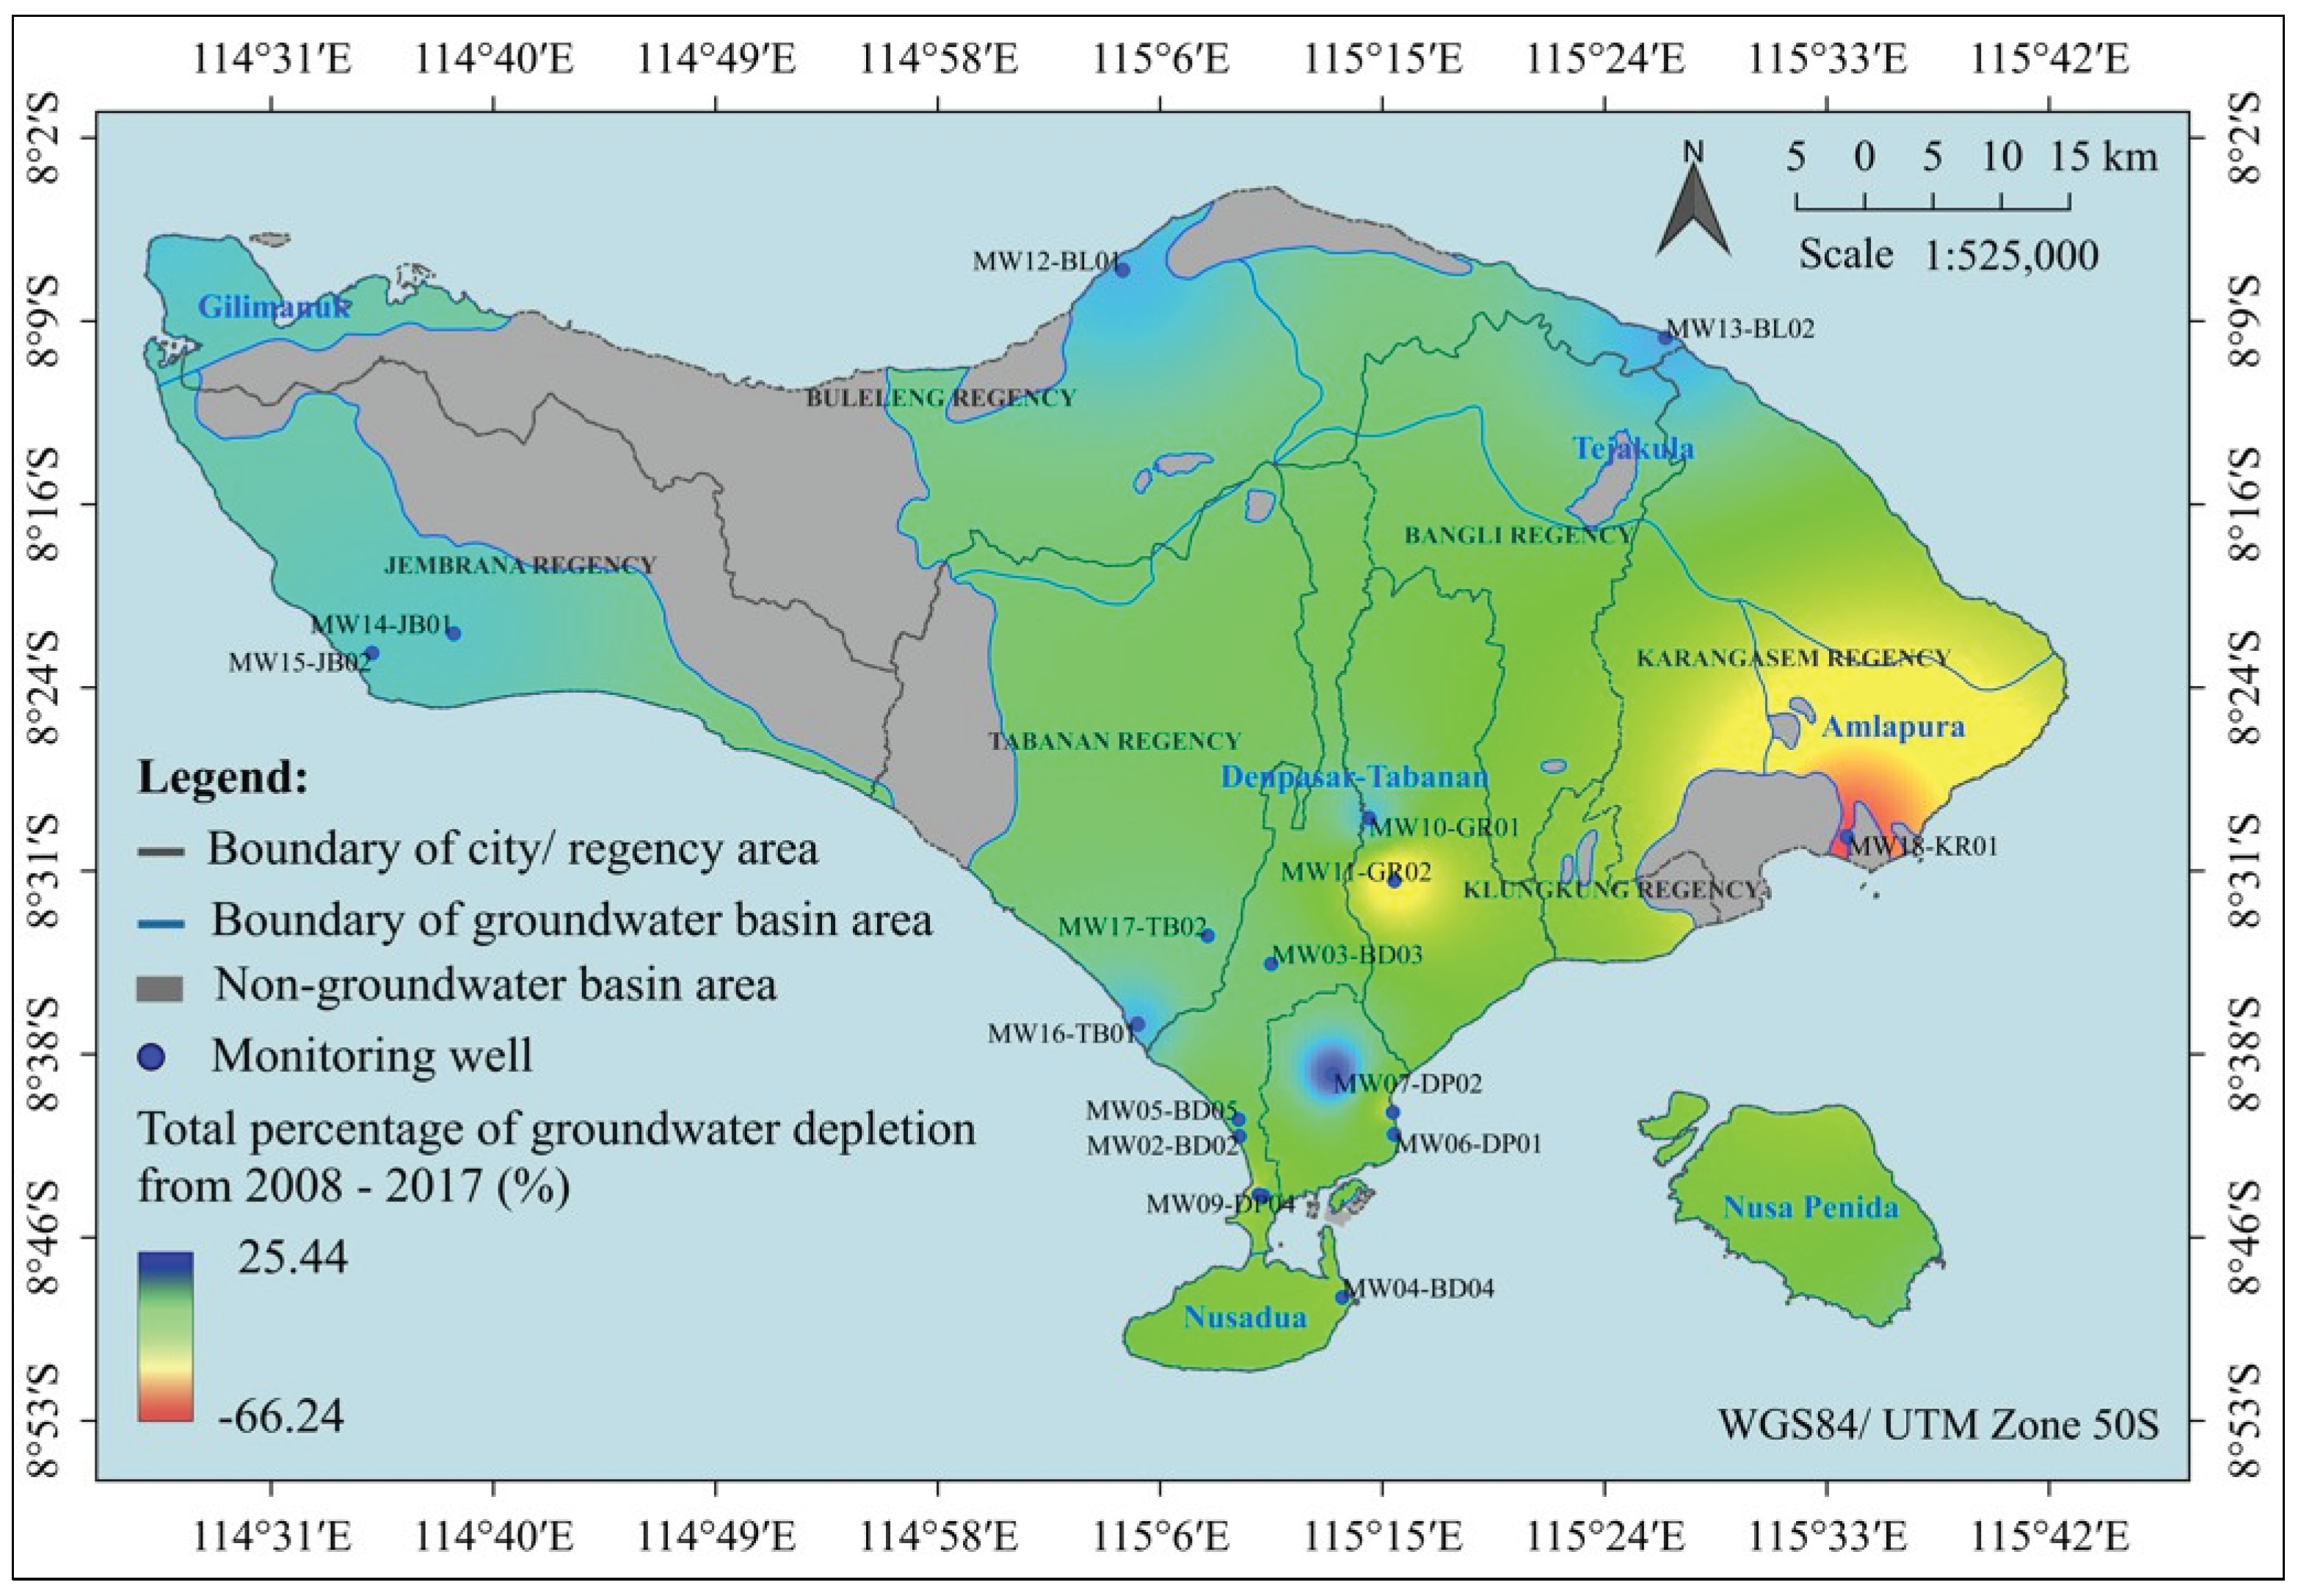
Figure 5.
Baseline scatter charts for interferogram pair selection of the PS and SBAS methods of InSAR using the ALOS PALSAR data in Bali from 2007 to 2010. The scatter charts present the baseline distribution for path 422 row 7010, the track with the joint-largest number of interferogram pairs, and path 423 row 7000, the track with the smallest number of interferogram pairs.
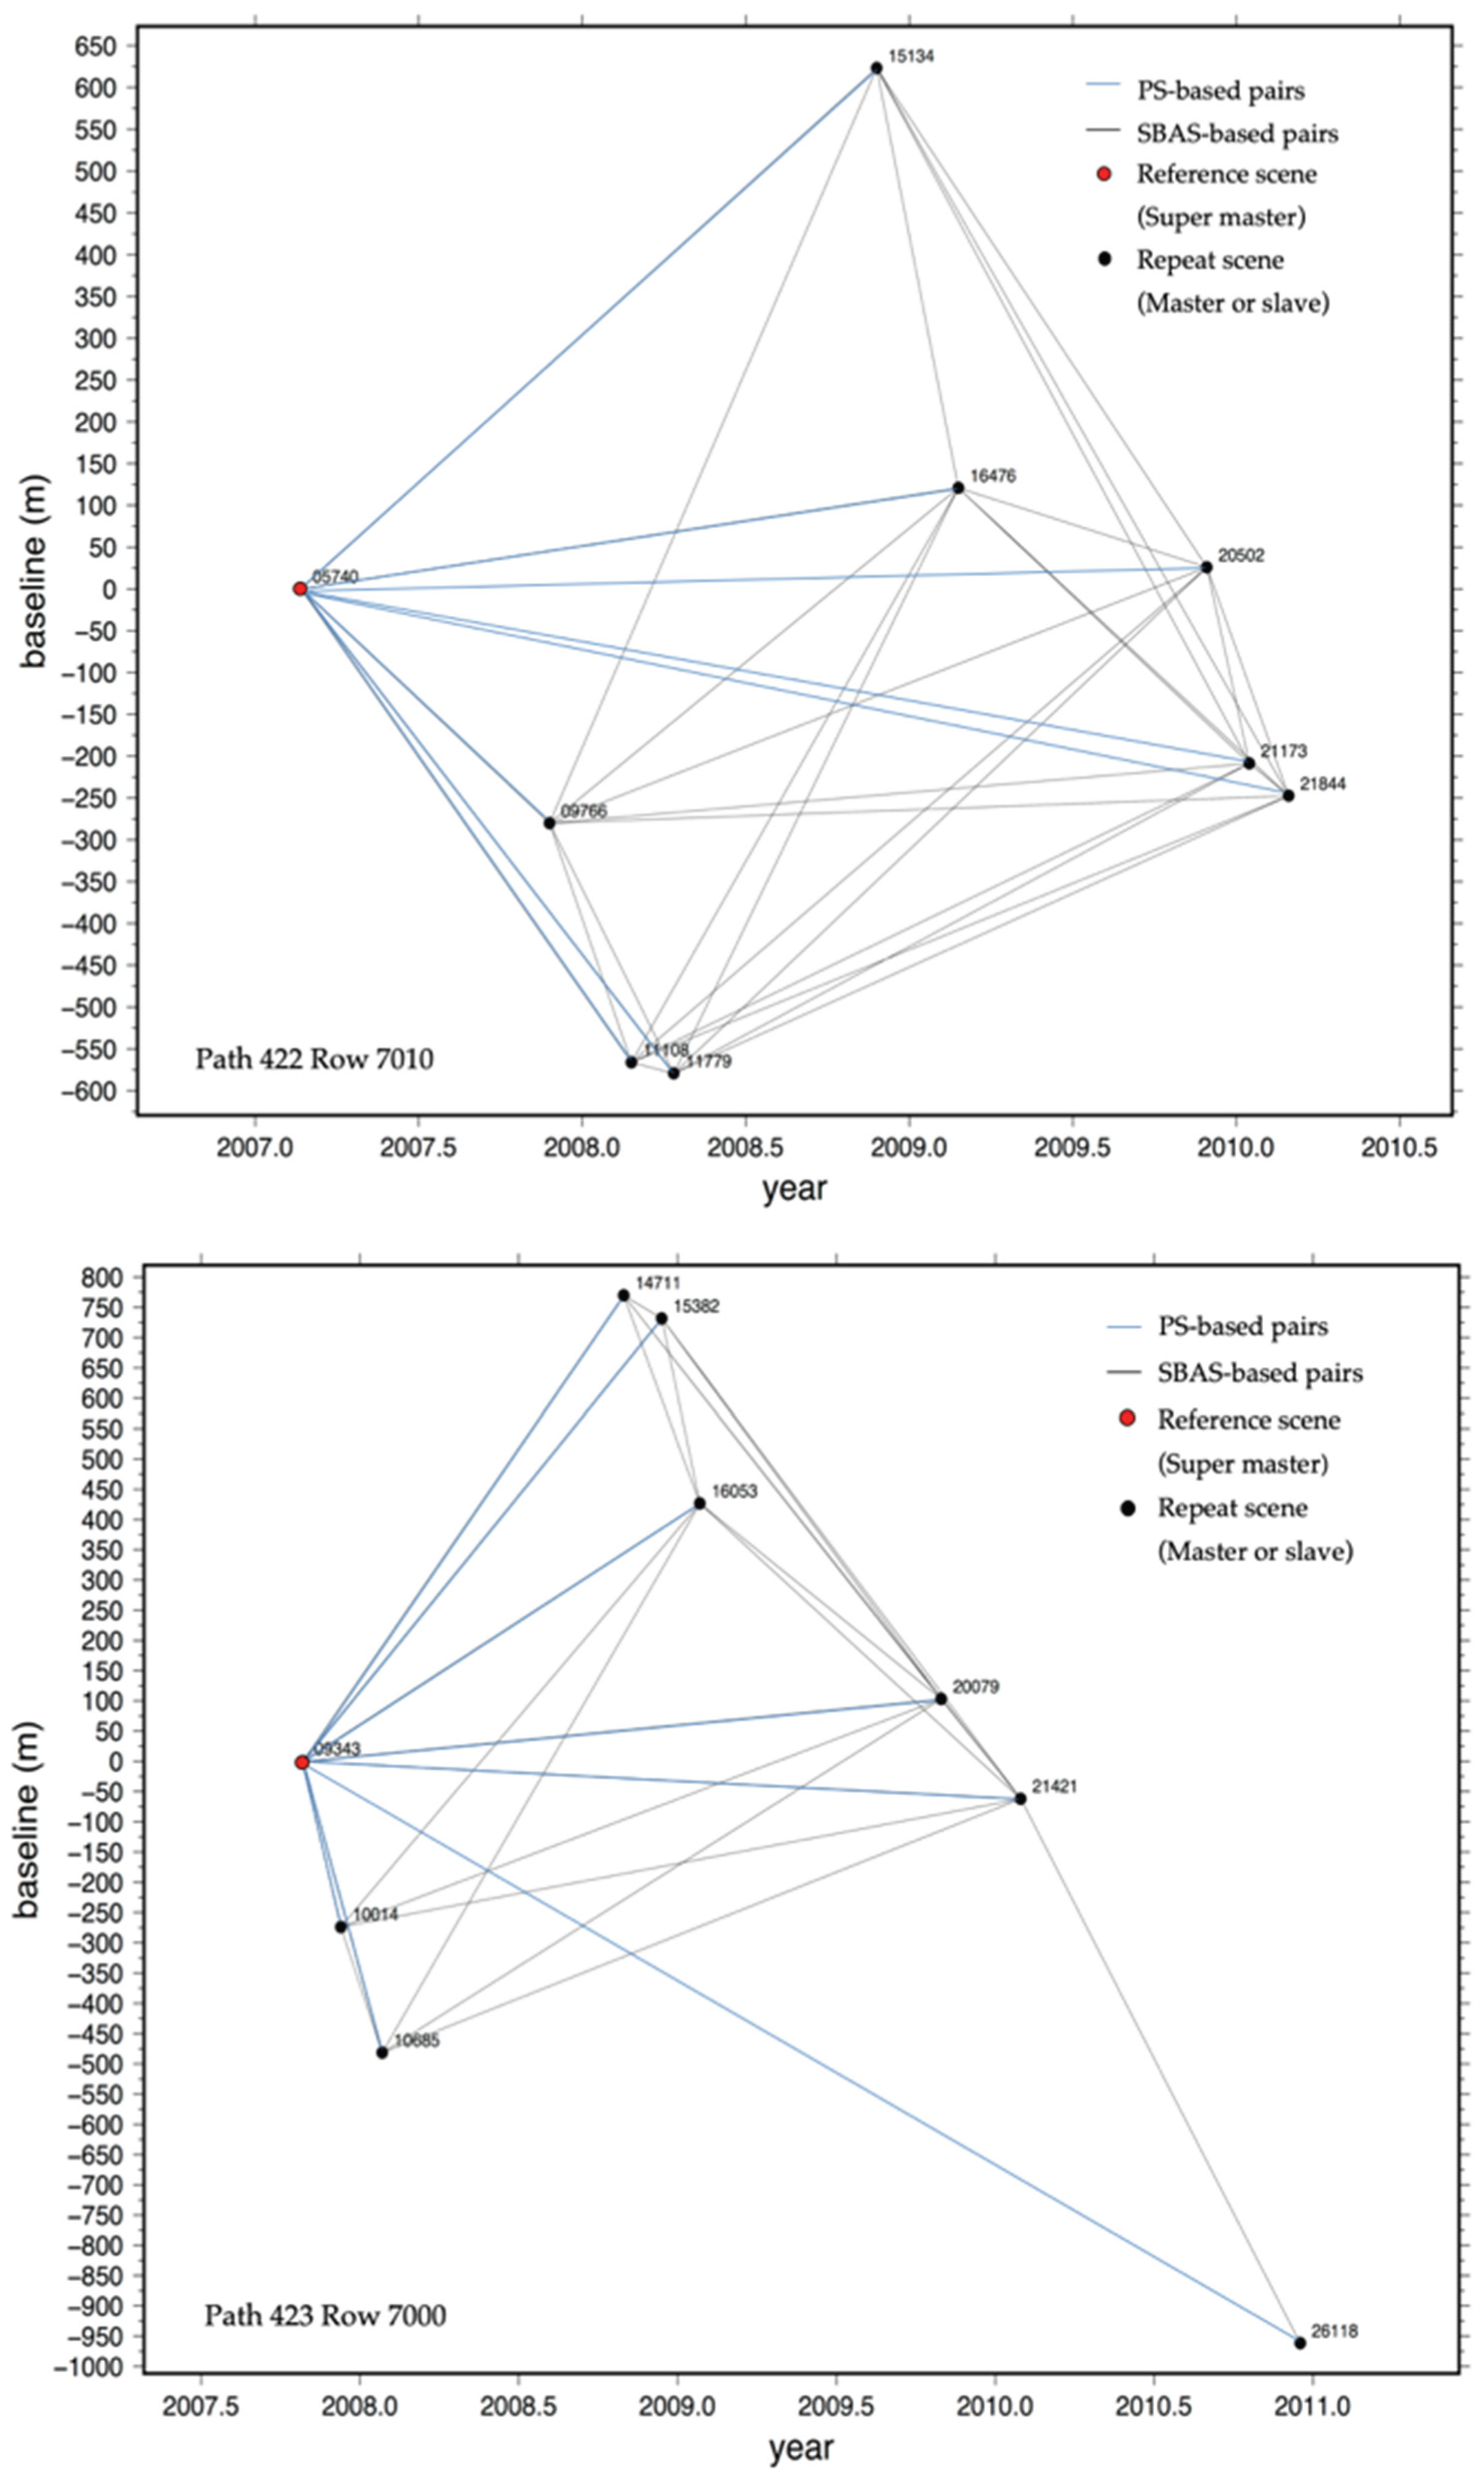
Figure 6.
Time-series cumulative displacement generated from InSAR processing throughout the area of Bali, Indonesia, from 2007 to 2010. The presented result is the average time-series cumulative displacement for path 422 (row 7010 and 7020), path 423 (row 7000, 7010, and 7020), and path 424 (row 7010 and 7020) at nine observation periods. The initial value is considered as the first observation period condition without displacement (0). The displacement for both upward and downward directions indicated a similar trend from the second to ninth observation period. The upward (high level) and downward (low level) displacement at the same observation period is connected with a high–low line. In particular, the downward displacement signified fluctuating movement with a decreasing inclination during the second to the ninth observation period, from −25.7 mm to −31.9 mm.
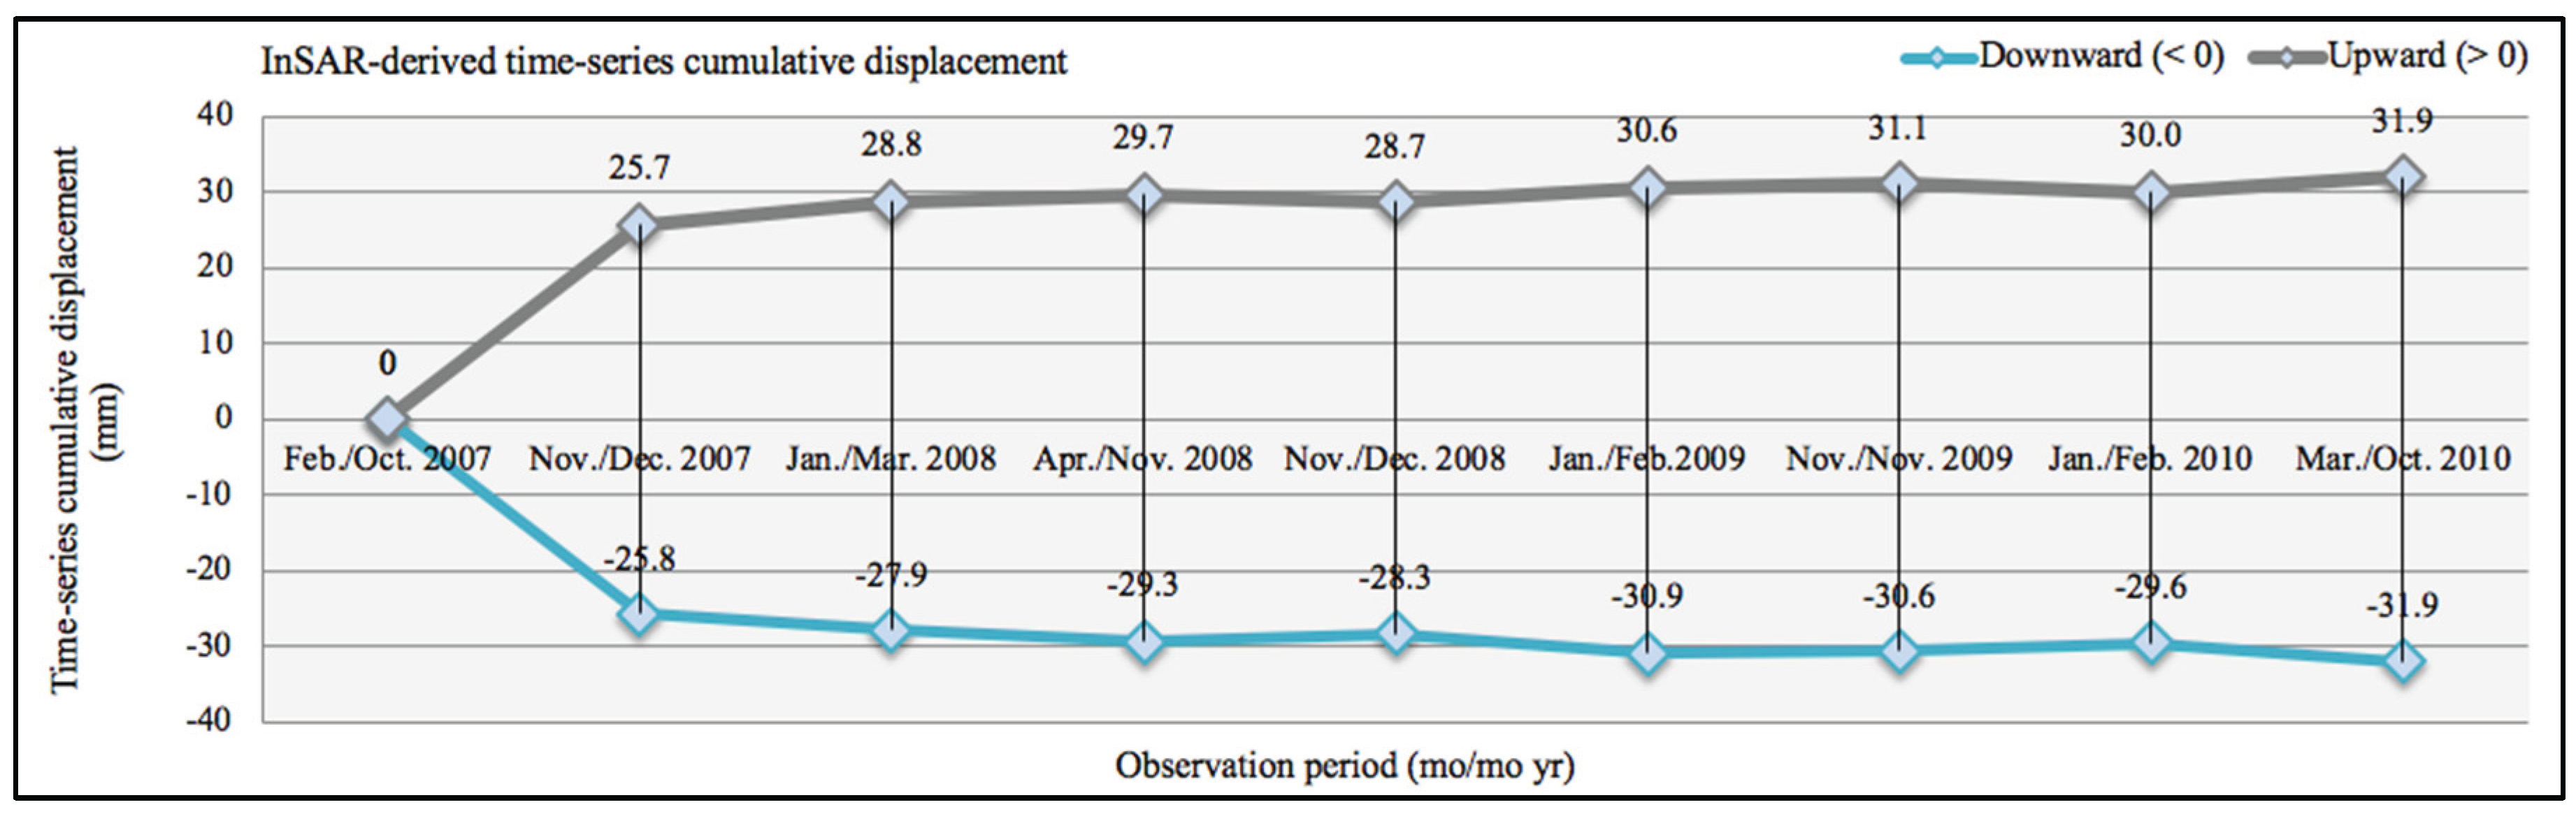
Figure 7.
Map showing the results of the mean displacement velocity. The mean velocity of downward displacement (i.e., subsidence) was –8.4 mm/yr. Areas of subsidence are shown with red arrows, which correspond to negative mean velocity values presented in red-to-yellow colors. Monitoring wells with groundwater depletion are plotted on the map to obtain the correlation of the hazard to the risk of subsidence based on the InSAR processing results.
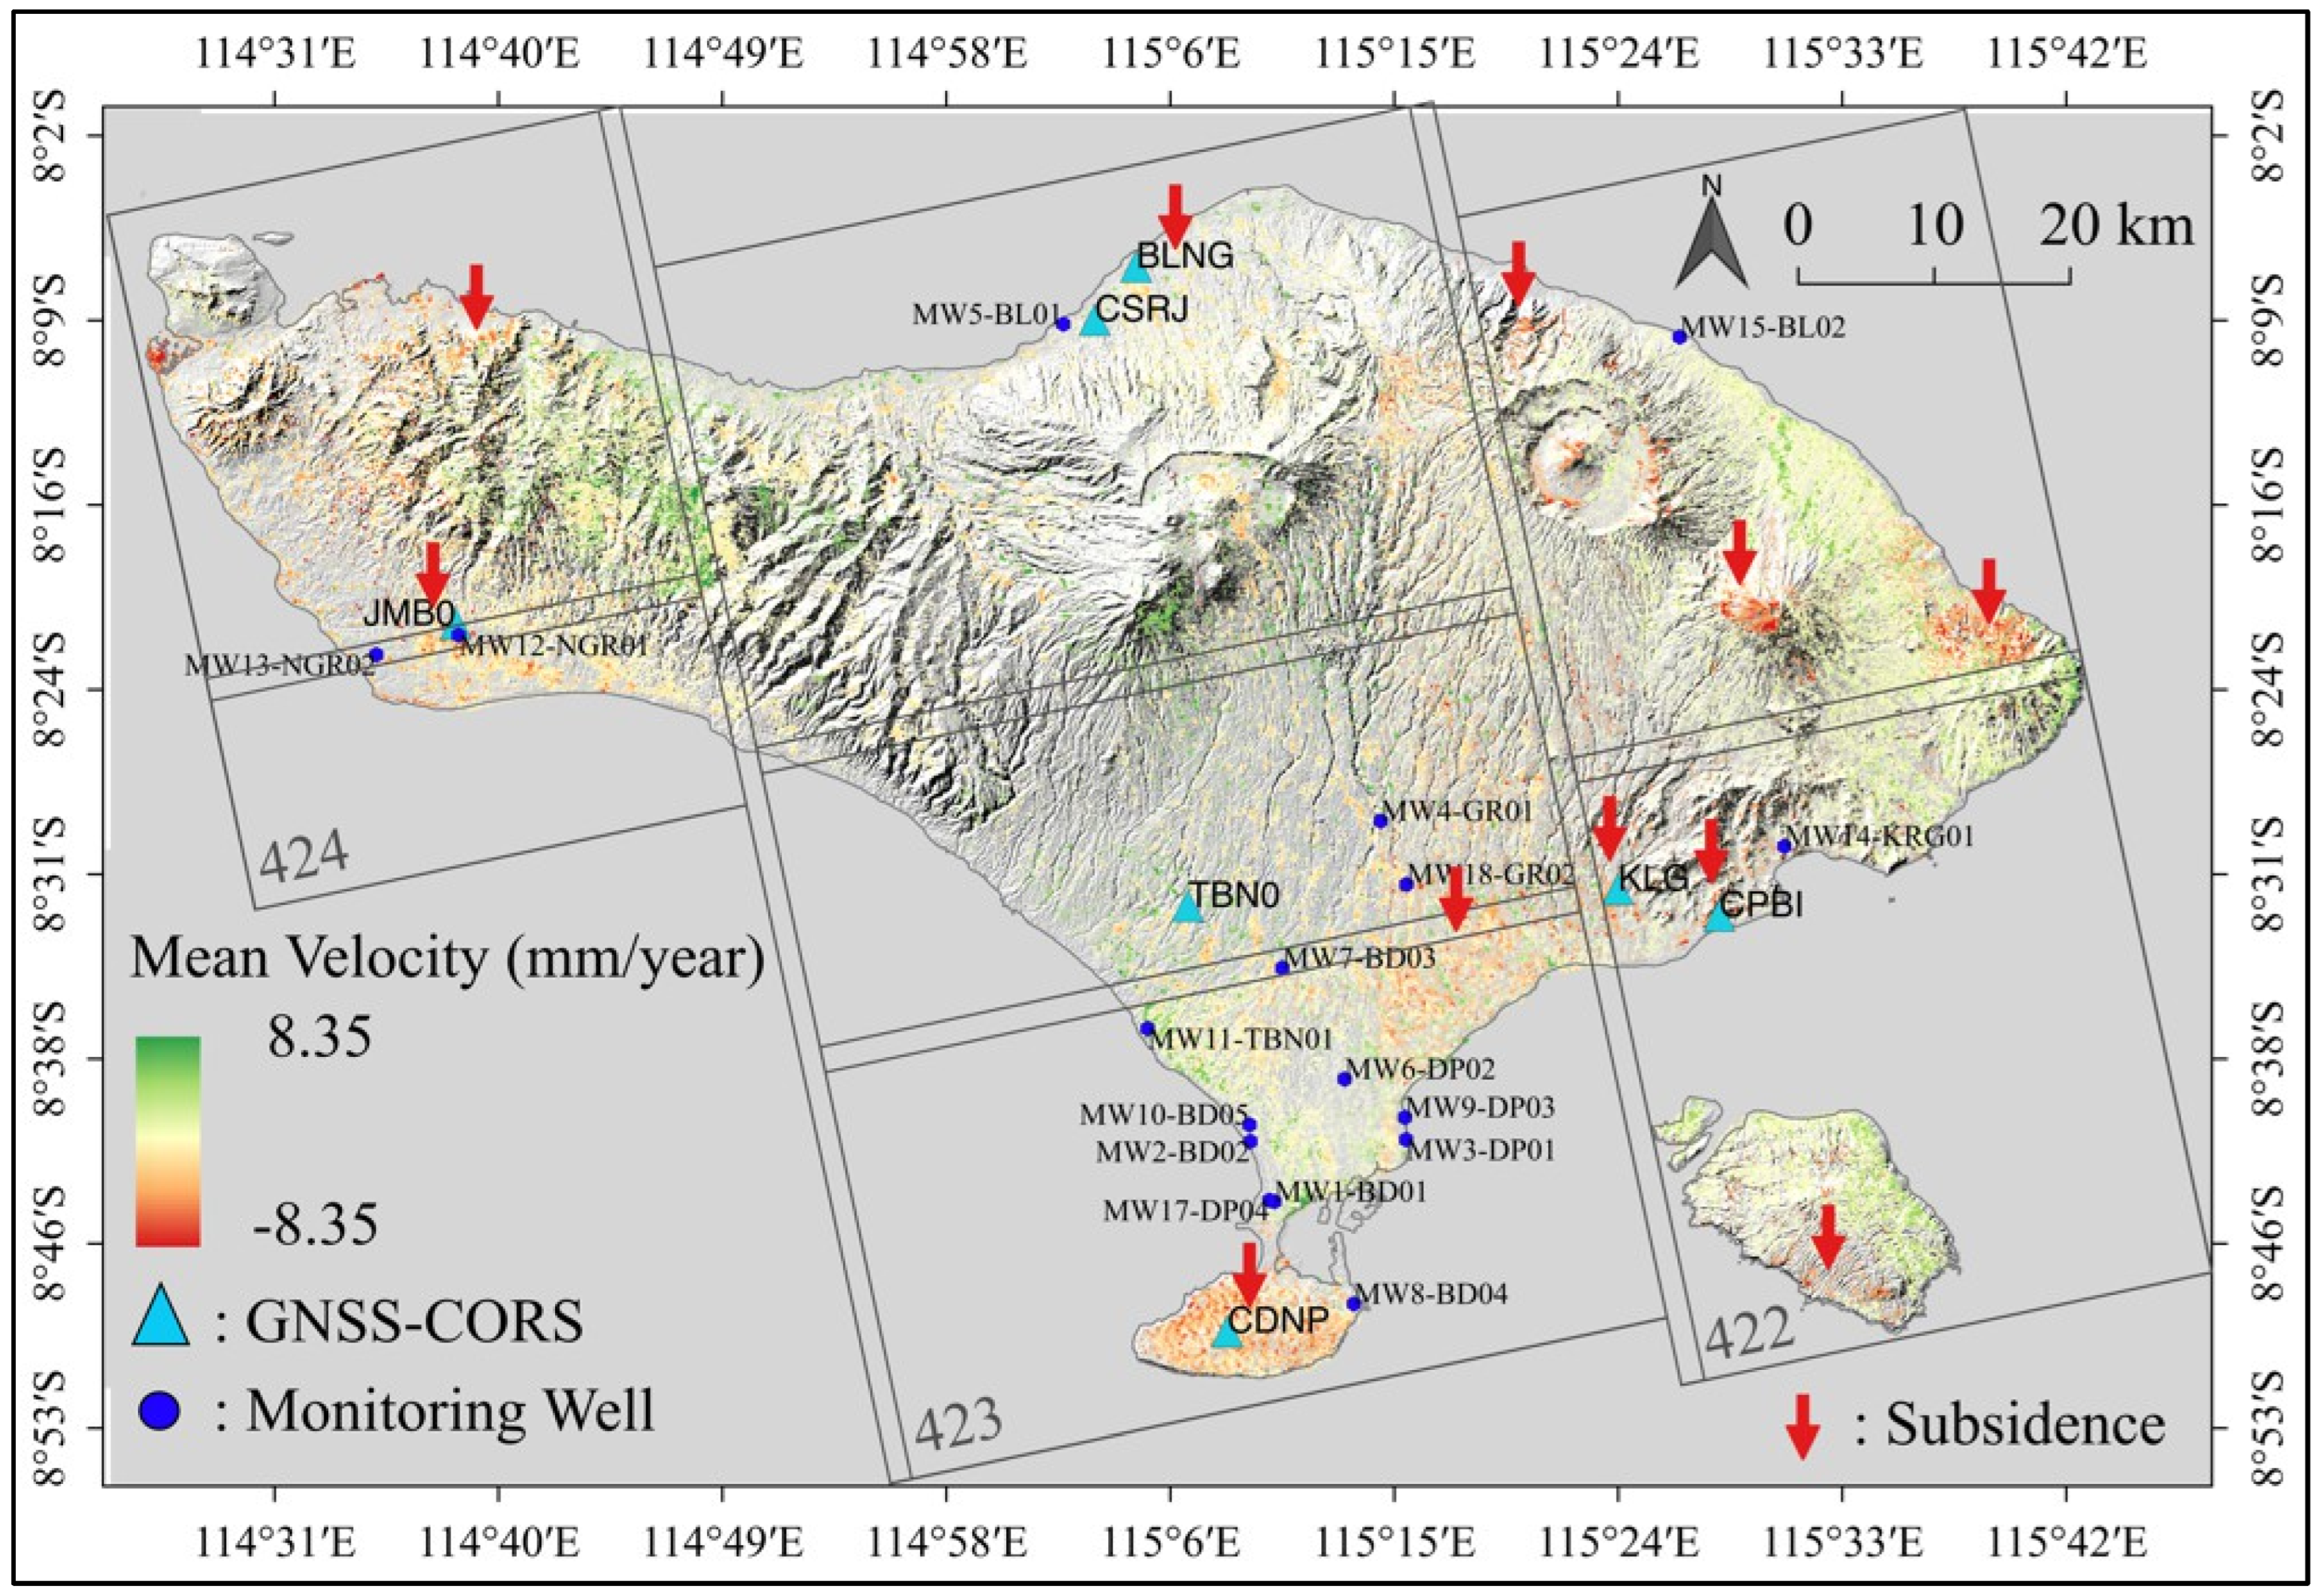
Figure 8.
Land displacement measurements generated from InSAR and RTK-GNSS. The InSAR-based measurement represents vertical displacement, and the RTK-GNSS demonstrates the station elevation measurement. The displacement was obtained during a similar observation period. The measurement results at station CDNP cover the period from July to December 2010. The measurement results at station CPBI cover the period from February 2008 to March 2010. The average Root Mean Square Error (RMSE) of the measurements at stations CDNP and CPBI is 0.003.
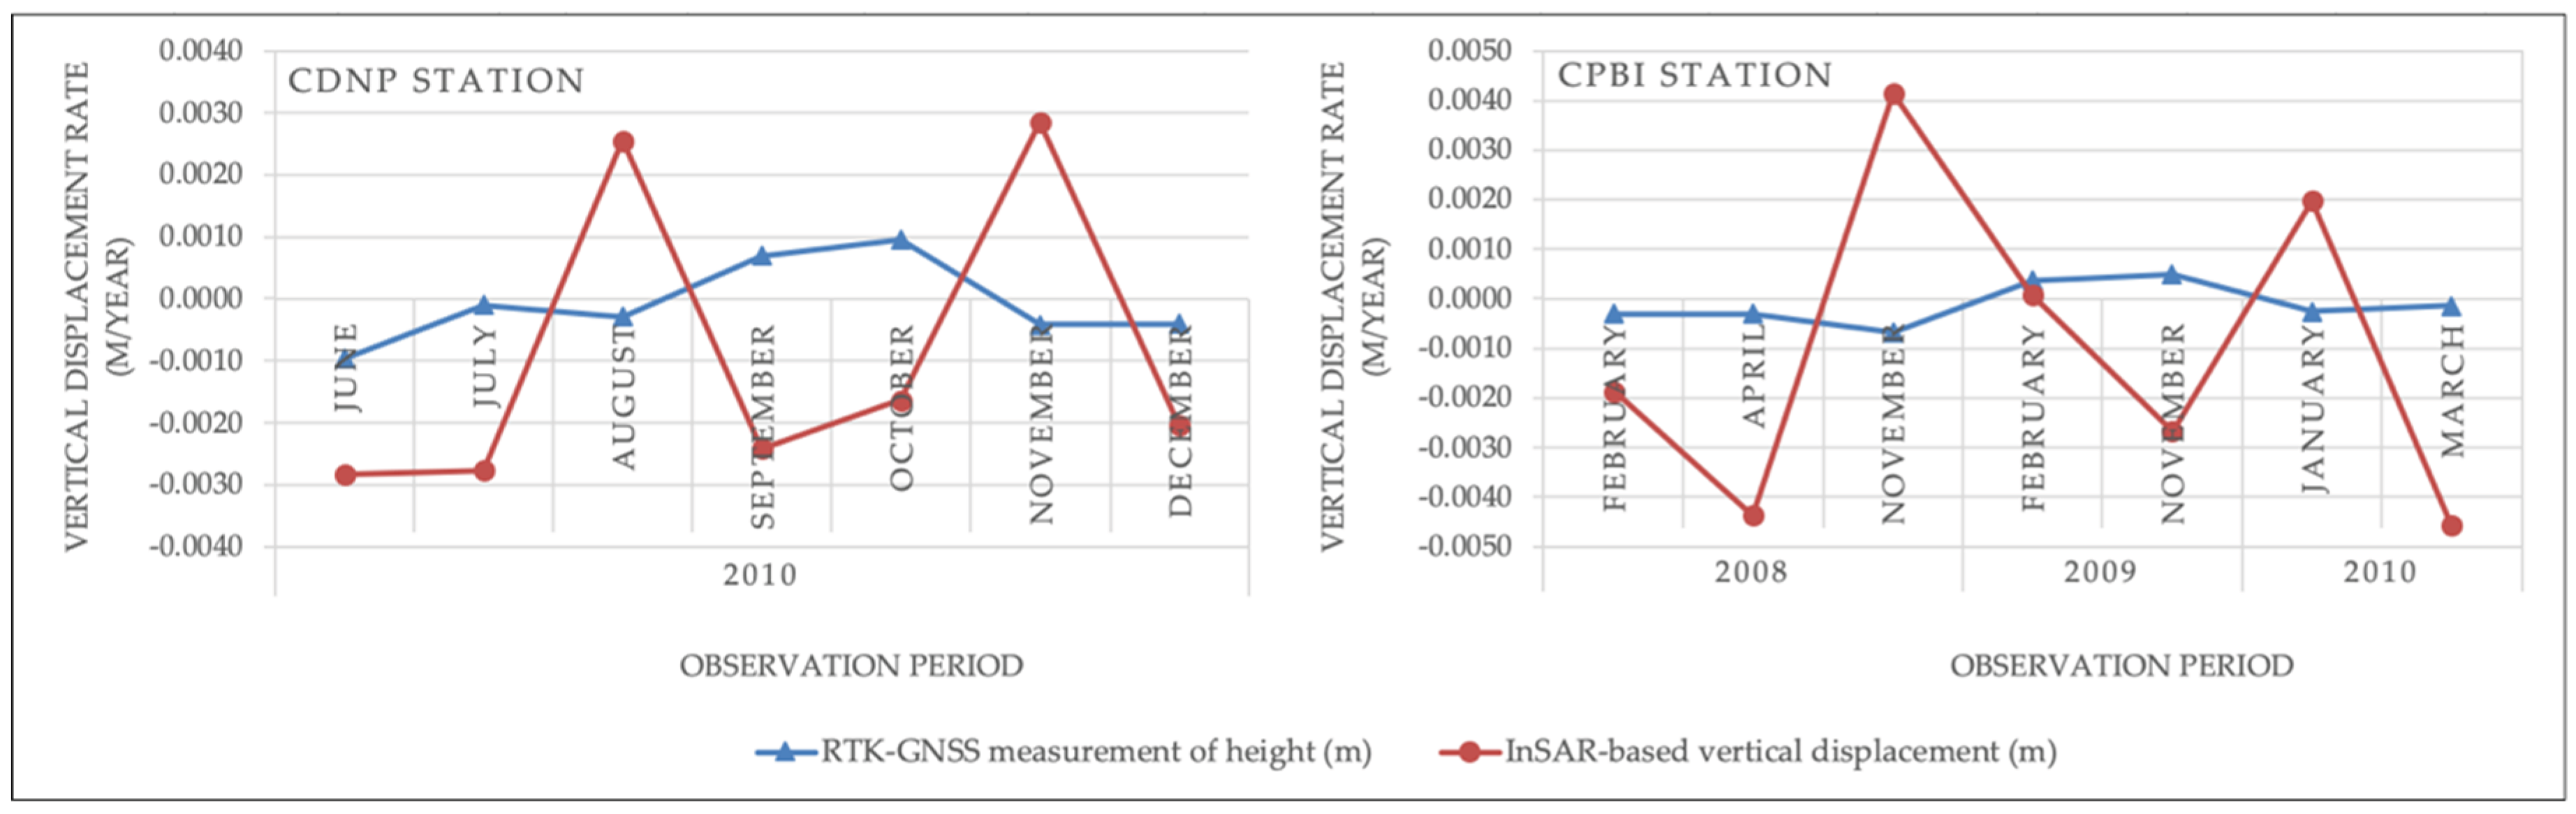
Figure 9.
Correlation of groundwater depletion hazard to the risk of land subsidence. The charts plot the total groundwater depletion in 2008–2017 and the subsidence rate in 2007–2010 at 18 monitoring wells. The zonation of groundwater conservation was divided into four zones, i.e., safe, vulnerable, critical, and damage. The criteria utilized for the classification are the level of groundwater depletion and the absence/presence of subsidence phenomenon.
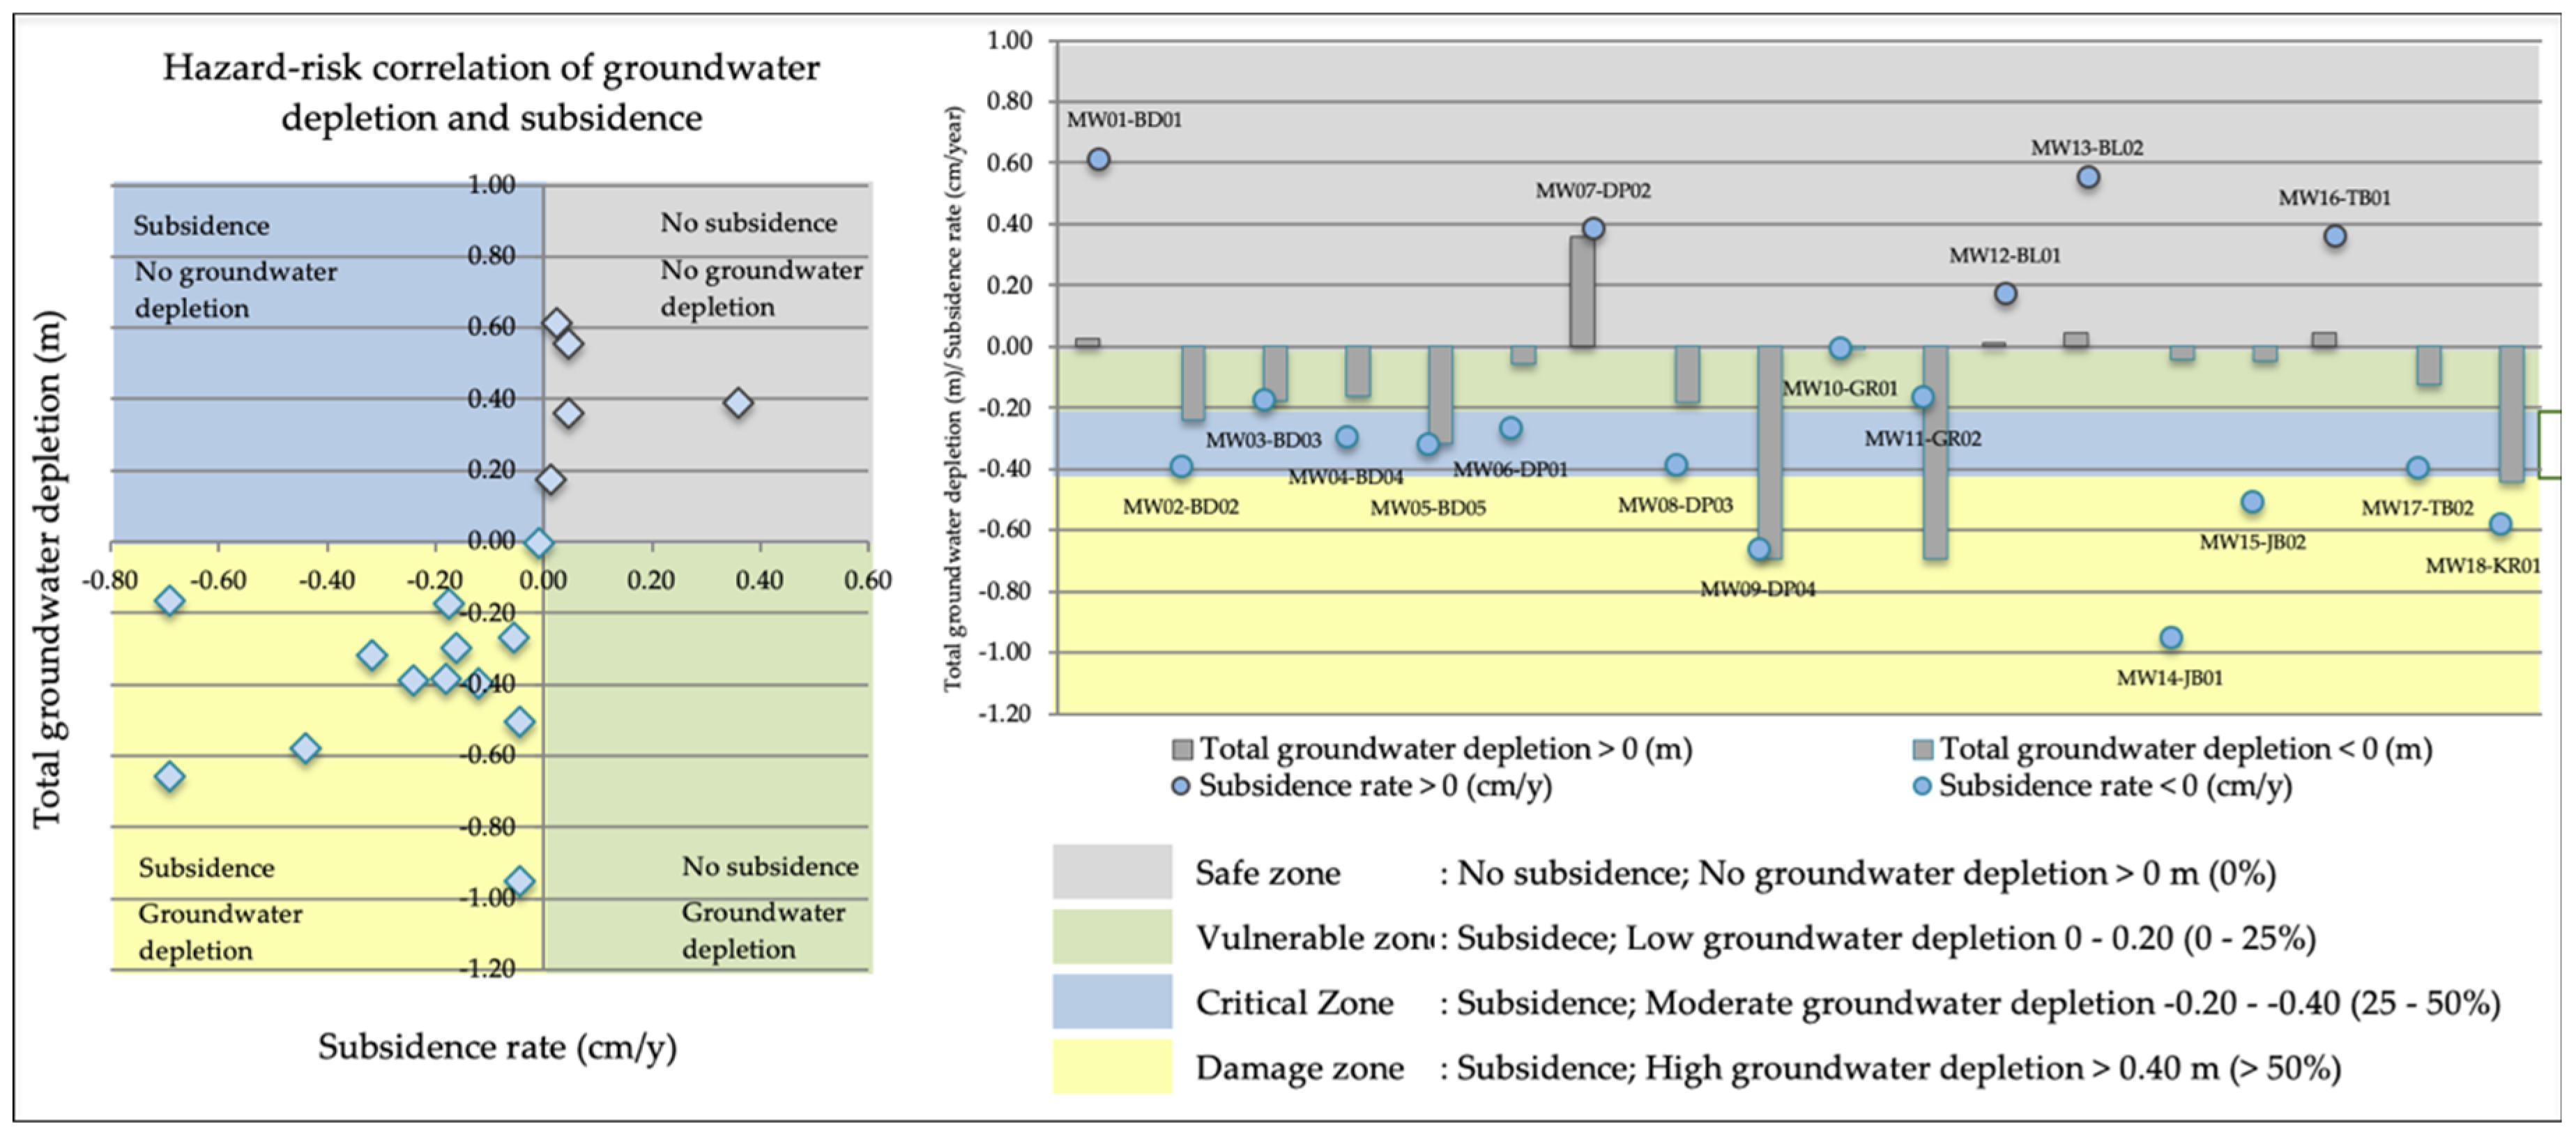
Figure 10.
Map of the zonation of groundwater conservation in Bali, Indonesia.
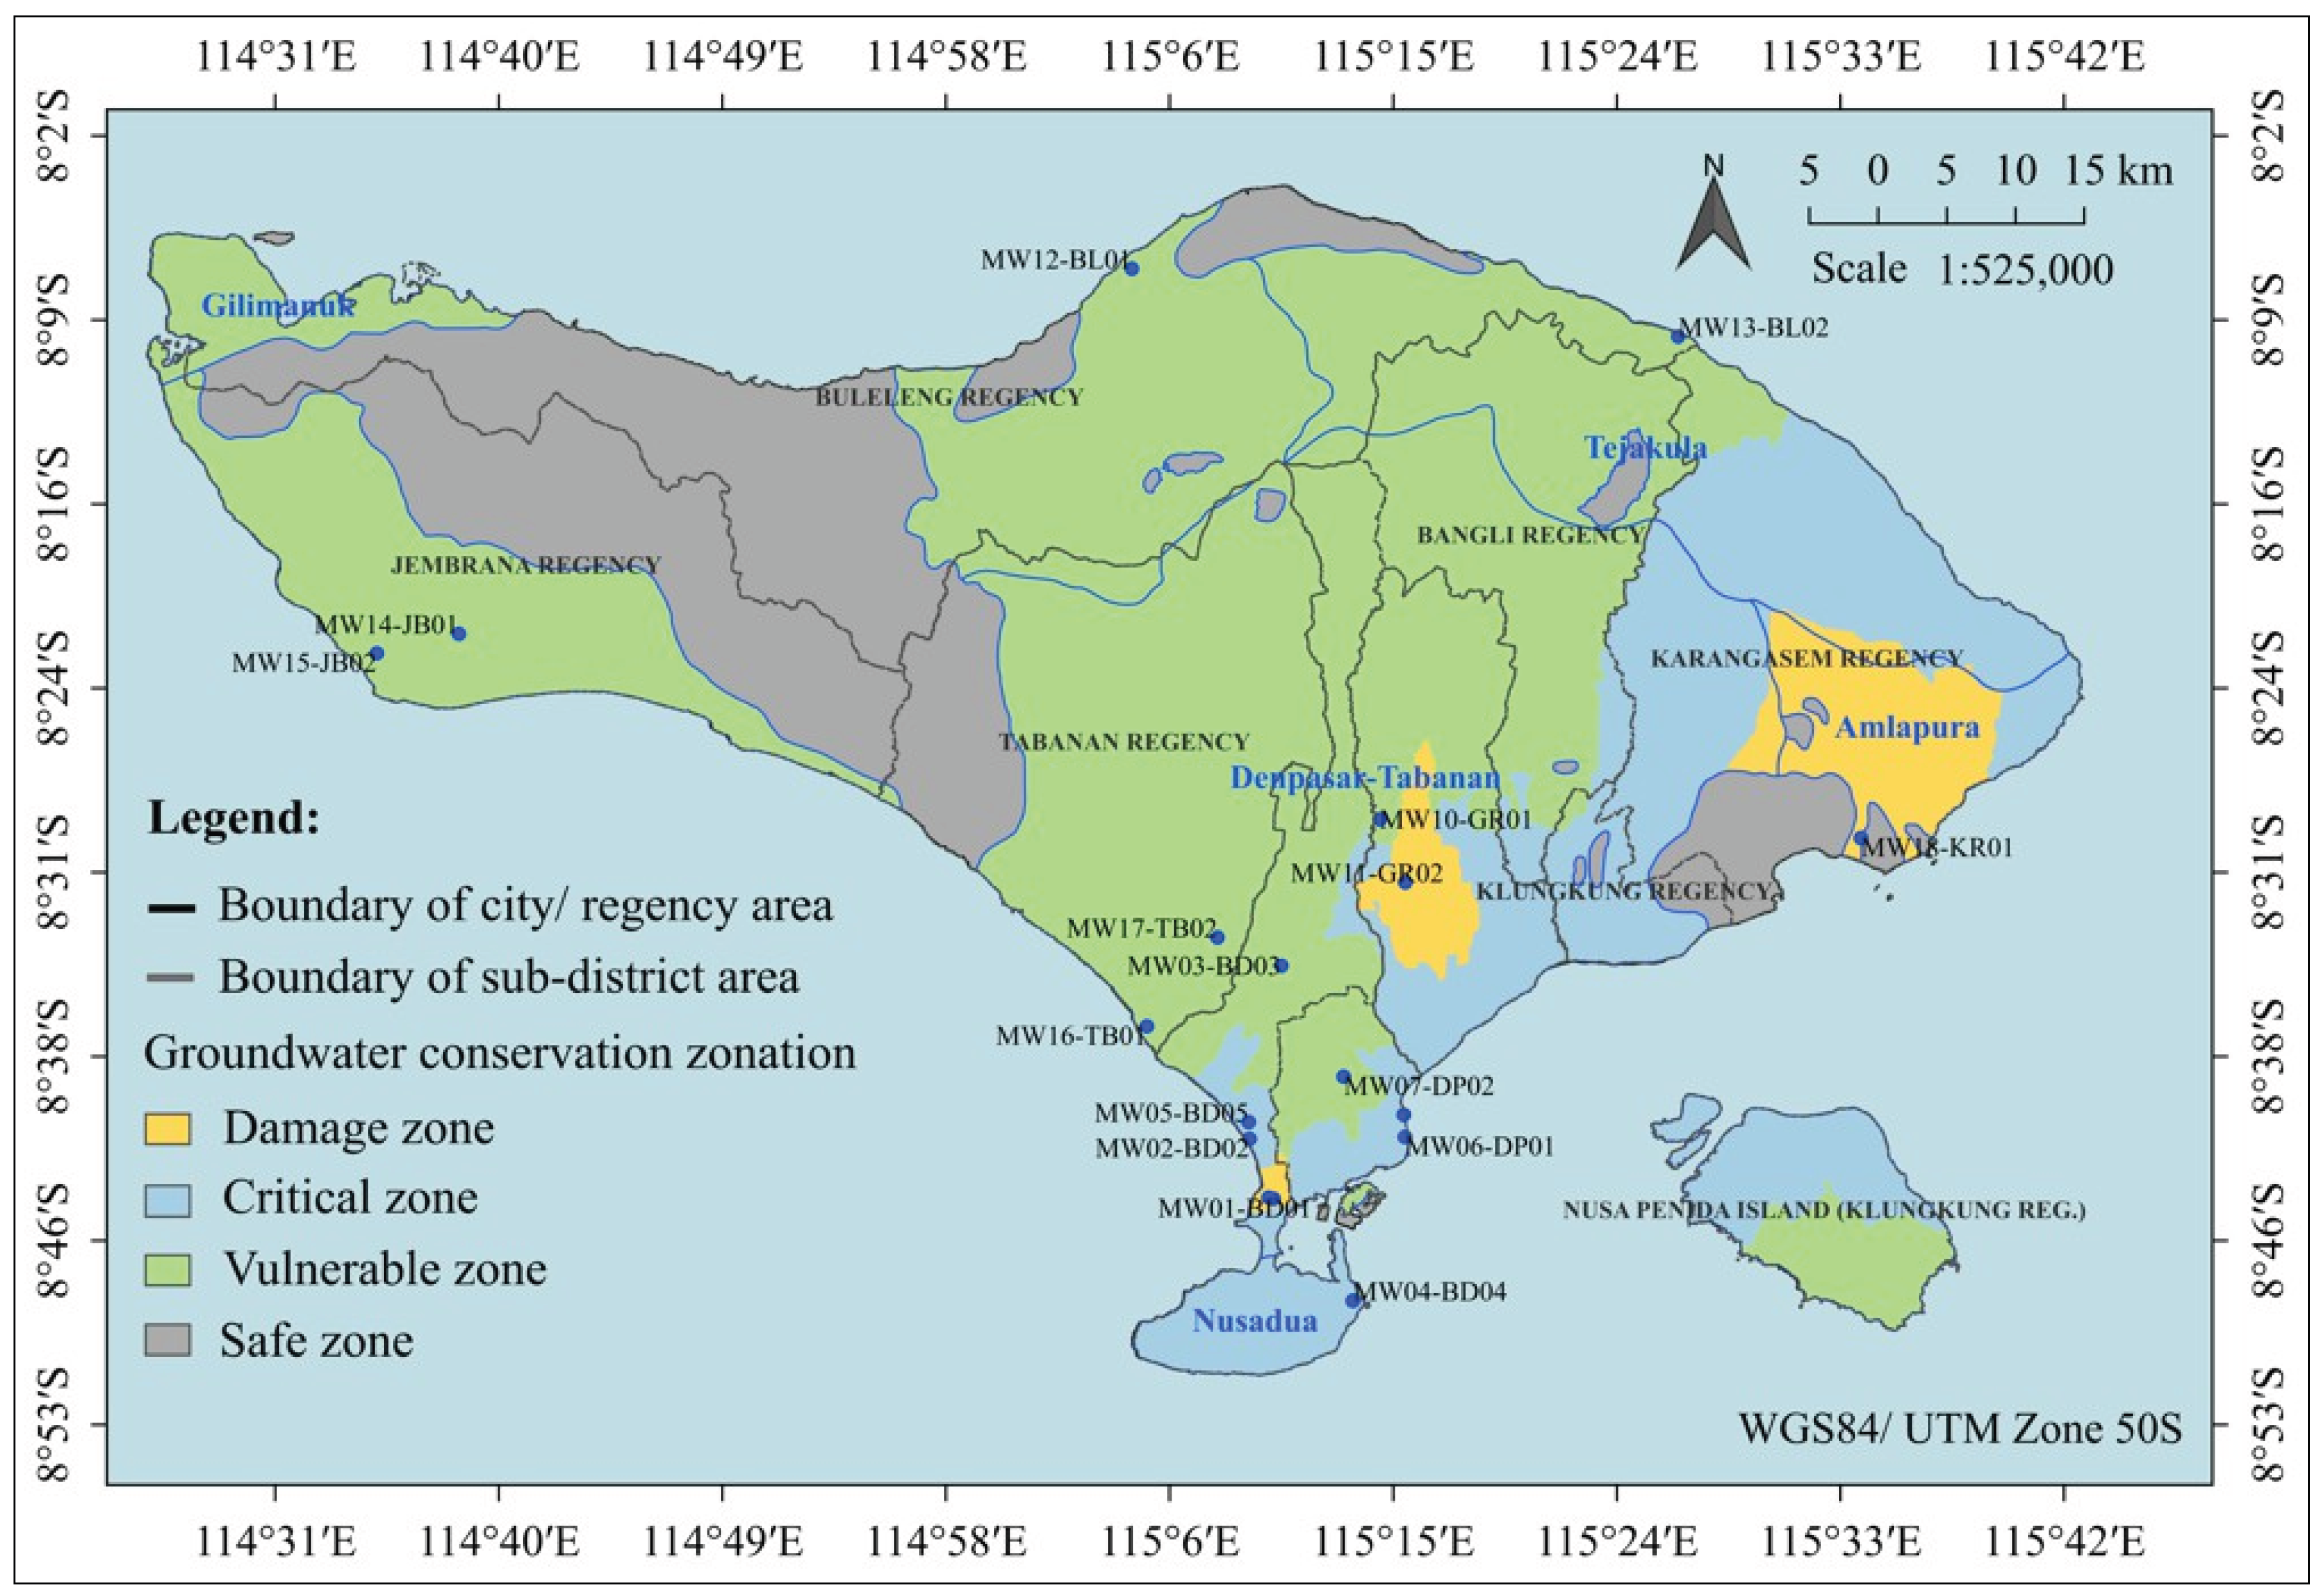

Table 1.
Monitoring well data of groundwater level in Bali, Indonesia.
| Well Number | Monitoring Well ID | Construction Year | Depth (m) | Groundwater Level (m Below Ground Surface) | ||||||
|---|---|---|---|---|---|---|---|---|---|---|
| 2008 1 | 2009 1 | 2010 1 | 2011 1 | 2012 1 | 2013 1 | 2017 2 | ||||
| 1 | MW01-BD01 | 1996 | 50 | 6.25 | 6.40 | 6.00 | 6.35 | 6.50 | 6.00 | 6.10 |
| 2 | MW02-BD02 | 1997 | 50 | 6.30 | 6.86 | 6.70 | 6.80 | 7.82 | 6.35 | 7.74 |
| 3 | MW03-BD03 | 2002 | 40 | 2.15 | 2.20 | 1.75 | 1.84 | 3.01 | 3.50 | 3.20 |
| 4 | MW04-BD04 | 2003 | 40 | 3.60 | 3.80 | 4.05 | 4.38 | 3.78 | 3.70 | 4.58 |
| 5 | MW05-BD05 | 2004 | 65 | 15.75 | 16.57 | 16.20 | 16.75 | 15.05 | 18.20 | 17.66 |
| 6 | MW06-DP01 | 1997 | 50 | 2.85 | 2.67 | 3.25 | 3.37 | 3.87 | 3.20 | 3.18 |
| 7 | MW07-DP02 | 2001 | 40 | 8.45 | 8.45 | 6.25 | 6.38 | 8.45 | 7.00 | 6.30 |
| 8 | MW08-DP03 | 2004 | 60 | 2.55 | 2.66 | 3.16 | 3.25 | 2.85 | 3.20 | 3.63 |
| 9 | MW09-DP04 | 2008 | 60 | - | 6.25 | 9.01 | 9.21 | 7.69 | 8.70 | 10.39 |
| 10 | MW10-GR01 | 1998 | 90 | 39.15 | 39.40 | 39.15 | 39.40 | 40.08 | 39.30 | 39.20 |
| 11 | MW11-GR02 | 2009 | 6060 | 7- | - | 7.85 | 7.85 | 7.16 | 12.10 | 12.00 |
| 12 | MW12-BL01 | 1998 | 40 | 0.55 | 0.55 | 0.50 | 0.58 | 0.75 | 0.50 | 0.48 |
| 13 | MW13-BL02 | 2007 | 60 | 7.35 | 7.10 | 6.75 | 7.00 | 7.66 | 7.12 | 7.08 |
| 14 | MW14-JB01 | 2006 | 60 | 10.35 | 10.27 | 9.82 | 9.95 | 10.74 | 9.50 | 10.61 |
| 15 | MW15-JB02 | 2006 | 60 | 17.26 | 17.50 | 17.20 | 16.00 | 16.83 | 16.00 | 17.53 |
| 16 | MW16-TB01 | 2005 | 60 | 8.47 | 8.55 | 7.85 | 7.90 | 8.26 | 8.00 | 8.20 |
| 17 | MW17-TB02 | 2008 | 65 | - | 7.82 | 8.25 | 8.34 | 7.87 | 8.50 | 8.55 |
| 18 | MW18-KR01 | 2007 | 70 | 4.68 | 6.87 | 4.25 | 7.60 | 4.82 | 7.25 | 7.32 |
1 Data collected from the ESDM of Indonesia in Bali Province; 2 field observation of groundwater level.
Table 2.
List of multi-temporal Advanced Land Observing Satellite (ALOS) Phased Array type L-band Synthetic-Aperture Radar (PALSAR) data covering the entire area of Bali from 2007 to 2010 for Interferometric Synthetic-Aperture Radar (InSAR) time-series processing.
Table 2.
List of multi-temporal Advanced Land Observing Satellite (ALOS) Phased Array type L-band Synthetic-Aperture Radar (PALSAR) data covering the entire area of Bali from 2007 to 2010 for Interferometric Synthetic-Aperture Radar (InSAR) time-series processing.
| Path | Scene ID | Acquisition Date (yyyy/mm/dd) | Number of Days | Baselines for InSAR Processing with a Super Master | |||
|---|---|---|---|---|---|---|---|
| Temporal Baseline (days) | Perpendicular Baseline (m) | ||||||
| Row 7000 | Row 7010 | Row 7020 | |||||
| 422 | 05740 | 2007/02/22 | 417 | (Super Master) | - | 0 | 0 |
| 09766 | 2007/11/25 | 693 | 276 | - | −280 | −262 | |
| 11108 | 2008/02/25 | 785 | 368 | - | −566 | −535 | |
| 11779 | 2008/04/10 | 831 | 414 | - | −579 | −543 | |
| 15134 | 2008/11/27 | 1061 | 644 | - | 623 | 597 | |
| 16476 | 2009/02/27 | 1152 | 735 | - | 121 | 107 | |
| 20502 | 2009/11/30 | 1428 | 1011 | - | 26 | 30 | |
| 21173 | 2010/01/15 | 1474 | 1057 | - | −209 | −199 | |
| 21844 | 2010/03/02 | 1520 | 1103 | - | −247 | −231 | |
| 423 | 09343 | 2007/10/27 | 664 | (Super Master) | 0 | 0 | 0 |
| 10014 | 2007/12/12 | 710 | 46 | −274 | −271 | −269 | |
| 10685 | 2008/01/27 | 756 | 92 | −482 | −472 | −464 | |
| 14711 | 2008/10/29 | 1032 | 368 | 770 | 725 | 681 | |
| 15382 | 2008/12/14 | 1078 | 414 | 732 | 691 | 651 | |
| 16053 | 2009/01/29 | 1123 | 459 | 427 | 393 | 358 | |
| 20079 | 2009/11/01 | 1399 | 735 | 103 | 88 | 72 | |
| 21421 | 2010/02/01 | 1491 | 827 | −62 | −66 | −71 | |
| 26118 | 2010/12/20 | 1813 | 1149 | −962 | −943 | −926 | |
| 424 | 05565 | 2007/02/10 | 405 | (Super Master) | - | 0 | 0 |
| 09591 | 2007/11/13 | 681 | 276 | - | −154 | −134 | |
| 11604 | 2008/03/30 | 819 | 414 | - | −992 | −956 | |
| 14959 | 2008/11/15 | 1049 | 644 | - | 838 | 814 | |
| 15630 | 2008/12/31 | 1095 | 690 | - | 279 | 260 | |
| 16301 | 2009/02/15 | 1140 | 735 | - | 279 | 443 | |
| 20327 | 2009/11/18 | 1416 | 1011 | - | −76 | −71 | |
| 20998 | 2010/01/03 | 1462 | 1057 | - | −181 | −171 | |
| 21669 | 2010/02/18 | 1508 | 1103 | - | −301 | −283 | |
Table 3.
List of Continuously Operating Reference Stations (CORSs) in Bali from 2008 to 2010 for Global Navigation Satellite System (GNSS) data measurement 1.
Table 3.
List of Continuously Operating Reference Stations (CORSs) in Bali from 2008 to 2010 for Global Navigation Satellite System (GNSS) data measurement 1.
| Station | Station ID | Location | Latitude | Longitude | Height (m) | Data Period | Distance (km) |
|---|---|---|---|---|---|---|---|
| Base station | CSRJ | Singaraja | −8.1497 | 115.0580 | 60.33 | 2008–2010 | - |
| Rover station | CDNP | Denpasar | −8.8181 | 115.1456 | 234.52 | 2008–2010 | 74.97 |
| Rover station | CPBI | Bukit Tengah | −8.5433 | 115.4708 | 278.75 | 2008–2010 | 63.07 |
1 Data obtained from the Indonesian Geospatial Information Agency (BIG).
Disclaimer/Publisher’s Note: The statements, opinions and data contained in all publications are solely those of the individual author(s) and contributor(s) and not of MDPI and/or the editor(s). MDPI and/or the editor(s) disclaim responsibility for any injury to people or property resulting from any ideas, methods, instructions or products referred to in the content. |
© 2025 by the authors. Licensee MDPI, Basel, Switzerland. This article is an open access article distributed under the terms and conditions of the Creative Commons Attribution (CC BY) license (http://creativecommons.org/licenses/by/4.0/).
Copyright: This open access article is published under a Creative Commons CC BY 4.0 license, which permit the free download, distribution, and reuse, provided that the author and preprint are cited in any reuse.


