
Submitted:
28 December 2025
Posted:
29 December 2025
You are already at the latest version
Abstract
The TCGS-SEQUENTION framework proposes that observable evolutionary dynamics constitute projections from a higher-dimensional counterspace structure, implying that certain heritable traits may exhibit synchronized emergence across physically disconnected populations beyond what contact mediated mechanisms can explain. This paper presents a comprehensive, falsifiable protocol to test the Sequention hypothesis using existing public genomic data from D. melanogaster and fast-evolving microbial systems, providing a definitive empirical test that yields either support or falsification. We operationalize Synchronous Parallel Emergence (SPE) as the central testable prediction: multiple isolated populations exhibiting coordinated change-points in trait-linked markers within a predefined temporal window, after controlling for migration, shared environmental forcing, and all standard evolutionary mechanisms including soft sweeps, polygenic redundancy, and cytoplasmic hitchhiking. The protocol employs a three-gate falsification structure: (G1) significant synchrony beyond null expectation, (G2) exclusion of directed influence pathways, and (G3) common-cause exclusion with chart invariance. The protocol is executable immediately using the Drosophila Genetic Reference Panel (DGRP), Drosophila Genome Nexus (DGN), Evolve-and-Resequence (E&R) time series, and long-term bacterial evolution datasets. This paper provides a decisive, no-waiting proof attempt: either SPE persists after stringent controls (supporting Sequention), or it dissolves (falsifying the universality claim for these systems). Explicit decision rules, confound matrices, and implementation checklists are provided for independent replication.
Keywords:
TCGS-SEQUENTION
; sequention
; D. melanogaster
; population genomics
; synchronous emergence
; falsification protocol
; soft sweeps
; epigenetics
; changepoints
; parallel adaptation
; transfer entropy
1. Introduction and Motivation
The TCGS-SEQUENTION framework advances the hypothesis that observable biological reality, including evolutionary dynamics, represents projections from a static higher-dimensional counterspace () onto the observable shadow space () [1]. Within this framework, Sequention denotes the geometric principle by which apparently separated evolutionary trajectories can share higher-level constraints, potentially manifesting as coordinated emergence patterns that transcend contact-mediated explanations.
This paper addresses a critical scientific need: translating the theoretical claims of TCGS-SEQUENTION into an operationally testable form using readily available biological data. We focus on D. melanogaster population genomics because this model organism offers an unusually strong combination of dense public genomics, well-characterized evolutionary dynamics, and mature methodological infrastructure [2,3,4].
The central objective is unambiguous: provide a protocol that yields a clean scientific outcome—either empirical alignment with Sequention predictions or falsification of the operational claim. This paper consolidates two tightly coupled deliverables:
- (D1)
- A structured reinterpretation of published findings in D. melanogaster population genomics as empirical “anchor signals” compatible with Sequention geometry.
- (D2)
- A registered falsification protocol executable on public datasets, with explicit decision rules and pass/fail criteria.
1.1. Why This Test Matters
Standard evolutionary theory explains the spread of beneficial alleles through sexual reproduction, migration, selection on standing variation, recurrent mutation, and stochastic processes [5,6]. These mechanisms generate powerful predictive models for allele frequency dynamics. However, if Sequention geometry is correct, certain emergence patterns should exhibit an “extra coupling” among populations—a statistical signature not fully captured by contact-mediated null models.
The test proposed here does not deny the reality of sexual reproduction, selection, or drift. Instead, it asks whether these mechanisms, rigorously modeled and conditioned upon, suffice to explain all observed synchrony patterns. A positive result (SPE persisting after controls) would indicate that an additional shared-term, consistent with Sequention geometry, contributes to evolutionary coordination. A negative result (SPE dissolving after controls) would falsify the Sequention universality claim for the tested systems.
2. Theoretical Framework: TCGS-SEQUENTION in Biology
2.1. Core Geometric Commitments
The TCGS-SEQUENTION framework treats biological evolution as observations in a chart-space constructed from measurable variables: allele frequencies, haplotype summaries, trait proxies, and environmental covariates. The fundamental postulates relevant to biological observables are:
Postulate 1
(Counterspace and Shadow Projection). The observable biological world () is a projection of structure in a higher-dimensional counterspace (). Observable evolutionary trajectories represent slices through this projection, organized by a foliation family that parameterizes what we perceive as “time.”
Postulate 2
(Foliation and Corridor Structure). The observed time parameter is a foliation label organizing shadow observations.Corridor structuredenotes a low-dimensional constraint family in whose projection yields repeatable, slice-robust alignment signatures across subpopulations in .
Postulate 3
(Singularity Dominance). Biological change is governed by a sparse set of dominating transition nodes (“singularities” in TCGS-SEQUENTION terminology) that structure trajectories as corridor-limited progressions in , rather than unconstrained diffusion across genotype space.
These postulates are not rhetorical claims; they generate concrete statistical targets and can therefore be operationally evaluated.
2.2. Constitutive Representation
A minimal constitutive representation motivates the test statistics. Following the TCGS-SEQUENTION formalism:
where is an informational potential over the joint space (genomes, phenotypes, environments), J is a flux representing evolutionary flow, is a monotone mobility function, is a global scale parameter, and represents sources of variation (mutation, recombination, acquisition). Evolutionary paths in charts of are predicted to share invariants—geodesic distance, path length, curvature—that manifest statistically as an additional shared-term coupling across subpopulations.
2.3. The Geometry-to-Statistics Mapping
The biological translation used here is deliberately modest. Sequention appears statistically as:
- (i)
- Shadow observation: each subpopulation’s trajectory is a projection of the higher-dimensional generative process; measured allele frequencies, haplotypes, and trait distributions are observables in .
- (ii)
- Foliation corridor: a subset of emergence events align along a low-dimensional constraint family such that multiple subpopulations exhibit coordinated changepoints not fully attributable to contact pathways.
- (iii)
- Sequention shared-term: the corridor manifests as an extra coupling among subpopulation trajectories, beyond what migration/selection models generate under posterior predictive checks.
3. Operational Definitions and Falsifiable Claims
3.1. Vocabulary
Definition 1
(Resolved Contact Pathway). Aresolved contact pathwayis any causal route that can plausibly transmit alleles/phenotypes between subpopulations within the relevant time window using standard mechanisms: migration/gene flow, admixture, shared founder origin, laboratory contamination, known dispersal corridors, known release events, or maternally inherited cytoplasmic sweeps.
Definition 2 (Non-Contact Emergence Signal (NCES)). A candidatenon-contact emergence signal(NCES) is a trait/allele whose time-localized rise (or coordinated shift in polygenic score) appears near-synchronous across geographically separated subpopulationsafterconditioning on (i) resolved contact pathways, (ii) shared environmental forcing, and (iii) standard genomic architectures including soft sweeps and polygenic redundancy.
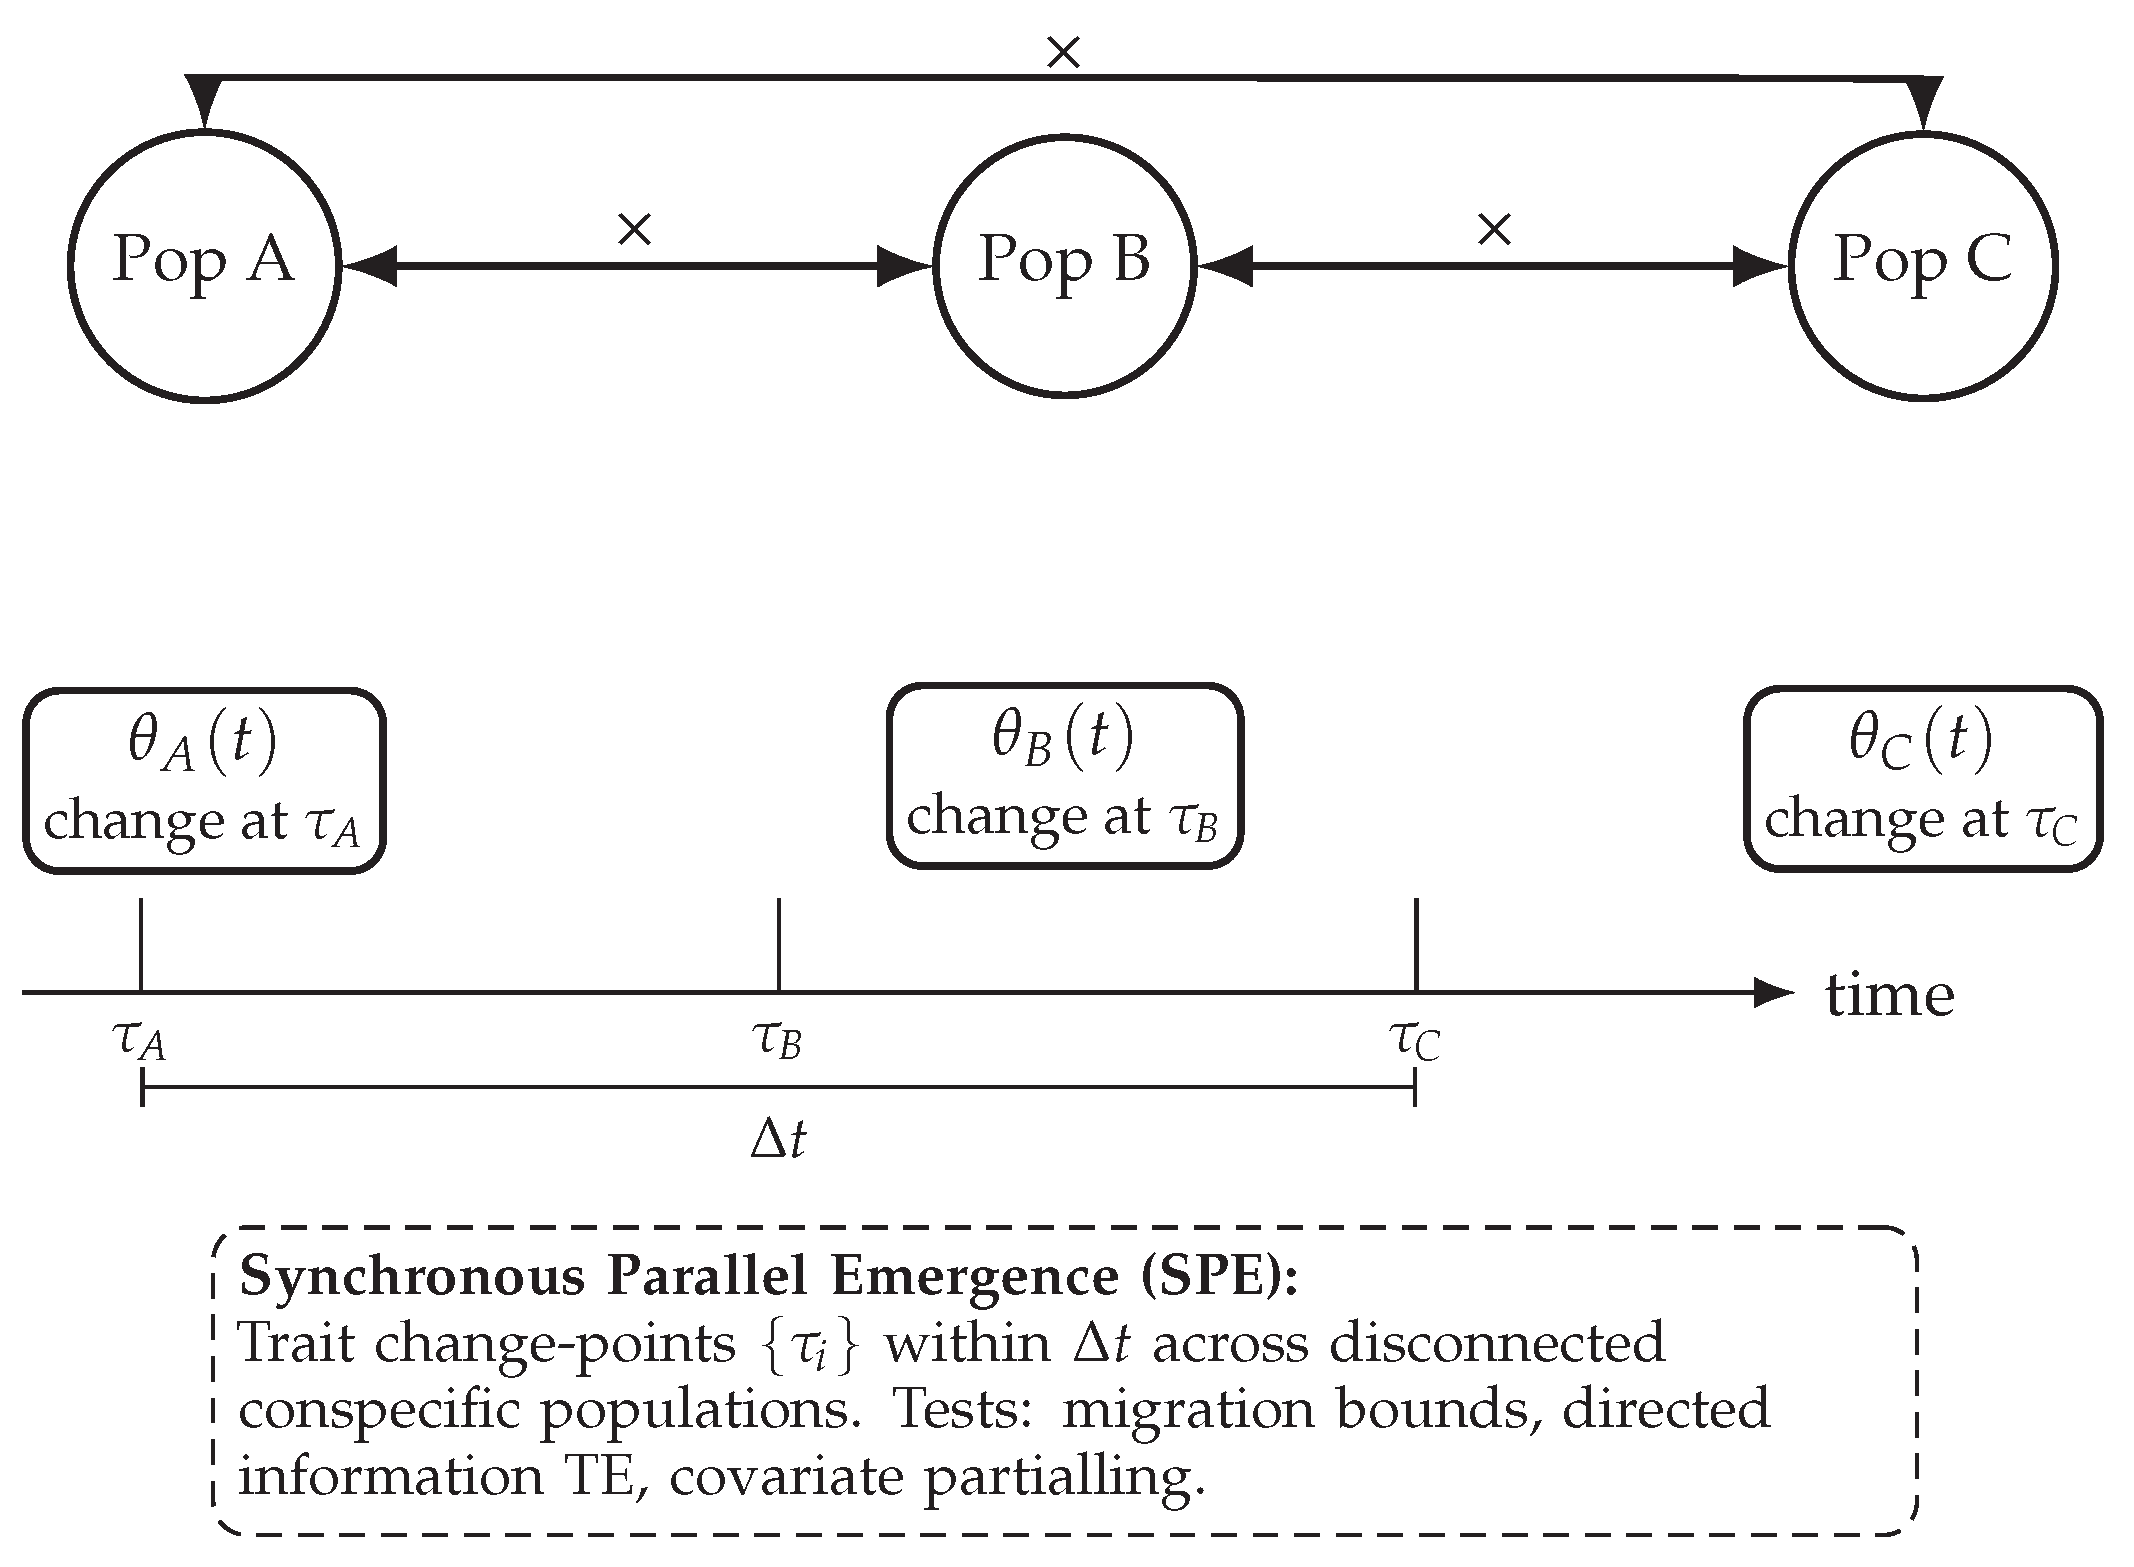
Definition 3 (Synchronous Parallel Emergence (SPE)). Synchronous Parallel Emergenceoccurs when, for a predeclared trait θ and tolerance window , the change-point times across m disconnected populations satisfy:
with probability exceeding under a Sequention-consistent model fittedwithoutper-population tuning, while the same event has probability under migration-constrained neutral/selection nulls.
3.2. The Falsifiable Claim
Claim 1
(Operational Sequention Claim). There exists a non-empty set of genomic/phenotypic emergence events inD. melanogaster(and optionally, in time-compressed microbial systems) for which:
- (a)
- Standard models (migration + shared selection + standing variation + recurrent mutation + cytoplasmic hitchhiking) fail to explain theobserved synchronyandmulti-origin structureat a pre-registered threshold.
- (b)
- A model that includes an additionalshared-term(a latent coupling among subpopulations) achieves decisive improvement under out-of-sample prediction and posterior predictive checks.
If no such events exist under stringent controls, this claim is falsified in the tested domain.
This paper is written to be useful immediately: an independent researcher can execute the protocol on public data and obtain a clean outcome without requiring new experiments.
4. Why Drosophila Is the Optimal Test Arena
4.1. Public Data Density and Historical Time-Depth
D. melanogaster offers an unusually strong combination: deep public genomics, dense sampling, and a mature methodological ecosystem. For the present objective, the critical features include:
4.2. Data Resources Available Now
The protocol is designed to execute immediately on existing resources:
5. Evidence Anchors: Empirical Motifs in the Literature
This section is not an argument from authority. It is a structured extraction of motifs already demonstrated in high-information systems, organized to serve as (i) calibration targets for the protocol and (ii) immediate anchors supporting the plausibility of corridor-like behavior in biological data.
5.1. Anchor A: Cytoplasmic Replacement Events
The documented global-scale Wolbachia-associated replacement in D. melanogaster was originally described as “at odds with current theory” in its framing [9]. Subsequent population genomics documented broad patterns consistent with large-scale cytoplasmic dynamics [14]. Standard explanations remain plausible; nonetheless, cytoplasmic sweeps provide a known mechanism that can generate apparent “synchrony,” and thus serve as a critical confound to be modeled and controlled.
Role in this paper:
- (A1)
- Confound requirement: Cytoplasmic coupling must be modeled explicitly; otherwise, apparent synchrony is uninterpretable.
- (A2)
- Calibration requirement: A correct pipeline should reproduce these patterns as cytoplasmic-driven under .
5.2. Anchor B: Rapid Spread of Resistance Architectures
Classic insecticide resistance at the Cyp6g1 locus involved a well-characterized P450 allele associated with DDT resistance [10]. Subsequent work demonstrated an allelic series involving copy-number variation and transposable element insertions consistent with ongoing adaptation [15]. These cases motivate a corridor interpretation: transitions occur through a constrained “ladder” of accessible states, and repeated selection pressures generate structured replacement patterns.
Role in this paper: Corridor-ladder calibration; mechanistic anchor for understanding constrained evolutionary progression.
5.3. Anchor C: Soft Sweeps and Multi-Origin Structure
Genome-wide scans in North American D. melanogaster show strong peaks with signatures of soft sweeps [8], consistent with theoretical expectations for adaptation from standing variation and recurrent mutation [5,6]. These results establish a critical baseline: apparent multi-origin emergence is not exotic. Therefore, the Sequention test must not naïvely equate “multi-origin” with “nonlocality.” The protocol explicitly conditions on soft sweep mechanisms.
Role in this paper: Baseline null mechanism; prevents naive inference by requiring that synchrony persist after conditioning on soft sweep dynamics.
5.4. Anchor D: Replicated Time-Series Parallelism
Replicated E&R experiments in D. melanogaster demonstrate highly parallel genomic selection response across independent replicates [11]. Polygenic adaptation under genetic redundancy is documented in related systems [12]. These results establish that strong convergence can emerge under repeated constraints and provide time-resolved trajectories suitable for alignment statistics.
Role in this paper: Alignment baseline; time-resolved coherence assessment.
5.5. Anchor E: Time Compression in Microbial Systems
Time is a limiting variable for geometry testing in multicellular organisms. Dense genomic sampling across 50,000–60,000 generations in E. coli long-term evolution experiments [16,17,18,19] supports rapid, high-power evaluation of corridor structure. Change-point alignment, repeated convergence, and the distribution of dominating transition nodes can be quantified with precision difficult to achieve in many wild multicellular datasets.
Role in this paper: Fast testing of corridor/singularity structure; the same logic applies to D. melanogaster and E. coli with domain-specific confounds.
5.6. Anchor Summary Table

Table 1.
Evidence anchors organized as calibration targets and confound-aware baselines for Sequention tests.
Table 1.
Evidence anchors organized as calibration targets and confound-aware baselines for Sequention tests.
| Anchor Class | Empirical Motif | Role in This Paper |
|---|---|---|
| Cytoplasmic sweeps | Species-wide replacement dynamics; host–symbiont coupling [9,14] | Required confound model; pipeline calibration |
| Resistance ladder | Fast spread; allelic series with TE/CNV structure [10,15] | Corridor-ladder calibration; mechanistic anchor |
| Soft sweeps | Multi-haplotype high-frequency peaks [8] | Baseline null mechanism; prevents naive inference |
| Replicate parallelism | Strong convergence across time-series replicates [11,12] | Alignment baseline; time-resolved coherence |
| Time compression | Dense genomic time series across 50k–60k generations [18,19] | Fast testing of corridor/singularity structure |
6. The Falsification Protocol
6.1. Preregistration Requirements
A peer-review-resistant protocol requires preregistration to prevent post hoc tuning. The following items must be fixed before accessing outcomes:
- (P1)
- Candidate list: A fixed list of loci/traits (e.g., known sweeps such as Cyp6g1, plus a genome-wide discovery phase with strict holdout).
- (P2)
- Subpopulation partition: Geographic bins and time windows; inclusion/exclusion criteria.
- (P3)
- (P4)
- Primary metrics: Synchrony score S, multi-origin score O, and combined improbability score I (defined below).
- (P5)
- Decision thresholds: False discovery control (FDR) and Bayes factor/information-criterion thresholds.
6.2. Three-Gate Falsification Structure
A Sequention pass requires all three gates:
- G1 (Synchrony): Significant multi-origin synchrony of change-points beyond null expectation.
- G2 (No Directed Influence): No plausible contact-mediated spread (sexual crossing/migration/admixture) and no directed-information signature.
- G3 (Common-Cause Exclusion + Invariance): Covariates and chart changes cannot remove the synchrony; the signal is chart-invariant.
Figure 1.
Concept diagram. Synchronous trait emergence across physically disconnected populations, with no gene-flow paths and matched environment controls, is predicted by Sequention and challenges sexual-spread explanations.
Figure 1.
Concept diagram. Synchronous trait emergence across physically disconnected populations, with no gene-flow paths and matched environment controls, is predicted by Sequention and challenges sexual-spread explanations.
7. Gate G1: Synchrony Statistics and Null Ensemble
7.1. Change-Point Extraction
For each subpopulation i and trait/marker series , estimate change-points using a preregistered method. Recommended approaches include penalized likelihood segmentation [20] or Bayesian change-point models with fixed hyperparameters.
7.2. Synchrony Statistic
Define the primary synchrony statistic:
where is the median change-point and is the preregistered tolerance window. Alternatively:
representing the maximal number of subpopulations whose change-point lies within of a common reference time.
7.3. Recombination-Respecting Null Ensemble
Construct a null ensemble () that preserves:
- Recombination blocks/haplotype structure (for genetic markers).
- Marginal distributions of .
- Sampling cadence and missingness.
- Within-population autocorrelation.
- Measured environmental covariates.
The null model class includes: demographic + migration models, selection models including hard/soft sweeps [5,6,8], polygenic redundancy architectures [12], and cytoplasmic hitchhiking terms [9,14].
Compute for each null replicate and report:
G1 Pass Criterion: and after multiplicity correction.
8. Gate G2: Independence and Directed Influence Exclusion
8.1. Contact-Graph Exclusion
Construct a contact graph over populations within T generations (preregistered), with edges representing plausible migration/admixture/contamination pathways. For each pair of populations used in synchrony tests:
- (i)
- Migration bound: Kinship/IBD and over trait-associated regions in the T-generation window preceding .
- (ii)
- Protocol separation: Distinct labs or geographies; matched equipment/batching effects explicitly modeled.
Gate G2 fails if any time-aligned populations are connected by an active path with non-negligible probability.
8.2. Directed Information Tests
Compute directed influence (transfer entropy) between all pairs:
where Z includes environment, batch, and demographic proxies [21]. Apply FDR control across pairs at 5%.
G2 Pass Criterion: All non-significant (FDR ) and no active path in the T-generation contact graph.
9. Gate G3: Common-Cause Exclusion and Chart Invariance
9.1. Covariate Partialling
Fit covariate-only models (environmental variables, lab batch, demography proxies) and compute residual series. Recompute change-points and on residuals. Synchrony must survive partialling.
Compare best covariate-only model versus Sequention-coupled model using AIC/BIC and out-of-sample metrics:
G3 Covariate Criterion: Sequention model improves fit with AIC and maintains cross-validation performance without tuning.
9.2. Chart Invariance
Repeat the analysis under preregistered chart transformations:
- Logit allele frequency versus raw frequency.
- Rank-based transforms for traits.
- Alternative normalization pipelines.
A Sequention-consistent signal must persist in all charts with bounded drift in inferred .
G3 Invariance Criterion: Synchrony pattern and statistical significance maintained across chart transformations.
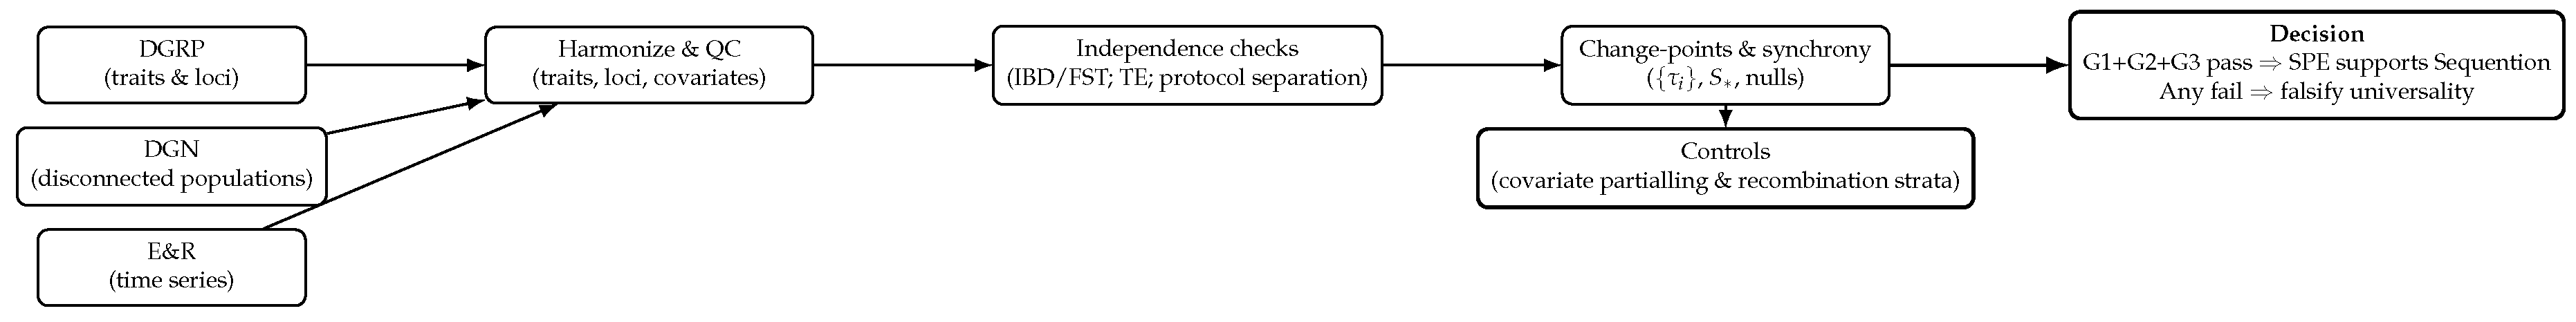
Figure 2.
End-to-end pipeline using existing public datasets. Independence is established before testing synchrony-in-isolation; migration- and environment-matched nulls define the benchmark.
Figure 2.
End-to-end pipeline using existing public datasets. Independence is established before testing synchrony-in-isolation; migration- and environment-matched nulls define the benchmark.
10. Combined Improbability and Model Selection
10.1. Multi-Origin Score
10.2. Joint Improbability
Combine scores conservatively:
estimated by joint simulation. The joint statistic is the core protection against false positives: synchrony alone or multi-origin alone is insufficient.
10.3. Sequention Alternative Model
Fit an alternative that differs from by adding a latent coupling term among subpopulations (the statistical proxy for a Sequention corridor). Implementation options include:
- A shared latent process driving allele-frequency increments with subpopulation-specific loadings.
- A coupling prior that induces correlated changepoints beyond migration expectations.
Model selection must be out-of-sample: predictive likelihood and posterior predictive checks, not in-sample fit.
Criterion 1
(Out-of-Sample Dominance). must improve predictive performance relative to on held-out subgroups/time windows, and must reproduce posterior predictive checks for the joint statistic while fails at a preregistered threshold.
11. Epigenetic Carriers and Multi-Singularity Framework
11.1. Why Epigenetics Is Operationally Central
Epigenetic inheritance is a known mechanism for transmitting phenotypic states across generations via chromatin state, small RNAs, or related molecular memory. In D. melanogaster, a major well-characterized transgenerational channel is small-RNA/piRNA-mediated silencing and heterochromatin dynamics, rather than high-level DNA methylation [22,23,24,25,26].
The existence of such channels has two immediate consequences:
- (a)
- False-positive risk: Apparent rapid appearance of a trait can be generated by inherited epigenetic states without any need for non-contact pathways.
- (b)
- Anchor opportunity: If Sequention geometry is real and chart-invariant, epigenetic channels provide high-bandwidth state variables that can be aligned across populations, strengthening synchrony detection under strict confound control.
11.2. Multi-Singularity Decomposition
Assumption A1
(Multi-Singularity Decomposition). There exists a finite set of latent drivers acting on such that the observed series for a trait θ is generated by a mixture of driver-coupled components plus measurement noise. Each induces a characteristic pattern across at least two observable channels (genetic and non-genetic) that is stable under chart changes.
Prediction 1
(Cross-Channel Co-Synchrony). If a population-level shift in θ is Sequention-driven, then the inferred change-point must co-align (within preregistered tolerance) with a change-point in at least one independent epigenetic/omic proxy after controlling for measured covariates. Under purely environment-driven plasticity, co-alignment fails once covariates are partialled out.
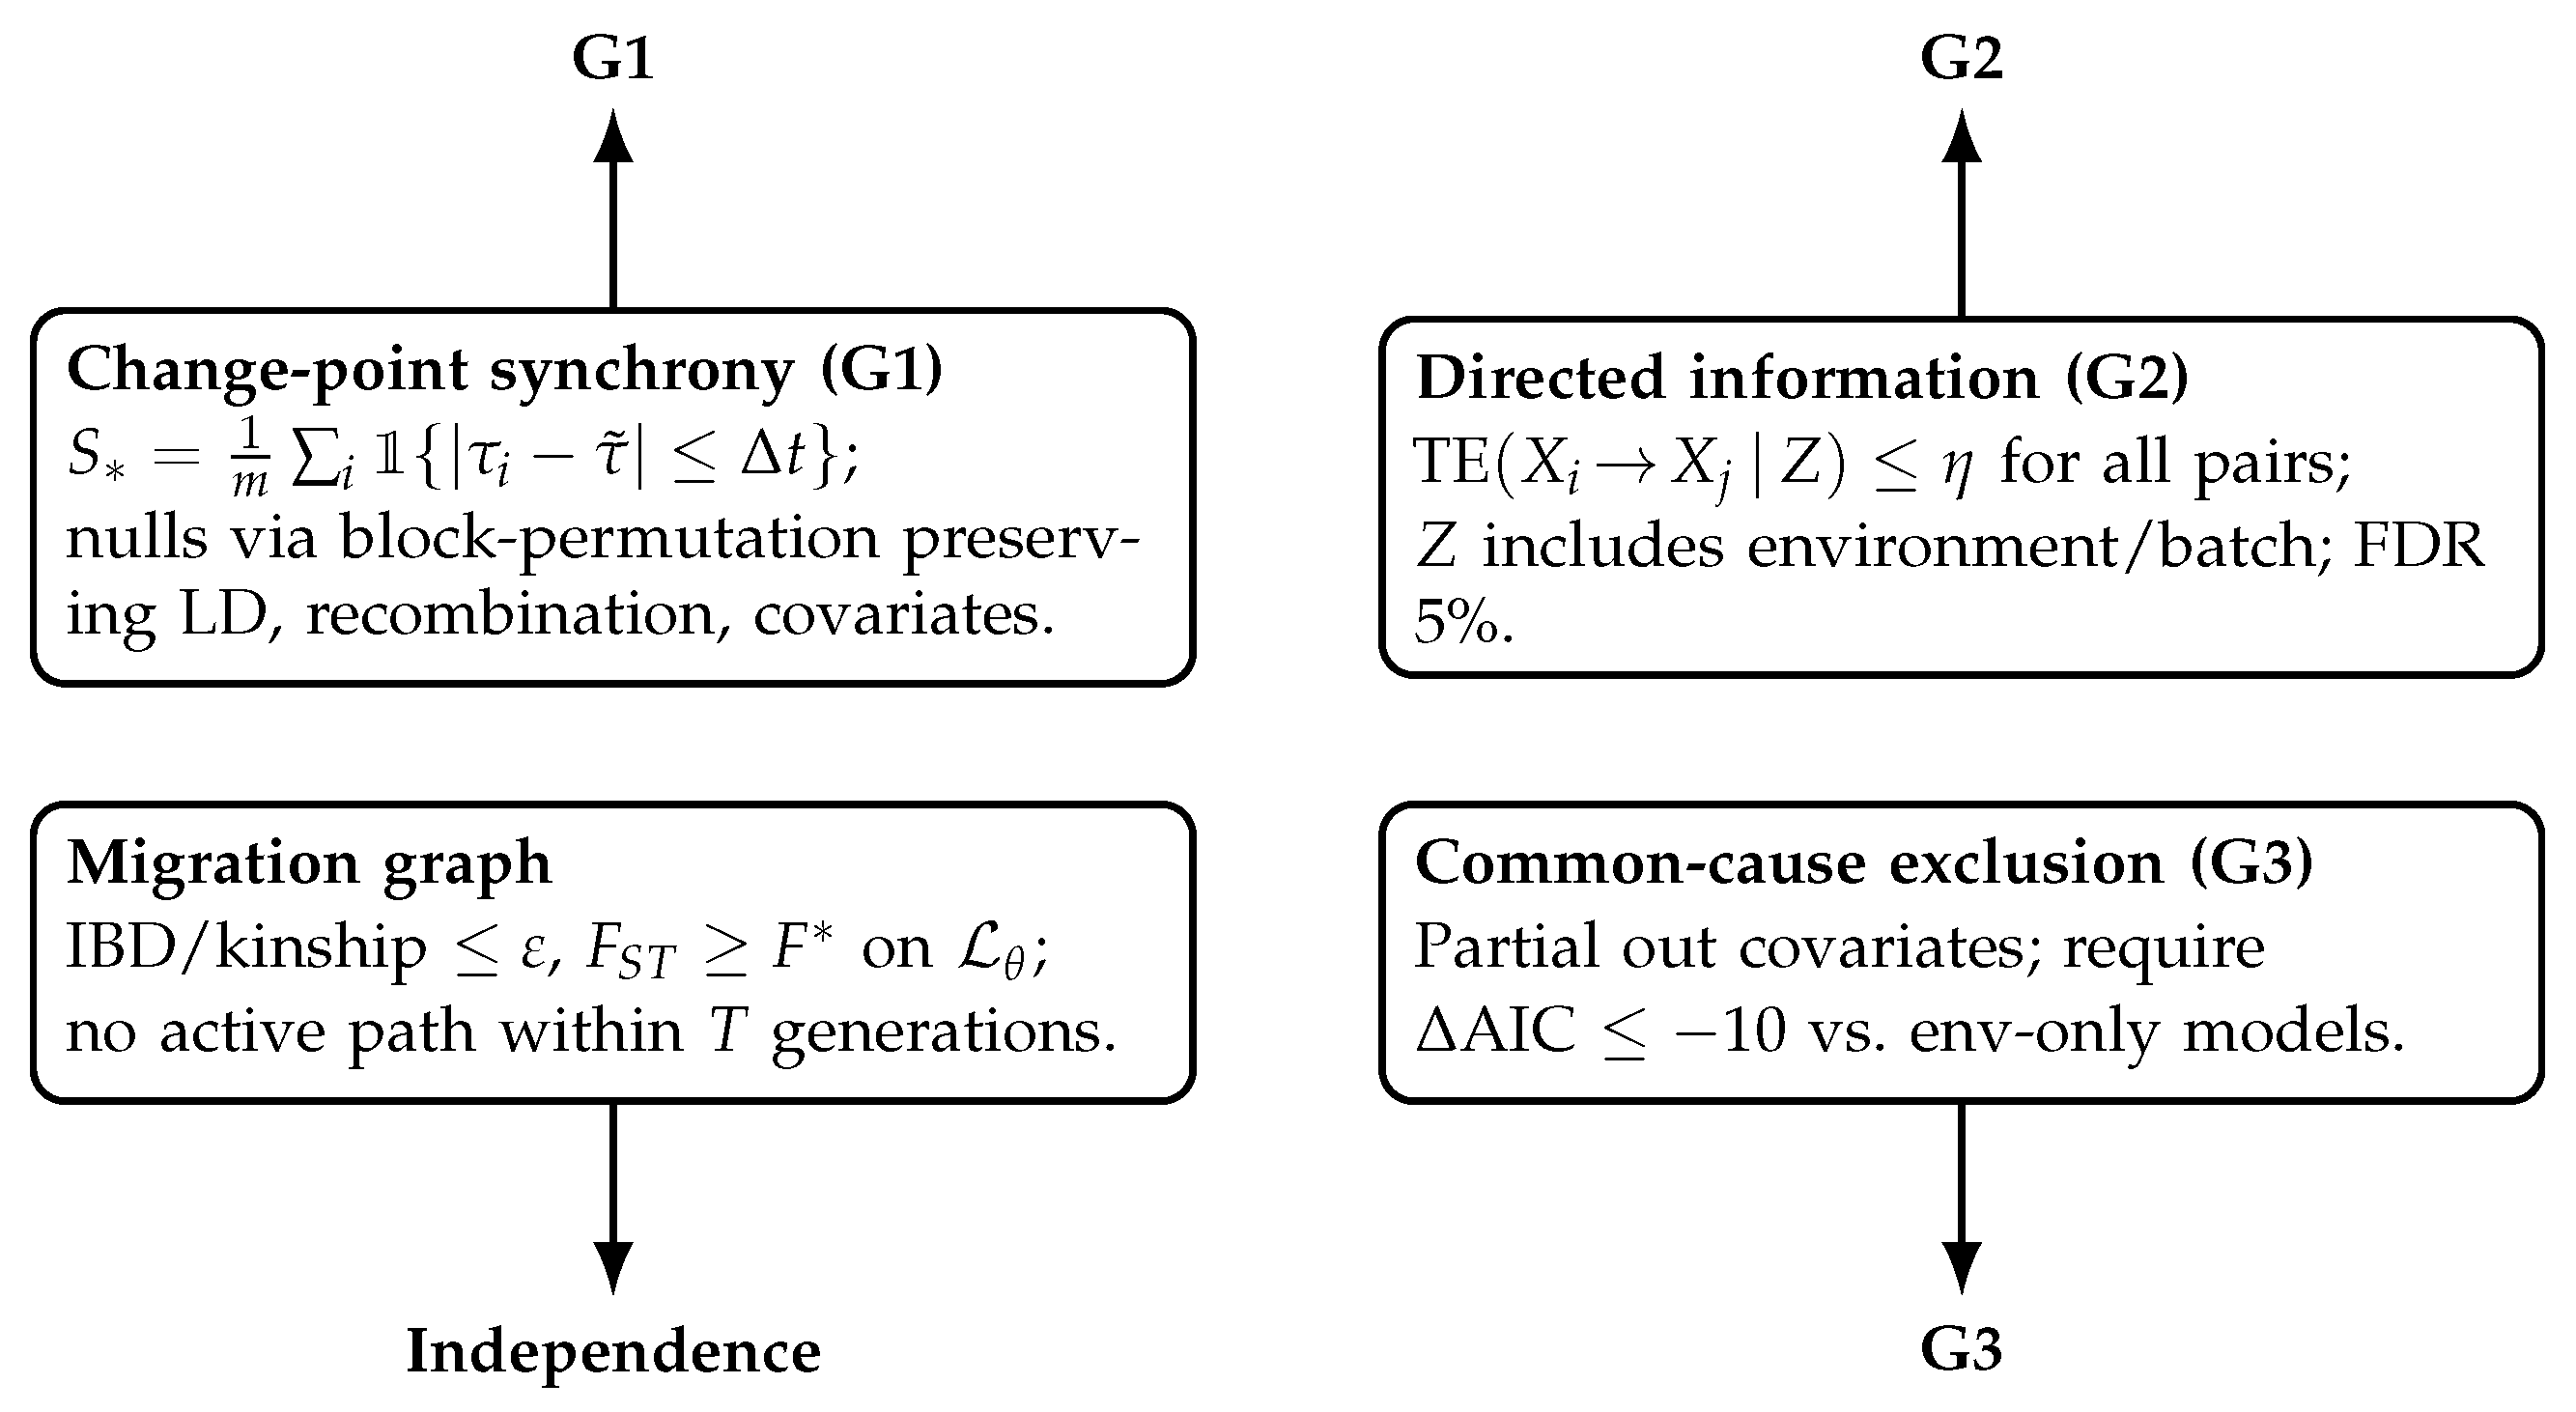
Figure 3.
Registered statistics. G1: synchrony; G2: contagion exclusion; G3: common-cause exclusion. All three gates must pass for SPE support.
Figure 3.
Registered statistics. G1: synchrony; G2: contagion exclusion; G3: common-cause exclusion. All three gates must pass for SPE support.
12. Decision Logic and Interpretation
12.1. Registered Decision Table
Table 2.
Registered decision table (G1–G3). Each gate has an unambiguous pass/fail rule. Partial passes must be reported as such; they do not count as support.
Table 2.
Registered decision table (G1–G3). Each gate has an unambiguous pass/fail rule. Partial passes must be reported as such; they do not count as support.
| Gate | Operational Definition | Pass Criterion (Preregistered) |
|---|---|---|
| G1: Synchrony | Estimate change-points ; compute and compare against recombination-respecting null ensemble. | and after multiplicity correction. |
| G2: No directed influence | Directed information/transfer entropy on series with covariates Z; plus explicit migration graph feasibility. | All non-significant (FDR ) and no active path in T-generation graph. |
| G3: Common-cause exclusion | Compare best covariate-only model vs. Sequention-coupled model using AIC/BIC and out-of-sample metrics. | Sequention model improves fit with AIC and maintains CV performance without tuning. |
12.2. Falsification and Support Criteria
Criterion 2
(Falsification Outcome). If, for the pre-registered candidate set and discovery set under strict multiple-testing control, the null class reproduces the joint distribution of across subpopulations in posterior predictive checks and the alternative fails to improve out-of-sample prediction materially, then the Sequention biology claim isfalsifiedforD. melanogasterin this operationalization.
Criterion 3 (Alignment Outcome (Not “Proof”)). If a non-empty set of events shows (i) low posterior predictive probability under for the joint statistic after all confounds, and (ii) decisive, out-of-sample improvement under with robust sensitivity analyses, then the data provideempirical alignmentwith a Sequention-style shared-term. This is evidence for the model class, not a metaphysical conclusion.
12.3. Interpretation Guidelines
Pass all gates: The Sequention signature survives stringent controls in the tested system. This supports the hypothesis that lingering informational constraints (beyond contact-mediated mechanisms) guide parallel emergence. Further extension to other taxa/time scales is warranted.
Fail any gate: The universality of the Sequention mechanism is falsified in the tested system as operationally defined. This is an informative negative result.
Ambiguity: Synchrony that vanishes only in extreme recombination strata suggests anisotropic mobility or trait-dependent charts (to be specified in future work).
Remark 1
(Compatibility with Mainstream Mechanisms). A pass does not deny sexual reproduction, selection, drift, or epigenetic inheritance. It indicates that these mechanisms, as encoded in preregistered nulls and covariate controls, do not suffice to explain the observed synchrony.
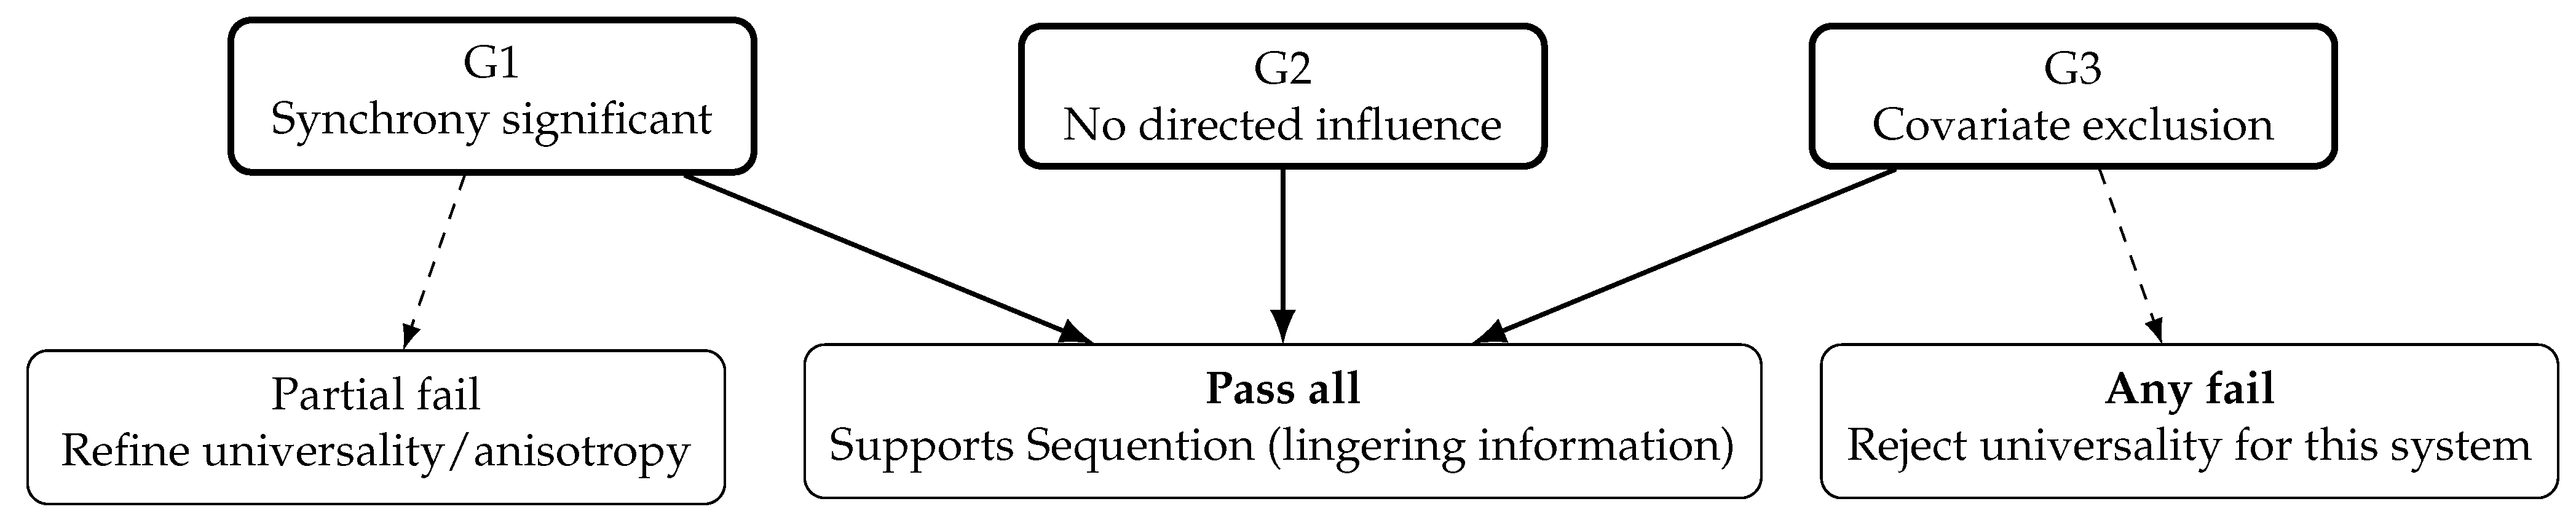
Figure 4.
Preregistered decision logic. This is a decisive test: success supports Sequention; failure is an informative falsification.
Figure 4.
Preregistered decision logic. This is a decisive test: success supports Sequention; failure is an informative falsification.
13. Confound Matrix
Table 3.
Confound matrix: mechanisms that can mimic rapid appearance and the minimum controls required. The protocol fails if any confound remains plausible at preregistered thresholds.
Table 3.
Confound matrix: mechanisms that can mimic rapid appearance and the minimum controls required. The protocol fails if any confound remains plausible at preregistered thresholds.
| Candidate Confound | How It Mimics Synchrony | Minimum Control |
|---|---|---|
| Migration / admixture | Alleles/traits spread by contact; produces aligned shifts. | Kinship/IBD bounds; geographic/lab separation; explicit migration graph exclusion. |
| Common environment | Shared covariate induces parallel plasticity. | Partial out covariates; require G3 improvement beyond env-only models. |
| Batch / pipeline artifacts | Shared library prep, mapping changes, or QC shifts create spurious change-points. | Batch covariates; replicate-by-lab design; sensitivity analyses; open pipelines. |
| Standing variation + selection | Parallelism arises from similar selection on shared standing variants. | Recombination-respecting nulls; replicate-specific haplotype structure preserved. |
| Epigenetic inheritance (piRNA/chromatin) | Heritable state shifts without DNA fixation; can appear abrupt. | Cross-channel tests (Prediction 1); explicitly model piRNA/TE proxies when available. |
| Horizontal transfer / symbionts / microbiome | Non-genetic carriers modulate phenotype in parallel. | Screen symbiont markers; exclude contamination; treat as covariates if measured. |
14. Step-by-Step Implementation Protocol
14.1. Step 1: Assemble Datasets and Metadata
Use public whole-genome resources and curated metadata (geography, collection date, sequencing batch, infection status when available). The protocol is agnostic to the specific repository as long as provenance is clear.
Required inputs:
- Frozen dataset manifest with IDs and file hashes.
- Geographic/temporal coordinates for each sample.
- Wolbachia/mtDNA infection status where available.
- Batch/sequencing information.
14.2. Step 2: QC and Stratification Control
Remove batch artifacts; control for ancestry structure using standard PCA/ADMIXTURE-like corrections. Validate by negative-control loci (presumed neutral regions).
Outputs:
- QC and structure adjustment report.
- Ancestry-corrected genotype matrices.
- Neutral-region control statistics.
14.3. Step 3: Emergence Detection (Change-Points)
For each candidate allele/trait, estimate a change-point time in each subpopulation using penalized likelihood segmentation [20]. For polygenic traits, compute a polygenic score per time bin and detect change-points analogously.
Parameters (preregistered):
- Penalty parameter for change-point detection.
- Minimum segment length.
- Tolerance window (e.g., for E&R; for seasonal windows).
14.4. Step 4: Null Model Fitting
Fit the suite of standard models comprising :
- Demographic + migration (gene flow) models.
- Selection models including hard/soft sweeps.
- Polygenic redundancy architectures.
- Cytoplasmic hitchhiking terms.
The null is a model class, not a single model, to avoid straw-manning.
14.5. Step 5: Compute Primary Statistics
Calculate:
14.6. Step 6: Independence and Directed Information Tests
Construct the contact graph and compute for all pairs. Apply FDR correction.
14.7. Step 7: Covariate Partialling and Chart Invariance
Fit covariate-only models, compute residuals, and retest synchrony. Repeat under alternative chart transformations.
14.8. Step 8: Sequention Alternative Model Fitting
Fit with the shared-term coupling. Evaluate using out-of-sample prediction and posterior predictive checks.
14.9. Step 9: Holdout Confirmation
Confirm results on held-out subpopulations/time windows not used in model tuning.
14.10. Step 10: Final Decision and Reporting
Apply the three-gate decision logic. Report all preregistered parameters, full null ensemble definition, full contact-graph assumptions, all charts and sensitivity analyses, and open code and data provenance.
15. Implementation Checklist
A minimal implementation that an external group can run without additional wet-lab work requires:
- (I1)
- Frozen dataset manifest (IDs, hashes, inclusion list).
- (I2)
- QC and structure adjustment report (PCA/related, batch effects).
- (I3)
- Change-point inference settings (penalty and minimum segment length) [20].
- (I4)
- Simulation engine for posterior predictive checks under .
- (I5)
- Alternative engine for (latent shared-term) with out-of-sample evaluation.
- (I6)
- Full results dossier per target: , sensitivity sweeps, and control outcomes.
- (I7)
- Containerized environment (e.g., Docker) for reproducibility.
- (I8)
- Pre-registered analysis plan timestamp.
16. Time Compression and Fast-Evolving Systems
16.1. Why Time Is a Limiting Variable
TCGS-SEQUENTION treats “time” as an organizational foliation label; consequently, more data does not automatically imply better inference if the data do not resolve the corridor transitions implied by singularity dominance. This creates a strategic requirement:
- (T1)
- Resolution requirement: The sampling schedule must resolve the transition neighborhood of candidate singularities.
- (T2)
- Compression requirement: When that is infeasible in multicellular organisms, the same geometry tests should be executed in fast-evolving systems where corridor transitions occur within experimentally tractable windows.
16.2. Microbial Time Compression
Dense genomic sampling across 50,000–60,000 generations in E. coli [18,19] supports rapid, high-power evaluation of corridor structure. Change-point alignment, repeated convergence, and the distribution of dominating transition nodes can be quantified with precision difficult to achieve in wild multicellular datasets.
The protocol is defined in a system-agnostic manner: the same logic applies to D. melanogaster and E. coli, with domain-specific confounds (e.g., recombination in D. melanogaster versus clonal interference in E. coli).
16.3. Cross-Species Universality Test
If Assumption A1 is correct, then some drivers may couple similarly across taxa even though molecular substrates differ. The operational implication is to apply the same registered gates to multiple organism classes and test whether inferred driver classes cluster by organism/environment or by chart-invariant signatures. A concrete falsifier follows: if signatures are fully explained by organism-specific substrates and covariates, no cross-species universality remains.
17. Sensitivity Analysis and Peer-Review Hardening
17.1. Negative Controls
- Neutral loci/traits where no corridor event is expected.
- Randomized subgroup labels (geography/cage permutation) to break corridor structure.
- Time-label scrambling to test algorithmic false synchrony.
17.2. Confound Stratification
- Cytoplasmic stratification where infection/mtDNA proxies are available [14].
- Batch-stratified reanalysis (sequencing run, calling pipeline).
- Multiple partition granularities (coarse vs. fine geographic bins).
17.3. Optional Directional Diagnostic
If time-series resolution allows, transfer-entropy-like diagnostics can be computed on residual trajectories to distinguish broadcast-like coupling from diffusion-like migration coupling [21]. This diagnostic is explicitly secondary and cannot substitute for the primary posterior predictive logic.
18. Broader Context: Sequention Beyond Genetics
The Sequention claim is broader than any single organism. However, strong peer review demands a narrow, testable slice. It is scientifically coherent to note that abiogenesis chemistry increasingly shows selective, water-compatible routes for key steps once considered major bottlenecks (e.g., RNA aminoacylation via thioester chemistry) [27]. The logical connection is not “chemistry proves geometry,” but rather:
High-dimensional possibility spaces can exhibit narrow, repeatable corridors of realized trajectories under constraints. Sequention proposes an additional, geometric source for such corridor structure; D. melanogaster provides an arena to ask whether an extra coupling term is needed once standard constraints are exhausted.
19. Conclusion
This paper advances TCGS-SEQUENTION in biology in a single, executable form. The evidence anchors provide immediate, citable empirical motifs already present in D. melanogaster and time-compressed bacterial systems. The protocol provides a falsifiable route to evaluating whether Sequention geometry contributes an identifiable shared-term beyond the strongest contact-mediated null class.
The approach is structured to withstand peer review by design: preregistration, confound inclusion, posterior predictive evaluation, and explicit falsification criteria. This is a decisive test: either Synchronous Parallel Emergence persists after all controls (supporting Sequention), or it dissolves (falsifying its universality for these systems).
Deliverables to the reader:
- (D1)
- A conservative, falsifiable Sequention claim stated in operational genomics language.
- (D2)
- A public-data-only analysis pipeline that produces a clean outcome: falsification or alignment.
- (D3)
- A literature-grounded set of calibration anchors ensuring the protocol is not naïve to mainstream explanations.
- (D4)
- Explicit decision rules, confound matrices, and implementation checklists for independent replication.
Data and Code Availability
This protocol uses public datasets exclusively. A complete implementation should accompany this manuscript as a preregistered repository containing:
- Dataset manifest with file hashes.
- Container specification (Docker/Singularity).
- Reproducible scripts for and .
- Pre-registered analysis plan with timestamp.
Author Contribution
Single author: Henry Arellano-Peña conceived the TCGS-SEQUENTION framework, designed the falsification protocol, reviewed the literature, and wrote the manuscript.
Competing Interests
The author declares no competing interests.
References
- Henry Arellano-Peña. TCGS-SEQUENTION Core: Timeless Counterspace & Shadow Geometry Foundation. Manuscript / Technical Report, 2025. Framework core document.
- Trudy F. C. Mackay, Stephen Richards, Eric A. Stone, Antonio Barbadilla, Julien F. Ayroles, Dianhui Zhu, Sònia Casillas, Yi Han, Michael M. Magwire, Julie M. Cridland, et al. The Drosophila melanogaster Genetic Reference Panel. Nature 2012, 482(7384), 173–178. [CrossRef]
- Justin B. Lack, Charis M. Cardeno, Meg A. Crepeau, W. Taylor, Russell Corbett-Detig, Kelly A. Stevens, Charles H. Langley, and John E. Pool. An expanded Drosophila Genome Nexus. Molecular Biology and Evolution 2016, 33(12), 3308–3313. [CrossRef]
- Neda Barghi, Roman Tobler, Viola Nolte, and Christian Schlötterer. Evolve and resequence studies: A powerful approach to study adaptation in Drosophila. Genetics 2019a, 211(2), 415–434. [CrossRef]
- Joachim Hermisson and Pleuni S. Pennings. Soft sweeps: Molecular population genetics of adaptation from standing genetic variation. Genetics 2005, 169(4), 2335–2352. [CrossRef]
- Pleuni S. Pennings and Joachim Hermisson. Soft sweeps II—molecular population genetics of adaptation from recurrent mutation or migration. Molecular Biology and Evolution 2006, 23(5), 1076–1084. [CrossRef] [PubMed]
- Justin B. Lack, Charis M. Cardeno, Meg A. Crepeau, W. Taylor, Russell B. Corbett-Detig, Kelly A. Stevens, Charles H. Langley, and John E. Pool. The Drosophila Genome Nexus: A population genomic resource of 623 Drosophila melanogaster genomes, including 197 from a single ancestral range population. Genetics 2015, 199(4), 1229–1241. [CrossRef] [PubMed]
- Nandita R. Garud, Philipp W. Messer, Erkan O. Buzbas, and Dmitri A. Petrov. Recent selective sweeps in North American Drosophila melanogaster show signatures of soft sweeps. PLOS Genetics 2015, 11(2), e1005004. [CrossRef] [PubMed]
- Markus Riegler, Manpreet Sidhu, William J. Miller, and Scott L. O’Neill. Evidence for a global Wolbachia replacement in Drosophila melanogaster. Current Biology 2005, 15(15), 1428–1433. [CrossRef]
- P. J. Daborn, J. L. Yen, M. R. Bogwitz, G. Le Goff, E. Feil, S. Jeffers, N. Tijet, T. Perry, D. Heckel, P. Batterham, R. Feyereisen, T. G. Wilson, and R. H. ffrench Constant. A single P450 allele associated with insecticide resistance in Drosophila. Science 2002, 297(5590), 2253–2256. [CrossRef]
- Claire Burny, Viola Nolte, Marlies Dolezal, and Christian Schlötterer. Highly parallel genomic selection response in replicated Drosophila melanogaster populations with reduced genetic variation. Genome Biology and Evolution 2021, 13(11), evab239. [CrossRef]
- Neda Barghi, Roman Tobler, Volker Nolte, Ana Marija Jakšić, François Mallard, Kathrin Anna Otte, Marlies Dolezal, Thomas Taus, Robert Kofler, and Christian Schlötterer. Genetic redundancy fuels polygenic adaptation in Drosophila. PLOS Biology 2019b, 17(2), e3000128. [CrossRef]
- modENCODE Consortium, Sushmita Roy, Jason Ernst, Peter V. Kharchenko, et al. Identification of functional elements and regulatory circuits by Drosophila modencode. Science, 330(6012):1787–1797, 2010. [CrossRef]
- Mark F. Richardson, Lucy A. Weinert, John J. Welch, Raquel S. Linheiro, Michael M. Magwire, Francis M.Jiggins, and Casey M. Bergman. Population genomics of the Wolbachia endosymbiont in Drosophila melanogaster. PLOS Genetics 2012, 8(12), e1003129. [CrossRef]
- Joshua M. Schmidt, R. Thomas Good, Brad Appleton, Jason Sherrard, Greg C. Raymant, Michael R. Bogwitz, Jennifer Martin, Phillip J. Daborn, Michael E. Goddard, Philip Batterham, and Charles Robin. Copy number variation and transposable elements feature in recent, ongoing adaptation at the Cyp6g1 locus. PLOS Genetics 2010, 6(6), e1000998. [CrossRef]
- Richard E. Lenski, Michael R. Rose, Suzanne C. Simpson, and Scott C. Tadler. Long-term experimental evolution in Escherichia coli. I. Adaptation and divergence during 2,000 generations. The American Naturalist 1991, 138(6), 1315–1341. [CrossRef]
- Jeffrey E. Barrick, Daniel S. Yu, Seul J. Yoon, Hyun-Su Jeong, Tae K. Oh, Daniel Schneider, Richard E. Lenski, and Jin H. Kim. Genome evolution and adaptation in a long-term experiment with Escherichia coli. Nature 2009, 461, 1243–1247. [CrossRef]
- Olivier Tenaillon, Jeffrey E. Barrick, Noah Ribeck, Daniel E. Deatherage, Jeffrey L. Blanchard, Aurko Dasgupta, Gary C.Wu, Sébastien Wielgoss, Stéphane Cruveiller, Claudine Médigue, Dominique Schneider, and Richard E. Lenski. Tempo and mode of genome evolution in a 50,000-generation experiment. Nature 2016, 536(7615), 165–170. [CrossRef]
- Benjamin H. Good, Michael J. McDonald, Jeffrey E. Barrick, Richard E. Lenski, and Michael M. Desai. The dynamics of molecular evolution over 60,000 generations. Nature 2017, 551(7678), 45–50. [CrossRef] [PubMed]
- Rebecca Killick, Paul Fearnhead, and Idris A. Eckley. Optimal detection of changepoints with a linear computational cost. Journal of the American Statistical Association 2012, 107(500), 1590–1598. [CrossRef]
- Thomas Schreiber. Measuring information transfer. Physical Review Letters 2000, 85(2), 461–464. [CrossRef] [PubMed]
- Thomas Grentzinger, Chiara Armenise, Céline Brun, Bernard Mugat, Virginie Serrano, Alain Pelisson, and Sandrine Chambeyron.
- Amina Akkouche, Thomas Grentzinger, Mathieu Fablet, Chiara Armenise, Nancy Burlet, Vincent Braman, Sandrine Chambeyron, and Cristina Vieira.
- Michael H. Fabry, Filippo A. Falconio, Fadwa Joud, Emily E. Lees, and Gregory J. Hannon.
- Shivani Deshmukh, Vasudevan Ponnaluri, Nan Dai, Sriharsa Pradhan, and Aayushi Bhavsar.
- Naama Liberman, Sharon Y. Wang, and Eric L. Greer. Transgenerational epigenetic inheritance: From phenomena to molecular mechanisms. Current Opinion in Genetics & Development 2019, 56, 52–59. [CrossRef]
- Jyoti Singh, Benjamin Thoma, Daniel Whitaker, Max Satterly Webley, Yuan Yao, and Matthew W. Powner. Thioester-mediated RNA aminoacylation and peptidyl-RNA synthesis in water. Nature 2025, 644, 933–940. [CrossRef] [PubMed]
Disclaimer/Publisher’s Note: The statements, opinions and data contained in all publications are solely those of the individual author(s) and contributor(s) and not of MDPI and/or the editor(s). MDPI and/or the editor(s) disclaim responsibility for any injury to people or property resulting from any ideas, methods, instructions or products referred to in the content. |
© 2025 by the authors. Licensee MDPI, Basel, Switzerland. This article is an open access article distributed under the terms and conditions of the Creative Commons Attribution (CC BY) license (http://creativecommons.org/licenses/by/4.0/).
Copyright: This open access article is published under a Creative Commons CC BY 4.0 license, which permit the free download, distribution, and reuse, provided that the author and preprint are cited in any reuse.


