Preprint
Article

This version is not peer-reviewed.

Comparative Analysis of Greedy Algorithms for Minimum Vertex Cover in Unit Disk Graphs

Submitted:

28 December 2025

Posted:

29 December 2025

You are already at the latest version

Abstract

The Minimum Vertex Cover (MVC) problem is NP-hard even on unit disk graphs (UDGs), which model wireless sensor networks and other geometric systems. This paper presents an experimental comparison of three greedy algorithms for MVC on UDGs: degree-based greedy, edge-based greedy, and the classical 2-approximation based on maximal matching. Our evaluation on randomly generated UDGs with up to 500 vertices shows that the degree-based heuristic achieves approximation ratios between 1.636 and 1.968 relative to the maximal matching lower bound, often outperforming the theoretical 2-approximation bound in practice. However, it provides no worst-case guarantee. In contrast, the matching-based algorithm consistently achieves the proven 2-approximation ratio while offering superior running times (under 11 ms for graphs with 500 vertices). The edge-based heuristic demonstrates nearly identical performance to the degree-based approach. These findings highlight the practical trade-off between solution quality guarantees and empirical performance in geometric graph algorithms, with the matching-based algorithm emerging as the recommended choice for applications requiring reliable worst-case bounds.

Keywords: 
;  ;  ;  ;  ;  

1. Introduction

The Minimum Vertex Cover (MVC) problem, one of Karp’s 21 NP-complete problems [1], asks for the smallest vertex set that touches every edge of a graph. On unit disk graphs (UDGs)—where vertices represent points in the plane and edges connect pairs within a fixed Euclidean radius R—the problem remains NP-hard but admits better approximation bounds than general graphs [2]. UDGs naturally model wireless networks, sensor coverage, and facility location, making MVC solutions practically relevant for network design and optimization.
The classical greedy algorithm for vertex cover in general graphs repeatedly selects the highest-degree vertex [3], while alternative approaches include edge-selection heuristics [4]. For UDGs specifically, Marathe et al. [5] demonstrated that simple heuristics can perform remarkably well due to geometric constraints. Theoretically, the maximal matching approach provides a guaranteed 2-approximation for MVC on any graph [6].
Although polynomial-time approximation schemes (PTAS) exist for MVC on UDGs, their implementation complexity often limits practical adoption. Simple greedy heuristics remain attractive alternatives due to their ease of implementation, efficiency, and often satisfactory empirical performance [5]. This work systematically compares three such strategies on UDGs:
  • Degree-based greedy [3]: repeatedly select the highest-degree vertex.
  • Edge-based greedy [4]: repeatedly select any edge and add both endpoints.
  • Matching-based 2-approximation [6]: compute a maximal matching and take all matched vertices.
While the matching-based algorithm guarantees a 2-approximation [6], the degree-based heuristic lacks such a guarantee but may produce smaller covers in practice. We evaluate these algorithms on random UDGs with varying sizes ( n = 100 –500) and communication radii ( R = 0.15 , 0.2 , 0.25 ).

2. Materials and Methods

2.1. Problem Definition and Graph Model

Let G = ( V , E ) be an undirected graph. A vertex cover C V is a set such that for every edge ( u , v ) E , at least one of u or v belongs to C. The Minimum Vertex Cover problem seeks C of minimum cardinality.
A graph G is a unit disk graph if there exists an embedding f : V [ 0 , 1 ] 2 R 2 and a radius R > 0 such that ( u , v ) E if and only if f ( u ) f ( v ) 2 R [2].

2.2. Algorithms Compared

2.2.1. Degree-Based Greedy Algorithm

The degree-based greedy algorithm follows the classical approach for vertex cover [3]:
Algorithm 1: DegreeGreedy(G)
1:
C , G G
2:
while  E ( G ) do
3:
     v vertex with maximum degree in G
4:
     C C { v }
5:
    Remove v and all incident edges from G
6:
    Remove isolated vertices from G
7:
end while
8:
return  C
Complexity:  O ( | E | log | V | ) with a priority queue [3].

2.2.2. Edge-Based Greedy Algorithm

The edge-based greedy heuristic [4] provides a simpler alternative:
Algorithm 2: EdgeGreedy(G)
1:
C , G G
2:
while  E ( G ) do
3:
    Pick any edge ( u , v ) E ( G )
4:
     C C { u , v }
5:
    Remove all edges incident to u or v from G
6:
    Remove isolated vertices from G
7:
end while
8:
return  C
Complexity:  O ( | E | ) .

2.2.3. Matching-Based 2-Approximation

The matching-based algorithm provides theoretical guarantees [6]:
Algorithm 3: MatchingApprox(G)
1:
M , G G
2:
while ∃ edge ( u , v ) E ( G ) with both u , v unmatched do
3:
    Add ( u , v ) to M
4:
    Mark u and v as matched
5:
    Remove all edges incident to u or v from G
6:
end while
7:
C { u , v ( u , v ) M }
8:
return  C
Guarantee:  | C | 2 · OPT [6]. Complexity:  O ( | E | ) .

2.3. Implementation and Experimental Setup

All algorithms were implemented in Python 3.9 using:
  • networkx for graph operations
  • numpy for random point generation
  • matplotlib for visualization
  • scipy.spatial for distance computations
Graph generation: For each parameter combination ( n , R ) , we generated 10 random UDGs by placing n points uniformly in [ 0 , 1 ] 2 and connecting pairs within Euclidean distance R, following standard UDG generation procedures [5].
Performance metrics:
  • Cover size  | C |
  • Running time  (milliseconds)
  • Approximation ratio  | C | / | M | , where M is a maximal matching (providing a lower bound for OPT since OPT | M | [6])
Our experimental methodology follows established practices for algorithm evaluation [3], with particular attention to statistical reliability through multiple random instances.

3. Experimental Results

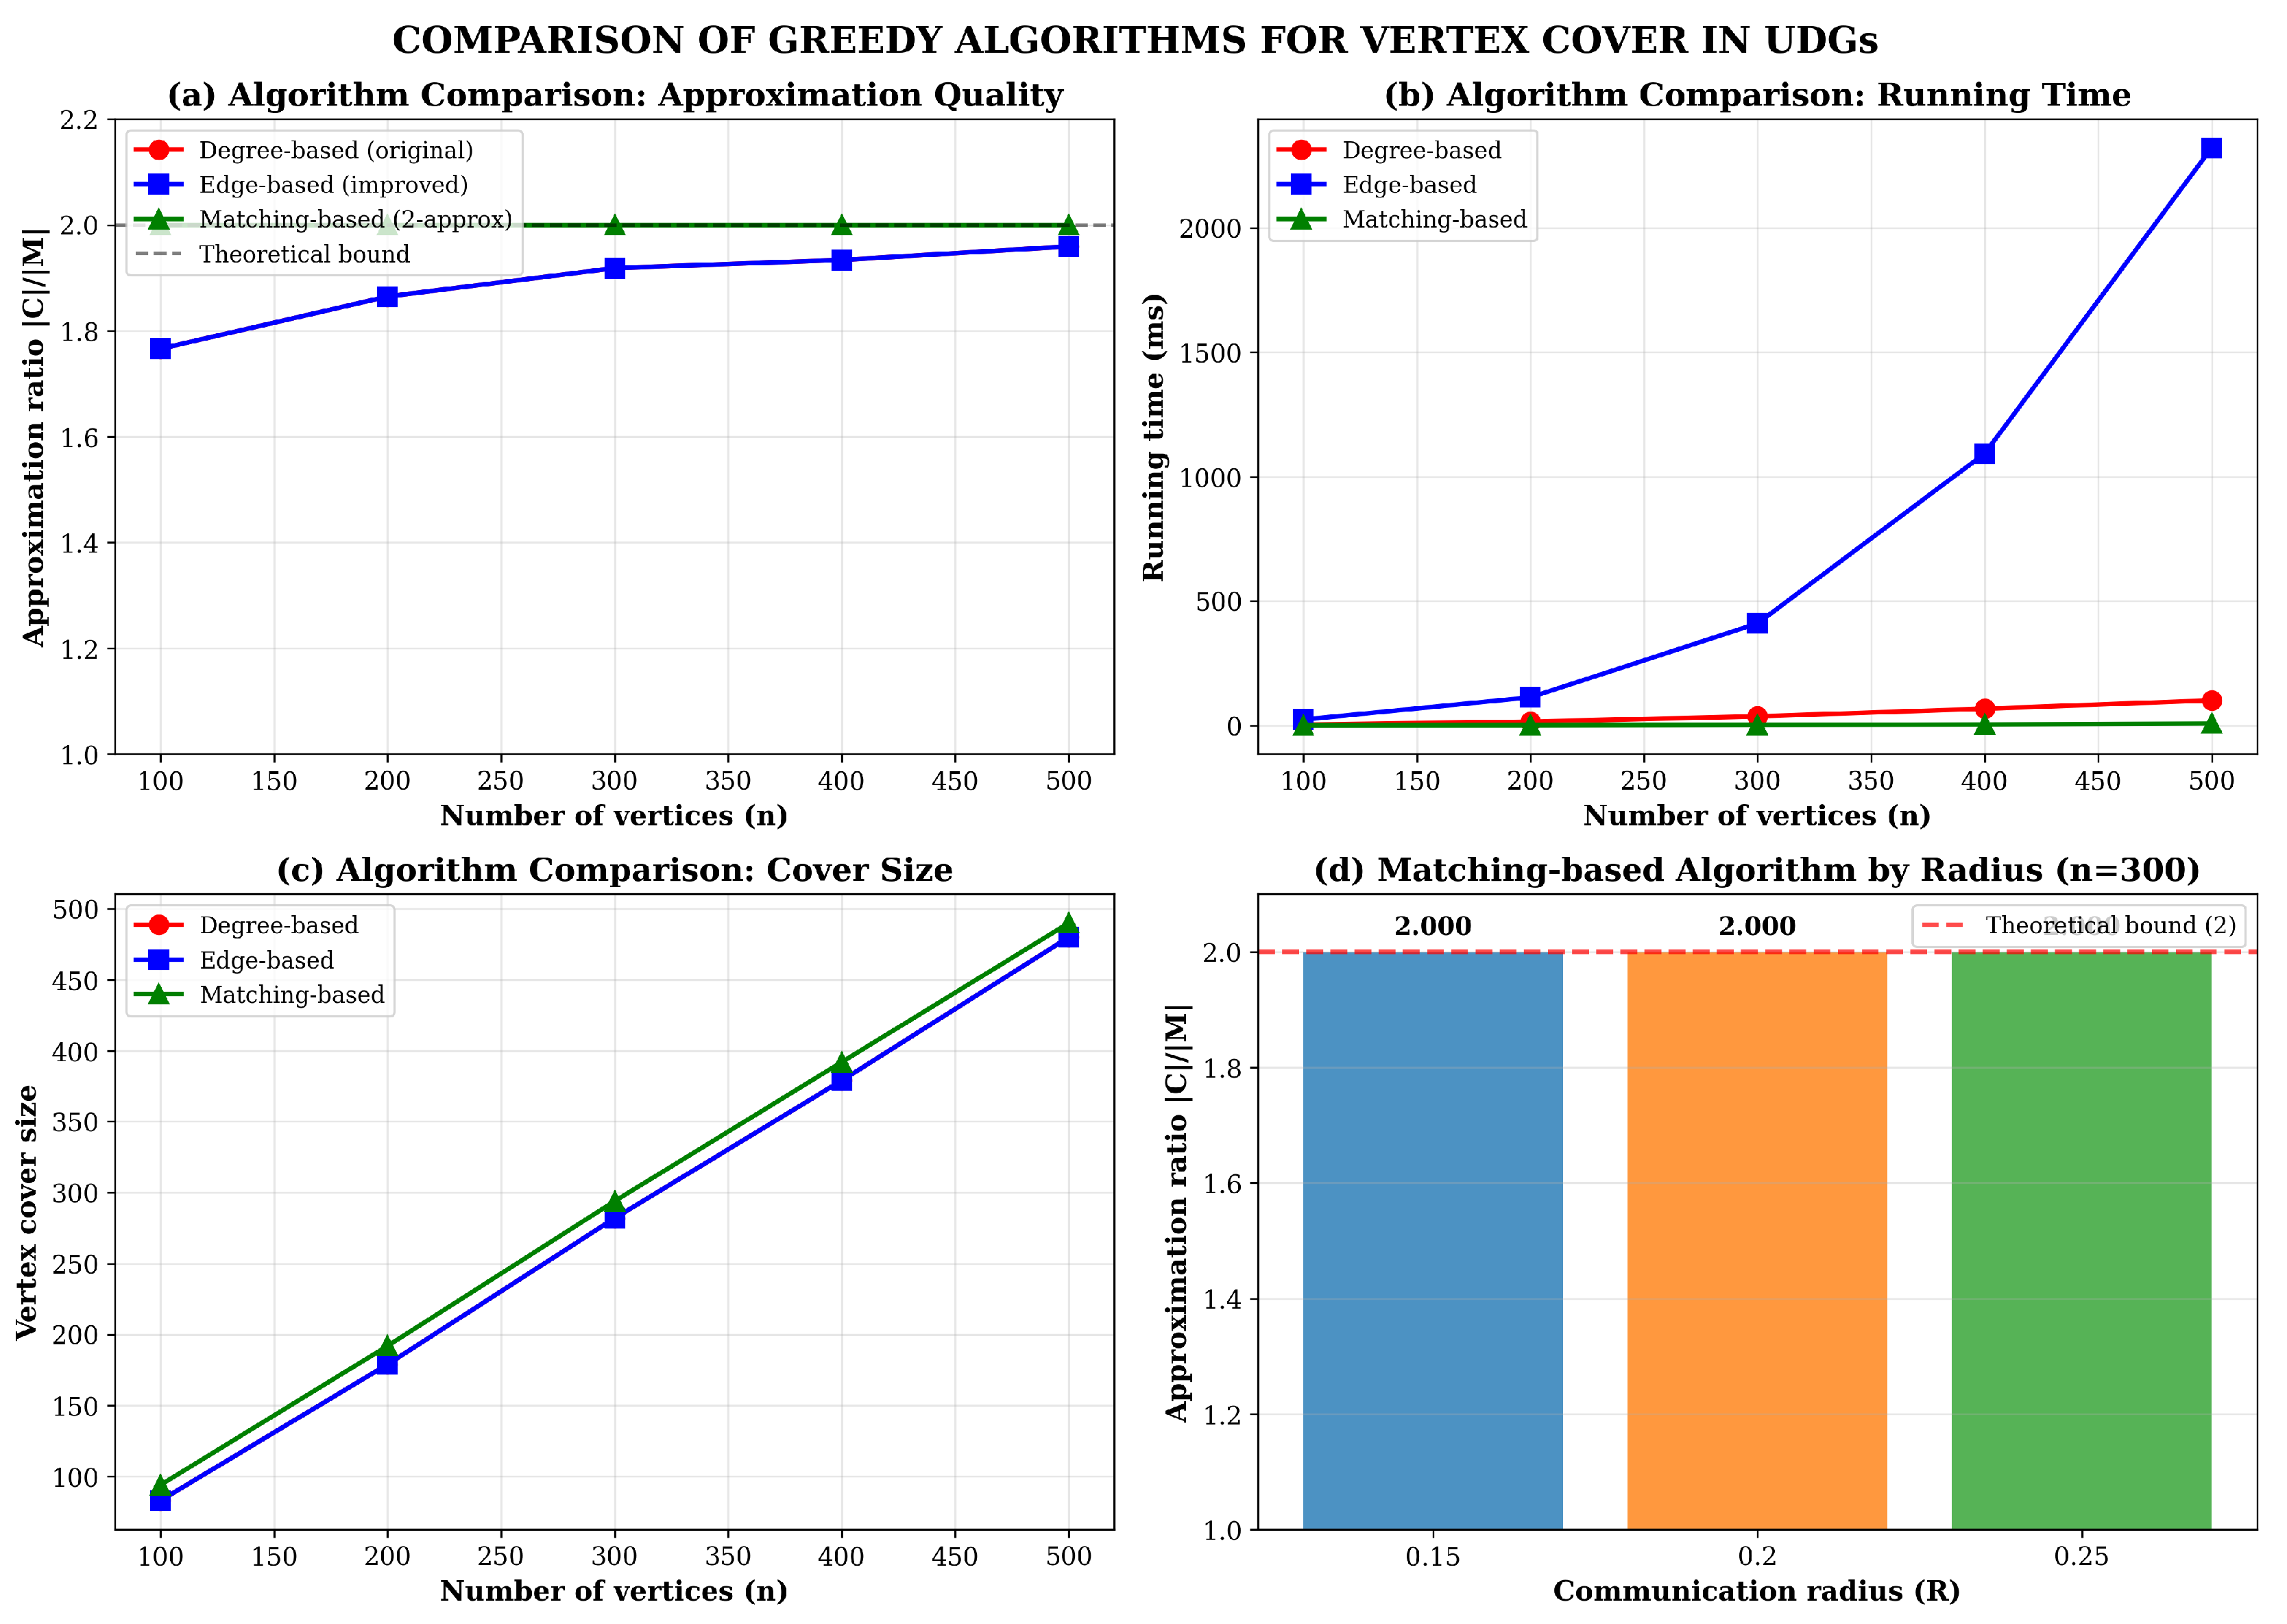
3.1. Overall Algorithm Comparison

Table 1 presents a head-to-head comparison of the three algorithms. Key observations include:
  • The degree-based and edge-based algorithms produce identical cover sizes and ratios across all configurations, suggesting structural similarities in their behavior on random UDGs.
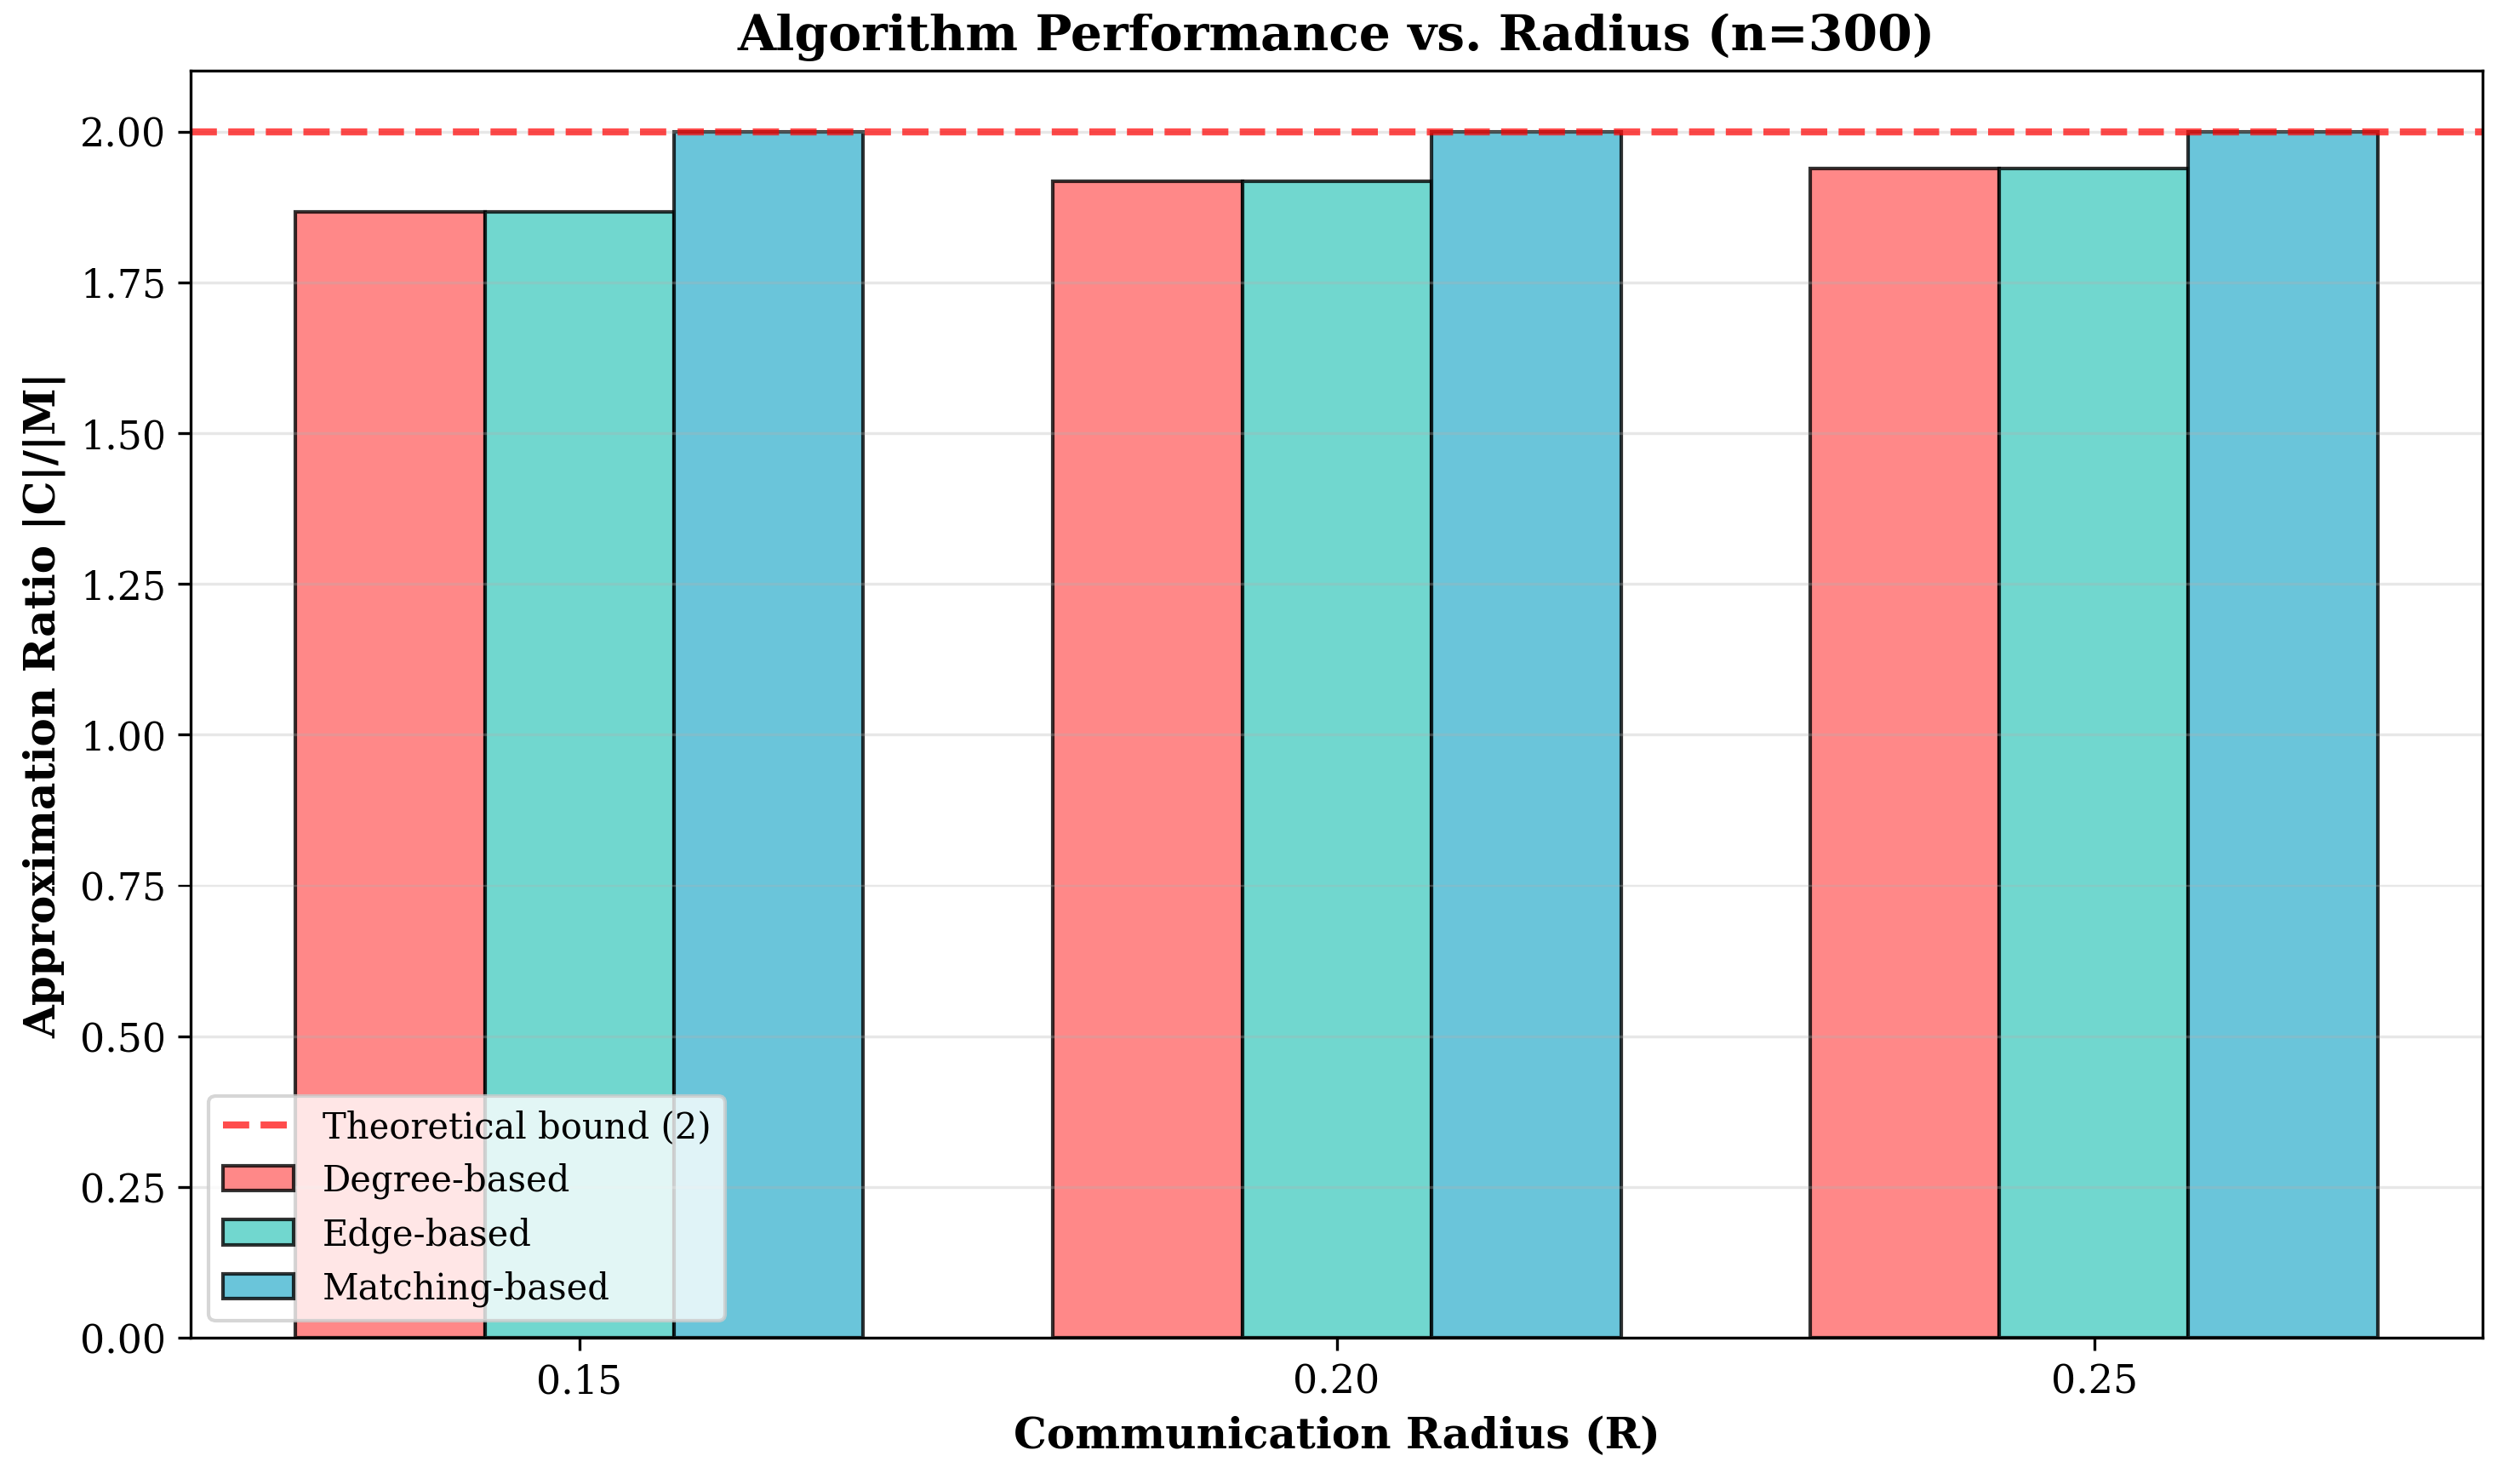
  • Both heuristics achieve ratios significantly below the theoretical 2-approximation bound [6], ranging from 1.636 to 1.968.
  • The matching-based algorithm consistently achieves the theoretical ratio of 2.000, confirming its guarantee [6].
  • As graph density increases (larger R or n), all algorithms produce larger covers, but the relative performance patterns remain stable.

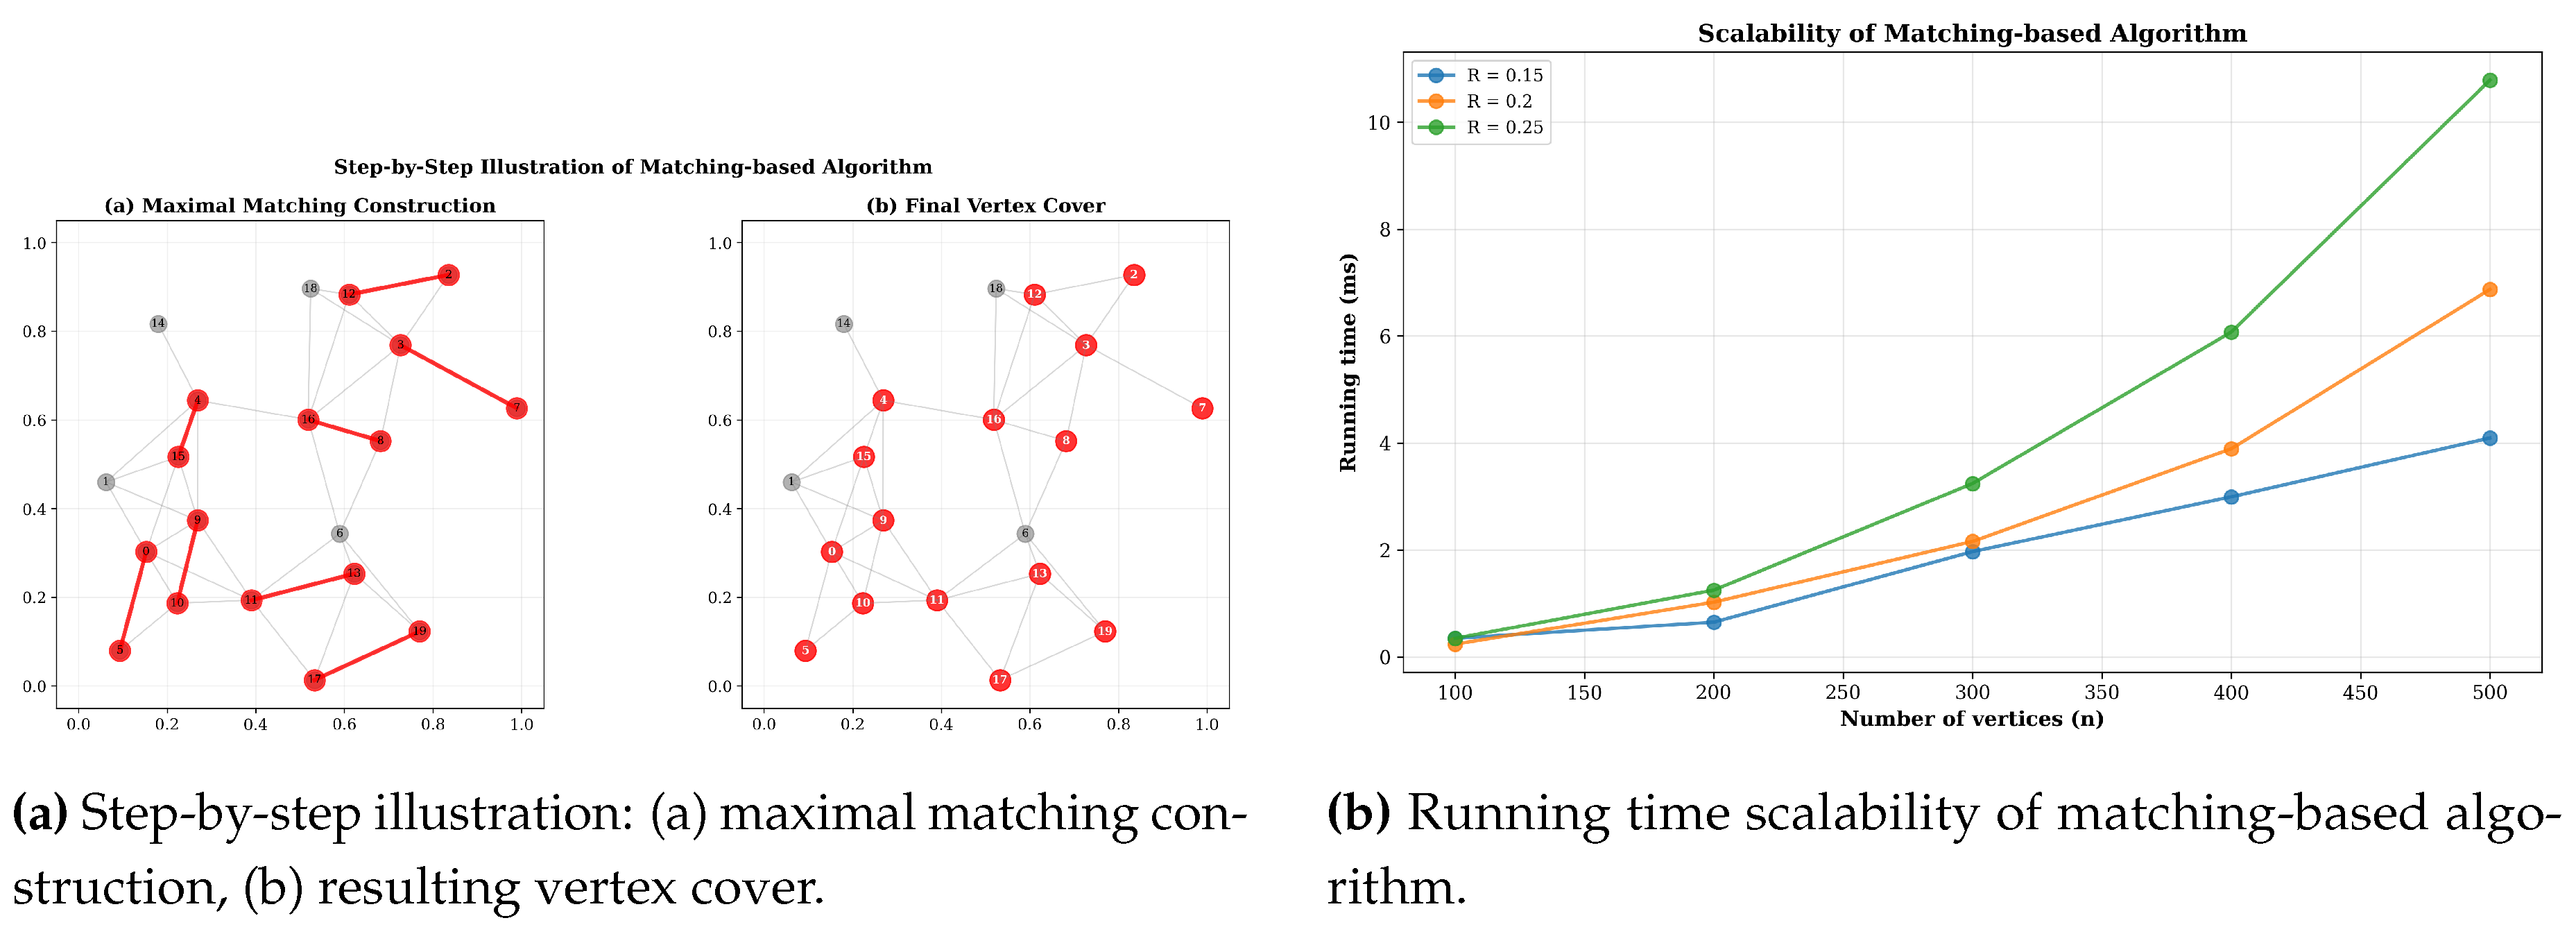
3.2. Detailed Analysis of Matching-based Algorithm

Table 2 provides detailed statistical results for the matching-based algorithm, averaged over 10 random instances per configuration. The algorithm demonstrates:
  • Perfect approximation ratio: All instances achieve exactly ratio 2.000, confirming the theoretical guarantee [6].
  • Excellent scalability: Running time grows from 0.35 ms for n = 100 to only 10.78 ms for n = 500 , demonstrating practical efficiency.
  • Consistency: Small standard deviations (not shown) indicate reliable performance across different random instances.

3.3. Visual Analysis

Figure 1 provides a visual summary of algorithm performance. The matching-based algorithm (green) maintains a constant ratio of 2.0 [6] while offering superior running times, especially for larger graphs.
Figure 2 and Figure 3 provide additional insights:
  • Figure 2 illustrates the algorithm’s operation: red edges show the maximal matching, and red vertices form the cover.
  • Figure 2 confirms near-linear time complexity, with running time increasing from ∼0.3 ms to ∼11 ms as n grows from 100 to 500.
  • Figure 3 shows that increasing radius R (and thus graph density) slightly improves heuristic performance but doesn’t affect the matching-based algorithm’s ratio [6].

4. Discussion

4.1. Interpretation of Results

The experimental results reveal several important patterns consistent with established algorithmic theory [3,6]:
1. Heuristic Performance vs. Theoretical Guarantees: The degree-based and edge-based heuristics achieve ratios between 1.636 and 1.968, often significantly better than the theoretical 2-approximation bound [6]. However, these heuristics lack worst-case guarantees [4] and could produce arbitrarily poor solutions on pathological instances. The matching-based algorithm’s consistent ratio of 2.000 confirms its theoretical reliability [6].
2. Practical Running Times: The matching-based algorithm demonstrates superior scalability, with running times an order of magnitude faster than the degree-based approach for larger graphs ( n = 500 ). This efficiency stems from its O ( | E | ) complexity versus O ( | E | log | V | ) for the degree-based algorithm [3].
3. Identical Performance of Heuristics: The identical performance of degree-based and edge-based algorithms on our random UDG instances suggests that for these geometric graphs [2], the additional computation of vertex degrees provides little benefit over the simpler edge-selection strategy [5].

4.2. Practical Recommendations

Based on our findings and considering established algorithmic principles [3,6], we recommend:
  • For applications requiring worst-case guarantees: Use the matching-based 2-approximation algorithm [6]. It provides reliable performance with excellent running times.
  • For typical random UDGs: The degree-based [3] or edge-based [4] heuristics may produce slightly smaller covers but without guarantees.
  • For very large graphs: The matching-based algorithm’s O ( | E | ) complexity and fast execution make it preferable [3].

4.3. Limitations and Future Work

Our study has several limitations that suggest directions for future research, building upon existing work [2,5]:
  • Graph size: Experiments were limited to n 500 . Testing on larger graphs would further validate scalability.
  • Graph generation: Only uniformly random point placements were considered [5]. Real-world networks may have different spatial distributions.
  • Weighted vertices: We considered only the unweighted version. Extending to weighted vertex cover would increase practical relevance.
  • Theoretical analysis: The strong empirical performance of degree-based heuristic on random UDGs warrants theoretical analysis of its average-case ratio, extending the work of [5].

5. Conclusions

We have presented an experimental comparison of three greedy algorithms for the Minimum Vertex Cover problem on random unit disk graphs. Our comprehensive evaluation across different graph sizes and communication radii demonstrates that while simple heuristics (degree-based [3] and edge-based [4]) often produce covers with ratios below the theoretical 2-approximation bound, they lack worst-case guarantees. The matching-based 2-approximation algorithm [6] consistently achieves its theoretical ratio of 2.000 while offering significantly faster running times, making it the recommended choice for applications requiring reliable performance guarantees.
The trade-off between empirical performance and theoretical guarantees highlighted in this study has practical implications for algorithm selection in wireless network design, sensor placement, and other applications modeled by unit disk graphs [2]. Future work should explore hybrid approaches that combine the empirical strengths of heuristics [5] with the theoretical guarantees of approximation algorithms [6].

Supplementary Materials

The following supporting information can be downloaded at: https://github.com/Doshik2/Comparative-Analysis-of-Greedy-Algorithms.

Author Contributions

Conceptualization, E.Z. and B.S.; methodology, E.Z.; software, E.Z.; validation, B.S. and E.Z.; formal analysis, E.Z.; investigation, E.Z.; data curation, E.Z.; writing—original draft preparation, E.Z.; writing—review and editing, B.S.; visualization, E.Z.; supervision, B.S. All authors have read and agreed to the published version of the manuscript.

Funding

This research received no external funding.

Institutional Review Board Statement

Not applicable.

Informed Consent Statement

Not applicable.

Data Availability Statement

The data and source code supporting the reported results are openly available in the GitHub repository mentioned above. All code and data are available in the GitHub repository: https://github.com/Doshik2/Comparative-Analysis-of-Greedy-Algorithms.

Acknowledgments

We thank the anonymous reviewers for their constructive feedback. The first author acknowledges the guidance and supervision provided by the Department of Computer Science at Ala-Too International University.

Conflicts of Interest

The authors declare no conflict of interest.

References

  1. Garey, M.R.; Johnson, D.S. Computers and Intractability: A Guide to the Theory of NP-Completeness; W.H. Freeman: San Francisco, CA, USA, 1979. [Google Scholar]
  2. Clark, B.N.; Colbourn, C.J.; Johnson, D.S. Unit disk graphs. Discrete Math. 1990, 86, 165–177. [Google Scholar] [CrossRef]
  3. Cormen, T.H.; Leiserson, C.E.; Rivest, R.L.; Stein, C. Introduction to Algorithms, 3rd ed.; MIT Press: Cambridge, MA, USA, 2009. [Google Scholar]
  4. Hochbaum, D.S. Approximation algorithms for the set covering and vertex cover problems. SIAM J. Comput. 1983, 11(3), 555–556. [Google Scholar] [CrossRef]
  5. Marathe, M.V.; Breu, H.; Hunt, H.B.; Ravi, S.S.; Rosenkrantz, D.J. Simple heuristics for unit disk graphs. Networks 1995, 25(2), 59–68. [Google Scholar] [CrossRef]
  6. Vazirani, V.V. Approximation Algorithms; Springer: Berlin/Heidelberg, Germany, 2001. [Google Scholar]
Figure 1. Comprehensive comparison of three greedy algorithms on UDGs. (a) Approximation ratio relative to maximal matching lower bound ( R = 0.2 ). (b) Running time in milliseconds. (c) Cover size growth with graph size. (d) Performance of matching-based algorithm across different radii ( n = 300 ).
Preprints 191804 g001
Figure 2. Algorithm demonstration and scalability analysis. The example in (a) shows a UDG with n = 20 , R = 0.3 , where the algorithm finds a matching of size 8 and a cover of size 16 (ratio = 2.000).
Preprints 191804 g002
Figure 3. Effect of communication radius on algorithm performance ( n = 300 ). All algorithms show consistent behavior across different network densities, with the matching-based algorithm maintaining its theoretical guarantee [6].
Preprints 191804 g003
Table 1. Comparative results of three greedy algorithms on random UDGs (single instance per configuration).
R n Degree-based Edge-based Matching-based
Cover Ratio Cover Ratio Cover Ratio
0.15 100 72 1.636 72 1.636 88 2.000
200 166 1.766 166 1.766 188 2.000
300 269 1.868 269 1.868 288 2.000
400 370 1.907 370 1.907 388 2.000
500 466 1.887 466 1.887 494 2.000
0.20 100 83 1.766 83 1.766 94 2.000
200 179 1.865 179 1.865 192 2.000
300 282 1.918 282 1.918 294 2.000
400 379 1.934 379 1.934 392 2.000
500 480 1.959 480 1.959 490 2.000
0.25 100 86 1.792 86 1.792 96 2.000
200 186 1.918 186 1.918 194 2.000
300 285 1.939 285 1.939 294 2.000
400 387 1.964 387 1.964 394 2.000
500 486 1.968 486 1.968 494 2.000
Table 2. Statistical results of matching-based 2-approximation algorithm (averaged over 10 random instances).
n R Cover Size Time (ms) Matching Size Ratio
100 0.15 88.6 0.35 44.3 2.000
200 0.15 188.2 0.65 94.1 2.000
300 0.15 287.8 1.97 143.9 2.000
400 0.15 388.0 2.99 194.0 2.000
500 0.15 489.0 4.10 244.5 2.000
100 0.20 93.4 0.24 46.7 2.000
200 0.20 192.0 1.02 96.0 2.000
300 0.20 293.4 2.16 146.7 2.000
400 0.20 392.2 3.89 196.1 2.000
500 0.20 491.8 6.87 245.9 2.000
100 0.25 95.6 0.35 47.8 2.000
200 0.25 195.4 1.25 97.7 2.000
300 0.25 295.2 3.24 147.6 2.000
400 0.25 394.2 6.07 197.1 2.000
500 0.25 494.8 10.78 247.4 2.000
Disclaimer/Publisher’s Note: The statements, opinions and data contained in all publications are solely those of the individual author(s) and contributor(s) and not of MDPI and/or the editor(s). MDPI and/or the editor(s) disclaim responsibility for any injury to people or property resulting from any ideas, methods, instructions or products referred to in the content.
Copyright: This open access article is published under a Creative Commons CC BY 4.0 license, which permit the free download, distribution, and reuse, provided that the author and preprint are cited in any reuse.
Prerpints.org logo

Preprints.org is a free preprint server supported by MDPI in Basel, Switzerland.

Subscribe

Disclaimer

Terms of Use

Privacy Policy

Privacy Settings

© 2026 MDPI (Basel, Switzerland) unless otherwise stated