
Submitted:
25 December 2025
Posted:
29 December 2025
You are already at the latest version
Abstract
This article reviews the same-frequency mutual interference explanation of gravitational bending light, gravitational lensing and light bending, analyzes the observation data of HerS-3 Einstein Cross, and uses the same-frequency mutual interference explanation of light bending to deduce the rationality of the formation of the HerS-3 Einstein Cross. This article believes that the light starts from the large When passing by a massive luminous planet (galaxy), the light bends due to the influence of electromagnetic waves continuously emitted by the massive luminous planet (galaxy). The degree of bending of the light is directly proportional to the brightness of the massive luminous planet and inversely proportional to the shortest distance between the light and the planet, regardless of the mass of the planet. Generally, the mass-to-light ratio (excluding dark matter) of planets (galaxies) in the universe is much smaller than the mass-to-light ratio of the sun. Therefore, the degree of light bending calculated using the gravitational lens principle is much smaller than the actual value. At this time, we have to use non-existent dark matter to supplement it. The HerS-3 Einstein cross derivation of dark matter is another example. However, using the same-frequency mutual interference explanation of light bending will not deduce dark matter, which is consistent with observational reality.
Keywords:
light bending
; gravitational lensing
; Einstein’s cross
; dark matter
; same-frequency mutual interference explanation of light bending
1. Preface
Light travels in straight lines, but it bends when it passes by a massive, luminous star [1]. Newton proposed in 1704 that the orbit of objects in mechanics can be bent by external forces, and light can also be bent in the medium. In 1784, Cavendish and in 1801 Soldner (Germany) both believed that Newton’s gravity theory predicted that starlight passing near a massive celestial body would be bent. Soldner also treated light as a heavy object and calculated the deflection angle of gravitational deflection of light. This calculation was published in 1804 and has been passed down to this day. In 1911, Einstein began to perform calculations based on the equivalence principle in the framework of his general theory of relativity, and the results were the same as Soldner’s results. However, in the process of constructing the general theory of relativity, Einstein realized in 1915 that the previous calculation results only obtained half of the deflection angle, so he revised it to 1.75 arc seconds. Einstein started based on “mass bends space-time, and light is the zero geodesic in space-time.” The derivation result is:
During the 1919 total solar eclipse, the Principe Island observation team led by Eddington and others measured the light deflection angle as 1.61 arc seconds, and the Sobral observation team measured 1.98 arc seconds. The average value is 1.795 arc seconds, which is highly consistent with Einstein’s calculation results. In 1979, the United Kingdom organized a reprocessing of Eddington’s photo data and concluded that “Eddington’s results are reasonable.”
The same-frequency mutual interference explanation of light bending [2] believes that: light is propagated by photons through electromagnetic waves, and gravity is propagated by gravitons through gravitational energy waves. The wavelengths of electromagnetic waves (visible light) and gravitational energy waves are not in the same order of magnitude, and they cannot affect each other. Therefore, photons and gravitons will hardly interact, and visible light (infrared light) and gravity will not interact. For electromagnetic waves of the same frequency, “interference” and “co-frequency interference” will occur when they meet, affecting each other’s propagation direction. Under normal circumstances, this effect is too small for us to observe. When a column of visible light (infrared light) passes by a massive luminous planet, the massive planet emits The electromagnetic waves completely cover the visible light (infrared light). At this time, the visible light (infrared light) is continuously affected by the electromagnetic waves of the same frequency emitted by the massive planet, and will form an arc around the massive planet, just like gravity bending light. This is the reason why people form “gravitational bending light” and “gravitational lens”. In the universe, when light passes by a massive luminous planet (galaxy), the bend formed is caused by the influence of electromagnetic waves continuously emitted by the massive luminous planet (galaxy). The degree of light bending is directly proportional to the brightness of the massive luminous planet and inversely proportional to the shortest distance between the light and the massive luminous planet.
Expressed as:
According to the measured data of the sun’s bending light, the luminosity (LS) of the sun is about 3.827×10^26J/s, the radius of the sun is 6.955×10^8m, and the angle at which the sun bends visible light is 1.795 arc seconds, then the light bending coefficient is:
Here 3.262E-18 is the common method in the table, the same as 3.262×10^(-18).
The article “An Alternative Explanation of the Gravitational Lensing Observations in MACS J 0025.4-1222 and Bullet (1E0657-56) Galaxy Clusters” believes that there is no dark matter derived from “gravitational lensing” in colliding galaxy clusters. Astronomers’ observations of distant colliding galaxies over the years have shown that: 1) Galaxy collisions have basically no impact on observable massive luminous planets; 2) There is a large amount of non-luminous hot gas in galaxy collisions; 3) Galaxies with dark matter in galaxy collisions all use the “gravitational lens” principle to invert the mass of the galaxy; 4) The mass of the galaxy inverted through the “gravitational lens” principle is separated from the distribution center of the non-luminous hot gas; 5) The mass of the material inverted through the “gravitational lens” principle is much greater than the mass of the luminous planet.
These phenomena reflect the following problems with the gravitational lens principle in general relativity: 1) The microscopic mechanism of action cannot be explained: As we all know, gravity is propagated by gravitons, and light is propagated by photons. Gravitons and photons basically do not interact, so the gravitational bending of light cannot be explained from the microscopic mechanism. 2) When Einstein published his general theory of relativity, he did not provide a detailed description of the structure of space-time, let alone how gravity bends space-time. 3) If gravity bends space-time, then the non-luminous hot gas, which is the main source of mass in galaxy collisions, should also contribute to the curved space-time. However, the observation fact is that the galaxy mass inferred through the “gravitational lens” principle is separated from the distribution of the non-luminous hot gas, indicating that the galaxy mass inferred through the “gravitational lens” principle does not reflect the mass of the non-luminous hot gas. To put it bluntly, a large amount of non-luminous gas (precursor objects) does not bend space-time. The reasonable explanation is: gravity bends the direction of motion of the object. When the light passes by the massive luminous planet, it continuously interacts with the electromagnetic waves emitted by the massive luminous planet, bending the light. It is reasonable that such a large amount of non-luminous gas does not bend light. 4) The degree of light bending caused by distant high-brightness stars is greatly reduced. Astronomical observations show that colliding galaxies are generally far away from the earth. The reason why we can observe these galaxies is because the brightness of the planets in these galaxies is much brighter than that of the sun. Statistics on some planets show that the mass-to-light ratio of distant stars (excluding dark matter) is much smaller than the mass-to-light ratio of the sun. In this way, from the side of these planets The degree of bending of light passing by the edge explained by “gravitational lensing” is much smaller than that explained by same-frequency mutual interference. In order to make up for the insufficiency of the calculation of the degree of light bending by the gravitational lens principle, non-existent dark matter has to be used to compensate. In fact, the explanation of light mutual interference in long-distance galaxy collision observations will not invert dark matter, which is in line with the reality of astronomical observations. MACS J 0025.4-1222 and bullet (1E0657-56) are two examples. It’s the same reason why the ratio of dark matter to visible matter is much lower than expected in typical rich galaxy clusters.
2. HerS-3 Einstein Cross
In September 2025, the world’s largest preprint platform arXiv.org announced “HerS-3: An Exceptional Einstein Cross Reveals a Massive Dark Matter Halo”[3].
HerS-3 is a bright (infrared) galaxy located at redshift z = 3.0607, approximately 11.6 billion light-years from Earth. The Hubble Space Telescope image reveals a foreground lens group composed of four galaxies (G1 to G4) with a redshift z of about 1.0, located about 7.8 billion light-years away. HerS-3 is magnified by the lens into an Einstein cross. Normally, only four mirror images appear because the center of the Einstein cross is blocked by foreground objects or has no signal, but HerS-3 is different. It contains five mirror images, and the fifth mirror appears at the center of the Einstein cross. This article uses the principle of gravitational lensing to deduce that: when only considering the four visible massive galaxies G1–G4 that are relatively close to HerS-3 and located in the center of the galaxy group, the lens model cannot reproduce the characteristics of the five Einstein cross mirror images of HerS-3 observed in the ALMA image. Only by adding a massive dark matter halo within a range of about 3-7 arc seconds (i.e. 25 to 60 kiloparsecs) southeast of G1 can the image reconstruction result be completely consistent with the characteristics of the five observed mirror images. There is no corresponding visible celestial body here. The deduced mass of the dark matter halo is between log (MDM/M⊙) = 12.2 and 13.0, which is trillions of times the mass of the sun and spans more than 100,000 light-years.
2.1. HerS-3 Einstein Cross Mirror Galaxy
Figure 1 is the HerS-3 Einstein cross observation diagram. The five yellow outlines in the picture are the five mirror images of the HerS-3 Einstein cross.
The redshifts are all z=3.0607, and there is a fifth image in the center of the cross. The four lensed galaxy groups are labeled G1, G2, G3 and G4, and their redshifts are z≈1.0.
Table 1 is the observation data of the five mirror images of the HerS-3 Einstein Cross. The coordinates in the table correspond to the center of each image of the HerS-3 Einstein Cross. The flow densities listed are measured values. The five mirror images are marked by location: NE: northeast; E: east; C: center; W: west; SW: southwest.
2.2. Galaxy Foreground Group (Lensing Galaxy Group)
Table 2 shows the photometric characteristics of the four foreground (lens) galaxies G1, G2, G3 and G4 of HerS-3.
Table 3 shows the flux densities of G1, G2, G3 and G4 lens galaxies, all in µJy. In the table, SDSS/u: refers to the
u-band filter used by the Sloan Digital Sky Survey (SDSS) project, covering the near-ultraviolet band (about 3500-4000 Å), and is mainly used to observe the ultraviolet radiation characteristics of celestial objects. Subaru/HSC/g: refers to the g-band filter of the wide-field camera (HSC) mounted on the Subaru Telescope (Subaru), covering the green part of visible light (about 4500-5500 Å), and is often used for studying galaxy morphology and large-scale structure. r: Usually refers to the r-band in standard astronomical filters, covering the red light region (about 6000-7000 Å). It is a commonly used band in optical surveys and is used to measure galaxy brightness and redshift. i: i-band in standard filters, covering near-infrared red light (about 7500-8500 Å), suitable for observing fainter or high-redshift objects, such as distant galaxies. z: z-band in standard filters, covering longer near-infrared wavelengths (about 8500-9500 Å), often used for high-redshift universe observations, such as early galaxies and dark energy research. Y: Y band in standard filters, located in the near-infrared (about 9700-10500 Å), mainly used for observing cold stars, galaxy clusters and cosmological phenomena. HST/F110W: refers to the F110W filter of the third-generation Wide Field Camera (WFC3) of the Hubble Space Telescope (HST), covering near-infrared wavelengths (approximately 10,000-12,000 Å). It is specially designed for deep space surveys and is used to study galaxy evolution and dark matter distribution.
The redshift distributions of all the lenticular galaxies G1, G2, G3 and G4 are concentrated in the range of z = 0.9 to z = 1.1. Taking into account the differences among the members of the galaxy group, we assume that the photometric redshift zphot of the galaxy group is approximately 1.
3. HerS-3 Celestial Lens Analysis
In Table 1, taking the lens object G1 as a reference (RAG1 01h27m54.23s, Dec.G1 00°49′39″09), the relative positions of the five mirror points are as follows:

Table 4.
Relative positions of HerS-3 mirror galaxies.
| mirror galaxy | R.A. | ∆R.A.(″) | DEC. | ∆Dec.(″) |
| SW | 01:27:54.01 | -22.000 | 00:49:37.1 | -1.990 |
| NE | 01:27:54.37 | 14.000 | 00:49:42.1 | 3.010 |
| E | 01:27:54.26 | 3.000 | 00:49:38.5 | -0.590 |
| C | 01:27:54.15 | -8.000 | 00:49:40.0 | 0.910 |
| W | 01:27:54.06 | -17.000 | 00:49:41.1 | 2.010 |
The relative coordinates and relative redshifts of lens objects G1-G4 are shown in Table 5. The reference positions of lens galaxies G1-G4 in the table are: RAG1: 01h27m54.23s, Dec.G1: 00°49′39″09 , the red shift is based on 1. When the red shift z is 1, the corresponding distance is 1.372E+26m. If the relative position and relative red shift are replaced by distance in meters, it can be seen that the relative red shift is 1747-2450 times larger than the relative position.
Therefore, the redshift formed by multiple lens galaxies (for example, three G1-G3) can be understood according to Figure 2. In the figure, S is the source object, O is the observation point, G1-G3 are the lens objects, assuming that the deflection angles formed by the lens objects are γ1, γ2, γ3, then the total deflection angle is:
That is, the deflection angle of light formed by multiple lenses is the sum of the deflection angles formed by each lens. Therefore, in the HerS-3 Einstein cross lens galaxy group, although the red shifts of G1-G4 are different, we can ignore the red shift issue and uniformly place them on the lens plane with red shift z=1.
The radiation amplitudes measured in different wavebands of G1-G4 lens galaxies are different. The specific values are as shown in Table 6. The measurement error range is removed from the table.
There is no specific value for the SDSS/u frequency band, so we will omit the calculation here. The third column Subaru/g is the measured value under the g filter, g (%) is the proportion of the measured value of the lens, the rest are similar, Subaru/r is The actual measured value under the r filter, r (%) is the proportion of the actual measured value of the lens, Subaru/i is the actual measured value under the i filter, i (%) is the proportion of the actual measured value of the lens, Subaru/z is the actual measured value under the z filter, z ( %) is the proportion of the actual measured value of the lens, Subaru/y is the actual measured value under the y filter, y(%) is the proportion of the actual measured value of the lens, HST/F110W is the actual measured value under the HST/F110W filter, w(%) is As can be seen from the table, the proportion of the measured value of the lens under the Subaru/g filter is obviously different from other constant proportions. Here, we also discard the measurement data under the Subaru/g filter and do not calculate it.
Assume that the measured wavelength of the observation point is λ1, and the wavelength emitted by the lens galaxy on the lens plane is λ0. According to the definition of red shift
The wavelength of the lens plane is:
The actual measurement of luminous flux in the infrared band is in microjansky µJy, which is the unit used to express energy density in radio astronomy. 1 µJy is equal to 10^-6 Janski Jy, and 1 Janski Jy is equal to 10^-26 watts per square meter per Hertz (W·m−2·Hz−1). Assuming that the measured center frequency unit is nanometers and the measured energy density is Microjanski, then the conversion into brightness (unit W/m^2) is:
Assume that the lens diameter of the observation point telescope is do (the diameter of the main mirror of the Subaru telescope is 8.2 meters). The amount of radiation in the universe is inversely proportional to the square of the distance. Then, at the lens plane, the brightness of the lens object is:
The brightness of a lensed galaxy is:
Table 7 shows the total radiation amplitude LO of the lens galaxies G1-G4 at the observation point. It is the sum of the measured amplitudes in different bands divided by the wavelength. The brightness of actual lensed galaxies should be proportional to this value.
Figure 3 is a schematic diagram of the bending of light by a single lens. In the figure, S is the source object, O is the observation point, G1 is the lens object, NE is the virtual image formed, and γ is the angle at which the light is bent.
Redshift formula:
Suppose the redshift of the source object is zs and the redshift of the lens plane is zl. The redshift between the source object and the observation point actually represents the redshift formed by the light after bending. This deflection angle is:
Here γ and r″ are both in arc seconds.
Figure 4 is a schematic diagram of mirror image formation. According to the same-frequency mutual interference explanation of light bending, the deflection angle of light is:
For the HerS-3 Einstein Cross, there are 5 mirror images and 4 lens galaxies. For each mirror image (such as NE), there are four lens galaxies (G1, G2, G3, G4) that work together to bend light. In the lens plane, the white light point is the coordinate point where the line connecting the source galaxy HerS-3 and the observation point passes through the lens plane. This point assumes the coordinates ΔRO and ΔDO relative to G1. In the figure, the effect of the lens galaxy G4 on the mirror NE is G4 on the NE The component of the light deflection angle in the NEO direction, δG4NEO is its included angle:
The sum of the deflection angles formed by the four lens galaxies at the mirror point is:
The rest are similar.
Table 8 is the OR and OD fitting table of the coordinates OR and OD of the center point where the line connecting the source object and the observation point passes through the lens plane. SWR and SWD are the coordinates of the center point of the mirror object. GR and GD are the coordinates of the center of the lens object. For each mirror point, it is formed by the sum of the deflection angles of the four lens galaxies at the mirror point, γ2. In addition, the deflection angle formed by equation (12) is γ1. Each mirror point The difference in deflection angle is Δγ, and the total below is the total of γ2, γ1, and Δγ. The bottom G=γ1/γ2, γ21=G×γ2. Repeatedly adjust the positions of OR and OD to minimize the total Δγ. The final adjustment result is OR=-9.11281″, OD=-10.97937″, and the error is: Δγ/γ1 (γ2) = 0.0834.
Next we calculate the brightness of the lensed galaxy. During the simulation process in Table 7, the corresponding formula is:
Let the brightness of the lens galaxy be L, and the actual brightness used for calculation is LG1:
The ratio of the brightness of the lensed galaxy to the radiance actually used in the calculation is:
The brightness of the lens galaxy calculated from this is shown in Table 9. The third column in the table is the brightness of the lens galaxy, the fourth column is the brightness relative to the sun, the fifth column is the mass of the lens galaxy given in Table 2, the sixth column is the mass relative to the sun, and the seventh column is the ratio of the mass and brightness of the lens galaxy. It can be seen from the table that G4 has a much smaller mass-to-light ratio than other galaxies, G 1. G3 is second, so the degree of light bending calculated by mass in the G1, G3, and G4 directions is much smaller than the actual degree, especially in the G4 direction. Therefore, in order to make up for the shortcomings of calculating the degree of light bending by mass, we have to supplement the non-existent dark matter halo in the G1, G3, and G4 directions, especially in the direction close to G4.
4. Discussion
In the discussion of this article, the bending coefficient of light is based on the measured data of visible light bent by the sun, while the measured data of the HerS-3 Einstein Cross is in the infrared band. There is a certain error between the two. In addition, the radiation flux measured at the observation point of the lens galaxies G1-G4 comes from different astronomical telescopes. Whether they can represent the infrared brightness of these galaxies is questionable, so the discussion in this article can only be used as a reference.
5. Conclusion
Light is propagated by photons through electromagnetic waves, and gravity is propagated by gravitons through gravitational energy waves. The wavelengths of electromagnetic waves (visible light) and gravitational energy waves are not in the same order of magnitude, and they cannot affect each other. Therefore, photons and gravitons will hardly interact, and visible light (infrared light) and gravity will not interact. For electromagnetic waves of the same frequency, “interference” and “co-frequency interference” phenomena will occur when they meet, affecting each other’s propagation direction. Under normal circumstances, this effect is too small for us to observe. When a column of visible light (infrared light) passes by a massive luminous planet, the light emitted by the massive planet will Radio electromagnetic waves completely cover visible light (infrared light). At this time, visible light (infrared light) is continuously affected by the electromagnetic waves of the same frequency emitted by the massive planet, and will form an arc around the massive planet, just like gravity bending light. This is the reason why people form “gravity bending light” and “gravitational lens”. In the universe, when light passes by a massive luminous planet (galaxy), the bend formed is caused by the influence of electromagnetic waves continuously emitted by the massive luminous planet (galaxy). The degree of light bending is directly proportional to the brightness of the massive luminous planet and inversely proportional to the shortest distance between the light and the massive luminous planet. The mass-to-light ratio (excluding dark matter) of the massive luminous stars (galaxies) in the universe is much smaller than the mass-to-light ratio of the sun. Therefore, the degree of bending calculated based on gravitational bending of light is much smaller than the degree of bending calculated using same-frequency mutual interference. In order to make up for the gap between the gravitational bending of light and the actual degree of bending of light, the gravitational bending of light has to be supplemented by non-existent dark matter. HerS-3 Einstein cross derivation of dark matter is an example.
References
- Baidu Encyclopedia. Light Bending. [2025-12-20], ttps://baike.baidu.com/item/%E5%85%89%E7%BA%BF%E5%BC%AF%E6%9B%B2/10255788. 20 12.
- Chen Junli. Explanation of same-frequency mutual interference of light bending - there is no dark matter derived from “gravitational lensing” in colliding galaxy clusters [J]. Astronomy and Astrophysics, 2024, 12(3): 44-55. [CrossRef]
- Cox P , Butler K M , Keeton C R ,et al.HerS-3: An Exceptional Einstein Cross Reveals a Massive Dark Matter Halo[J].IOP Publishing Ltd, 2025. [CrossRef]
Figure 1.
HerS-3 Einstein cross observation diagram.
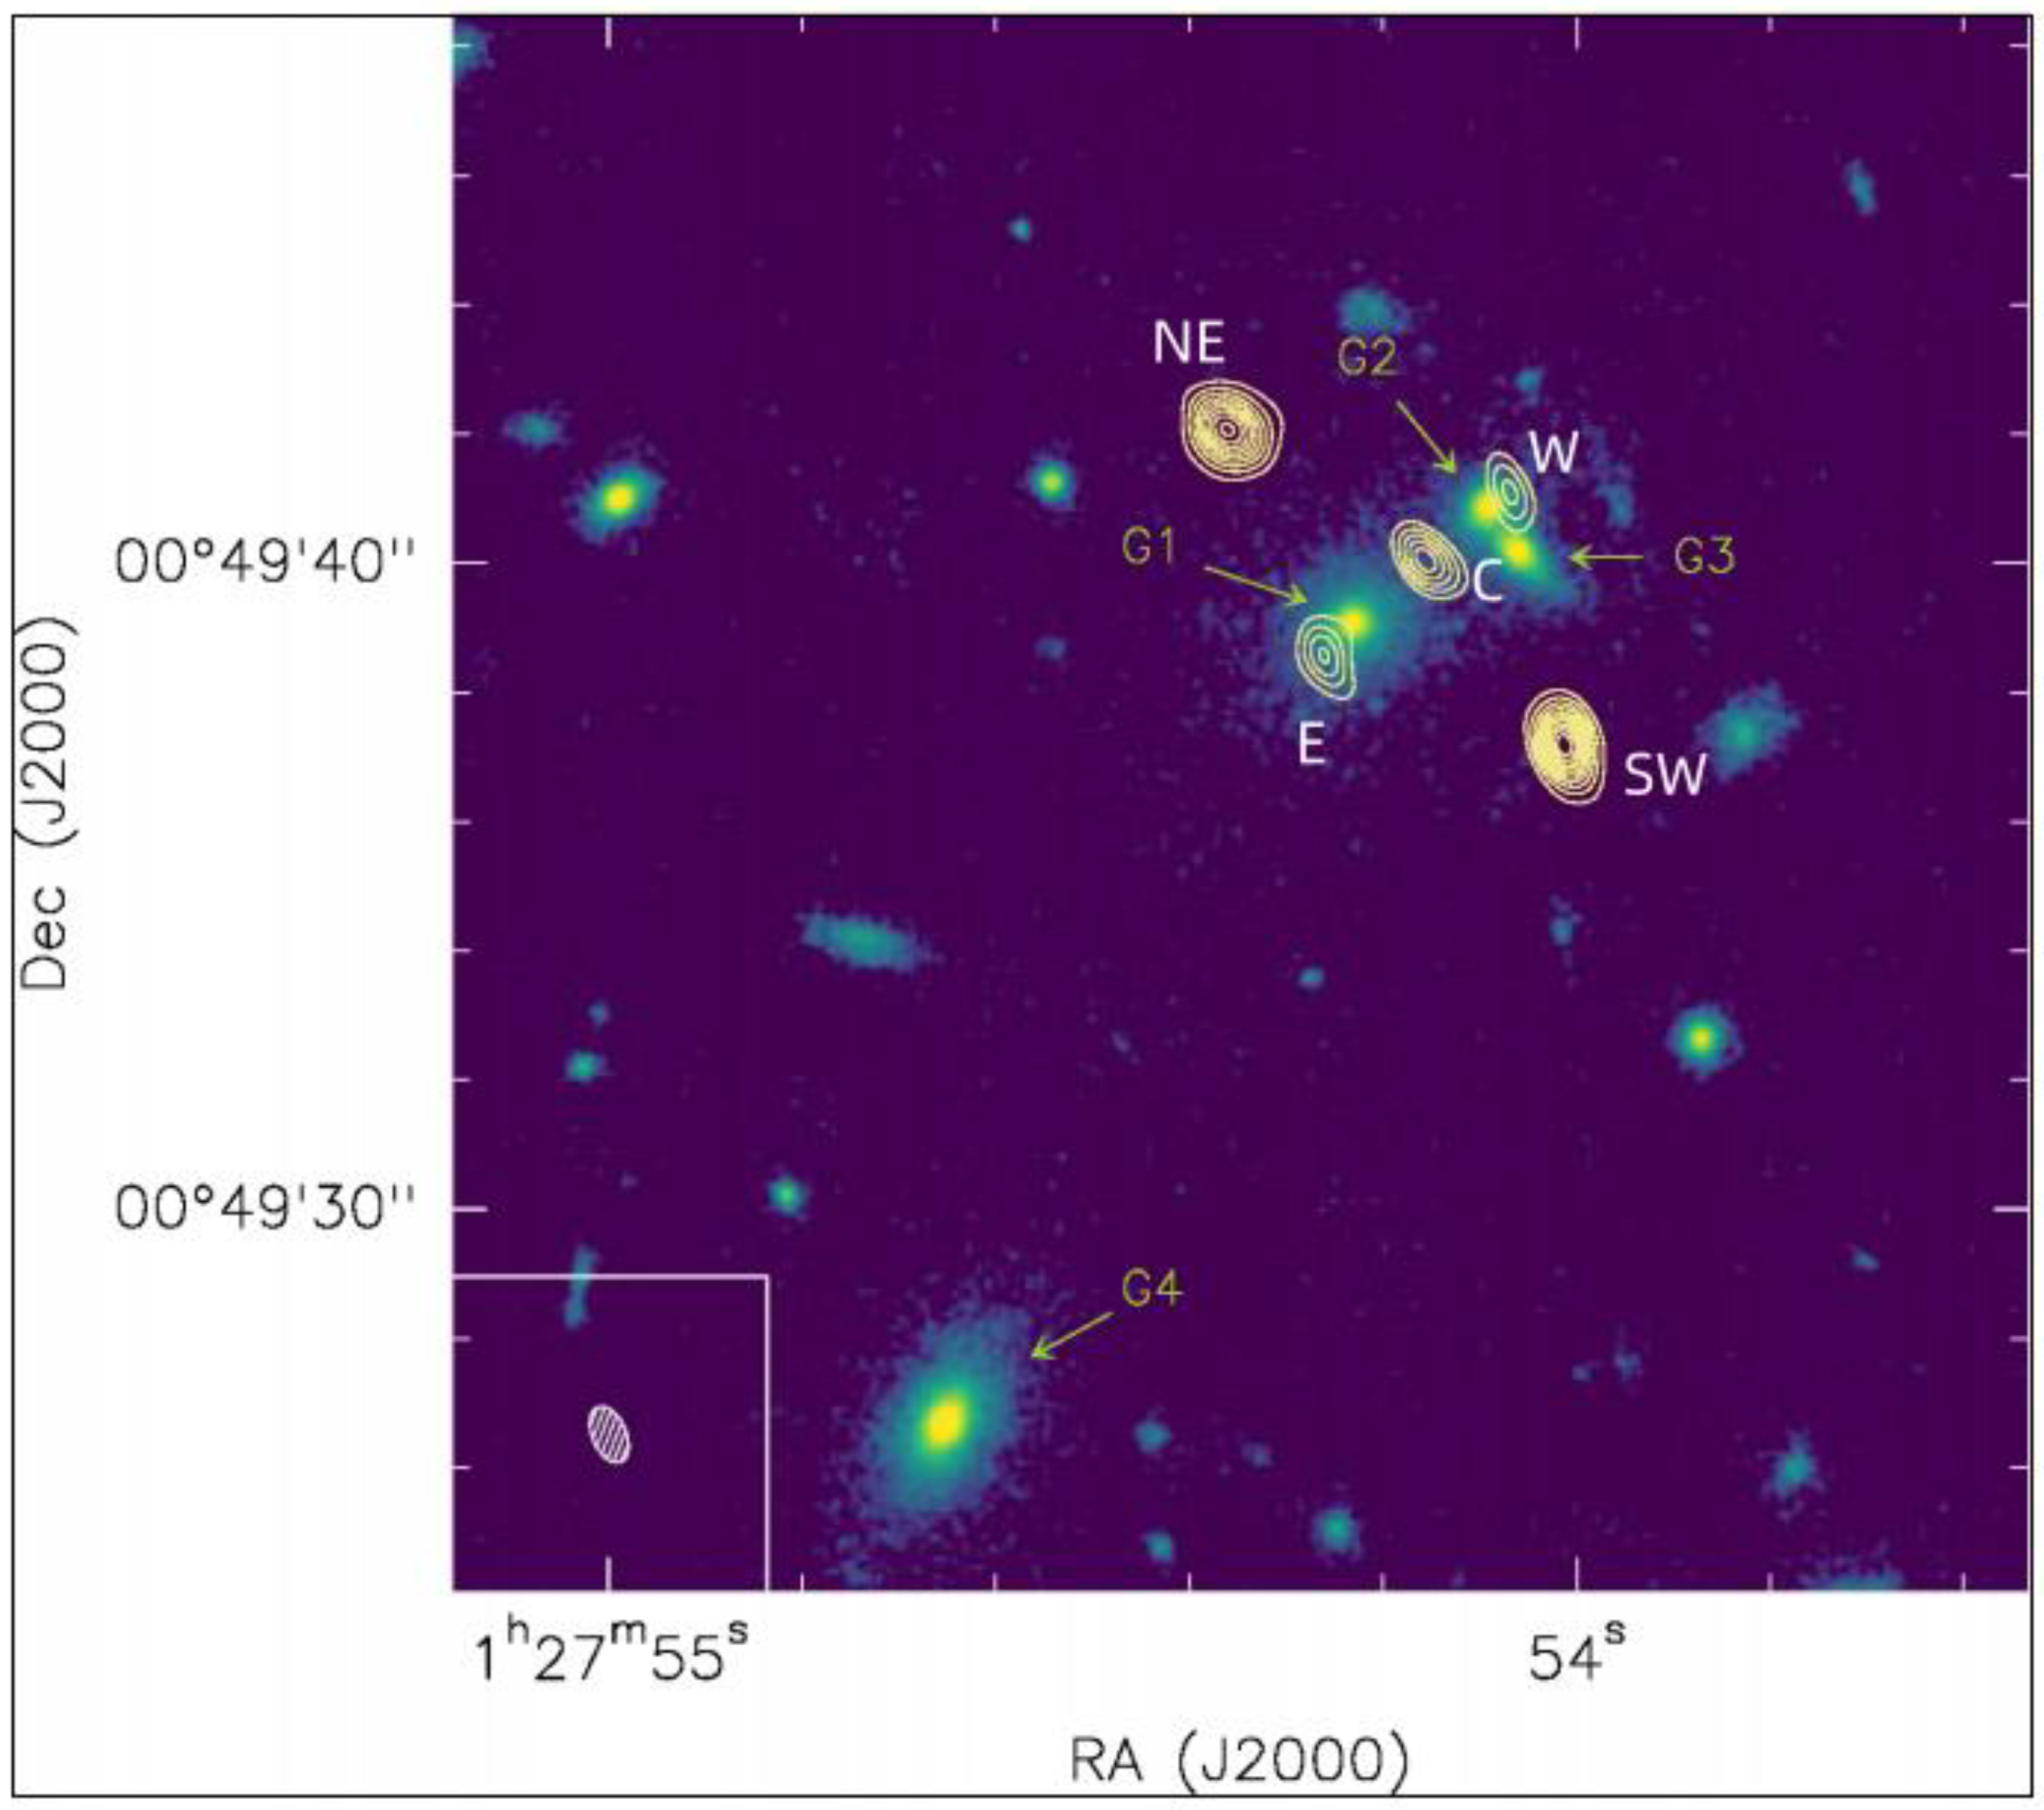
Figure 2.
Celestial lenses formed by multiple galaxies.
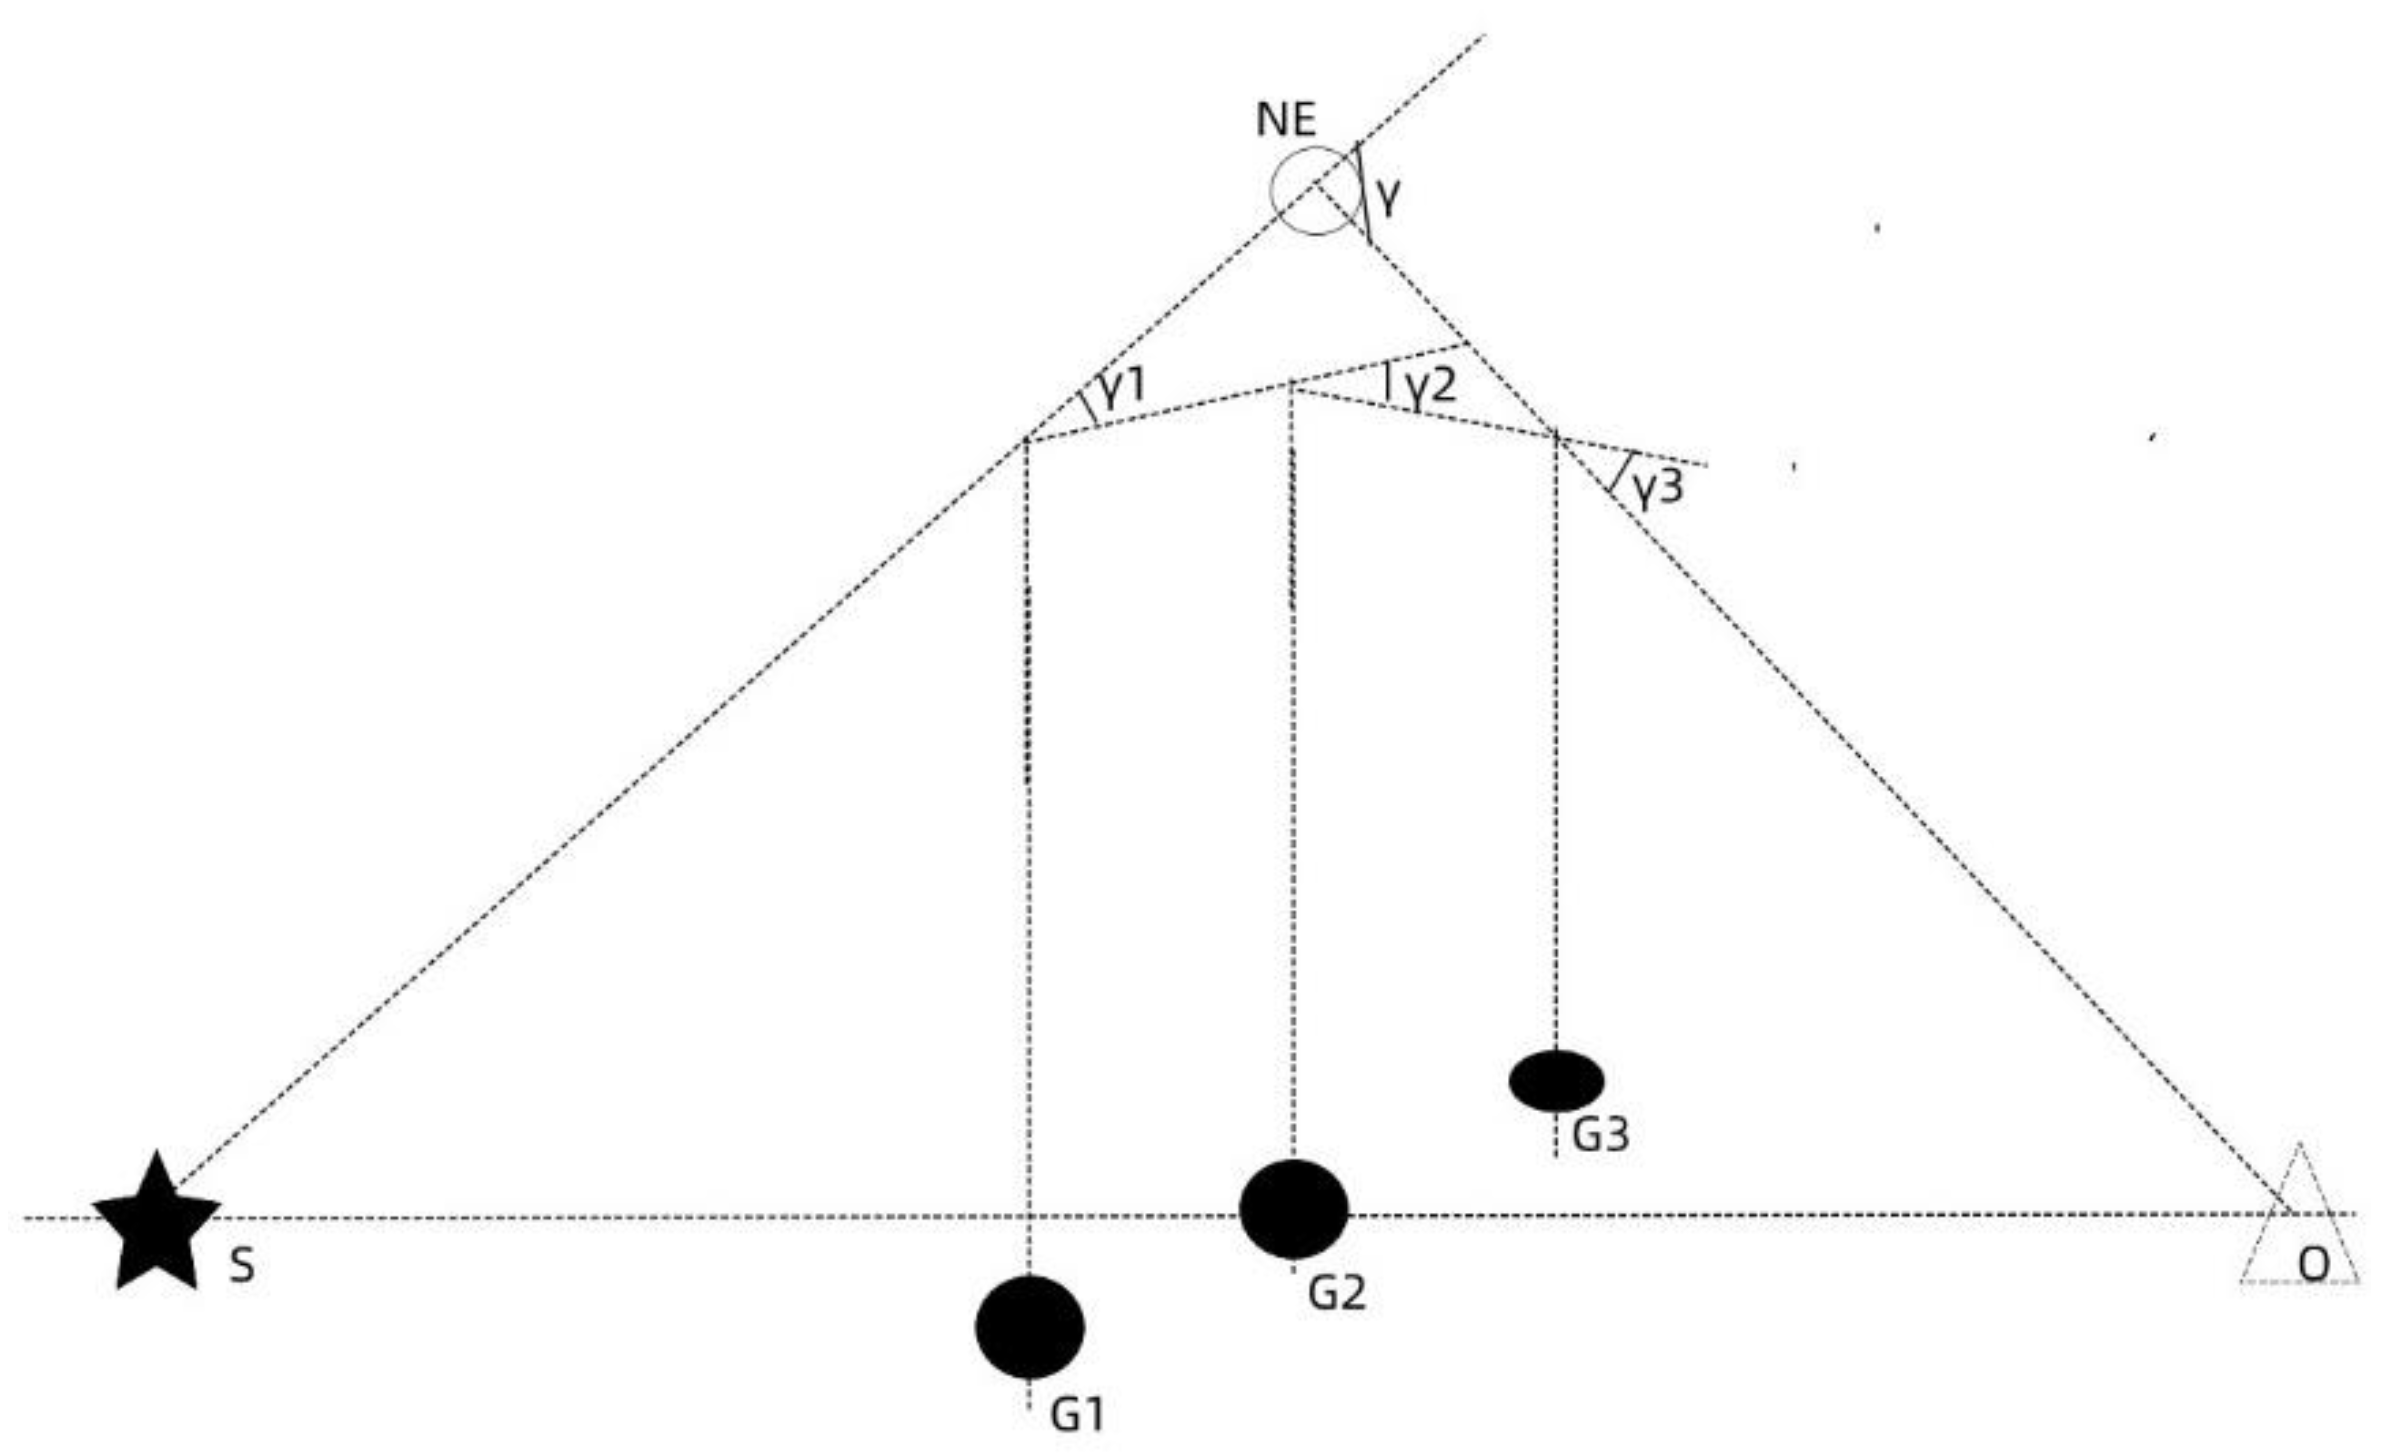
Figure 3.
Schematic diagram of lens formation.
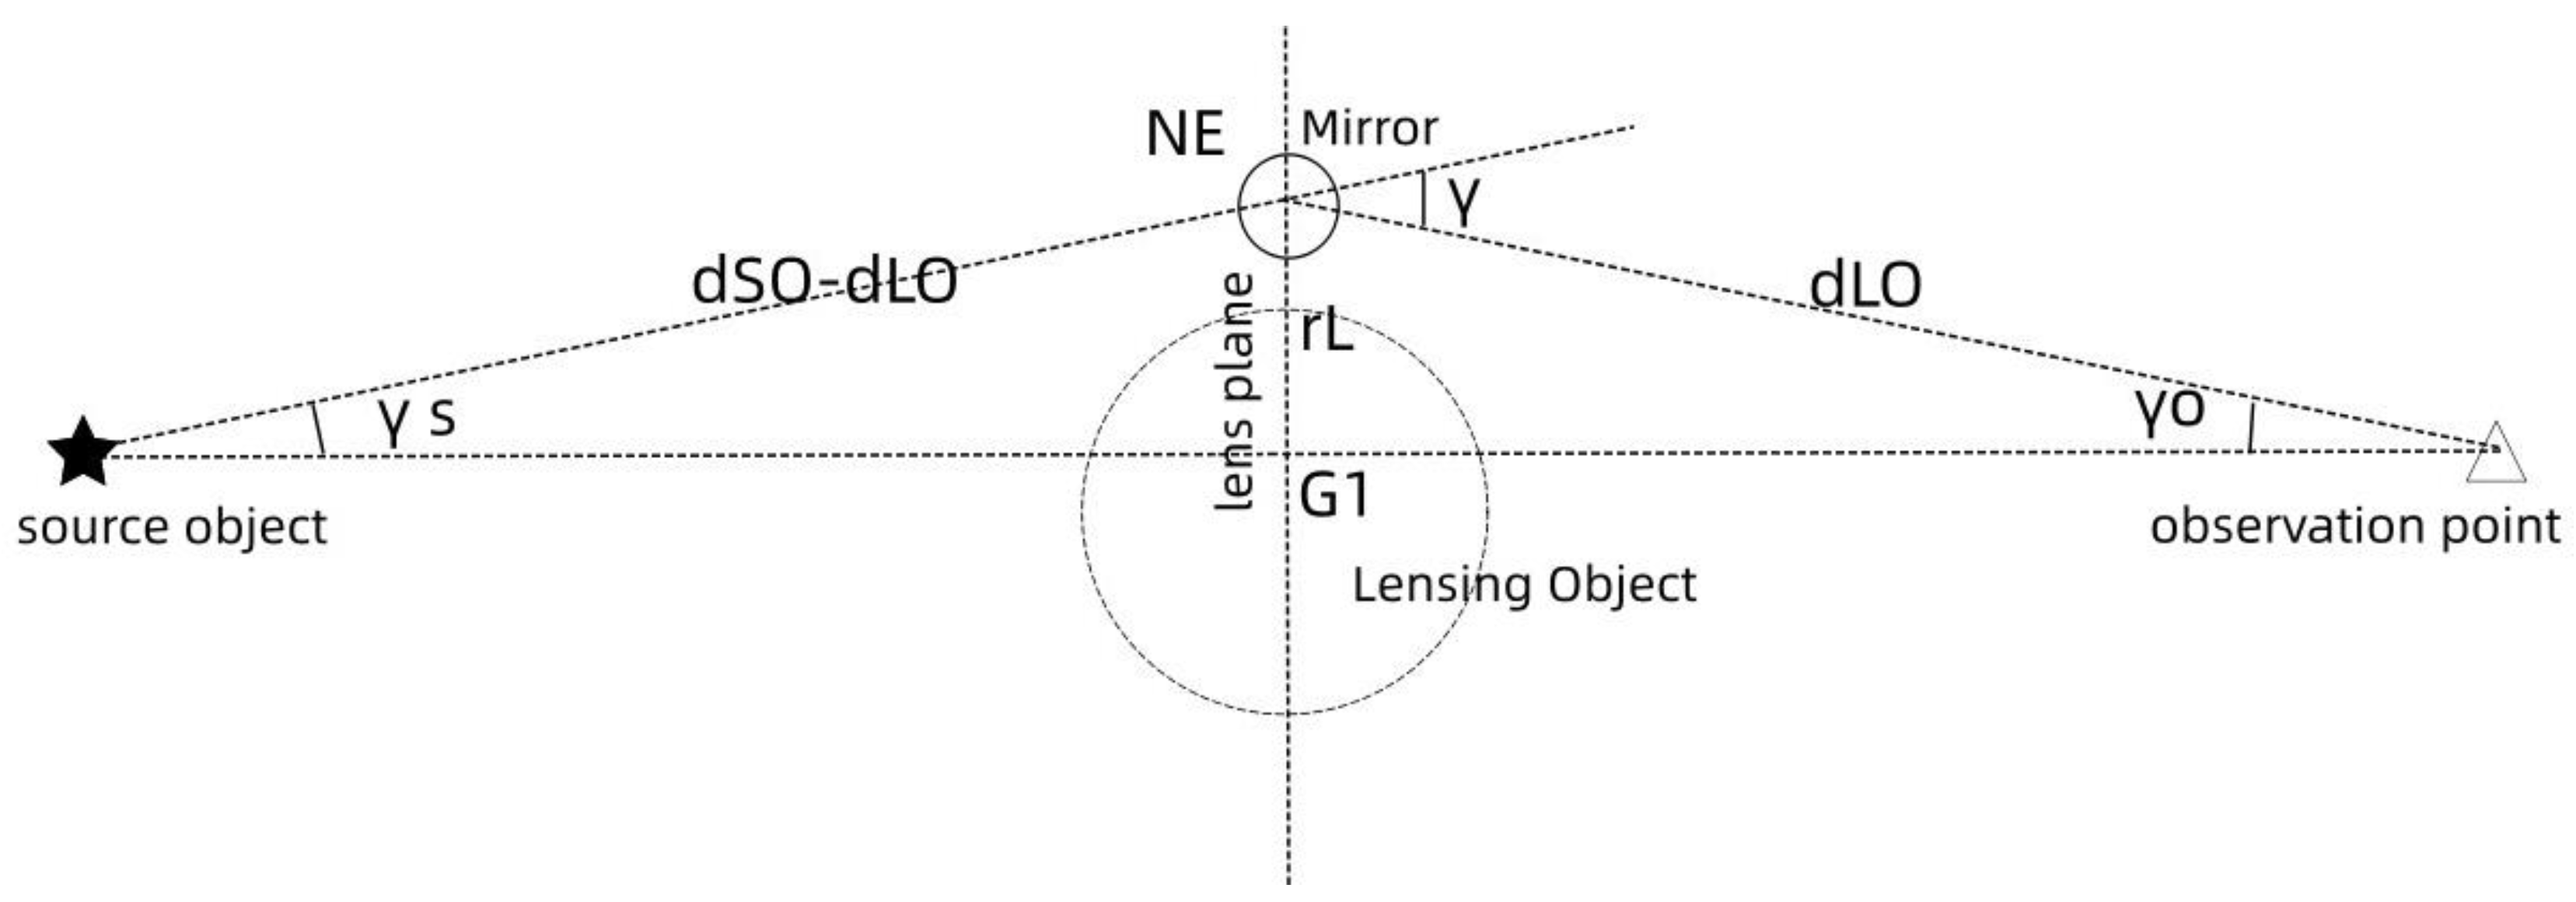
Figure 4.
Schematic diagram of mirror formation.
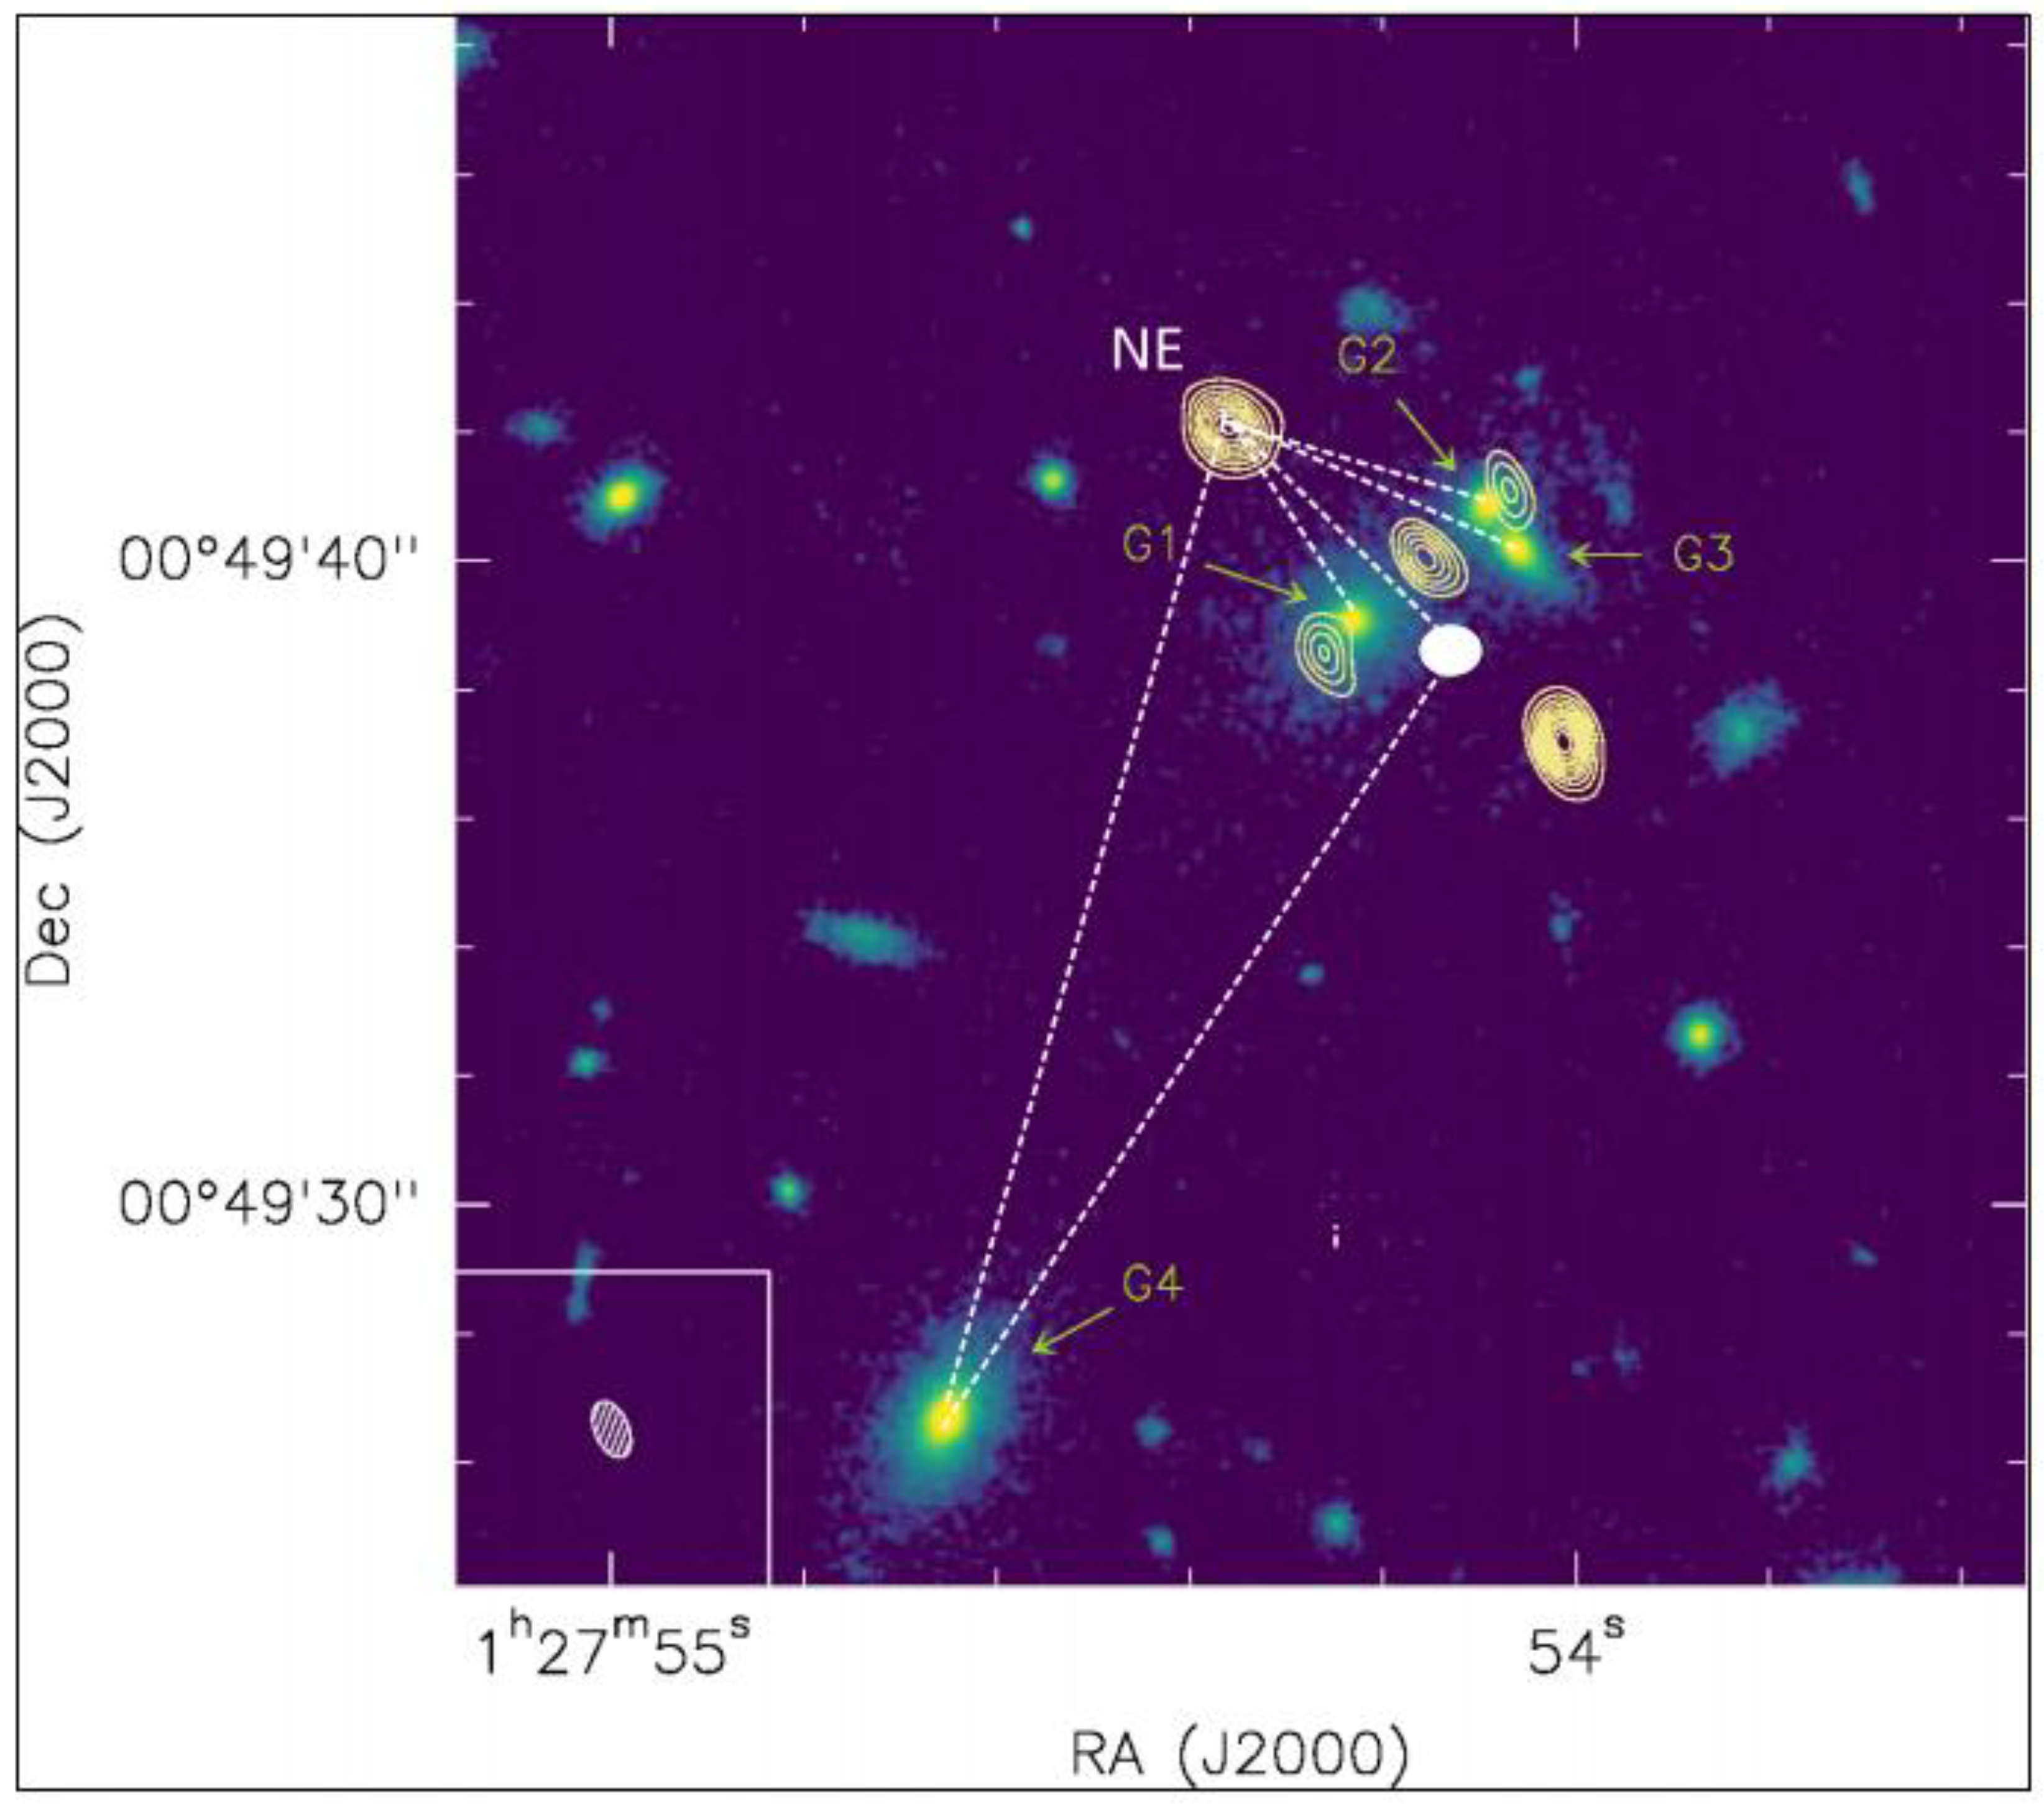
Table 1.
Coordinates and flux density of HerS-3 Einstein cross.
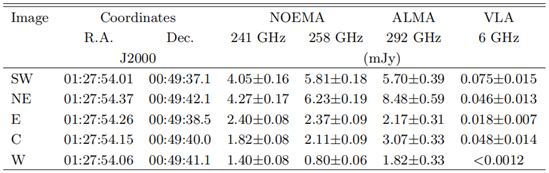
Table 2.
Photometric characteristics of lensed galaxies G1, G2, G3 and G4.
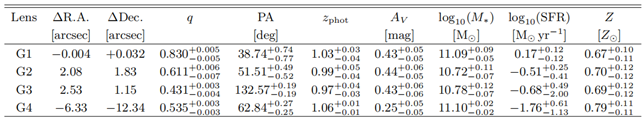
ΔRA and ΔDec. in the table are the relative positions of G1, G2, G3 and G4 relative to G1: RAG1 = 01h27m54.23s, Dec.G1 = 00°49′ 39″09. zphot is the photometric redshift, AV is the dust extinction, M∗ is the stellar mass, log10(M∗) represents the base 10 logarithm of the galaxy stellar mass (M∗). In astronomy, the stellar mass is usually expressed in solar mass (M⊙), so log10(M∗) In fact, the stellar mass of the galaxy is compared with the solar mass and then the logarithm is taken. SFR is the star formation rate. The star formation rate (SFR) is closely related to log10(M*). Z is the metallicity.
Table 3.
Flux density of G1, G2, G3 and G4 lens galaxies.
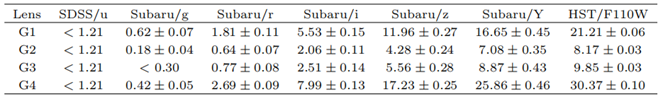
Table 5.
Comparison of lens galaxy species positions and redshifts.
| Lens | ∆R.A.(″) | ∆R.A.(m) | ∆Dec.(″) | ∆Dec.(m) | zphot | d(m) |
| G1 | -0.004 | -2.662E+18 | 0.032 | 2.129E+19 | 0.03 | 4.117E+24 |
| G2 | 2.080 | 1.384E+21 | 1.830 | 1.218E+21 | -0.01 | -1.372E+24 |
| G3 | 2.530 | 1.683E+21 | 1.150 | 7.652E+20 | -0.03 | -4.117E+24 |
| G4 | -6.330 | -4.212E+21 | -12.340 | -8.211E+21 | 0.06 | 8.235E+24 |
| 合计 | 7.282E+21 | 1.022E+22 | 1.784E+25 | |||
| 比例 | 2450 | 1747 |
Table 6.
Measured radiation amplitudes of lens galaxies in different wavebands.
| Lens | SDSS /u |
Subaru /g |
G (%) |
Subaru /r |
R (%) |
Subaru /i |
I (%) |
Subaru /z |
Z (%) |
Subaru /Y |
Y (%) |
HST /F110W |
W (%) |
| G1 | <1.21 | 0.62 | 0.41 | 1.81 | 0.31 | 5.53 | 0.31 | 11.96 | 0.31 | 16.65 | 0.28 | 21.21 | 0.30 |
| G2 | <1.21 | 0.18 | 0.12 | 0.64 | 0.11 | 2.06 | 0.11 | 4.28 | 0.11 | 7.08 | 0.12 | 8.17 | 0.12 |
| G3 | <1.21 | 0.29 | 0.19 | 0.77 | 0.13 | 2.51 | 0.14 | 5.56 | 0.14 | 8.87 | 0.15 | 9.85 | 0.14 |
| G4 | <1.21 | 0.42 | 0.28 | 2.69 | 0.46 | 7.99 | 0.44 | 17.23 | 0.44 | 25.86 | 0.44 | 30.37 | 0.44 |
| total | 1.51 | 1.00 | 5.91 | 1.00 | 18.09 | 1.00 | 39.03 | 1.00 | 58.46 | 1.00 | 69.60 | 1.00 |
Table 7.
The total amplitude of respective radiation of G1-G4 lens galaxies.
| Lens | Subaru/r | Subaru/i | Subaru/z | Subaru/Y | HST/F110W | LO (L/λtotal) |
| λo | 620 | 770 | 870 | 970 | 1100 | |
| G1 | 1.81 | 5.53 | 11.96 | 16.65 | 21.21 | 0.06030 |
| G2 | 0.64 | 2.06 | 4.28 | 7.08 | 8.17 | 0.02335 |
| G3 | 0.77 | 2.51 | 5.56 | 8.87 | 9.85 | 0.02899 |
| G4 | 2.69 | 7.99 | 17.23 | 25.86 | 30.37 | 0.08879 |
Table 8.
Center coordinate simulation adjustment table.
| OR | SWR | SWD | GR | GD | cosα | r | L | γ | γ2total | γ21total | r1(″) | Δγ |
| -9.11281 | -22.000 | -1.990 | -0.004 | 0.032 | 0.764 | 22.089 | 0.06030 | 2.086E-03 | ||||
| 0D | -22.000 | -1.990 | 2.080 | 1.830 | 0.720 | 24.381 | 0.02335 | 6.900E-04 | ||||
| -10.97937 | -22.000 | -1.990 | 2.530 | 1.150 | 0.741 | 24.730 | 0.02899 | 8.686E-04 | ||||
| -22.000 | -1.990 | -6.330 | -12.340 | 1.000 | 18.780 | 0.08879 | 4.726E-03 | 8.371E-03 | 17.034 | 15.713 | 1.321753 | |
| 14.000 | 3.010 | -0.004 | 0.032 | 0.944 | 14.317 | 0.06030 | 3.978E-03 | |||||
| 14.000 | 3.010 | 2.080 | 1.830 | 0.902 | 11.978 | 0.02335 | 1.759E-03 | |||||
| 14.000 | 3.010 | 2.530 | 1.150 | 0.927 | 11.620 | 0.02899 | 2.314E-03 | |||||
| 14.000 | 3.010 | -6.330 | -12.340 | 0.995 | 25.474 | 0.08879 | 3.467E-03 | 1.152E-02 | 23.437 | 27.017 | -3.580169 | |
| 3.000 | -0.590 | -0.004 | 0.032 | 0.611 | 3.068 | 0.06030 | 1.201E-02 | |||||
| 3.000 | -0.590 | 2.080 | 1.830 | -0.339 | 2.589 | 0.02335 | -3.056E-03 | |||||
| 3.000 | -0.590 | 2.530 | 1.150 | -0.431 | 1.802 | 0.02899 | -6.926E-03 | |||||
| 3.000 | -0.590 | -6.330 | -12.340 | 0.982 | 15.004 | 0.08879 | 5.810E-03 | 7.843E-03 | 15.958 | 15.958 | 0.000002 | |
| -8.000 | 0.910 | -0.004 | 0.032 | 0.016 | 8.044 | 0.06030 | 1.202E-04 | |||||
| -8.000 | 0.910 | 2.080 | 1.830 | -0.183 | 10.122 | 0.02335 | -4.229E-04 | |||||
| -8.000 | 0.910 | 2.530 | 1.150 | -0.116 | 10.533 | 0.02899 | -3.189E-04 | |||||
| -8.000 | 0.910 | -6.330 | -12.340 | 0.976 | 13.355 | 0.08879 | 6.490E-03 | 5.869E-03 | 11.941 | 11.941 | 0.000000 | |
| -17.000 | 2.010 | -0.004 | 0.032 | 0.614 | 17.111 | 0.06030 | 2.165E-03 | |||||
| -17.000 | 2.010 | 2.080 | 1.830 | 0.527 | 19.081 | 0.02335 | 6.451E-04 | |||||
| -17.000 | 2.010 | 2.530 | 1.150 | 0.556 | 19.549 | 0.02899 | 8.247E-04 | |||||
| -17.000 | 2.010 | -6.330 | -12.340 | 0.996 | 17.882 | 0.08879 | 4.943E-03 | 8.578E-03 | 17.455 | 15.196 | 2.258414 | |
| total | 4.218E-02 | 85.825 | 85.82523706 | 7.160339 | ||||||||
| G | 2034.813172 |
Table 9.
Brightness and mass of lensed galaxies.
| lens name |
L(µJy) /λ(nm) |
brightness (J/s) |
brightness (L☉) |
log10(M∗) (M☉) |
mass (M☉) |
M/L |
| G1 | 0.06030 | 3.695E+40 | 9.655E+13 | 11.09 | 1.230E+11 | 1.274E-03 |
| G2 | 0.02335 | 1.431E+40 | 3.740E+13 | 10.72 | 5.248E+10 | 1.403E-03 |
| G3 | 0.02899 | 1.777E+40 | 4.643E+13 | 10.78 | 6.026E+10 | 1.298E-03 |
| G4 | 0.08879 | 5.441E+40 | 1.422E+14 | 11.10 | 1.259E+11 | 8.854E-04 |
Disclaimer/Publisher’s Note: The statements, opinions and data contained in all publications are solely those of the individual author(s) and contributor(s) and not of MDPI and/or the editor(s). MDPI and/or the editor(s) disclaim responsibility for any injury to people or property resulting from any ideas, methods, instructions or products referred to in the content. |
© 2025 by the authors. Licensee MDPI, Basel, Switzerland. This article is an open access article distributed under the terms and conditions of the Creative Commons Attribution (CC BY) license (http://creativecommons.org/licenses/by/4.0/).
Copyright: This open access article is published under a Creative Commons CC BY 4.0 license, which permit the free download, distribution, and reuse, provided that the author and preprint are cited in any reuse.


