Submitted:
25 December 2025
Posted:
26 December 2025
You are already at the latest version
Abstract
As new energy technology systems grow increasingly complex, corporate innovation activities in photovoltaics, energy storage, wind power, and energy management exhibit distinct distributed characteristics. Cross-enterprise collaboration and cross-regional innovation have become pivotal drivers for industrial upgrading. However, the lengthy new energy industrial chain, numerous participants, and high technical coupling lead to significant knowledge stickiness in knowledge transfer processes, thereby impairing collaborative innovation efficiency.To address this issue, this paper constructs a probabilistic resource allocation optimization model for distributed innovation networks in new energy enterprises. First, Least Squares Support Vector Machine (LSSVM) is employed to predict the success rate of collaborative innovation tasks. Model parameters are jointly optimized using grid search and Particle Swarm Optimization (PSO) under RBF, Polynomial, and Sigmoid kernel functions to adapt to different types of technological coupling and knowledge stickiness structures.Subsequently, a Gaussian Copula is introduced to characterize the risk dependency structure among technological maturity, external market volatility, and R&D collaboration complexity between innovation nodes. This enables the calculation of conditional value at risk (CoVaR) to quantify collaborative innovation risks under high uncertainty in new energy technologies. During resource allocation, a cost-loss model based on Bayesian decision theory is established, and the simulated annealing algorithm is employed to solve for the optimal combination of R&D and collaborative resources.Simulation results demonstrate that under conditions of rapid new energy technology iteration and significant knowledge stickiness, this method reduces resource waste by 17%–23% compared to traditional empirical allocation approaches while enhancing cross-enterprise innovation collaboration efficiency. This study provides a quantifiable and interpretable decision-making method for distributed innovation management in the new energy industry, holding significant implications for building an efficient industrial collaborative innovation ecosystem.
Keywords:
distributed innovation
; new energy enterprises
; knowledge stickiness
; technology collaboration
; LSSVM
; copula
; CoVaR
; resource allocation optimization
1. Introduction
As new energy technology systems—including photovoltaics, wind power, and energy storage—continue to evolve, inter-enterprise technological collaboration increasingly exhibits distributed and heterogeneous characteristics. The industry innovation model has shifted from single-entity dominance to multi-node linkage mechanisms. However, against a backdrop of deepening technological coupling and heightened uncertainty, issues such as knowledge stickiness, risk transmission, and resource misallocation have become increasingly prominent during collaboration. These challenges constrain innovation efficiency gains and the steady-state evolution of the industrial collaborative ecosystem.Addressing the urgent need to overcome structural barriers in collaborative innovation within the new energy sector, it is imperative to establish a resource allocation mechanism with dynamic responsiveness. This mechanism should enable precise identification of high-risk collaborative tasks and rational regulation of resource deployment, thereby driving the high-quality development of distributed innovation systems among enterprises.
2. Research Methods and Modeling Framework
2.1. Construction of the New Energy Distributed Innovation Network
Within the research methodology and modeling framework, constructing the distributed innovation network for new energy serves as the structural foundation for subsequent collaborative task prediction and risk dependency modeling. This requires formalizing nodes and collaborative relationships at the enterprise level. The set of enterprises participating in collaborative activities across photovoltaic, wind power, energy storage, and energy management sectors is denoted as . Collaborative relationships are mapped as an undirected edge set E through three event categories: joint patents, cooperative R&D, and technology licensing. These are encoded via a weighted adjacency matrix , where edge weights are derived from the superposition of multi-source collaboration strengths:
where , , and represent the collaboration frequencies between enterprises i and j in joint patents, collaborative R&D, and technology licensing, respectively. α1, α2, and α3 denote weight coefficients reflecting the relative importance of different collaboration types. Based on this, a time-varying network sequence is constructed, mapping annual collaboration information into multi-period snapshots. This provides a temporal carrier for subsequent calculations of metrics such as knowledge stickiness indices and technology maturity [1].To visually depict the distribution of core enterprises, cross-domain coupling relationships, and collaboration intensity within the network, Figure 1 employs node size to encode enterprise collaboration levels, color to distinguish technological subfields, and edge thickness to represent collaboration strength. This forms a visual topology structure that corresponds one-to-one with matrix W. This structure serves as the foundational input feature for LSSVM collaboration task success rate prediction while also providing node-to-node relationship constraints for Gaussian Copula risk dependency modeling.
2.2. Collaborative Innovation Task Success Rate Prediction Model (LSSVM)
After establishing the distributed innovation network structure and obtaining the collaboration intensity matrix between enterprises, it is necessary to quantitatively predict the success rate of collaborative innovation tasks for different enterprise combinations under complex technological scenarios. This provides foundational probability inputs for subsequent risk dependency structure modeling [2].To capture the nonlinear influence of multidimensional structural factors—such as knowledge stickiness, technological distance, collaborative strength, and firm absorptive capacity—on task success rates, a prediction model based on Least Squares Support Vector Machines (LSSVM) is constructed. Key features extracted from the network are represented as input vectors xi, while historical collaborative task success rates are denoted as yi. A nonlinear regression function is constructed using kernel mapping. The model’s optimization objective is defined as
where w is the feature space weight vector, ϕ is the kernel mapping function, b is the bias term, γ controls the balance between empirical and structural risk, and ei is the error term. Considering the technological heterogeneity of new energy collaboration, three candidate kernel structures are designed: RBF, Polynomial, and Sigmoid kernels. Parameter optimization for different kernels employs a combined framework of grid search and particle swarm optimization (PSO) to ensure higher model adaptability when facing various types of technological coupling relationships [3]. Table 1 presents the key parameters and search ranges required for the three kernel types. This design provides a stable prior probability foundation for constructing conditional risk distributions in subsequent Copula models.
2.3. Risk Dependency Structure Modeling (Gaussian Copula)
After obtaining prior estimates of collaborative innovation success rates, a Gaussian Copula is introduced to construct a joint risk dependency structure among technology maturity, external market volatility, and R&D collaboration complexity, thereby capturing the interactive effects of multi-source uncertainties in new energy technology collaboration scenarios [4].Let the marginal distributions of the three risk factors be , , and , respectively. Through probability integral transformation, we obtain uniform random variables , , and obeying the interval [0, 1]. We then use the Gaussian Copula to embed them into the same correlation structure, with the joint distribution expressed as
where denotes the inverse function of the standard normal distribution, and represents the three-dimensional normal distribution function with correlation matrix Σ. The off-diagonal elements of Σ reflect the linear correlation and tail-end linkage strength among different risk factors. To improve modeling accuracy, this paper uses maximum likelihood estimation method to fit and modify edge distribution parameters and related structural parameters based on historical collaborative task data [5]. As shown in Figure 2, the entire Copula risk modeling module consists of an input factor layer, an edge distribution transformation layer, a Copula joint modeling core layer, and an output distribution structure layer. In this structure, the maturity of technology, market volatility, and collaborative complexity are first standardized through edge fitting and integral transformation inputs, and a joint risk distribution is constructed through Gaussian Copula. This result will serve as the input basis for the conditional risk measurement module (CoVaR calculation) and form a collaborative risk modeling loop with the LSSVM prediction module.
2.4. Collaborative Technical Risk Measurement (CoVaR)
After obtaining the joint distribution of technical maturity, market volatility, and synergistic complexity based on Gaussian Copula, it is necessary to further transform this joint uncertainty into an actionable synergistic technical risk indicator to provide constraints for subsequent resource allocation models [6].This study adopts Conditional Value at Risk (CoVaR) as the systematic co-technical risk measurement tool. The loss variable for each new energy technology co-unit is represented as . Key triggering factors (e.g., severe market volatility or high-complexity co-operation modes) are denoted as . At a given confidence level α, the risk value of triggering factors is first calculated as . Subsequently, the co-technical CoVaR is defined within the joint distribution described by Copula as
where β is the conditional confidence level, controlling the acceptable loss range for the collaborative technology when the trigger factor reaches extreme states. Leveraging the Copula correlation matrix constructed earlier and the task success rate distribution predicted by LSSVM, Monte Carlo sampling generates numerous scenarios within the joint risk space. This enables numerical solutions for across different technical subdomains and collaboration modes, aggregating them into the systemic risk exposure at the collaborative task level [7]. Figure 3 organizes key risk factors, technical collaboration nodes, and their conditional excess loss probabilities into a three-tier structure:The top layer represents triggering factors ( ), the middle layer comprises collaborative units across different technical directions ( ), and the bottom layer consists of risk exposure metrics derived from CoVaR. Directed edges annotate conditional probabilities and threshold levels, visually illustrating the propagation paths of extreme shocks through the collaborative network along technical dimensions. This provides structured input for setting risk constraints and penalty weights in cost–loss-based probabilistic resource allocation optimization models [8].
2.5. Probabilistic Resource Allocation Optimization Model
Building upon the aforementioned collaborative innovation task success rate prediction and collaborative technology risk measurement, a probabilistic resource allocation optimization model is designed. This formalizes the allocation problem of finite R&D and collaborative resources across multiple technological subfields and enterprise nodes as a Bayesian decision process aimed at minimizing risk-adjusted expected loss [9].First, a prior distribution is constructed based on the success probability distribution of collaborative tasks output by LSSVM. Combining the joint risk structure and conditional risk exposure provided by Gaussian Copula and CoVaR, the success rate and loss distribution under different technology combination scenarios undergo posterior updates. This yields the conditional expected loss for each collaborative task at resource input level xi. Based on this, the overall optimization objective function is formulated:
where x = (x₁,…,x_n) represents the resource allocation decision variables for each collaborative task or technology direction, denotes the posterior occurrence probability updated based on observational data, is the unit resource cost, λ is the decision-maker’s risk aversion coefficient, and total budget and resource capacity constraints are imposed to define the feasible domain.Given the objective function’s pronounced non-convexity in high-dimensional space, a simulated annealing algorithm is employed to control the temperature and design perturbation acceptance for x’s search trajectory. By adopting a “probabilistic acceptance of suboptimal solutions” approach, it avoids getting stuck in local optima, achieving a dynamic trade-off between enhancing success rates and reducing risk exposure in resource combinations [10].
3. Simulation Design and Results Analysis
3.1. Experimental Setup and Parameter Configuration
To validate the adaptability and stability of the probabilistic resource allocation optimization model in multi-technology collaboration scenarios, this study designed a simulation testing platform covering three technology domains: wind power, photovoltaics, and energy storage. A multi-stage collaborative task set was constructed as the experimental subject. The experiments drew upon 118 valid collaborative task samples extracted from domestic renewable energy enterprises’ joint patents and cooperative R&D projects between 2017 and 2024. An initial adjacency matrix was constructed based on enterprise collaboration frequency and technological heterogeneity to input the network module. The LSSVM module employed a 7:3 training-to-validation split ratio, with a fixed RBF kernel structure. The particle swarm optimization algorithm ran for 300 iterations with a population size of 30, using an initial inertia factor of 0.8 that decreased progressively across generations. In risk dependency modeling, three types of marginal distributions were fitted using a mixture of extreme value and normal distributions. The correlation matrix generated 1,000 joint samples via Monte Carlo sampling for CoVaR estimation. For resource allocation optimization, the total budget is set to 1, decision variables x ∈ [0,1]^n, with an initial temperature T₀ = 100 and cooling rate α = 0.92. A dynamic adjustment mechanism for the acceptance probability of perturbations per iteration is implemented. Key parameters for each module are shown in Table 1, providing a unified configuration basis for subsequent multi-strategy comparative analysis.
3.2. Results Analysis and Discussion
Based on the aforementioned simulation environment and parameter settings, this study compares the proposed probabilistic optimization model with traditional empirical allocation strategies from the perspective of resource allocation structure evolution. It analyzes performance differences in collaborative task success rates and risk exposure levels. Three typical technology combinations—photovoltaic (PV), wind power, and energy storage—were selected. Under fixed total resource constraints, five rounds of resource allocation simulations were conducted using both the empirical method (allocation based on collaboration frequency ratios) and the optimized model (incorporating LSSVM + CoVaR structure).As shown in Figure 4, the three-dimensional resource allocation evolution diagram depicts task indices and technology directions along the X and Y axes, respectively, with the Z axis representing corresponding resource allocation ratios. Color gradients indicate task success rates under each configuration. The figure reveals that the resource distribution generated by the optimization model concentrates more heavily in high CoVaR exposure regions, significantly mitigating the resource wastage observed in low-success-rate tasks under the empirical method.Particularly in the wind-storage coupling task, resource reallocation concentrated the success rate improvement range between 0.12 and 0.18, whereas the empirical configuration spread widely across 0.06 to 0.11—a 54% difference. This contrast not only validates the model’s ability to identify and respond to high-risk tasks but also provides data support for subsequent strategy adjustment mechanisms under multi-period dynamic resource deployment.
4. Conclusions
In multi-source heterogeneous technical collaboration environments, the integrated prediction and measurement framework combining LSSVM and Copula structures effectively captures knowledge stickiness and risk dependency characteristics in distributed renewable energy innovation. This establishes a probabilistic resource allocation optimization model with decision interpretability. By employing risk-adjusted expected loss minimization within a Bayesian framework, it expands quantitative pathways for collaborative task resource deployment.Although simulation experiments validate the model’s effectiveness, its robustness in handling extreme mutation scenarios remains limited by constraints in collaborative data acquisition dimensions and task diversity characterization methods. Future work may integrate graph neural networks with dynamic game mechanisms to further optimize collaborative network evolution modeling and resource reallocation strategies, thereby enhancing dynamic prediction and strategic response capabilities for technological collaboration within complex industrial ecosystems.
Acknowledgments
The authors gratefully acknowledge the support from the National Natural Science Foundation of China (Grant No. 71072075).
References
- Zheng, X.; Dwyer, V. M.; Barrett, L. A.; Derakhshani, M.; Hu, S. Adaptive notch-filtration to effectively recover photoplethysmographic signals during physical activity. Biomedical Signal Processing and Control 2022, 72, 103303. [Google Scholar] [CrossRef]
- Dall-Orsoletta, A; Romero, F; Ferreira, P. Open and collaborative innovation for the energy transition: An exploratory study[J]. Technology in Society 2022, 69, 101955. [Google Scholar] [CrossRef]
- Inês, A; Diniz, A; Moreira, A C. Driving eco-innovation in supply chains through multi-stakeholder collaboration: A review and research agenda[J]. Journal of Open Innovation: Technology, Market, and Complexity 2025, 100472. [Google Scholar] [CrossRef]
- Zhao, R; Xu, J; Zhao, Y; et al. Resource allocation pattern to green technology innovation efficiency: Synergy between environmental resource orchestration and firms’ digital capabilities[J]. Journal of Innovation & Knowledge 2025, 10(4), 100760. [Google Scholar]
- Huan, J. Environmental cognitive distance, R&D capability distance, and supply chain green technology innovation[J]. Humanities and Social Sciences Communications 2025, 12(1), 1–10. [Google Scholar]
- Alkaraan, F; Elmarzouky, M; de Sousa Jabbour, A B L; et al. Maximizing sustainable performance: Integrating servitization innovation into green sustainable supply chain management under the influence of governance and Industry 4.0[J]. Journal of Business Research 2025, 186, 115029. [Google Scholar] [CrossRef]
- Li, Y; Han, M; Shahidehpour, M; et al. Data-driven distributionally robust scheduling of community integrated energy systems with uncertain renewable generations considering integrated demand response[J]. Applied Energy 2023, 335, 120749. [Google Scholar] [CrossRef]
- Li, Y; Feng, B; Wang, B; et al. Joint planning of distributed generations and energy storage in active distribution networks: A Bi-Level programming approach[J]. Energy 2022, 245, 123226. [Google Scholar] [CrossRef]
- Li, Y; Wang, C; Li, G; et al. Optimal scheduling of integrated demand response-enabled integrated energy systems with uncertain renewable generations: A Stackelberg game approach[J]. Energy Conversion and Management 2021, 235, 113996. [Google Scholar] [CrossRef]
- Lotfi, R; Kargar, B; Hoseini, S H; et al. Resilience and sustainable supply chain network design by considering renewable energy[J]. International Journal of Energy Research 2021, 45(12), 17749–17766. [Google Scholar] [CrossRef]
Figure 1.
Schematic Diagram of the Distributed Innovation Network Structure for New Energy Enterprises.
Figure 1.
Schematic Diagram of the Distributed Innovation Network Structure for New Energy Enterprises.
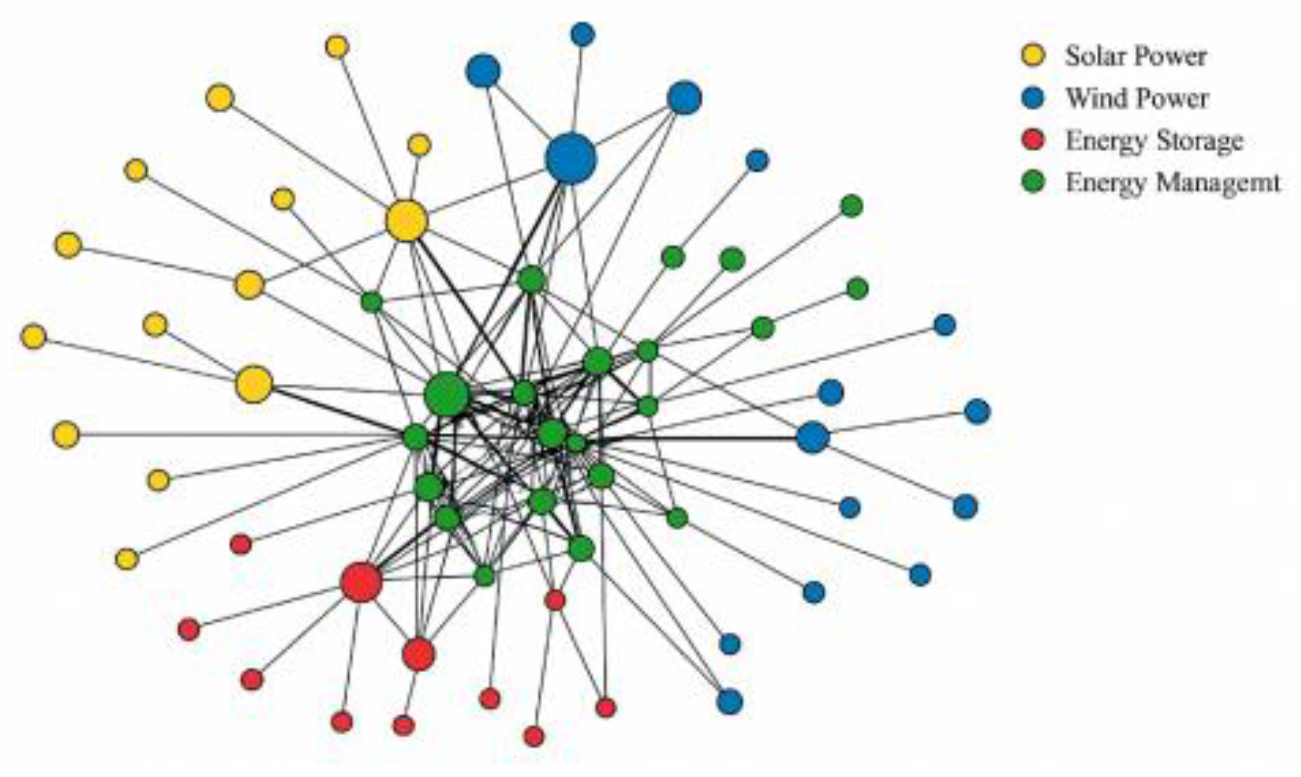
Figure 2.
Gaussian Copula Risk Modeling Structure Diagram.
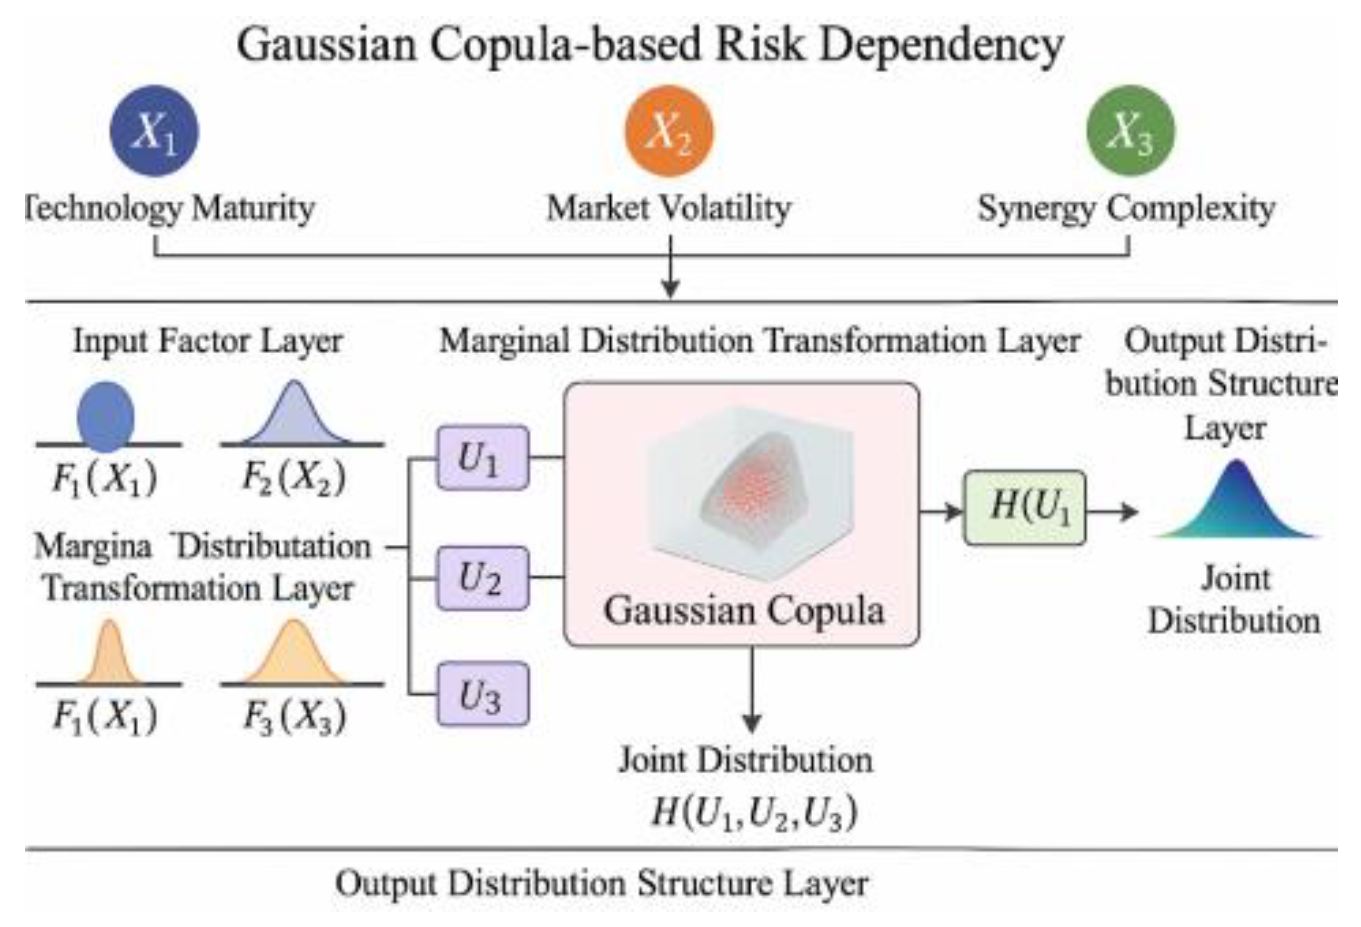
Figure 3.
CoVaR-Based Collaborative Technical Risk Propagation Map.
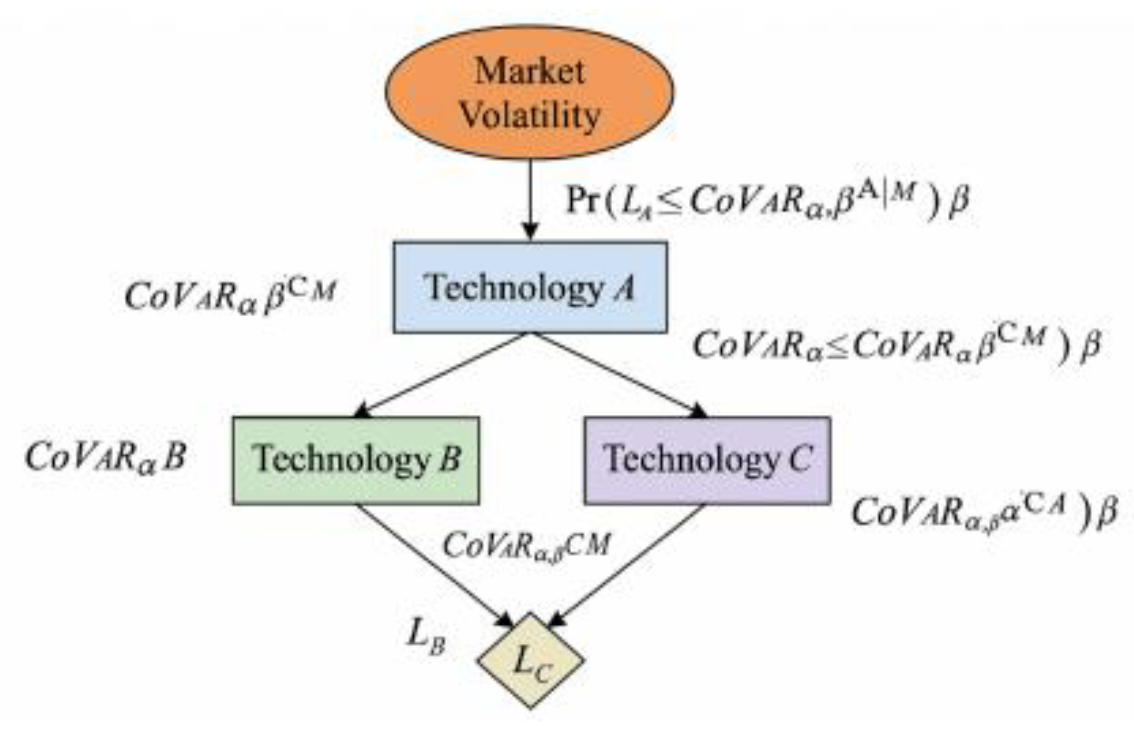
Figure 4.
Multidimensional Resource Allocation Mapping and Task Success Response Structure.
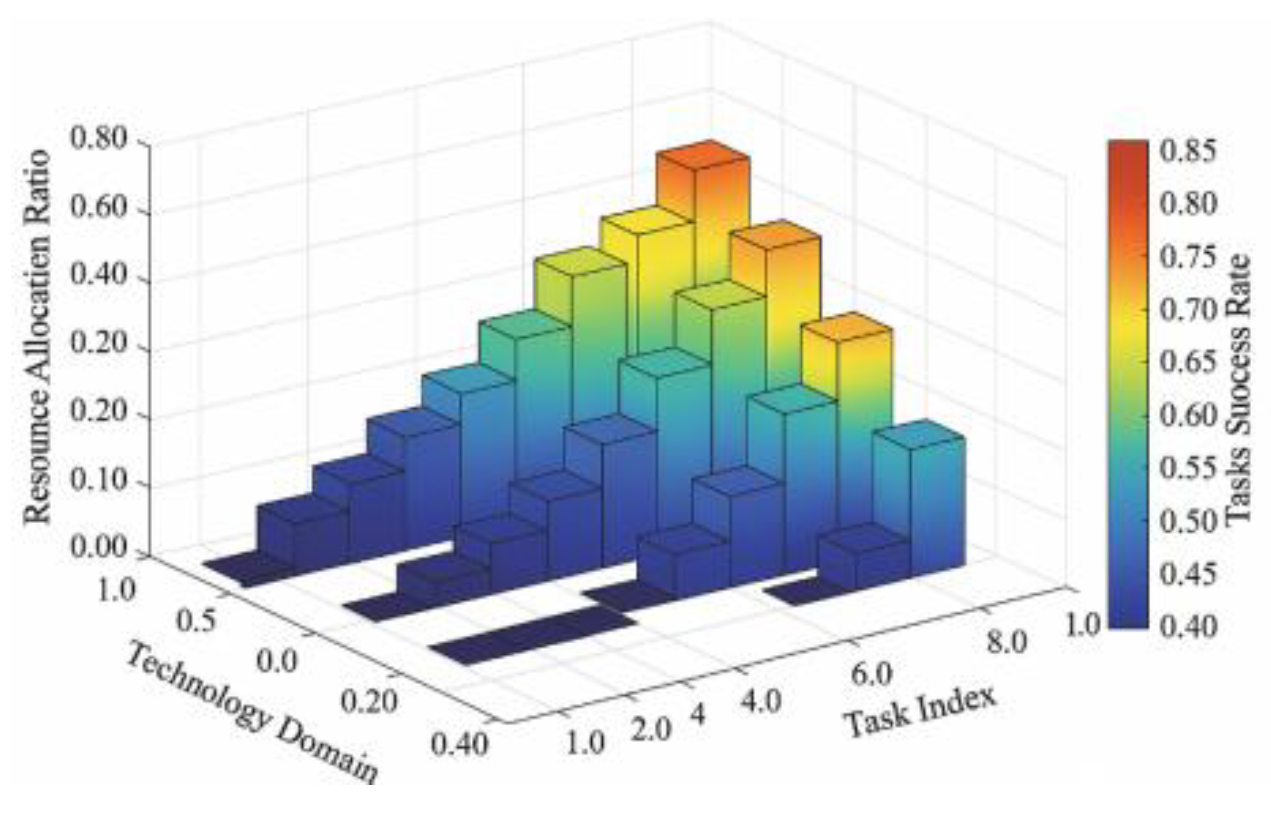

Table 1.
LSSVM Kernel Structures and Hyperparameter Settings.
| Kernel Type | Mathematical Form | Key Parameters | Search Range / Setting |
| RBF | σ, γ | ||
| Polynomial | d, c, γ | ||
| Sigmoid | κ, θ, γ |
Table 1.
Key Parameter Settings and Adaptive Strategies for Each Module.
| Module Stage | Parameter Name | Value/Setting Method | Adaptation Logic Description |
| LSSVM Training Module | Kernel Function Type | RBF | Nonlinear Collaborative Structure Modeling Oriented |
| Particle Swarm Population Size | 30 | Ensuring Global Optimization Capability | |
| Maximum Iteration Count | 300 | Control convergence stability | |
| Copula Modeling Module | Sample Generation Method | Monte Carlo (N=1000) | Constructing Joint Risk Distributions |
| Marginal Distribution Fitting | EVT / GMM Hybrid | Capturing Tail Correlation Characteristics | |
| Simulated Annealing Resource Allocation Module | Initial Temperature T0 | 100 | Initiate Wide-Area Search |
| Cooling Rate α | 0.92 | Control temperature decay rate | |
| Perturbation acceptance mechanism | Metropolis criterion + dynamic update | Preventing Local Optima Trapping |
Disclaimer/Publisher’s Note: The statements, opinions and data contained in all publications are solely those of the individual author(s) and contributor(s) and not of MDPI and/or the editor(s). MDPI and/or the editor(s) disclaim responsibility for any injury to people or property resulting from any ideas, methods, instructions or products referred to in the content. |
© 2025 by the authors. Licensee MDPI, Basel, Switzerland. This article is an open access article distributed under the terms and conditions of the Creative Commons Attribution (CC BY) license (http://creativecommons.org/licenses/by/4.0/).
Copyright: This open access article is published under a Creative Commons CC BY 4.0 license, which permit the free download, distribution, and reuse, provided that the author and preprint are cited in any reuse.


