
Submitted:
25 December 2025
Posted:
25 December 2025
You are already at the latest version
Abstract
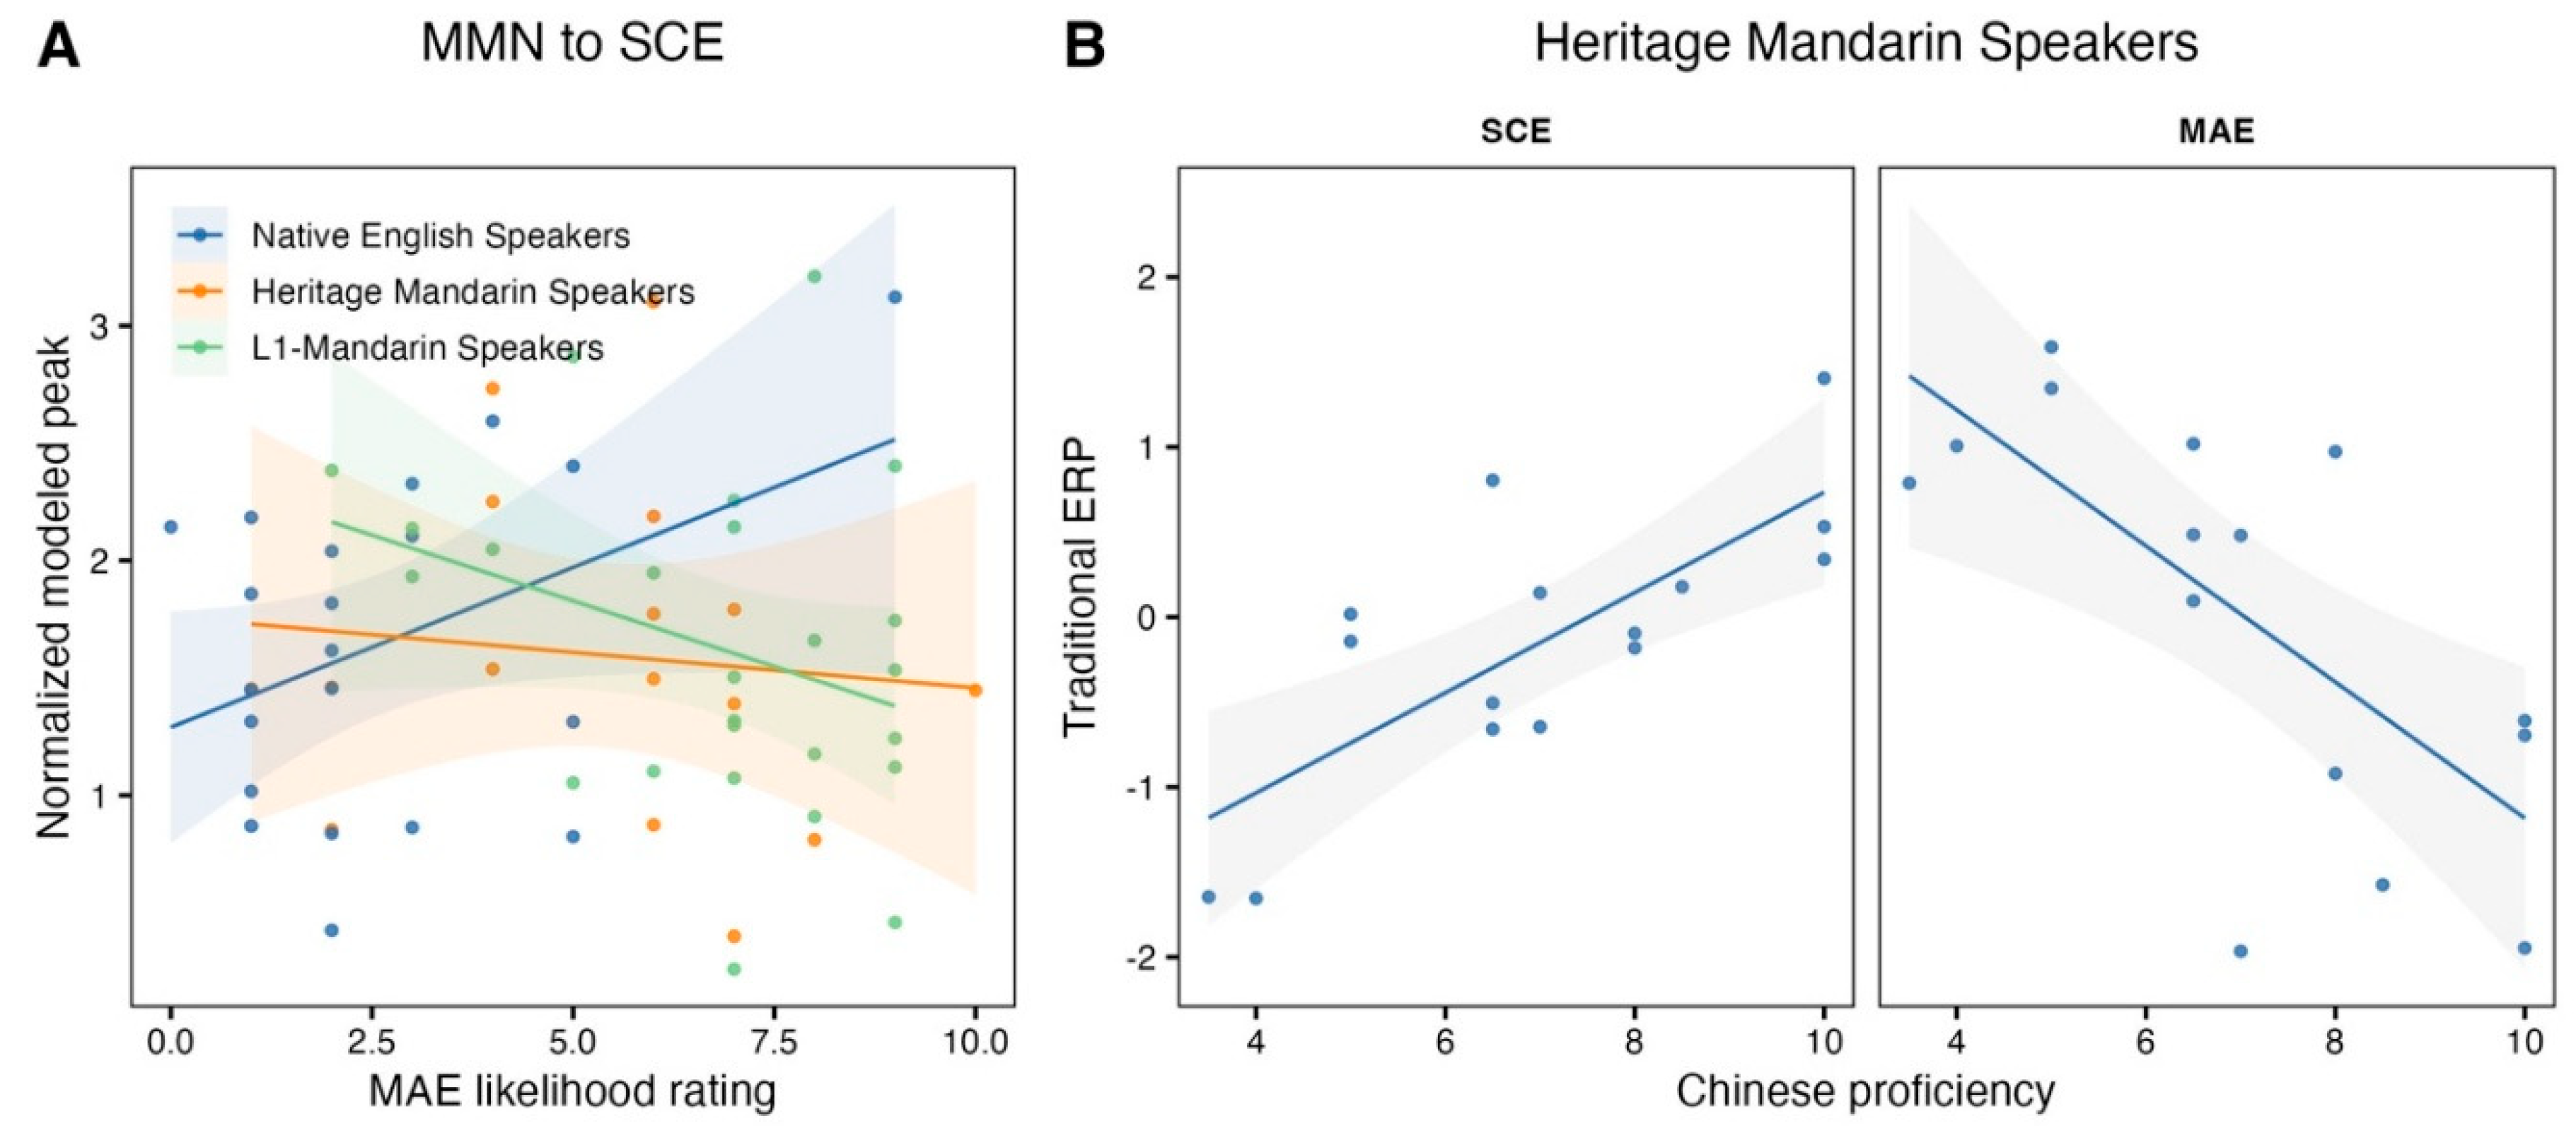
Accented speech contains talker-indexical cues that listeners can use to infer social group membership, yet it remains unclear how the auditory system categorizes accent variability and how this process depends on language experience. The current study used EEG and the MMN oddball paradigm to test pre-attentive neural sensitivity to accent changes of English words stopped produced by Canadian English or Mandarin Chinese accented English talkers. Three participant groups were tested: Native English listeners, L1-Mandarin listeners, and Heritage Mandarin listeners. In the Native English and L1-Mandarin groups, we observed MMNs to the Canadian accented English deviant, indicating that the brain can group speech by accent despite substantive inter-talker variation and is consistent with an experience-dependence sensitivity to accent. Exposure to Mandarin Chinese accented English modulated MMN magnitude. Time-frequency analyses suggested that α and low-β power during accent encoding varied with language background, with Native English listeners showing stronger activity when presented with Mandarin Chinese accented English. Finally, the neurophysiological response in the Heritage Mandarin group reflected a broader phonological space encompassing both Canadian English and Mandarin-accented English, and its magnitude was predicted by Chinese proficiency. These findings provide brain-based evidence that automatic accent categorization is not uniform across listeners but interacts with native phonology and second-language experience.
Keywords:
Introduction
Methods
Participants
Materials
Procedure
EEG Recording and Analysis
EEG Analysis
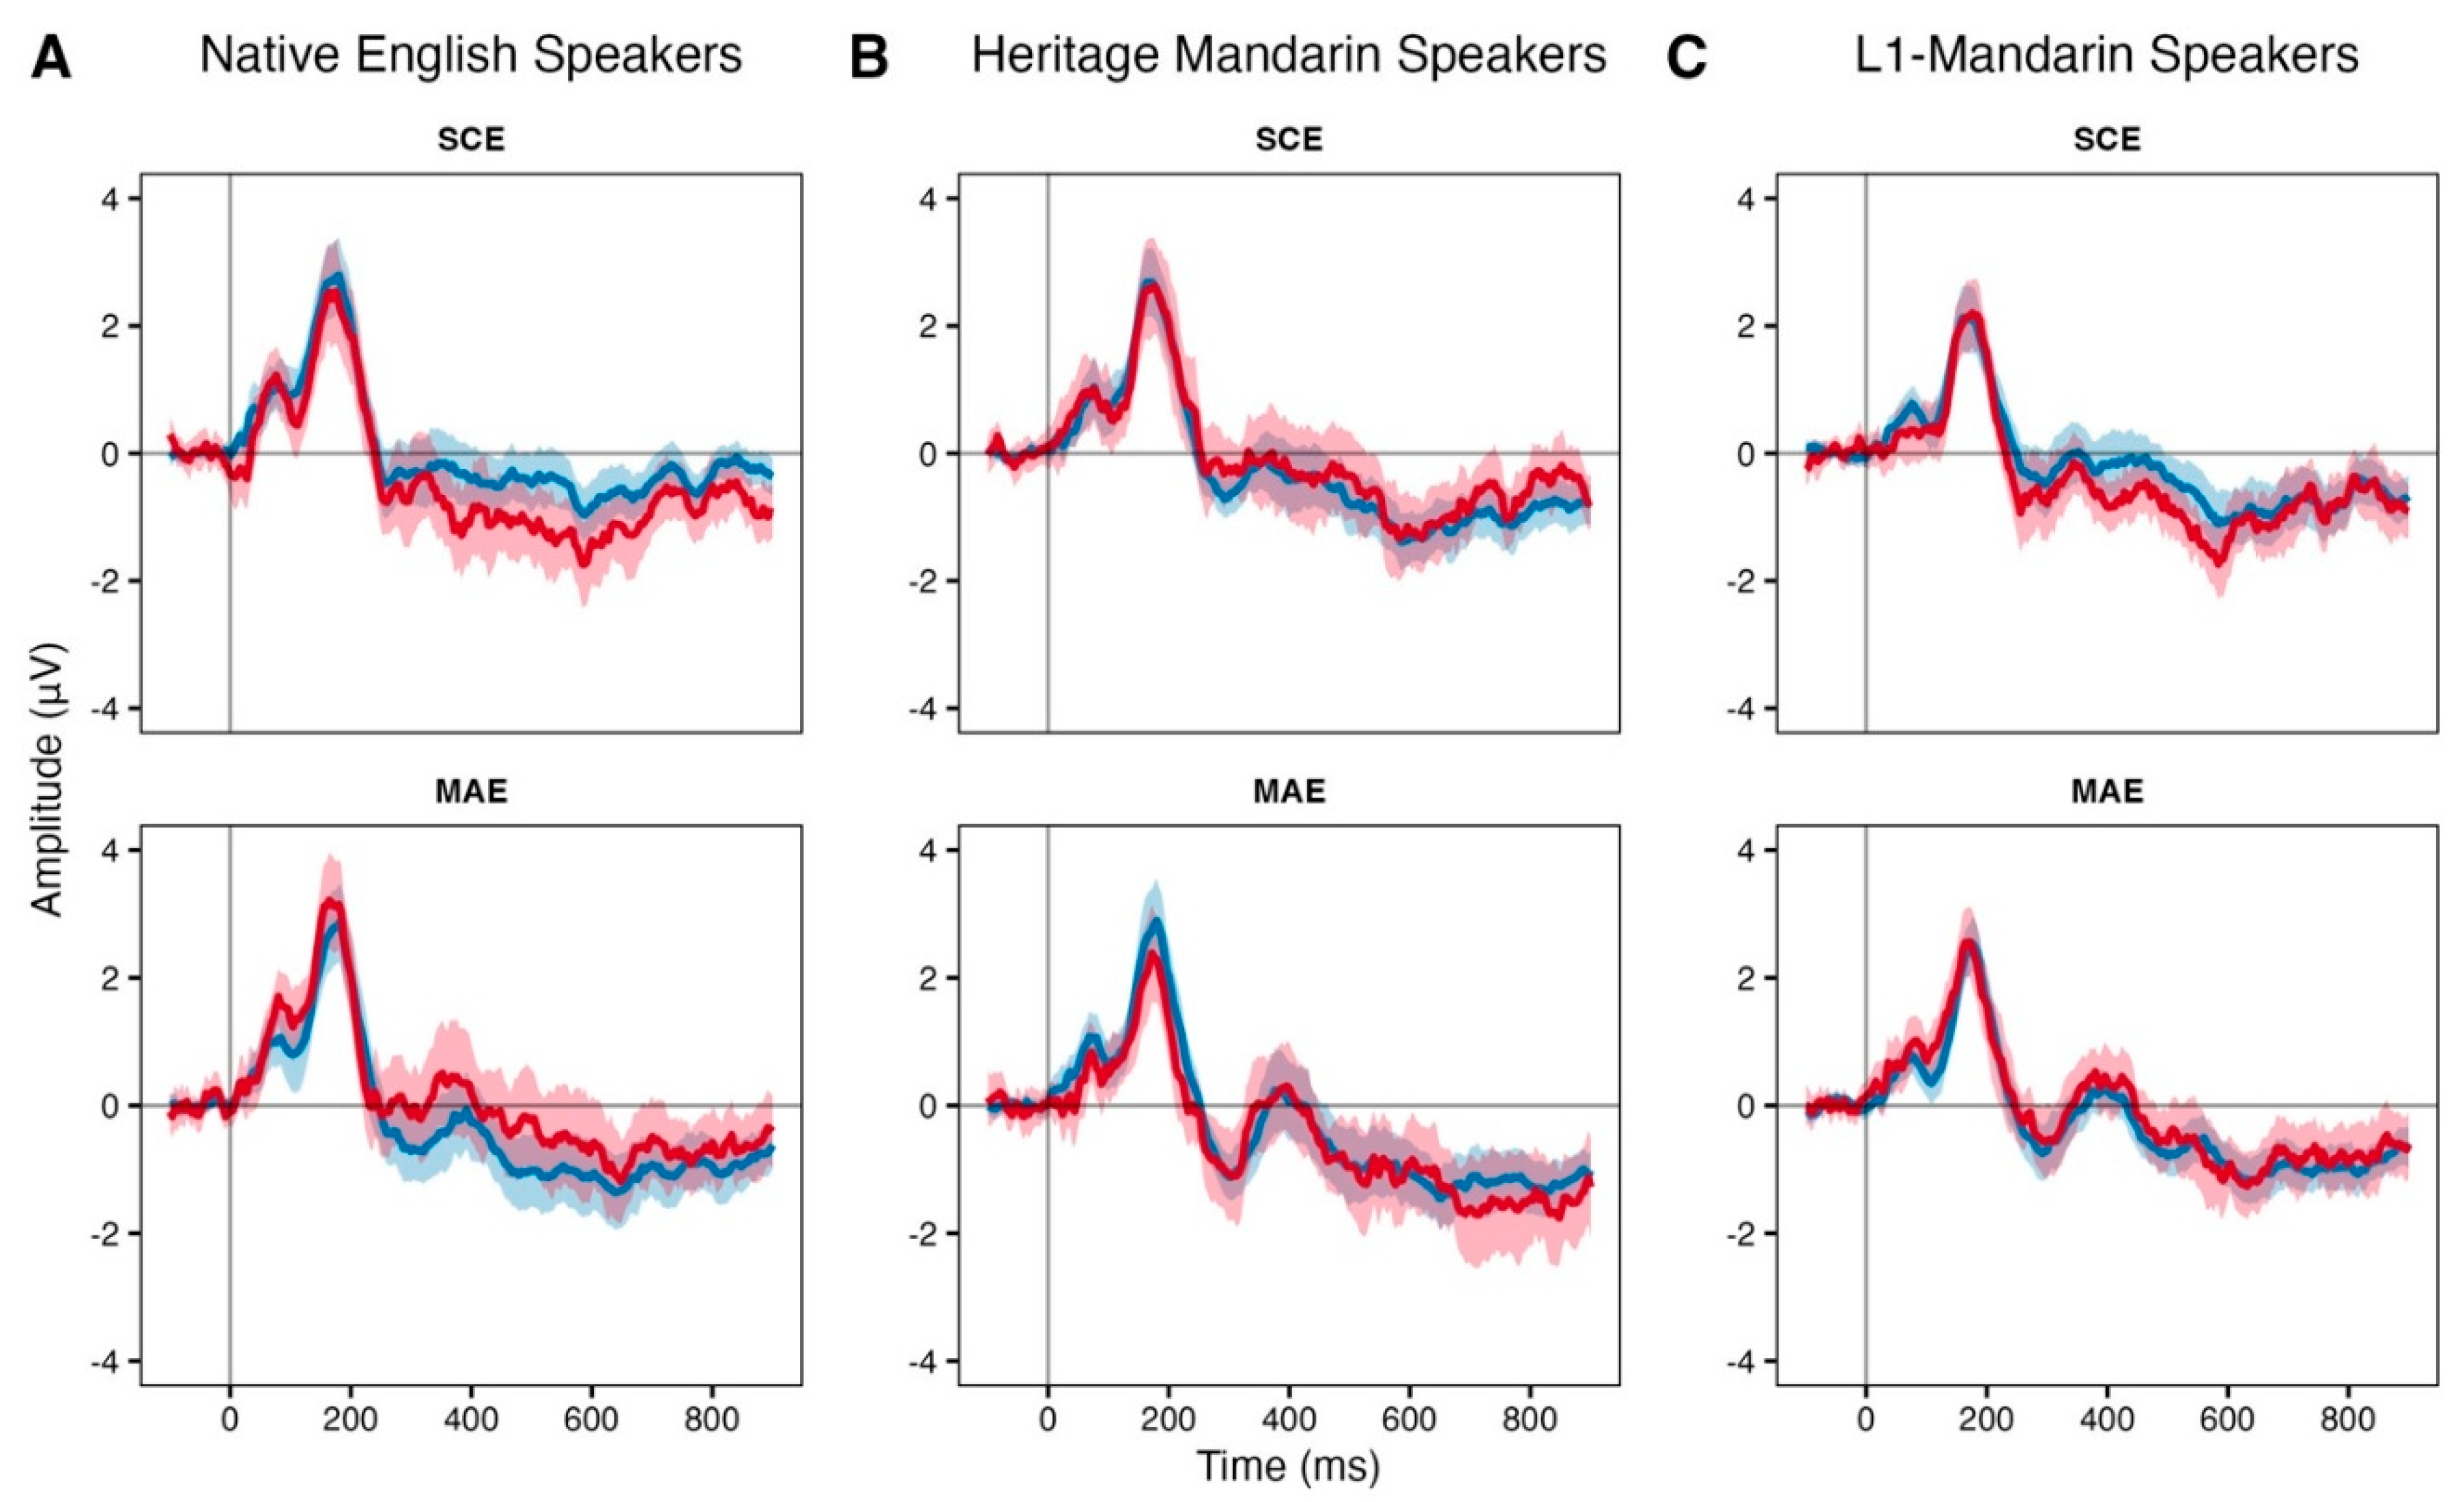
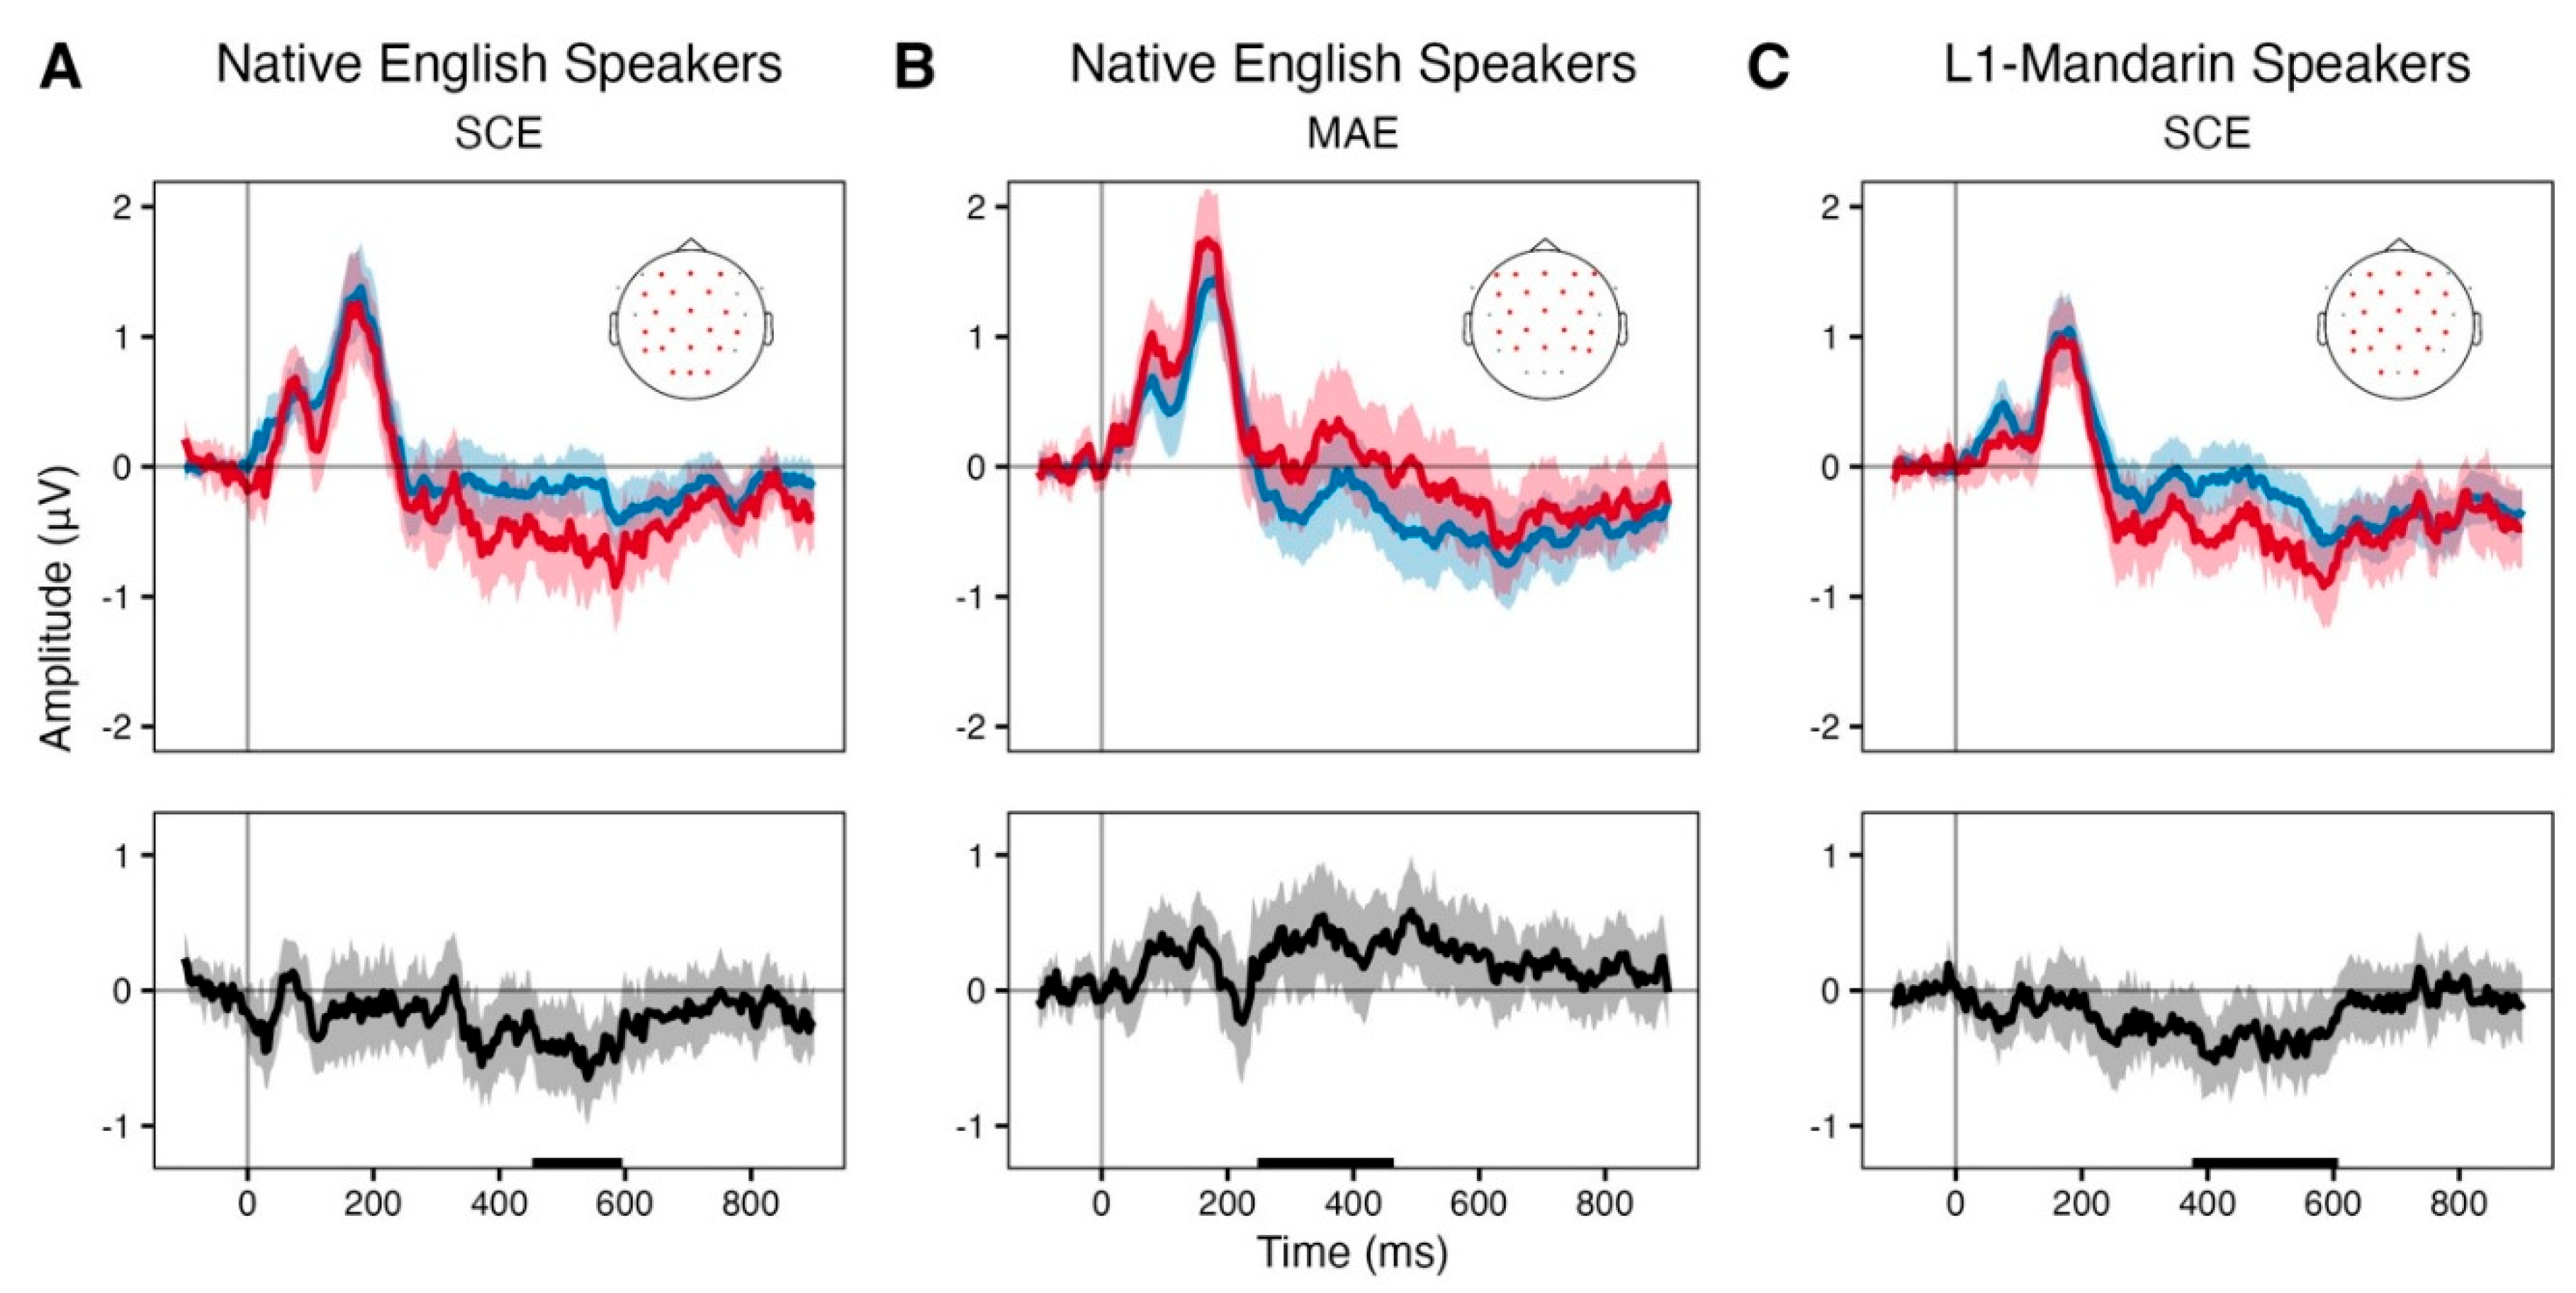
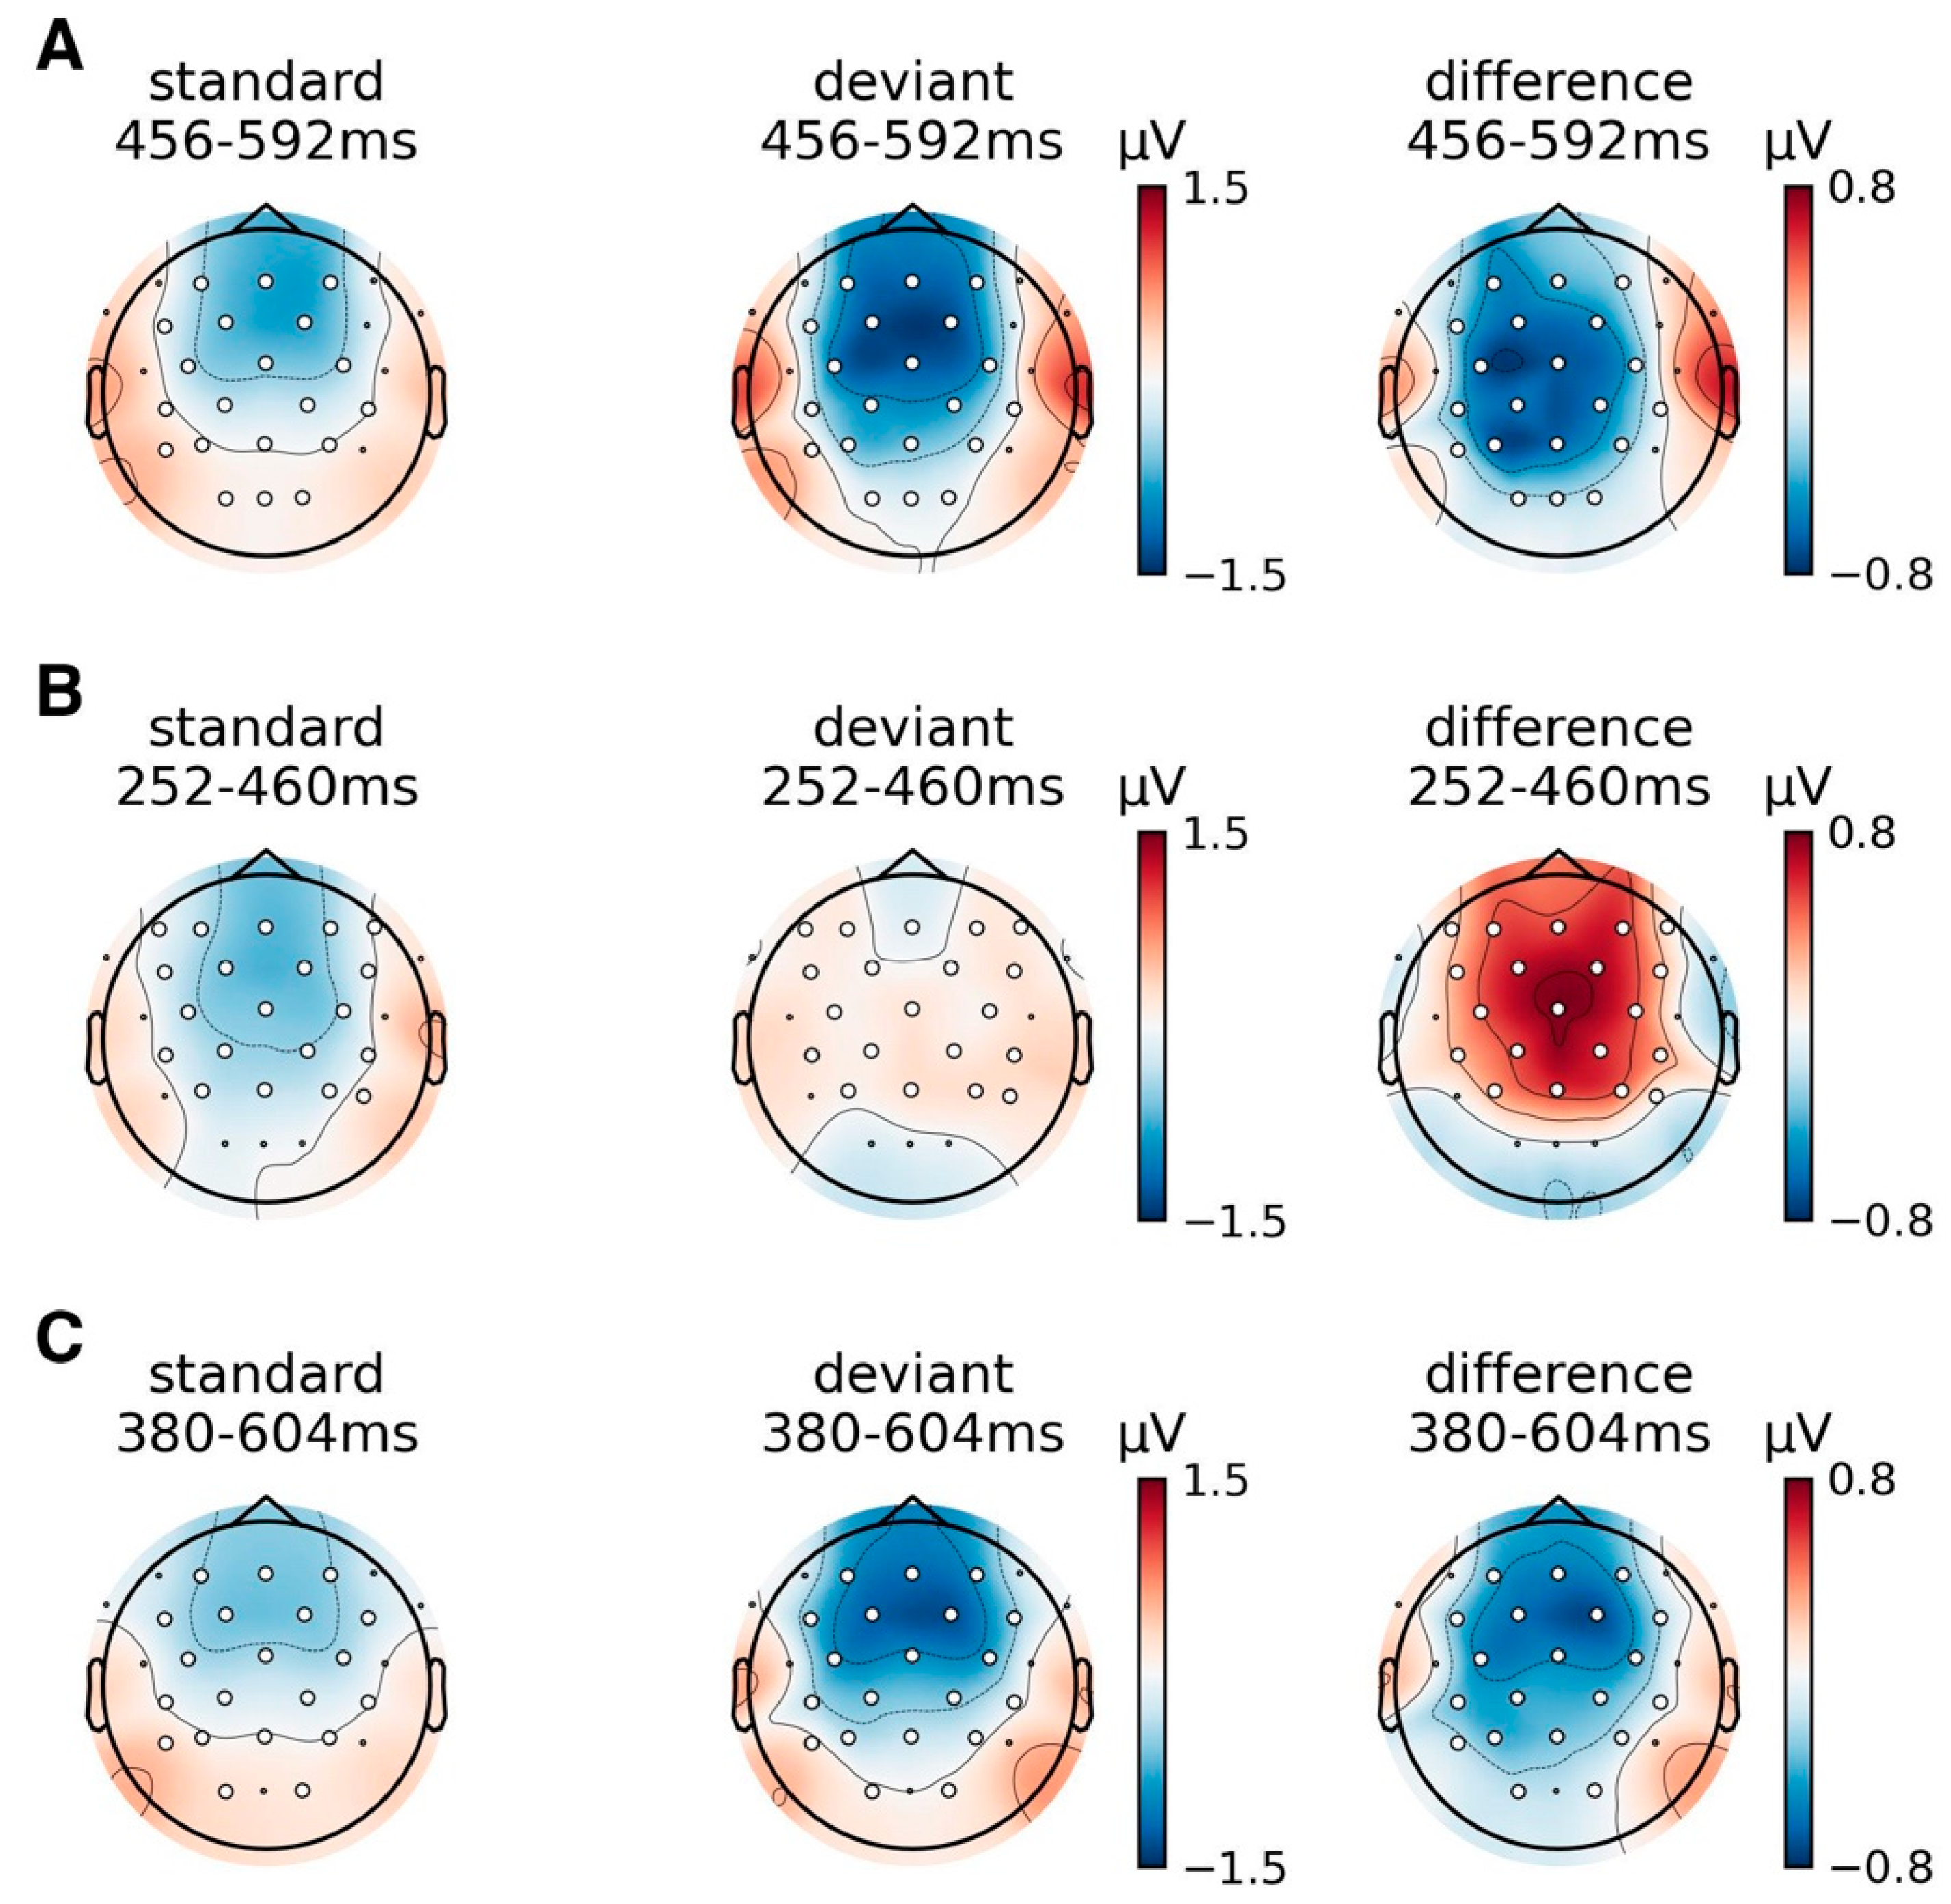
Event-Related Potentials
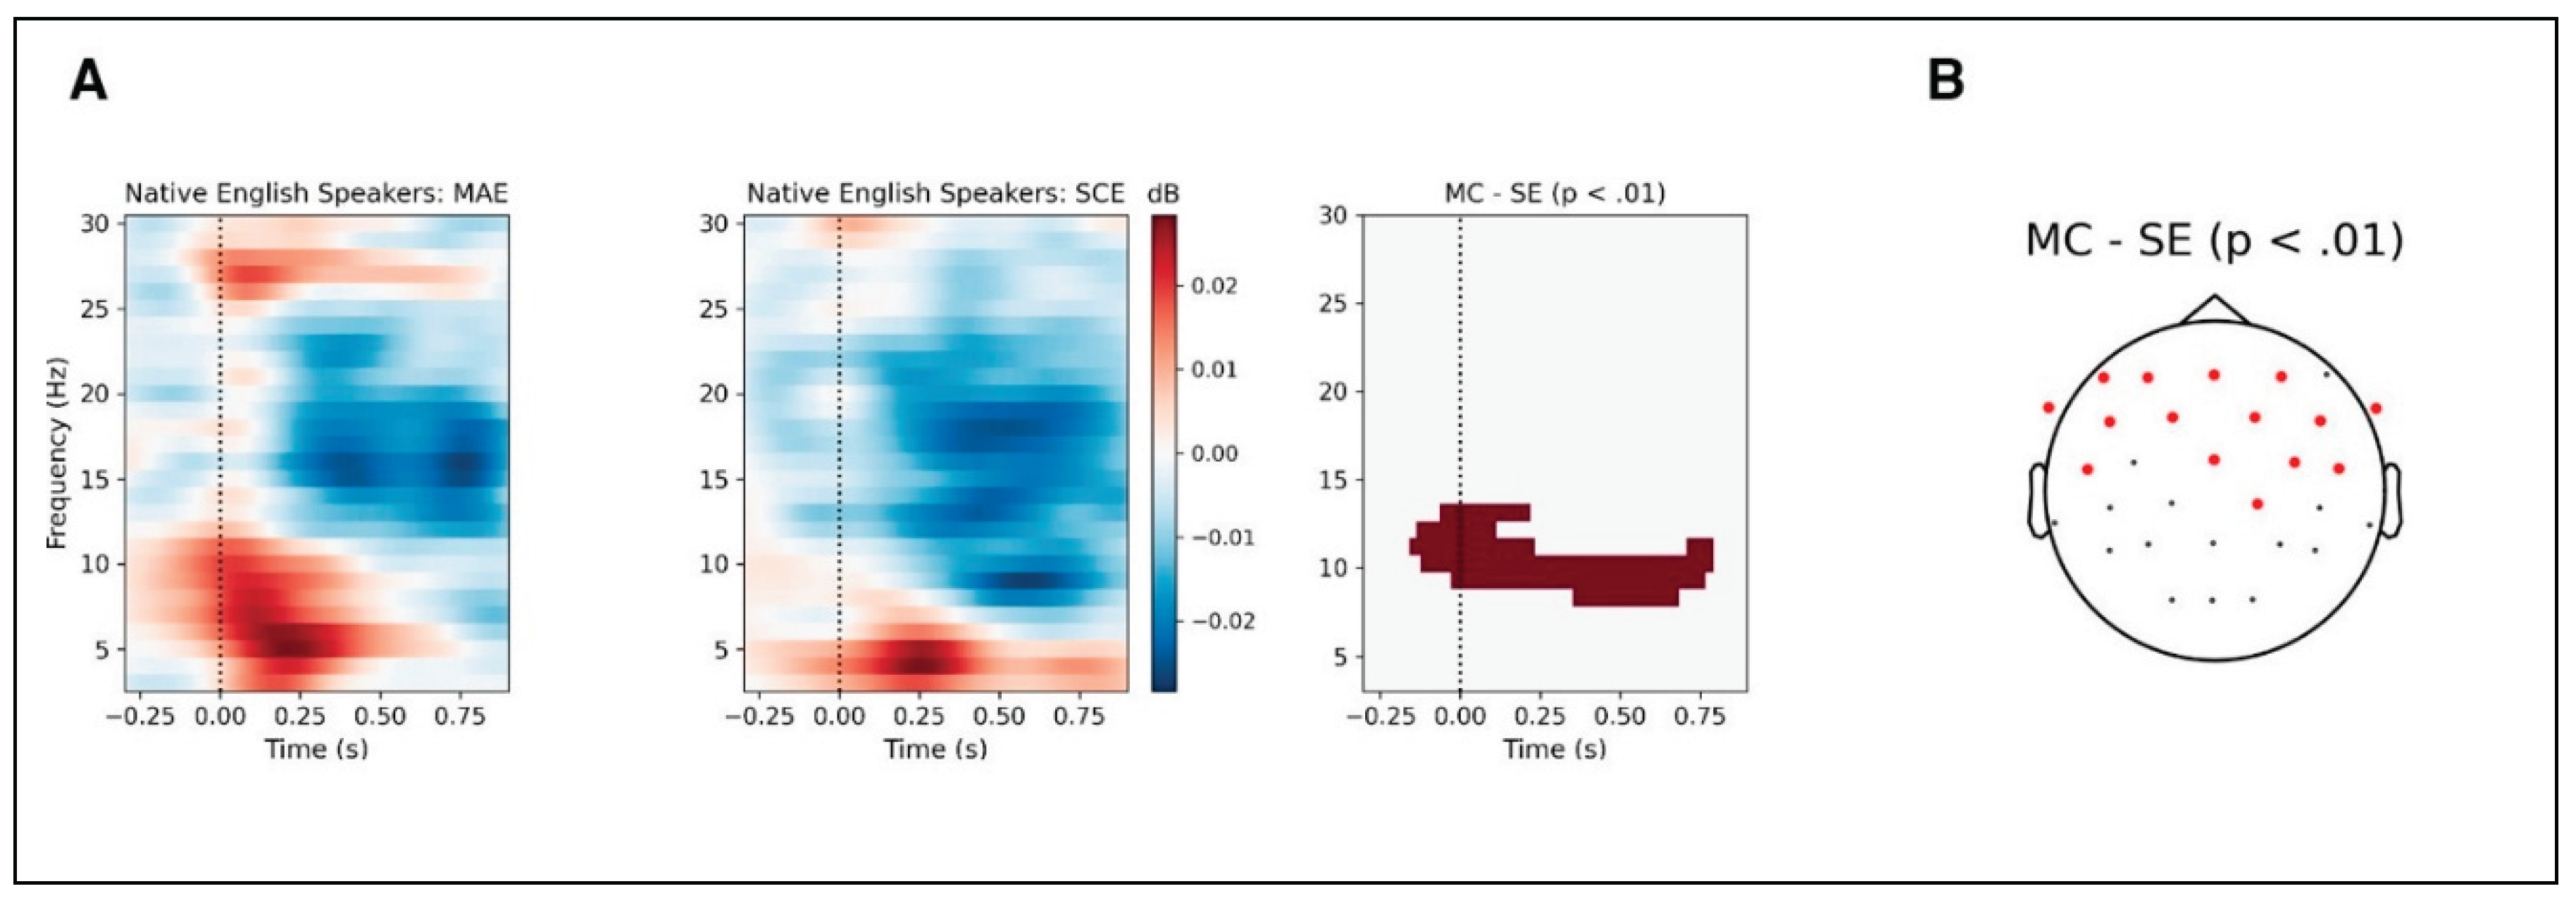
Event-Related Spectral Perturbation
Generalized Additive Modeling
Results
Event Related Potentials
Event-Related Spectral Perturbation
Generalized Additive Models
Discussion
Conclusion
Supplemental Materials
Author Contributions
Funding
Institutional Review Board
Informed Consent Statement
Conflicts of Interest
Appendix

| Talker | Median Rating | Standard Deviation |
| Chinese Accented | ||
| 1 | 5 | 1.57 |
| 2 | 7 | 1.45 |
| 3 | 4 | 1.18 |
| 4 | 6 | 1.2 |
| 5 | 7 | 0.75 |
| 6 | 5 | 1.6 |
| 7 | 5 | 1.28 |
| 8 | 6 | 1.59 |
| 9 | 6 | 1.33 |
| 10 | 6 | 1.58 |
| Overall | 6 | 0.95 (median) |
| Canadian English | ||
| 11 | 1 | 1.17 |
| 12 | 1 | 0.92 |
| 13 | 1 | 1.17 |
| 14 | 1 | 1.22 |
| 15 | 1 | 1.23 |
| 16 | 1 | 1.41 |
| 17 | 1 | 1.2 |
| 18 | 1 | 0.93 |
| 19 | 1 | 2.1 |
| 20 | 1 | 1.44 |
| Overall | 1 | 0 (median) |
References
- Bent, T.; Holt, R.F. Representation of Speech Variability. WIREs Cogn. Sci. 2017, 8, e1434. [Google Scholar] [CrossRef]
- Hartman, D.E. The Perceptual Identity and Characteristics of Aging in Normal Male Adult Speakers. J. Commun. Disord. 1979, 12, 53–61. [Google Scholar] [CrossRef]
- Hartman, D.E.; Danhauer, J.L. Perceptual Features of Speech for Males in Four Perceived Age Decades. J. Acoust. Soc. Am. 1976, 59, 713–715. [Google Scholar] [CrossRef]
- Ptacek, P.H.; Sander, E.K. Age Recognition from Voice. J. Speech Hear. Res. 1966, 9, 273–277. [Google Scholar] [CrossRef]
- Shipp, T.; Hollien, H. Perception of the Aging Male Voice. J. Speech Hear. Res. 1969, 12, 703–710. [Google Scholar] [CrossRef]
- Hillenbrand, J.M.; Clark, M.J. The Role of F0 and Formant Frequencies in Distinguishing the Voices of Men and Women. Atten. Percept. Psychophys. 2009, 71, 1150–1166. [Google Scholar] [CrossRef] [PubMed]
- Lass, N.J.; Hughes, K.R.; Bowyer, M.D.; Waters, L.T.; Bourne, V.T. Speaker Sex Identification from Voiced, Whispered, and Filtered Isolated Vowels. J. Acoust. Soc. Am. 1976, 59, 675–678. [Google Scholar] [CrossRef] [PubMed]
- Mullennix, J.W.; Johnson, K.A.; Topcu-Durgun, M.; Farnsworth, L.M. The Perceptual Representation of Voice Gender. J. Acoust. Soc. Am. 1995, 98, 3080–3095. [Google Scholar] [CrossRef] [PubMed]
- Remez, R.E.; Fellowes, J.M.; Rubin, P.E. Talker Identification Based on Phonetic Information. J. Exp. Psychol. Hum. Percept. Perform. 1997, 23, 651–666. [Google Scholar] [CrossRef]
- Babel, M.; Russell, J. Expectations and Speech Intelligibility. J. Acoust. Soc. Am. 2015, 137, 2823–2833. [Google Scholar] [CrossRef]
- Baugh, J. Racial Identification by Speech. Am. Speech 2000, 75, 362–364. [Google Scholar] [CrossRef]
- Perrachione, T.K.; Chiao, J.Y.; Wong, P.C.M. Asymmetric Cultural Effects on Perceptual Expertise Underlie an Own-Race Bias for Voices. Cognition 2010, 114, 42–55. [Google Scholar] [CrossRef]
- Thomas, E.R.; Reaser, J. Delimiting Perceptual Cues Used for the Ethnic Labeling of African American and European American Voices. J. Socioling. 2004, 8, 54–87. [Google Scholar] [CrossRef]
- Van Dommelen, W.A.; Moxness, B.H. Acoustic Parameters in Speaker Height and Weight Identification: Sex-Specific Behaviour. Lang. Speech 1995, 38, 267–287. [Google Scholar] [CrossRef]
- Smith, D.R.R.; Patterson, R.D.; Turner, R.; Kawahara, H.; Irino, T. The Processing and Perception of Size Information in Speech Sounds. J. Acoust. Soc. Am. 2005, 117, 305–318. [Google Scholar] [CrossRef]
- Flege, J.E. The Detection of French Accent by American Listeners. J. Acoust. Soc. Am. 1984, 76, 692–707. [Google Scholar] [CrossRef] [PubMed]
- Park, H. Detecting Foreign Accent in Monosyllables: The Role of L1 Phonotactics. J. Phon. 2013, 41, 78–87. [Google Scholar] [CrossRef]
- Kinzler, K.D. Language as a Social Cue. Annu. Rev. Psychol. 2021, 72, 241–264. [Google Scholar] [CrossRef]
- Purnell, T.; Idsardi, W.; Baugh, J. Perceptual and Phonetic Experiments on American English Dialect Identification. J. Lang. Soc. Psychol. 1999, 18, 10–30. [Google Scholar] [CrossRef]
- Formisano, E.; De Martino, F.; Bonte, M.; Goebel, R. “Who” Is Saying “What”? Brain-Based Decoding of Human Voice and Speech. Science 2008, 322, 970–973. [Google Scholar] [CrossRef]
- Binder, J. The New Neuroanatomy of Speech Perception. Brain 2000, 123, 2371–2372. [Google Scholar] [CrossRef]
- Hickok, G.; Poeppel, D. The Cortical Organization of Speech Processing. Nat. Rev. Neurosci. 2007, 8, 393–402. [Google Scholar] [CrossRef]
- Liebenthal, E.; Binder, J.R.; Spitzer, S.M.; Possing, E.T.; Medler, D.A. Neural Substrates of Phonemic Perception. Cereb. Cortex 2005, 15, 1621–1631. [Google Scholar] [CrossRef]
- Mesgarani, N.; Cheung, C.; Johnson, K.; Chang, E.F. Phonetic Feature Encoding in Human Superior Temporal Gyrus. Science 2014, 343, 1006–1010. [Google Scholar] [CrossRef]
- Obleser, J.; Eisner, F. Pre-Lexical Abstraction of Speech in the Auditory Cortex. Trends Cogn. Sci. 2009, 13, 14–19. [Google Scholar] [CrossRef]
- Scott, S.K.; Johnsrude, I.S. The Neuroanatomical and Functional Organization of Speech Perception. Trends Neurosci. 2003, 26, 100–107. [Google Scholar] [CrossRef] [PubMed]
- Yi, H.G.; Leonard, M.K.; Chang, E.F. The Encoding of Speech Sounds in the Superior Temporal Gyrus. Neuron 2019, 102, 1096–1110. [Google Scholar] [CrossRef] [PubMed]
- Belin, P.; Zatorre, R.J. Adaptation to Speaker’s Voice in Right. NeuroReport 2003, 14, 2105–2109. [Google Scholar] [CrossRef]
- von Kriegstein, K.; Smith, D.R.R.; Patterson, R.D.; Kiebel, S.J.; Griffiths, T.D. How the Human Brain Recognizes Speech in the Context of Changing Speakers. J. Neurosci. 2010, 30, 629–638. [Google Scholar] [CrossRef] [PubMed]
- Drozdova, P.; Van Hout, R.; Scharenborg, O. Talker-Familiarity Benefit in Non-Native Recognition Memory and Word Identification: The Role of Listening Conditions and Proficiency. Atten. Percept. Psychophys. 2019, 81, 1675–1697. [Google Scholar] [CrossRef]
- Johnsrude, I.S.; Mackey, A.; Hakyemez, H.; Alexander, E.; Trang, H.P.; Carlyon, R.P. Swinging at a Cocktail Party: Voice Familiarity Aids Speech Perception in the Presence of a Competing Voice. Psychol. Sci. 2013, 24, 1995–2004. [Google Scholar] [CrossRef] [PubMed]
- Beauchemin, M.; De Beaumont, L.; Vannasing, P.; Turcotte, A.; Arcand, C.; Belin, P.; Lassonde, M. Electrophysiological Markers of Voice Familiarity. Eur. J. Neurosci. 2006, 23, 3081–3086. [Google Scholar] [CrossRef]
- Plante-Hébert, J.; Boucher, V.J.; Jemel, B. The Processing of Intimately Familiar and Unfamiliar Voices: Specific Neural Responses of Speaker Recognition and Identification. PLOS ONE 2021, 16, e0250214. [Google Scholar] [CrossRef] [PubMed]
- del Giudice, R.; Lechinger, J.; Wislowska, M.; Heib, D.P.J.; Hoedlmoser, K.; Schabus, M. Oscillatory Brain Responses to Own Names Uttered by Unfamiliar and Familiar Voices. Brain Res. 2014, 1591, 63–73. [Google Scholar] [CrossRef] [PubMed]
- Giraud, A.-L.; Poeppel, D. Cortical Oscillations and Speech Processing: Emerging Computational Principles and Operations. Nat. Neurosci. 2012, 15, 511–517. [Google Scholar] [CrossRef]
- Poeppel, D.; Assaneo, M.F. Speech Rhythms and Their Neural Foundations. Nat. Rev. Neurosci. 2020, 21, 322–334. [Google Scholar] [CrossRef]
- Schilling, N.; Marsters, A. Unmasking Identity: Speaker Profiling for Forensic Linguistic Purposes. Annu. Rev. Appl. Linguist. 2015, 35, 195–214. [Google Scholar] [CrossRef]
- Newman, M.; Wu, A. “Do You Sound Asian When You Speak English?” Racial Identification and Voice in Chinese and Korean Americans’ English. Am. Speech 2011, 86, 152–178. [Google Scholar] [CrossRef]
- Xue, S.An.; Hao, J.G. Normative Standards for Vocal Tract Dimensions by Race as Measured by Acoustic Pharyngometry. J. Voice 2006, 20, 391–400. [Google Scholar] [CrossRef]
- Squires, G.D.; Chadwick, J. Linguistic Profiling: A Continuing Tradition of Discrimination in the Home Insurance Industry? Urban Aff. Rev. 2006, 41, 400–415. [Google Scholar] [CrossRef]
- Wright, K.E. Housing Policy and Linguistic Profiling: An Audit Study of Three American Dialects. Language 2023, 99, e58–e85. [Google Scholar] [CrossRef]
- Grey, K.L. Deviant Bodies, Stigmatized Identities, and Racist Acts: Examining the Experiences of African-American Gamers in Xbox Live. New Rev. Hypermedia Multimed. 2012, 18, 261–276. [Google Scholar] [CrossRef]
- Berry, J. Linguistic Profiling: Its Prevalence and Consequence. Mich. Acad. 2021, 47, 78. [Google Scholar]
- Näätänen, R. Attention and Brain Function; Routledge, 1992; ISBN 978-0-429-48735-4. [Google Scholar]
- Näätänen, R.; Paavilainen, P.; Rinne, T.; Alho, K. The Mismatch Negativity (MMN) in Basic Research of Central Auditory Processing: A Review. Clin. Neurophysiol. 2007, 118, 2544–2590. [Google Scholar] [CrossRef]
- Titova, N.; Näätänen, R. Preattentive Voice Discrimination by the Human Brain as Indexed by the Mismatch Negativity. Neurosci. Lett. 2001, 308, 63–65. [Google Scholar] [CrossRef] [PubMed]
- Alho, K. Cerebral Generators of Mismatch Negativity (MMN) and Its Magnetic Counterpart (MMNm) Elicited by Sound Changes. Ear Hear. 1995, 16, 38–51. [Google Scholar] [CrossRef] [PubMed]
- Hari, R.; Hämäläinen, M.; Ilmoniemi, R.; Kaukoranta, E.; Reinikainen, K.; Salminen, J.; Alho, K.; Näätänen, R.; Sams, M. Responses of the Primary Auditory Cortex to Pitch Changes in a Sequence of Tone Pips: Neuromagnetic Recordings in Man. Neurosci. Lett. 1984, 50, 127–132. [Google Scholar] [CrossRef]
- Javit, D.C.; Steinschneider, M.; Schroeder, C.E.; Vaughan, H.G.; Arezzo, J.C. Detection of Stimulus Deviance within Primate Primary Auditory Cortex: Intracortical Mechanisms of Mismatch Negativity (MMN) Generation. Brain Res. 1994, 667, 192–200. [Google Scholar] [CrossRef] [PubMed]
- Näätänen, R.; Alho, K. Mismatch Negativity—A Unique Measure of Sensory Processing in Audition. Int. J. Neurosci. 1995, 80, 317–337. [Google Scholar] [CrossRef]
- Näätänen, R.; Lehtokoski, A.; Lennes, M.; Cheour, M.; Huotilainen, M.; Iivonen, A.; Vainio, M.; Alku, P.; Ilmoniemi, R.J.; Luuk, A.; et al. Language-Specific Phoneme Representations Revealed by Electric and Magnetic Brain Responses. Nature 1997, 385, 432–434. [Google Scholar] [CrossRef]
- Sams, M.; Paavilainen, P.; Alho, K.; Näätänen, R. Auditory Frequency Discrimination and Event-Related Potentials. Electroencephalogr. Clin. Neurophysiol. Potentials Sect. 1985, 62, 437–448. [Google Scholar] [CrossRef]
- Sharma, A.; Dorman, M.F. Cortical Auditory Evoked Potential Correlates of Categorical Perception of Voice-Onset Time. J. Acoust. Soc. Am. 1999, 106, 1078–1083. [Google Scholar] [CrossRef]
- Fu, Z.; Monahan, P.J. Extracting Phonetic Features From Natural Classes: A Mismatch Negativity Study of Mandarin Chinese Retroflex Consonants. Front. Hum. Neurosci. 2021, 15, 1–15. [Google Scholar] [CrossRef]
- Gomes, H.; Ritter, W.; Vaughan, H.G. The Nature of Preattentive Storage in the Auditory System. J. Cogn. Neurosci. 1995, 7, 81–94. [Google Scholar] [CrossRef]
- Hu, A.; Gu, F.; Wong, L.L.N.; Tong, X.; Zhang, X. Visual Mismatch Negativity Elicited by Semantic Violations in Visual Words. Brain Res. 2020, 1746, 147010. [Google Scholar] [CrossRef]
- Monahan, P.J.; Schertz, J.; Fu, Z.; Pérez, A. Unified Coding of Spectral and Temporal Phonetic Cues: Electrophysiological Evidence for Abstract Phonological Features. J. Cogn. Neurosci. 2022, 34, 618–638. [Google Scholar] [CrossRef] [PubMed]
- Phillips, C.; Pellathy, T.; Marantz, A.; Yellin, E.; Wexler, K.; Poeppel, D.; McGinnis, M.; Roberts, T. Auditory Cortex Accesses Phonological Categories: An MEG Mismatch Study. J. Cogn. Neurosci. 2000, 12, 1038–1055. [Google Scholar] [CrossRef]
- Politzer-Ahles, S.; Jap, B.A.J. Can the Mismatch Negativity Really Be Elicited by Abstract Linguistic Contrasts? Neurobiol. Lang. 2024, 1–26. [Google Scholar] [CrossRef] [PubMed]
- Schröger, E.; Paavilainen, P.; Näätänen, R. Mismatch Negativity to Changes in a Continuous Tone with Regularly Varying Frequencies. Electroencephalogr. Clin. Neurophysiol. Potentials Sect. 1994, 92, 140–147. [Google Scholar] [CrossRef]
- Shestakova, A.; Brattico, E.; Huotilainen, M.; Galunov, V.; Soloviev, A.; Sams, M.; Ilmoniemi, R.J.; Näätänen, R. Abstract Phoneme Representations in the Left Temporal Cortex: Magnetic Mismatch. NeuroReport 2002, 13, 1813–1816. [Google Scholar] [CrossRef]
- Knösche, T.R.; Lattner, S.; Maess, B.; Schauer, M.; Friederici, A.D. Early Parallel Processing of Auditory Word and Voice Information. NeuroImage 2002, 17, 1493–1503. [Google Scholar] [CrossRef] [PubMed]
- Allen, J.; Kraus, N.; Bradlow, A. Neural Representation of Consciously Imperceptible Speech Sound Differences. Percept. Psychophys. 2000, 62, 1383–1393. [Google Scholar] [CrossRef]
- Bühler, J.C.; Schmid, S.; Maurer, U. Influence of Dialect Use on Speech Perception: A Mismatch Negativity Study. Lang. Cogn. Neurosci. 2017, 32, 757–775. [Google Scholar] [CrossRef]
- Dehaene-Lambertz, G.; Dupoux, E.; Gout, A. Electrophysiological Correlates of Phonological Processing: A Cross-Linguistic Study. J. Cogn. Neurosci. 2000, 12, 635–647. [Google Scholar] [CrossRef] [PubMed]
- Hacquard, V.; Walter, M.A.; Marantz, A. The Effects of Inventory on Vowel Perception in French and Spanish: An MEG Study. Brain Lang. 2007, 100, 295–300. [Google Scholar] [CrossRef]
- Kazanina, N.; Phillips, C.; Idsardi, W.J. The Influence of Meaning on the Perception of Speech Sounds. Proc. Natl. Acad. Sci. 2006, 103, 11381–11386. [Google Scholar] [CrossRef]
- Lipski, S.C.; Escudero, P.; Benders, T. Language Experience Modulates Weighting of Acoustic Cues for Vowel Perception: An Event-related Potential Study. Psychophysiology 2012, 49, 638–650. [Google Scholar] [CrossRef]
- Miglietta, S.; Grimaldi, M.; Calabrese, A. Conditioned Allophony in Speech Perception: An ERP Study. Brain Lang. 2013, 126, 285–290. [Google Scholar] [CrossRef]
- Sharma, A.; Dorman, M.F. Neurophysiologic Correlates of Cross-Language Phonetic Perception. J. Acoust. Soc. Am. 2000, 107, 2697–2703. [Google Scholar] [CrossRef]
- Winkler, I.; Lehtokoski, A.; Alku, P.; Vainio, M.; Czigler, I.; Csépe, V.; Aaltonen, O.; Raimo, I.; Alho, K.; Lang, H.; et al. Pre-Attentive Detection of Vowel Contrasts Utilizes Both Phonetic and Auditory Memory Representations. Cogn. Brain Res. 1999, 7, 357–369. [Google Scholar] [CrossRef]
- Winkler, I.; Kujala, T.; Alku, P.; Näätänen, R. Language Context and Phonetic Change Detection. Cogn. Brain Res. 2003, 17, 833–844. [Google Scholar] [CrossRef] [PubMed]
- Scharinger, M.; Monahan, P.J.; Idsardi, W.J. You Had Me at “Hello”: Rapid Extraction of Dialect Information from Spoken Words. NeuroImage 2011, 56, 2329–2338. [Google Scholar] [CrossRef]
- Tuninetti, A.; Chládková, K.; Peter, V.; Schiller, N.O.; Escudero, P. When Speaker Identity Is Unavoidable: Neural Processing of Speaker Identity Cues in Natural Speech. Brain Lang. 2017, 174, 42–49. [Google Scholar] [CrossRef] [PubMed]
- Hardman, J. Accentedness and Intelligibility of Mandarin-Accented English for Chinese, Koreans, and Americans. In Proceedings of the In Proceedings of the International Symposium on the Acquisition of Second Language Speech; 2014; Vol. Vol. 5, pp. 240–260.
- Hansen Edwards, J.G. Sociolinguistic Variation in Asian Englishes: The Case of Coronal Stop Deletion. Engl. World-Wide J. Var. Engl. 2016, 37, 138–167. [Google Scholar] [CrossRef]
- Cheng, L.S.P.; Kramer, M.A. Exploring Asian North American English: A YouTube Corpus-Based Approach. Presented at the LSA 2022 Annual Meeting, Washington, DC, United States (virtual), 2022. [Google Scholar]
- Boersma, P.; Weenink, D. Praat: Doing Phonetics by Computer 2020.
- Tervaniemi, M.; Kujala, A.; Alho, K.; Virtanen, J.; Ilmoniemi, R.J.; Näätänen, R. Functional Specialization of the Human Auditory Cortex in Processing Phonetic and Musical Sounds: A Magnetoencephalographic (MEG) Study. NeuroImage 1999, 9, 330–336. [Google Scholar] [CrossRef]
- Monahan, P.J. Phonological Knowledge and Speech Comprehension. Annu. Rev. Linguist. 2018, 4, 21–47. [Google Scholar] [CrossRef]
- Cowan, N.; Winkler, I.; Teder, W.; Näätänen, R. Memory Prerequisites of Mismatch Negativity in the Auditory Event-Related Potential (ERP). J. Exp. Psychol. Learn. Mem. Cogn. 1993, 19, 909–921. [Google Scholar] [CrossRef]
- Peirce, J.; Gray, J.R.; Simpson, S.; MacAskill, M.; Höchenberger, R.; Sogo, H.; Kastman, E.; Lindeløv, J.K. PsychoPy2: Experiments in Behavior Made Easy. Behav. Res. Methods 2019, 51, 195–203. [Google Scholar] [CrossRef]
- Pérez, A.; Monahan, P.J.; Lambon Ralph, M.A. Joint Recording of EEG and Audio Signals in Hyperscanning and Pseudo-Hyperscanning Experiments. MethodsX 2021, 8, 101347. [Google Scholar] [CrossRef]
- Gramfort, A. MEG and EEG Data Analysis with MNE-Python. Front. Neurosci. 2013, 7. [Google Scholar] [CrossRef]
- Bigdely-Shamlo, N.; Mullen, T.; Kothe, C.; Su, K.-M.; Robbins, K.A. The PREP Pipeline: Standardized Preprocessing for Large-Scale EEG Analysis. Front. Neuroinformatics 2015, 9. [Google Scholar] [CrossRef]
- Pion-Tonachini, L.; Kreutz-Delgado, K.; Makeig, S. ICLabel: An Automated Electroencephalographic Independent Component Classifier, Dataset, and Website. NeuroImage 2019, 198, 181–197. [Google Scholar] [CrossRef]
- Mahajan, Y.; Peter, V.; Sharma, M. Effect of EEG Referencing Methods on Auditory Mismatch Negativity. Front. Neurosci. 2017, 11, 560. [Google Scholar] [CrossRef]
- Jacobsen, T.; Horenkamp, T.; Schröger, E. Preattentive Memory-Based Comparison of Sound Intensity. Audiol. Neurotol. 2003, 8, 338–346. [Google Scholar] [CrossRef] [PubMed]
- Maris, E.; Oostenveld, R. Nonparametric Statistical Testing of EEG- and MEG-Data. J. Neurosci. Methods 2007, 164, 177–190. [Google Scholar] [CrossRef] [PubMed]
- Meulman, N.; Sprenger, S.A.; Schmid, M.S.; Wieling, M. GAM-Based Individual Difference Measures for L2 ERP Studies. Res. Methods Appl. Linguist. 2023, 2, 100079. [Google Scholar] [CrossRef]
- Wood, S.; Wood, M.S. Package ‘Mgcv’ 2015.
- R Core Team R: A Language and Environment for Statistical Computing 2021.
- Simpson, G.L. Gratia: An R Package for Exploring Generalized Additive Models. J. Open Source Softw. 2024, 9, 6962. [Google Scholar] [CrossRef]
- Hansen, J.C.; Hillyard, S.A. Endogeneous Brain Potentials Associated with Selective Auditory Attention. Electroencephalogr. Clin. Neurophysiol. 1980, 49, 277–290. [Google Scholar] [CrossRef] [PubMed]
- Arnal, L.H.; Giraud, A.-L. Cortical Oscillations and Sensory Predictions. Trends Cogn. Sci. 2012, 16, 390–398. [Google Scholar] [CrossRef]
- McMahon, C.M.; Boisvert, I.; de Lissa, P.; Granger, L.; Ibrahim, R.; Lo, C.Y.; Miles, K.; Graham, P.L. Monitoring Alpha Oscillations and Pupil Dilation across a Performance-Intensity Function. Front. Psychol. 2016, 7. [Google Scholar] [CrossRef]
- Strauß, A.; Wöstmann, M.; Obleser, J. Cortical Alpha Oscillations as a Tool for Auditory Selective Inhibition. Front. Hum. Neurosci. 2014, 8. [Google Scholar] [CrossRef] [PubMed]
- Lenth, R.V.; Piaskowski, J. Emmeans: Estimated Marginal Means, Aka Least-Squares Means; 2025.
- Scharinger, M.; Monahan, P.J.; Idsardi, W.J. You Had Me at “Hello”: Rapid Extraction of Dialect Information from Spoken Words. NeuroImage 2011, 56, 2329–2338. [Google Scholar] [CrossRef]
- Scharinger, M.; Monahan, P.J.; Idsardi, W.J. Linguistic Category Structure Influences Early Auditory Processing: Converging Evidence from Mismatch Responses and Cortical Oscillations. NeuroImage 2016, 128, 293–301. [Google Scholar] [CrossRef] [PubMed]
- Jaramillo, M.; Alku, P.; Paavilainen, P. An Event-Related Potential (ERP) Study of Duration Changes in Speech and Non-Speech Sounds. NeuroReport 1999, 10, 3301. [Google Scholar] [CrossRef]
- Takegata, R.; Tervaniemi, M.; Alku, P.; Ylinen, S.; Näätänen, R. Parameter-Specific Modulation of the Mismatch Negativity to Duration Decrement and Increment: Evidence for Asymmetric Processes. Clin. Neurophysiol. 2008, 119, 1515–1523. [Google Scholar] [CrossRef] [PubMed]
- Peter, V.; McArthur, G.; Thompson, W.F. Effect of Deviance Direction and Calculation Method on Duration and Frequency Mismatch Negativity (MMN). Neurosci. Lett. 2010, 482, 71–75. [Google Scholar] [CrossRef]
- White, E.J.; Titone, D.; Genesee, F.; Steinhauer, K. Phonological Processing in Late Second Language Learners: The Effects of Proficiency and Task. Biling. Lang. Cogn. 2017, 20, 162–183. [Google Scholar] [CrossRef]
- Winkler, I.; Kujala, T.; Tiitinen, H.; Sivonen, P.; Alku, P.; Lehtokoski, A.; Czigler, I.; Csépe, V.; Ilmoniemi, R.J.; Näätänen, R. Brain Responses Reveal the Learning of Foreign Language Phonemes. Psychophysiology 1999, 36, 638–642. [Google Scholar] [CrossRef]
- Liberto, G.M.D.; Nie, J.; Yeaton, J.; Khalighinejad, B.; Shamma, S.A.; Mesgarani, N. Neural Representation of Linguistic Feature Hierarchy Reflects Second-Language Proficiency. NeuroImage 2021, 227, 117586. [Google Scholar] [CrossRef]
- Gosselin, L.; Martin, C.D.; González Martín, A.; Caffarra, S. When a Nonnative Accent Lets You Spot All the Errors: Examining the Syntactic Interlanguage Benefit. J. Cogn. Neurosci. 2022, 34, 1650–1669. [Google Scholar] [CrossRef]
- Gustavsson, L.; Kallioinen, P.; Klintfors, E.; Lindh, J. Neural Processing of Voices—Familiarity. J. Acoust. Soc. Am. 2013, 133, 3569. [Google Scholar] [CrossRef]
- Brunellière, A.; Soto-Faraco, S. The Speakers’ Accent Shapes the Listeners’ Phonological Predictions during Speech Perception. Brain Lang. 2013, 125, 82–93. [Google Scholar] [CrossRef] [PubMed]
- Hanulíková, A.; van Alphen, P.M.; van Goch, M.M.; Weber, A. When One Person’s Mistake Is Another’s Standard Usage: The Effect of Foreign Accent on Syntactic Processing. J. Cogn. Neurosci. 2012, 24, 878–887. [Google Scholar] [CrossRef] [PubMed]
- Caffarra, S.; Martin, C.D. Not All Errors Are the Same: ERP Sensitivity to Error Typicality in Foreign Accented Speech Perception. Cortex 2019, 116, 308–320. [Google Scholar] [CrossRef]
| Age of acquisition (English) | English proficiency | Chinese proficiency | MAE exposure | ||||
| Listening | Speaking | Listening | Speaking | Familiarity | Exposure Likelihood | ||
| Native English Listeners (n = 22) | NA | 10 (0.2) | 10 (0) | NA | NA | 4 (2.3) | 2 (2) |
| Heritage Mandarin Listeners (n = 17) | 2.5 (3) | 10 (0.4) | 10 (0.9) | 8 (2.2) | 7 (2.7) | 8 (2.2) | 6 (2.4) |
| L1-Mandarin Listeners (n = 26) | 6.7 (2.3) | 8 (1.1) | 7 (1.3) | 10 (0.4) | 10 (0.2) | 8 (1.2) | 7 (2.1) |
Disclaimer/Publisher’s Note: The statements, opinions and data contained in all publications are solely those of the individual author(s) and contributor(s) and not of MDPI and/or the editor(s). MDPI and/or the editor(s) disclaim responsibility for any injury to people or property resulting from any ideas, methods, instructions or products referred to in the content. |
© 2025 by the authors. Licensee MDPI, Basel, Switzerland. This article is an open access article distributed under the terms and conditions of the Creative Commons Attribution (CC BY) license (http://creativecommons.org/licenses/by/4.0/).


