
Submitted:
29 March 2023
Posted:
29 March 2023
You are already at the latest version
Abstract
Purpose: Emotional voice conveys important social cues that demand listeners’ attention and timely processing. This event-related potential study investigated the feasibility of a multi-feature oddball paradigm to examine adult listeners’ neural responses to detecting emotional prosody changes in non-repeating naturally spoken words. Method: Thirty-three adult listeners completed the experiment by passively listening to the words in neutral and three alternating emotions while watching a silent movie. Previous research documented pre-attentive change-detection electrophysiological responses (e.g., MMN, P3a) to emotions carried by fixed syllables or words. Given that the MMN and P3a have also been shown to reflect extraction of abstract regularities over repetitive acoustic patterns, the current study employed a multi-feature oddball paradigm to compare listeners’ MMN and P3a to emotional prosody change from neutral to angry, happy, and sad emotions delivered with hundreds of non-repeating words in a single recording session. Results: Both MMN and P3a were successfully elicited by the emotional prosodic change over the varying linguistic context. Angry prosody elicited the strongest MMN compared to happy and sad prosodies. Happy prosody elicited the strongest P3a in the centro-frontal electrodes, and angry prosody elicited the smallest P3a. Conclusions: The results demonstrated that listeners were able to extract the acoustic patterns for each emotional prosody category over constantly changing spoken words. The findings confirm the feasibility of the multi-feature oddball paradigm in investigating emotional speech processing beyond simple acoustic change detection, which may potentially be applied to pediatric and clinical populations.
Keywords:
emotional prosody
; multi-feature oddball
; mismatch negativity (MMN)
; P3a
1. Introduction
Daily communication is rarely full of neutral speech. Speakers express their views and feelings through content (i.e., what is said) as well as style (i.e., how it is said), and listeners evaluate both to get the intended message properly. Emotional prosody is a stylistic vocal register that displays the speaker’s internal states by varying pitch, intensity, stress, and temporal information (Banse & Scherer, 1996). The same sentence can take on a different meaning by changing the tone. When the semantic content contradicts the emotional prosody, listeners tend to rely more on prosody to infer the meaning (Ben-David et al., 2016; Filippi et al., 2017; Kim & Sumner, 2017; Lin et al., 2020; Mehrabian & Wiener, 1967; Schirmer & Kotz, 2003).
To capture online processing of the important and fast-changing prosodic information, the time-sensitive electroencephalography (EEG) method can be used. Previous EEG studies on emotional processing focused more on the visual modality than the auditory (Grossmann et al., 2005; Thierry & Roberts, 2007). Among the few event-related potential (ERP) reports, which may require hundreds of trials for averaging the time-locked EEG responses, the speech stimuli have used fixed contrasts of vowels (Carminati et al., 2018), simple syllables (Fan et al., 2013; Hung & Cheng, 2014; Schirmer et al., 2005), or words (Jiang et al., 2014; Thönnessen et al., 2010; Zora et al., 2020). The experiments were conducted with the passive-listening oddball paradigm to examine the pre-attentive neural discriminative response for change detection, which is known as the mismatch negativity (MMN) (for a review, see Näätänen et al., 2007). In a typical MMN study, one sound is repetitively presented 80 – 90% of the time (i.e., the Standard), and this stream of sound is randomly interrupted by another sound presented at 10 – 20% of the time (i.e., the Deviant). The ERPs to the Standard (e.g., a syllable with neutral voice) and Deviant (e.g., the same syllable with happy or angry voice) are compared with the Standard ERP subtracted from the Deviant ERP to derive the MMN response to the two sounds.
Two ERP components—the mismatch negativity (MMN) and P3a—are commonly observed and analyzed in the difference ERPs to an emotional prosodic change in speech (Carminati et al., 2018; Hung & Cheng, 2014; Pakarinen et al., 2014; Wambacq & Jerger, 2004; Zora et al., 2020). The MMN typically peaks at approximately 150~200 ms after the onset of acoustic change, and it appears as a negative deflection in the difference ERPs at centro-frontal electrodes over the scalp (e.g., Fan et al., 2013; Jiang et al., 2014; Schirmer, Striano, et al., 2005; Thönnessen et al., 2010). The MMN amplitude tends to be larger with perceptually more distinct Standard and Deviant stimuli, and it is interpreted as a discrimination sensitivity index (Garrido et al., 2009; Näätänen et al., 2007). Following the MMN, the P3a is a positive deflection elicited around 350 ms after the onset of acoustic change, and it is also centro-frontally oriented (Goydke et al., 2004; Hung & Cheng, 2014; Wambacq & Jerger, 2004; Zora et al., 2020). The P3a is mainly linked to cognitive evaluation of the incoming sounds and involuntary attention to the novel auditory input (Escera et al., 2000; Escera et al., 1998; Escera et al., 2001; Näätänen et al., 2007; Polich, 2007). It has been found to be correlated with cognitive and psychosocial functioning measures (Light et al., 2007) and especially sensitive to emotional prosodic information (Carminati et al., 2018; Pakarinen et al., 2014). Zora et al. (2020) measured listeners’ P3a to both emotional prosody and linguistic prosody (i.e., word stress) and showed that the P3a amplitudes were stronger to the emotional prosody than non-emotional prosody, which suggests that the elicitation of P3a is more sensitive to affective salience of the auditory context, not just acoustic-level difference in any type of prosodic information.
Previous ERP research has typically tested only two emotional prosodies (one Standard and one Deviant) in an oddball experiment. A systematic assessment of neural sensitivities to multiple vocal emotional categories has rarely been examined in a single recording session (except Carminati et al., 2018). Furthermore, researchers have raised concerns that emotional prosodies in previous studies were delivered through a small number of fixed syllables or words, limiting the generalization of natural emotional voice processing at the neural level (Zora et al., 2020). Even though the MMN was initially linked to low-level acoustic processing, studies have shown stronger MMN amplitudes to prosodic changes in real words than pseudowords (Fan et al., 2013; Zora et al., 2020), indicating higher-level influences of cognitive processing of emotions within the linguistic context. To date, studies have successfully recorded MMNs to emotional prosodic changes from neutral to happy, fearful, or angry, demonstrating that the MMN can be a reliable neurophysiological measure to examine listeners’ neural sensitivity to affective prosodic categories over relatively simple fixed speech stimuli.
To investigate the pre-attentive neural discriminative responses to multiple emotional categories, we resorted to the multi-feature oddball paradigm (or optimal paradigm, Näätänen et al., 2004; Pakarinen et al., 2009). In a typical implementation, the multi-feature oddball paradigm limits the presentation of the Standard sound to 50% and allows different types of Deviants to equally take up the rest of the 50% sound presentation. As a trade-off, the differences among ERPs elicited by multiple deviants can sometimes be subtle and require a more sophisticated statistical modeling approach. To our knowledge, previous research has not employed the multi-feature oddball paradigm to examine MMN and P3a responses to emotional prosody change detection over non-repeating real words (only one study with 14 pseudo-words, Thönnessen et al., 2010). It remains unclear whether the listeners can automatically extract the acoustic patterns for different emotional prosodic categories across varying spoken words, which reflects a higher level of perceptual processing that better resembles the challenging listening environment in real life. The use of different spoken words as opposed to fixed repeated syllables (e.g., Hung & Cheng, 2014; Schirmer & Escoffier, 2010; Schirmer et al., 2005) or limited numbers of pseudowords (e.g., Frühholz et al., 2011) enforces listeners to extract paralinguistic category across varying lexical item contents. Even though the non-repeating word sequence created a complex acoustic context, we hypothesized that listeners would still be able to show MMN and P3a responses by building their auditory memory trace based on the emotional prosodic categories analogous to a previous MMN study demonstrating abstract lexical tone extraction from different vowels with 30 levels of intensity and pitch variations (Wang et al., 2012). Successful establishment of the protocol for emotional prosody research can provide the basis for further tests involving populations such as infants and children, who have relatively short attention span, to examine their ability to extract abstract regularities for multiple emotional prosody categories within one EEG recording session.
2. Material and methods
2.1. Participants
The participants were 33 monolingual native speakers of American English studying at the University of Minnesota. All participants (female = 22, male = 11) were right-handed (self-reported), aged between 18 and 28 (mean = 20.5), and without hearing- and language-related problems. They all had normal or corrected-to-normal vision. All participants denied any neurological disorders or significant health conditions that may impact their completion of this research study. The experimental protocol was approved by the Institutional Review Board at the University of Minnesota (Approval number: STUDY00004594). Participants signed the informed consents before the experiment, and each received $10 upon completion.
2.2. Stimuli
All speech stimuli were taken from the Toronto Emotional Speech Set (TESS, Dupuis & Pichora-Fuller, 2010), which includes 200 monosyllabic phonetically balanced words (Northwestern University Auditory Test No. 6, NU-6; Tillman & Carhart, 1966) as listed in Appendix A. Each of the 200 words was spoken in neutral, happy, sad, and angry voices by a young female speaker, yielding a total of 800 stimuli. These recordings were verified as good representations of the corresponding emotions by the same authors in an emotion recognition study (Dupuis & Fuller, 2011), with an average correct recognition score of 82% across emotions. The sounds were sampled at 24414 Hz, with the root mean square (RMS) levels equalized using PRAAT 6.0.40 (Boersma & Weenink, 2020). Table 1 summarizes the mean fundamental frequency (F0, in Hz), duration, intensity variation (dB), harmonics-to-noise ratio (HNR), and spectral centroid (Hz) in each emotional prosody, which are commonly used to characterize different vocal emotions (Amorim et al., 2019; Banse & Scherer, 1996; Johnstone & Scherer, 2000; Mani & Pätzold, 2016).
2.3. Procedure
There were a total of 600 trials in the experiment. The Standard stimuli were the 200 words in a neutral tone (50% probability, randomly presented for 300 trials). Three emotional voices (angry, happy, sad) served as Deviant stimuli (each presented with 16.7% probability, 100 trials). For each Deviant type, 100 words were randomly selected. The sounds were presented in alternating fashion with no consecutive Deviants trials in the same emotional prosody (Figure 1). The inter-stimulus interval (ISI) was randomized between 800 – 900 ms, and the total recording time was around 25 minutes.
Participants were seated in an electrically and acoustically treated booth (ETS-Lindgren Acoustic Systems). They were instructed to ignore the speech sounds and focus on a silent movie with subtitles during EEG recording. The speech sounds were played via two loudspeakers (M-audio BX8a) placed at a 45-degree azimuth angle 3 feet away from the participants and presented at 55 dB SL relative to the individual listener’s hearing threshold with a reference tone of 1 kHz (Koerner & Zhang, 2015). The sound presentation was controlled by E-Prime (Psychological Software Tools, Inc) using a Dell PC outside the sound-treated room. Continuous EEG data were recorded through the Advanced Neuro Technology EEG System. Its WaveGuard EEG cap has a layout of 64 Ag/AgCl electrodes following the standard International 10-20 Montage system with intermediate locations. The default bandpass filter for raw data recording was set between 0.016 Hz to 200 Hz, and the sampling rate was 512 Hz. The electrode AFz served as the ground electrode. The impedance of all electrodes was kept under 5 kΩ.
2.4. Data processing and analysis
The raw EEG data was downsampled to 250 Hz offline with EEGLAB v14.1.1 (Delorme & Makeig, 2004). The low-pass filter was at 30 Hz, and high-pass filtered at 0.5 Hz. The data were then re-referenced to the average of the two mastoid electrodes. To attenuate artifacts such as low-frequency drift, muscle activity and eye blinks, the “Clean_rawdata” EEGLAB plug-in and Independent Component Analysis (ICA) algorithm (Dammers et al., 2008; Delorme et al., 2001) were adopted. ERP epochs were then extracted from 100 ms pre-stimulus onset to 1000 ms post-stimulus onset with baseline correction. Epochs containing data points over the range of ±100.0 μV were rejected before averaging. The accepted numbers of trials for each emotional prosody were 276 for neutral (Standard), 91 for angry (Deviant), 89 for happy (Deviant), and 91 for sad (Deviant) on average. Using ERPLAB v7.0.0 (Lopez-Calderon & Luck, 2014), event-related potentials (ERPs) were averaged for Standard (neutral prosody) and each three types of the Deviant (angry, happy, and sad prosodies). Difference waveforms were then derived by subtracting the Standard ERP for neutral voice from each Deviant ERP.
Statistical analyses were completed in R (https://www.r-project.org/) with the packages “lme4” (Bates et al., 2015), “lmerTest” (Kuznetsova et al., 2017), and “emmeans” (Lenth et al., 2018). The difference waveforms were used for assessing the MMN (200 – 300 ms) and P3a (350 – 450 ms) components. The time window selections were based on previous ERP studies (Pakarinen et al., 2014; Thönnessen et al., 2010; Zora et al., 2020) and visual inspection of the grand average difference waveforms. ERP amplitude quantification was calculated as the mean voltages of the 40 ms peak (20 ms before and after the peak value) of the difference waveforms. First, separate one-tail t-tests were run to verify the presence of MMN and P3a responses to each emotion with Bonferroni correction for multiple comparisons. The mean voltage of MMN is tested against the null hypothesis that it is larger or equal to zero (micro-voltage), because MMN is established as a negative-deflected component. The mean voltage of P3a is tested against the null hypothesis that it is smaller or equal to zero (micro-voltage), for P3a being a positive-deflected component. Next, linear mixed-effect models (ERP amplitude data ~ Emotion + Region + Laterality + (1 | Participant) were respectively implemented on MMN and P3a amplitudes. Each model included by-participant intercept as a random-effect factor. Emotion (angry, happy, and sad), region of the electrode (anterior, central, and parietal), and laterality of the electrode (left, middle, and right) were included as fixed-effect factors. Categorical variables were coded as orthogonal contrasts. Model assumptions of linearity, normality, and variance homogeneity were checked for MMN and P3a values.
3. Results
The average ERP waveforms showed distinct MMN and P3a peaks to the change detection of each emotional prosody (Figure 2 and Figure 3). The presence of MMN activities to each emotion was verified by MMN amplitudes being significantly more negative than zero. MMN components were verified for angry deviant (t(32) = -4.83, p < .001, d = -0.84), happy deviant (t(32) = -4.4, p < .001, d = -0.77), and sad deviant (t(32) = -4.1, p < .001, d = -0.71). Linear mixed effects model (Table 2 in Appendix B) showed a main effect of emotion (F(2,858) = 13.81, p < .001), but non-significant main effects of electrode region (F(2,858) = 2.17, p = 0.11) and electrode laterality (F(2,858) = 0.24, p = 0.79). Pairwise comparisons showed stronger MMN values to angry prosody than happy (-0.35 μV, p = .001) and sad prosodies (-0.4 μV, p < .001) (Figure 4).
Significance of P3a responses to each emotion was verified by demonstrating that P3a amplitudes were significantly more positive than zero. P3a components were verified for angry deviant (t(32) = -4.65, p < .001, d = 0.81), happy deviant (t(32) = 9.5, p < .001, d = 1.65), and sad deviant (t(32) = 9.03, p < .001, d = 1.57). Linear mixed effects model (Table 3 in Appendix C) showed main effects of emotion (F(2,858) = 38.05, p < .001) and electrode region (F(2,858) = 31.81 , p < .001), but non-significant main effect of electrode laterality (F(2,858) = 1.60, p = 0.20). Pairwise comparisons showed stronger P3a amplitudes to happy prosody than angry (0.76 μV, p < .001) and sad prosodies (0.5 μV, p < .001), and stronger P3a to sad than angry (0.26 μV, p = .01). Moreover, P3a was stronger at frontal (0.63 μV, p < .001) and central (0.58 μV, p < .001) regions compared with the posterior region (Figure 5).
4. Discussion
Emotional prosody in natural speech is a crucial social cue that listeners detect efficiently for effective interpersonal communication. But it has not received as much attention in ERP research as facial emotional expression. In this study, we employed a multi-feature auditory oddball paradigm to examine neural responses to emotional prosody changes. Unlike previous studies using limited and fixed speech sounds, we adopted roving stimulus presentation with varying spoken words to deliver natural emotional prosodies that are usually embedded in complex language contexts in real life. The MMN and P3a responses to the three emotional deviants—angry, happy, and sad voices demonstrated that listeners successfully extracted emotional prosodic information from the non-repeating spoken words.
4.1. MMN: Angry Voices Elicited the Strongest Response
The strongest MMN response was observed when the background voice changed from neutral to angry. This may reflect heightened automatic processing of the ambient high-arousal negative emotional sounds, even if the listeners were not paying attention to the auditory events. The early time window of MMN (around 200 ms after sound onset) also implies that the pre-attentive sensory processing is activated when the affective signals change. The early enhanced response to emotions such as anger or fear, so-called “negative bias,” is considered essential for survival because these sounds are usually associated with immediate threat or danger (Adolphs, 2002; Scherer, 1989; Schirmer, Striano, et al., 2005). Our results align with the notion of negativity bias response, and similar results have been shown in an earlier EEG study (Carminati et al., 2018).
4.2. P3a: Happy Voices Elicited the Strongest Response
The P3a response was centro-frontally oriented, consistent with the topographic distribution of the classical P3a (Polich, 2007; SanMiguel et al., 2010). As an involuntary neural response following the MMN, the P3a reflects listeners’ involuntary attentional shift to the novel auditory input in the background and involves some signal appraisal. Among the three emotional deviants, our listeners showed the strongest P3a to the happy voice. Previous reports mainly focused on the enhanced P3a component to general affective information but seldom inspected P3a differences for each emotional prosody (Jiang et al., 2014; Pakarinen et al., 2014; Thönnessen et al., 2010; Zora et al., 2020). One study by Pinheiro et al. (2017) used laughter and growl to present happy and angry voices, and they asked participants to pay attention to the sounds during the EEG recording. Their results showed enhanced positive deflection to laughter at 350 – 450 ms after the sound onset, similar to the time window of our P3a component. Another report presented different emotional prosodies over French vowels and observed stronger P3a to the happy voice than sad and neutral voices (Carminati et al., 2018). Along with our results showing increased P3a to happy prosody than angry and sad prosodies over non-repeating spoken words, listeners may involuntarily orient their attention to positive information more than negative ones after the initial sensory processing stage (i.e., MMN).
In contrast, angry voices elicited the smallest P3a in comparison with happy and sad prosodies. The current results differed from Pakarinen and colleagues (2014), who showed similar P3a amplitudes across angry and sad emotions. There are two notable distinctions in the experimental design between our study and Pakarinen et al. (2014). First, their multi-feature oddball paradigm focused on speech- or linguistic-level deviants (e.g., spectral density, frequency, intensity, sound-source location , noise level, consonant duration, omission, vowel change, or the vowel duration) and only introduced the three emotions as rare events (i.e., not deviants). Second, our current experiment tested P3a to emotional prosody categories in varying spoken words, creating a different listening context than the fixed syllables used by Pakarinen et al. (2014).
4.3. Limitations and Future Directions
The current study is of limited scope with several limitations. First, we only included speech stimuli from female speakers because the emotional speech set of phonetically balanced words only contains female-voice recordings (Dupuis & Pichora-Fuller, 2010). One neurophysiological study demonstrated that listeners showed early differentiation of emotional prosody information regardless of the speakers’ gender (Paulmann & Kotz, 2008). A recent behavioral study observed a modulatory effect of encoder gender of the speech stimuli on listeners’ emotional prosody recognition (Lin et al., 2021). In this regard, including both female and male emotional voices in the stimuli can provide a more fine-grained view on listeners’ neural sensitivities to natural emotional speech prosody and the potential influences of the gender of the speaker.
Second, we incorporated non-repeating real words to create a more perceptually changing linguistic context for extracting acoustic patterns for the target emotional prosody categories. Even though we carefully selected a phonetically-balanced word list to control phonetic-level acoustic variations across emotional voices, the paralinguistic features such as pitch, intensity variation, or word durations still co-vary with different emotional prosodies. Singling out each acoustic feature in emotional voices and testing each of them may not be realistic, because emotional prosody is essentially a collective of all the relevant acoustic properties (Bachorowski & Owren, 2008; Banse & Scherer, 1996; Johnstone & Scherer, 2000). One solution is to create four oddball tasks and use each of the neutral, angry, happy, and sad prosodies as the standard sound, and compare standard and deviant sounds of the same emotion across tasks. This solution may not be the optimal one because it contradicts our purpose to establish an efficient testing protocol to record MMN and P3a to multiple emotional deviants that could potentially be applied to clinical and pediatric populations without requiring focused attention and extended hours of EEG recording. Nonetheless, a follow-up study with several multi-oddball recording sessions will still be valuable to verify the findings about the MMN and P3a components to the three emotional voices as measured in the current study.
Another limitation is that although we verified the feasibility of the modified multi-feature oddball protocol, the current paradigm does not fully leverage the temporal advantage of neurophysiological responses to address different processing stages of emotional prosody recognition motivated by a full theoretical model. Emotional prosody is decoded rapidly in human brains and can be categorized into three stages–sensory analysis, derivation of emotional meanings, and emotion evaluation (Kotz & Paulmann, 2011). Due to the millisecond temporal resolution advantage, the electrophysiological measures have the advantage of recording the rapid processing time-course underlying emotion recognition in a spoken language context. The distinct MMN and P3a components measured in the current report are known to be related to sensory comparison (Schirmer et al., 2005) and context derivation (Wambacq & Jerger, 2004) respectively in emotional speech processing. The distinct patterns of the MMN-P3a sequence of different emotions also suggest that the sensory and emotion derivation stages may differ across emotions. However, the setup of the current modified paradigm aimed to record the processing stages during a passive listening task, rather than during a volitional emotion recognition task involving both implicit and explicit processing conditions (e.g., Lin et al., 2022). Therefore, it may be premature to conclude that our pre-attentive system is more biased toward angry voices in the early processing stages (stronger MMN) and happy voices in the later stage (stronger P3a).
As our sample size (33) is rather small, we kept the mixed effects models simple with a random-intercept factor for accounting for inter-subject differences and did not include a by-participant random-slope factor to account for intra-subject contrasts for the emotional categories (Hox & McNeish, 2020). However, full multilevel models with random-intercept and random-slope factors would be more desirable with a larger sample to avoid biases and inflation of evidence (Barr et al., 2013).
Our roving stimulus presentation in the multi-feature oddball protocol and the findings add to the existing literature on neural sensitivities to emotional prosody have used a wide range of lexical items such as vowels (Carminati et al., 2018), simple syllables (Hung & Cheng, 2014; Pakarinen et al., 2014; Schirmer & Escoffier, 2010; Schirmer et al., 2005), limited numbers of words (Jiang et al., 2014; Thönnessen et al., 2010), or non-speech sounds (Thierry & Roberts, 2007). The elicitation and confirmation of these two components at both the individual- and group-level demonstrated feasibility of our multi-feature oddball protocol in the context of high acoustic variations in the linguistic domain (i.e., non-repeating real words). More importantly, this time-efficient design of testing three emotional deviants in one task did not appear to compromise the target ERP components for emotional prosodic change detection. Our results also corroborate the findings that the MMN response reflects not only the simple detection of acoustic change (e.g., Pakarinen et al., 2009; Tavakoli & Campbell, 2016) but also the change at higher-level abstract category (Jiang et al., 2014; Näätänen et al., 2001; Picton et al., 2000; Zora et al., 2020). Notably, the MMN and P3a patterns in our study cannot be simply attributed to lower-level responses to acoustic change detection as the stimulus properties showed the largest mean f0 deviation by the Happy prosody (15.9%), largest mean duration deviation by the Sad prosody (23.2%), and largest intensity variation deviation by the Angry prosody (2.1 dB) in comparison with Neutral (Table 1). Collectively, these data not only confirmed the feasibility of the neurophysiological approach but also provide in-depth evidence on how the human pre-attentive system captures the change of incoming abstract emotional prosody categories in a highly dynamic speech context. Understanding how the involuntary attentional system is triggered in early stages of emotional prosody processing has important implications for future developmental and clinical studies (Paris et al., 2018; Zhang et al., 2021). For instance, Kostilainen and researchers (2020) applied a similar paradigm to examine preterm infants’ neural responses to phonetic and emotional information in speech, and they successfully recorded distinct responses to different sounds from them. Future studies can focus on the emotional dimension of speech and record the neural representations of emotional voices in newborns and older infants to characterize the development trend of emotional processing. Another study by Charpentier and colleagues (2018) tested children with autism using the vowel /a/ in different emotions, and they observed different MMN and P3a characteristics in children with autism. Future studies can employ more complex stimuli as implemented in our modified multi-feature oddball paradigm to further examine the online processing of emotional speech information in children with autism.
5. Conclusions
Using a passive listening multi-feature oddball paradigm, we assessed listeners’ pre-attentive neural sensitivity in extracting and discriminating three affective prosodic categories against neutral voice across roving stimuli of non-repeating spoken words and the following involuntary orientation to prosodic contrasts. The successful elicitation of the target ERP components with the strongest MMN for angry voice and strongest P3a for happy voice provides the impetus to extend the paradigm to testing infants, children, and individuals with difficulties in affective speech processing (Ding & Zhang, 2023). Future work is needed to determine the functional significance of MMN and P3a responses to emotional prosody in this paradigm that may explain individual behavioral differences and developmental changes.
Funding
This work was partly supported by University of Minnesota’s Interdisciplinary Doctoral Fellowship, the Bryng Bryngelson Fund from the Department of Speech-Language-Hearing Sciences, and Dissertation Fellowship, Brain Imaging Grant and SEED Grant from the College of Liberal Arts.
Data Availability Statement
The data for the current study are available from the corresponding author on reasonable request.
Acknowledgements
We would like to thank Jessica Tichy, Kailie McGuigan, Corrin Murray, Natasha Stark, Shannon Hofer-Pottala, Emily Krattley, and Hayley Levenhagen for the help with data collection.
Declaration of interest
None.
Appendix A

Table 1.
Two hundred phonetically balanced monosyllabic words from Northwestern University Auditory Test No. 6, NU-6 (Tillman & Carhart, 1966).
Table 1.
Two hundred phonetically balanced monosyllabic words from Northwestern University Auditory Test No. 6, NU-6 (Tillman & Carhart, 1966).
| Back Bar Base Bath Bean Beg Bite Boat Bone Book Bought Burn Cab Calm Came Cause Chain Chair Chalk Chat |
Check Cheek Chief Choice Cool Dab Date Dead Death Deep Dime Dip Ditch Dodge Dog Doll Door Fail Fall Far |
Fat Fit Five Food Gap Gas Gaze Germ Get Gin Goal Good Goose Gun Half Hall Hash Hate Have Haze |
Hire Hit Hole Home Hurl Hush Jail Jar Join Judge Jug Juice Keen Keep Keg Kick Kill King Kite Knock |
Late Laud Lean Learn Lease Lid Life Limb Live Loaf Long Lore Lose Lot Love Luck Make Match Merge Mess |
Met Mill Mob Mode Mood Moon Mop Mouse Nag Name Near Neat Nice Note Numb Pad Page Pain Pass Pearl |
Peg Perch Phone Pick Pike Pole Pool Puff Rag Raid Rain Raise Rat Reach Read Red Ring Ripe Road Room |
Rose Rot Rough Rush Said Sail Search Seize Sell Shack Shall Shawl Sheep Shirt Should Shout Size Soap Soup Sour |
South Sub Such Sure Take Talk Tape Team Tell Thin Third Thought Thumb Time Tip Tire Ton Tool Tough Turn |
Vine Voice Void Vote Wag Walk Wash Week Wheat When Which Whip White Wife Wire Witch Yearn Yes Young Youth |
Appendix B
Table 2.
Summary of the linear mixed-effect model with MMN as the dependent variable.
| Factor | Estimate | SE | df | t value | p |
|---|---|---|---|---|---|
| Intercept | -0.89 | 0.16 | 63.68 | -5.72 | < .001*** |
| Emotion | |||||
| Angry | -0.35 | 0.08 | 858 | -4.25 | < .001*** |
| Sad | 0.05 | 0.08 | 858 | 0.56 | 0.58 |
| Region | |||||
| Frontal | 0.09 | 0.08 | 858 | 1.12 | 0.26 |
| Posterior | 0.17 | 0.08 | 858 | 2.10 | 0.04* |
| Laterality | |||||
| Middle | -0.01 | 0.08 | 858 | -0.09 | 0.93 |
| Right | 0.05 | 0.08 | 858 | 0.55 | 0.59 |
Appendix C
Table 3.
Summary of the linear mixed-effect model with P3a as the dependent variable.
| Factor | Estimate | SE | df | t value | p |
|---|---|---|---|---|---|
| Intercept | 1.96 | 0.14 | 82.33 | 13.51 | < .001 *** |
| Emotion | |||||
| Angry | -0.76 | 0.09 | 858 | -8.58 | < .001 *** |
| Sad | -0.50 | 0.09 | 858 | -5.65 | < .001 *** |
| Region | |||||
| Frontal | 0.05 | 0.09 | 858 | 0.53 | 0.60 |
| Posterior | -0.58 | 0.09 | 858 | -6.63 | < .001 *** |
| Laterality | |||||
| Middle | 0.10 | 0.09 | 858 | 1.11 | 0.27 |
| Right | -0.06 | 0.09 | 858 | -0.66 | 0.51 |
References
- Adolphs, R. (2002). Neural Systems for Recognizing Emotion. Current Opinion in Neurobiology, 12(2), 169-177. [CrossRef]
- Amorim, M. , Anikin, A., Mendes, A. J., Lima, C. F., Kotz, S. A., & Pinheiro, A. P. (2019). Changes in Vocal Emotion Recognition across the Life Span. Emotion. [CrossRef]
- Bachorowski, J.-A. , & Owren, M. J. (2008). Vocal Expressions of Emotion. Handbook of emotions. 3, 196–210.
- Banse, R., Scherer, K. R. (1996). Acoustic Profiles in Vocal Emotion Expression. Journal of Personality and Social Psychology, 70(3), 614. [CrossRef]
- Barr, D. J. , Levy, R., Scheepers, C., & Tily, H. J. (2013). Random effects structure for confirmatory hypothesis testing: Keep it maximal. Journal of Memory and Language, 68(3), 255-278. [CrossRef]
- Bates, D. , Maechler, M., Bolker, B., Walker, S., Christensen, R. H. B., Singmann, H., Dai, B., Grothendieck, G., Green, P., & Bolker, M. B. (2015). Package ‘Lme4’. Convergence.
- Ben-David, B. M. , Multani, N., Shakuf, V., Rudzicz, F., & van Lieshout, P. H. (2016). Prosody and Semantics Are Separate but Not Separable Channels in the Perception of Emotional Speech: Test for Rating of Emotions in Speech. Journal of Speech, Language, and Hearing Research, 59(1), 72-89. https://jslhr.pubs.asha.org/data/journals/jslhr/935053/jslhr_59_1_72.pdf.
- Boersma, P. , & Weenink, D. (2020). Praat: Doing Phonetics by Computer [Computer Program]. Version 6.1.09.
- Carminati, M. , Fiori-Duharcourt, N., & Isel, F. (2018). Neurophysiological Differentiation between Preattentive and Attentive Processing of Emotional Expressions on French Vowels. Biological Psychology, 132, 55-63.
- Charpentier, J. , Kovarski, K., Roux, S., Houy-Durand, E., Saby, A., Bonnet-Brilhault, F., Latinus, M., & Gomot, M. (2018). Brain Mechanisms Involved in Angry Prosody Change Detection in School-Age Children and Adults, Revealed by Electrophysiology. Cognitive, Affective, & Behavioral Neuroscience, 18(4), 748-763.
- Dammers, J. , Schiek, M., Boers, F., Silex, C., Zvyagintsev, M., Pietrzyk, U., & Mathiak, K. (2008). Integration of Amplitude and Phase Statistics for Complete Artifact Removal in Independent Components of Neuromagnetic Recordings. IEEE Transactions on Biomedical Engineering. ( 55(10), 2353–2362. [PubMed]
- Delorme, A. , & Makeig, S. (2004). Eeglab: An Open Source Toolbox for Analysis of Single-Trial Eeg Dynamics Including Independent Component Analysis. Journal of Neuroscience Methods, 134(1), 9-21. [CrossRef]
- Delorme, A. , Makeig, S., & Sejnowski, T. (2001). Automatic Artifact Rejection for EEG Data Using High-Order Statistics and Independent Component Analysis. Proceedings of the third international ICA conference.
- Ding, H. , & Zhang, Y. (2023). Speech Prosody in Mental Disorders. Annual Review of Linguistics. [CrossRef]
- Dupuis, K. , & Pichora-Fuller, M. K. (2010). Toronto Emotional Speech Set (Tess). [CrossRef]
- Dupuis, K. , & Pichora-Fuller, M. K. (2011). Recognition of emotional speech for younger and older talkers: Behavioural findings from the toronto emotional speech set. Canadian Acoustics.
- Escera, C. , Alho, K., Schröger, E., & Winkler, I. W. (2000). Involuntary Attention and Distractibility as Evaluated with Event-Related Brain Potentials. Audiology and Neurotology.
- Escera, C. , Alho, K., Winkler, I., & Näätänen, R. (1998). Neural Mechanisms of Involuntary Attention to Acoustic Novelty and Change. ( 10(5), 590–604. [PubMed]
- Escera, C. , Yago, E., & Alho, K. (2001). Electrical Responses Reveal the Temporal Dynamics of Brain Events During Involuntary Attention Switching. ( 14(5), 877–883. [PubMed]
- Filippi, P. , Ocklenburg, S., Bowling, D. L., Heege, L., Güntürkün, O., Newen, A., & de Boer, B. (2017). More Than Words (and Faces): Evidence for a Stroop Effect of Prosody in Emotion Word Processing. Cognition and Emotion.
- Frühholz, S. , Ceravolo, L., & Grandjean, D. (2011). Specific Brain Networks During Explicit and Implicit Decoding of Emotional Prosody. ( 22(5), 1107–1117. [CrossRef] [PubMed]
- Garrido, M. I. , Kilner, J. M., Stephan, K. E., & Friston, K. J. (2009). The Mismatch Negativity: A Review of Underlying Mechanisms. Clinical Neurophysiology.
- Goydke, K. N. , Altenmüller, E., Möller, J., & Münte, T. F. (2004). Changes in Emotional Tone and Instrumental Timbre Are Reflected by the Mismatch Negativity. F. ( 21(3), 351–359.
- Grossmann, T. , Striano, T., & Friederici, A. D. (2005). Infants' Electric Brain Responses to Emotional Prosody. NeuroReport: For Rapid Communication of Neuroscience Research, 1828. [Google Scholar] [CrossRef]
- Hox, J. , & McNeish, D. (2020). Small samples in multilevel modeling. In R. van de Schoot & M. Milocevic (Eds.), Small Sample Size Solutions (pp. 215–225). Routledge. [CrossRef]
- Jiang, A. , Yang, J., & Yang, Y. (2014). MMN Responses During Implicit Processing of Changes in Emotional Prosody: An ERP Study Using Chinese Pseudo-Syllables. Cognitive Neurodynamics.
- Johnstone, T. , & Scherer, K. R. (2000). Vocal Communication of Emotion. R. ( 2, 220–235.
- Kim, S. K. , & Sumner, M. (2017). Beyond Lexical Meaning: The Effect of Emotional Prosody on Spoken Word Recognition. The Journal of the Acoustical Society of America.
- Koerner, T. K. , & Zhang, Y. (2015). Effects of Background Noise on Inter-Trial Phase Coherence and Auditory N1–P2 Responses to Speech Stimuli. Hearing Research.
- Kostilainen, K. , Partanen, E., Mikkola, K., Wikström, V., Pakarinen, S., Fellman, V., & Huotilainen, M. (2020). Neural processing of changes in phonetic and emotional speech sounds and tones in preterm infants at term age. ( 148, 111–118.
- <named-content content-type="background:white">Kotz, S. A. , & Paulmann, S. (2011). Emotion, Language, and the Brain. ( 5(3), 108–125.
- Kuznetsova, A. , Brockhoff, P. B., & Christensen, R. H. B. (2017). LmerTest Package: Tests in Linear Mixed Effects Models. Journal of Statistical Software. [CrossRef]
- Lenth, R. , Singmann, H., Love, J., Buerkner, P., & Herve, M. (2018). Emmeans: Estimated Marginal Means, Aka Least-Squares Means. R Package Version.
- Light, G. A. , Swerdlow, N. R., & Braff, D. L. (2007). Preattentive sensory processing as indexed by the MMN and P3a brain responses is associated with cognitive and psychosocial functioning in healthy adults. L. ( 19(10), 1624–1632. [CrossRef]
- Lin, Y. , Ding, H., & Zhang, Y. (2020). Prosody Dominates over Semantics in Emotion Word Processing: Evidence from Cross-Channel and Cross-Modal Stroop Effects. Journal of Speech, Language, and Hearing Research.
- Lin, Y. , Fan, X., Chen, Y., Zhang, H., Chen, F., Zhang, H., Ding, H., & Zhang, Y. (2022). Neurocognitive Dynamics of Prosodic Salience over Semantics during Explicit and Implicit Processing of Basic Emotions in Spoken Words. ( 12(12), 1706. [CrossRef]
- Lopez-Calderon, J. , & Luck, S. J. (2014). ERPLAB: An Open-Source Toolbox for the Analysis of Event-Related Potentials. Frontiers in Human Neuroscience.
- Mani, N. , & Pätzold, W. (2016). Sixteen-Month-Old Infants’ Segment Words from Infant-and Adult-Directed Speech. Language Learning and Development. [CrossRef]
- Mehrabian, A. , & Wiener, M. (1967). Decoding of Inconsistent Communications. ( 6(1), 109.
- Näätänen, R. , Paavilainen, P., Rinne, T., & Alho, K. (2007). The Mismatch Negativity (MMN) in Basic Research of Central Auditory Processing: A Review. Clinical Neurophysiology, 2544. [Google Scholar]
- Näätänen, R. , Pakarinen, S., Rinne, T., & Takegata, R. (2004). The Mismatch Negativity (MMN): Towards the Optimal Paradigm. Clinical Neurophysiology.
- Näätänen, R. , Tervaniemi, M., Sussman, E., Paavilainen, P., & Winkler, I. (2001). ‘Primitive Intelligence’in the Auditory Cortex. Trends in Neurosciences.
- Pakarinen, S. , Lovio, R., Huotilainen, M., Alku, P., Näätänen, R., & Kujala, T. (2009). Fast Multi-Feature Paradigm for Recording Several Mismatch Negativities (MMNs) to Phonetic and Acoustic Changes in Speech Sounds. Biological Psychology.
- Pakarinen, S. , Sokka, L., Leinikka, M., Henelius, A., Korpela, J., & Huotilainen, M. (2014). Fast Determination of MMN and P3a Responses to Linguistically and Emotionally Relevant Changes in Pseudoword Stimuli. ( 577, 28–33. [PubMed]
- Paris, M. , Mahajan, Y., Kim, J., & Meade, T. (2018). Emotional Speech Processing Deficits in Bipolar Disorder: The Role of Mismatch Negativity and P3a. Journal of Affective Disorders.
- Paulmann, S. , & Kotz, S. A. (2008). Early Emotional Prosody Perception Based on Different Speaker Voices. Neuroreport.
- Picton, T. W. , Alain, C., Otten, L., Ritter, W., & Achim, A. (2000). Mismatch Negativity: Different Water in the Same River. Audiology and Neurotology.
- Pinheiro, A. P. , Barros, C., Dias, M., & Kotz, S. A. (2017). Laughter Catches Attention! Biological Psychology. [CrossRef]
- Polich, J. (2007). Updating P300: An Integrative Theory of P3a and P3b. Clinical Neurophysiology, 2128. [Google Scholar]
- SanMiguel, I. , Morgan, H. M., Klein, C., Linden, D., & Escera, C. (2010). On the Functional Significance of Novelty-P3: Facilitation by Unexpected Novel Sounds. Biological Psychology. [CrossRef]
- Scherer, K. R. (1989). Vocal Correlates of Emotional Arousal and Affective Disturbance. In Handbook of Social Psychophysiology. (pp. 165-197). John Wiley & Sons.
- Schirmer, A. , & Escoffier, N. (2010). Emotional MMN: Anxiety and Heart Rate Correlate with the ERP Signature for Auditory Change Detection. Clinical Neurophysiology.
- Schirmer, A. , & Kotz, S. A. (2003). Erp Evidence for a Sex-Specific Stroop Effect in Emotional Speech. Journal of Cognitive Neuroscience, 1148. [Google Scholar]
- Schirmer, A. , Striano, T., & Friederici, A. D. (2005). Sex Differences in the Preattentive Processing of Vocal Emotional Expressions. D. ( 16(6), 635–639.
- <named-content content-type="background:white">Tavakoli, P. 55. Tavakoli, P., & Campbell, K. (2016). Can an Auditory Multi-Feature Optimal Paradigm be Used for the Study of Processes Associated with Attention Capture in Passive Listeners? Brain Research.
- Thierry, G. , & Roberts, M. V. (2007). Event-Related Potential Study of Attention Capture by Affective Sounds. Neuroreport.
- Thönnessen, H. , Boers, F., Dammers, J., Chen, Y.-H., Norra, C., & Mathiak, K. (2010). Early Sensory Encoding of Affective Prosody: Neuromagnetic Tomography of Emotional Category Changes. Neuroimage.
- Tillman, T. W. , & Carhart, R. (1966). An Expanded Test for Speech Discrimination Utilizing CNC Monosyllabic Words: Northwestern University Auditory Test No. 6.
- Wambacq, I. J. , & Jerger, J. F. (2004). Processing of Affective Prosody and Lexical-Semantics in Spoken Utterances as Differentiated by Event-Related Potentials. Cognitive Brain Research.
- Wang, X. D. , Gu, F,, He, K,, Chen, L. H., & Chen, L. (2012). Preattentive Extraction of Abstract Auditory Rules in Speech Sound Stream: A Mismatch Negativity Study Using Lexical Tones. PLOS ONE.
- Zhang, M. , Xu, S., Chen, Y., Lin, Y., Ding, H., & Zhang, Y. (2021). Recognition of Affective Prosody in Autism Spectrum Conditions: A Systematic Review and Meta-Analysis. Autism, 1995. [Google Scholar]
- Zora, H. , Rudner, M., & Montell Magnusson, A. K. (2020). Concurrent Affective and Linguistic Prosody with the Same Emotional Valence Elicits a Late Positive ERP Response. K. ( 51(11), 2236–2249.
Figure 1.
A schematic example of the order of the trials. The Standard (neutral prosody) and Deviant (angry, happy, and sad prosodies) were always alternating, and the three emotions (Deviants) were pseudo-randomly interspersed. [Figure 1]
Figure 1.
A schematic example of the order of the trials. The Standard (neutral prosody) and Deviant (angry, happy, and sad prosodies) were always alternating, and the three emotions (Deviants) were pseudo-randomly interspersed. [Figure 1]
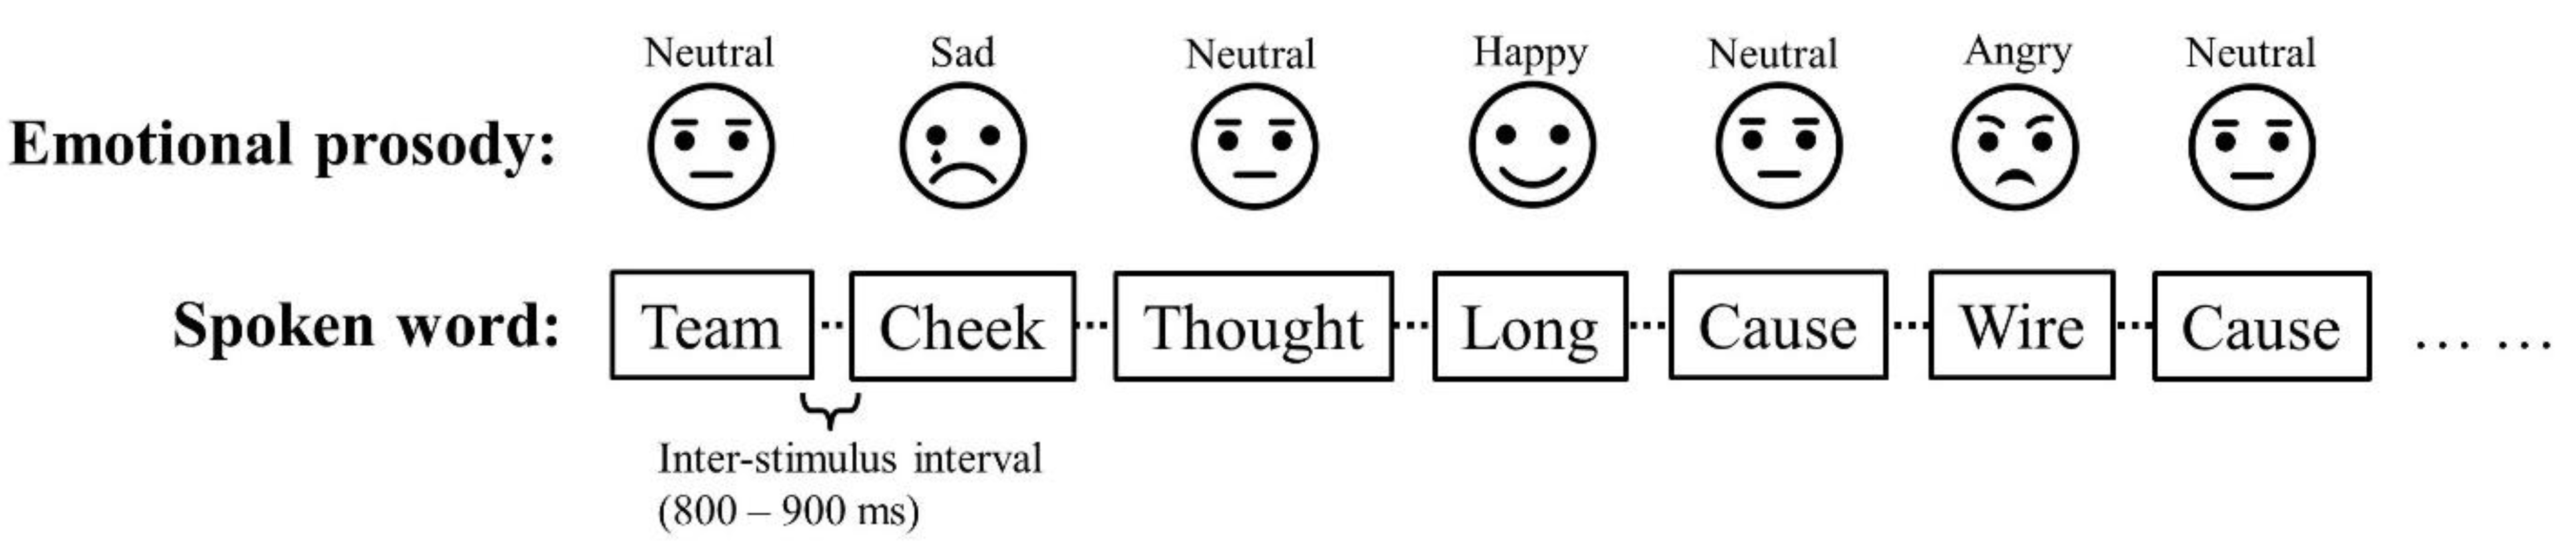
Figure 2.
The grand mean event-related potential (ERP) waveforms of Standard (neutral prosody) and Deviants (angry, happy, and sad), and grand mean difference waveforms of angry, happy, and sad for all listeners. Mean amplitudes of the midline electrodes (Fz, Cz, Pz) were used for the waveforms. The gray shaded areas mark the windows for MMN (200 – 300 ms) and P3a (350 – 450 ms).
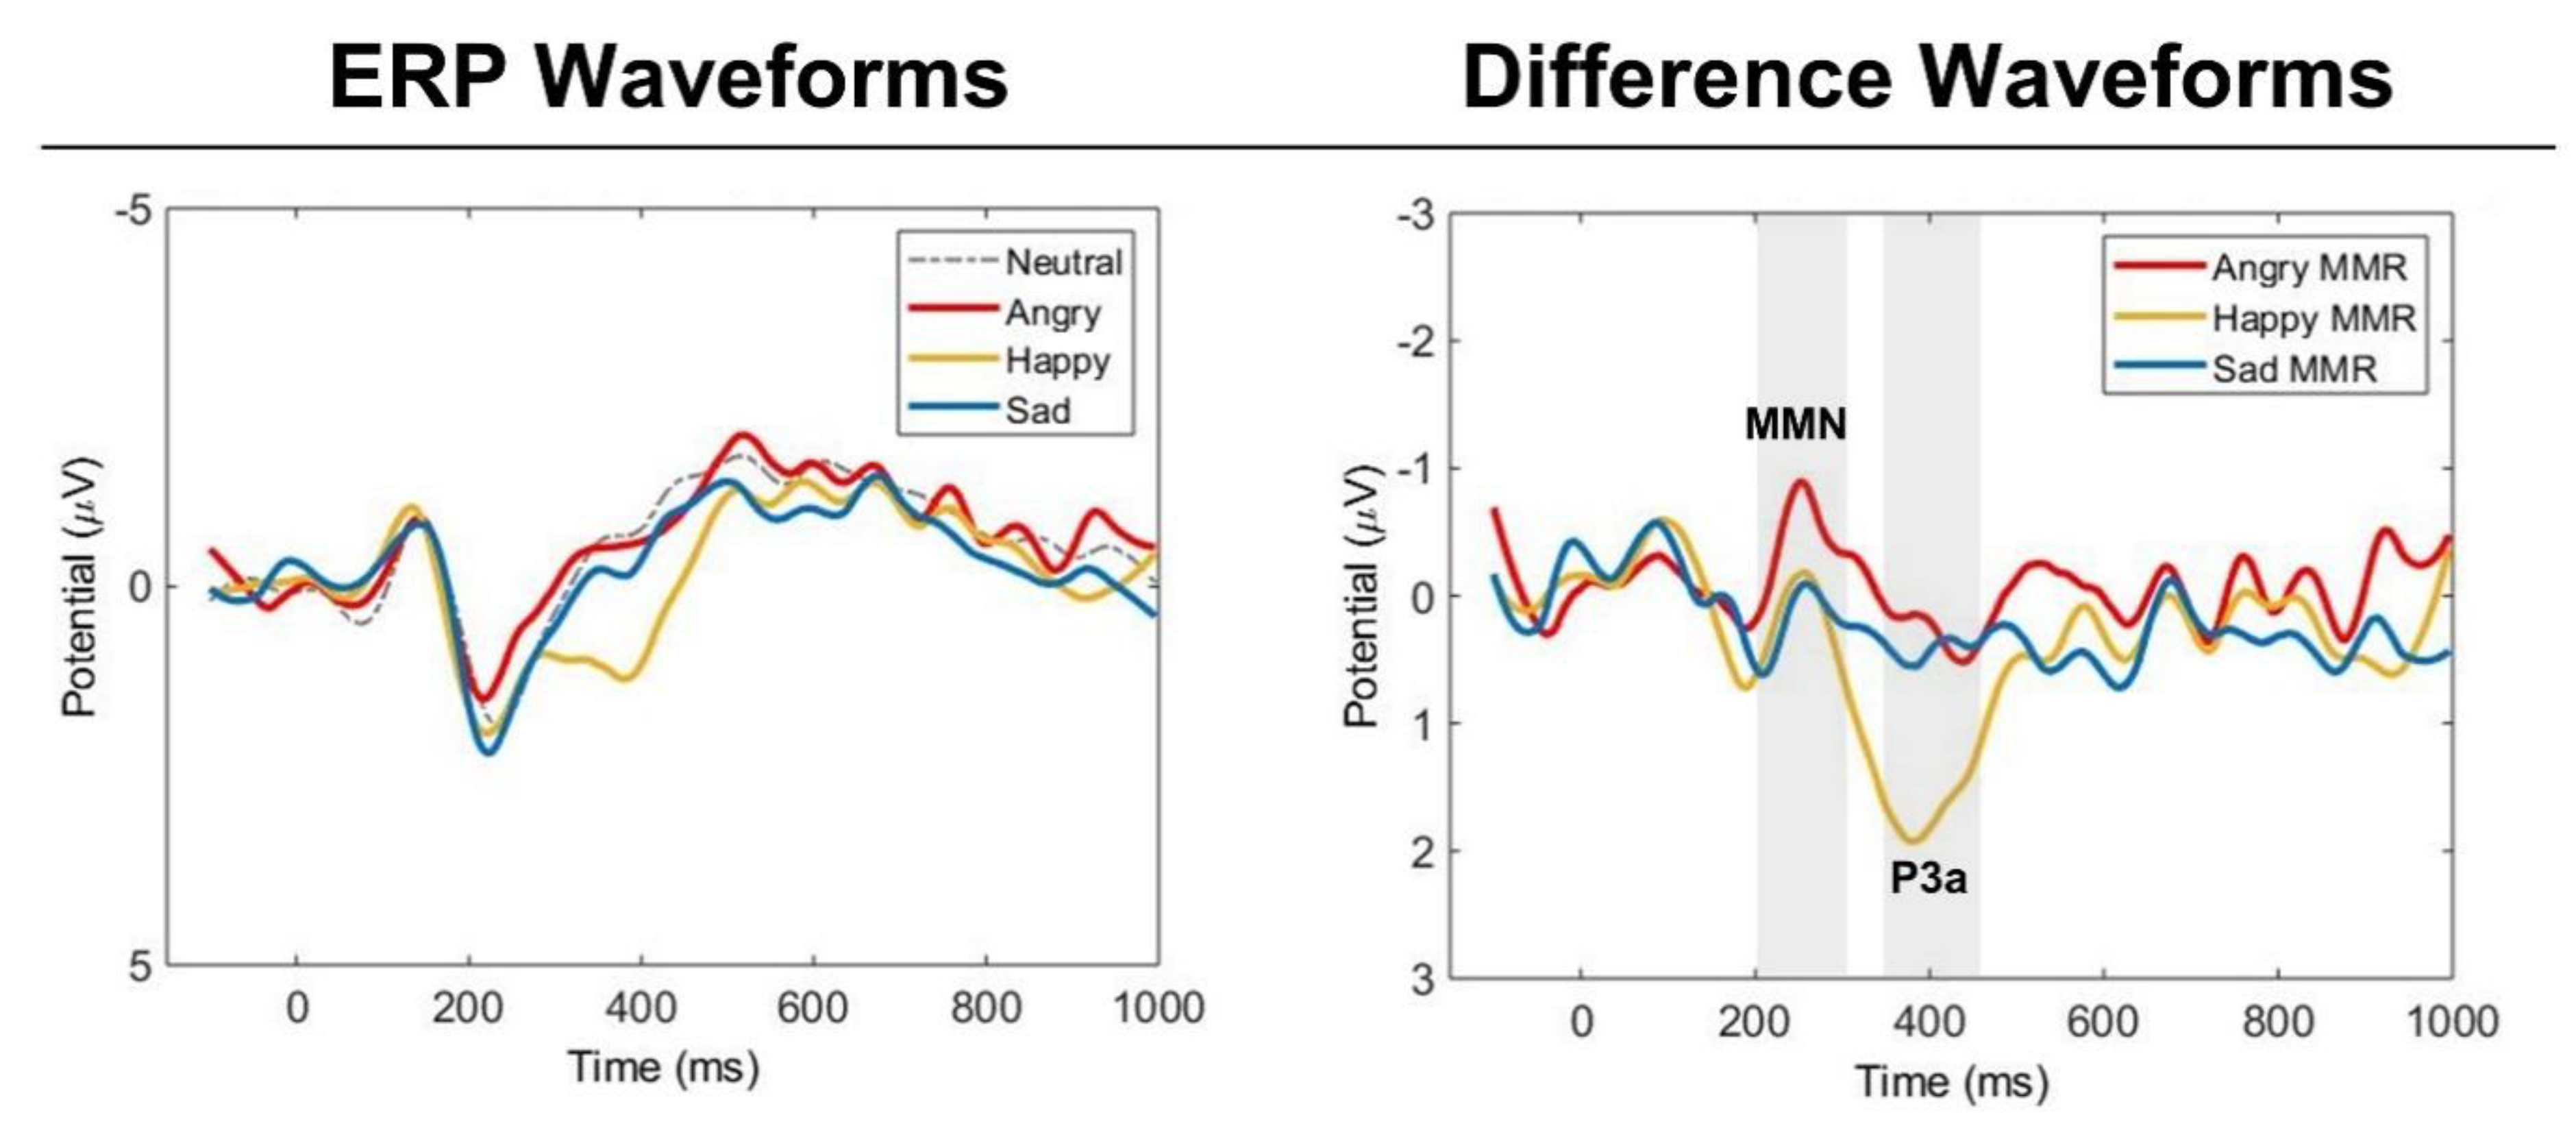
Figure 3.
The scalp topographic maps of (A) MMN and (B) P3a to angry, happy, and sad emotional prosodies averaged across male and female listeners. The topographies are based on the latencies of peak values at Cz channel.
Figure 3.
The scalp topographic maps of (A) MMN and (B) P3a to angry, happy, and sad emotional prosodies averaged across male and female listeners. The topographies are based on the latencies of peak values at Cz channel.
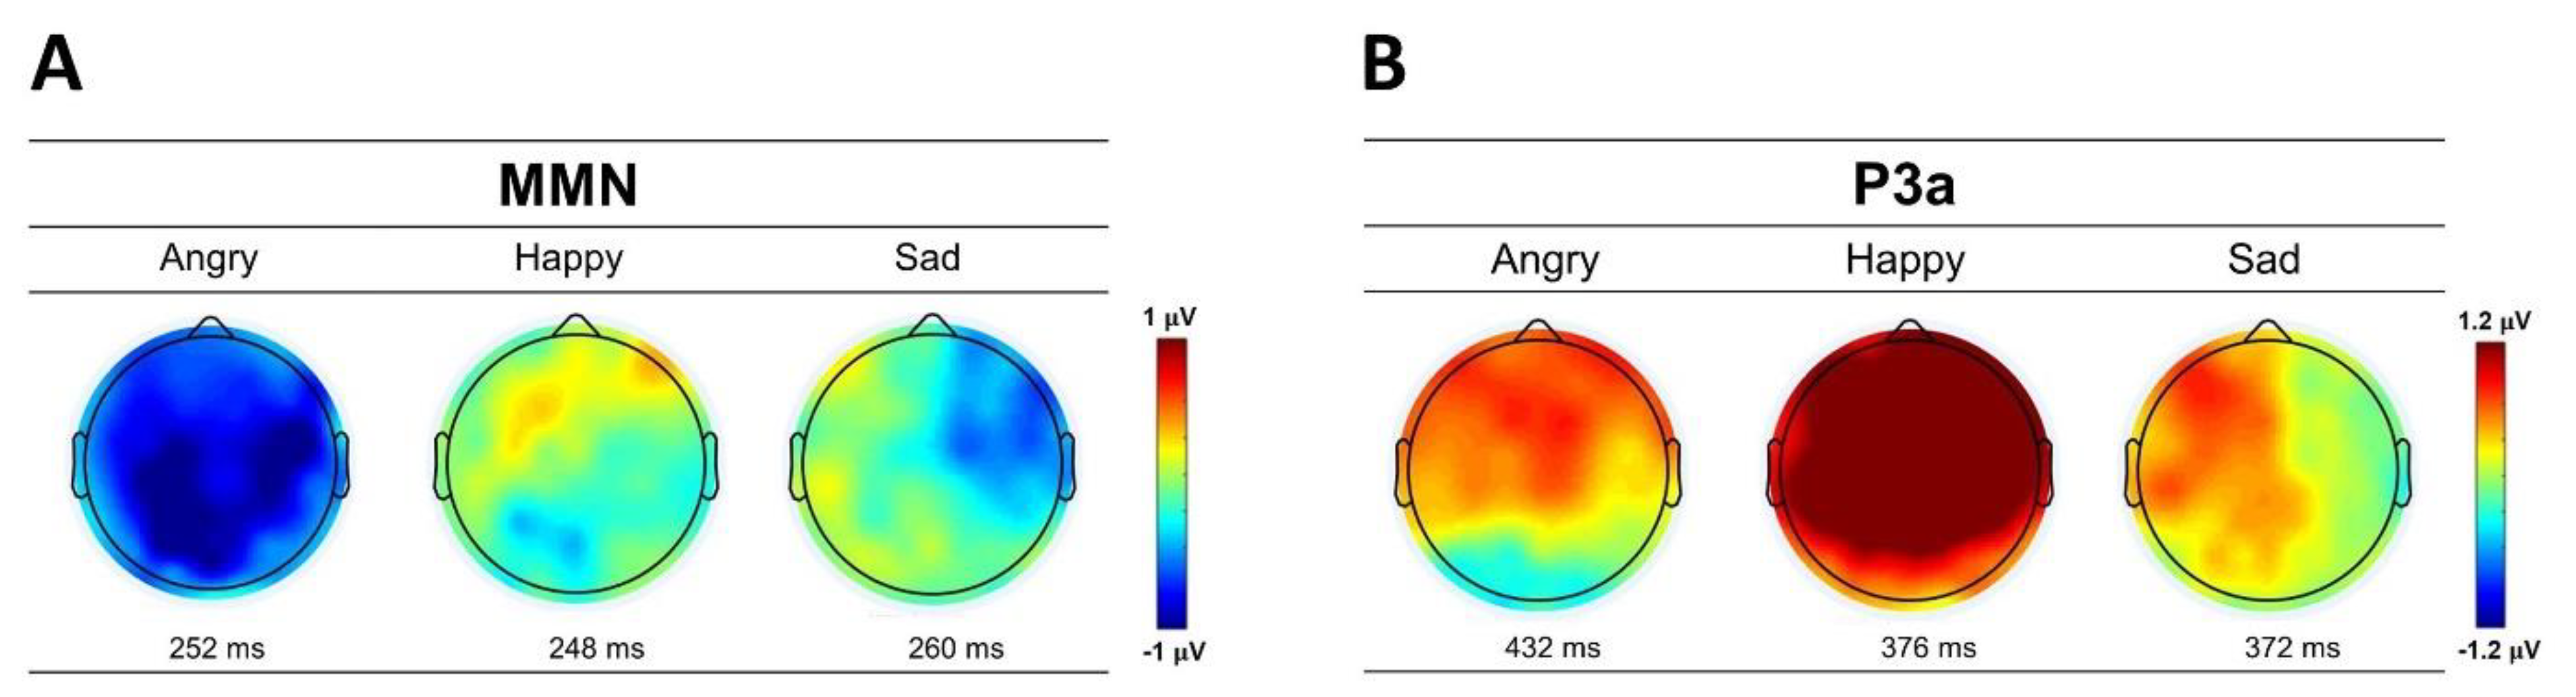
Figure 4.
The main effects of (A) emotion (angry, happy, sad), (B) electrode region (central, frontal, parietal), and (C) electrode laterality (left, middle, right) on listeners’ MMN amplitudes. [Figure 4]
Figure 4.
The main effects of (A) emotion (angry, happy, sad), (B) electrode region (central, frontal, parietal), and (C) electrode laterality (left, middle, right) on listeners’ MMN amplitudes. [Figure 4]
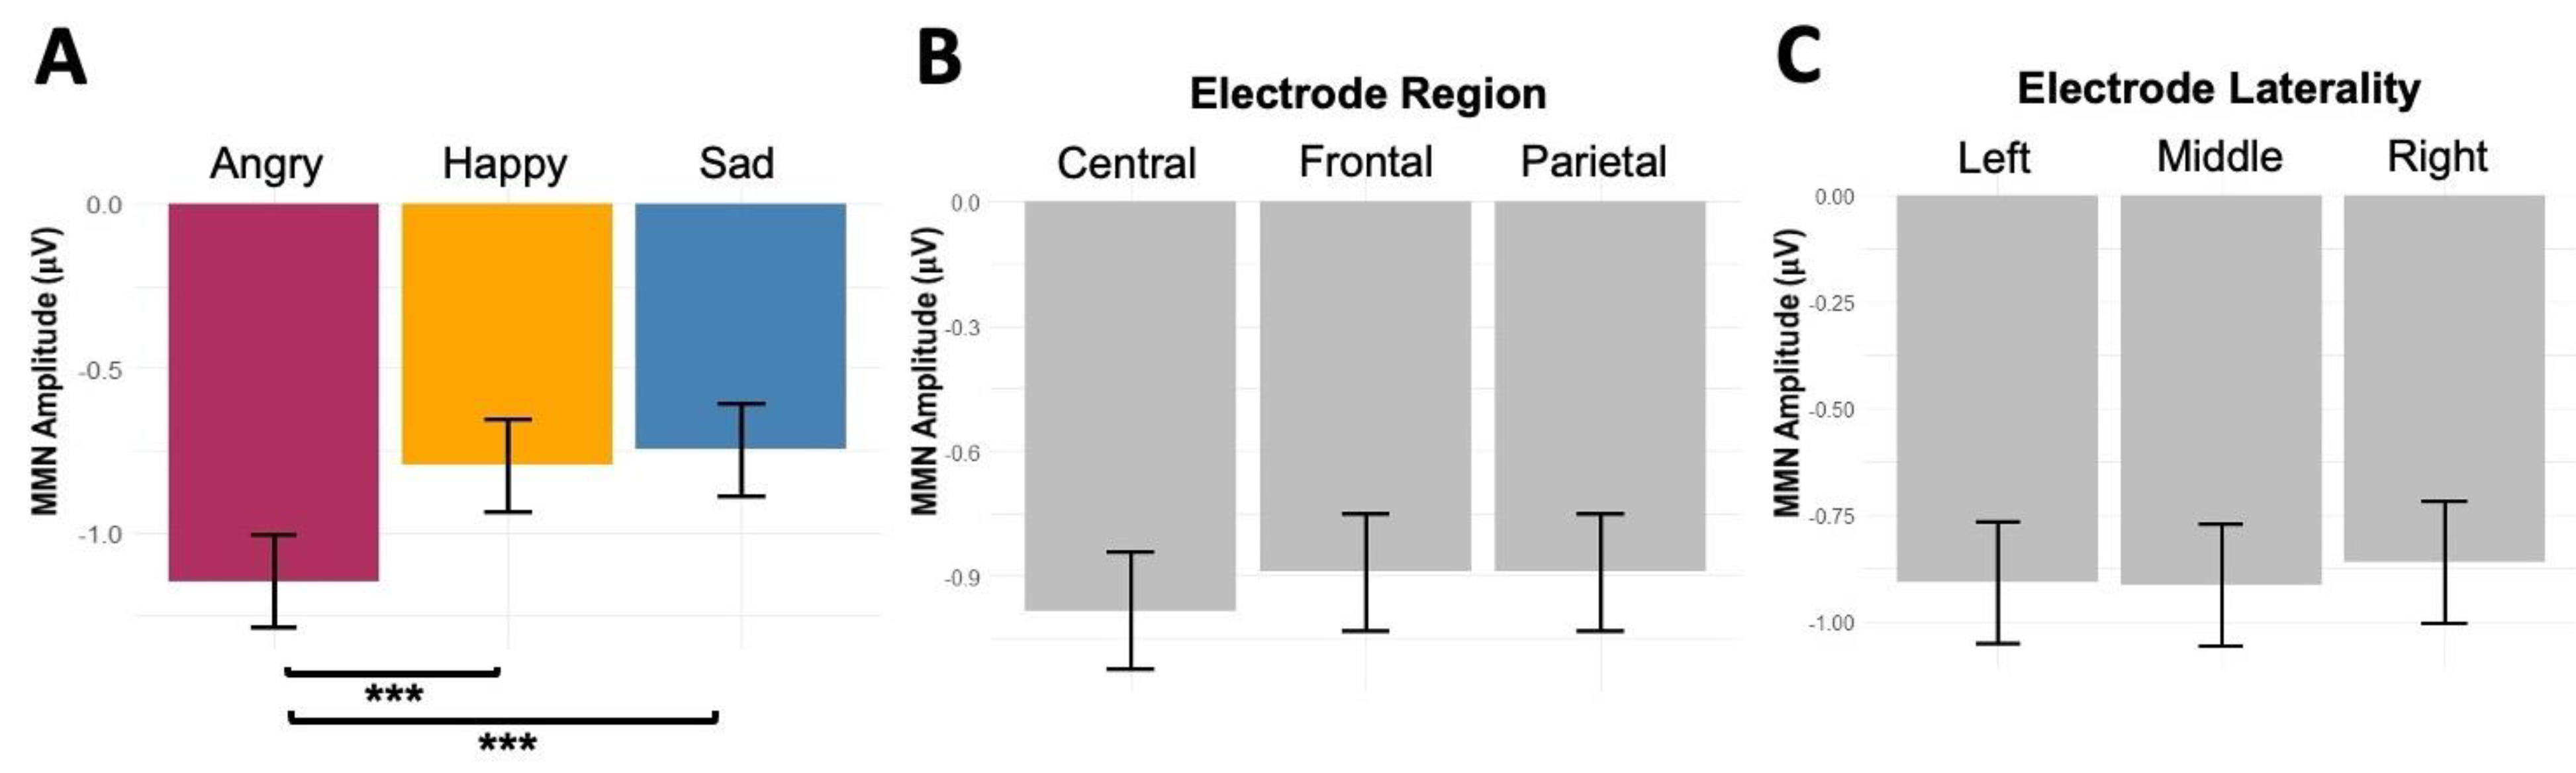
Figure 5.
The main effects of (A) emotion (angry, happy, sad) and (B) electrode region (central, frontal, parietal), and (C) electrode laterality (left, middle, right) on listeners’ P3a amplitudes.
Figure 5.
The main effects of (A) emotion (angry, happy, sad) and (B) electrode region (central, frontal, parietal), and (C) electrode laterality (left, middle, right) on listeners’ P3a amplitudes.
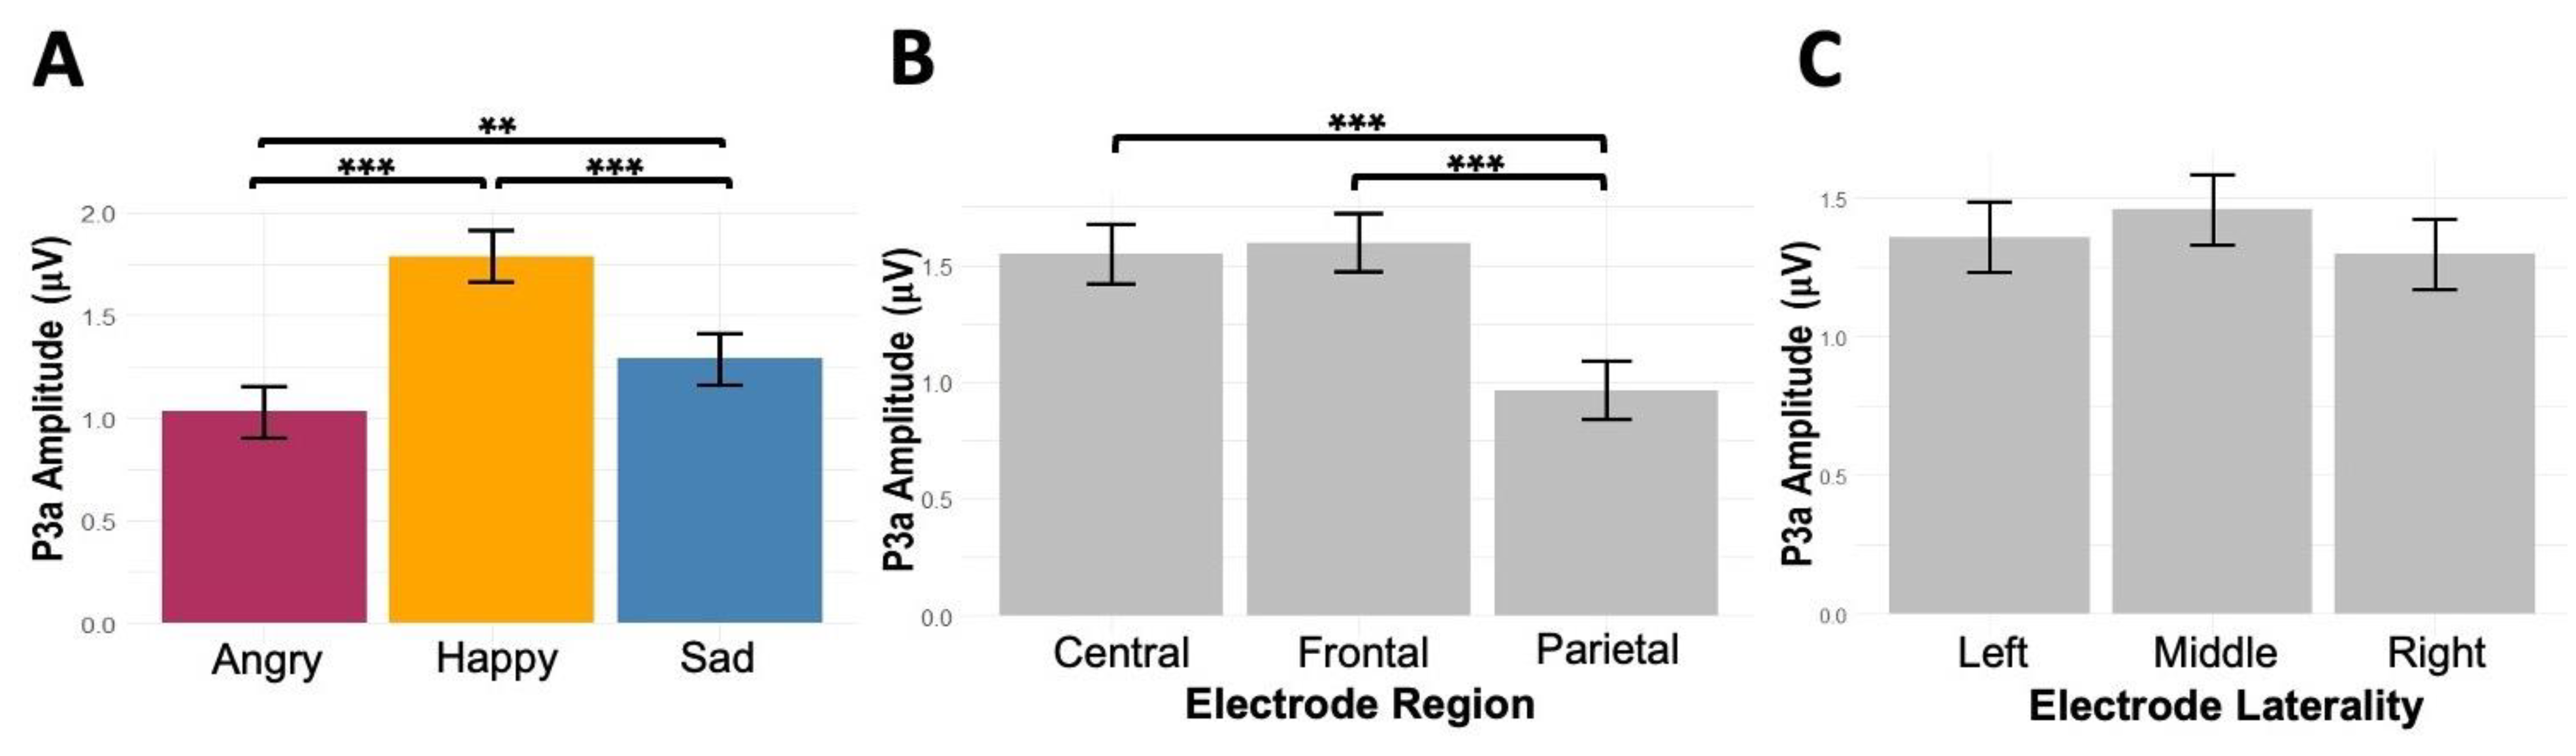
Table 1.
The acoustic properties of each emotional prosody.
| Mean F0 (Hz) | Duration (ms) | Intensity Variation (dB) | HNR (dB) | Spectral Centroid (Hz) | ||||||
|---|---|---|---|---|---|---|---|---|---|---|
| Emotions | M | SD | M | SD | M | SD | M | SD | M | SD |
| Angry | 216.71 | 36.64 | 646 | 109 | 11.15 | 3.74 | 9.22 | 5.01 | 1810.96 | 1075.32 |
| Happy | 226.13 | 10.86 | 742 | 91 | 10.82 | 4.12 | 17.53 | 3.77 | 1052.92 | 265.19 |
| Sad | 180.42 | 20.57 | 822 | 104 | 10.18 | 3.11 | 19.31 | 4.25 | 408.79 | 278.89 |
| Neutral | 195.04 | 9.25 | 667 | 84 | 9.14 | 3.71 | 18.75 | 4.43 | 758.43 | 220.34 |
Note. The averaged values and standard deviations of the words were used to report the mean fundamental frequency (F0), word duration, intensity variation, harmonics-to-noise ratio (HNR), and spectral centroid of each emotional prosody.
Disclaimer/Publisher’s Note: The statements, opinions and data contained in all publications are solely those of the individual author(s) and contributor(s) and not of MDPI and/or the editor(s). MDPI and/or the editor(s) disclaim responsibility for any injury to people or property resulting from any ideas, methods, instructions or products referred to in the content. |
© 2023 by the authors. Licensee MDPI, Basel, Switzerland. This article is an open access article distributed under the terms and conditions of the Creative Commons Attribution (CC BY) license (http://creativecommons.org/licenses/by/4.0/).
Copyright: This open access article is published under a Creative Commons CC BY 4.0 license, which permit the free download, distribution, and reuse, provided that the author and preprint are cited in any reuse.


