
Submitted:
24 December 2025
Posted:
25 December 2025
You are already at the latest version
Abstract
Structural biomarkers determined by X-ray scattering of the tissues can complement conventional histopathology and facilitate a fast triage procedure of cancer biopsy samples. It has been shown previously that lipid reflexes can distinguish cancerous from benign samples, except for fibroadenomas. In the present study, we demonstrate that fibroadenoma samples can be recognized using X-ray scattering of collagen. Moreover, we show that modifications in collagen structure are manifested in the water reflexes. Examination of diffraction patterns from water using two-dimensional Fourier transformation and machine learning yields excellent classification metrics in both synchrotron images and laboratory diffractometer data.
Keywords:
cancer detection
; X-ray scattering
; structural biomarkers
; collagen
; fibroadenoma
; water molecules
1. Introduction
Breast cancer is the most commonly diagnosed cancer among women worldwide. According to the predictions of the Lancet’s Breast Cancer Commission [1], by 2040, there will be more than 3 million new cases of breast cancer per year. 13.1% women in the US will be diagnosed with invasive breast cancer, and 2.3% will die from the disease [2]. In 2024, an estimated 310,720 new cases of invasive breast cancers and 56,500 new cases of ductal carcinoma in situ will be diagnosed among women and 2,790 among men in the US [2]. The death rate has decreased recently [3], mainly due to advances in early diagnostics [4,5]. Correspondingly, avoiding any delays in cancer detection is paramount for a patient. Both cancerous and benign lesions require histopathological examination; biopsies with a benign diagnosis being eight times more likely than those with a malignant one. Currently, there is no opportunity to ‘fast-track’ potential malignant cases. Thus, there is a real need to adopt a different methodology for tissue diagnostics that can effectively triage samples at an early stage, allowing identification of those with potentially life-threatening conditions and, ideally, offering early reassurance to those without significant disease.
Such an approach for breast cancer detection can be implemented by exploiting the structural biomarkers obtained from X-ray scattering of human breast tissues. In particular, wide-angle X-ray scattering (WAXS), with momentum transfer q approximately between 3 and 40 nm-1, provides information on variations in lipid and aqueous components [6,7,8,9,10,11,12,13,14]. It was shown [9,14] that in cancerous tissues, the intensity of the maximum at ~ q = 14 nm-1 (corresponding to inter-fatty-acid molecular distances) is reduced. Concurrently, at ~ q = 20 nm-1, the intensity of a maximum (associated with the oxygen-oxygen distance in the tetrahedral structure of water) increases. This effect can serve as a structural biomarker for breast cancer detection, although the data have been mostly derived from synchrotron experiments with limited sample numbers. Recently, we have employed bespoke laboratory diffractometers for the same purposes and observed the same maxima variations [15,16,17] across a large number of samples in both the US [15] and the UK [16,17]. Specifically, using machine learning for binary benign/cancer differentiation, we achieved 95% sensitivity and 100% specificity [17]. However, in this analysis, fibroadenoma was excluded from the benign dataset because its lipid signal is very similar to that of cancer.
The momentum transfer range, 0.1 < q < 5 nm-1, corresponding to small-angle scattering (SAXS), provides information about possible alterations in the collagen fibril repeat distances and coherence [18,19,20,21], the amorphous scattering profile [20,23], and triglyceride packing (q = 1.5 nm-1) [14,24]. In this paper, we demonstrate, for the first time, the feasibility of separating fibroadenoma samples from cancerous samples using collagen features. In the SAXS images obtained at the Diamond Light Source, we removed the triglyceride peak and evaluated the reflexes at smaller angles. The signal from collagen fibrils is anisotropic; thus, we used a recently developed approach based on two-dimensional Fourier coefficients, principal component analysis, and a Logistic Regression classifier [17,25,26]. We demonstrated that the patterns from cancerous and fibroadenoma samples are well separated in the space of principal components, with an area under the receiver operating characteristic (ROC) curve (AUC) of 0.89. This metric can be further improved by using the measurement-to-patient transition [17], which yields a value of 0.95 for patients.
The scattering signal from breast tissue collagen is not currently observable using our bespoke laboratory diffractometers. However, the alterations of the collagen structure are correlated with another WAXS feature: the signal from the aqueous component. Despite the seeming simplicity of a single H2O molecule, water demonstrates a rich variety of structure-related properties [27,28]. Its interaction with light, primarily in the infrared range, led to the field of research known as Aquaphotomics [29]. In X-ray diffraction experiments, liquid water produces a broad maximum at ~ q = 20 nm-1 that corresponds to the first-shell O–O correlations [30,31,32]. In biological tissues, the precise interaction of water with other components is critical and prominent. In particular, hydration layer water bridges play an essential role in the formation and characteristics of collagen fibrils [33,34,35]. Correspondingly, the X-ray diffraction signal from water is affected by the collagen structure (and vice versa), and its alternations can be seen in the water-related region of the diffraction patterns.
A component of established models of invasive tumors is their association with preferentially aligned collagen, which promotes the motility of cancer cells. Therefore, given the structural intimacy of collagen and water, we hypothesize that this preferred orientation would also manifest within water signatures. Further, the collagen of benign lesions may not have this alignment characteristic, and hence, discrimination may be possible using this feature. We show here that analyzing the water contributions to two-dimensional X-ray diffraction patterns and their Fourier transforms using machine learning enables us to distinguish signals from fibroadenoma and cancer, both in the synchrotron and laboratory experiments.
2. Results
2.1. Measurements of Collagen at the Diamond Light Source Synchrotron
The SAXS data were collected on beamline I22 at the Diamond Light Source [36], the UK’s national synchrotron facility. The samples from 24 cancerous patients and 12 patients with fibroadenoma were measured. In total, we obtained 297 images of cancerous samples and 144 of fibroadenoma. A typical X-ray diffraction image is shown in Figure 1 (a). It demonstrates the amorphous scattering at very small angles, followed by several orders of the collagen reflexes and the triglyceride maximum at q = 1.5 nm-1. To evaluate scattering in collagen, we extracted the region within the red-dashed lines. The resulting area is shown in Figure 1(b).
We did not perform azimuthal integration of the obtained images to retain information on the anisotropy (i.e., preferential alignment) associated with collagen fibrils. Instead, we used the approach outlined in sub-section 4.2.3, which is based on two-dimensional Fourier transforms of the images and principal component analysis (PCA). Correspondingly, each measurement is represented by a point in the space of principal components. The three-dimensional visualization is presented in Figure 2(a). This figure shows that the cancer and fibroadenoma clusters are well separated, even in 3D. The ROC curve generated from 20 PC dimensions is demonstrated in Figure 2(b). The AUC of 0.89 indicates excellent separation of the clusters, with a sensitivity of 0.76 and a specificity of 0.84. However, these metrics can be further improved by implementing the measurement-to-patient approach developed in [17]. The corresponding ROC curve with the AUC of 0.95 is shown in Figure 2(c).
2.2. Measurements of Water at the Diamond Light Source Synchrotron
For cancerous and fibroadenoma samples, the WAXS images obtained at the Diamond synchrotron are dominated by water-related maxima. A typical image is presented in Figure 3(a). The lipid contribution is less intense in these samples than in their healthy counterparts. However, to completely eliminate the lipid signal from our analysis, we extracted the region below 16 nm-1, as shown in Figure 3(b).
To determine whether the water X-ray diffraction signal maintains the collagen-induced anisotropy, we evaluate the obtained diffraction pattern using the same approach as in the analysis of the collagen performed in the previous sub-section. Similarly, all measurements are shown as points in the 3D space of principal components in Figure 4(a). Evidently, the cancer and fibroadenoma clusters are well-separated, with only a few outliers. The ROC curve is shown in Figure 4(b), with an AUC of 0.88, a sensitivity of 0.7, and a specificity of 0.9. As in the case of collagen, these metrics improve with the measurement-to-patient transition, to an AUC of 0.97, a sensitivity of 0.92, and a specificity of 0.96 (see Figure 4(c)).
2.3. Measurements of Water at the Laboratory Diffractometer
2295 measurements for 169 cancerous patients and 347 measurements for 22 fibroadenoma patients were performed on our bespoke laboratory diffractometer at Keele University. A typical WAXS pattern is shown in Figure 5(a). Similar to the images obtained at the synchrotron, we extracted the regions with lipid responses below 16 nm-1, leaving only the contributions from water. The resulting image is presented in Figure 5(b).
The 3D PC space is shown in Figure 6(a), with a visible separation between the cancerous and fibroadenoma clusters. The corresponding ROC curve is presented in Figure 6(b). The metrics are worse than for the synchrotron measurements, with an AUC of 0.73, a sensitivity of 0.80, and a specificity of 0.57. However, the patient-based metrics in Figure 6(c) are significantly improved. As our current dataset is significantly skewed, with 22 fibroadenoma patients vs 169 cancer patients, we explored an approach similar to the sliding window [37]. We compared fibroadenoma patients to each of the seven groups of 22 cancer patients and averaged the results. The resulting AUC ROC are 0.79 for measurements and 0.85 for patients.
As our current dataset is significantly skewed, with 22 fibroadenoma patients vs 169 cancer patients, we explored an approach similar to the sliding window [37]. We compared fibroadenoma patients to each of the seven groups of 22 cancer patients and averaged the results. The resulting AUC ROC are 0.79 for measurements and 0.85 for patients.
3. Discussion
In this study, we explored features of the X-ray scattering patterns of cancerous and fibroadenoma breast tissue samples. The previous comparison of cancerous and benign samples [17] was based on fat-molecule scattering. However, this was not effective for fibroadenoma, as its lipid signal is very similar to that of cancer. Here, we used different momentum-transfer ranges associated with collagen fibrils and water. The SAXS region was examined on the synchrotron, the Diamond Light Source, and the measurements of the WAXS region were performed both on the synchrotron and the laboratory diffractometer.
To explore the anisotropy of X-ray scattering from collagen, we did not use the standard azimuthal-integration approach, as this would have reduced orientation effects. Instead, we utilized the recently developed method of 2D Fourier transformations applied to tissue X-ray scatter [17,25,26]. Unlike classical equatorial/meridional analysis, the Fourier-based approach captures the presence and strength of anisotropy without explicit alignment, as directional order is encoded in the spatial-frequency magnitude distribution. We performed principal component analysis of the Fourier coefficients and classified the X-ray scattering images using logistic regression in a 20-dimensional PC space. We obtained good classification metrics: ROC AUC of 0.89, sensitivity of 0.76, and specificity of 0.84, but these improved further when we classified patients rather than measurements, following the procedure described in [17]. The patient-based metrics are ROC AUC of 0.95, sensitivity of 0.75, and specificity of 0.88.
However, an excellent classification based on collagen molecules cannot be used in the clinical setting, as the resolution of collagen diffraction peaks is currently achievable only in synchrotron experiments or using impractical laboratory methods. We hypothesized that the anisotropy of collagen fibrils can manifest itself in the X-ray scattering signal from water. Water plays a vital role in the coupling of long collagen molecules, as various types of water bridges and hydration layers are formed. The periodicities of these bridge types are similar, being about 0.3 nm [33]. Correspondingly, we can expect the X-ray scattering signal to exhibit collagen-induced anisotropy at about 21 nm-1, i.e., near the usual water-scattering maximum associated with the tetrahedral structure. A similar analysis using 2D Fourier transformation, PCA, and logistic regression in the 20-dimensional PC space provided an excellent cluster separation. The patient-based metrics are ROC AUC of 0.97, sensitivity of 0.92, and specificity of 0.96, i.e., the classification is even better than for the collagen itself. We attribute this to the anisotropic SAXS signal from the collagen being observed on a background of strong isotropic amorphous scattering. In contrast, water is the only scatterer in the WAXS region, with the momentum transfer exceeding 16 nm-1, i.e., above the lipid-related maximum.
The WAXS measurements were also performed using our laboratory diffractometer. As expected, the resulting metrics for the cancer/fibroadenoma classification are inferior to those of the synchrotron but still reasonable, with the patient-based ROC AUC of 0.76, sensitivity of 0.70, and specificity of 0.72. However, we hope to achieve better results in future studies through straightforward improvements. First, in the current experimental setup, the exclusively water-related signal is measured over an observed azimuthal range much smaller than 180 degrees (see Figure 5(b)). This would be significantly improved in diffractometers with a larger detector active area. Second, the current dataset is skewed, as we have far fewer fibroadenoma patients (22 vs 169). We employed an approach similar to the sliding window [37], and the patient-based ROC AUC is improved to 0.85. However, studies using a more balanced dataset and more patients in general are planned for the near future. We believe that the current work demonstrates the proof of principle for our approach to achieve cancer/fibroadenoma classification based on X-ray scattering from water with collagen-induced anisotropy.
4. Materials and Methods
4.1. Experimental Design
4.1.1. Breast Tissue Specimens
All of the consented tissue samples (cancer and fibroadenoma) employed within this study were supplied by the Breast Cancer Now Biobank (BCNB) with National Research Ethics Service approval (23/EE/0229). Local ethical approval for the project was also obtained through the Keele University ethics committee (NS-210096). All of the specimens were fresh-frozen (FF) with approximate dimensions of 10 × 2 × 2 mm in size, taken from patients who consented to the BCNB, and all cases were supplied with a histopathological diagnosis acquired by conventional H&E sections. Each tissue specimen was initially placed and subsequently stored in a well (5 mm diameter, 2 mm depth) of a bespoke aluminum sample holder. The well was sealed with a SPEXTM 6 µm-thick mylar film to secure the tissue and mitigate against dehydration.
4.1.2. X-Ray Diffraction (XRD) Measurements (Synchrotron)
Wide-angle X-ray scattering (WAXS) and small-angle X-ray scattering (SAXS) data were collected on beamline I22 at the Diamond Light Source [36], the UK’s national synchrotron facility. The experiments were conducted using monochromatic X-rays with a wavelength of 0.1 nm, selected to optimize the scattering contrast. A rectangular beam was collimated to 240 x 60 μm and employed for all data collections, as this provided appropriate spatial resolution for mapping structural heterogeneity within each specimen. Data acquisition was carried out using a 2D Pilatus P3-2M detector placed at a calibrated sample-to-detector distance of 170 mm for WAXS and 5935mm for SAXS.
Each specimen, within its bespoke holder (see above), was embedded in a custom-designed 9×9 aperture aluminum gel-solution sample grid. This grid was engineered to provide mechanical stability, uniform thermal conditions, and precise alignment during measurements. Further, this enabled batch processing of specimens.
For systematic data collection, a 5×5 Cartesian raster grid of measurement points was established for each specimen, covering the areas of interest. Based on preliminary optimization, the raster point spacing was 500 µm, a compromise between spatial resolution and data-acquisition efficiency. Data were recorded as fly-scans with 10 data frames per point to improve statistical reliability and reduce random noise. The acquisition time was fixed at 100 ms per frame.
The experimental conditions, including beam energy, sample environment, and data acquisition parameters, were rigorously controlled and documented to ensure reproducibility. All raw data were corrected, reduced, and subsequently processed using standard DLS pipelines, with detailed calibration steps and correction algorithms applied to account for detector geometry, background scattering, and beam intensity variations. This comprehensive methodology facilitates the reproducibility of our results and supports future comparative studies.
4.1.3. X-Ray Diffraction (XRD) Measurements (Laboratory Diffractometer)
Laboratory XRD measurements were conducted using a bespoke X-ray diffractometer engineered and built by EosDx, Inc. (Menlo Park, CA, USA), a US-based company developing X-ray scattering for medical diagnostics. X-ray radiation from a copper-based Incoatec Microfocus Source (Geesthacht, Germany) was harvested using two multilayer curved-mirror optics, yielding a monochromatic beam of 200 μm diameter with λ = 0.154 nm. A MiniPix SN1442 (ADVACAM, Prague, Czech Republic) two-dimensional detector was employed to detect and record the X-ray scatter. This detector has a square pixel size of 55 μm and an active array of 256 × 256 pixels. To calibrate the sample-to-detector distance (nominally 20 mm) and provide a quality assurance check, silver behenate powder (Thermo Scientific® 045494.06, Heysham, Lancashire, UK) within an aluminium holder was scanned. All experimental data were stored as a 256-by-256 matrix of integers representing total photon counts. Standard temperatures and pressures were maintained throughout all data collection. As in the synchrotron specimen, heterogeneity was assessed by acquiring data from several individual spots on each specimen (4-9, depending on sample size). Each individual scatter pattern was covered over the q-range up to 23 nm-1 and collected for 30 sec.
4.2. Data Analysis
4.2.1. Image Preprocessing (Synchrotron)
297 WAXS and SAXS 2D scattering patterns corresponding to 12 fibroadenoma and 24 cancer patients were obtained at the DLS. Initial image processing was conducted using the standard beamline I22 pipelines [36] (systematic, pre-defined protocol steps for data processing) in conjunction with the DAWN data analysis software [38], designed to ensure the accuracy and reproducibility of the datasets.
A brief description of the pipeline process follows. Initially, the detector is calibrated to correct for inherent geometric aberrations and ensure accurate mapping. The scattering from standard NIST reference materials was measured to ensure accurate detector alignment and pixel-scale precision. A mask is generated for the detector active area that, when applied to the measured data, efficiently excludes artifacts such as the beam stop shadow and non-responsive (dead), or other inappropriately responding pixels. Edge effects are also removed by dilating the mask. The legitimacy of error estimation in photon-counting statistics was subsequently assessed using a Poisson model to validate the error calculations for measured intensities. For each measurement, beam-stop diode exposure measurements were used for channel averaging to reduce random noise. Further, this measurement provided correction data for variations in incident beam intensity. Each data collection was also corrected for any slight variations in exposure time, thus ensuring direct intensity comparisons. The next step was to average the intensities of the multiple frames collected at each measurement position, producing a single, high-fidelity 2D diffraction pattern for each measurement point. This stage also included background subtraction to isolate sample-specific scattering signals from inherent environmental and/or instrumental signals. Subsequently, inherent geometric distortion and absorption corrections are applied to each measurement point frame. As a final pipeline step, all non-numeric (NaN) values were removed, and, where necessary, intensities were scaled to standardize the datasets. This step ensures that the processed data are suitable for subsequent quantitative analyses.
Following this systematic processing pipeline, each measured position was associated with a well-calibrated and background-corrected diffraction profile suitable for quantitative structural analysis and comparative studies. The comprehensive documentation of each processing step enhanced data reproducibility and facilitated the validation of analytical results across independent data collections.
4.2.2. Image Preprocessing (Lab Diffractometer)
2678 WAXS images (frames) corresponding to 22 fibroadenoma and 169 cancer patients were obtained using the laboratory diffractometer. The unprocessed XRD data files contained intensities for each of the 256 × 256 pixels of the active detector array. Data processing and corrections followed closely those described within the DLS pipeline. For example, the first preprocessing step was the removal of non-responsive detector pixels (e.g., dead pixels), and calibrations were performed using external standard reference materials. The maximum difference in sample-to-detector distance, which influences calibration, was within 2.6%.
4.2.3. Fourier Coefficients Representation and Classification Procedure
In this work, we used the 2D Fourier coefficients approach proposed in [17,25,26]. Fourier coefficients were calculated for the preprocessed XRD data using the two-dimensional Discrete Fourier Transformation (2DFT) functions provided by the SciPy and NumPy libraries. This approach enabled the implementation of preprocessing analysis of the same area within each 2D image, thereby enhancing the influence of cancer on the XRD pattern and reducing the impact of any optical misalignment. The 2DFT application produced matrices of Fourier coefficients for each scatter frame. For all subsequent analyses, only the magnitudes of the complex Fourier coefficients were used. The elements of the acquired matrices are normalized by the element at (0,0), i.e., brightness.
In a procedure similar to that of Face Recognition [39,40], the Fourier coefficient matrices were ‘flattened’, i.e., translated into a single row. Subsequently, a single matrix was built by stacking the rows of all frames into a matrix, with the number of rows equal to the number of measured samples and the number of columns equal to the number of Fourier coefficients. This matrix was then used as the primary input to a principal component analysis (PCA). Accordingly, each sample was represented as a point in the PC space. The Logistic Regression classifier from the scikit-learn library [41] was used to generate the receiver operating characteristic (ROC) curve in the 20-dimensional space. The area under the ROC curve (AUC) was used as a metric, jointly with the sensitivity and specificity.
5. Conclusion
In conclusion, the present study shows that X-ray diffraction of collagen molecules and collagen-structured water can distinguish cancerous biopsy samples from fibroadenoma. This can complement the previously observed classification of cancerous and benign (not fibroadenoma) samples based on the lipid reflexes and provide a fast, accurate, and inexpensive triage procedure for histopathology.
Author Contributions
Conceptualization, L.M. and P.L.; methodology, S.M., A.Al., V.K., O.A., A.Aj., C.G., K.R. and P.L.; software, S.M., A.Al., V.K., V.S., O.A., and S.D.; validation, K.R., L.M., and P.L.; formal analysis, S.M., A.Al., and L.M.; investigation, S.M., A.Al., V.K., V.S., O.A., S.D., A.Aj., L.A., and C.G.; resources, C.G. and P.L.; data curation, S.M., A.Al., V.K., V.S., O.A., S.D., and A.Aj.; writing—original draft preparation, S.M., V.K., and L.M.; writing—review and editing, K.R. and L.M.; visualization, S.M., O.A., and L.M.; supervision, C.G., K.R., L.M., and P.L.; project administration, C.G. and P.L. All authors have read and agreed to the published version of the manuscript.
Funding
This research received no external funding.
Institutional Review Board Statement
Tissue was collected under NRES Approval number 23/EE/0229, approved November 21, 2023, with university ethics approval granted for this research (NS-210096).
Informed Consent Statement
Informed consent was obtained from all subjects involved in the study by the Breast Cancer Now Biobank.
Data Availability Statement
The files with the XRD patterns with extracted boundaries used for the analysis in this paper are available at https://zenodo.org/records/18002237. The codes are available upon request.
Acknowledgments
The authors acknowledge the role of the Breast Cancer Now Tissue Bank in collecting and making available the samples used to generate this publication, and the patients who donated to the Bank. This work acknowledges the support of the National Institute for Health and Care Research Barts Biomedical Research Centre (NIHR203330); a delivery partnership of Barts Health NHS Trust, Queen Mary University of London, St George’s University Hospitals NHS Foundation Trust, and St George’s University of London.
Conflicts of Interest
P.L. is a shareholder of Matur UK, Ltd and EosDx, Inc. S.M., V.K., V.S., O.A., and S.D. are consultants for Matur UK, Ltd. A.Aj., K.R., and L.M. are consultants for EosDx, Inc.
References
- Coles, C.E.; Earl, H.; Anderson, B.O.; Barrios, C.H.; Bienz, M.; Bliss, J.M.; Cameron, D.A.; Cardoso, F.; Cui, W.; Francis, P.A; et al. The Lancet Breast Cancer Commission. Lancet 2024, 403, 1895–1950. [Google Scholar] [CrossRef]
- American Cancer Society, Breast Cancer Facts & Figures 2024-2025; American Cancer Society, USA: Atlanta, 2024.
- Siegel, R.L.; Giaquinto, A.N.; Jemal, A. Cancer statistics, 2024. CA Cancer J Clin. 2024, 74, 12–49. [Google Scholar] [CrossRef]
- Migowski, A. Early detection of breast cancer and the interpretation of results of survival studies. Cienc. Saude Coletiva 2015, 20, 1309. [Google Scholar] [CrossRef]
- Taylor, C.; McGale, P.; Probert, J.; Broggio, J.; Charman, J.; Darby, S.C.; Kerr, A.J.; Whelan, T.; Cutter, D.J.; Mannu, G.; Dodwell, D. Breast cancer mortality in 500 000 women with early invasive breast cancer diagnosed in England, 1993-2015: population based observational cohort study. BMJ 2023, 381, e074684. [Google Scholar] [CrossRef] [PubMed]
- Conceiçao, A.L.C.; Antoniassi, M.; Geraldelli, W.; Poletti, M.E. Mapping transitions between healthy and pathological lesions in human breast tissues by diffraction enhanced imaging computed tomography (DEI-CT) and small angle x-ray scattering (SAXS). Radiat. Phys. Chem. 2014, 95, 313–316. [Google Scholar] [CrossRef]
- Kidane, G.; Speller, R.D.; Royle, G.J.; Hanby, A.M. X-ray scatter signatures for normal and neoplastic breast tissues. Phys. Med. Biol. 1999, 44, 1791. [Google Scholar] [CrossRef]
- Poletti, M.E.; Gonçalves, O.D.; Mazzaro, I. X-ray scattering from human breast tissues and breast-equivalent materials. Phys. Med. Biol. 2002, 47, 47–63. [Google Scholar] [CrossRef] [PubMed]
- Oliveira, O.R.; Conceiçao, A.L.C.; Cunha, D.M.; Poletti, M.E.; Pela, C.A. Identification of neoplasias of breast tissues using a powder diffractometer. J. Radiat. Res. 2008, 49, 527–532. [Google Scholar] [CrossRef]
- Conceicao, A.L.C.; Antoniassi, M.; Poletti, M.E. Assessment of the differential linear coherent scattering coefficient of biological samples. Nucl. Instr. Meth. Phys. Res. A 2010, 619, 67–70. [Google Scholar] [CrossRef]
- Griffiths, J.A.; Royle, G.J.; Hanby, A.M.; Horrocks, J.A.; Bohndiek, S.E.; Speller, R.D. Correlation of energy dispersive diffraction signatures and microCT of small breast tissue samples with pathological analysis. Phys. Med. Biol. 2007, 52, 6151–6164. [Google Scholar] [CrossRef]
- Cunha, D.M.; Oliveira, O.R.; Pérez, C.A.; Poletti, M.E. X-ray scattering profiles of some normal and malignant human breast tissues. X-ray Spectrometry 2006, 35, 370–374. [Google Scholar] [CrossRef]
- Conceicao, A.L.C.; Antoniassi, M.; Cunha, D.M.; Ribeiro-Silva, A.; Poletti, M.E. Multivariate analysis of the scattering profiles of healthy and pathological human breast tissues. Nucl. Instr. Meth. Phys. Res. A 2011, 652, 870–873. [Google Scholar] [CrossRef]
- Conceicao, A.L.C.; Meehan, K.; Antoniassi, M.; Piacenti-Silva, M.; Poletti, M.E. The influence of hydration on the architectural rearrangement of normal and neoplastic human breast tissues. Heliyon 2019, 5, e01219. [Google Scholar] [CrossRef]
- Friedman, J.; Blinchevsky, B.; Slight, M.; Tanaka, A.; Lazarev, A.; Zhang, W.; Aram, B.; Ghadimi, M.; Lomis, T.; Mourokh, L.; Lazarev, P. Structural Biomarkers for Breast Cancer Determined by X-Ray Diffraction. In Quantum Effects and Measurement Techniques in Biology and Biophotonics; Aiello, C., Polyakov, S.V., Derr, P., Eds.; Proc. SPIE, 2024; Volume 12863, p. 1286302. [Google Scholar]
- Denisov, S.; Blinchevsky, B.; Friedman, J.; Gerbelli, B.; Ajeer, A.; Adams, L.; Greenwood, C.; Rogers, K.; Mourokh, L.; Lazarev, P. Vitacrystallography: Structural Biomarkers of Breast Cancer Obtained by X-ray Scattering. Cancers 2024, 16, 2499. [Google Scholar] [CrossRef] [PubMed]
- Alekseev, A.; Shcherbakov, V.; Avdieiev, O.; Denisov, S.A.; Kubytskyi, V.; Blinchevsky, B.; Murokh, S.; Ajeer, A.; Adams, L.; Greenwood, C.; Rogers, K.; Jones, L.J.; Mourokh, L.; Lazarev, P. Benign/Cancer Diagnostics Based on X-Ray Diffraction: Comparison of Data Analytics Approaches. Cancers 2025, 17, 1662. [Google Scholar] [CrossRef] [PubMed]
- Lewis, R.A.; Rogers, K.D.; Hall, C.J.; Towns-Andrews, E.; Slawson, S.; Evans, A.; Pinder, S.E.; Ellis, I.O.; Boggis, C.R.M.; Hufton, A.P.; Dance, D.R. Breast cancer diagnosis using scattered X-rays. J. Synchrotron Rad. 2000, 7, 348–352. [Google Scholar] [CrossRef]
- Fernandez, M.; Keyrilainen, J.; Serimaa, R.; Torkkeli, M.; Karjalainen-Lindsberg, M.-L.; Tenhunen, M.; Thomlinson, W.; Urban, V.; Suortti, P. Small-angle x-ray scattering studies of human breast tissue samples. Phys. Med. Biol. 2002, 47, 577–592. [Google Scholar] [CrossRef]
- Sidhu, S.; Siu, K.K.W.; Falzon, G.; Nazaretian, S.; Hart, S.A.; Fox, J.G.; Susil, B.J.; Lewis, R.A. X-ray scattering for classifying tissue types associated with breast disease. Med. Phys. 2008, 35, 4660–4670. [Google Scholar] [CrossRef]
- Conceição, A.L.; Antoniassi, M.; Poletti, M.E. Analysis of breast cancer by small angle X-ray scattering. Analyst 2009, 134, 1077–1082. [Google Scholar] [CrossRef]
- Sidhu, S.; Siu, K.K.W.; Falzon, G.; Hart, S.A.; Fox, J.G.; Lewis, R.A. Mapping structural changes in breast tissue disease using x-ray scattering. Med. Phys. 2009, 36, 3211–3217. [Google Scholar] [CrossRef]
- Conceiçao, A.L.C.; Antoniassi, M.; Geraldelli, W.; Poletti, M.E. Mapping transitions between healthy and pathological lesions in human breast tissues by diffraction enhanced imaging computed tomography (DEI-CT) and small angle x-ray scattering (SAXS). Radiat. Phys. Chem. 2014, 95, 313–316. [Google Scholar] [CrossRef]
- Mohd Sobri, S.N.; Abdul Sani, S.F.; Sabtu, S.N.; Looi, L.M.; Chiew, S.F.; Pathmanathan, D.; Chio-Srichan, S.; Bradley, D.A. Structural Studies of Epithelial Mesenchymal Transition Breast Tissues. Sci. Rep. 2020, 10, 1997. [Google Scholar] [CrossRef]
- Alekseev, A.; Avdieiev, O.; Murokh, S.; Yuk, D.; Lazarev, A.; Labelle, D.; Mourokh, L.; Lazarev, P. Fourier Transformation-Based Analysis of X-Ray Diffraction Pattern of Keratin for Cancer Detection. Crystals 2025, 15, 57. [Google Scholar] [CrossRef]
- Murokh, S.; Willerson, E.; Lazarev, A.; Lazarev, P.; Mourokh, L.; Brumberg, J.C. X-ray diffraction reveals alterations in mouse somatosensory cortex following sensory deprivation. J. Neurosci. Meth 2025, 424, 110582. [Google Scholar] [CrossRef]
- Eisenberg, D.; Kauzmann, W. Structure and Properties of Water; Oxford University Press: New York, USA, 2005. [Google Scholar]
- Vitiello, G. My Double Unveiled: The Dissipative Quantum Model of Brain; John Benjamins Publishing: Amsterdam, Netherlands, 2001. [Google Scholar]
- Muncan, J.; Tsenkova, R. Aquaphotomics—Exploring Water Molecular Systems in Nature. Molecules 2023, 28, 2630. [Google Scholar] [CrossRef]
- Head-Gordon, T.; Hura, G. Water Structure from Scattering Experiments and Simulation. Chem. Rev. 2002, 102, 2651−2669. [Google Scholar] [CrossRef]
- Skinner, L. B.; Huang, C.; Schlesinger, D.; Pettersson, L. G.; Nilsson, A.; Benmore, C. J. Benchmark O–O Pair-Distribution Function of Ambient Water from X-ray Diffraction Measurements with a Wide Q-Range. J. Chem. Phys. 2013, 138, 074506. [Google Scholar] [CrossRef] [PubMed]
- Amann-Winkel, K.; Bellissent-Funel, M.C.; Bove, L.E.; Loerting, T.; Nilsson, A.; Paciaroni, A.; Schlesinger, D.; Skinner, L. X-ray and Neutron Scattering of Water. Chem. Rev. 2016, 116, 7570–7589. [Google Scholar] [CrossRef]
- Bella, J.; Brodsky, B.; Berman, H.M. Hydration structure of a collagen peptide. Structure 1995, 3, 893–906. [Google Scholar] [CrossRef] [PubMed]
- Vassaux, M. Heterogeneous Structure and Dynamics of Water in a Hydrated Collagen Microfibril. Biomacromol 2024, 25, 4809−4818. [Google Scholar] [CrossRef]
- Giannetti, G.; Matsumura, F.; Caporaletti, F.; Micha, D.; Koenderink, G.H.; Ilie, I.M.; Bonn, M.; Woutersen, S.; Giubertoni, G. Water and Collagen: A Mystery Yet to Unfold. Biomacromol 2025, 26, 2784−2799. [Google Scholar] [CrossRef] [PubMed]
- Smith, A.J.; Alcock, S.G.; Davidson, L.S.; Emmins, J.H.; Hiller Bardsley, J.C.; Holloway, P.; Malfois, M.; Marshall, A.R.; Pizzey, C.L.; Rogers, S.E.; Shebanova, O.; Snow, T.; Sutter, J.P.; Williams, E.P.; Terrill, N.J. I22: SAXS/WAXS beamline at Diamond Light Source - an overview of 10 years operation. J. Synchrotron Radiat. 2021, 28, 939–947. [Google Scholar] [CrossRef] [PubMed]
- Datar, M.; Gionis, A.; Indyk, P.; Motwani, R. Maintaining Stream Statistics over Sliding Windows. SIAM J. Comp. 2002, 31, 1794–1813. [Google Scholar] [CrossRef]
- Pauw, B.R.; Smith, A.J.; Snow, T.; Terrill, N.J.; Thünemann, A.F. The modular small-angle X-ray scattering data correction sequence. J. Appl. Crystallogr. 2017, 29, 1800–1811. [Google Scholar] [CrossRef] [PubMed]
- Filik, J.; Ashton, A.W.; Chang, P.C.Y.; Chater, P.A.; Day, S.J.; Drakopoulos, M.; Gerring, M.W.; Hart, M.L.; Magdysyuk, O.V.; Michalik, S.; Smith, A.; Tang, C.C.; Terrill, N.J.; Wharmby, M.T.; Wilhelm, H. Processing two-dimensional X-ray diffraction and small-angle scattering data in DAWN 2. J. Appl. Cryst. 2017, 50, 959–966. [Google Scholar] [CrossRef]
- Sirovich, L.; Kirby, M. Low-dimensional procedure for the characterization of human faces. J. Opt. Soc. Am. A 1987, 4, 519–524. [Google Scholar] [CrossRef]
- Turk, M.; Pentland, A.P. Face recognition using eigenfaces. Proceedings of the IEEE Conference on Computer Vision and Pattern Recognition 1991, 586–591. [Google Scholar]
- Pedregosa, F.; Varoquaux, G.; Gramfort, A.; Michel, V.; Thirion, B.; Grisel, O.; Blondel, M.; Prettenhofer, P.; Weiss, R.; Dubourg, V.; Vanderplas, J.; Passos, A.; Cournapeau, D.; Brucher, M.; Perrot, M.; Duchesnay, E. Scikit-learn: Machine learning in python. J. Mach. Learn. Res. 2011, 12, 2825–2830. [Google Scholar]
Figure 1.
SAXS images obtained at the Diamond Light Source synchrotron. Numbers indicate the position of the pixels on the detector. (a) Full image; (b) Image with no lipid contribution. The red dashed rectangle indicates the extracted boundary.
Figure 1.
SAXS images obtained at the Diamond Light Source synchrotron. Numbers indicate the position of the pixels on the detector. (a) Full image; (b) Image with no lipid contribution. The red dashed rectangle indicates the extracted boundary.
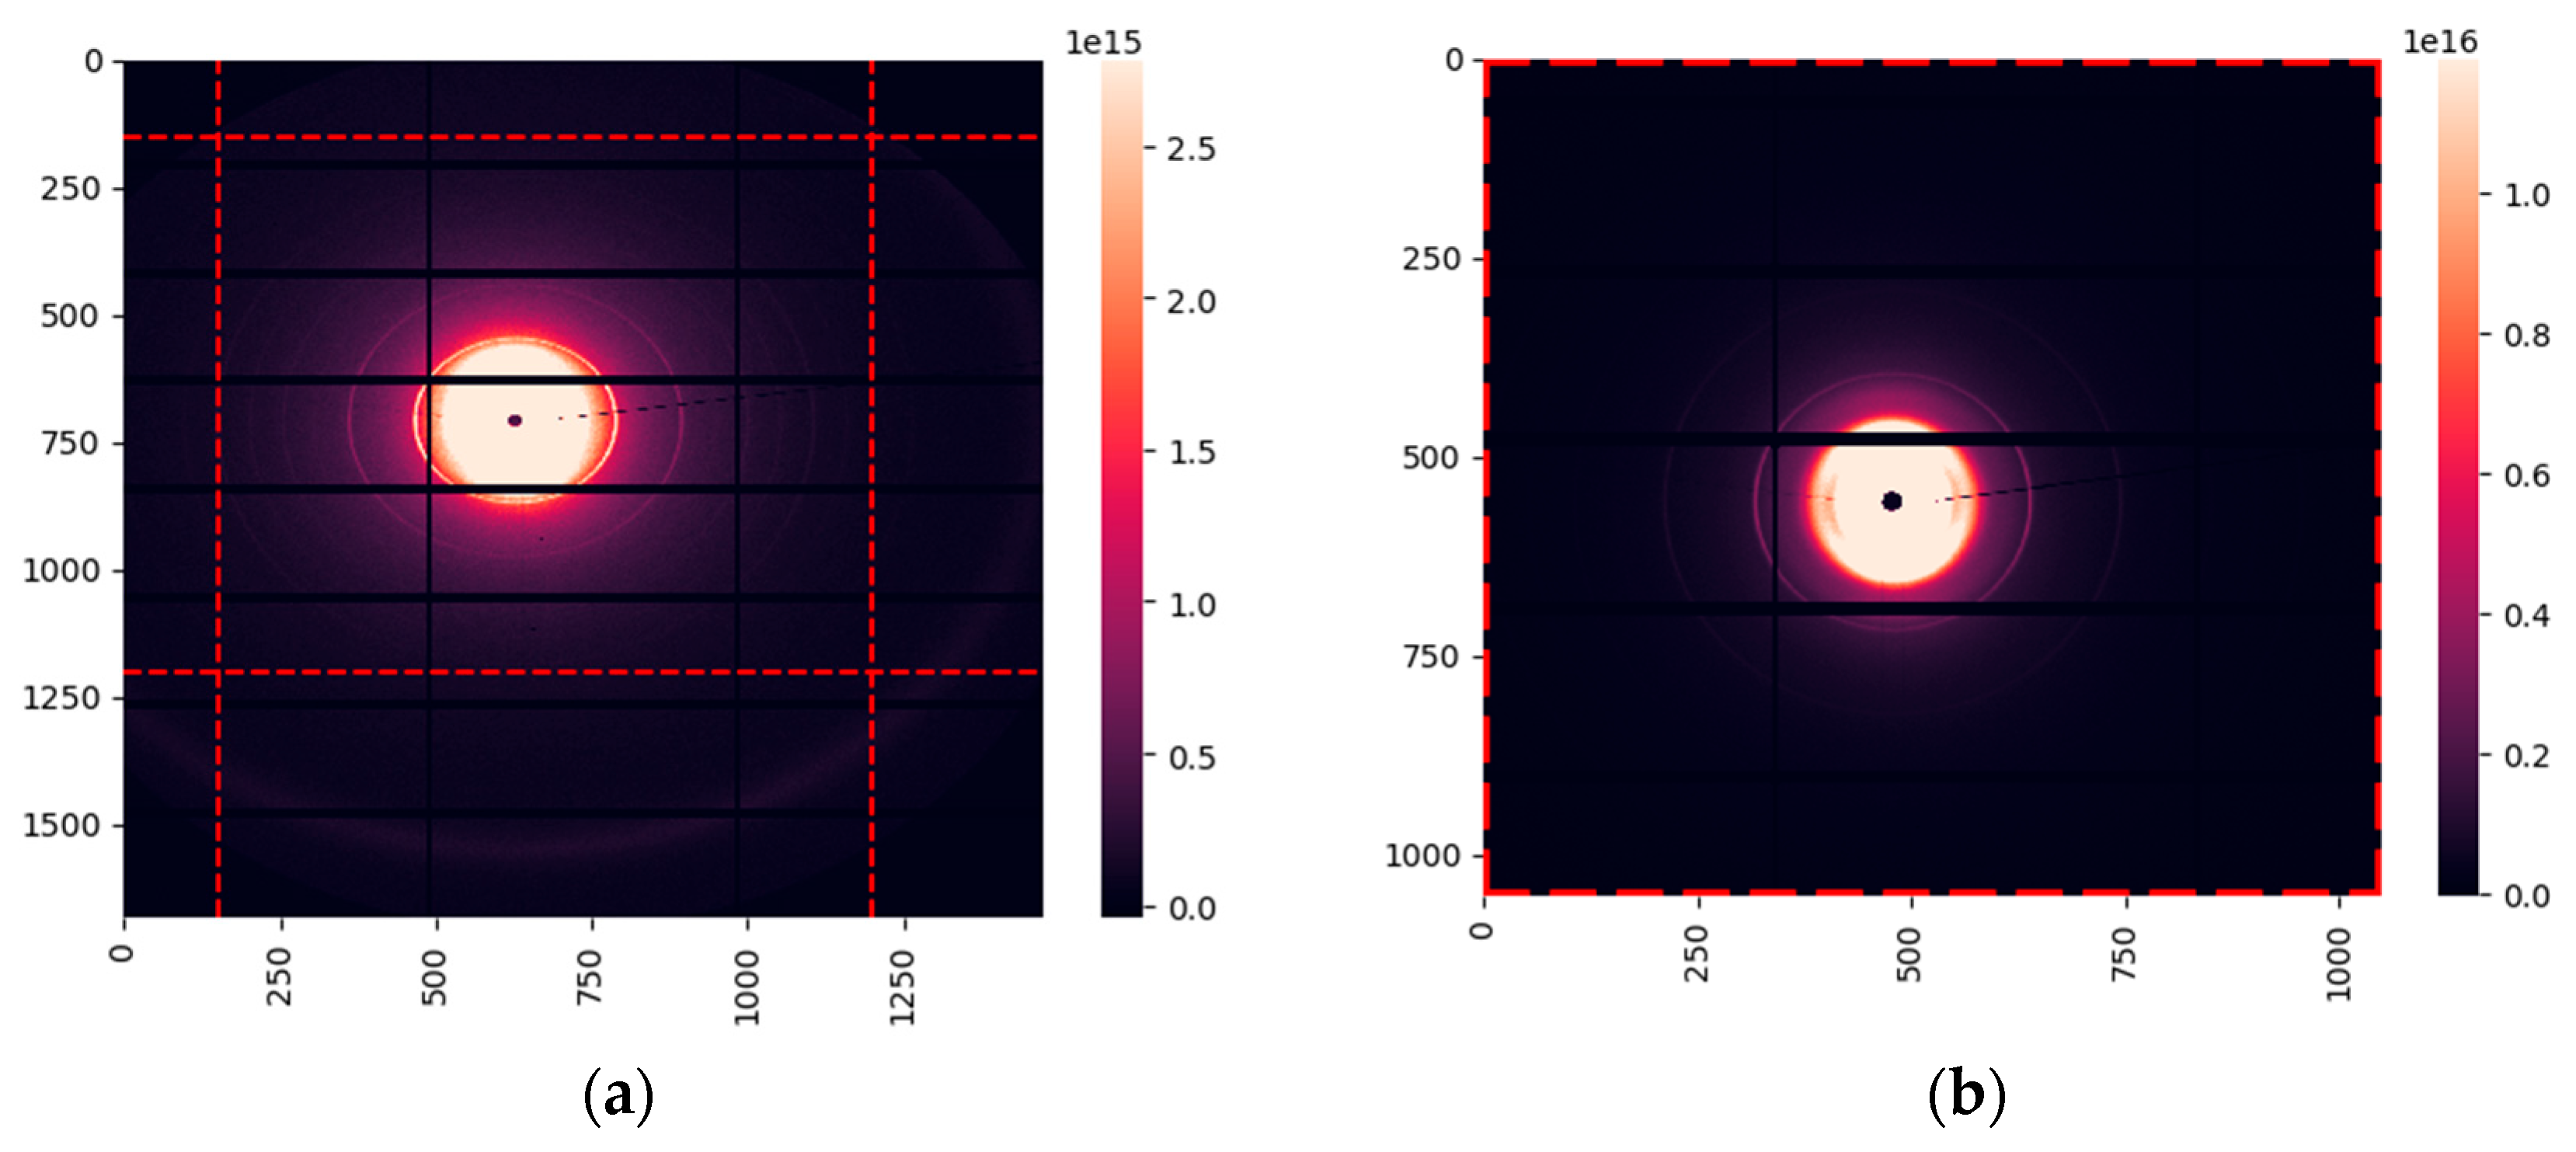
Figure 2.
(a) The PCA-transformed data within the 3D PC space. Each PCA point corresponds to a single diffraction measurement; (b) Measurement-based ROC curve for collagen contribution to synchrotron SAXS images; (c) Patient-based ROC curve for collagen contribution to synchrotron SAXS images.
Figure 2.
(a) The PCA-transformed data within the 3D PC space. Each PCA point corresponds to a single diffraction measurement; (b) Measurement-based ROC curve for collagen contribution to synchrotron SAXS images; (c) Patient-based ROC curve for collagen contribution to synchrotron SAXS images.
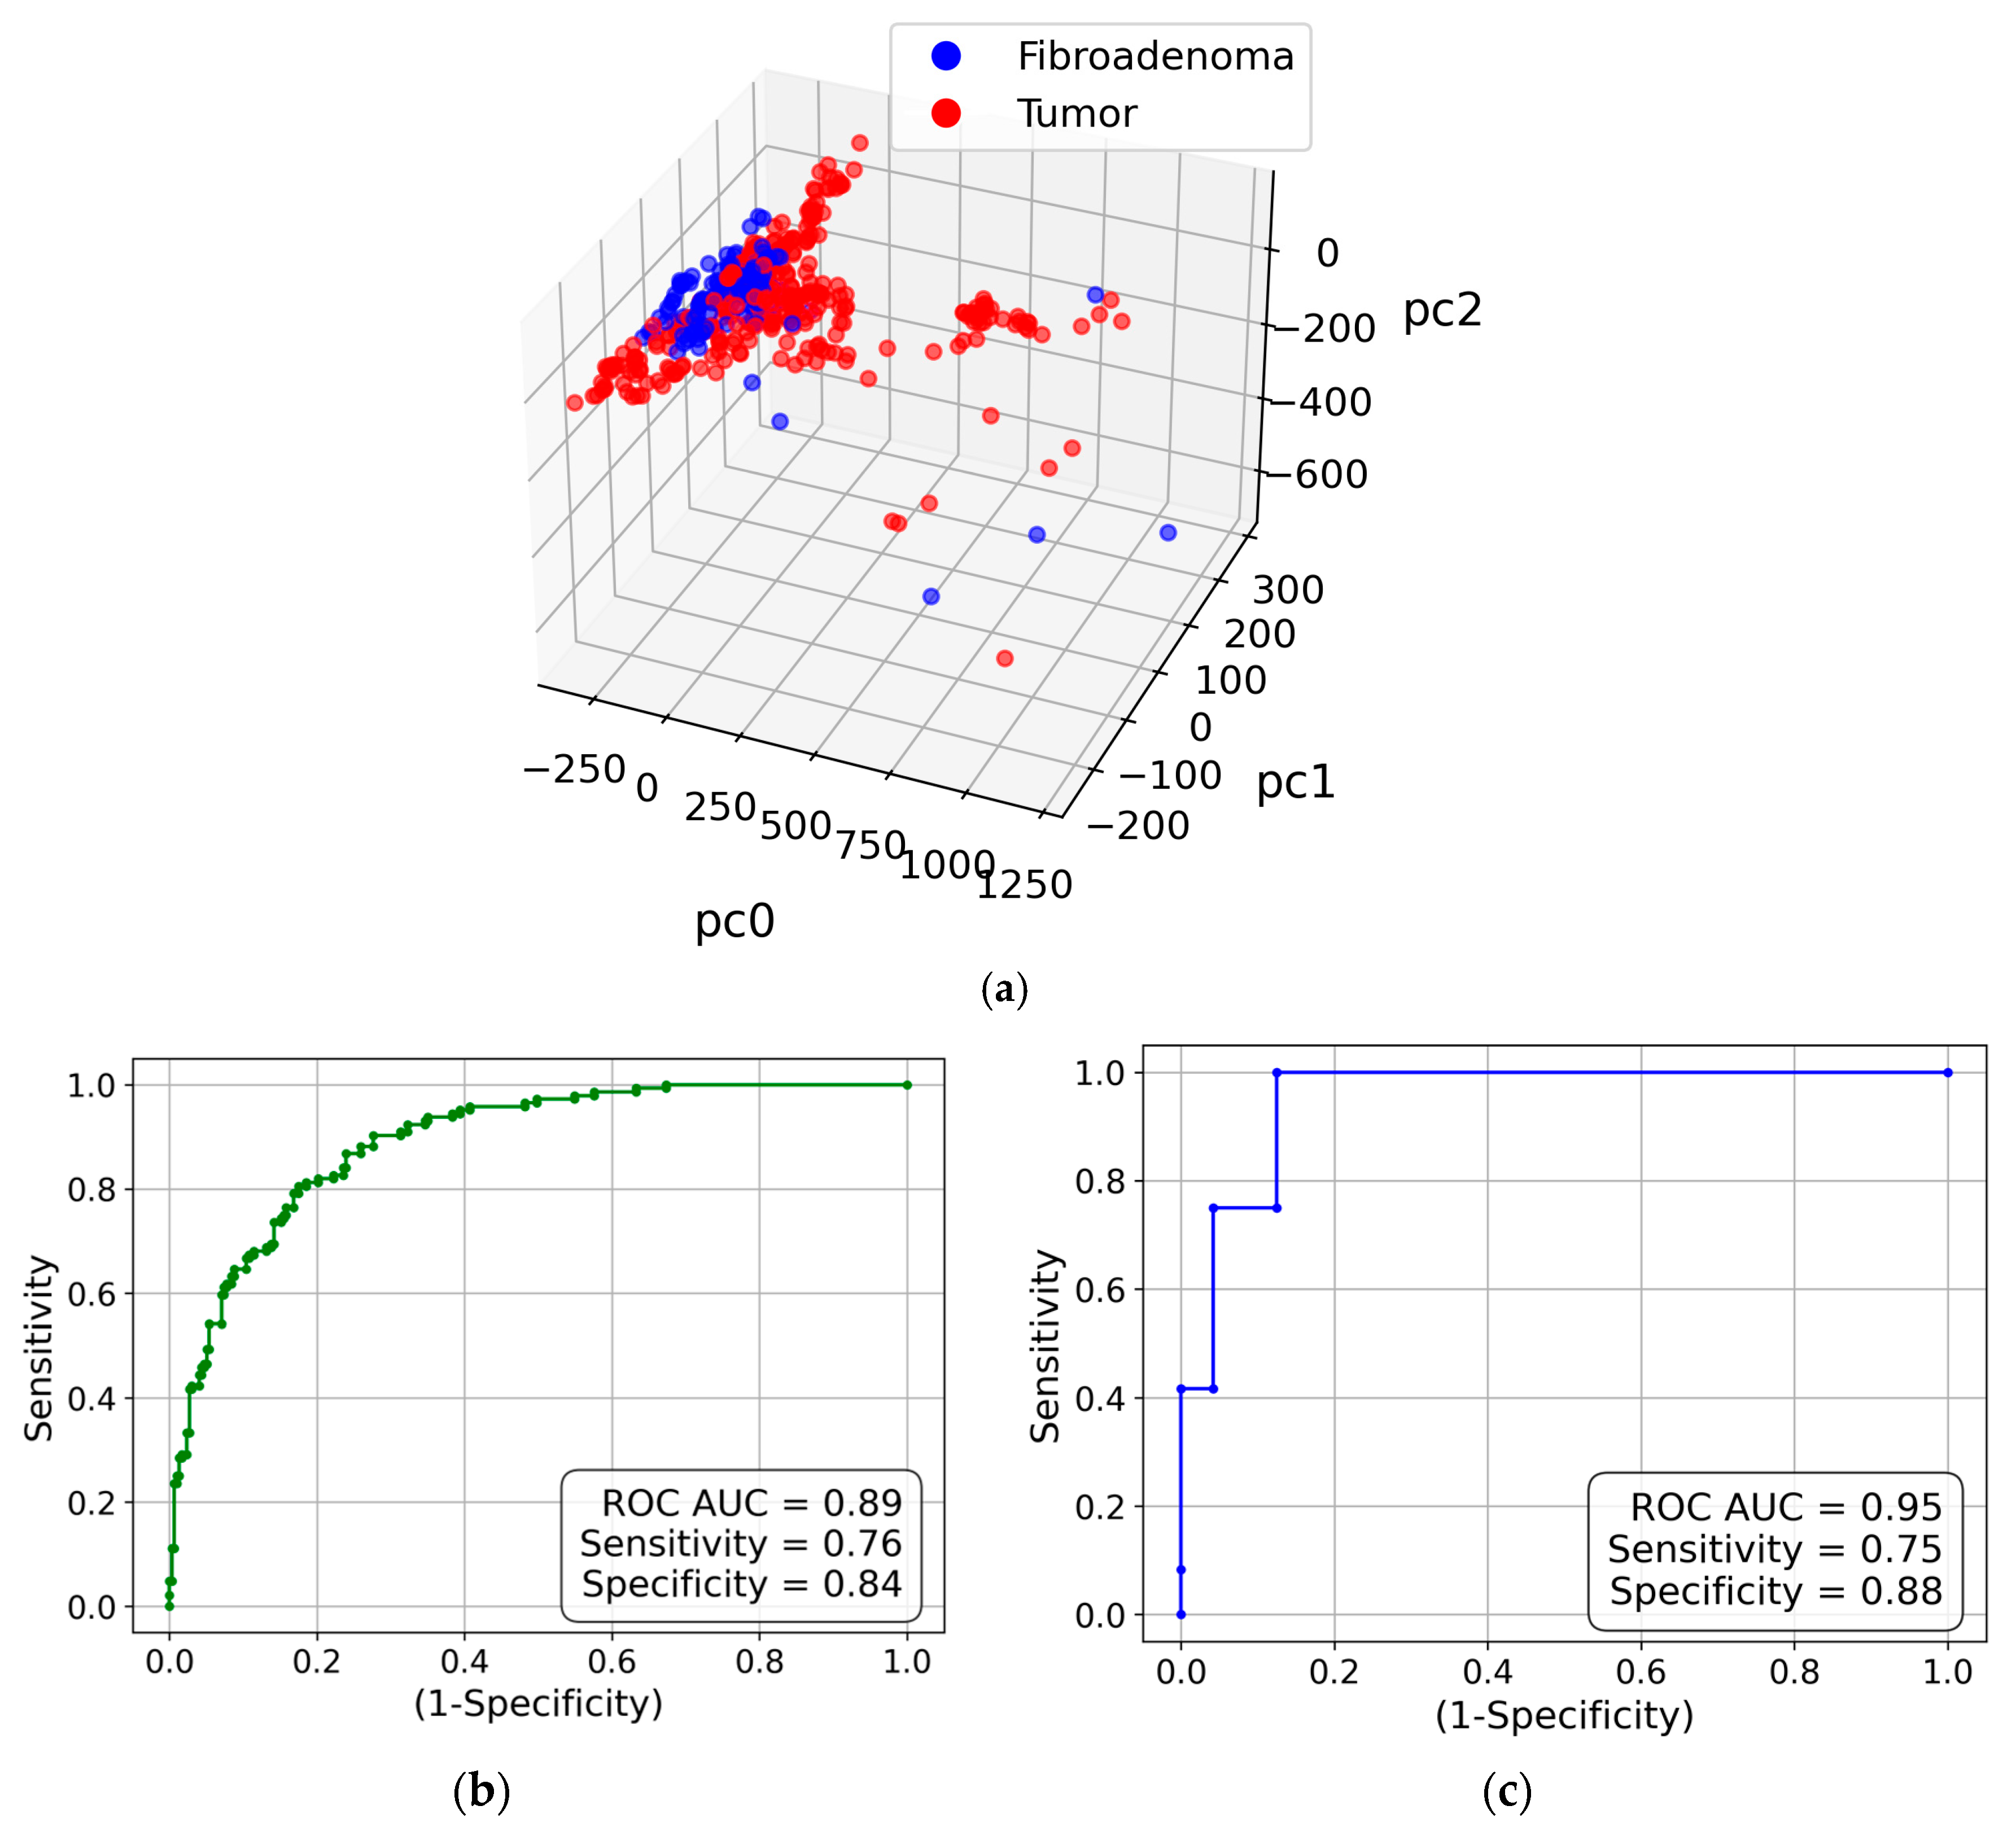
Figure 3.
WAXS images obtained at the synchrotron. Numbers indicate the position of the pixels on the detector. (a) Full image; (b) Image with no lipid contribution. The rectangular cutout in the bottom-right corner of the detector allows simultaneous measurement of the SAXS signal.
Figure 3.
WAXS images obtained at the synchrotron. Numbers indicate the position of the pixels on the detector. (a) Full image; (b) Image with no lipid contribution. The rectangular cutout in the bottom-right corner of the detector allows simultaneous measurement of the SAXS signal.
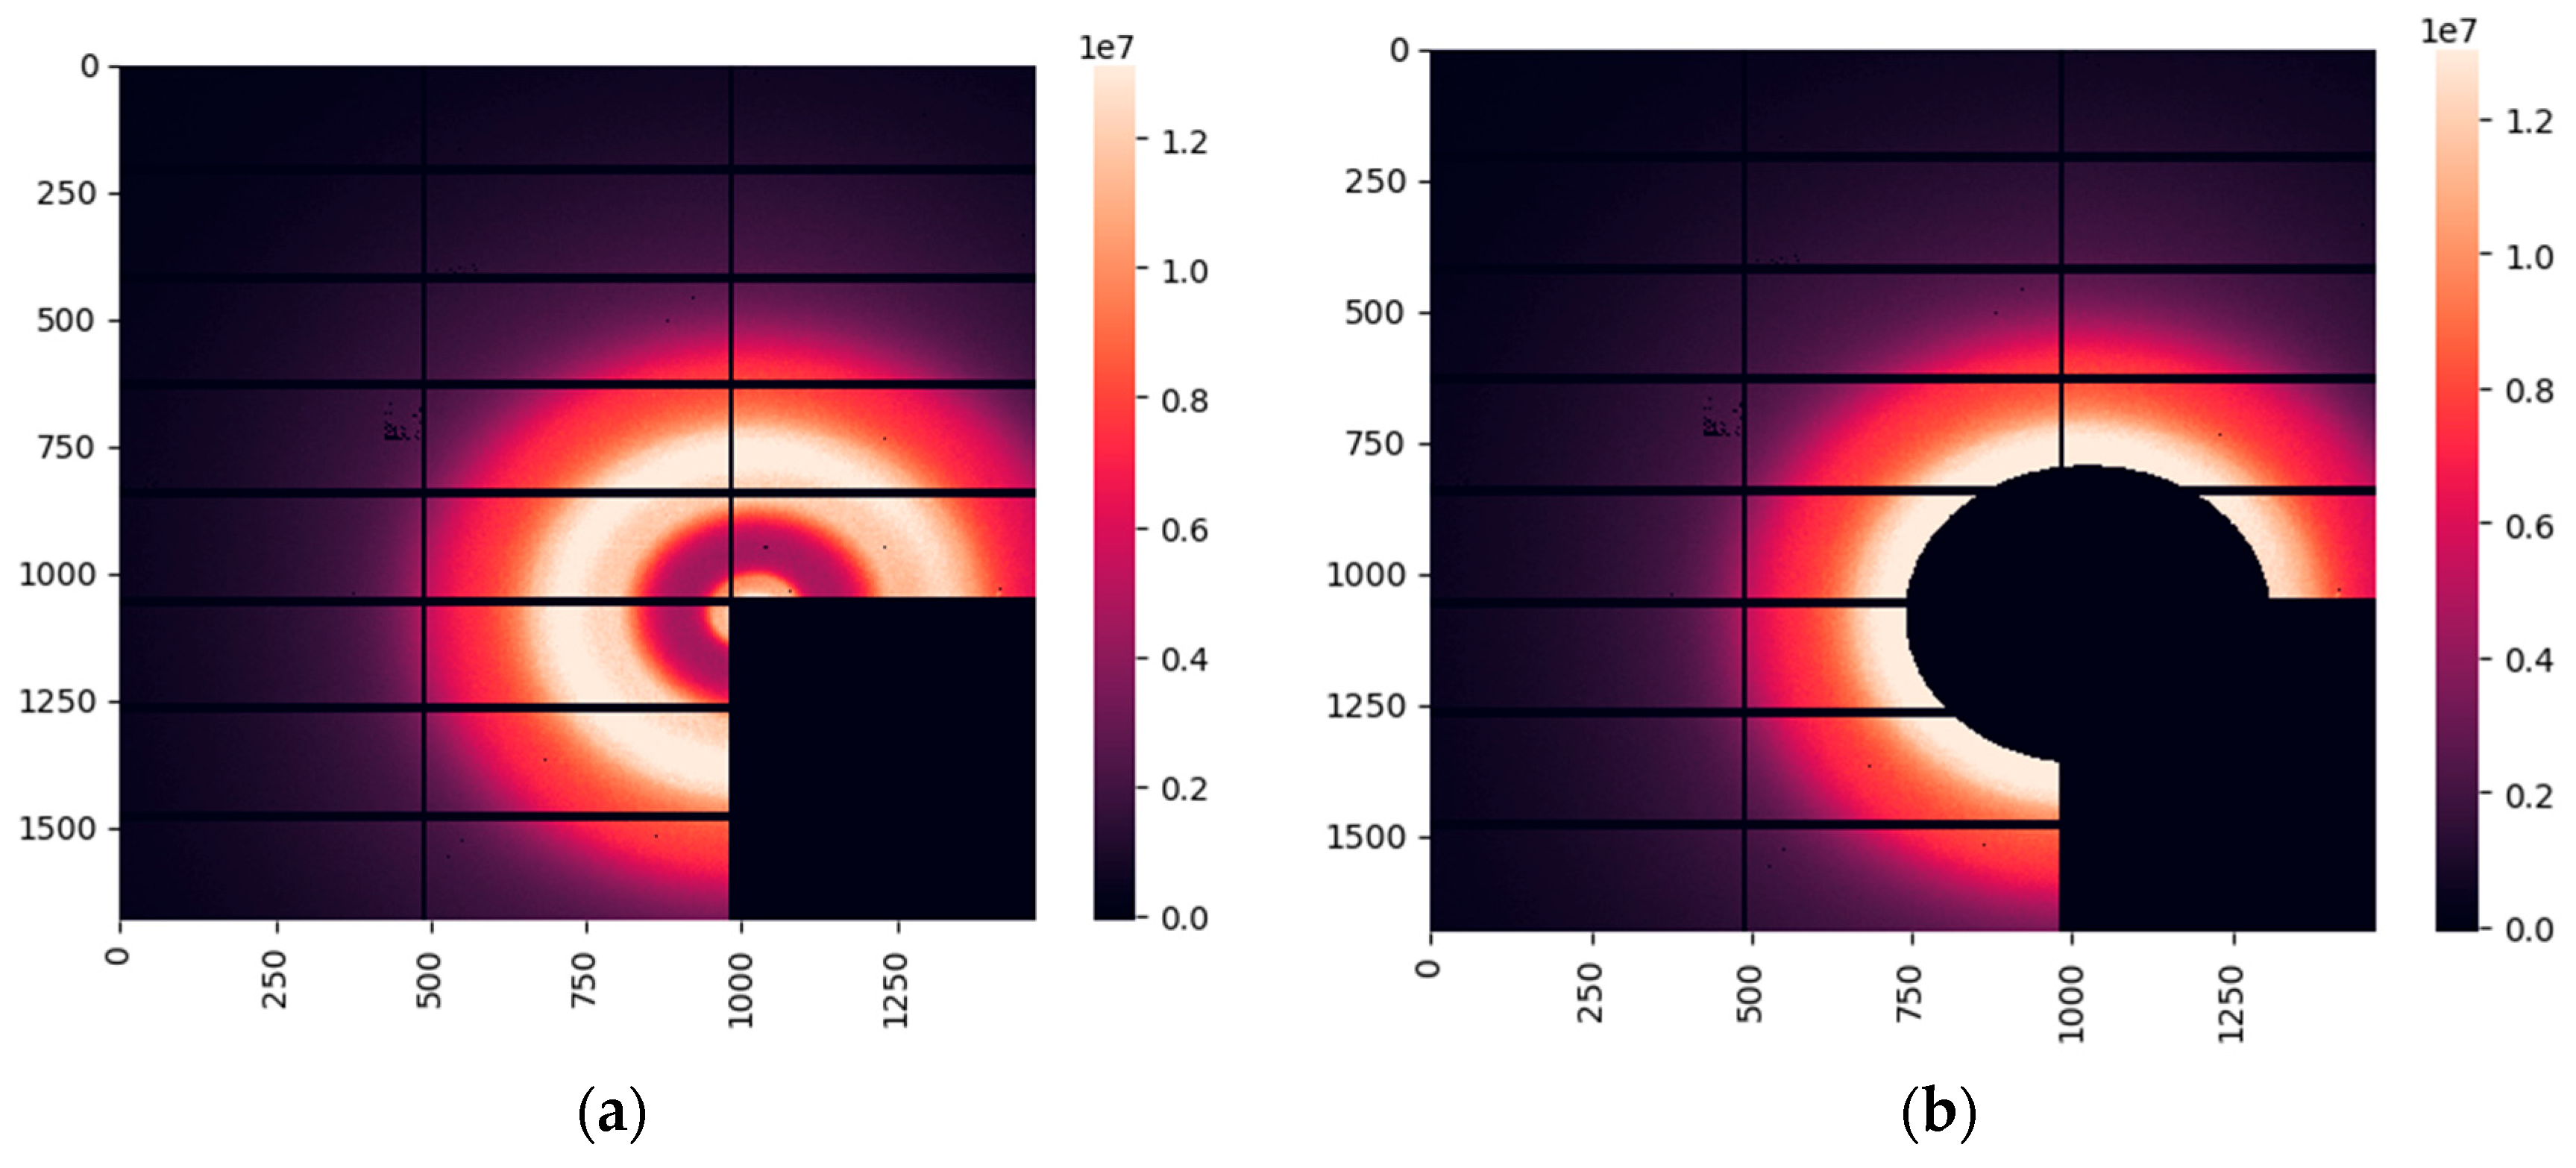
Figure 4.
(a) The PCA-transformed data within the 3D PC space; (b) Measurement-based ROC curve for water contribution to synchrotron WAXS images; (c) Patient-based ROC curve for water contribution to synchrotron WAXS images.
Figure 4.
(a) The PCA-transformed data within the 3D PC space; (b) Measurement-based ROC curve for water contribution to synchrotron WAXS images; (c) Patient-based ROC curve for water contribution to synchrotron WAXS images.
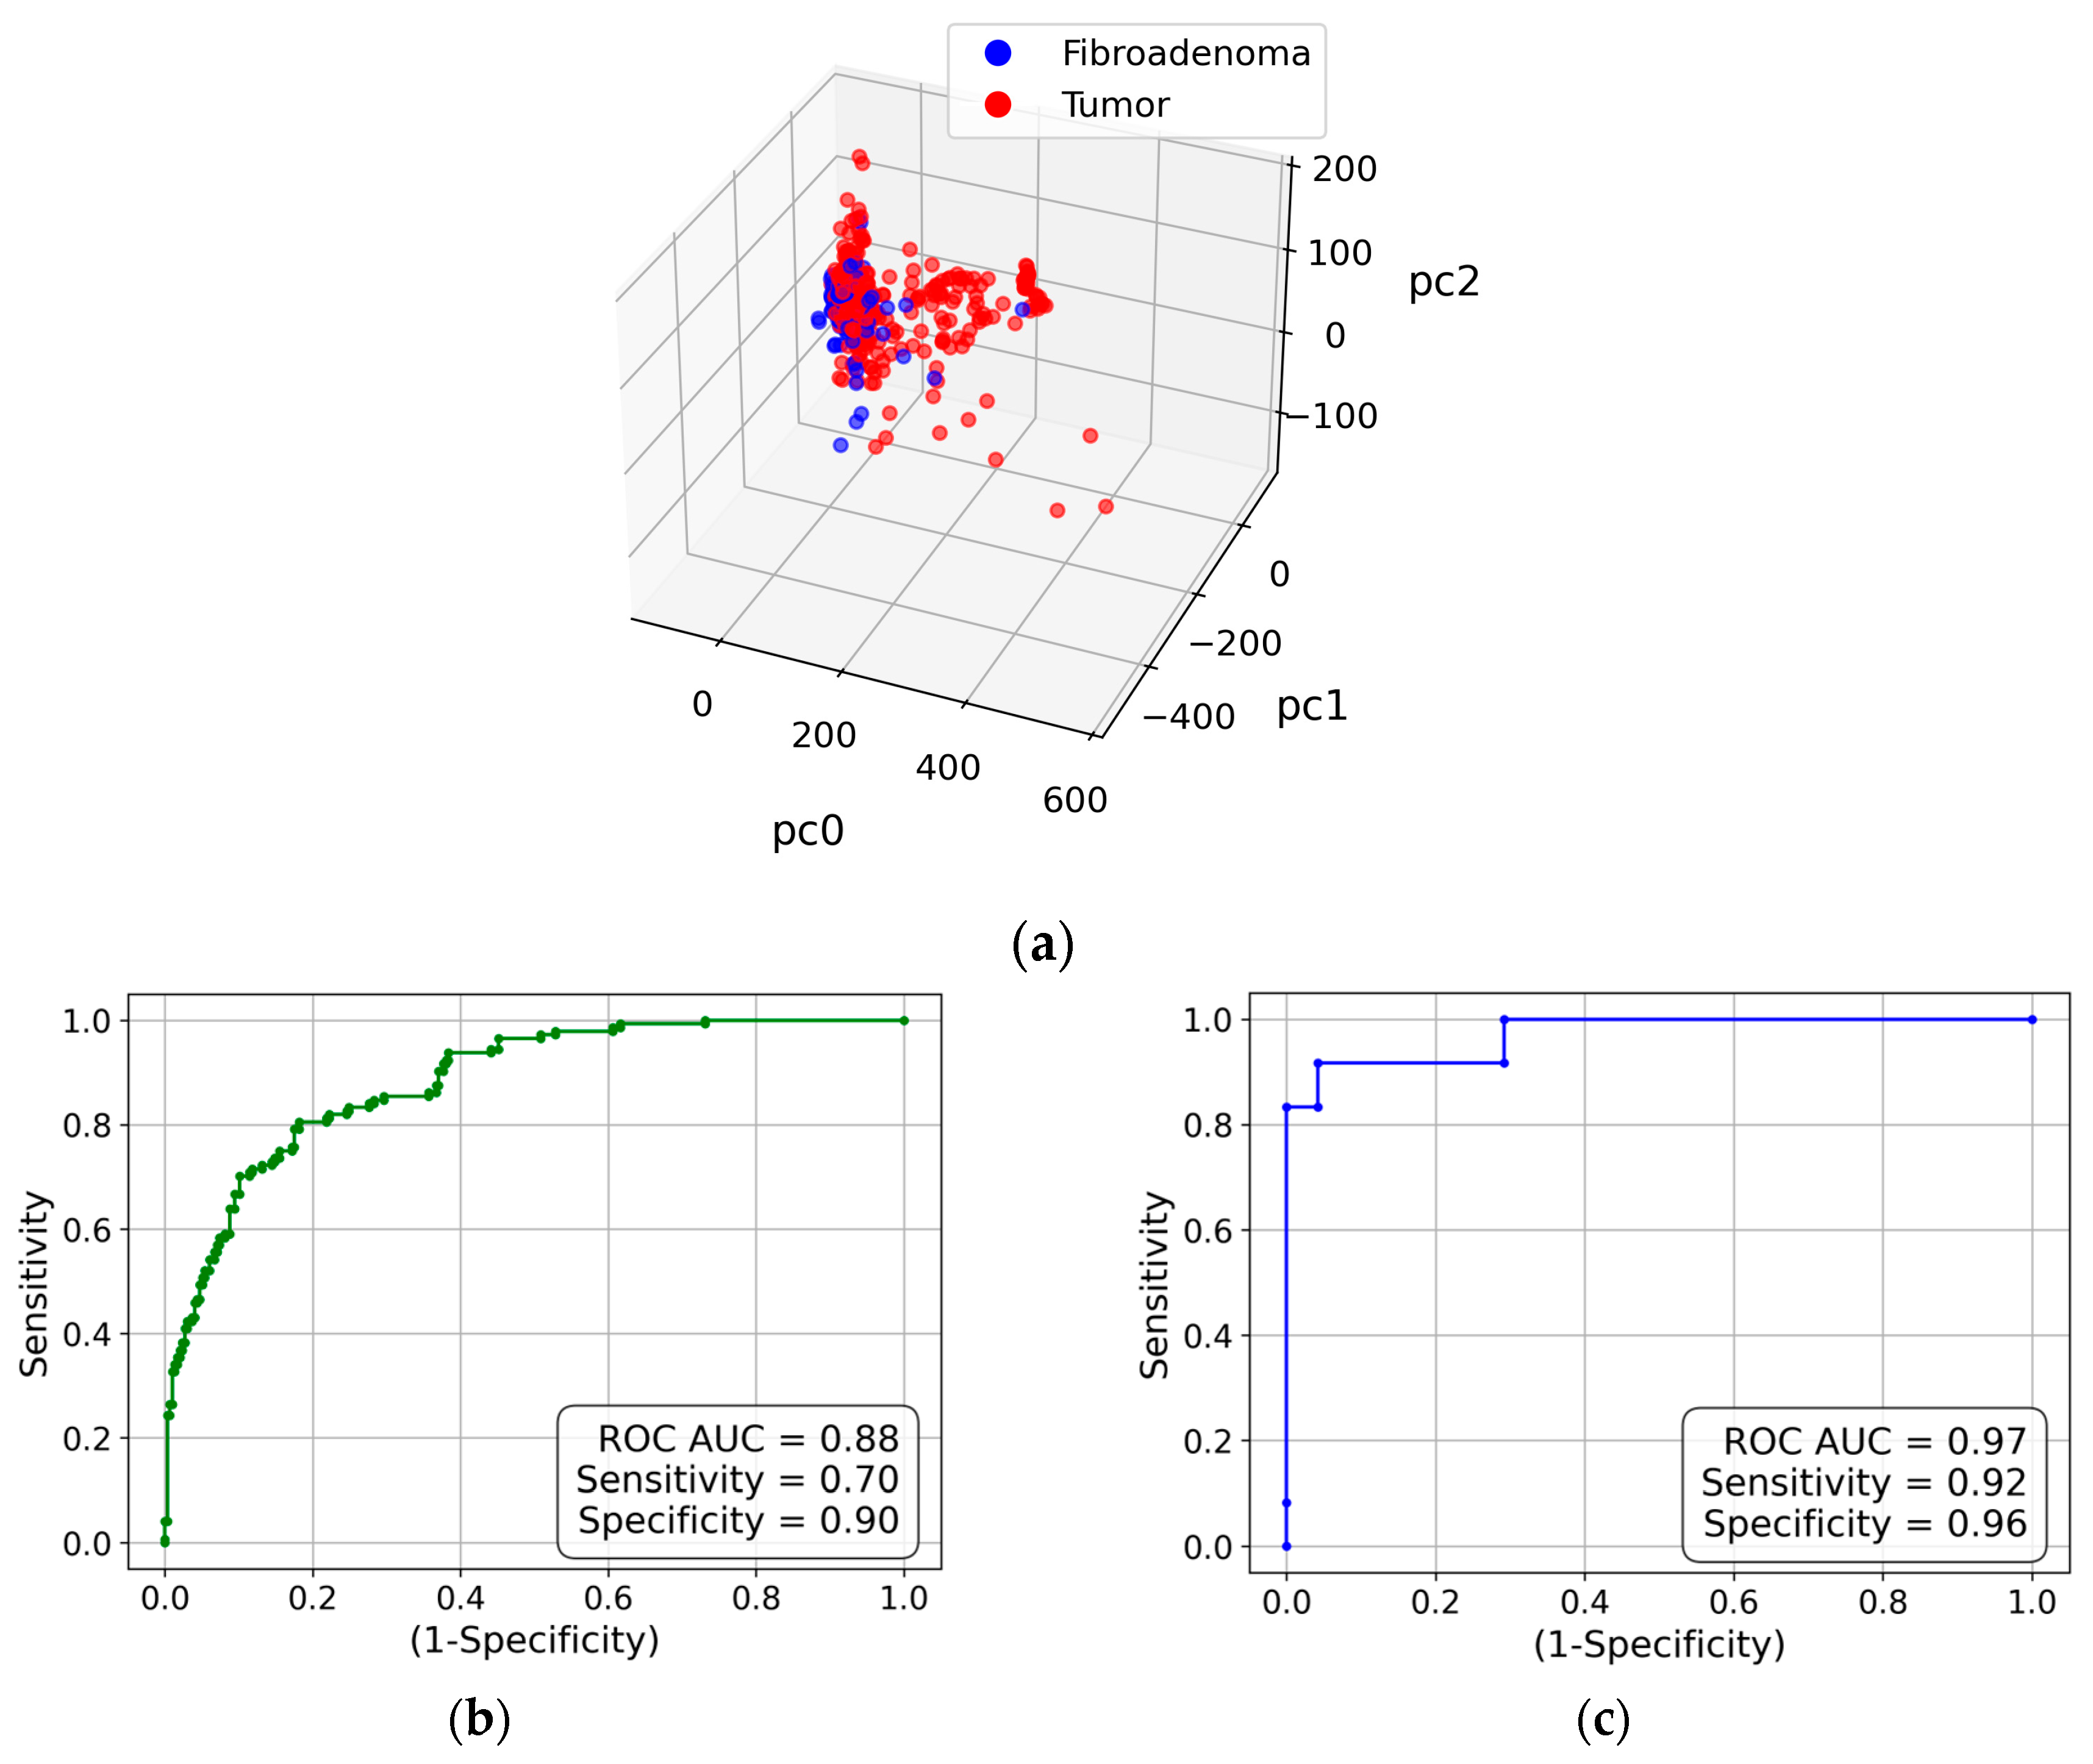
Figure 5.
X-ray scattering images obtained at a laboratory diffractometer. Numbers indicate the position of the pixels on the detector. (a) Full image; (b) Image with only water contribution. The red dashed line indicates the extracted boundary.
Figure 5.
X-ray scattering images obtained at a laboratory diffractometer. Numbers indicate the position of the pixels on the detector. (a) Full image; (b) Image with only water contribution. The red dashed line indicates the extracted boundary.
Figure 6.
(a) The PCA-transformed data within the 3D PC space; (b) Measurement-based ROC curve for water contribution to laboratory WAXS images; (c) Patient-based ROC curve for water contribution to laboratory WAXS images.
Figure 6.
(a) The PCA-transformed data within the 3D PC space; (b) Measurement-based ROC curve for water contribution to laboratory WAXS images; (c) Patient-based ROC curve for water contribution to laboratory WAXS images.
Disclaimer/Publisher’s Note: The statements, opinions and data contained in all publications are solely those of the individual author(s) and contributor(s) and not of MDPI and/or the editor(s). MDPI and/or the editor(s) disclaim responsibility for any injury to people or property resulting from any ideas, methods, instructions or products referred to in the content. |
© 2025 by the authors. Licensee MDPI, Basel, Switzerland. This article is an open access article distributed under the terms and conditions of the Creative Commons Attribution (CC BY) license (http://creativecommons.org/licenses/by/4.0/).
Copyright: This open access article is published under a Creative Commons CC BY 4.0 license, which permit the free download, distribution, and reuse, provided that the author and preprint are cited in any reuse.


