
Submitted:
01 February 2025
Posted:
03 February 2025
You are already at the latest version
Abstract
As the number of new breast cancer cases grows around the world, there is an unmet need for fast, accurate, and low-cost methods of early cancer detection. It was previously shown that X-ray diffraction on lipid molecules can provide the necessary structural biomarker. However, these measurements were performed on small ex-vivo samples, and to ensure the progress to in-vivo diagnostics, the approach should be extended to larger tissues. We use the phantom fat samples to establish such a procedure. In the obtained X-ray diffraction patterns, we observe the characteristic features for the inter-fatty-acid molecular distance. The large size of the samples led to the peak broadening, but the features remain visible up to 10 centimeters in thickness. The experimental data is in excellent agreement with the Monte-Carlo simulations based on the form factors obtained from the small samples. Our results usher the way for in-vivo monitoring of structural biomarkers of breast cancer.
Keywords:
cancer detection
; X-ray scattering
; Monte-Carlo simulations
; structural biomarkers
; lipid molecules
1. Introduction
Breast cancer is the most common cancer diagnosed among females in the United States. Approximately 1 in 8 women in the US (13.1%) will be diagnosed with invasive breast cancer, and 1 in 43 (2.3%) will die from the disease [1]. In 2024, an estimated 310,720 new cases of invasive breast cancers and 56,500 new cases of ductal carcinoma in situ will be diagnosed among women and 2,790 among men in the US [1]. The mortality rate has slightly decreased over the last few years [2], which can be attributed to progress in early diagnostics [3,4]. However, the total number of cases and mortality are still worryingly high, and more breakthroughs are needed.
Mammography is the current standard breast screening technique but has apparent limitations [5]. It is less effective for women with dense breasts, fails to detect 10-30% of breast cancers [6], exposes patients to radiation, and often leads to false positives and overdiagnoses, which cost $4 billion annually [7]. This also requires additional screening tests (with a total cost of $7.91 billion [8]), and the sequence of procedures usually takes several weeks with multiple appointments. Moreover, biopsies are often essential for conclusive diagnoses. These involve histopathological analysis and genetic expression profiling, making the process expensive, time-consuming, and discomforting for patients [9]. It should be noted that over 80% of patients undergoing biopsies do not have cancer, rendering many of them unnecessary [10]. Ultrasound, often used for dense breasts as complementary to the mammogram, while non-invasive, has lower sensitivity and higher variability in diagnosis [11]. Although advanced techniques such as 3D mammograms (tomosynthesis), molecular breast imaging, computerized tomography, magnetic resonance imaging, contrast-enhanced digital mammography, and positron emission tomography offer more accurate diagnostics, they are higher cost and unsuitable for mass screening [5].
Instead of direct probes or imaging of suspicious abnormalities, cancer detection research has recently focused on biomarkers [12,13,14,15], i.e., precancerous or cancer-induced biochemical or molecular alterations. Specific breast cancer-associated biomarkers comprise macromolecules, such as nucleic acid (DNA/RNA), proteins, and intact cells [16]. Another prominent biomarker approach is the liquid biopsy, which detects circulating tumor DNA and cells in body fluids [17,18]. The biomarker tests are non-invasive and performed ex vivo, addressing the convenience and comfort of patients. Still, they are relatively expensive and require significant time to process the results.
Another approach for breast cancer detection employs structural biomarkers obtained from X-ray scattering experiments with human breast tissues. Small-angle X-ray scattering (SAXS) addresses the breast-cancer-induced modifications of collagen fibril repeat distances [19,20,21,22] and changes to the associated amorphous scattering [21,22,23,24]. Wide-angle X-ray scattering (WAXS) delivers information about variations in the lipid and aqueous components [25,26,27,28,29,30,31,32]. In particular, it was shown [28,32] that in cancerous tissues, the intensity of a peak at approximately q = 14 nm-1 is reduced (where q is momentum transfer measured in reciprocal space units). This intensity maximum arises from inter-fatty-acid molecular distances. Concurrently, an intensity maximum at approximately q = 20 nm-1 (associated with the oxygen-oxygen distance in the tetrahedral structure of water) increases. This effect can serve as a structural biomarker for breast cancer detection, but the experiments mentioned above are primarily performed at synchrotron facilities with a limited number of samples. Recently, we employed bespoke laboratory diffractometers for the same purposes and obtained the same peak variations [33,34] on a large number of samples both in the US [33] and the UK [34]. For the WAXS measurements, we achieved 96.3% sensitivity and 91.6% specificity for binary cancer/non-cancer differentiation of the samples using the machine learning approaches.
The proposed cancer detection approach based on X-ray diffractometry appears promising, as it is non-invasive, rapid, and relatively inexpensive. However, significant challenges must be overcome before it can be used for in-vivo applications. In particular, previous experiments were performed on small samples a few millimeters thick, and it is unclear if the same observations can be made for the samples several orders of magnitude larger. First, the incoming X-ray photons can be mostly absorbed, and the scattered signal would be weak. Second, the photons can be scattered multiple times within an extended tissue, resulting in diffraction patterns that may be difficult to interpret. Third, photons scattered by the same structures at different positions along the thick sample will intersect the detector at different positions, leading to peak broadening. Confounding this further, every detector pixel may also receive photons scattered through a different angle when the scattering source occurs at different positions along the primary beam.
The present paper addresses these issues by performing X-ray scattering experiments on phantoms constructed from pork neck bone ends. Instead of the copper anode of Refs. [33,34], we used a silver anode with a shorter wavelength, leading to a significantly larger penetration depth. Two device configurations were used, with and without a beam stop, which prevents the detector saturation and pixel crosstalk caused by the unscattered X-ray beam. We supported our experiments with Monte-Carlo simulations described in the Methods section below.
2. Results
2.1. Measurements of X-Ray Scattering
X-ray scattering experiments were performed on phantom fat samples of various thicknesses, 2, 4, 6, 8, and 10 cm, to evaluate the role of sample thickness on the characteristics of the scattered signal. The measurements were taken at three lateral points on each sample. The representative images obtained at 2 cm thickness are shown in Figure 1 for two device configurations, with and without the beam stop.
After the azimuthal integration and averaging over three points of the measurements, we obtain the dependence of intensity on the momentum transfer, as shown in Figure 2, also for two device configurations.
An intensity maximum, characteristic of fat, occurring at approximately 14.5 nm-1, is clearly seen in all curves, even for the samples of 10 cm thickness. At smaller thicknesses, this peak is resolved into several narrower maxima associated with different forms of lipids [35,36]. At larger thicknesses, the inherent peak broadening leads to overlapping the separate peaks. The intensity of the scattered signal decreases with increasing thickness, d, because of the dominance of X-ray absorption (d > 1/μ where μ is the tissue linear absorption length at Ag wavelengths). At large values of q, the signal/noise as measured by the detector is smaller without the beam stop, so the beam stop is desirable for the experiment addressing the fat peak at 14.5 nm-1. However, at small values of q, the beam stop produces artifacts, as seen in Figure 2(a), making analyzing the signals difficult. In the region below 5 nm-1, signal decay with 1/q dependence is associated with X-ray scattering by air molecules in the interval between the sample and the detector. Any amorphous scattering with a 1/q4 dependence overlaps with the primary beam or is screened by the beam stop and is not apparent. A low-intensity peak at 4.5 nm-1, representing the third order of the triglyceride packing [35,36], is also visible. There is a peak or shoulder at about 9 nm-1, but the origin of this feature is unclear.
2.2. Monte-Carlo Simulations
Monte-Carlo simulations were performed to complement the experimental results and provide a theoretical understanding of the scattering behavior in thick samples. The simulations allowed for independent control of parameters such as scattering type, photon energy, and sample geometry, offering insights that are otherwise extremely difficult to obtain experimentally. In this model, the monochromatic photons were emitted from the source with a specific geometry. The tissue was represented by material with form factors corresponding to adipose tissues [37]. With a certain probability, each photon from the source can be absorbed, transmitted, or scattered (by the Raleigh or Compton process) one or more times in the sample. Depending on the geometry, some scattered photons will not intersect the detector. For each X-ray photon the detector captures, the following information was stored for analysis: energy, six-dimensional coordinates for position and momentum, ID for the event, number of Rayleigh scatterings, number of Compton scatterings, and number of diffraction events. We consistently used 5×10⁷ incident photons for our simulations.
Higher-order scatterings—double, triple, and beyond—become increasingly prominent with thickness increase. The photon numbers for these events (out of 5×10⁷) are shown in Figure 3, with the left and right panels corresponding to 4 and 10 cm thicknesses, respectively.
For a 4 cm thickness (Figure 3(a)), the scattering accounts for 83% of the total signal, whereas in a 10 cm sample, this reduces to 64%. The triple scattering is rare in both cases, appearing as a background noise, and the adipose peak is well resolved.
We also separated the contributions of various scattering processes, with the results shown in Figure 4 for 4 (left panel) and 10 cm (right panel) thicknesses.
This figure demonstrates that the Raleigh scattering dominates the region of interest in our studies (10-20 nm-1), especially at the momentum transfer of the adipose peak. The large feature at zero transfer momentum corresponds to the unscattered photons. The magnitude of the signal is much smaller at 10 cm thickness because of increased absorption.
2.3. Comparison of Experiments and Simulations
To compare the Monte-Carlo results with experimental data, we simulated X-ray scattering on adipose samples with thicknesses corresponding to those of the experimental counterparts. In all cases, 5×10⁷ photons were incident on the sample. The scattered photons incident on the detector were azimuthally integrated to provide the dependence of the intensity on momentum transfer, q. The results are shown in Figure 5.
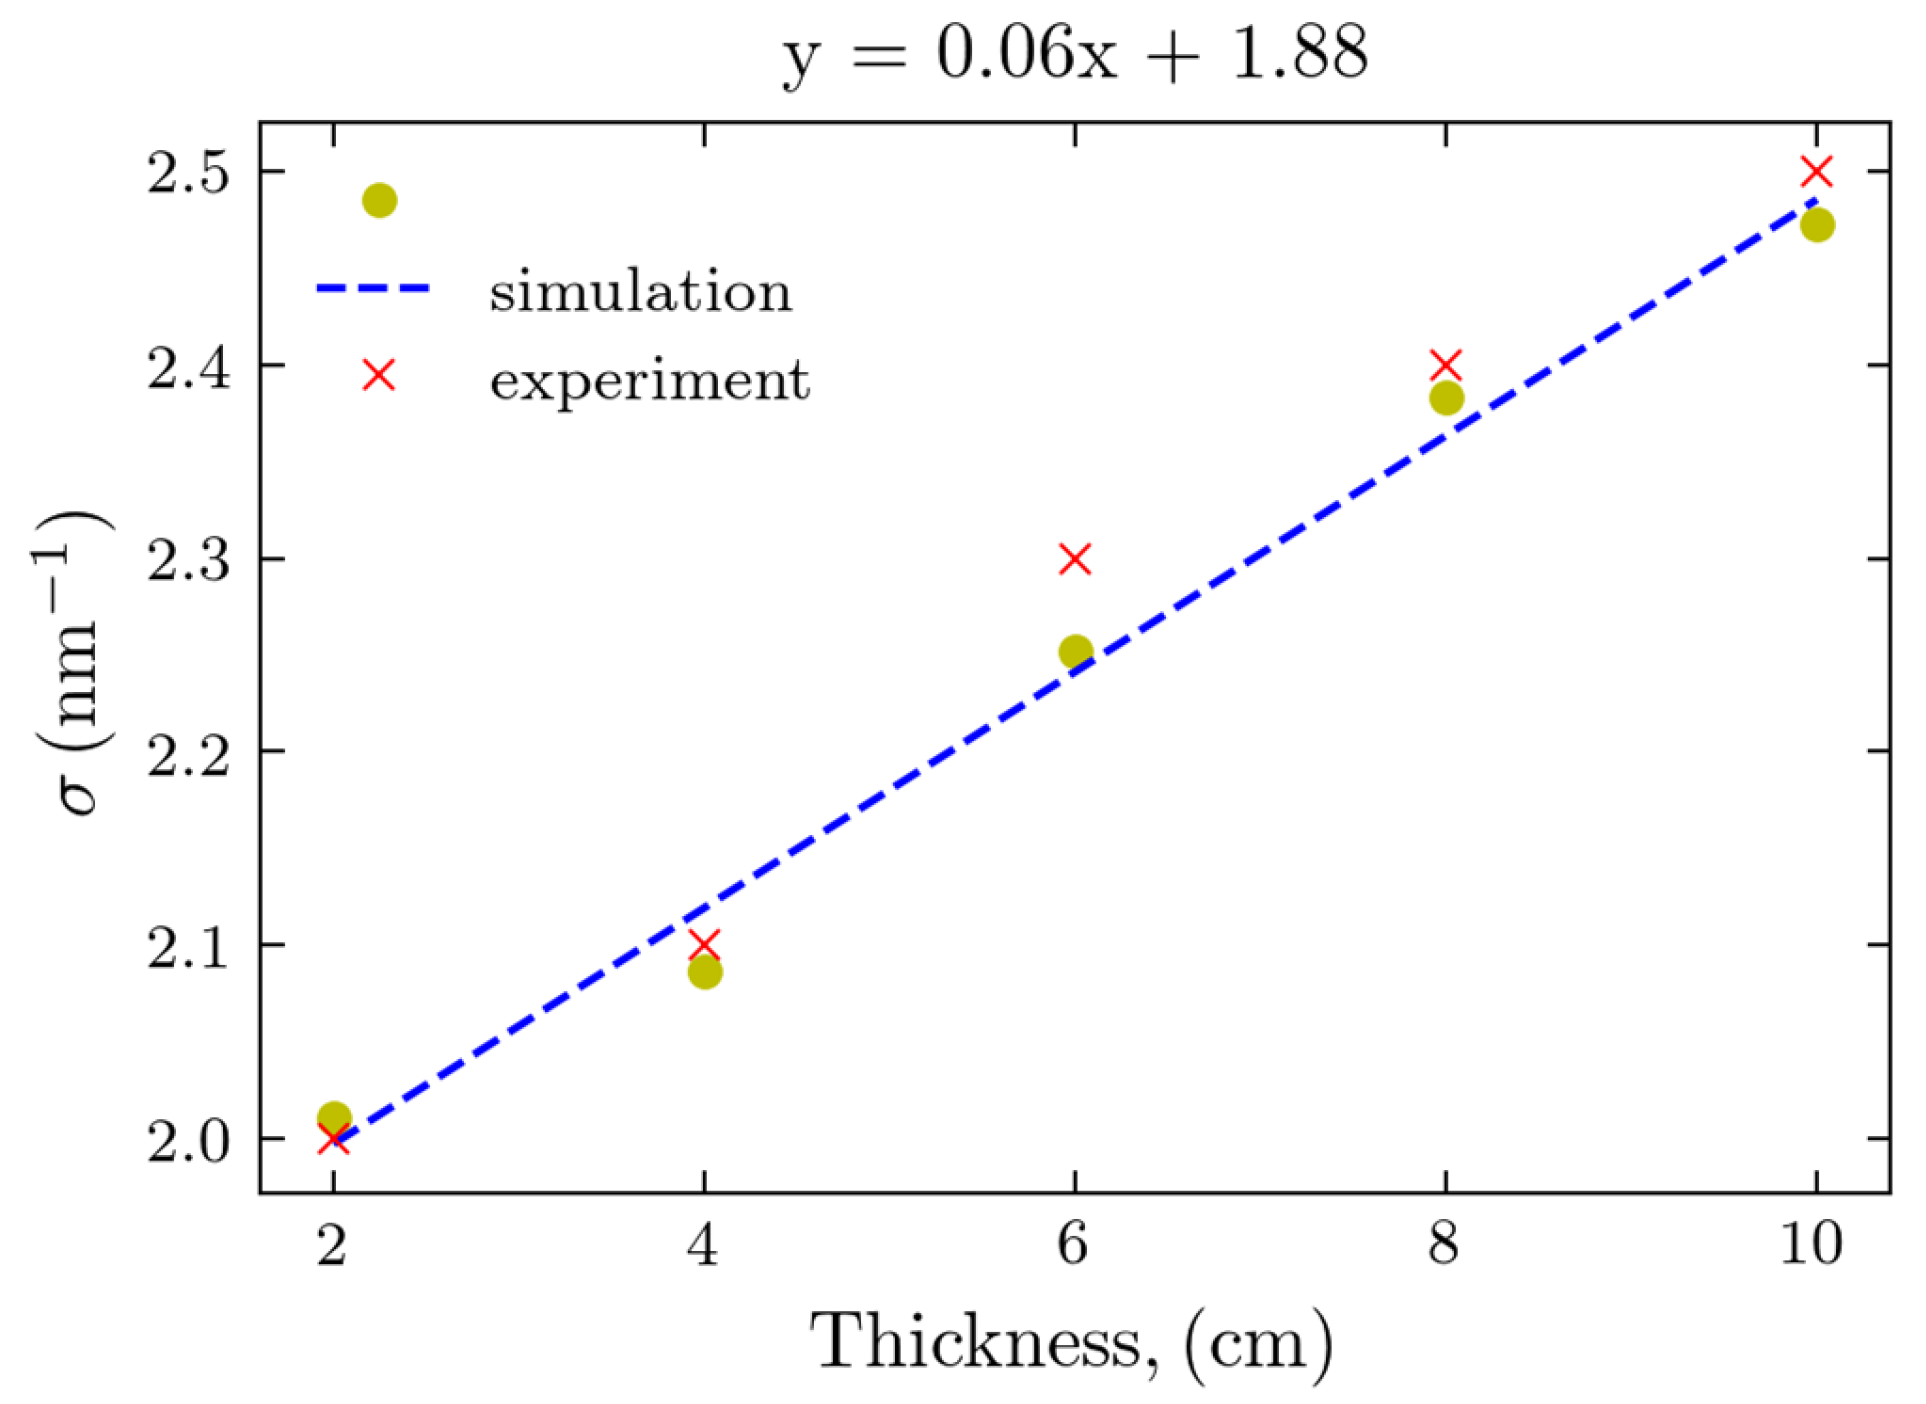
It is evident from Figure 5 that the fat form factor produced a peak at approximately 14.5 nm-1, as expected. The width of this peak increased with increasing thickness, and its magnitude decreased. However, the peak remains discernable up to a thickness of 10 cm, similar to the experimental observations of Figure 2. To further compare the experimental results and simulations, we performed the least squares, Gaussian fit to the maxima profiles of Figs. 5 and 2(a). Experimentally, the device with the beam stop was used due to its greater S/N. The determined peak widths of the calculated and experimental Gaussian peaks are presented in Figure 6.
Both results follow the linear fit with the thickness increasing, and remarkably, the values obtained from the Monte-Carlo simulations are in excellent agreement with those of actual experiments, as the corresponding points are almost overlapping.
We also compared the tissue attenuation between simulated and actual experiments by integrating the intensity at small q, up to q = 3, using Figure 5 for the simulated results and Figure 2(b) (no beam stop) for the experiment.
Figure 7.
Integrated transmitted intensity for various thicknesses of the samples and the exponential fit. (a) Monte-Carlo simulations; (b) Experiment.
Figure 7.
Integrated transmitted intensity for various thicknesses of the samples and the exponential fit. (a) Monte-Carlo simulations; (b) Experiment.
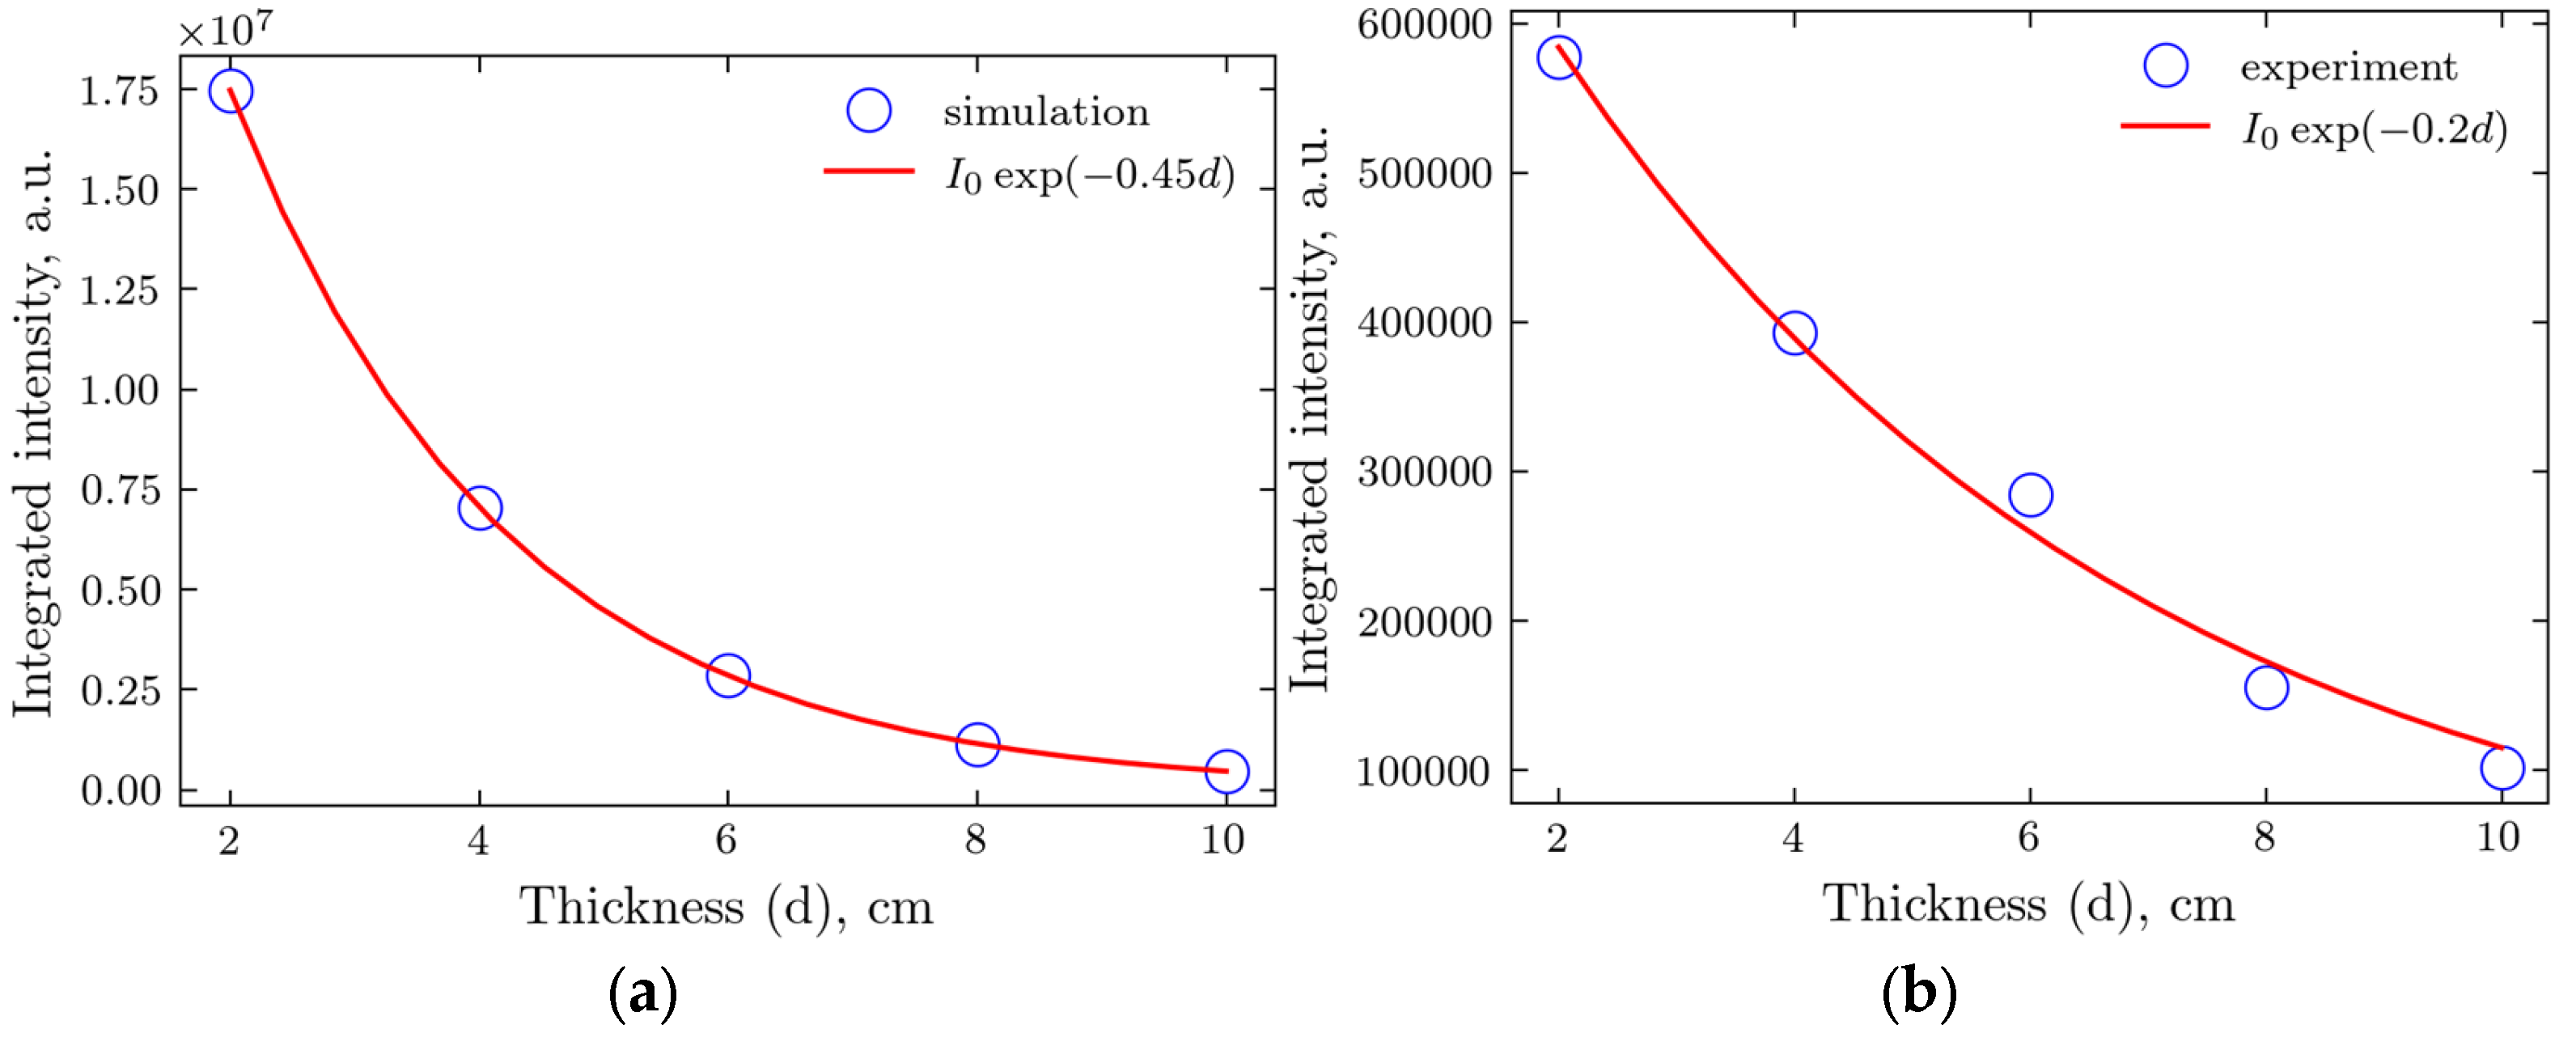
Beer-Lambert’s law [38], with its exponential dependence on the thickness, works well for both simulated and experimental data. Still, the attenuation coefficient for the latter is somehow more than two times smaller. This is probably caused by the non-uniform packing, with a fraction of less than 1 for the samples. At the same time, the material for the simulations is supposed to be uniform without any voids.
3. Discussion
It is evident from Figure 2 that the proposed cancer detection method based on structural biomarkers obtained utilizing X-ray scattering is feasible for in-vivo applications. The intensity maxima corresponding to scattering from fat, previously used for cancer/non-cancer classification in small biopsy breast cancer samples, is visible up to a sample thickness of 10 cm. This was achieved due to an updated laboratory diffractometer with an X-ray source based on more penetrating Ag wavelength photons. We explored two device configurations, with and without a beam stop. At large momentum transfer values, the signal produced by the device with the beam stop is less noisy, and evaluating the fat peak properties is easier. However, at small q, the beam stop produces artifacts, and the device can better examine the small-angle scattering without it.
Monte-Carlo simulation appeared to be a valuable tool for supporting the X-ray scattering experiment. Using the form factor obtained from synchrotron experiments with small samples, we could model the experiment with much larger samples and with different energies of the X-ray photons. The fat peak widths obtained in the simulation are in excellent agreement with the experimental data.
The results obtained in our work demonstrate the potential feasibility of in-vivo breast cancer detection. This approach can be first extended to phantom samples prepared from human breast tissues, and eventually, our diffractometer can be modified to be used in vivo. Monte-Carlo simulations can connect the small- and large-sample results with the form factors initially taken as the mixture of the tissue components and ultimately determined from direct X-ray scattering experiments with human tissues.
4. Materials and Methods
4.1. Sample Preparation
Three mylar tubes were constructed using stencil sheets, each with a diameter of 4 cm and an initial length of 10 cm. The first tube was filled with adipose tissue isolated from the neck bone ends of pork. The second tube was filled with a silver behenate (AgBH) powder (Thermoscientific® 045494.06, Waltham, MA, USA) as a calibration standard. The third tube was left empty to measure background levels. For each measurement, the sample height was progressively reduced by removing material and trimming the tube in 2 cm increments, starting from the initial length of 10 cm. Measurements were taken at the tube lengths of 10 cm, 8 cm, 6 cm, 4 cm, and 2 cm.
4.2. XRD Measurements
Measurements were performed using a custom-built vertical optical axis diffractometer equipped with a Photon III 7HE detector and a silver anode x-ray source built by Bruker Corporation (Billerica, MA, USA). The CMT detector featured a 135-micron pixel size and 768 × 512 pixels sensitive area. Experiments were undertaken with and without the use of a primary beam stop. The detector was aligned so that the primary beam would intersect near the center of the shorter side and the edge of the sensitive area, such that a broader range of scattering angles could be measured. The X-ray source power was 50 kV and 1000 mA (50W), while a standard 110V outlet powered the entire instrument. The primary beam was shaped and focused by Montel mirror-focusing optics and then collimated with a custom-built tungsten collimator with an 800-micron diameter pinhole aperture.
Following the background and calibration scans, measurements of animal adipose tissue were conducted. Starting at a sample length of 10 cm, measurements were collected at three distinct points (P1, P2, and P3) on the tissue. For P1, exposure times of 30 seconds, 60 seconds, and 120 seconds were used, while for P2 and P3, a single exposure time of 120 seconds was applied. After completing measurements at each length, the sample length was reduced by 2 cm, and the process was repeated until reaching the final length of 2 cm. The same procedures were applied for scans with a beam stop, including trimming the sample and measuring three distinct points at each length. These measurements were performed using an exposure time of 180 seconds.
4.3. Image Processing
As the beam stop created a shadow region with a low intensity of the same, it was cut out and replaced with “null” values so that the azimuthal integrator would disregard those pixels. In this, the shadow region was manually overlayed. The calibration measurement of AgBH with 2 cm thickness was used to determine the location of the beam center and the sample-to-detector distance. The calculated distance to the sample center was 71 cm, so the actual distance to the sample support platform was 72 cm. For samples of different thicknesses, the effective sample-to-detector distances for azimuthal integration were calculated as 72—(thickness/2) cm.
4.4. Data Processing
After the azimuthal integration of scattering patterns, the dependence of the intensity on the distance to the center was obtained. It was recalculated to the dependence on the momentum transfer q = (4π sin θ)/λ, where sin 2θ is the ratio of the distances from the pixel to the center and from the sample to the detector. Next, the measurements of the three points corresponding to the same distance were averaged.
4.5. Monte-Carlo Simulations
For Monte-Carlo simulations, we used the Geant4 simulation toolkit [39], which is a widely used platform for modeling interactions between particles and matter. Initially developed for high-energy physics applications at CERN, it is now also applied in other fields, including medical physics and materials science, due to its ability to simulate complex geometries and interactions across various energies. Geant4 provides tools to define geometries, materials, and physics processes, making it suitable for X-ray scattering simulations. It includes elastic (Rayleigh) and inelastic (Compton) scattering, as well as photoelectric absorption, with the material form factors derived from experimental scattering patterns, mainly measured at a synchrotron. While effective for non-biological materials, this approach is challenging to apply to biological tissues due to their complex and variable composition. Paterno et al. [37] demonstrated the applicability of this software by simulating SAXS experiments on structured materials. In this, biological samples were approximated as mixtures of four primary components: fat, water, collagen, and calcium hydroxyapatite. The overall form factor of the sample is then calculated as a weighted combination of these basis materials, each incorporating interference effects. In the present work, we used only the fat form factor. We consider a pencil 22 keV X-ray beam (Ag wavelength) of 100 micrometers radius, with all the scattering processes taking place in a vacuum.
5. Conclusions
The main conclusion of our work is that the structural biomarkers obtained in the small biopsy samples can be observed in the samples of the sizes of the human organs. This proves the feasibility of fast, accurate, and inexpensive cancer detection based on X-ray scattering.
Author Contributions
Conceptualization, L.M. and P.L.; methodology, V.K., M.K., A.L., K.R., and P.L.; software, V.K. and M.K.; validation, B.A., K.R., L.M., and P.L.; formal analysis, V.K. and M.K.; investigation, V.K., M.K., A.T., A.N., and B.A.; resources, A.L. and P.L.; data curation, V.K., M.K., A.T., and A.N.; writing—original draft preparation, V.K., A.T., and L.M.; writing—review and editing, K.R., L.M., and P.L.; visualization, V.K. and M.K.; supervision, B.A., L.M., and P.L.; project administration, B.A. and P.L.; funding acquisition, P.L. All authors have read and agreed to the published version of the manuscript.
Funding
This research received no external funding.
Institutional Review Board Statement
Not applicable.
Informed Consent Statement
Not applicable
Data Availability Statement
The files with the XRD patterns and results of Monte-Carlo simulations are available at https://doi.org/10.5281/zenodo.14775480. The codes for the image processing are available upon request.
Conflicts of Interest
P.L. is a shareholder of Matur UK, Ltd. and EosDx, Inc. V.K. and M.K. are consultants for Matur UK, Ltd. A.T., A.N., A.L., and B.A. are employees of EosDx, Inc. K.R. and L.M. are consultants for EosDx, Inc.
References
- American Cancer Society, Breast Cancer Facts & Figures 2024-2025, Atlanta: American Cancer Society, USA, 2024.
- Siegel, R.L.; Giaquinto, A.N.; Jemal, A. Cancer statistics, 2024. CA Cancer J Clin. 2024, 74, 12–49. [Google Scholar] [CrossRef] [PubMed]
- Migowski, A. Early detection of breast cancer and the interpretation of results of survival studies. Cienc. Saude Coletiva 2015, 20, 1309. [Google Scholar] [CrossRef] [PubMed]
- Taylor, C.; McGale, P.; Probert, J.; Broggio, J.; Charman, J.; Darby, S.C.; Kerr, A.J.; Whelan, T.; Cutter, D.J.; Mannu, G.; Dodwell, D. Breast cancer mortality in 500 000 women with early invasive breast cancer diagnosed in England, 1993-2015: Population based observational cohort study. BMJ 2023, 381, e074684. [Google Scholar] [CrossRef] [PubMed]
- Wang, L. Early Diagnosis of Breast Cancer. Sensors 2017, 17, 1572. [Google Scholar] [CrossRef]
- Majid, A.S.; de Paredes, E.S.; Doherty, R.D.; Sharma, N.R.; Salvador, X. Missed breast carcinoma: Pitfalls and pearls. Radiographics 2003, 23, 881–895. [Google Scholar] [CrossRef]
- Ong, M.S.; Mandl, K.D. National expenditure for false-positive mammograms and breast cancer overdiagnoses estimated at $4 billion a year. Health Aff (Millwood) 2015, 34, 576–583. [Google Scholar] [CrossRef]
- Vlahiotis, A.; Griffin, B.; Stavros, A.T.; Margolis, J. Analysis of utilization patterns and associated costs of the breast imaging and diagnostic procedures after screening mammography. Clinicoecon Outcomes Res 2018, 10, 157–167. [Google Scholar] [CrossRef]
- Keemers-Gels, M.E.; Groenendijk, R.P.; van den Heuvel, J.H.; Boetes, C.; Peer, P.G.; Wobbes, T.H. Pain experienced by women attending breast cancer screening. Breast Cancer Res Treat 2000, 60, 235–240. [Google Scholar] [CrossRef]
- Kirchner, J.T. Accuracy of Fine Needle Aspiration Breast Biopsy. Am. Fam. Physician 1998, 57, 2835–2836. [Google Scholar]
- Boca Bene, I.; Ciurea, A.I.; Ciortea, C.A.; Dudea, S.M. Pros and Cons for Automated Breast Ultrasound (ABUS): A Narrative Review. J Pers Med 2021, 11, 703. [Google Scholar] [CrossRef]
- Hulka, B.S. Overview of biological markers. In Biological Markers in Epidemiology; Hulka, B.S., Griffith, J.D., Wilcosky, T.C., Eds.; Oxford University Press: New York, USA, 1990; pp. 3–15. [Google Scholar]
- Naylor, S. Biomarkers: Current perspectives and future prospects. Expert Rev Mol Diagn 2003, 3, 525–529. [Google Scholar] [CrossRef] [PubMed]
- Henry, N.L.; Hayes, D.F. Cancer biomarkers. Mol Oncol 2012, 6, 140–146. [Google Scholar] [CrossRef] [PubMed]
- Passaro, A.; Al Bakir, M.; Hamilton, E.G.; Diehn, M.; André, F.; Roy-Chowdhuri, S.; Mountzios, G.; Wistuba, I.I.; Swanton, C.; Peters, S. Cancer biomarkers: Emerging trends and clinical implications for personalized treatment. Cell 2024, 187, 1617–1635. [Google Scholar] [CrossRef] [PubMed]
- Afzal, S.; Hassan, M.; Ullah, S.; Abbas, H.; Tawakkal, F.; Khan, M.A. Breast Cancer; Discovery of Novel Diagnostic Biomarkers, Drug Resistance, and Therapeutic Implications. Front Mol Biosci 2022, 9, 783450. [Google Scholar] [CrossRef]
- Alix-Panabières, C.; Pantel, K. Circulating tumor cells: Liquid biopsy of cancer. Clinic Chem 2013, 59, 110–118. [Google Scholar] [CrossRef]
- Crowley, E.; Di Nicolantonio, F.; Loupakis, F.; Bardelli, A. Liquid biopsy: Monitoring cancer-genetics in the blood. Nat Rev Clinic Oncol 2013, 10, 472–484. [Google Scholar] [CrossRef]
- Lewis, R.A.; Rogers, K.D.; Hall, C.J.; Towns-Andrews, E.; Slawson, S.; Evans, A.; Pinder, S.E.; Ellis, I.O.; Boggis, C.R.M.; Hufton, A.P.; Dance, D.R. Breast cancer diagnosis using scattered X-rays. J. Synchrotron Rad. 2000, 7, 348–352. [Google Scholar] [CrossRef]
- Fernandez, M.; Keyrilainen, J.; Serimaa, R.; Torkkeli, M.; Karjalainen-Lindsberg, M.-L.; Tenhunen, M.; Thomlinson, W.; Urban, V.; Suortti, P. Small-angle x-ray scattering studies of human breast tissue samples, Phys. Med. Biol. 2002, 47, 577–592. [Google Scholar] [CrossRef]
- Sidhu, S.; Siu, K.K.W.; Falzon, G.; Nazaretian, S.; Hart, S.A.; Fox, J.G.; Susil, B.J.; Lewis, R.A. X-ray scattering for classifying tissue types associated with breast disease, Med. Phys. 2008, 35, 4660–4670. [Google Scholar] [CrossRef]
- Conceição, A.L.; Antoniassi, M.; Poletti, M.E. Analysis of breast cancer by small angle X-ray scattering. Analyst 2009, 134, 1077–1082. [Google Scholar] [CrossRef]
- Sidhu, S.; Siu, K.K.W.; Falzon, G.; Hart, S.A.; Fox, J.G.; Lewis, R.A. Mapping structural changes in breast tissue disease using x-ray scattering, Med. Phys. 2009, 36, 3211–3217. [Google Scholar] [CrossRef]
- Conceiçao, A.L.C.; Antoniassi, M.; Geraldelli, W.; Poletti, M.E. Mapping transitions between healthy and pathological lesions in human breast tissues by diffraction enhanced imaging computed tomography (DEI-CT) and small angle x-ray scattering (SAXS), Radiat. Phys. Chem. 2014, 95, 313–316. [Google Scholar] [CrossRef]
- Kidane, G.; Speller, R.D.; Royle, G.J.; Hanby, A.M. X-ray scatter signatures for normal and neoplastic breast tissues. Phys. Med. Biol. 1999, 44, 1791. [Google Scholar] [CrossRef] [PubMed]
- Poletti, M.E.; Gonçalves, O.D.; Mazzaro, I. X-ray scattering from human breast tissues and breast-equivalent materials, Phys. Med. Biol. 2002, 47, 47–63. [Google Scholar] [CrossRef]
- Oliveira, O.R.; Conceiçao, A.L.C.; Cunha, D.M.; Poletti, M.E.; Pela, C.A. Identification of neoplasias of breast tissues using a powder diffractometer, J. Radiat. Res. 2008, 49, 527–532. [Google Scholar] [CrossRef]
- Conceicao, A.L.C.; Antoniassi, M.; Poletti, M.E. Assessment of the differential linear coherent scattering coefficient of biological samples, Nucl. Instr. Meth. Phys. Res. A 2010, 619, 67–70. [Google Scholar] [CrossRef]
- Griffiths, J.A.; Royle, G.J.; Hanby, A.M.; Horrocks, J.A.; Bohndiek, S.E.; Speller, R.D. Correlation of energy dispersive diffraction signatures and microCT of small breast tissue samples with pathological analysis, Phys. Med. Biol. 2007, 52, 6151–6164. [Google Scholar] [CrossRef]
- Cunha, D.M.; Oliveira, O.R.; Pérez, C.A.; Poletti, M.E. X-ray scattering profiles of some normal and malignant human breast tissues. X-ray Spectrometry 2006, 35, 370–374. [Google Scholar] [CrossRef]
- Conceicao, A.L.C.; Antoniassi, M.; Cunha, D.M.; Ribeiro-Silva, A.; Poletti, M.E. Multivariate analysis of the scattering profiles of healthy and pathological human breast tissues, Nucl. Instr. Meth. Phys. Res. A 2011, 652, 870–873. [Google Scholar] [CrossRef]
- Conceicao, A.L.C.; Meehan, K.; Antoniassi, M.; Piacenti-Silva, M.; Poletti, M.E. The influence of hydration on the architectural rearrangement of normal and neoplastic human breast tissues. Heliyon 2019, 5, e01219. [Google Scholar] [CrossRef]
- Friedman, J.; Blinchevsky, B.; Slight, M.; Tanaka, A.; Lazarev, A.; Zhang, W.; Aram, B.; Ghadimi, M.; Lomis, T.; Mourokh, L.; Lazarev, P. Structural Biomarkers for Breast Cancer Determined by X‐Ray Diffraction, In Quantum Effects and Measurement Techniques in Biology and Biophotonics, Aiello, C., Polyakov, S.V., Derr, P., Eds.; Proc. SPIE 2024, 12863, 1286302.
- Denisov, S.; Blinchevsky, B.; Friedman, J.; Gerbelli, B.; Ajeer, A.; Adams, L.; Greenwood, C.; Rogers, K.; Mourokh, L.; Lazarev, P. Vitacrystallography: Structural Biomarkers of Breast Cancer Obtained by X-ray Scattering. Cancers 2024, 16, 2499. [Google Scholar] [CrossRef] [PubMed]
- Cholakova, D.; Denkov, N. Polymorphic phase transitions in triglycerides and their mixtures studied by SAXS/WAXS techniques: In bulk and in emulsions. Adv. Colloid Interface Sci. 2024, 323, 103071. [Google Scholar] [CrossRef] [PubMed]
- Penagos, I.A.; De Witte, F.; Rimaux, T.; Chèvremont, W.; Pintelon, I.; Dewettinck, K.; Van Bockstaele, F. Multiscale analysis of triglycerides using X-ray scattering: Implementing a shape-dependent model for CNP characterization. Soft Matt. 2024, 20, 5071–5085. [Google Scholar] [CrossRef]
- Paternò, G.; Cardarelli, P.; Contillo, A.; Gambaccini, M.; Taibi, A. Geant4 implementation of inter-atomic interference effect in small-angle coherent X-ray scattering for materials of medical interest, Phys. Med. 2018, 51, 64–70. [Google Scholar] [CrossRef]
- Oshina, I.; Spigulis, J. Beer-Lambert law for optical tissue diagnostics: Current state of the art and the main limitations. J. Biomed. Opt. 2021, 26, 100901. [Google Scholar] [CrossRef]
- Agostinelli, S.; Allison, J.; Amako, K.; Apostolakis, J.; Araujo, H.; Arce, P.; Asai, M.; Axen, D.; Banerjee, S.; Barrand, G.; et al. Geant4 — a simulation toolkit. Nucl. Instr. Meth. Phys. Res. A 2003, 506, 250–303. [Google Scholar] [CrossRef]
Figure 1.
Obtained X-ray scattering images with the intensities in the logarithmic scale. Numbers indicate the position of the pixels on the detector. (a) Device with the beam stop; (b) Device without the beam stop.
Figure 1.
Obtained X-ray scattering images with the intensities in the logarithmic scale. Numbers indicate the position of the pixels on the detector. (a) Device with the beam stop; (b) Device without the beam stop.
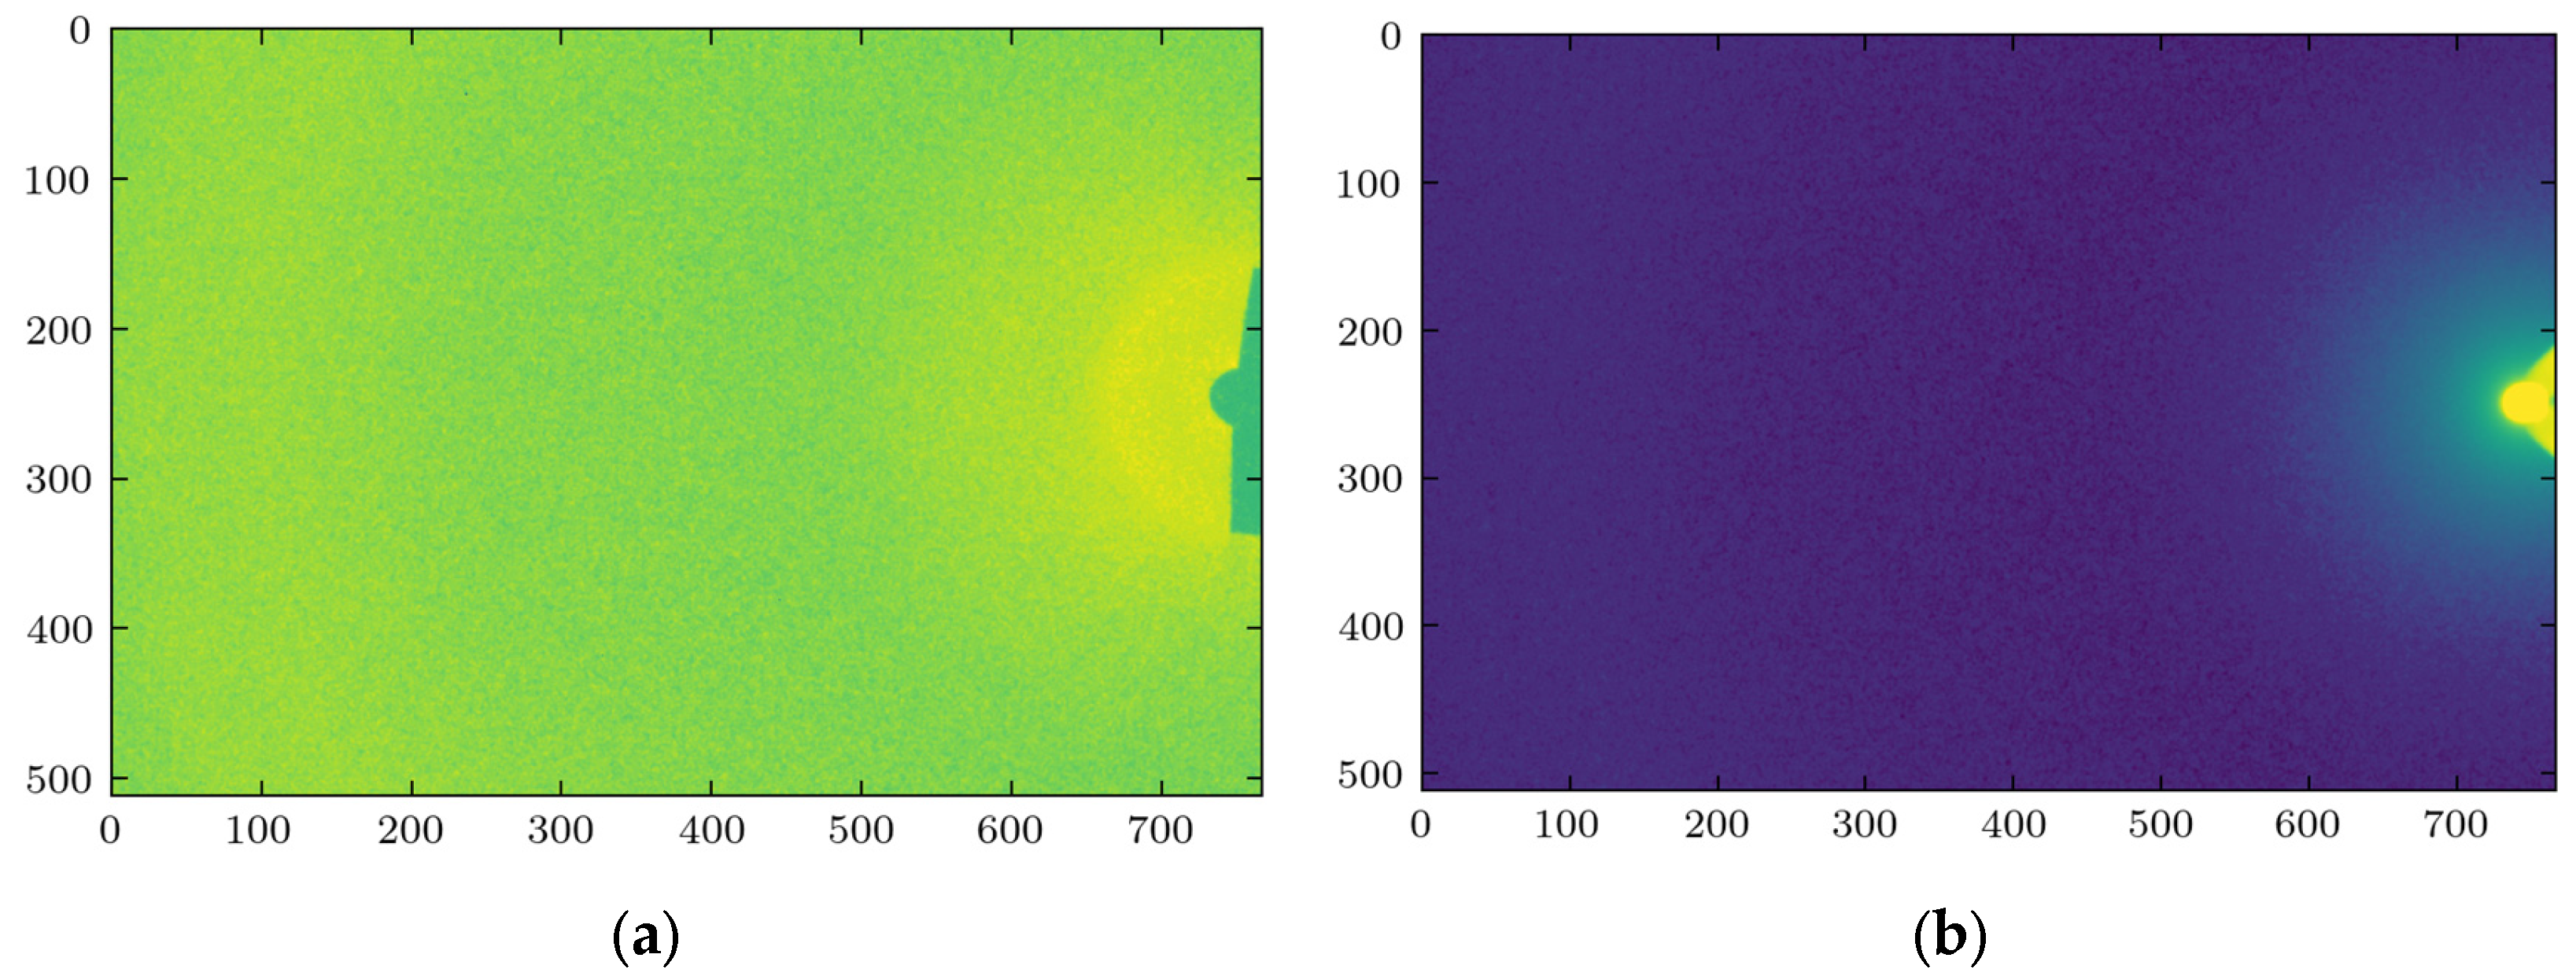
Figure 2.
Dependencies of the scattered intensities on the transfer momentum for various sample thicknesses. (a) Device with the beam stop; (b) Device without the beam stop.
Figure 2.
Dependencies of the scattered intensities on the transfer momentum for various sample thicknesses. (a) Device with the beam stop; (b) Device without the beam stop.
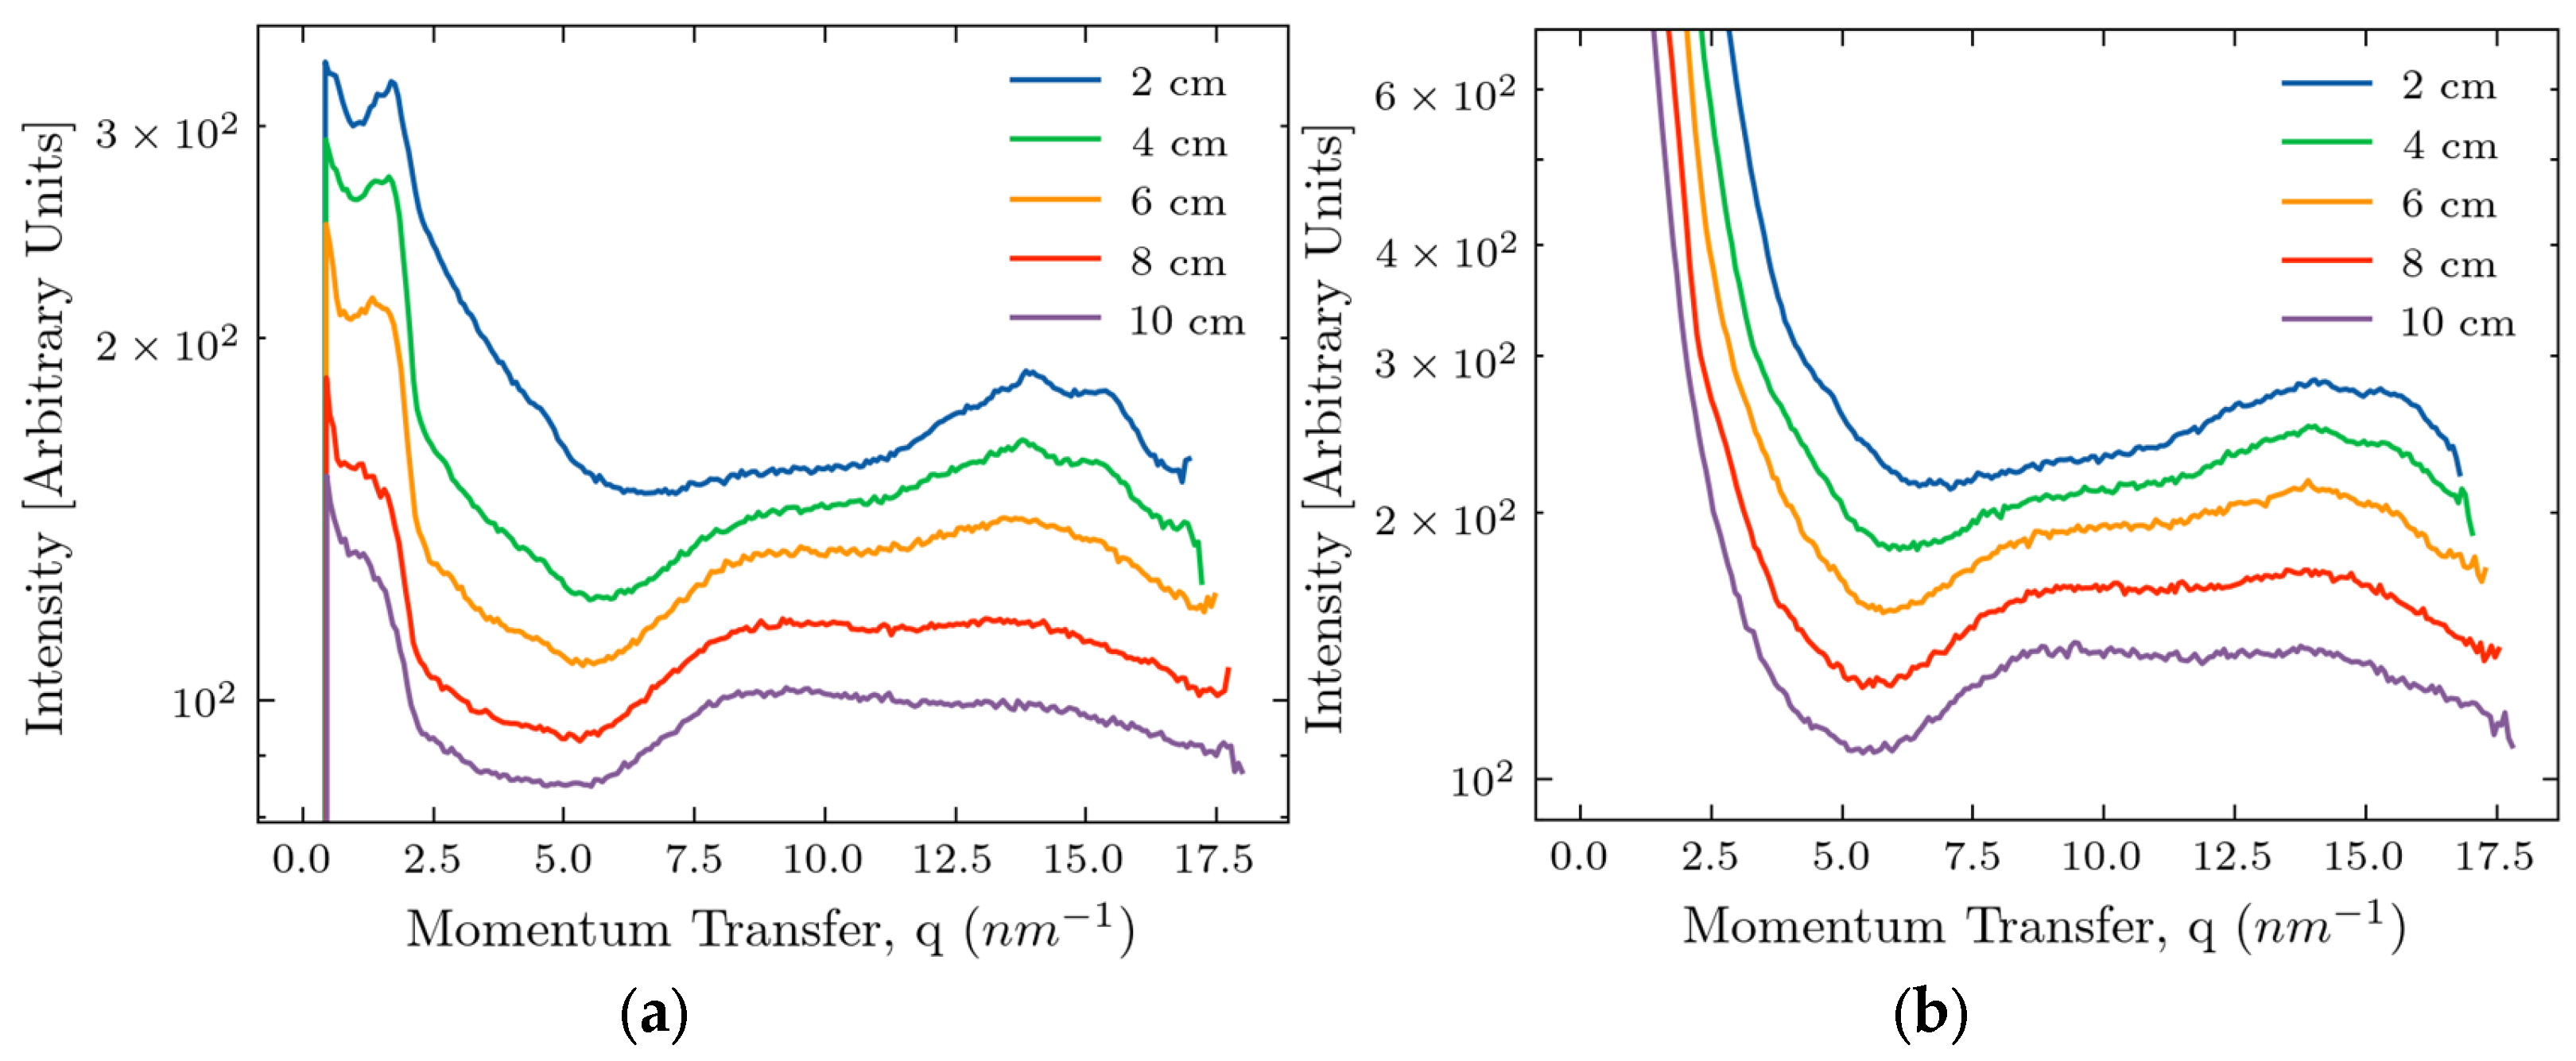
Figure 3.
Number of X-ray photons (out of 50 million) experiencing single, double, and triple scattering within the adipose sample with (a) 4 cm thickness and (b) 10 cm thickness.
Figure 3.
Number of X-ray photons (out of 50 million) experiencing single, double, and triple scattering within the adipose sample with (a) 4 cm thickness and (b) 10 cm thickness.
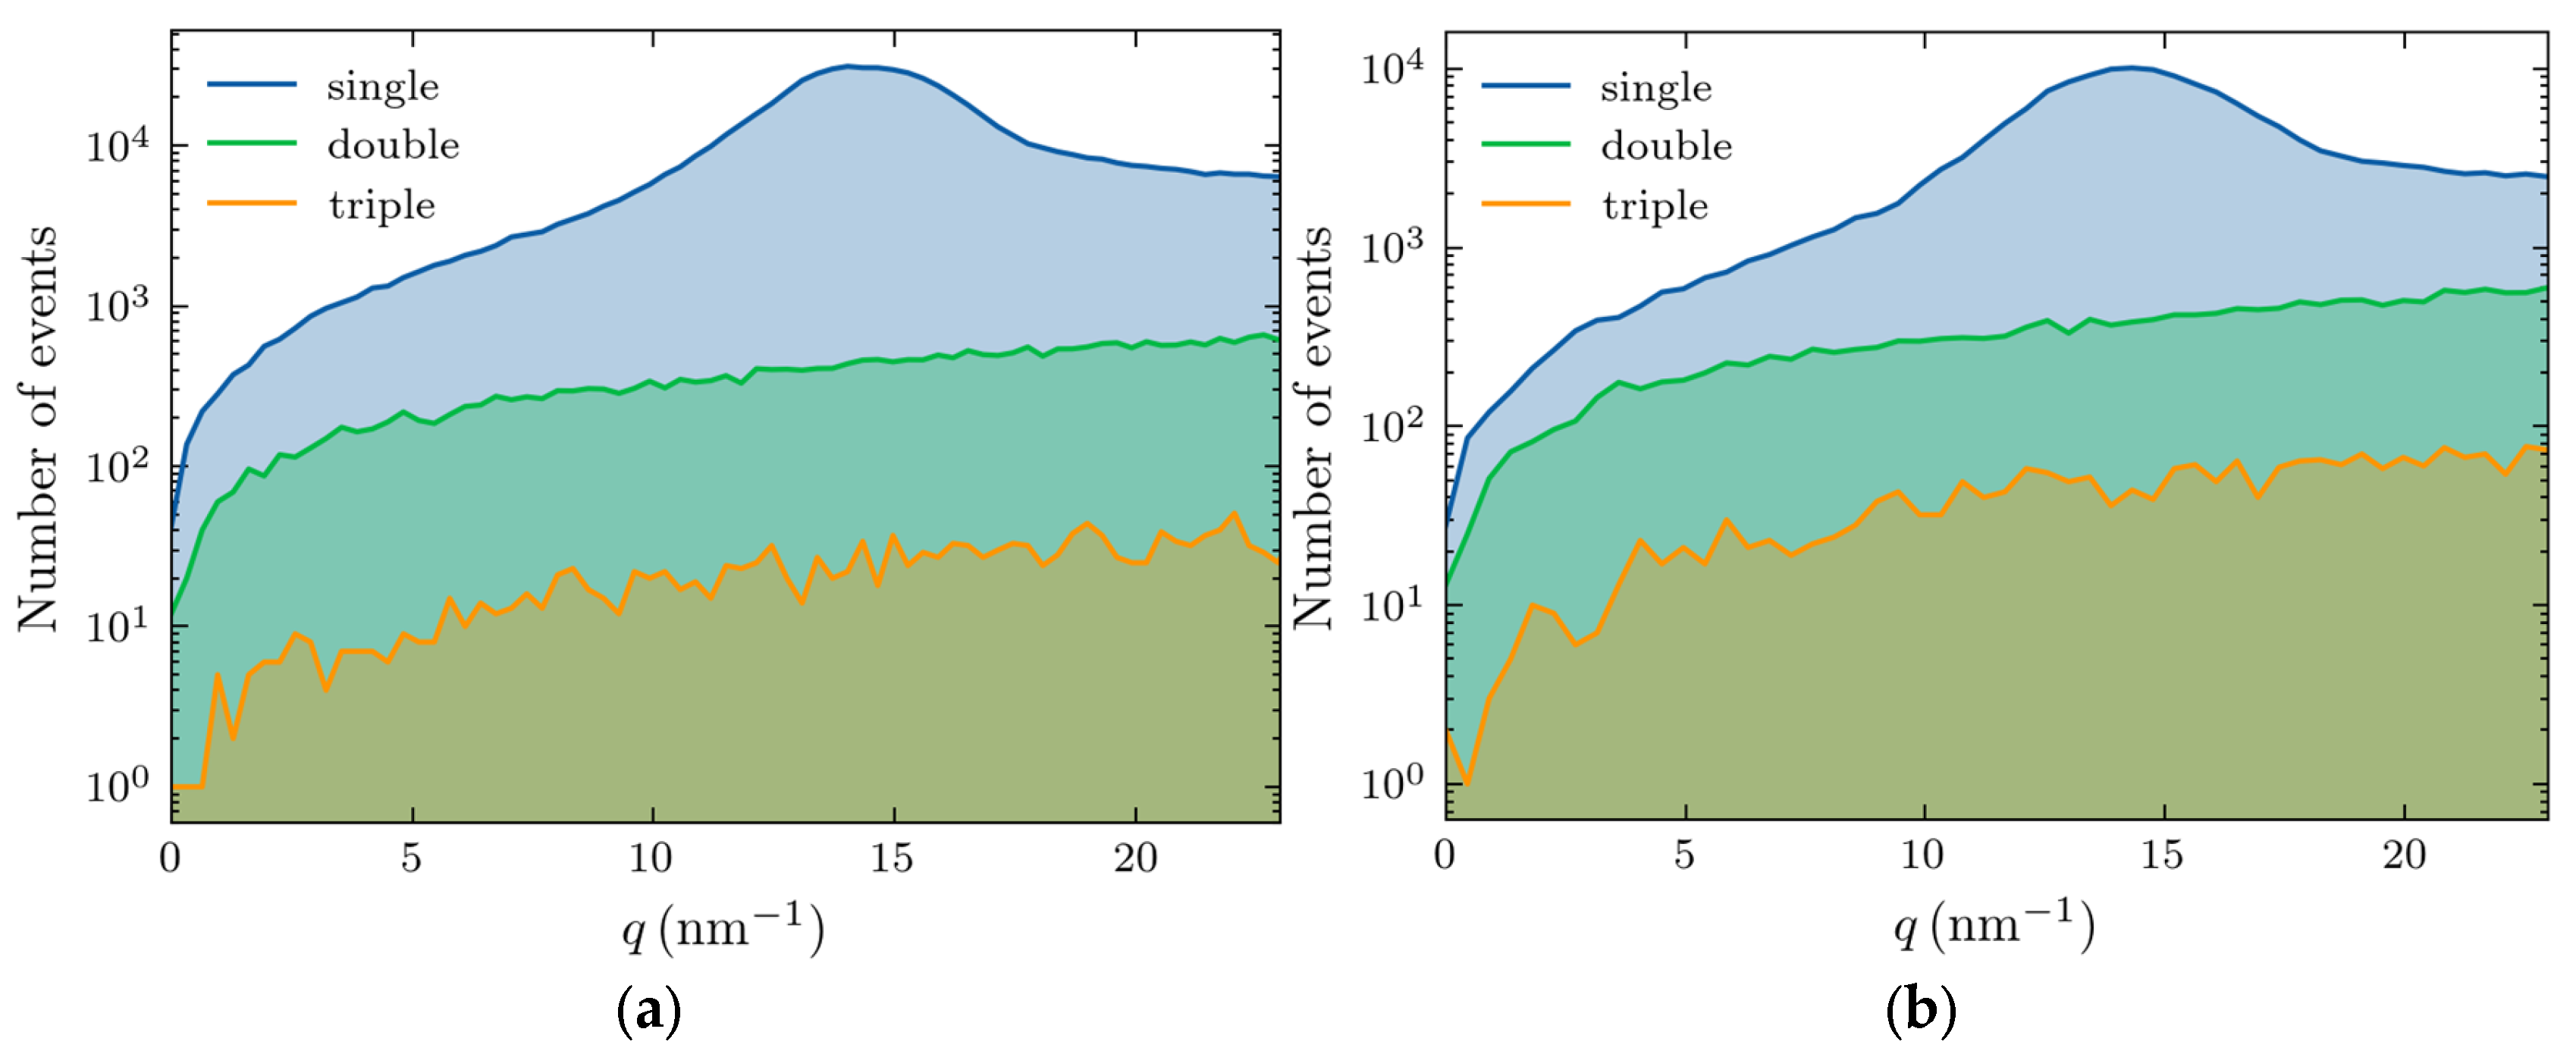
Figure 4.
Number of X-ray photons (out of 50 million) experiencing elastic (Raleigh) or Compton scattering within the adipose sample with (a) 4 cm thickness and (b) 10 cm thickness.
Figure 4.
Number of X-ray photons (out of 50 million) experiencing elastic (Raleigh) or Compton scattering within the adipose sample with (a) 4 cm thickness and (b) 10 cm thickness.
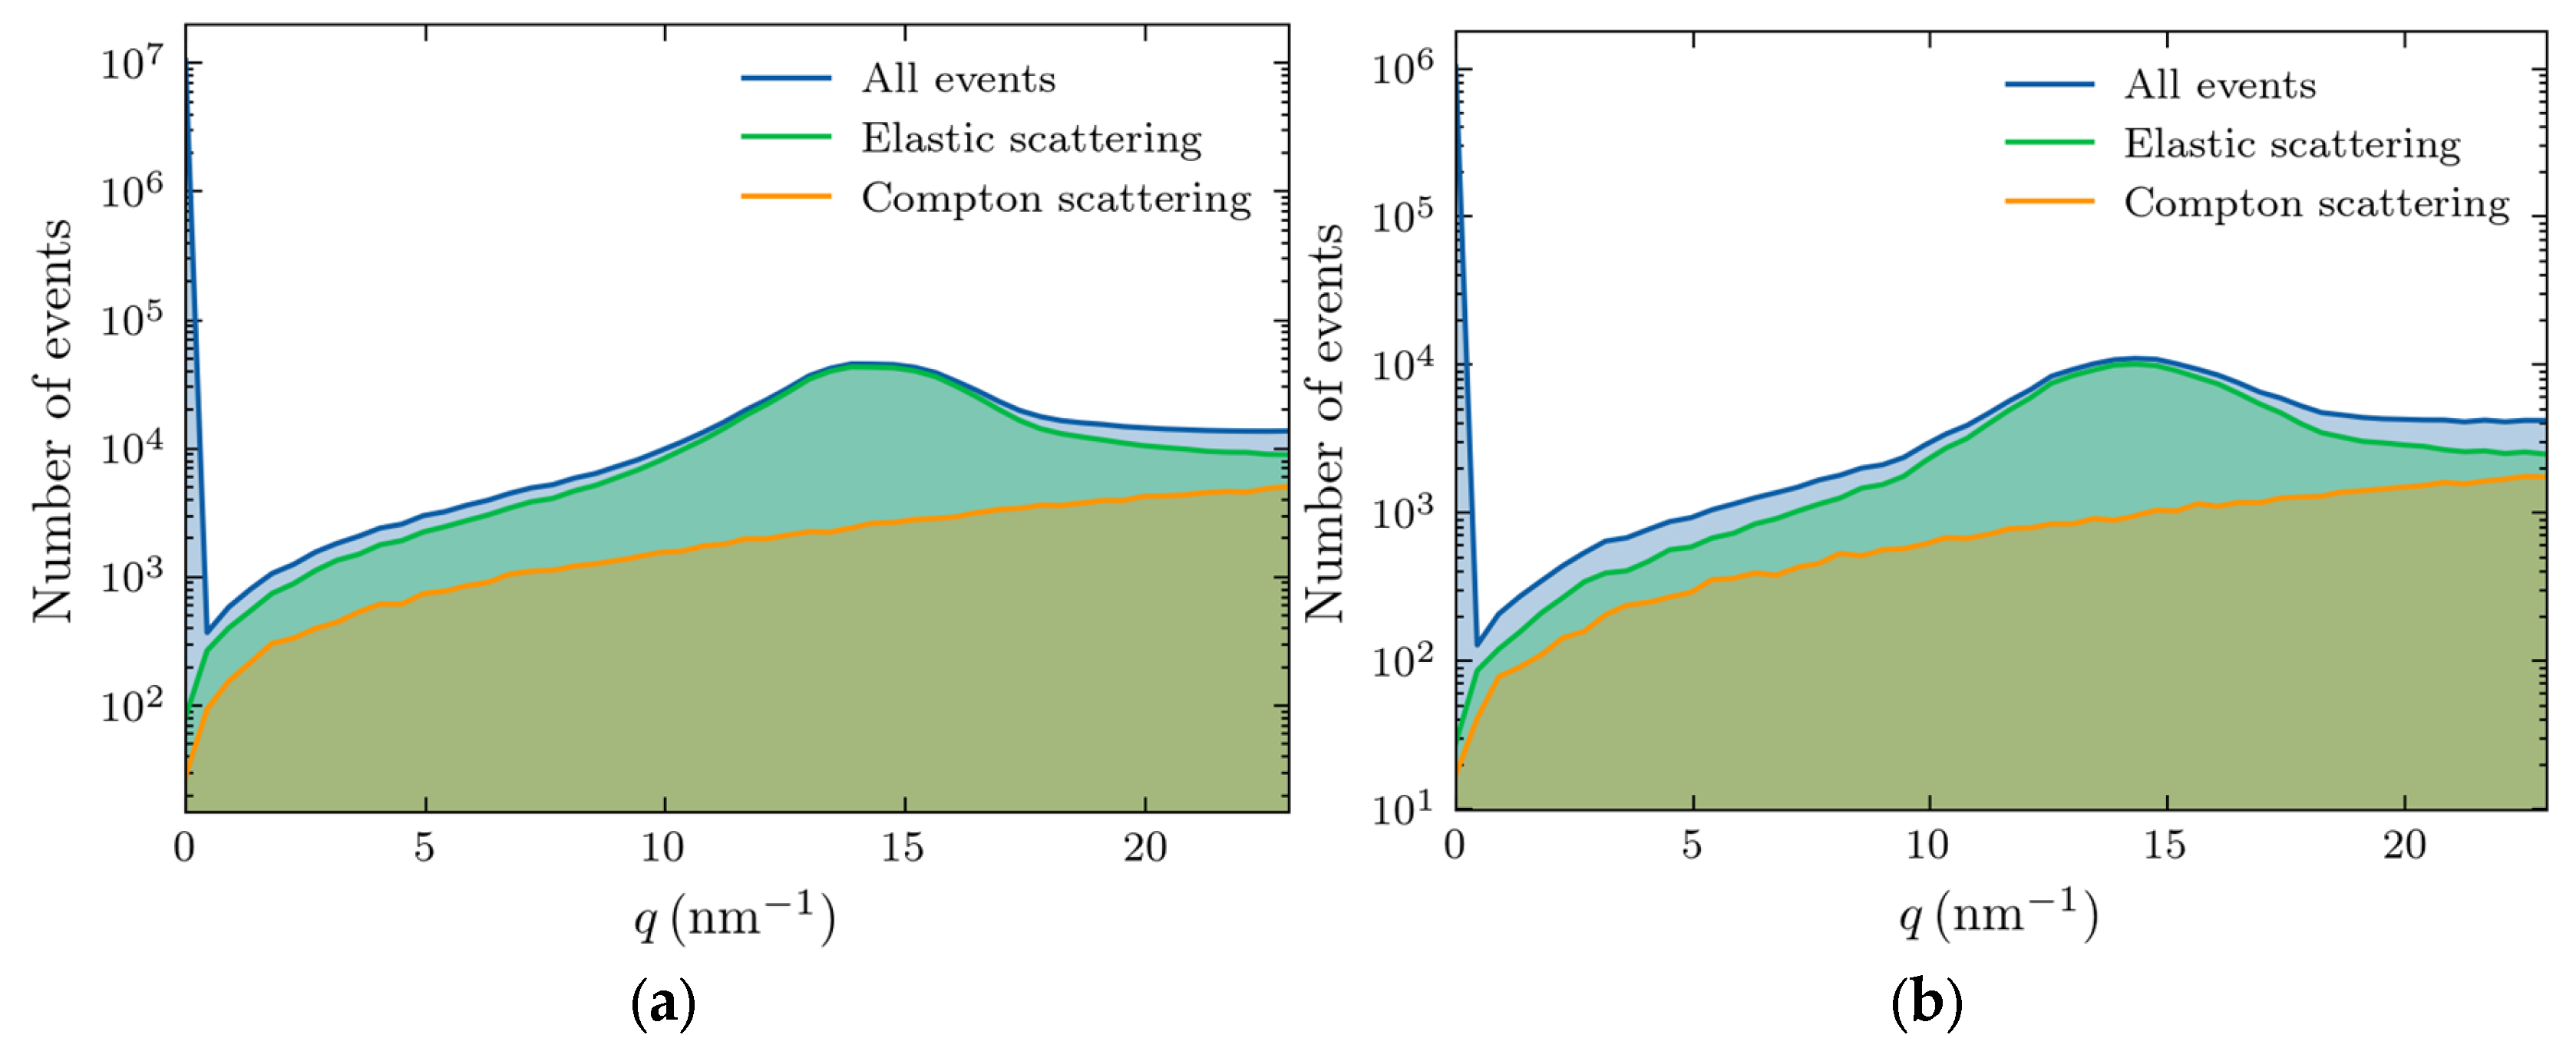
Figure 5.
Simulated dependencies of the X-ray scattering intensity on the transfer momentum for various thicknesses of the fat samples.
Figure 5.
Simulated dependencies of the X-ray scattering intensity on the transfer momentum for various thicknesses of the fat samples.
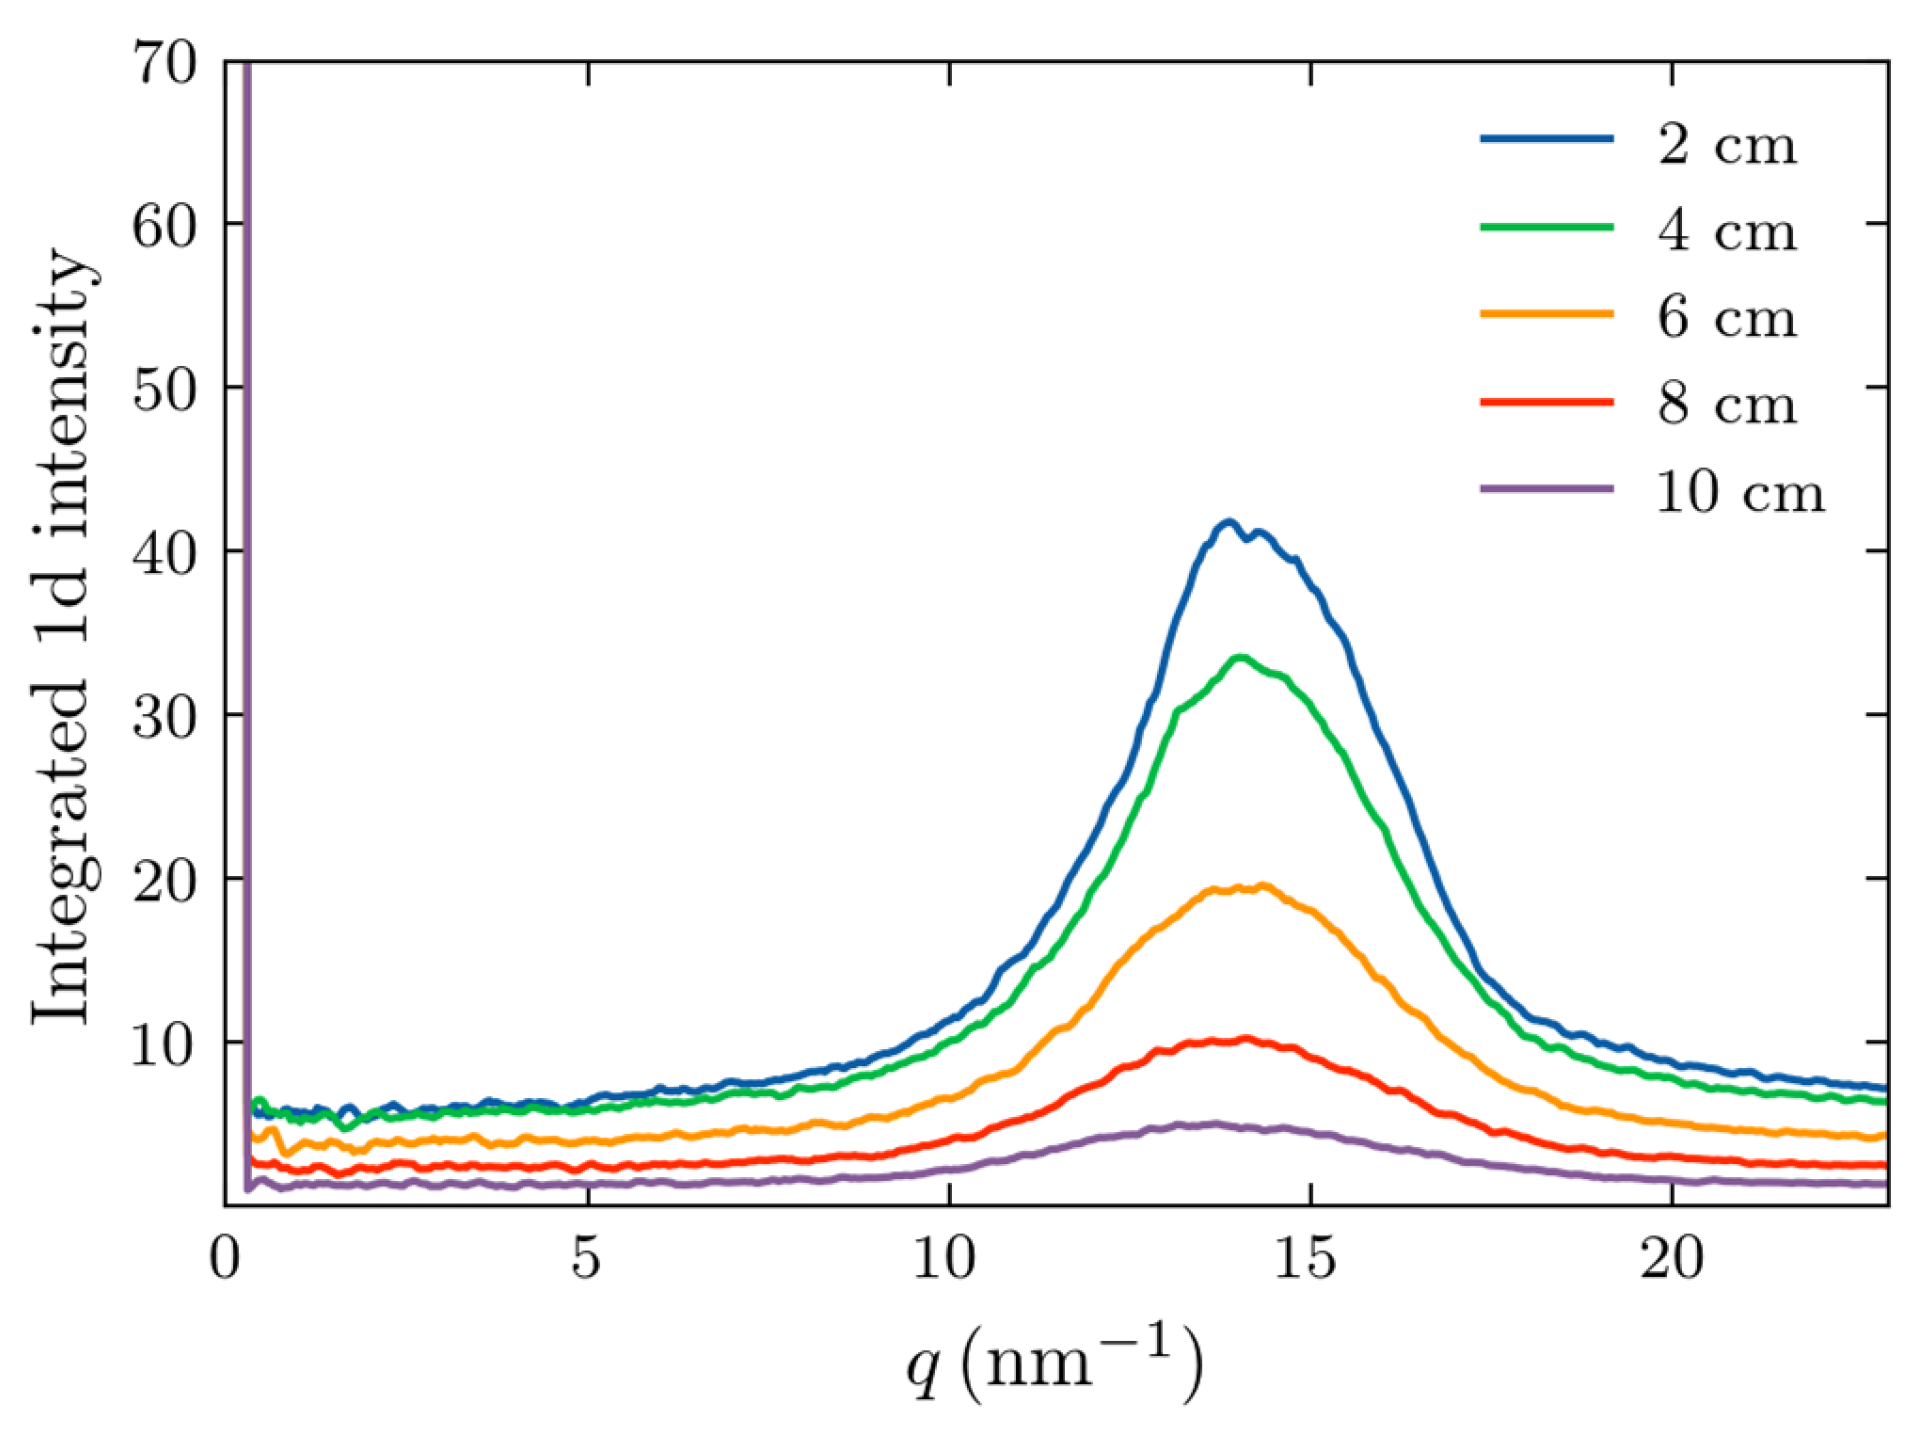
Figure 6.
Calculated peak widths of the Gaussian peaks for experimental and simulated curves and the linear fit for the simulations.
Figure 6.
Calculated peak widths of the Gaussian peaks for experimental and simulated curves and the linear fit for the simulations.
Disclaimer/Publisher’s Note: The statements, opinions and data contained in all publications are solely those of the individual author(s) and contributor(s) and not of MDPI and/or the editor(s). MDPI and/or the editor(s) disclaim responsibility for any injury to people or property resulting from any ideas, methods, instructions or products referred to in the content. |
© 2025 by the authors. Licensee MDPI, Basel, Switzerland. This article is an open access article distributed under the terms and conditions of the Creative Commons Attribution (CC BY) license (http://creativecommons.org/licenses/by/4.0/).
Copyright: This open access article is published under a Creative Commons CC BY 4.0 license, which permit the free download, distribution, and reuse, provided that the author and preprint are cited in any reuse.


