Preprint
Article

This version is not peer-reviewed.

Energy Availability, Body Composition, and Phase Angle Among Adolescent Artistic Gymnasts During a Competitive Season

A peer-reviewed article of this preprint also exists.

Submitted:

22 December 2025

Posted:

24 December 2025

You are already at the latest version

Abstract

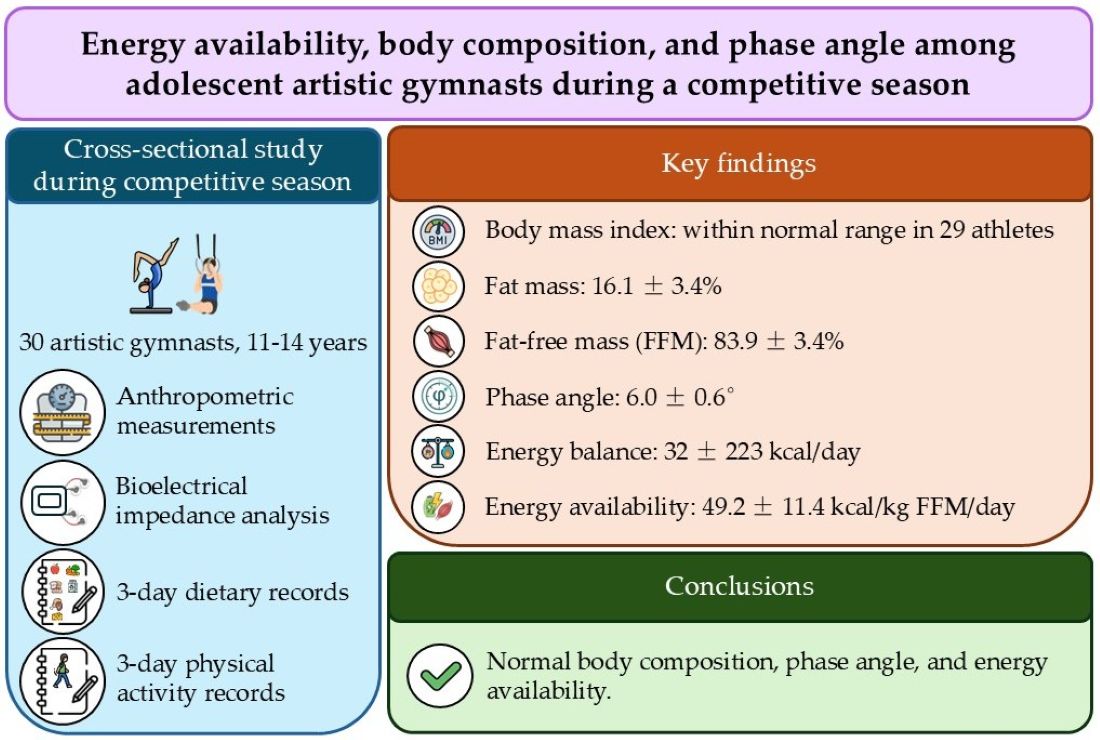
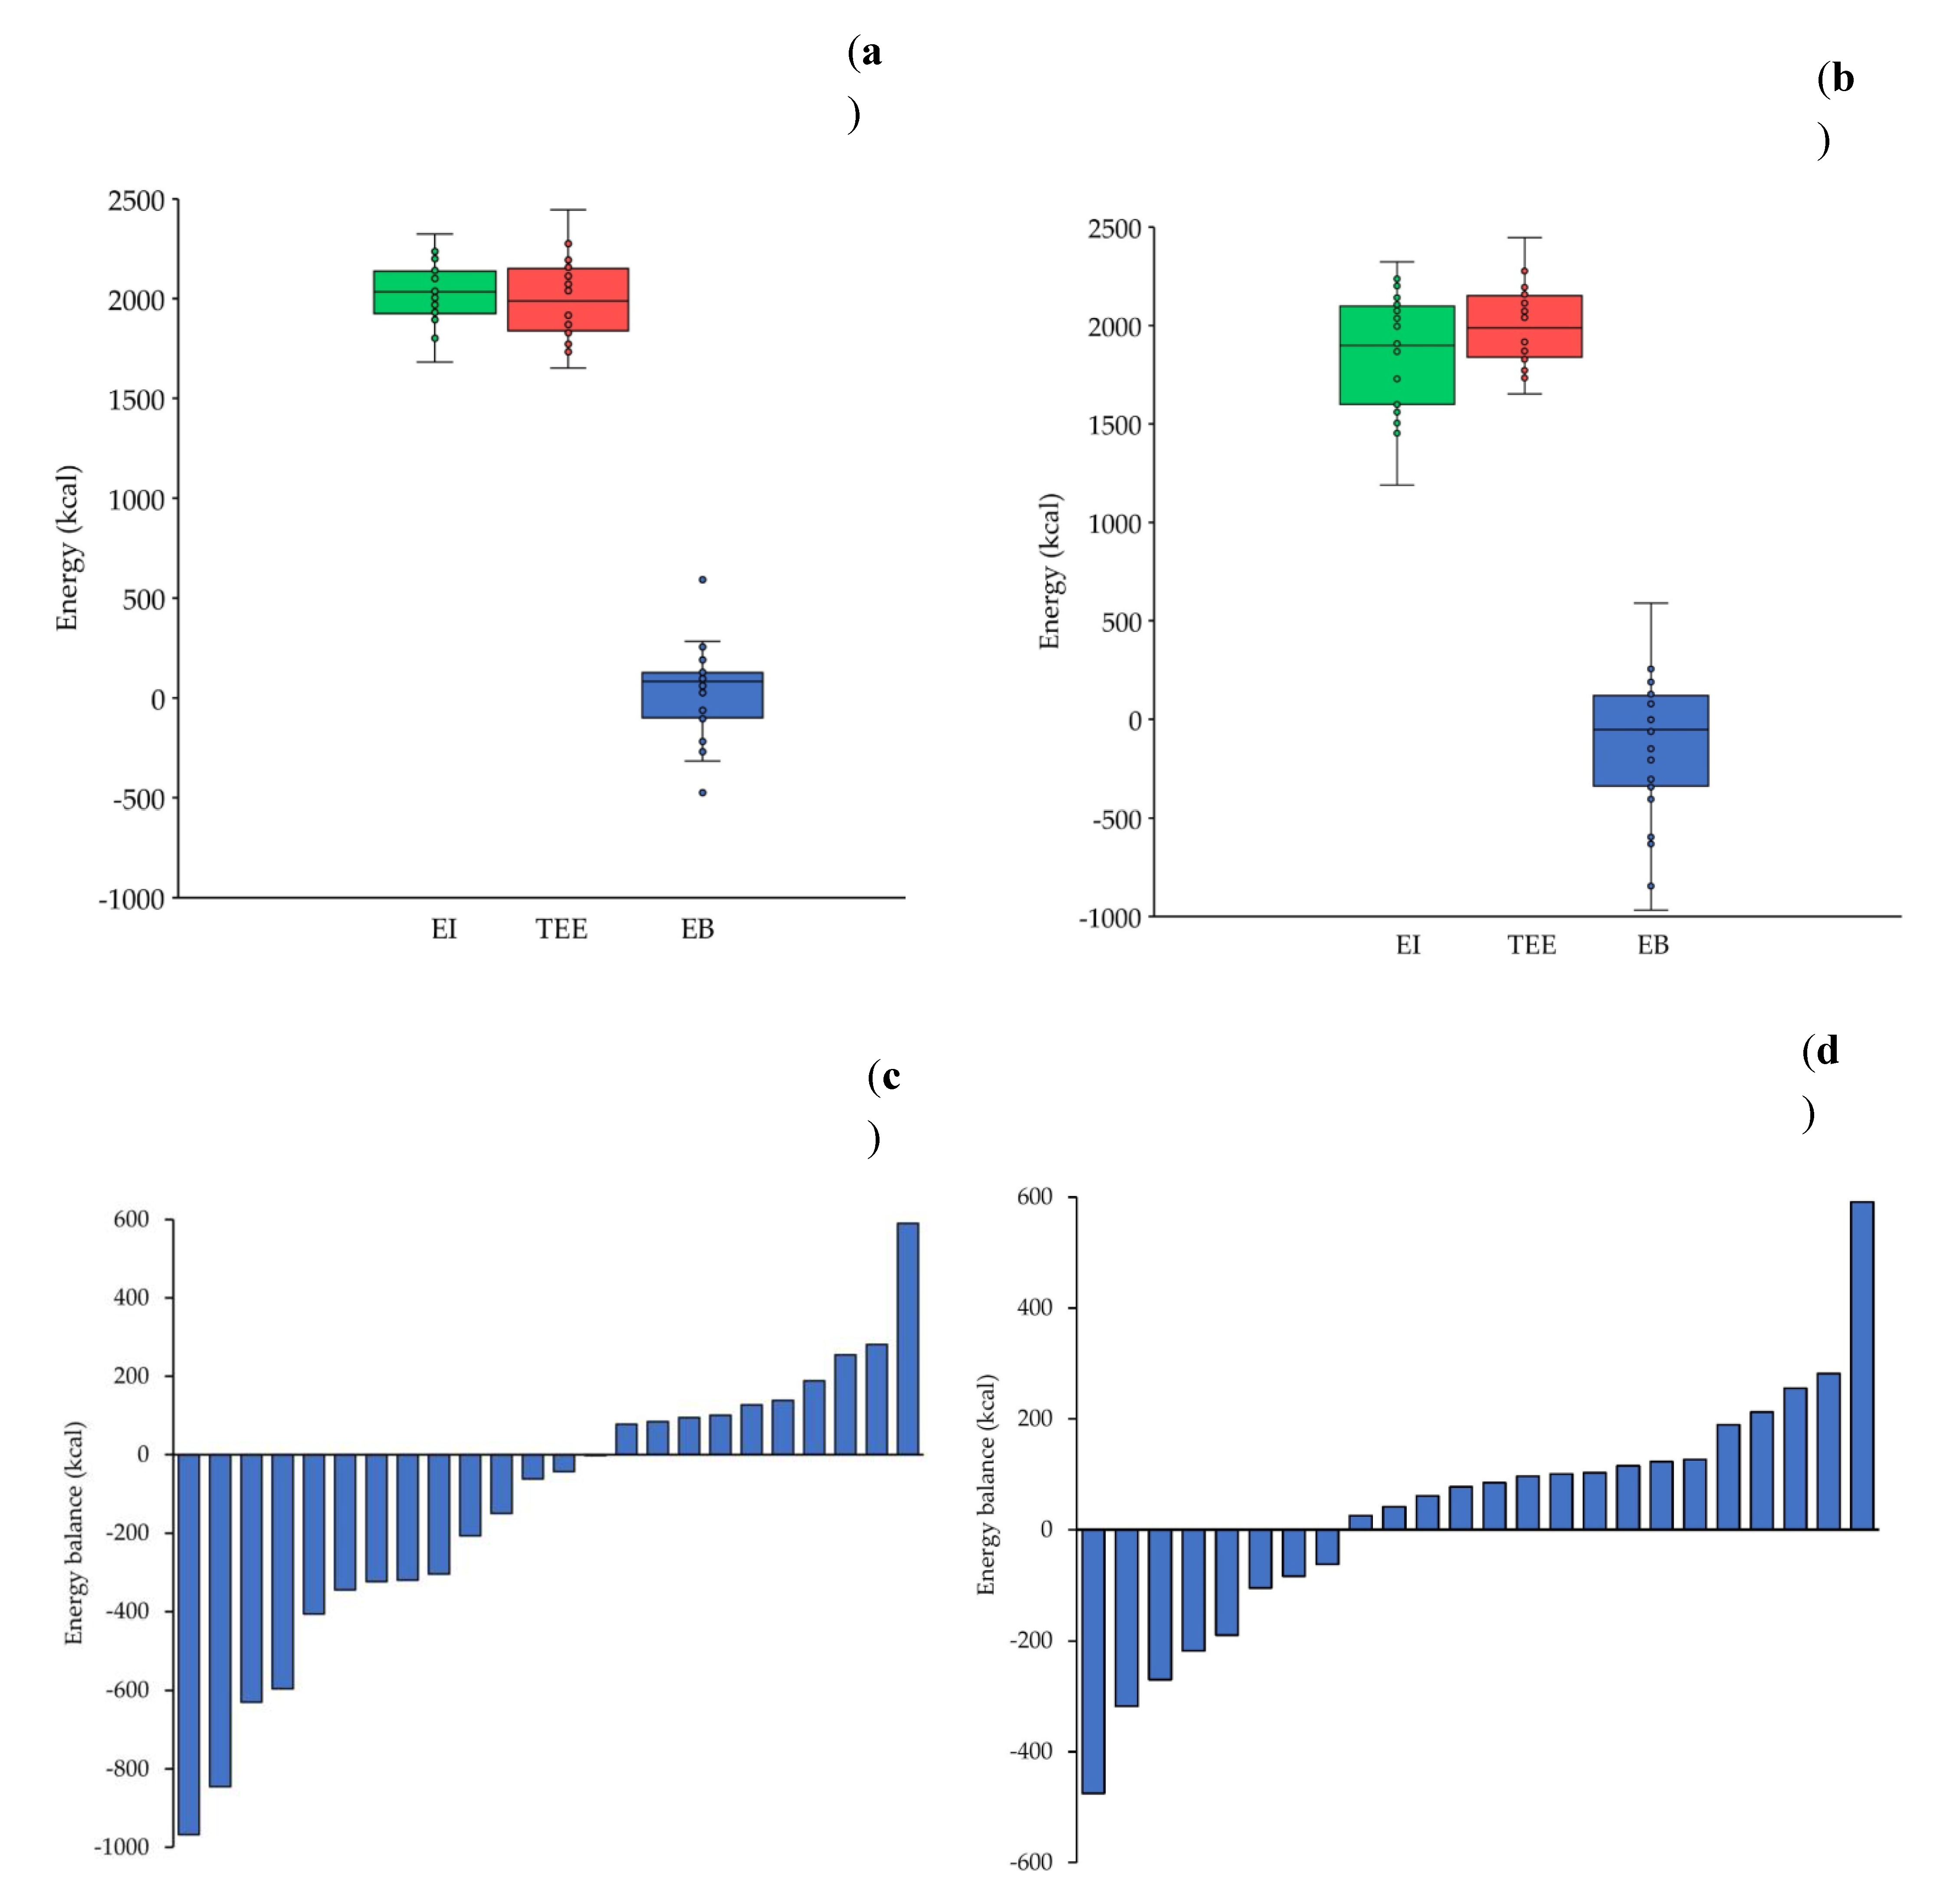
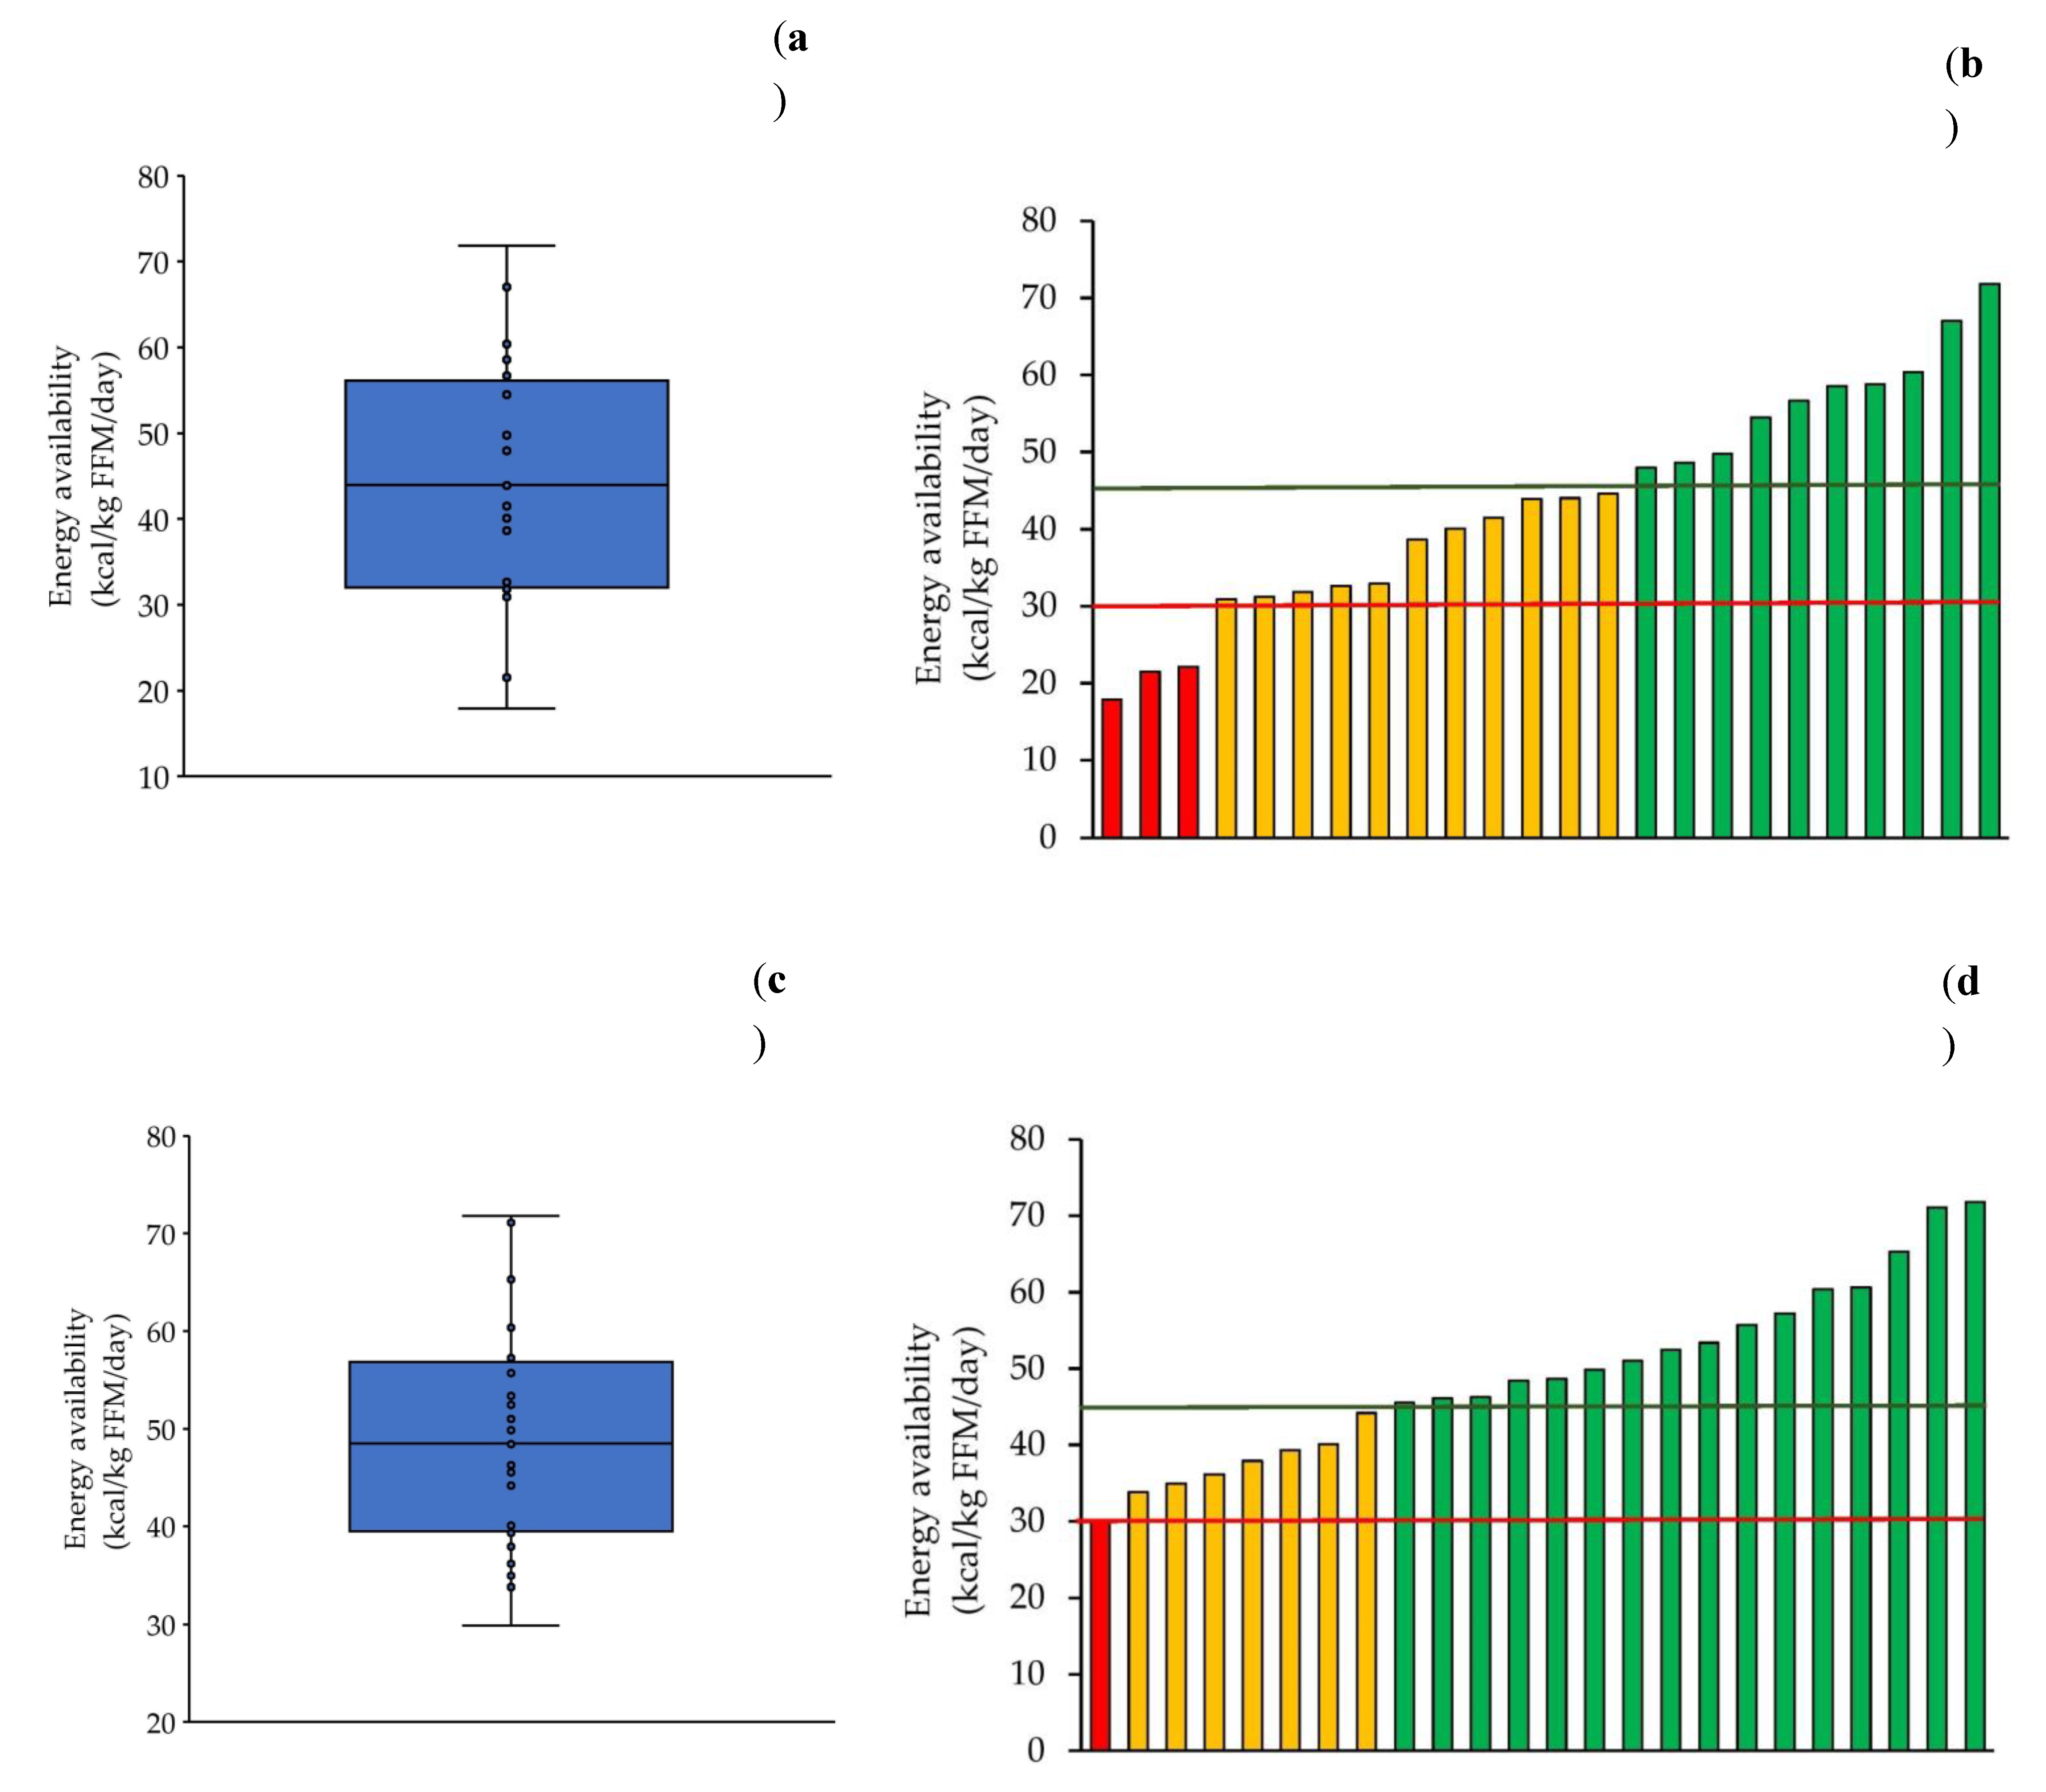
Background/Objectives: Energy availability (EA) is associated with Relative Energy Deficiency in Sport syndrome. This study assessed ΕΑ, body composition, and phase angle (φ) of adolescent artistic gymnasts during a competitive season. Methods: Thirty artistic gymnasts aged 11-14 years participated in the study. Anthropometric data were collected and body mass index (BMI) was assessed using the World Health Organization growth charts. Bioelectrical impedance analysis was performed and diet and physical activity were recorded for three days. Dietary and physical activity records were analyzed to estimate energy intake, total energy expenditure (TEE), and exercise energy expenditure, from which energy balance (EB) and EA were calculated. The 95% confidence ellipses of the impedance (Z) vectors were compared with a reference population using the two-sample Hotelling’s T2 test. Correlations between conceptually relevant study variables were examined by Pearson’s or Spearman’s correlation analysis. Statistical significance was set at α = 0.05. Results: All participants were classified within the normal BMI category, except for one classified as overweight. Mean (± SD) fat mass, fat-free mass (FFM), and φ were 16.1 ± 3.4%, 83.9 ± 3.4%, and 6.0 ± 0.6°, respectively. The 95% confidence ellipses of Z vectors differed significantly from the reference population. Energy balance was 32 ± 223 kcal/day and EA was 49.2 ± 11.4 kcal/kg FFM/day. Energy availability was significantly correlated with EB, TEE, and body composition variables. Phase angle was significantly correlated with anthropometric and body composition variables. Conclusions: Adolescent non-elite artistic gymnasts exhibited normal body composition and EA during the competitive season.

Keywords: 
;  ;  ;  ;  ;  ;  ;  

1. Introduction

Energy availability (EA) is the amount of dietary energy intake (EI), relative to fat-free mass (FFM), that remains available to support physiological functions of the human body after accounting for exercise energy expenditure (EEE) [1]. In healthy, physically active individuals, an EA ≥ 45 kcal/kg FFM/day is considered adequate for females [1], while ≥ 40 kcal/kg FFM/day is sufficient for males [2]. Low energy availability (LEA), defined as EA ≤ 30 kcal/kg FFM/day, is considered the primary cause of Relative Energy Deficiency in Sport (REDs) syndrome [1]. REDs is a major health concern in athletes, as it can impair several physiological, psychological, and bodily functions [1,3].
The calculation of EA requires the estimation of EI, EEE, and FFM. Bioelectrical impedance analysis (BIA) is a widely used method of assessing body composition. BIA measures the resistance (R) of body tissues and reactance (Xc), which reflects the ability of cell membranes to act as electrical conductors to a low-intensity electrical current (≈ 800 μA) applied at one or multiple frequencies, thereby estimating body composition based on tissue conductivity [4]. Lean tissue, rich in water and electrolytes, conducts electricity well, whereas fat tissue is a poor conductor. Together, R and Xc are used to calculate impedance (Z), as the vector resultant of R and Xc, and phase angle (φ), as the arctangent of Xc/R [4]. Phase angle serves as an indicator of cellular integrity and functionality [5]: Higher values correspond to better cellular health [5] and greater muscle mass [6,7,8], whereas lower values are linked to malnutrition [9] and various pathological conditions [10,11]. Moreover, φ has been proposed as a marker of muscle strength [12].
Artistic gymnastics is a popular Olympic sport, in which optimal performance requires speed, a high power-to-body mass ratio, strength, flexibility, coordination, and precise technical execution [13]. To develop these attributes, athletes begin intensive training at a young age, during which major physical and physiological changes take place [14]. Early adolescent competitive artistic gymnasts (≈11 years of age) typically train 20 hours per week, with training volume increasing to around 30 hours per week in older adolescents (≈17 years of age) [15,16,17,18,19]. Adolescent female athletes can expend up to 768 kcal during 4-hour session [19]. The combination of high training loads, increased energy demands for optimal growth, and emphasis on maintaining low body mass may increase the risk of LEA in this population [20,21,22,23,24].
To our knowledge, few studies have assessed EA in pre-adolescent and adolescent gymnasts and none in artistic gymnasts. Studies on rhythmic and acrobatic gymnasts have reported EA values below 30 kcal/kg FFM/day [24,25] or between 30 and 45 kcal/kg FFM/day [22,23,24], indicating a current or potential risk of LEA. These athletes also tend to show low body mass index (BMI) and fat mass (FM) percentage [22,24,26]. In contrast, studies on artistic gymnasts have reported body composition variables within normal ranges [20,21] and high φ values (around 7°) [20].
The presentation above shows no studies have evaluated EA in adolescent artistic gymnasts, while research examining body composition and φ in this population remains limited. Therefore, the aim of the present study was to assess EA, body composition, and φ in adolescent artistic gymnasts during a competitive season.

2. Materials and Methods

2.1. Participants and Ethics
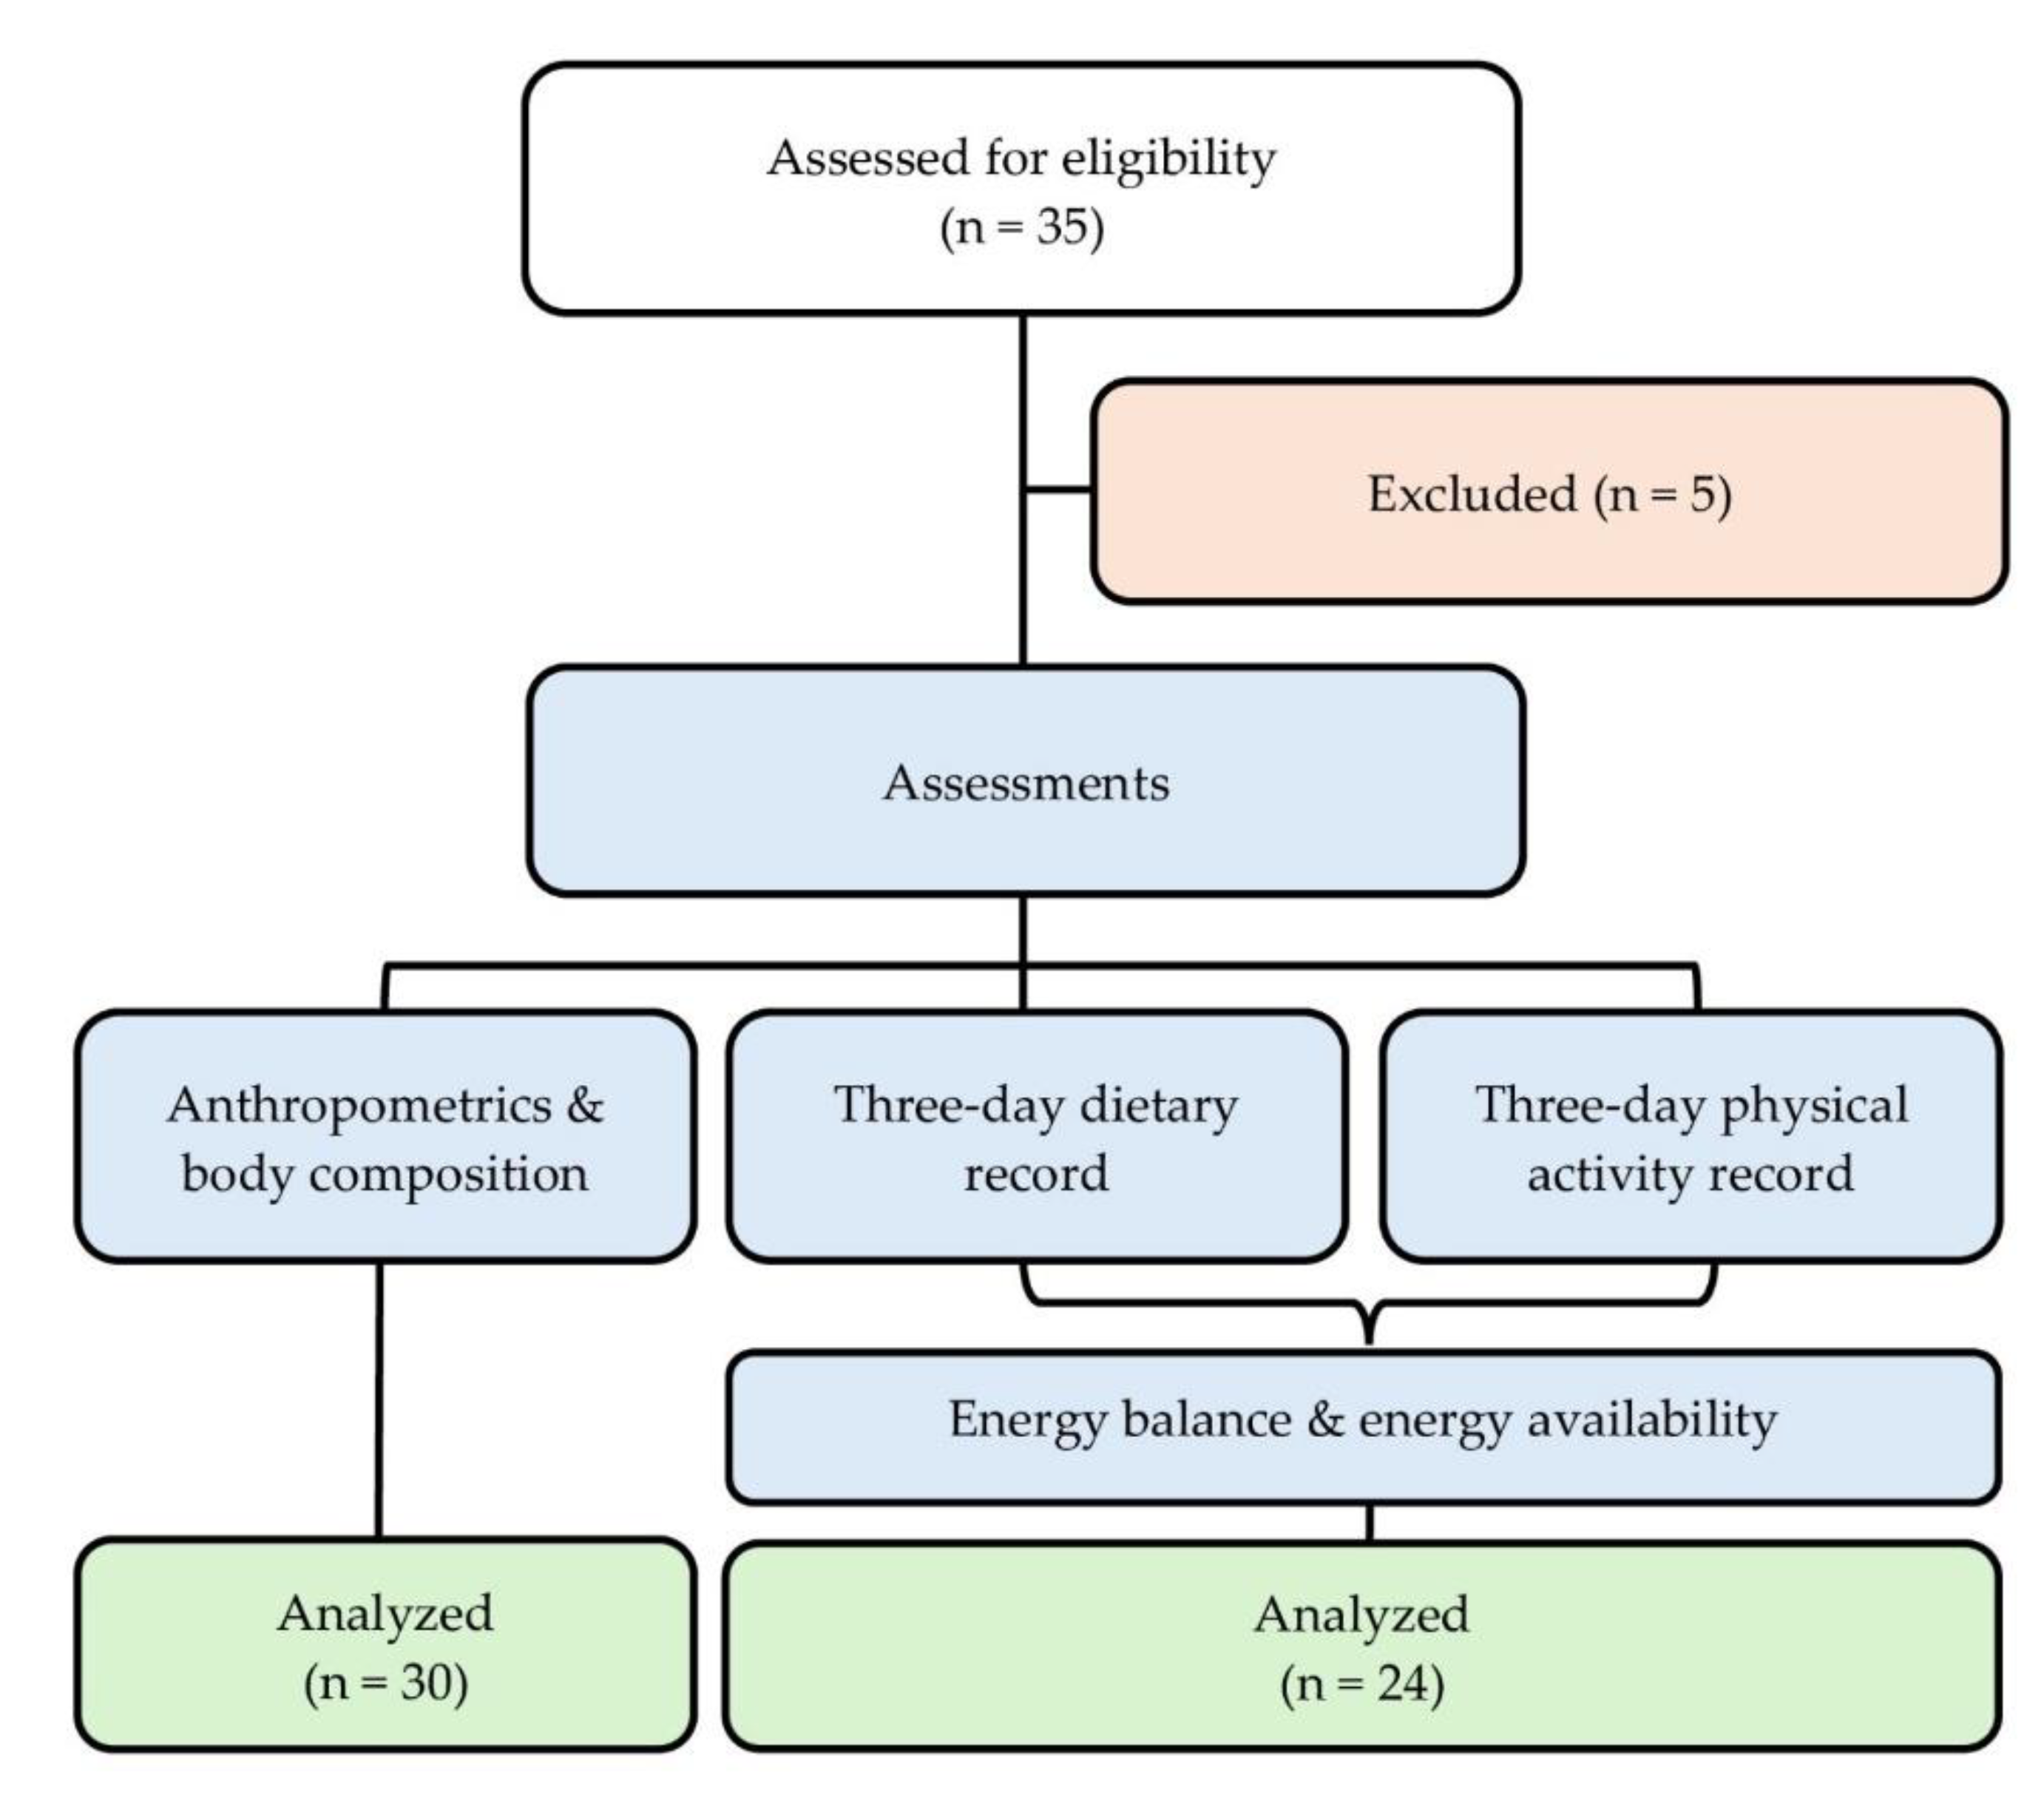
The study included 30 male and female artistic gymnasts from various sport clubs in Thessaloniki, Greece. Inclusion criteria were: 1) age between 11 and 14 years, 2) at least two years of continuous training in artistic gymnastics, 3) participation in national-level competitions, and 4) preparation for competition during the study period. Exclusion criteria were: 1) any chronic disease affecting EI or expenditure and 2) musculoskeletal injuries that could limit training during competitive preparation.
Participants and their parents received oral and written information about the purpose of the study, procedures, potential benefits of participation, and data-protection measures, after which written informed consent was obtained. The research was approved by the Ethics Committee of the School of Medicine, Aristotle University of Thessaloniki (approval number 82/2024).

2.2. Study Design

This was an observational, cross-sectional study conducted during a competitive season. Demographic and anthropometric data were collected, and body composition was assessed using BIA. Participants also recorded their dietary intake, including supplements, and physical activity for three days.

2.3. Demographic Characteristics

Demographic data were collected through interviews, during which a structured questionnaire was completed. Recorded information included date of birth, training age, weekly training hours, and (for girls) age at menarche.

2.4. Anthropometrics and Body Composition

Body mass was measured to the nearest 0.1 kg with minimal clothing using an electronic scale (Seca, Hamburg, Germany). Body height was measured to the nearest 0.01 m without shoes using a stadiometer. BMI was then calculated and evaluated using the BMI-for-Age growth charts for children and adolescents aged 5-19 years, provided by the World Health Organization (WHO).
Body composition was assessed through multi-frequency BIA using a Bodystat QuadScan 4000 device (Douglas, United Kingdom). Measurements were carried out with participants lying supine, arms and legs slightly apart. Electrodes were placed on the right hand (at the wrist and above the middle finger) and right foot (at the ankle and above the second toe), as per manufacturer’s instructions. Electrical current at 5, 50, 100, and 200 kHz was applied. The following variables were obtained: FM (kg and %), FFM (kg and %), total body water (TBW, L and %), extracellular water (ECW, L and %), intracellular water (L and %), third-space water (L), body cell mass (BCM, kg), R (Ω), Xc (Ω), φ (°), and Z (Ω). Bioelectrical Impedance Vector Analysis (BIVA) was also performed. BIVA evaluates cell mass and fluid balance by plotting height-adjusted R and Xc on a bivariate graph [27]. All measurements were conducted prior to training sessions, after at least 12 hours without vigorous exercise and at least three hours in the fasted state.

2.5. Analysis of Energy Intake

Energy intake was estimated through three-day food diaries (two weekdays and one weekend day) completed by the participants with parental assistance. Parents received online training on accurate dietary recording and written instructions with portion-size guidance. Additionally, an example of a completed daily food record was included in the food diaries to facilitate proper reporting.
The dietary records were analyzed using the online Cronometer application (Revelstoke, British Columbia, Canada) with nutritional data sourced from the FoodData Central database provided by the U.S. Department of Agriculture. Energy contribution from supplements was verified and calculated based on product label information.

2.6. Analysis of Energy Expenditure

Resting energy expenditure (REE) was estimated using the age- and sex-specific Schofield equation [28].
Physical-activity energy expenditure was determined from three-day physical activity diaries completed concurrently with the dietary records. Participants, with parental assistance, recorded all daily activities and duration of each over 24 hours. Detailed instructions for accurate recording were provided during an online session with parents and in-person meetings with coaches. Furthermore, an example of a completed daily physical activity record was included in the diaries. Activity data were analyzed using the youth metabolic equivalent of task values from the Youth Compendium of Physical Activities [29]. Although this database includes a smaller variety of activities than the Compendium of Physical Activities for adults [30], it provides age-specific data, ensuring greater accuracy in estimation. When a recorded activity was not listed in the youth database, a comparable activity was selected.
Total energy expenditure (TEE) was calculated by determining a weighted average MET, based on the duration and MET value of each activity, multiplying this value by REE, and adding 10% to account for energy expenditure from diet-induced thermogenesis.
To verify EEE, two researchers independently observed and recorded one training session of four randomly selected athletes from different sport clubs. The observations were conducted under blinded conditions; neither the athletes nor the coaches were aware that the training session was being observed and recorded. Each researcher independently observed one athlete at a time, recording the exact duration of each exercise, estimated intensity, and duration of rest intervals. EEE values derived from direct observation were lower and were therefore taken into account, as in practice there are inevitably periods of inactivity during training sessions.

2.7. Energy Balance and Energy Availability

The energy balance (EB) on each of the three days of dietary and physical activity recording was calculated as the difference between EI and TEE. EA was calculated according to the formula provided by the International Olympic Committee [1], using the average EI and EEE of the two weekdays that included gymnastics training: EA = (EI - EEE) / FFM.

2.8. Assessment of Dietary Underreporting

To assess potential underreporting of dietary intake, the difference between each participant’s estimated EI and the reference EI values provided by the European Food Safety Authority—based on age, sex, and Physical Activity Level (PAL) [31]—was calculated. PAL for each participant was determined as the mean ratio of TEE to REE across the three days of dietary and physical activity recording. When underreporting (defined as a negative difference between estimated and reference EI) was identified, the participant’s EI was adjusted to the reference EI. Subsequently, EB (calculated as corrected EI minus TEE) and EA (using the corrected EI in the corresponding formula) were recalculated.

2.9. Statistical Analysis

Data are presented as mean ± standard deviation (SD). Correlations between conceptually relevant study variables were examined by Pearson’s or Spearman’s correlation analysis, depending on whether data distribution did not differ or differed from normal based on the Shapiro-Wilk test. For BIVA, Xc and R, measured at 50 kHz, were standardized to the participants’ height. Subsequently, the 95% confidence ellipses of the participants in the present study were compared with those of a reference population [32] using the two-sample Hotelling’s T2 test. Vector analysis was performed using the BIVA 2002 software [33]. The level of statistical significance was set at α = 0.05. All statistical analyses were conducted using the SPSS version 29.0 (IBM, Armonk, NY, USA).

3. Results

A total of 35 athletes were approached and assessed for eligibility to participate in the study. Five were excluded because they did not meet the inclusion criteria related to gymnastics type and age or met the exclusion criteria such as injury or illness. Anthropometric and body composition measurements were conducted on the remaining 30 athletes (24 girls and 6 boys). Of those, 24 (20 girls and 4 boys) completed the three-day dietary and physical activity records, while the remaining 6 did not return their records and were therefore included in the anthropometric and body composition analysis only (Figure 1).

3.1. Demographic Characteristics

The demographic characteristics of the participants are shown in Table 1. Of the 24 girls, 10 reported having reached menarche at the age of 12.6 ± 0.7 years. The age of the 10 athletes who had menstruated was 13.3 ± 0.7 years, while the mean age of those who had not yet menstruated was 11.9 ± 0.9 years.

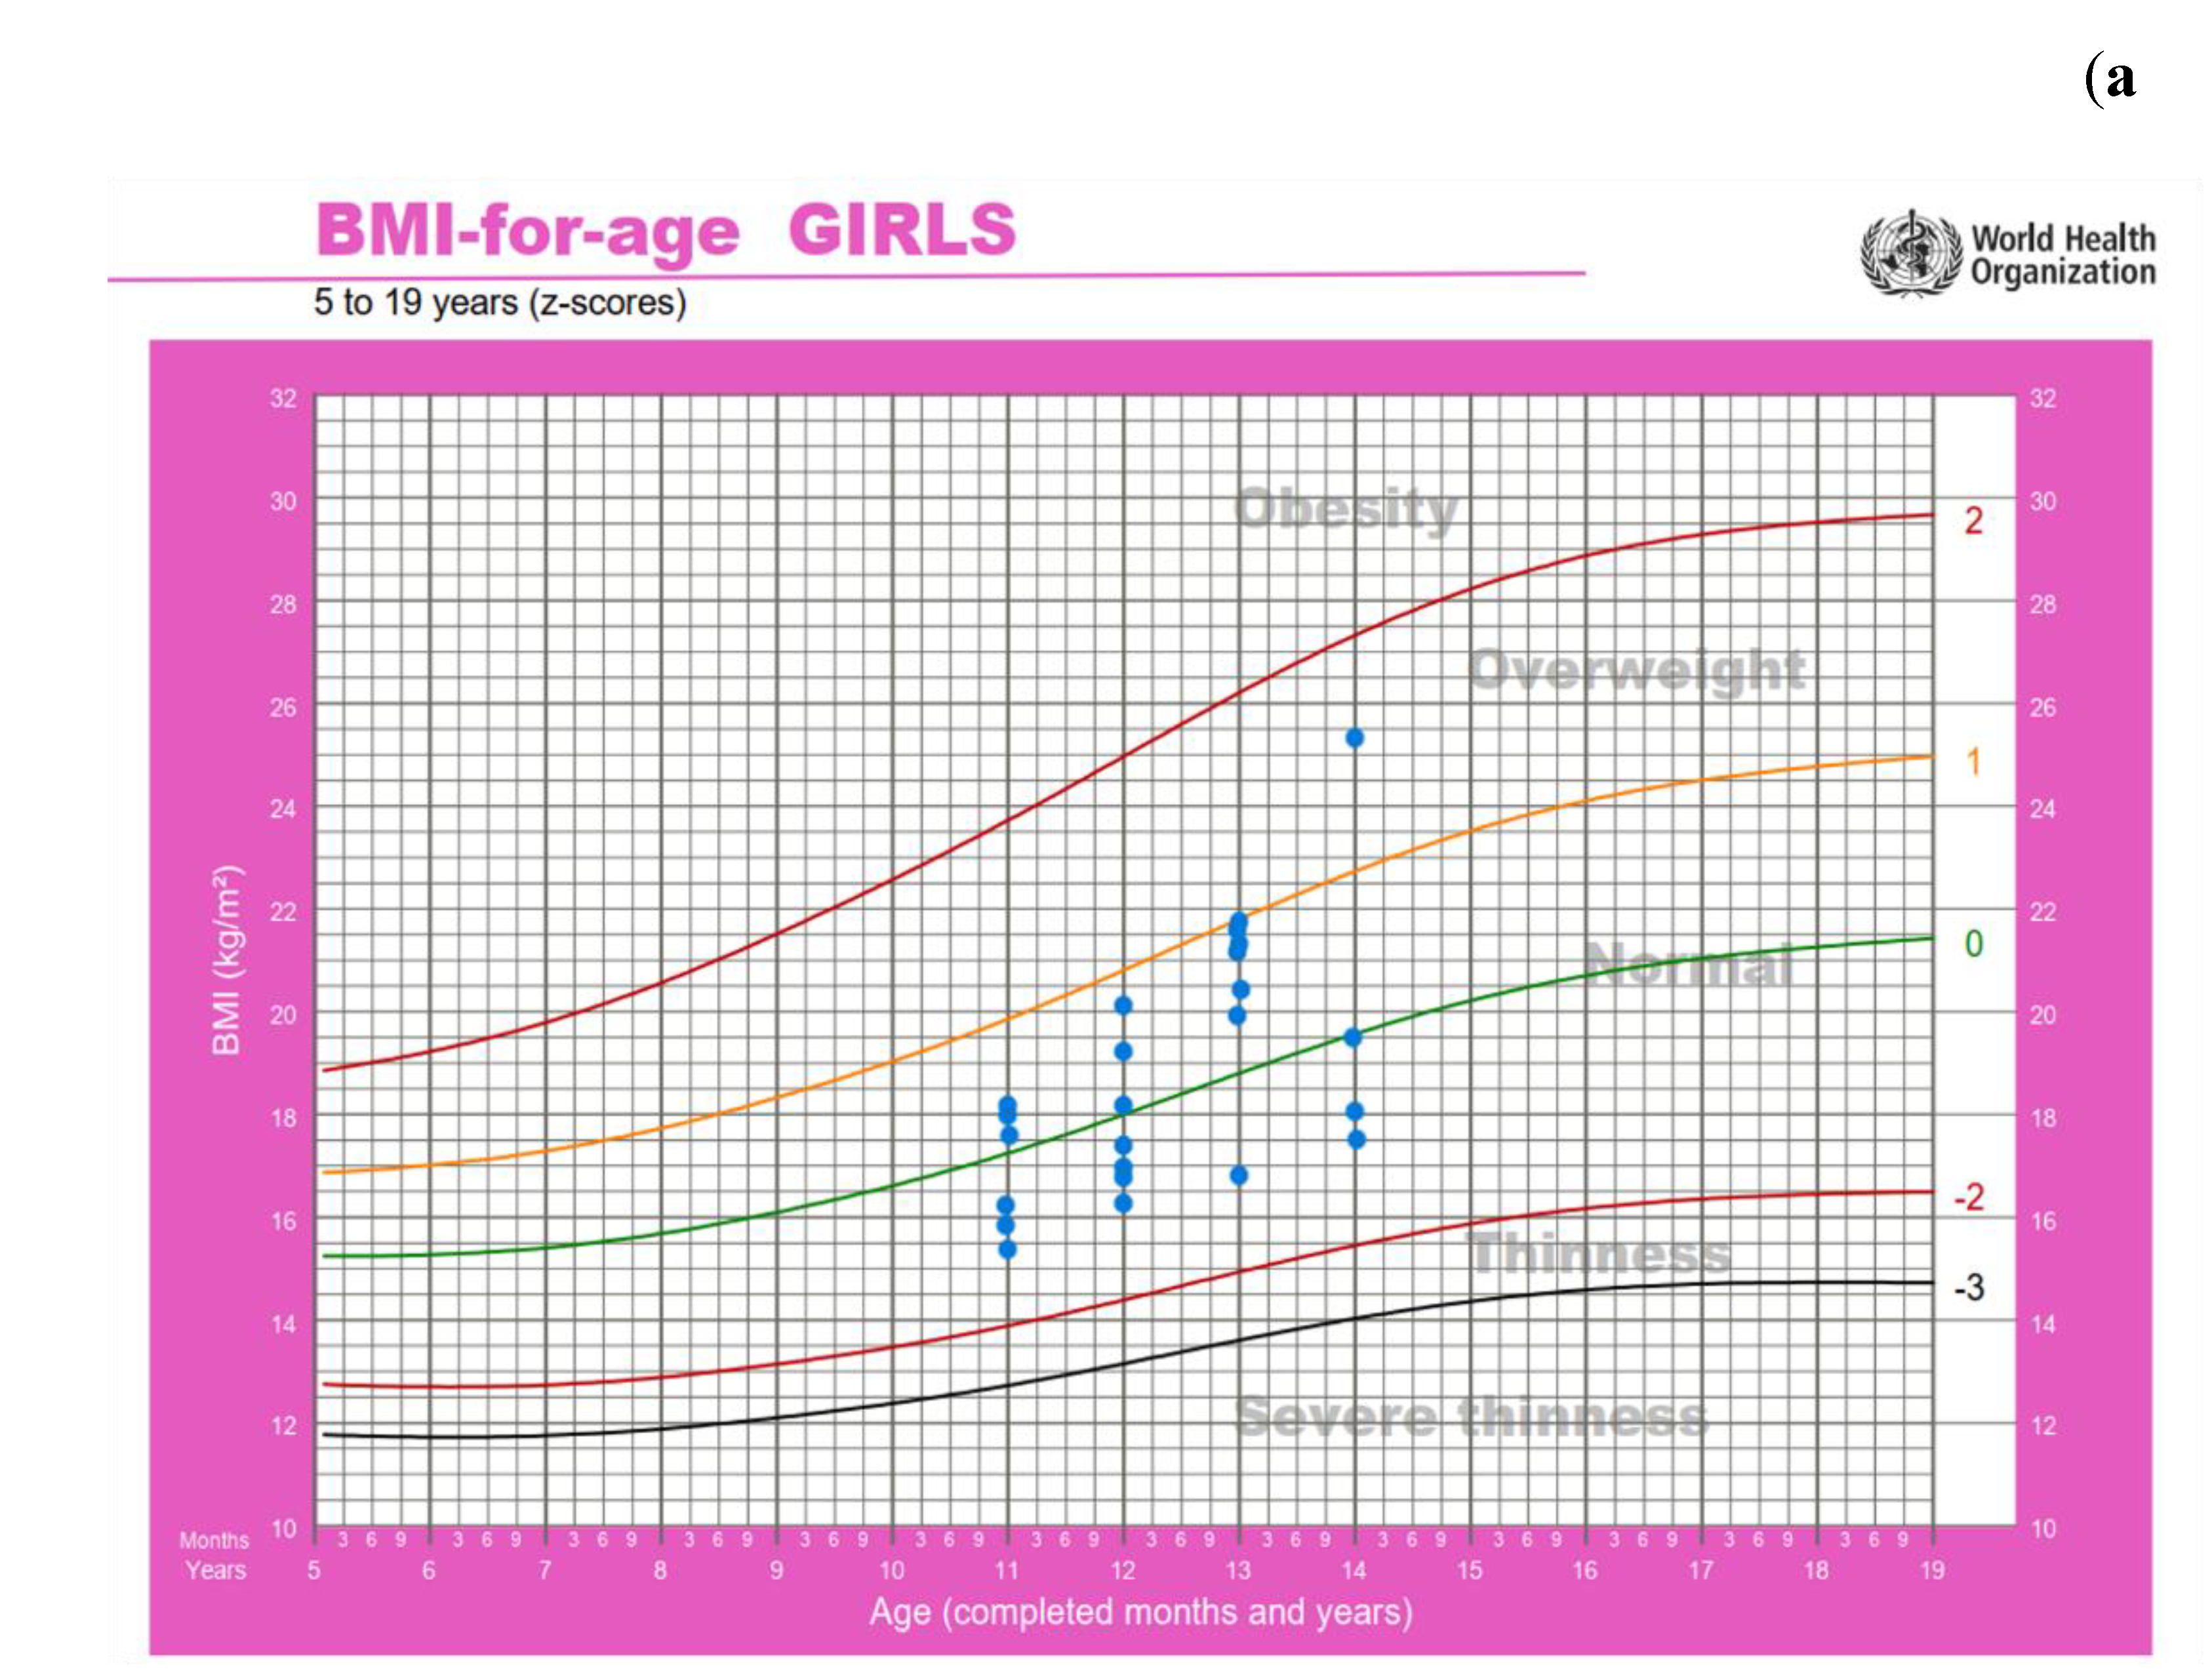
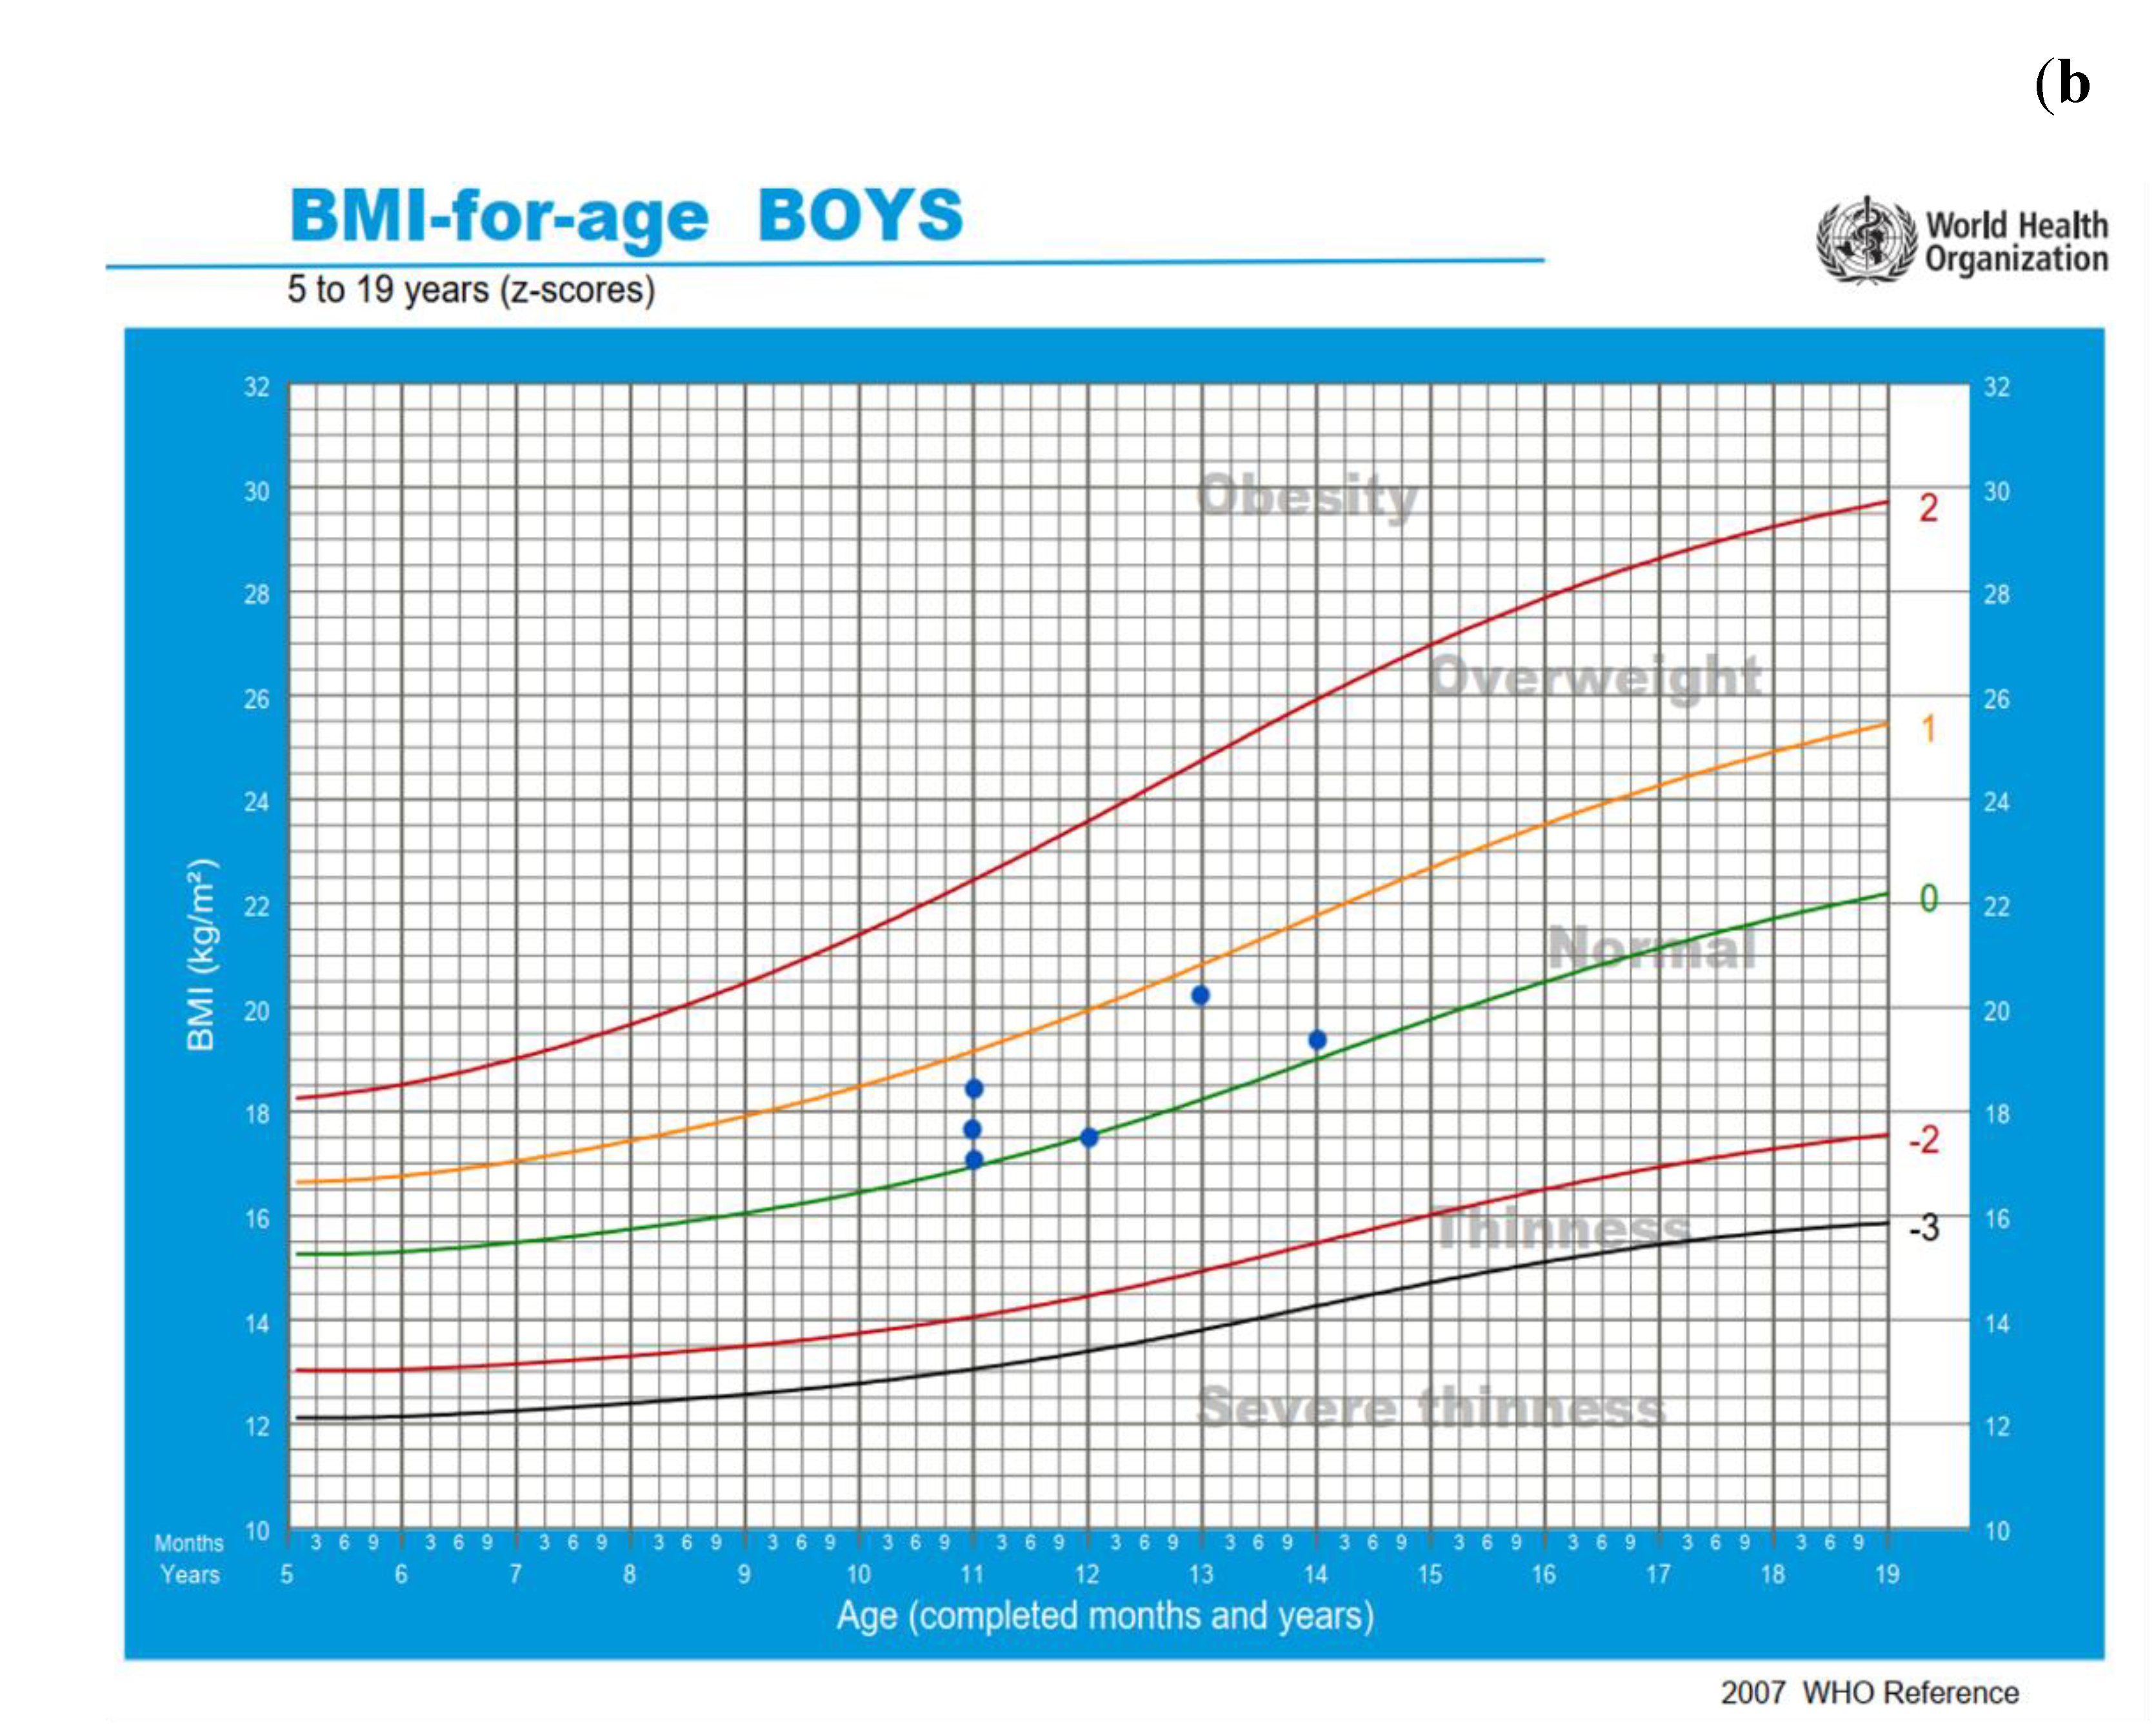
3.2. Anthropometrics and Body Composition

Table 2 presents the anthropometric and body composition variables of the participants.
All participants were classified in the normal BMI category according to the WHO growth charts, except for one girl who was classified as overweight. The BMI z-score value was 0.10 ± 0.70 for all participants (n = 30) and 0.11 ± 0.75 for the participants with complete energy data (n = 24, Figure 2).
A statistically significant difference was found between the Z vectors of the participants in the present study and those of a reference population [32] (T² = 16.3, F = 8.1, p = 0.0004, Mahalanobis D = 0.82, Figure 3).

3.3. Energy Balance and Energy Availability

Underreporting of dietary intake was identified in 63% of the participants, with an average underreporting level of 17%. The participants’ total daily EI was 1865 ± 295 kcal (Figure 4a) and increased to 2033 ± 148 kcal after adjustment for underreporting (Figure 4b). Daily REE was 1290 ± 134 kcal, EEE was 396 ± 87 kcal, and TEE reached 2001 ± 204 kcal (Figure 4a, b). PAL was 1.56 ± 0.06.
Daily EB was initially negative (–135 ± 374 kcal, Figure 4a) but became positive after adjustment for underreporting (32 ± 223 kcal, Figure 4b). Specifically, 14 out of the 24 athletes (58%) initially exhibited a negative EB (Figure 4c), whereas, after adjustment for underreporting, 8 of the 24 athletes (33%) retained a negative EB (Figure 4d).
The participants’ ΕA was 43.7 ± 14.4 kcal/kg FFM/day (Figure 5a) and increased to 49.2 ± 11.4 kcal/kg FFM/day after adjusting EI for underreporting (Figure 5c). Before adjustment for underreporting, two girls and one boy had ΕA values below 30 kcal/kg FFM/day, and eleven girls had values below 45 kcal/kg FFM/day (Figure 5b). Following adjustment for underreporting, one girl remained below 30 kcal/kg FFM/day, whereas six girls and one boy had EA values below 45 kcal/kg FFM/day (Figure 5d).

3.4. Correlations

Correlation analysis revealed significant correlations between EA and BCM, R, Xc, EB (averaged over the two weekdays with gymnastics training), and TEE (averaged over the two weekdays with gymnastics training), both before and after adjustment for underreporting of dietary intake (Table 3 and Table 4, respectively). Additionally, after adjustment for underreporting, EA was significantly correlated with FM in kg (Table 4). Phase angle was significantly correlated with body weight, BMI, FM (kg), FFM (kg), TBW, and ECW (Table 5).

4. Discussion

In the present study, we assessed EI, TEE, EB, EA, body composition, and φ in adolescent artistic gymnasts during a competitive season. Our findings show that the athletes demonstrated adequate EA to support physiological functions, with anthropometric variables, body composition variables, and φ within the normal range.
One of the consequences of LEA, and a severe indicator of REDs syndrome, is primary amenorrhea [1]. In the present study around half of the female athletes had already reached menarche at a mean age of 12.6 years, which is slightly lower than the ages reported in adolescent rhythmic gymnasts (13.3 years [35] and 13.6 years [36].) Additionally, the participants’ normal BMI values indicate appropriate physical development. These BMI values are consistent with the range of 18 to 19 kg/m² reported in similar populations [22,24,25,35,37].
Regarding body composition, no specific and widely accepted normative values exist for children and adolescents. The FM percentage of 16.1% measured in this study is comparable to previous findings in healthy Polish and Greek adolescents, in which FM percentage among participants with normal body weight was 16.3 and 17.6%, respectively [38,39]. A similar FM percentage (16.8%) has also been reported in Bulgarian female artistic gymnasts [37]. In contrast, three studies in acrobatic and rhythmic gymnasts reported lower FM percentage values [22,24,26], likely due to intensive training and low EI, whereas two studies in artistic and acrobatic gymnasts reported higher FM percentage values, reaching up to 22.9% [18,25]. Among the studies that evaluated body composition in gymnastic athletes, only two reported FFM percentage [24,25]: Villa et al. found values nearly identical to those in the present study [24], whereas Besor et al. reported values approximately 5% lower [25], likely attributable to the older age of their participants (≈ 14 years) and the different body composition method used (dual-energy X-ray absorptiometry).
Regarding φ, the mean value of 6.0 ° found in the present study is slightly higher (by 0.2–0.3°) than values reported in healthy Caucasian children aged 12 years [32], suggesting cellular integrity, increased muscle mass, and adequate nutritional status. Τo our knowledge, only one study has assessed φ in adolescent gymnast, specifically rhythmic gymnasts, reporting a slightly higher value of 6.7° [35], possibly due to the older age of the participants (≈ 15 years).
According to BIVA, the bioimpedance vector of the participants in the present study was shifted to the left of that of healthy 12-year-old children [32], forming a slightly larger angle with the R/height axis. Since the angle between the bioelectrical impedance vector and the R/height axis equals φ, the larger angle observed in the athletes confirms their higher φ compared to the reference population. This leftward shift is consistent with studies in youth athletes from various sports [40,41,42] and suggests increased BCM [43]. Indeed, we found a BCM of about 20 kg, which is about 4 kg higher than values reported in healthy adolescents of similar age [44].
The percentage of dietary underreporting identified in this study aligns with findings from studies involving children, adolescents, and adults [45,46,47]. Underreporting may arise from unconscious reasons, such as difficulty estimating portion sizes, inaccurate measurements, or forgetting to record consumed foods, and conscious reasons, including feelings of guilt, the desire to present a more disciplined image, or a lack of motivation.
Studies in adolescent athletes in rhythmic and acrobatic gymnastics have reported low EB, LEA, and, in some cases, menstrual irregularities, indicating an increased risk of REDs [22,24,25,35]. In contrast, our findings indicate that the adolescent artistic gymnasts had adequate EI, as reflected by a nearly neutral EB and EA values above the threshold associated with REDs risk. This discrepancy may be partly explained by the younger age of the participants in the present study, as well as differences in the type of gymnastics compared with the aforementioned studies. Specifically, Oliveira et al. [19] reported that training volume in artistic gymnasts aged around 11 years was 20 hours per week, which is consistent with the training volume of the athletes in the present study. In contrast, studies in older adolescent artistic gymnasts (15-17 years), reported higher training volume, around 30 hours per week [15,16,17,18]. Additionally, the relatively low training volume observed in the present study may be attributed to the fact that the participants were not elite athletes.
Τhe negative correlation between EA and FM (kg) could be partially explained by the impact of LEA on energy metabolism and regulation. Specifically, LEA can reduce resting metabolic rate, induce hypothyroidism, and increase cortisol levels, all of which may negatively affect physiological function. Indeed, studies have reported higher FM in female adolescent athletes with EA < 30 kcal/kg FFM/day than those whose EA exceeded this threshold [48,49].
The negative correlation between EA and BCM may be explained by the fact that EA is expressed relative to FFM. Because BCM represents the protein rich compartment of FFM [4], athletes with higher BCM than others, but with similar EI and EEE, will inherently have lower EA, reflecting a mathematical, rather than physiological, relationship. Similarly, the positive correlation between EA and R may result from the relationship between EA and FFM, as resistance decreases with increasing FFM. The positive correlation between EA and Xc may reflect the influence of EA on cellular integrity. Athletes with higher EA are more likely to maintain adequate energy to support cellular integrity and function.
Regarding φ, its significant correlations with other anthropometric and body composition variables are consistent with previous research. Specifically, body weight, BMI, FM, FFM, TBW, and ECW have all been identified as determinants of φ [50,51].
The main limitations of the present study are: First, the sample included a small number of boys, as participation in most sport clubs in Thessaloniki, Greece is predominately female. Second, the biological maturation stage of the participants was not assessed. Third, 20% of the athletes did not complete the three-day dietary intake and physical activity records, limiting the available data for estimating EB and EA. Another limitation concerns the accuracy of the dietary records, namely the extent to which they reflect the actual intake. To address this issue, adjustments were applied in cases of dietary underreporting. These adjustments assumed that the recorded foods were accurate but the portion sizes had been underestimated, rather than assuming that specific foods were entirely omitted. Finally, the estimation of EEE was based on observations of a representative subset of athletes and training sessions, rather than all participants and sessions.
Our review of the literature, as presented in this article, indicates that the number of studies examining ΕA, body composition and φ in adolescent artistic gymnasts is very limited. Therefore, the importance of the present study lies in its focus on a population that has been underrepresented in previous studies. Our findings imply that the exercise training regimen followed by early adolescent artistic gymnasts (11-14 years) does not place them at risk of developing LEA. Further studies are recommended to investigate EA in older adolescent and elite artistic gymnasts, who typically engage in more demanding training programs. Moreover, future research should address not only EA, but also additional factors proposed to contribute to the risk of developing REDs syndrome [52].

5. Conclusions

In conclusion, adolescent artistic gymnasts who participated in national competitions but were not elite athletes exhibited normal BMI and body composition values, consistent with their age and training level. After adjustment for estimated dietary underreporting, EB and EA were within ranges considered sufficient to support bodily physiological functions. Overall, our findings show that the participants in this study did not experience LEA during the competitive season.

Author Contributions

Conceptualization, D.M. and A.P.; methodology, D.M., M.C., and A.P.; formal analysis, A.G., A.K., and A.P.; investigation, A.G., A.K., D.M., and A.P.; resources, A.P.; data curation, A.G., A.K., and A.P.; writing—original draft preparation, A.G. and A.K.; writing—review and editing, D.M., M.C., and A.P.; visualization, A.G. and A.K.; supervision, A.P.; project administration, D.M., M.C., and A.P. All authors have read and agreed to the published version of the manuscript.

Funding

This research received no external funding.

Institutional Review Board Statement

The study was conducted in accordance with the Declaration of Helsinki and approved by the Ethics Committee of the School of Medicine, Aristotle University of Thessaloniki (approval number 82/2024).

Informed Consent Statement

Informed consent was obtained from all subjects involved in the study.

Data Availability Statement

The original data presented in the study are openly available in the repository of Hellenic Academic Research Data Management Initiative at https://hardmin.heal-link.gr/dataset/907eb5f0-275d-46c1-9496-9c6d387b6074.

Acknowledgments

We thank the participants and their parents for their adherence to the requirements of the study.

Conflicts of Interest

The authors declare no conflicts of interest.

Abbreviations

The following abbreviations are used in this manuscript:
BCM Body cell mass
BIA Bioelectrical impedance analysis
BIVA Bioelectrical Impedance Vector Analysis
BMI Body mass index
EA Energy availability
EB Energy balance
ECW Extracellular water
EEE Exercise energy expenditure
EI Energy intake
FFM Fat-free mass
FM Fat mass
LEA Low energy availability
PAL Physical Activity Level
R Resistance
REDs Relative Energy Deficiency in Sport
REE Resting Energy Expenditure
SD Standard deviation
TBW Total body water
TEE Total energy expenditure
WHO World Health Organization
Xc Reactance
Ζ Impedance
φ Phase angle

References

  1. Mountjoy, M.; Ackerman, K.E.; Bailey, D.M.; Burke, L.M.; Constantini, N.; Hackney, A.C.; Heikura, I.A.; Melin, A.; Pensgaard, A.M.; Stellingwerff, T.; et al. 2023 International Olympic Committee’s (IOC) Consensus Statement on Relative Energy Deficiency in Sport (REDs). Br J Sports Med 2023, 57, 1073–1097. [Google Scholar] [CrossRef]
  2. Melin, A.K.; Heikura, I.A.; Tenforde, A.; Mountjoy, M. Energy Availability in Athletics: Health, Performance, and Physique. Int J Sport Nutr Exerc Metab 2019, 29, 152–164. [Google Scholar] [CrossRef]
  3. Dipla, K.; Kraemer, R.R.; Constantini, N.W.; Hackney, A.C. Relative Energy Deficiency in Sports (RED-S): Elucidation of Endocrine Changes Affecting the Health of Males and Females. Hormones 2021, 20, 35–47. [Google Scholar] [CrossRef]
  4. Kyle, U.G.; Bosaeus, I.; De Lorenzo, A.D.; Deurenberg, P.; Elia, M.; Gómez, J.M.; Heitmann, B.L.; Kent-Smith, L.; Melchior, J.C.; Pirlich, M.; et al. Bioelectrical Impedance Analysis - Part I: Review of Principles and Methods. Clinical Nutrition 2004, 23, 1226–1243. [Google Scholar] [CrossRef] [PubMed]
  5. da Silva, B.R.; Gonzalez, M.C.; Cereda, E.; Prado, C.M. Exploring the Potential Role of Phase Angle as a Marker of Oxidative Stress: A Narrative Review. Nutrition 2022, 93. [Google Scholar] [CrossRef] [PubMed]
  6. Fernández-Jiménez, R.; Dalla-Rovere, L.; García-Olivares, M.; Abuín-Fernández, J.; Sánchez-Torralvo, F.J.; Doulatram-Gamgaram, V.K.; Hernández-Sanchez, A.M.; García-Almeida, J.M. Phase Angle and Handgrip Strength as a Predictor of Disease-Related Malnutrition in Admitted Patients: 12-Month Mortality. Nutrients 2022, 14. [Google Scholar] [CrossRef]
  7. Silva, A.A.; de Melo, G.F.; de Almeida Filho, E.J.B.; Silvino, V.O.; de Albuquerque Neto, S.L.; Ribeiro, S.L.G.; Silva, A.S.; dos Santos, M.A.P. Correlation between Phase Angle and Muscle Mass, Muscle Function, and Health Perception in Community-Dwelling Older Women. Sport Sci Health 2023, 19, 713–721. [Google Scholar] [CrossRef]
  8. Samadinian, F.; Eshaghian, N.; Tarrahi, M.J.; Amani, R.; Akbari, M.; Shirani, F. Phase Angle as an Indicator of Nutritional Status: A Cross-Sectional Study on the Iranian Population. J Health Popul Nutr 2025, 44. [Google Scholar] [CrossRef] [PubMed]
  9. Popiolek-Kalisz, J.; Kalisz, G. Malnutrition Assessed with Phase Angle and Mortality Risk in Heart Failure – a Meta-Analysis. Nutrition, Metabolism and Cardiovascular Diseases 2025. [Google Scholar] [CrossRef]
  10. Langer, R.D.; Ward, L.C.; Larsen, S.C.; Heitmann, B.L. Can Change in Phase Angle Predict the Risk of Morbidity and Mortality during an 18-Year Follow-up Period? A Cohort Study among Adults. Front Nutr 2023, 10. [Google Scholar] [CrossRef]
  11. Chen, Y.Q.; Chen, H.F.; Han, Y.; Shen, Y.H.; Zhang, Y.D.; Fu, L.Z.; Tang, F.; Liu, X.S.; Wu, Y.F. Lower Phase Angle as a Marker for Poor Prognosis in Patients with Chronic Kidney Disease: A Cohort Study. Front Nutr 2025, 12. [Google Scholar] [CrossRef]
  12. Cirillo, E.; Pompeo, A.; Cirillo, F.T.; Vilaça-Alves, J.; Costa, P.; Ramirez-Campillo, R.; Dourado, A.C.; Afonso, J.; Casanova, F. Relationship between Bioelectrical Impedance Phase Angle and Upper and Lower Limb Muscle Strength in Athletes from Several Sports: A Systematic Review with Meta-Analysis. Sports 2023, 11. [Google Scholar] [CrossRef]
  13. Moeskops, S.; Oliver, J.L.; Read, P.J.; Cronin, J.B.; Myer, G.D.; Lloyd, R.S. The Physiological Demands of Youth Artistic Gymnastics: Applications to Strength and Conditioning. Strength Cond J 2019, 41, 1–13. [Google Scholar] [CrossRef]
  14. Sundgot-Borgen, J.; Garthe, I.; Meyer, N. Energy Needs and Weight Management for Gymnasts. In Gymnastics; wiley, 2013; pp. 51–59. ISBN 9781118357538. [Google Scholar]
  15. Georgopoulos, N.A.; Markou, K.B.; Theodoropoulou, A.; Benardot, D.; Leglise, M.; Vagenakis, A.G. Growth Retardation in Artistic Compared with Rhythmic Elite Female Gymnasts 2002.
  16. Markou, K.B.; Mylonas, P.; Theodoropoulou, A.; Kontogiannis, A.; Leglise, M.; Vagenakis, A.G.; Georgopoulos, N.A. The Influence of Intensive Physical Exercise on Bone Acquisition in Adolescent Elite Female and Male Artistic Gymnasts. Journal of Clinical Endocrinology and Metabolism 2004, 89, 4383–4387. [Google Scholar] [CrossRef] [PubMed]
  17. Theodoropoulou, A.; Markou, K.B.; Vagenakis, G.A.; Benardot, D.; Leglise, M.; Kourounis, G.; Vagenakis, A.G.; Georgopoulos, N.A. Delayed but Normally Progressed Puberty Is More Pronounced in Artistic Compared with Rhythmic Elite Gymnasts Due to the Intensity of Training. Journal of Clinical Endocrinology and Metabolism 2005, 90, 6022–6027. [Google Scholar] [CrossRef] [PubMed]
  18. Jakše, B.; Jakše, B.; Čuk, I.; Šajber, D. Body Composition, Training Volume/Pattern and Injury Status of Slovenian Adolescent Female High-performance Gymnasts. Int J Environ Res Public Health 2021, 18, 1–12. [Google Scholar] [CrossRef]
  19. de Oliveira Goulart, K.N.; Vieira, M.M.; Aleixo, I.M.S.; Wilke, C.F.; Wanner, S.P. Estimated Energy Expenditure and Training Intensity in Young Female Artistic Gymnasts. Motriz. Revista de Educacao Fisica 2022, 28. [Google Scholar] [CrossRef]
  20. Carvajal Veitia, W.; Campos, Y.D. Body Composition Analysis Using Bioelectrical Parameters in the Cuban Sporting Population. Archivos de Medicina del Deporte 2017, 34, 207–215. [Google Scholar]
  21. Aguilo, A.; Lozano, L.; Tauler, P.; Nafría, M.; Colom, M.; Martínez, S. Nutritional Status and Implementation of a Nutritional Education Program in Young Female Artistic Gymnasts. Nutrients 2021, 13. [Google Scholar] [CrossRef]
  22. Silva, M.R.G.; Silva, H.H.; Paiva, T. Sleep Duration, Body Composition, Dietary Profile and Eating Behaviours among Children and Adolescents: A Comparison between Portuguese Acrobatic Gymnasts. Eur J Pediatr 2018, 177, 815–825. [Google Scholar] [CrossRef]
  23. Silva, M.R.G.; Paiva, T. Low Energy Availability and Low Body Fat of Female Gymnasts before an International Competition. Eur J Sport Sci 2015, 15, 591–599. [Google Scholar] [CrossRef]
  24. Villa, M.; Villa-Vicente, J.G.; Seco-Calvo, J.; Mielgo-Ayuso, J.; Collado, P.S. Body Composition, Dietary Intake and the Risk of Low Energy Availability in Elite-Level Competitive Rhythmic Gymnasts. Nutrients 2021, 13. [Google Scholar] [CrossRef]
  25. Besor, O.; Redlich, N.; Constantini, N.; Weiler-Sagie, M.; Monsonego Ornan, E.; Lieberman, S.; Bentur, L.; Bar-Yoseph, R. Assessment of Relative Energy Deficiency in Sport (REDs) Risk among Adolescent Acrobatic Gymnasts. J Pers Med 2024, 14. [Google Scholar] [CrossRef]
  26. Purenović-Ivanović, T.; Popović, R.; Bubanj, S.; Stanković, R. Body Composition in High-Level Female Rhythmic Gymnasts of Different Age Categories. Sci Sports 2019, 34, 141–148. [Google Scholar] [CrossRef]
  27. Piccoli, A.; Rossi, B.; Pillon, L.; Bucciante, G. A New Method for Monitoring Body Fluid Variation by Bioimpedance Analysis: The RXc Graph. 1994, Vol. 46. [Google Scholar] [CrossRef] [PubMed]
  28. Schofield, W. Predicting Basal Metabolic Rate, New Standards and Review of Previous Work. Hum Nutr Clin Nutr 1985, 39, 5–41. [Google Scholar]
  29. Butte, N.F.; Watson, K.B.; Ridley, K.; Zakeri, I.F.; McMurray, R.G.; Pfeiffer, K.A.; Crouter, S.E.; Herrmann, S.D.; Bassett, D.R.; Long, A.; et al. A Youth Compendium of Physical Activities: Activity Codes and Metabolic Intensities. Med Sci Sports Exerc 2018, 50, 246–256. [Google Scholar] [CrossRef] [PubMed]
  30. Herrmann, S.D.; Willis, E.A.; Ainsworth, B.E. The 2024 Compendium of Physical Activities and Its Expansion. J Sport Health Sci 2024, 13, 1–2. [Google Scholar] [CrossRef]
  31. European Food Safety Authority (EFSA). Dietary Reference Values for Nutrients Summary Report. EFSA Supporting Publications 2017, 14, 98. [Google Scholar] [CrossRef]
  32. De Palo, T.; Messina, G.; Edefonti, A.; Perfumo, F.; Pisanello, L.; Peruzzi, L.; Di Iorio, B.; Mignozzi, M.; Vienna, A.; Conti, G.; et al. Normal Values of the Bioelectrical Impedance Vector in Childhood and Puberty. Nutrition 2000. [Google Scholar] [CrossRef] [PubMed]
  33. Piccoli, A.; Pillon, L.; Dumler, F. Applied Nutritional Investigation - Impedance Vector Distribution by Sex, Race, Body Mass Index, and Age in the United States: Standard Reference Intervals as Bivariate Z Scores. Nutrition 2002. [Google Scholar] [CrossRef] [PubMed]
  34. WHO (World Health Organization) Growth Reference Data for 5-19 Years. Available online: http://www.who.int/growthref/en/ (accessed on 12 May 2025).
  35. Alessandro, C.D.’; Morelli, E.; Evangelisti, I.; Galetta, F.; Franzoni, F.; Lazzeri, D.; Piazza, M.; Cupisti, A. Profiling the Diet and Body Composition of Subelite Adolescent Rhythmic Gymnasts 2007.
  36. Jürimäe, J.; Remmel, L.; Tamm, A.L.; Purge, P.; Maasalu, K.; Tillmann, V. Associations of Circulating Irisin and Fibroblast Growth Factor-21 Levels with Measures of Energy Homeostasis in Highly Trained Adolescent Rhythmic Gymnasts. J Clin Med 2022, 11. [Google Scholar] [CrossRef]
  37. Kolimechkov, S.; Yanev, I.; Kiuchukov, I.; Petrov, L.; Alexandrova, A.; Zaykova, D.; Stoimenov, E. Nutritional Status and Body Composition of Young Artistic Gymnasts from Bulgaria. Journal of Applied Sports Sciences 2019, 3, 39–52. [Google Scholar] [CrossRef]
  38. Kobylińska, M.; Antosik, K.; Decyk, A.; Kurowska, K.; Skiba, D. Body Composition and Anthropometric Indicators in Children and Adolescents 6–15 Years Old. Int J Environ Res Public Health 2022, 19. [Google Scholar] [CrossRef]
  39. Papadopoulou, S.K.; Feidantsis, K.G.; Hassapidou, M.N.; Methenitis, S. The Specific Impact of Nutrition and Physical Activity on Adolescents’ Body Composition and Energy Balance. Res Q Exerc Sport 2021, 92, 736–746. [Google Scholar] [CrossRef]
  40. Meleleo, D.; Bartolomeo, N.; Cassano, L.; Nitti, A.; Susca, G.; Mastrototaro, G.; Armenise, U.; Zito, A.; Devito, F.; Scicchitano, P.; et al. Evaluation of Body Composition with Bioimpedence. A Comparison between Athletic and Non-Athletic Children. Eur J Sport Sci 2017, 17, 710–719. [Google Scholar] [CrossRef]
  41. Carrasco-Marginet, M.; Castizo-Olier, J.; Rodríguez-Zamora, L.; Iglesias, X.; Rodríguez, F.A.; Chaverri, D.; Brotons, D.; Irurtia, A. Bioelectrical Impedance Vector Analysis (BIVA) for Measuring the Hydration Status in Young Elite Synchronized Swimmers. PLoS One 2017, 12. [Google Scholar] [CrossRef]
  42. Koury, J.C.; Trugo, N.M.F.; Torres, A.G. Phase Angle and Bioelectrical Impedance Vectors in Adolescent and Adult Male Athletes. Int J Sports Physiol Perform 2014, 9, 798–804. [Google Scholar] [CrossRef] [PubMed]
  43. de la Cruz Marcos, S.; Redondo Del Río, M.P.; de Mateo Silleras, B. Applications of Bioelectrical Impedance Vector Analysis (Biva) in the Study of Body Composition in Athletes. Applied Sciences (Switzerland) 2021, 11. [Google Scholar] [CrossRef]
  44. Kaczmarek, M.; Durda-Masny, M.; Hanć, T. Reference Data for Body Composition Parameters in Normal-Weight Polish Adolescents: Results from the Population-Based ADOPOLNOR Study. Eur J Pediatr 2024, 183, 5021–5031. [Google Scholar] [CrossRef]
  45. Lioret, S.; Touvier, M.; Balin, M.; Huybrechts, I.; Dubuisson, C.; Dufour, A.; Bertin, M.; Maire, B.; Lafay, L. Characteristics of Energy Under-Reporting in Children and Adolescents. British Journal of Nutrition 2011, 105, 1671–1680. [Google Scholar] [CrossRef] [PubMed]
  46. Burrows, T.L.; Ho, Y.Y.; Rollo, M.E.; Collins, C.E. Validity of Dietary Assessment Methods When Compared to the Method of Doubly Labeled Water: A Systematic Review in Adults. Front Endocrinol (Lausanne) 2019, 10. [Google Scholar] [CrossRef] [PubMed]
  47. Petridou, A.; Rodopaios, N.E.; Mougios, V.; Koulouri, A.A.; Vasara, E.; Papadopoulou, S.K.; Skepastianos, P.; Hassapidou, M.; Kafatos, A. Effects of Periodic Religious Fasting for Decades on Nutrient Intakes and the Blood Biochemical Profile. Nutrients 2021, 13. [Google Scholar] [CrossRef]
  48. Koehler, K.; Achtzehn, S.; Braun, H.; Mester, J.; Schaenzer, W. Comparison of Self-Reported Energy Availability and Metabolic Hormones to Assess Adequacy of Dietary Energy Intake in Young Elite Athletes. Applied Physiology, Nutrition and Metabolism 2013, 38, 725–733. [Google Scholar] [CrossRef] [PubMed]
  49. Kinoshita, N.; Uchiyama, E.; Ishikawa-Takata, K.; Yamada, Y.; Okuyama, K. Association of Energy Availability with Resting Metabolic Rates in Competitive Female Teenage Runners: A Cross-Sectional Study. J Int Soc Sports Nutr 2021, 18. [Google Scholar] [CrossRef]
  50. Ferreira, G.O.C.; Ferrari, G.; Langer, R.D.; Cossio-Bolaños, M.; Gomez-Campos, R.; Lázari, E.; Moraes, A.M. Phase Angle and Its Determinants among Adolescents: Influence of Body Composition and Physical Fitness Level. Sci Rep 2024, 14. [Google Scholar] [CrossRef]
  51. Gonzalez, M.C.; Barbosa-Silva, T.G.; Bielemann, R.M.; Gallagher, D.; Heymsfield, S.B. Phase Angle and Its Determinants in Healthy Subjects: Influence of Body Composition. American Journal of Clinical Nutrition 2016, 103, 712–716. [Google Scholar] [CrossRef]
  52. Jeukendrup, A.E.; Areta, J.L.; Van Genechten, L.; Langan-Evans, C.; Pedlar, C.R.; Rodas, G.; Sale, C.; Walsh, N.P. Does Relative Energy Deficiency in Sport (REDs) Syndrome Exist? Sports Medicine 2024, 54, 2793–2816. [Google Scholar] [CrossRef]
Figure 1. Flow chart of participants.
Preprints 191033 g001
Figure 2. Position of (a) girls (n = 24) and (b) boys (n = 6) on the WHO BMI-for-age growth charts [34].
Preprints 191033 g002
Figure 3. 95% confidence ellipses for the mean bioelectrical impedance vectors of participants in the present study (dashed line) and the reference population (solid line) [32]. Xc: Reactance, R: Resistance. Analysis was performed using Hotelling’s T² test. *Significant difference, p = 0.0004.
Preprints 191033 g003
Figure 4. a, b: Boxplots of daily energy intake (EI), total energy expenditure (TEE), and energy balance (EB) of the participants (n = 24), averaged over 3 days, (a) before adjustment for dietary underreporting and (b) after adjustment for dietary underreporting. Each box represents the interquartile range, and the center line represents the median. Whiskers are extended to the most extreme data point that is no more than 1.5 times the interquartile range from the edge of the box (Tukey style). Dots represent individual values. c, d: Individual EB of the participants, (c) before adjustment for dietary underreporting and (d) after adjustment for dietary underreporting.
Preprints 191033 g004
Figure 5. a, c: Energy availability (EA) of the participants (n = 24), averaged over 2 days, (a) before adjustment for dietary underreporting and (c) after adjustment for dietary underreporting. Each box represents the interquartile range, and the center line represents the median. Whiskers are extended to the most extreme data point that is no more than 1.5 times the interquartile range from the edge of the box (Tukey style). Dots represent individual values. b, d: Individual EA of the participants, (b) before adjustment for dietary underreporting and (d) after adjustment for dietary underreporting. Red bars represent participants with EA below the defined threshold for low energy availability (red line), orange bars represent participants with EA between the low and adequate EA thresholds (green line), and green bars represent participants with adequate EA.
Preprints 191033 g005
Table 1. Table 1. Demographic characteristics (mean ± SD) of all participants (n = 30) and of those with complete energy intake and energy expenditure data (n = 24).
Variable n = 30 n = 24
Age (years) 12.4 ± 1.1 12.4 ± 1.1
Training age (years) 7.6 ± 1.7 7.7 ± 1.7
Training duration (h/week) 17.1 ± 3.9 17.4 ± 3.9
Table 2. Anthropometrics, body composition, and φ of all participants (n = 30) and of those with complete energy intake and energy expenditure data (n = 24).
Variable n = 30 n = 24
Weight (kg) 42.5 ± 8.9 42.6 ± 9.3
Height (m) 1.50 ± 0.09 1.50 ± 0.09
Body mass index (kg/m2) 18.7 ± 2.2 18.8 ± 2.4
Fat mass (kg) 7.0 ± 2.5 6.9 ± 2.6
Fat mass (%) 16.1 ± 3.4 16.0 ± 3.7
Fat-free mass (kg) 35.5 ± 7.1 35.7 ± 7.4
Fat-free mass (%) 83.9 ± 3.4 84.0 ± 3.7
Total body water (L) 27.0 ± 5.2 27.1 ± 5.5
Total body water (%) 63.7 ± 2.7 63.8 ± 2.9
Extracellular water (L) 12.7 ± 1.8 12.7 ± 1.9
Extracellular water (%) 30.3 ± 2.4 30.3 ± 2.5
Intracellular water (L) 13.9 ± 2.8 13.9 ± 2.9
Intracellular water (%) 33.1 ± 3.6 32.8 ± 3.3
Third-space water (L) 0.3 ± 1.7 0.5 ± 1.6
Body cell mass (kg) 19.9 ± 3.9 19.9 ± 4.1
Resistance (Ω) 589 ± 59 586 ± 63
Reactance (Ω) 62.0 ± 5.6 61.9 ± 6.2
Phase angle (°) 6.0 ± 0.6 6.1 ± 0.6
Impedance at 5 kHz (Ω) 669 ± 62 666 ± 66
Impedance at 50 kHz (Ω) 593 ± 59 589 ± 63
Impedance at 100 kHz (Ω) 562 ± 57 559 ± 61
Impedance at 200 kHz (Ω) 535 ± 56 531 ± 59
Table 3. Correlation analysis between energy availability and other conceptually relevant study variables before adjustment for underreporting of dietary intake in adolescent artistic gymnasts during the competitive season (n = 24).
r or ρ p
Fat mass (kg) − 0.365 a 0.080
Fat mass (%) 0.002 0.993
Body cell mass (kg) − 0.576 0.003
Resistance (Ω) 0.643 < 0.001
Reactance (Ω) 0.476 0.019
Phase angle (°) − 0.231 0.276
Energy balance (kcal) 0.912 < 0.001
Total energy expenditure (kcal) − 0.490 0.015
Boldface indicates significant correlations (p < 0.05). a Spearman’s ρ. All other values are Pearson’s r.
Table 4. Correlation analysis between energy availability and other conceptually relevant study variables after adjustment for underreporting of dietary intake in adolescent artistic gymnasts during the competitive season (n = 24).
r or ρ p
Fat mass (kg) − 0.418 a 0.042
Fat mass (%) − 0.023 0.913
Body cell mass (kg) − 0.659 < 0.001
Resistance (Ω) 0.770 < 0.001
Reactance (Ω) 0.497 0.014
Phase angle (°) − 0.345 0.099
Energy balance (kcal) 0.836 < 0.001
Total energy expenditure (kcal) − 0.571 0.004
Boldface indicates significant correlations (p < 0.05). a Spearman’s ρ. All other values are Pearson’s r.
Table 5. Correlation analysis of phase angle with anthropometric and body composition variables in adolescent artistic gymnasts during the competitive season (n = 30).
r or ρ p
Weight (kg) 0.463 0.010
Body mass index (kg/m2) 0.588 a < 0.001
Fat mass (kg) 0.428 a 0.018
Fat mass (%) 0.351 0.057
Fat-free mass (kg) 0.400 0.029
Fat-free mass (%) − 0.351 0.057
Total body water (L) 0.395 0.031
Total body water (%) − 0.409 0.025
Extracellular water (L) 0.364 0.048
Extracellular water (%) − 0.497 0.005
Intracellular water (L) 0.341 0.065
Intracellular water (%) − 0.230 a 0.221
Body cell mass (kg) 0.340 0.066
Boldface indicates significant correlations (p < 0.05). a Spearman’s ρ. All other values are Pearson’s r.
Disclaimer/Publisher’s Note: The statements, opinions and data contained in all publications are solely those of the individual author(s) and contributor(s) and not of MDPI and/or the editor(s). MDPI and/or the editor(s) disclaim responsibility for any injury to people or property resulting from any ideas, methods, instructions or products referred to in the content.
Copyright: This open access article is published under a Creative Commons CC BY 4.0 license, which permit the free download, distribution, and reuse, provided that the author and preprint are cited in any reuse.
Prerpints.org logo

Preprints.org is a free preprint server supported by MDPI in Basel, Switzerland.

Subscribe

Disclaimer

Terms of Use

Privacy Policy

Privacy Settings

© 2026 MDPI (Basel, Switzerland) unless otherwise stated