Preprint
Article

This version is not peer-reviewed.

Relationship of Body Composition and Somatotype with Physical Activity Level and Nutrition Knowledge in Elite and Non-Elite Orienteering Athletes

A peer-reviewed article of this preprint also exists.

Submitted:

15 January 2025

Posted:

16 January 2025

You are already at the latest version

Abstract

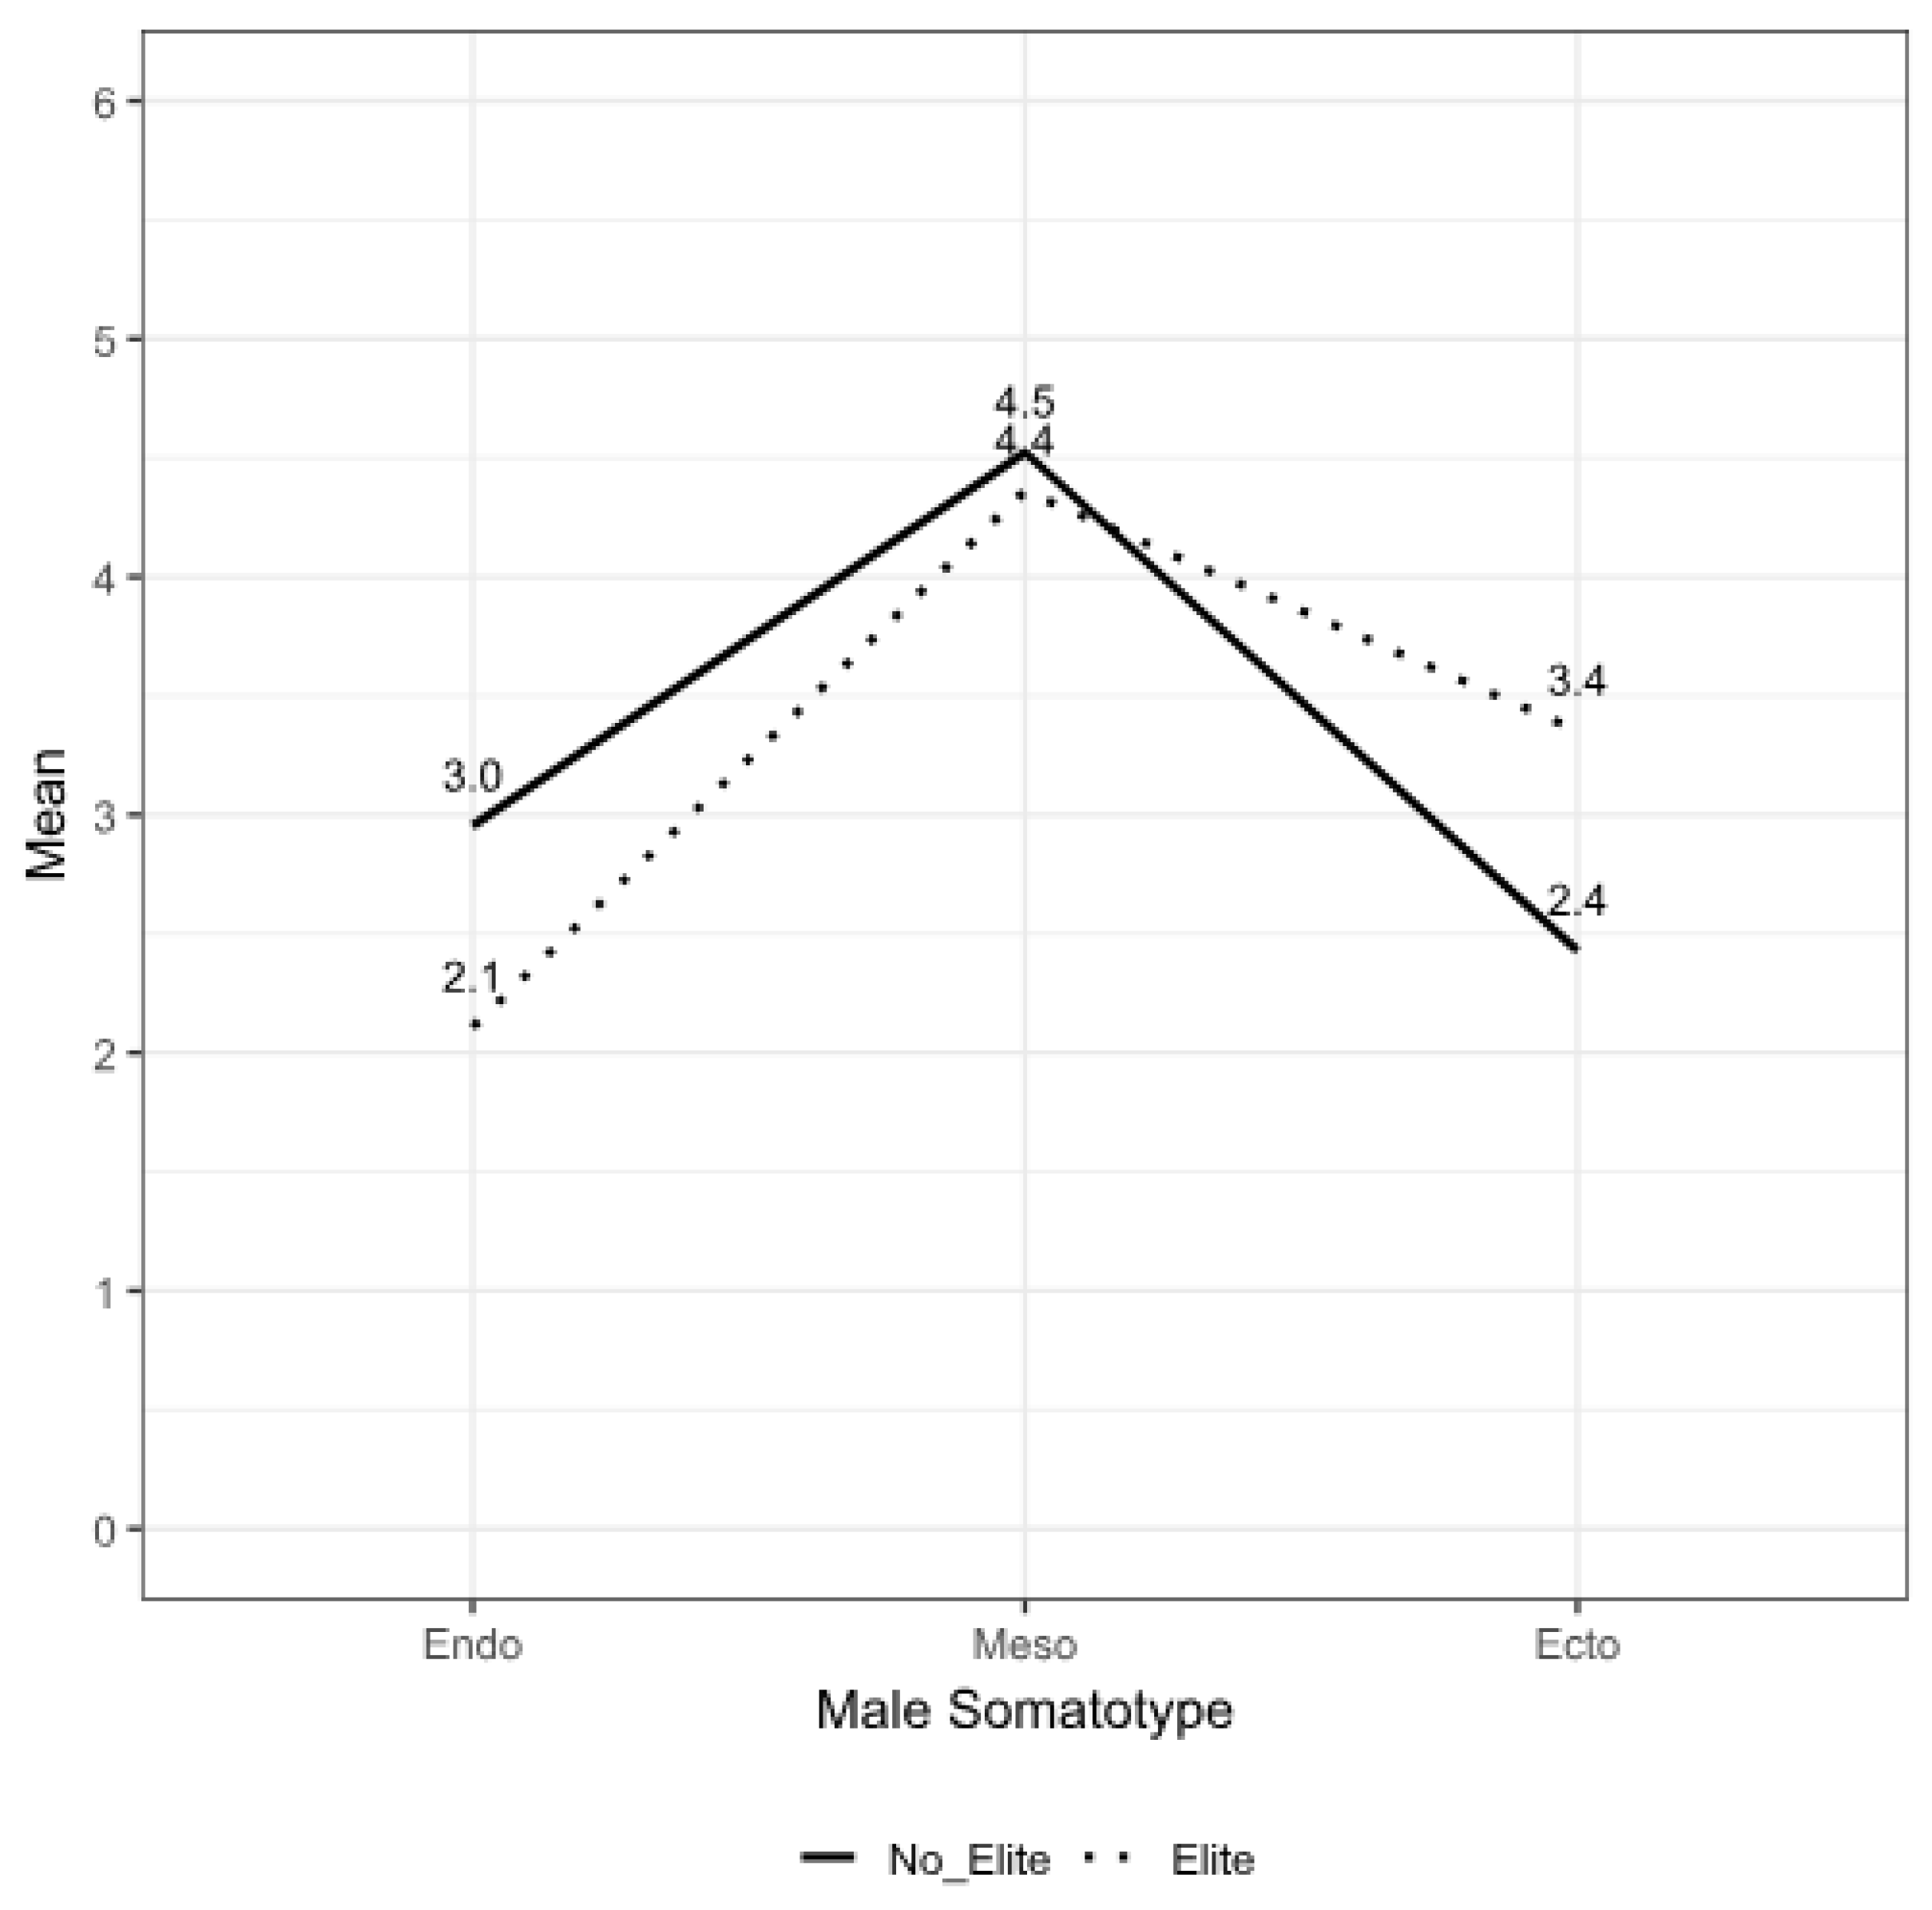
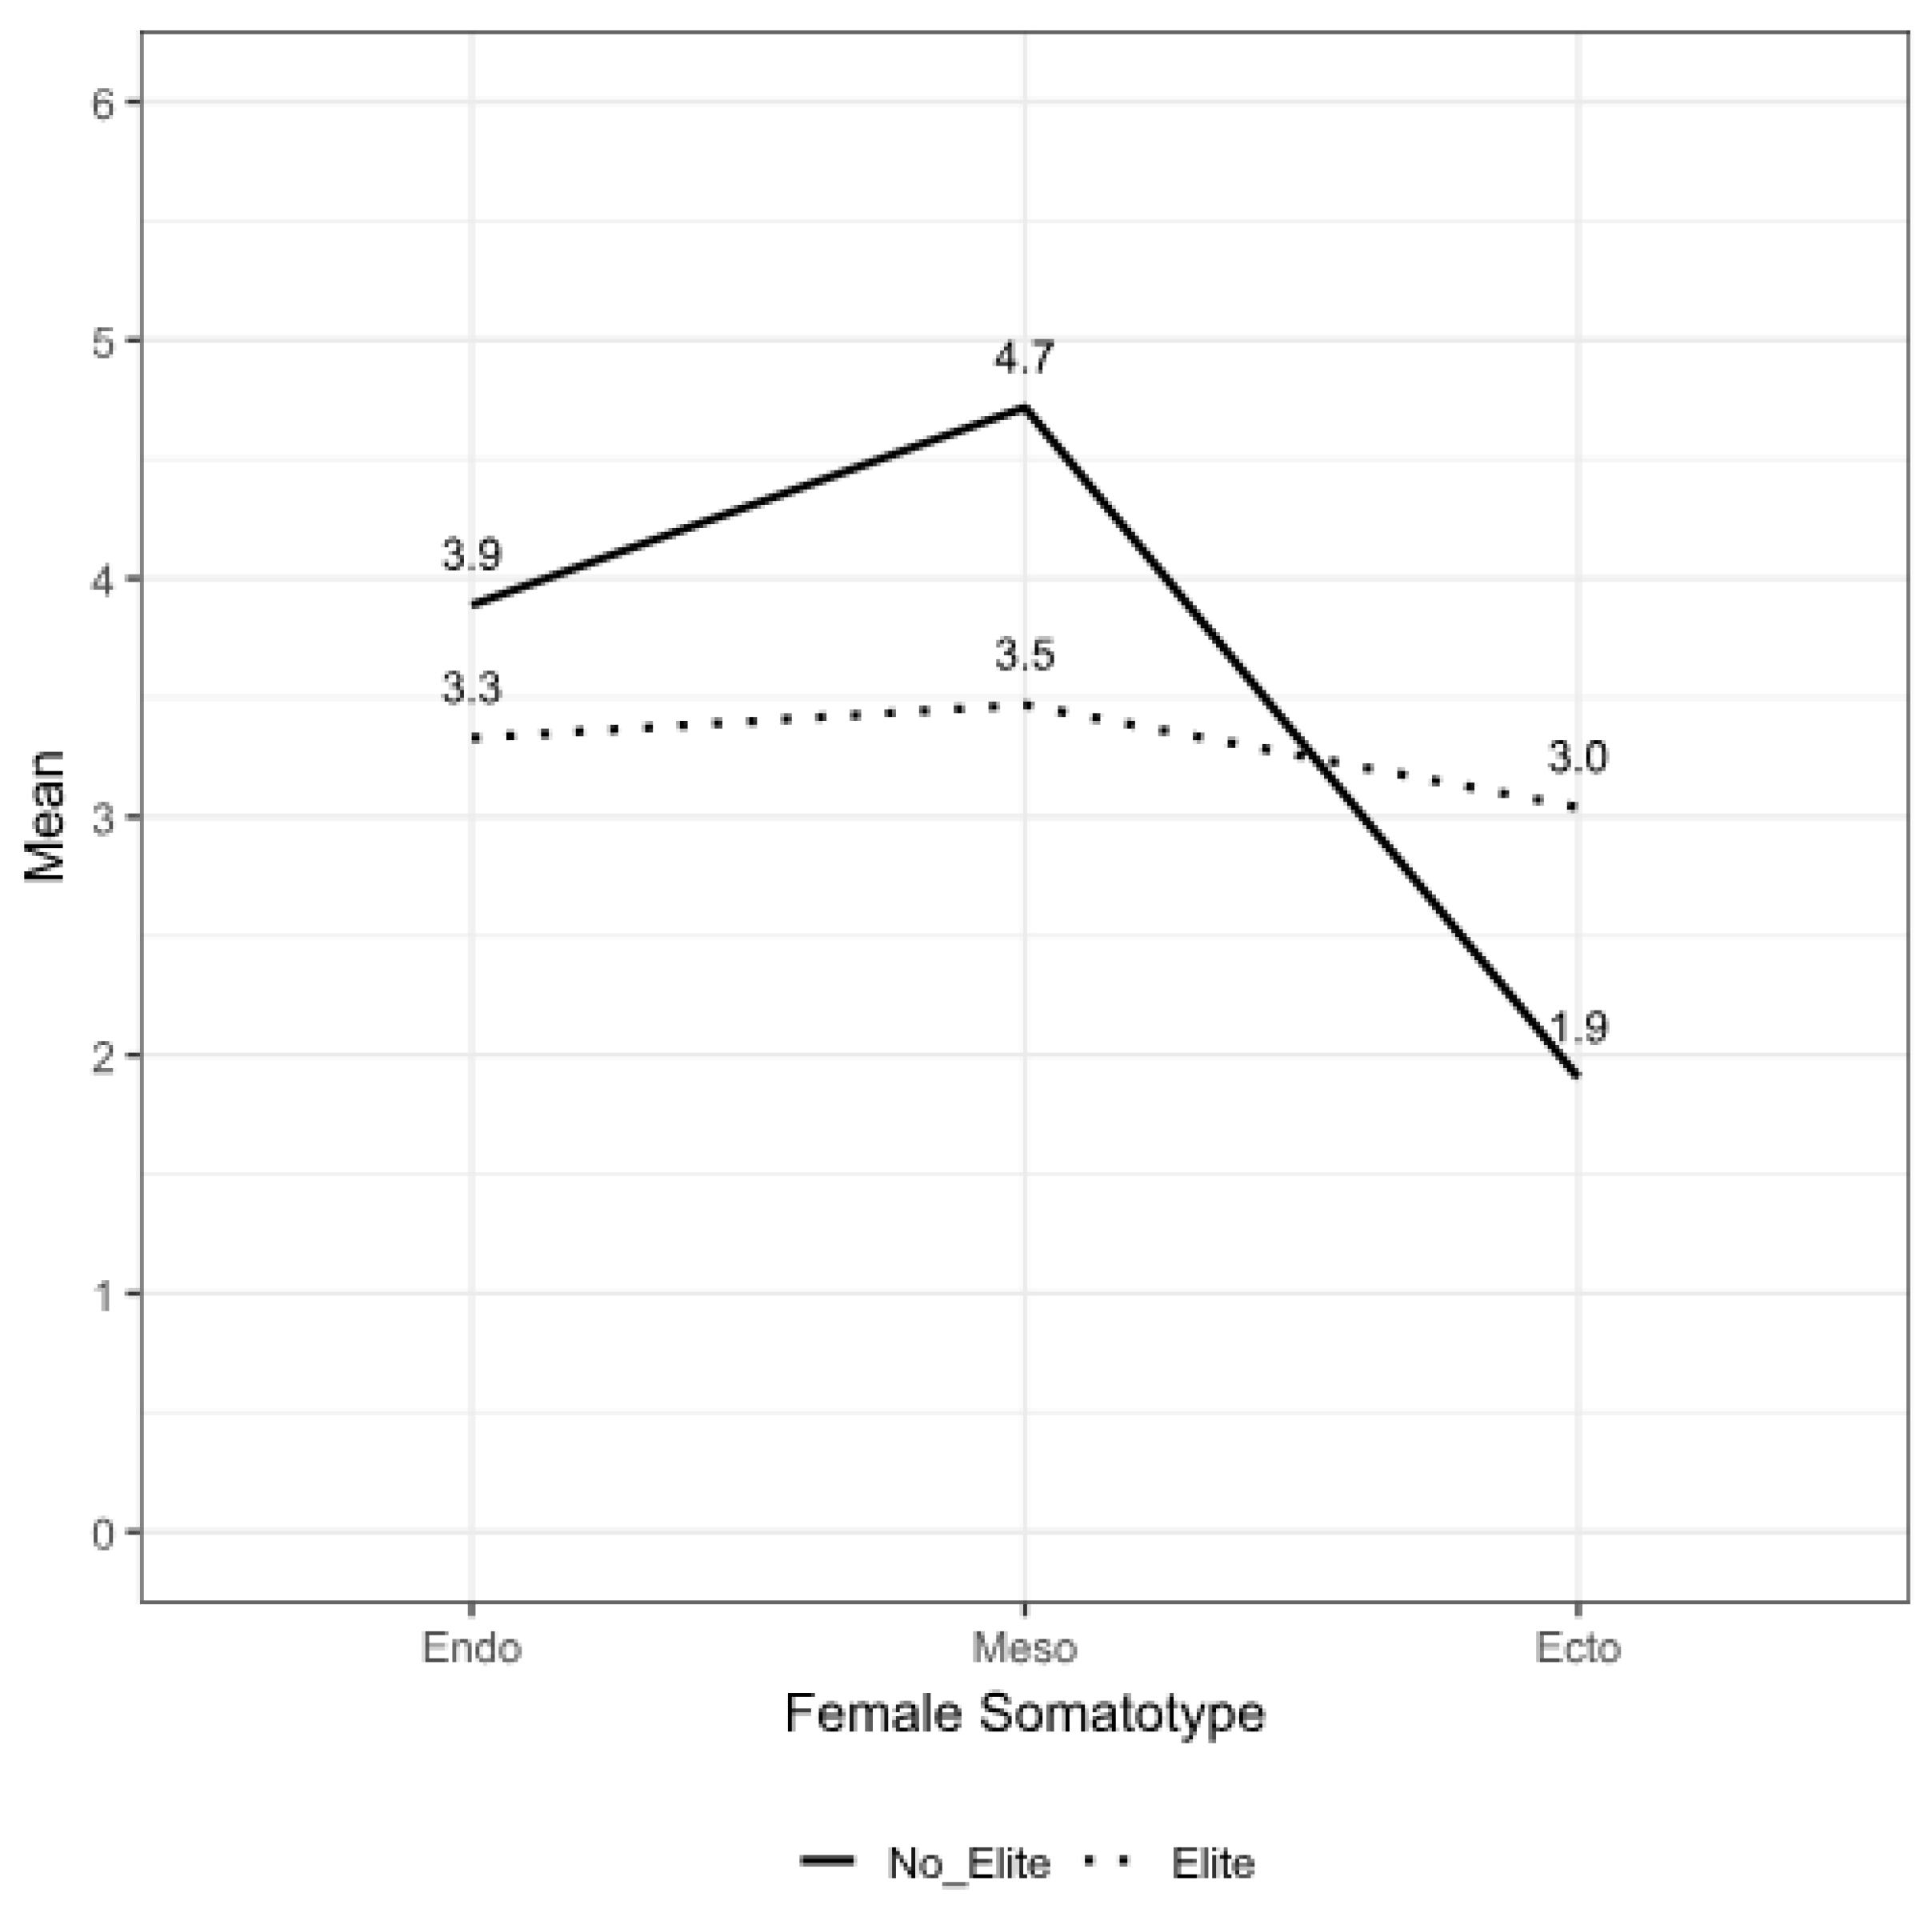
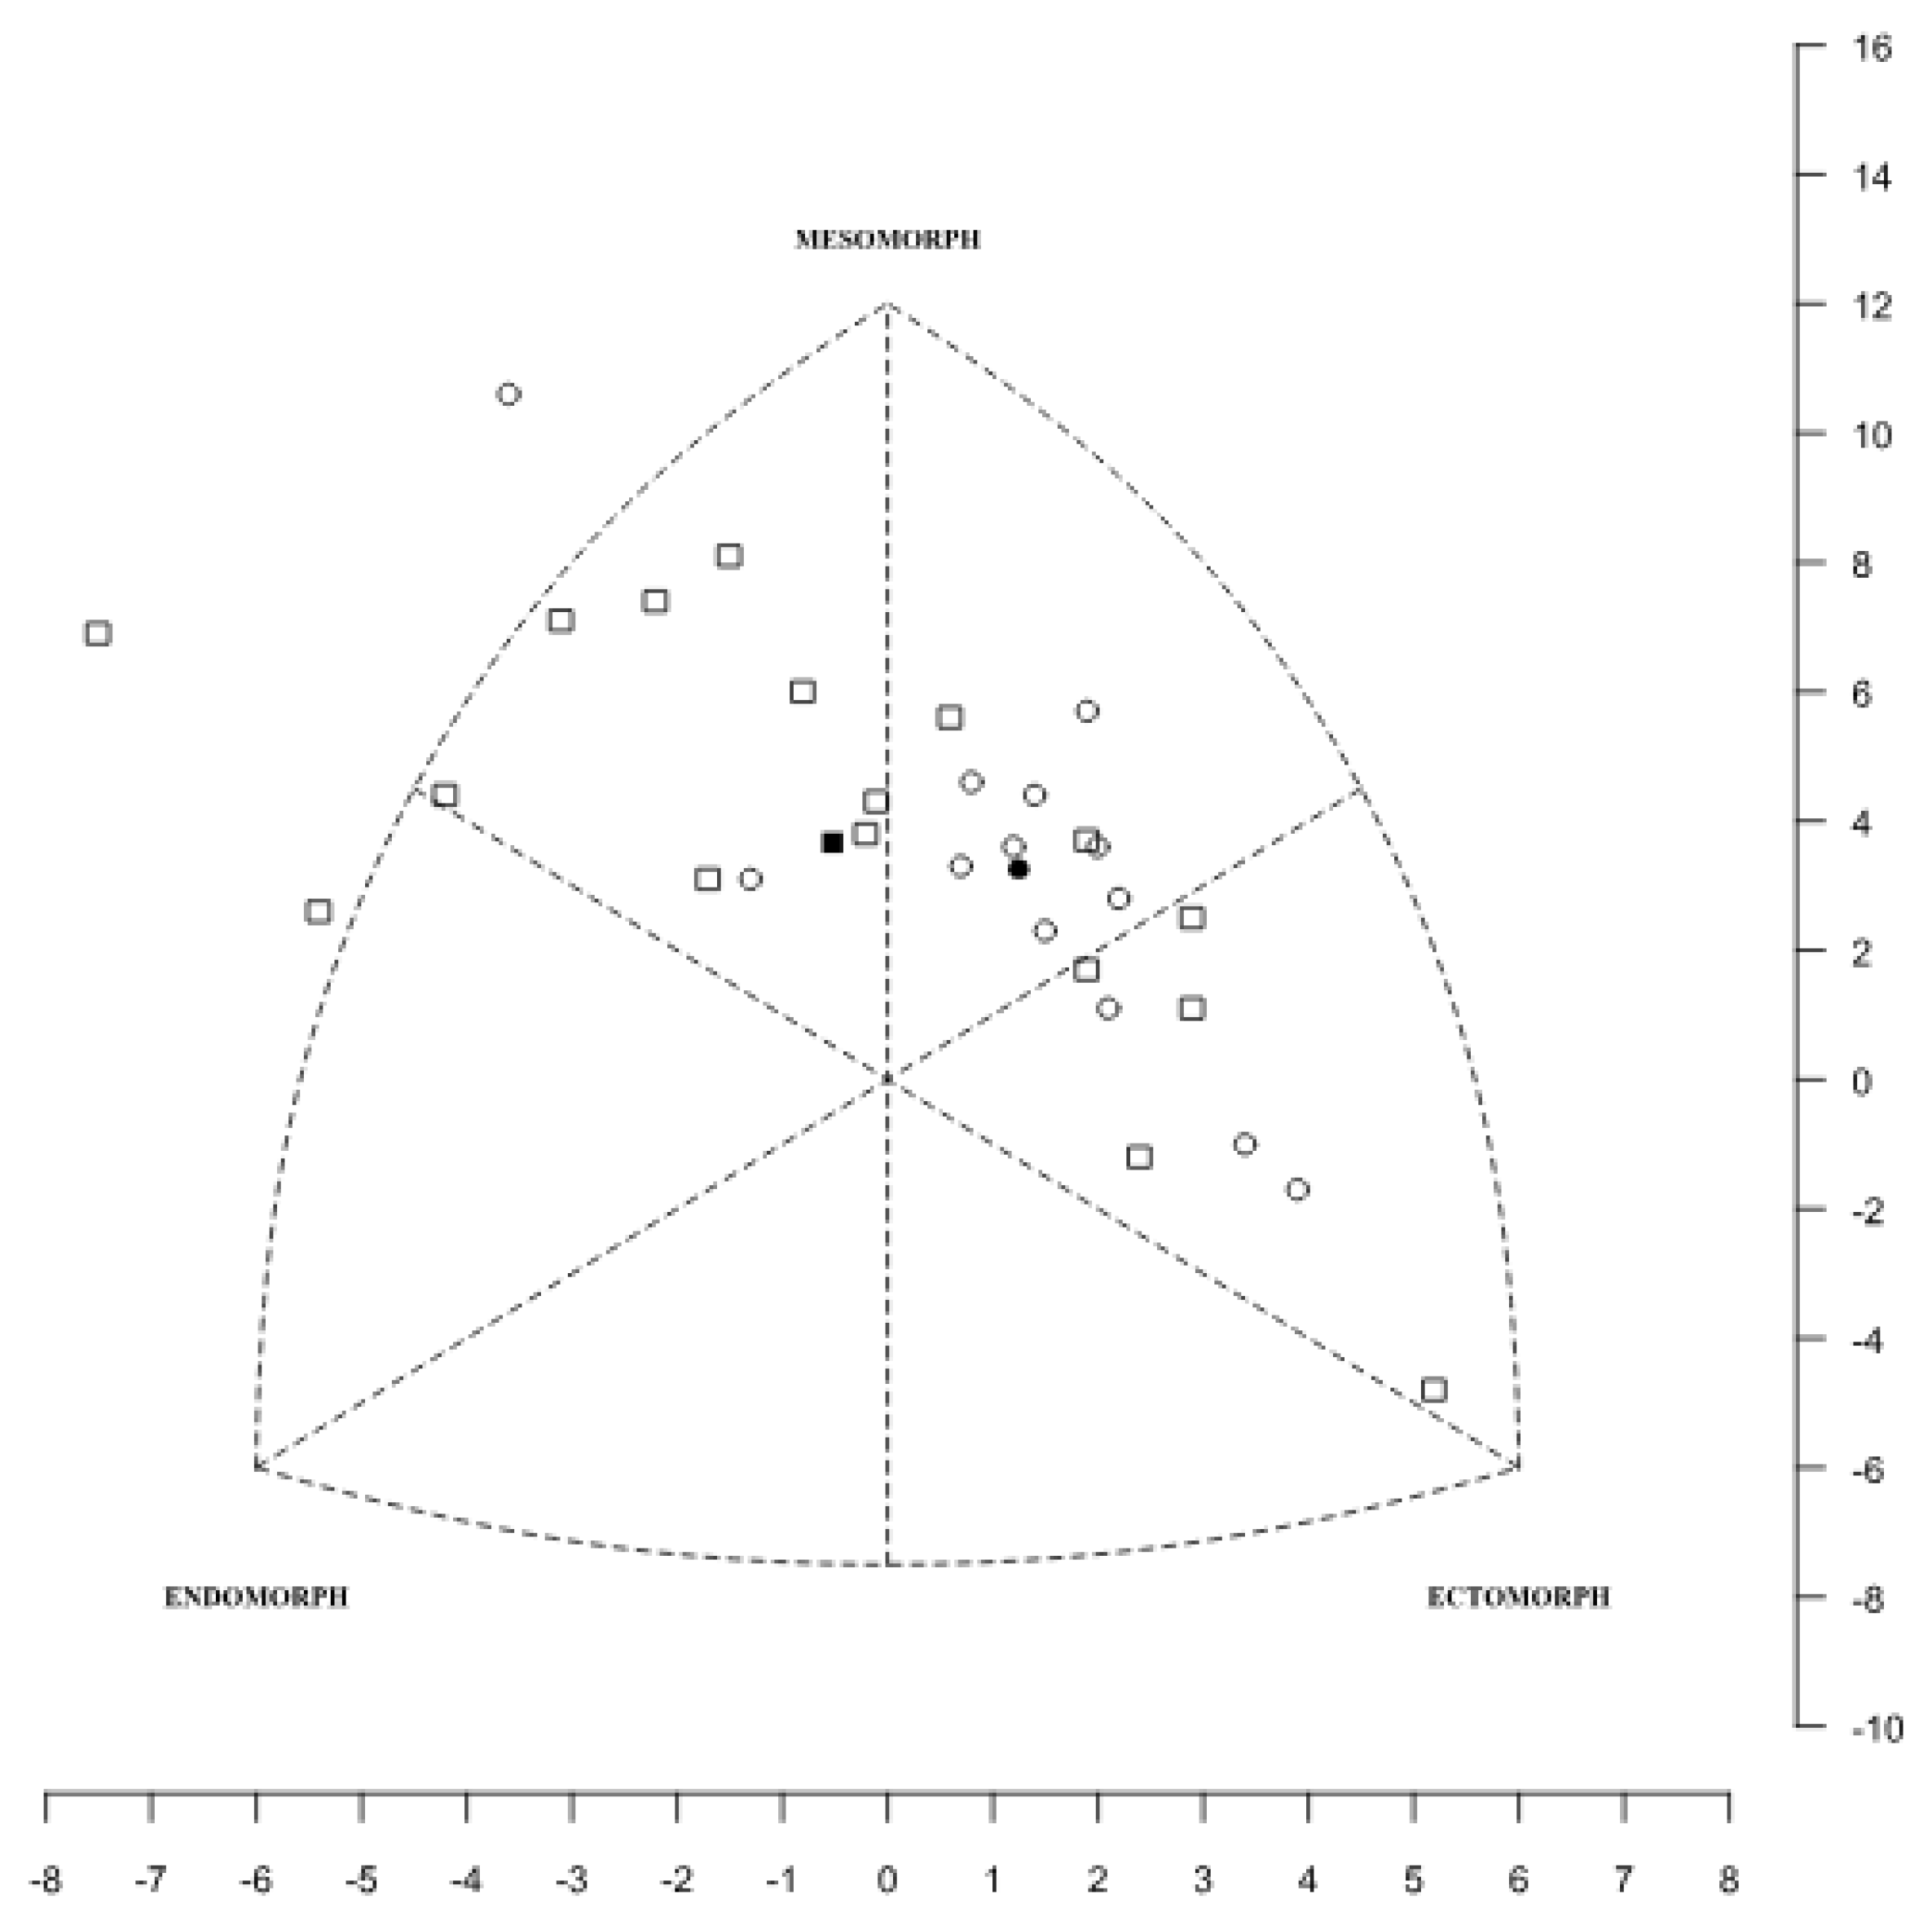
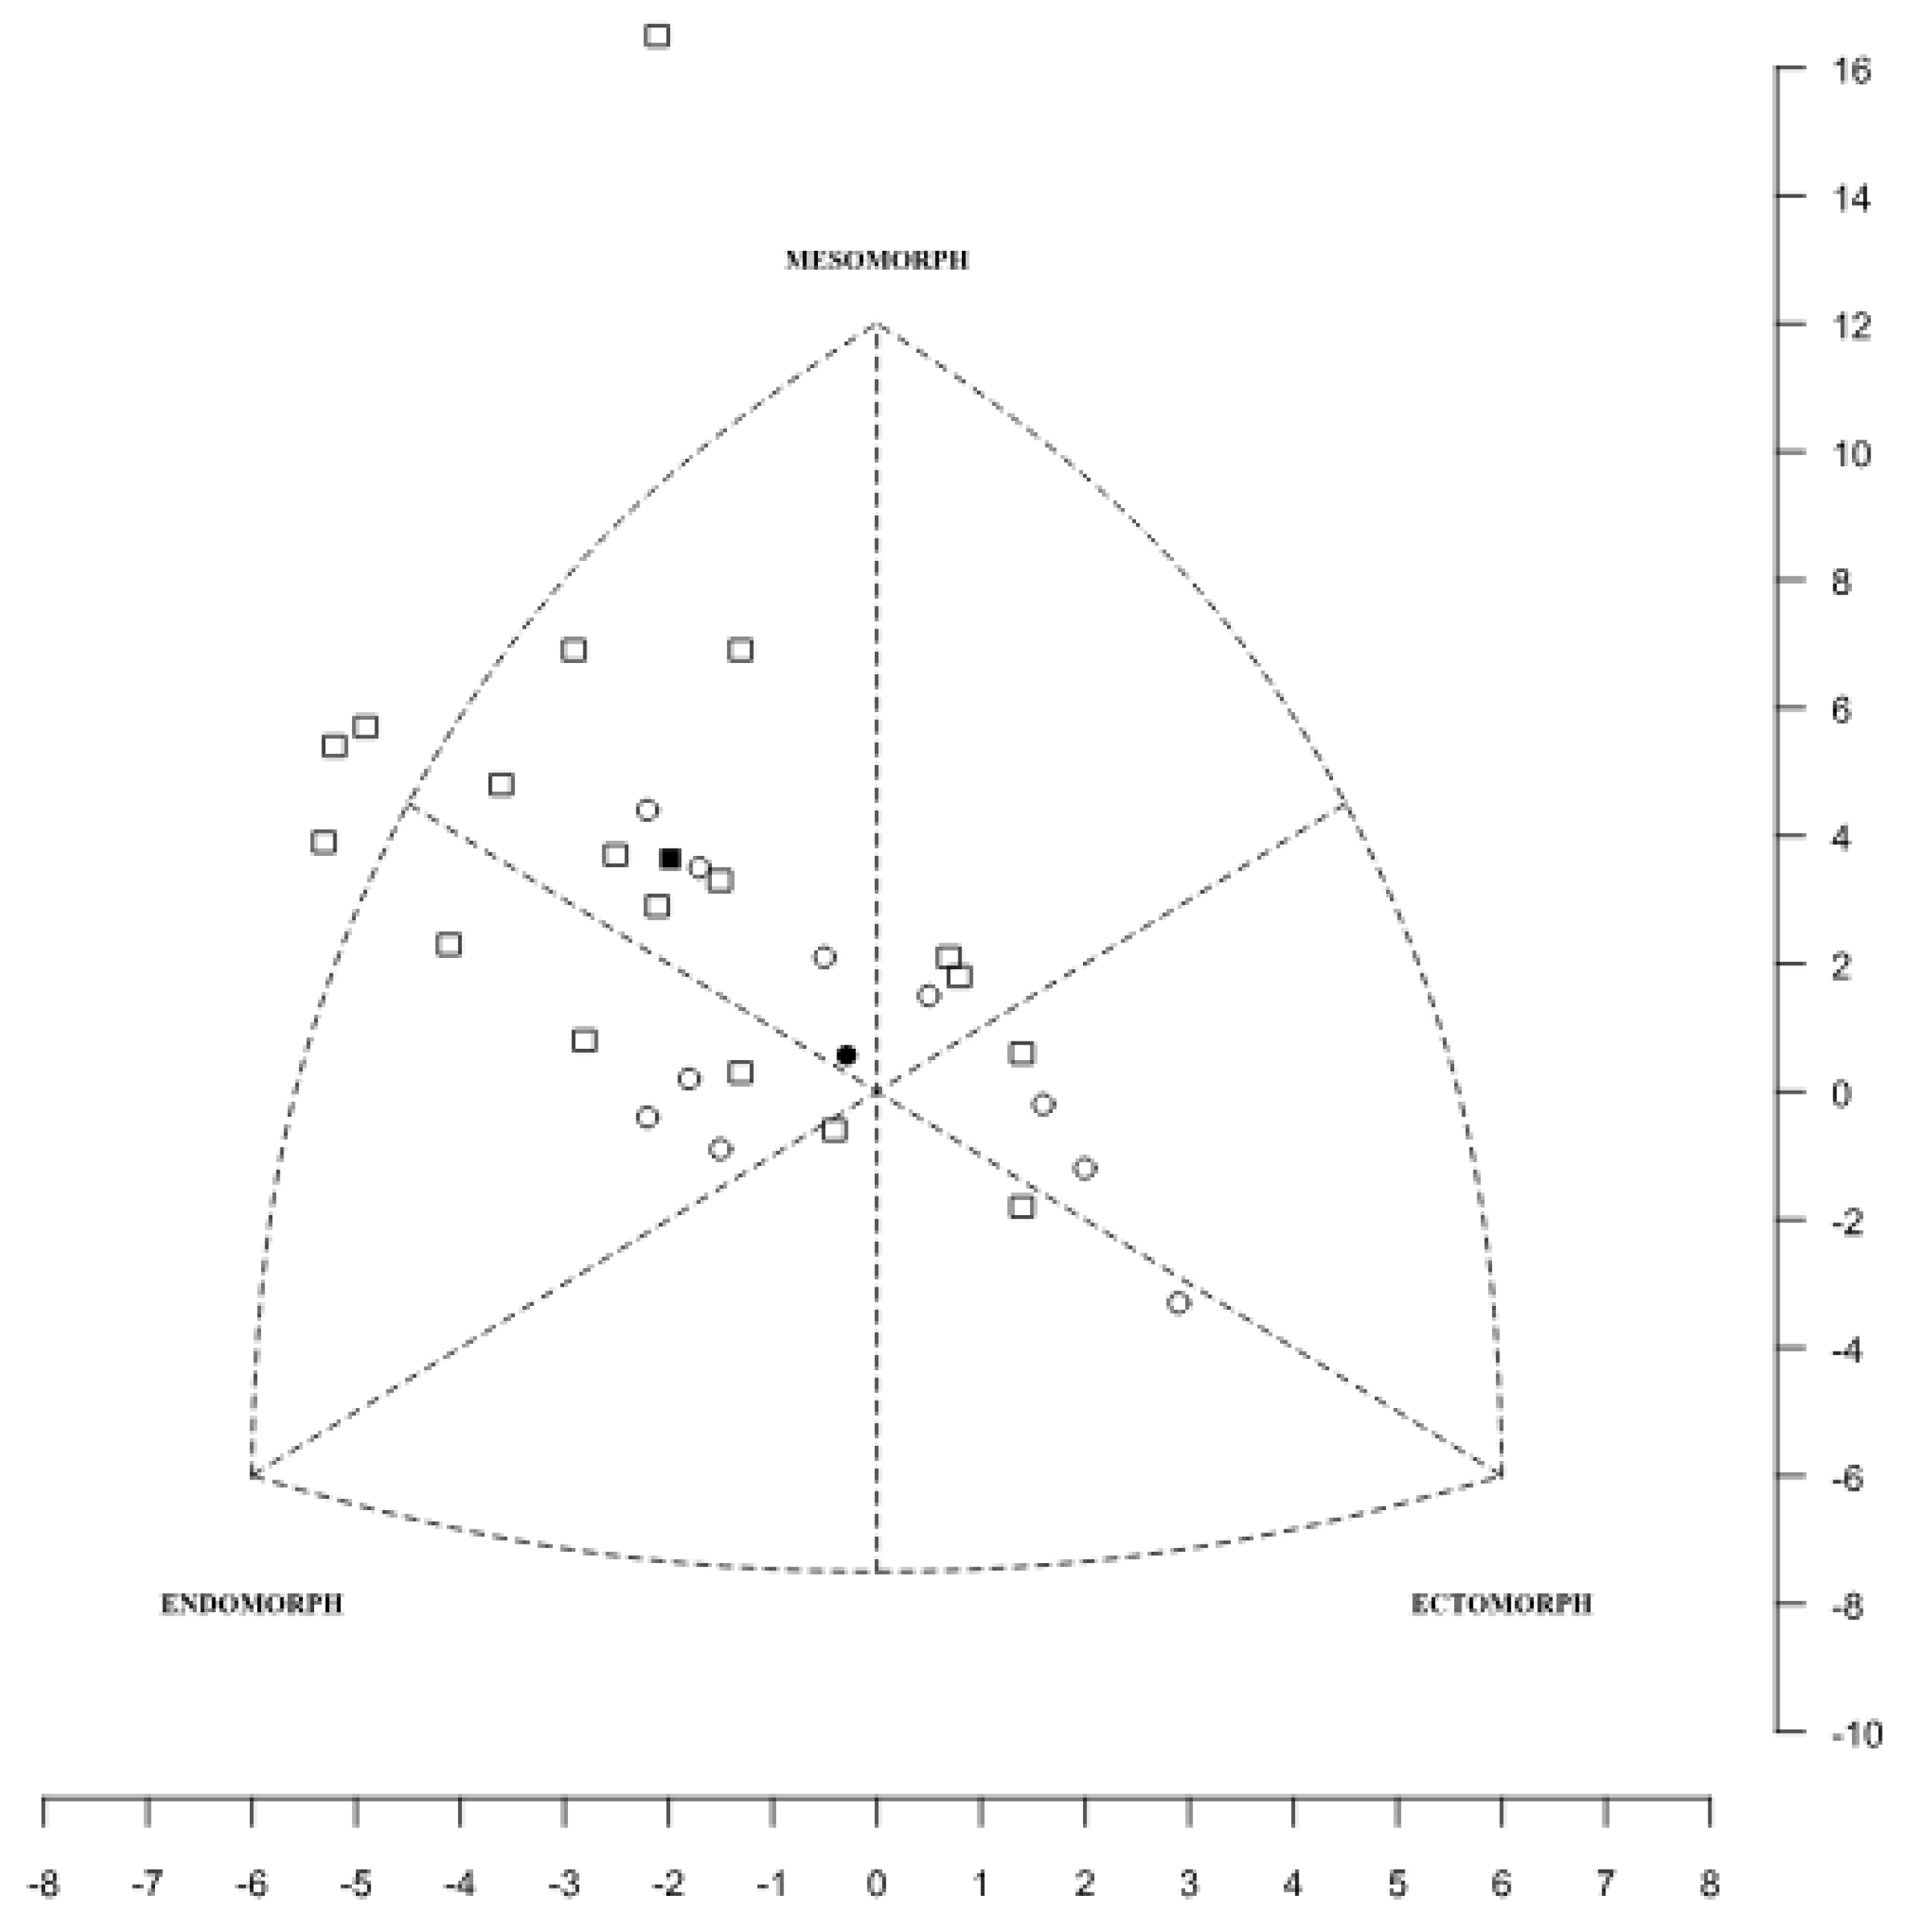
Objectives: This study aimed to identify physique characteristics (anthropometric, somatotype, body composition) of Orienteers and to compare them across with Nutrition Knowledge and Physical Activity Level. Methods: Data was collected from 58 competitive Orienteering athletes, 10 elite female (age = 25.5 ± 6.4 years, body mass = 59.5 ± 7.7 kg, height = 168.1 ± 6.5 cm, BMI = 21.0 ± 1.9 kg/m2) and 13 elite male (age = 24.3 ± 5.0  years, body mass = 65.0 ± 5.5 kg, height = 175.1 ± 6.0 cm, BMI = 21.3 ± 2.2 kg/m2) and 18 non-elite female (age = 41.7 ± 10.3  years, body mass = 60.6 ± 8.5 kg, height = 161.3 ± 11.7 cm, BMI = 23.4 ± 3.7 kg/m2) and 17 non-elite male (age = 37.2 ± 14.6  years, body mass = 71.5 ± 14.2 kg, height = 174.0 ± 8.8 cm, BMI = 23.6 ± 4.1 kg/m2). Nutrition knowledge was evaluated using the updated Abridged Nutrition for Sport Knowledge Questionnaire (A-NSKQ). Physical activity was assessed using the short version of the self-reported International Physical Activity Questionnaire – Short Form (IPAQ-SF). Results: The percentage of body fat (p = .050) in elite male was significantly lower than in non-elite male. Mesomorphy (p = .030) in elite female was significantly lower than in non-elite female, but the ectomorphy (p = .019) was significantly higher. Elite male are ectomorphic mesomorph while non-elite male are balanced mesomorph and elite female are central and non-elite female are endomorphic mesomorph. Significant differences (p = .025) were also observed in the Sports Nutrition Knowledge among elite male and non-elite male, with the former group achieving a higher percentage of correct responses. In the case of Total Nutritional Knowledge, elite Orienteering athletes of both sexes scored significantly higher (elite female: p = .042; elite male: p = .029) than their non-elite counterparts. A significant negative correlation is also observed between body fat and MET-min/week (r = −.39, p = .038), bone mass and MET-min/week (r = −.40, p = .033), endomorphy and Sports Nutrition Knowledge (r = −.38, p = .045) in female Orienteering athletes. Among male Orienteering athletes the most significant findings include a negative correlation between age and MET-min/week (r = −.49, p = .010), kcal/week (r = −.46, p = .016) and Sports Nutrition Knowledge (r = −.40, p = .029). Conclusions: Key findings indicate that elite Orienteers have lower body fat percentages and higher nutrition knowledge scores compared to non-elite Orienteers. These results on the physical characteristics of Orienteering athletes and score of Physical Activity and classification of Nutrition Knowledge can be useful to coaches and sports scientists to improve Orienteer’s performance.

Keywords: 
;  ;  ;  ;  

1. Introduction

Orienteering is described as a cross-country type event, with the rules according of the International Orienteering Federation (IOF) [1], that management four Orienteering disciplines: 1) Foot orienteering (FootO); 2) Mountain Bike or MTB (MTB orienteering); 3) Ski orienteering (SkiO); and 4) Trail orienteering (TrailO).
It is well-documented that Orienteers’ performance predominantly relies on the aerobic component, interspersed with bouts of anaerobic activity [2]. Given these conditions, it is hypothesized that Orienteers experience high energy expenditure and substantial fluid and electrolyte losses during activity. Consequently, an appropriate physical profile and comprehensive nutritional support are essential by performance.
Despite Orienteering’s widespread popularity across 76 countries, including Portugal and Spain, comprehensive studies that could contribute to optimizing the performance of Orienteering athletes (OA) are still limited. This scarcity extends to research involving measurable human body features, which should be standardized according to the guidelines of the International Society for the Advancement of Kinanthropometry (ISAK) [3]. Additionally, there is a lack of studies assessing the physical activity levels (PAL) and nutritional knowledge (NK) of these athletes [4,5,6]. Thus, to the best of our knowledge, no studies have investigated these variables. Addressing this knowledge gap could significantly improve the design of exercising/training and diet programs, as well as facilitate the monitoring of both acute and chronic effects of interventions. These elements are crucial for achieving excellence in Orienteering [7].
The aims of this study were (1) to describe the anthropometric characteristics, body composition (BC), somatotype, NK, and PAL of elite (E) and non-elite (NE) OA and (2) to explore the associations between BC and somatotype according to NK and PAL.

2. Materials and Methods

2.1. Ethical Approval

This project was approved by Ethics Committee of the Faculty of Human Kinetics, University of Lisbon (FMH Code 13/2022) in May 2022. Informed consent was obtained from all participants included in the study. All related procedures were conducted in accordance with the standard of ethics outlined in the Declaration of Helsinki [8].

2.2. Participants

Fifty-eight international-level E and NE OA of seven countries, Angola (n = 1), Brazil (n = 5), Poland (n = 1), Portugal (n = 26), South Africa (n = 1), Spain (n = 22) and Sweden (n = 2), volunteered participate in the current study, 30 males (M) and 28 females (F); age: 41.7 ± 10.3 (NEFOA), 25.5 ± 6.4 (EFOA), 37.2 ± 14.6 (NEMOA), 24.3 ± 5.0 (EMOA) years. Inclusion criteria set for all subjects were being OA with valid license in Portuguese Orienteering Federation (FPO) [9] or Spanish Orienteering Federation (FEDO) [10] or IOF [1], being in the age group 18 to 65 years, without metabolic disease or any disease that could affect body fat, not having taken hormone treatment or corticoids in the three months prior to the anthropometric assessment, except for contraceptives. The sample size (n) was calculated according to the population (N) of 2500 OA of different nationalities, considering the sum of registered participants in official, annual and internationally renowned events in Portugal and Spain. Thus, confidence level of 95% was adopted to the sampling calculation, as well as associated critical value of 1.96 (Z-score), ± 10% error margin and population with homogeneous features (p = 0.8) [11], which show an “n” of 61 subjects. The rankings of the Orienteers, separated by gender, were obtained from the IOF/ World Ranking [1], accessed on 20 February 2023. An OA was classified as “NE” if they were not listed in the aforementioned rankings.

2.3. Variables and Measures

The demographic, NK and PAL data of the Orienteers were collected using an online electronic scheme built on Google Forms© by the researchers. For all Orienteers, data anthropometric were obtained during a single day, between 6:30am-10:00pm, at two competitions 2023: “Portugal "O" Meeting” organized by FPO [9] and “35º Trofeo Internacional Murcia Costa Cálida” organized by FEDO [10] and Federation of Orienteering Sport of the Valencian Community (FEDOCV) [12].

2.4. Nutritional Knowledge Assessment

To assess NK of athletes, especially the concepts domain related to sports nutrition, we used the updated Abridged Nutrition for Sport Knowledge Questionnaire (A-NSKQ) [6]. This instrument was validated for use with athletes of different nationalities, levels of competition and sports [4,5]. The questionnaire is composed of multiple-choice questions with three or four alternative answers and just one correct answer. The questionnaire contains 35 questions, divided into two subsections. The first section contains 11 questions about general nutrition knowledge (GNK); the second section contains 24 questions about sports nutrition (SNK) specifically. Nutritional knowledge scores were expressed as percentages of correct answers obtained by the subjects in each subsection (GNK and SNK) and in the sum of the subsections (total nutritional knowledge - TNK). The level of knowledge was classified as poor (0-49%), average (50-65%), good (66-75%) and excellent (76-100%) [4].

2.5. Physical Activity Assessment

The PA was assessed based on the short version of the self-reported International Physical Activity Questionnaire – Short Form (IPAQ-SF) [13], instrument with validity and re-producibility tested in numerous countries [14], that consists of eight open questions that allow estimating the time spent per week, the last 7 days of the assess, on different PA domains (i.e. walking and physical effort from moderate to vigorous intensity) and physical inactivity (i.e. sitting). Considering that the IPAQ-SF data can also be used to estimate the score expressed as metabolic equivalent (MET), in minutes per week (MET-min/week) [13,15], the total PA score was calculated by multiplying METs recorded for each activity type and the volume observed for each activity type was calculated by weighting its energy requirements: walking, 3.3 METs; moderate activity, 4.0 METs; vigorous activity, 8.0 METs. The sum of products found for each PA type gave origin to the total PA score (walking + moderate PA + vigorous PA = total PA score) [13]. Values lower than 10 minutes of PA (per day) were not included in the calculation; they were re-coded to “zero’, since scientific evidence indicates that PA sessions shorter than 10 minutes do not lead to health benefits [13]. Cases whose total physical activity score exceeded 960 minutes (16 hours per day) were considered outliers; they were excluded from the analysis. Categorical and continuous IPAQ-SF data processing and analysis have followed official guidelines [13]. The PAL were categorized in three levels: 1) “low”, the more lowest, those individuals who not walking for at least 10 minutes or didn’t do moderate PA were considered low/ inactive; 2) “moderate”, any one of the following three criteria: 3 or more days of vigorous activity of at least 20 minutes per day or 5 or more days of moderate-intensity activity or walking of at least 30 minutes per day or 5 or more days of any combination of walking, moderate-intensity or vigorous intensity activities achieving a minimum of at least 600 MET-min/week; and 3) “high”, any one of the following two criteria: vigorous-intensity activity on at least 3 days and accumulating at least 1500 MET-minutes/week or 7 or more days of any combination of walking, moderate-intensity or vigorous intensity activities achieving a minimum of at least 3000 MET-minutes/week [13].

2.6. Anthropometric Measurements

Anthropometric variables of the subjects were measured according to ISAK protocol [3] by Level 3 or 4 ISAK Anthropometrist [16], and adopted hygienic-sanitary care against COVID-19 [17]. Twenty-six anthropometric variables were measured for each subject, namely: four basic measurements - body mass, height, sitting height, arms span; thickness of nine skinfolds - pectoral, according to procedures described by the American College of Sports Medicine (ACSM) [18], triceps, subscapular, biceps, iliac crest, supraspinal, abdominal, thigh and calf; nine girths - neck, relaxed arm, flexed and tensed arm, chest, waist, hips, thigh middle, calf and ankle; and four breadths - humerus, bi-styloid, femur and bimalleolar. Body mass was recorded on a portable scale to the nearest 0.1 kg (model 760, SECA gmbh & co. kg, Hamburg, Germany) and height and sitting height were measured on a stadiometer to the nearest 0.1 cm (model 213, SECA gmbh & co. kg, Hamburg, Germany). Arms span was measured using a measure tape, to the nearest 0.1 cm. Girths measurements were performed using a flexible anthropometric steel tape, to the nearest 0.1 cm (ROSSCRAFT INNOVATIONS, Spokane, USA). Breadths measurements were performed using a small bone caliper, to the nearest 0.1 cm (ROSSCRAFT INNOVATIONS, Spokane, USA), and skinfold thickness was measured using a caliper calibrated to the nearest 0.5 mm (ROSSCRAFT INNOVATIONS, Spokane, USA). To mark the anthropometric reference points was used a segmometer, to the nearest 0.1 cm (CESCORF, Porto Alegre, Brazil), with the aid of dermatograph pencil. Body Mass Index (BMI) was calculated as weight (kg) to height squared (m2) quotient [19]. Body density (BD) was estimated by using specific equations for male [20] and female [21] athletes. BD was transformed into body fat (BF) percentage using equations specific for each sex published by the ACSM [18]. Bone mass (BM) and muscle mass (MM) were determined in kg through the methods by Martin [22] and Lee et al. [23], respectively. The data from the anthropometric assessments were used to calculate the somatotype values, compared to each other, somatotype dispersion mean (SDM), somatotype dispersion distance (SDD), somatotype attitudinal mean (SAM) and somatotype attitudinal distance (SAD), according to the Heath-Carter method [24].
Further details regarding the processes adopted for anthropometric and PA assessment are provided in Silva et al. [25].

2.7. Statistical Analysis

Data collected was inputted into Microsoft Excel (Microsoft Corporation, Redmond, WA, USA). The R programming language (version 4.3.1) [26] was used for all statistical analyses, including the Somatoplot performed. The normality of each variable was assessed using the Kolmogorov–Smirnov normality test and when the data if revealed that was not normally distributed non-parametric analyses were required. A descriptive analysis (mean and standard deviation [SD]) was calculated for all variables unless otherwise stated. T-test or Pearson correlation coefficient (r) tests were used to calculate the relationship between the variables demographics, anthropometrics, BC, somatotype, NK, MET and energy expenditure for PA domains data for each sex. The alpha level for statistical significance was established at p ≤ .05. The chosen statistical tests were appropriate for the data distribution and aimed to identify significant differences and correlations.

3. Results

Participants were 58 subjects, 23 EOA: 10 EFOA (age = 25.5 ± 6.4 yr., body mass = 59.5 ± 7.7 kg, height = 168.1 ± 6.5 cm, BMI = 21.0 ± 1.9 kg/m2) and 13 EMOA (age = 24.3 ± 5.0 yr., body mass = 65.0 ± 5.5 kg, height = 175.1 ± 6.0 cm, BMI = 21.3 ± 2.2 kg/m2), and 35 NEOA: 18 NEFOA (age = 41.7 ± 10.3 yr., body mass = 60.6 ± 8.5 kg, height = 161.3 ± 11.7 cm, BMI = 23.4 ± 3.7 kg/m2) and 17 NEMOA (age = 37.2 ± 14.6 yr., body mass = 71.5 ± 14.2 kg, height = 174.0 ± 8.8 cm, BMI = 23.6 ± 4.1 kg/m2). EOA were significantly younger (p < .01) and had a higher frequency of orienteering training (OTF) (measured in days per week) (EFOA: p = .024; EMOA: p < .01) compared to their NEOA counterparts in both sexes. Regarding the orienteering training quantity (OTQ) (measured in hours per week) only EFOA demonstrated a significantly greater volume (p = .022) than NEFOA. EMOA had a significantly shorter sitting height (p < .01) and lower abdominal skinfold thickness (p = .04) compared to NEMOA. Additionally, the girths of the neck (p = .03), chest (p = .028), and waist (p = .010) were significantly smaller in EMOA than in NEMOA. The waist girth (p = .014) was also significantly smaller in EFOA compared to NEFOA. The percentage of body fat (BF) (p = .050) in EMOA was significantly lower than in NEMOA. Mesomorphy (p = .030) in EFOA was significantly lower than in NEFOA, but the ectomorphy (p = .019) was significantly higher (Table 1; Figure 1 and Figure 2).
All significant comparisons show a large effect size (Cohen’s D), except endomorphy (EFOA x NEFOA) with a small effect size (Cohen’s D = .47), and BF and abdominal skinfold thickness (EMOA x NEMOA) with medium effect size (Cohen’s D = .76 and .79, respectively).
Although the SDM and SAM did not show significant differences, both the SDD (FOA: 4.3; MOA: 3.1) and SAD (FOA: 1.8; MOA: 1.3) exhibited values greater than 3 and 1, respectively. This indicates considerable differences in somatotypes between E and NE, for MOA (Figure 3) and FOA (Figure 4). Thus, EMOA are ectomorphic mesomorph while NEMOA are balanced mesomorph and EFOA are central and NEFOA are endomorphic mesomorph.
Significant differences (p = .025) were also observed in the SNK among EMOA and NEMOA, with the former group achieving a higher percentage of correct responses. In the case of TNK, EOA of both sexes scored significantly higher (EFOA: p = .042; EMOA: p = .029) than their NEOA counterparts.
The Table 2 shows the association of NK with BC, somatotype, MET, and energy expenditure for Orienteers. The most significant findings in FOA include a negative correlation between age and SNK (r = −.40, p = .034) and TNK (%) (r = −.41, p = .030). Furthermore, OTF and OTQ exhibit a positive correlation with MET-min/week, kcal/week, GNK, SNK and TNK, all with a p-value less than 0.05. A significant negative correlation is also observed between BF and MET-min/week (r = −.39, p = .038), BM and MET-min/week (r = −.40, p = .033), endomorphy and SNK (r = −.38, p = .045). Lastly, a positive correlation was observed between GNK and SNK (r = .50, p = .006). Among MOA the most significant findings include a negative correlation between age and MET-min/week (r = −.49, p = .010), kcal/week (r = −.46, p = .016) and SNK (r = −.40, p = .029). Furthermore, OTF and OTQ exhibit a positive correlation with MET-min/week and kcal/week with a p-value less than 0.05. A significant negative correlation is also observed between BF and MET-min/week (r = −.48, p = .011) and kcal/week (r = −.42, p = .029), MM and MET-min/week (r = −.45, p = .020), BMI and MET-min/week (r = −.57, p = .002) and kcal/week (r = −.50, p = .008), endomorphy and MET-min/week (r = −.44, p = .021), mesomorphy and MET-min/week (r = −.47, p = .013) and kcal/week (r = −.45, p = .018). Ectomorphy show positive correlation with MET-min/week (r = .59, p = .001) and kcal/week (r = .54, p = .004). Lastly, a positive correlation was observed between GNK and SNK (r = .55, p = .002).

4. Discussion

This study aimed to identify physique characteristics (anthropometric, somatotype, body composition) of Orienteers with rankings separated by gender and to compare them across with NK and PAL
In sport, nutrition and performance are inextricably linked, and the assessment of NK is an important component of providing support to athletes [27,28]. For instance, Relative Energy Deficiency in Sport (REDs) can be prevented through nutritional intervention in sports nutrition and/ or individual athlete-centered nutrition counseling, with evidence-based information and recommendations [29,30]. Similarly, a recent intervention has been conducted in female endurance athletes [31].
To the best of our knowledge, this is the first study to investigate the NK of Orienteers that presented results similarly to elite and non-elite Australian team sport athletes, playing Australian football, cricket, lawn bowls, soccer, or hockey [32]. Therefore, although athletes may have GK of healthy eating, we understand that they may need specific knowledge of sports nutrition. Thus, we recommend that nutritionists be part of the Orienteering teams, as Orienteers may use non-professional sources of Nutrition, and studies have identified positive effects of nutritional support on NK [33,34].
The data shows that EOA are significantly younger and train more frequently and for longer durations each week than NEOA ones, however, with approximately 500 hours of annual training, OA have injury incidence rates of around 2 injuries/1000 hours of training [35]. This is consistent with findings in other endurance sports, where younger athletes often have the capacity to train more intensively and recover more quickly [2]. A recent systematic review and meta-analysis also found that early specialization in a sport does not necessarily facilitate later athletic excellence, and that participation patterns can differ significantly between junior and senior elite athletes [36].
EMOA tend to have a lower BF percentage than NEOA ones. This is consistent with the demands of Orienteering as an endurance sport, where a leaner BF can contribute to better performance [37]. Similar trends have been observed in other endurance sports such as long-distance running and cycling. Additionally, our results are similar to the findings of a study that aimed to investigate morphological parameters (body mass, height, BMI) of 50 medallists at the World Masters Orienteering Championships (WMOC) 2022 [38].
Somatotype data indicate that EFOA have a more ectomorphic (lean) and less mesomorphic (muscular) somatotype than NEOA. This could be related to the nature of the sport, which involves navigating a variety of terrain and therefore may favour a lighter body type [37]. Conversely, sports such as weightlifting or rugby may favour a more mesomorphic somatotype.
The characteristics of successful Orienteers reflect the multifaceted demands of the sport, which combines physical endurance, navigational skills, and strategic decision-making. These demands differentiate Orienteering from many other sports, and further research could provide more insights into the optimal training strategies, physiological profiles, and nutritional needs for OA.
These results can be useful for health and sports performance professionals working with Orienteers and can help inform nutritional intervention strategies. However, more research is needed to further explore these relationships and to develop effective evidence-based interventions. These findings are consistent with previous studies that have demonstrated the importance of NK in sports performance [39,40,41]. Moreover, these results underscore the need for greater nutritional education and support for athletes, especially in endurance sports where nutrition can have a significant impact on performance [42,43].

5. Conclusions

Extensive material has been collected from 58 competitive Orienteering athletes of different nationalities. A questionnaire online was used to collect the demographic, physical activity level and nutrition knowledge data of the Orienteers and the study is its cross-sectional nature.
Diet quality scores or indices may therefore be a useful tool for investigating the relationship between nutrition knowledge and dietary intake. The specific influence of nutrition knowledge on dietary intake is an important research question. This study contributes to the understanding of the physical and nutritional profiles of Orienteers, providing valuable insights for coaches and sports scientists. Future research should explore the longitudinal effects of targeted nutritional interventions on Orienteering performance.

Author Contributions

Conceptualization, V.S.S. and F.V.; methodology, V.S.S. and F.V.; software, I.S.; validation, H.E.I., E.D.R. and D.A.S.S; formal analysis, I.S. and V.S.S.; investigation, V.S.S., F.V., H.E.I. and E.D.R.; resources, V.S.S.; data curation, V.S.S.; writing—original draft preparation, V.S.S. and I.S.; writing—review and editing, V.S.S., I.S., D.A.S.S., H.E.I. and E.D.R.; visualization, F.V.; supervision, F.V.; project administration, V.S.S., F.V. and E.D.R. All authors have read and agreed to the published version of the manuscript.

Funding

This research received no external funding.

Institutional Review Board Statement

The study was conducted in accordance with the Declaration of Helsinki, and approved by the Ethics Committee of the Faculty of Human Kinetics, University of Lisbon (protocol code 13/2022, approval date: 11 May 2022).

Informed Consent Statement

Informed consent was obtained from all subjects involved in the study.

Data Availability Statement

All data generated or analyzed during this study are available from the corresponding author on reasonable request. The data are not publicly available due to ethical reasons.

Acknowledgments

To all the Orienteering athletes who volunteered in the study and especially to Portuguese Orienteering Federation and Spanish Orienteering Federation/ Federation of Orienteering Sport of the Valencian Community for all collaboration in the study.

Conflicts of Interest

The authors declare no conflicts of interest.

Abbreviations

The following abbreviations are used in this manuscript:
ACSM American College of Sports Medicine
A-NSKQ Abridged Nutrition for Sport Knowledge Questionnaire
BF Body Fat
BC Body Composition
BD Body Density
BM Bone Mass
BMI Body Mass Index
E Elite
EFOA Elite Female Orienteering Athletes
EMOA Elite Male Orienteering Athletes
F Female
FEDO Spanish Orienteering Federation
FPO Portuguese Orienteering Federation
FOA Female Orienteering Athletes
GNK General Nutrition Knowledge
IOF International Orienteering Federation
IPAQ-SF International Physical Activity Questionnaire – Short Form
ISAK International Society for the Advancement of Kinanthropometry
M Male
MET Metabolic Equivalent
MM Muscle Mass
MOA Male Orienteering Athletes
NE Non-Elite
NEFOA Non-Elite Female Orienteering Athletes
NEMOA Non-Elite Male Orienteering Athletes
NK Nutrition Knowledge
OA Orienteering Athletes
OP Orienteering Practice
OTF Orienteering Training Frequency
OTQ Orienteering Training Quantity
PAL Physical Activity Level
REDs Relative Energy Deficiency in Sport
SAM Somatotype Attitudinal Mean
SAD Somatotype Attitudinal Distance
SD Standard Deviation
SDD Somatotype Dispersion Distance
SDM Somatotype Dispersion Mean
SNK Sports Nutrition Knowledge
ST Skinfold Thickness
TNK Total Nutritional Knowledge

References

  1. International Orienteering Federation (IOF). International Orienteering Federation Home Page. Available online: https://orienteering.sport/ (accessed on 12 January 2025).
  2. Batista, M.M.; Paludo, A.C.; Gula, J.N.; Pauli, P.H.; Tartaruga, M.P. Physiological and cognitive demands of orienteering: a systematic review. Sport Sci. Health 2020, 16, 591–600. [Google Scholar] [CrossRef]
  3. Esparza-Ros, F.; Vaquero-Cristóbal, R.; Marfell-Jones, M. Protocolo Internacional para la Valoración Antropométrica. Perfil Completo. Sociedad Internacional para el Avance de la Cineantropometría: Murcia, España, 2019.
  4. Trakman, G.L.; Forsyth, A.; Hoye, R.; Belski, R. The nutrition for sport knowledge questionnaire (NSKQ): development and validation using classical test theory and Rasch analysis. J. Int, Soc, Sports Nutr. 2017, 14. [Google Scholar] [CrossRef] [PubMed]
  5. Trakman, G.L.; Forsyth, A.; Hoye, R.; Belski, R. Development and validation of a brief general and sports nutrition knowledge questionnaire and assessment of athletes’ nutrition knowledge. J. Int, Soc, Sports Nutr. 2018, 15. [Google Scholar] [CrossRef] [PubMed]
  6. Trakman, G.L.; Brown, F.; Forsyth, A.; Belski, R. Modifications to the nutrition for sport knowledge questionnaire (NSQK) and abridged nutrition for sport knowledge questionnaire (ANSKQ). J. Int, Soc, Sports Nutr. 2019, 16. [Google Scholar] [CrossRef]
  7. Celestino, T.F.S.; Leitão, J.C.G.C.; Pereira, A.M.A. Determinantes para a excelência na Orientação: as representações de treinadores e atletas de elite (Determinants for excellence in Orienteering: the representation of elite coaches and athletes) (Determinantes para la excelencia en la orientación: las representaciones de entrenadores y atletas de elite). Retos 2019, 35, 91–96. [Google Scholar] [CrossRef]
  8. World Medical Association. World Medical Association Declaration of Helsinki: ethical principles for medical research involving human subjects. JAMA, 2013, 310, 2191–2194. [Google Scholar] [CrossRef]
  9. Federação Portuguesa de Orientação (FPO). Federação Portuguesa de Orientação Home Page. Available online: https://www.fpo.pt/ (accessed on 12 January 2025).
  10. Federación Española de Orientación (FEDO). Federación Española de Orientación Home Page. Available online: https://www.fedo.org/web/ (accessed on 12 January 2025).
  11. Levine, D.M.; Stephan, D.F.; Szabat, K.A. Estatística: Teoria e Aplicações Usando o Microsoft Excel® em Português, 7th ed.; LTC: Rio de Janeiro, Brasil, 2016. [Google Scholar]
  12. Federación del Deporte de Orientación de la Comunidad Valenciana (FEDOCV). Federación del Deporte de Orientación de la Comunidad Valenciana Home Page. Available online: https://www.fedocv.org/ (accessed on 12 January 2025).
  13. International Physical Activity Questionnaire (IPAQ). IPAQ - International Physical Activity Questionnaire Home Page. Available online: https://sites.google.com/view/ipaq/home (accessed on 12 January 2025).
  14. Sember, V.; Meh, K.; Sorić, M.; Starc, G.; Rocha, P.; Jurak, G. Validity and reliability of International Physical Activity Questionnaires for adults across EU countries: systematic review and meta analysis. Int. J. Environ. Res. Public Health 2020, 17, 7161. [Google Scholar] [CrossRef]
  15. Ainsworth, B.E.; Haskell, W.L.; Whitt, M.C.; Irwin, M.L.; Swartz, A.M.; Strath, S.J.; O'Brien, W.L.; Bassett, D.R., Jr.; Schmitz, K.H.; Emplaincourt, P.O.; et al. Compendium of physical activities: an update of activity codes and MET intensities. Med. Sci. Sports Exerc. 2000, 32, S498–S516. [Google Scholar] [CrossRef]
  16. Silva, V.S.; Vieira, M.F.S. International Society for the Advancement of Kinanthropometry (ISAK) Global: international accreditation scheme of the competent anthropometrist. Rev. Bras. Cineantropom. Desempenho Hum. 2020, 22, e70517. [Google Scholar] [CrossRef]
  17. Silva, V.S.; Souza, I.; Sehl, P.L. Good hygienic-sanitary practices in anthropometric routine in the (post-) COVID-19 pandemic. Rev. Bras. Cineantropom. Desempenho Hum. 2021, 23, e77625. [Google Scholar] [CrossRef]
  18. Liguori, G.; Feito, Y.; Fountaine, C.; Roy, B.A. Diretrizes do ACSM para os Testes de Esforço e sua Prescrição, 11th ed.; Guanabara Koogan: Rio de Janeiro, Brasil, 2023; pp. 74–78. [Google Scholar]
  19. Quetelet, L.A.J. Anthropométrie ou Measure des Différentes Facultés de l’Homme. C. Muquardt: Brussels, Belgium, 1870.
  20. Withers, R.T.; Craig, N.P.; Bourdon, P.C.; Norton, K.I. Relative body fat and anthropometric prediction of body density of male athletes. Eur. J. Appl. Physiol. Occup. Physiol. 1987, 56, 191–200. [Google Scholar] [CrossRef] [PubMed]
  21. Withers, R.T.; Whittingham, N. O.; Norton, K.I.; La Forgia, J.; Ellis, M.W.; Crockett, A. Relative body fat and anthropometric prediction of body density of female athletes. Eur. J. Appl. Physiol. Occup. Physiol. 1987, 56, 169–180. [Google Scholar] [CrossRef] [PubMed]
  22. Martin, A.D. Anthropometric Assessment of Bone Mineral. In Anthropometric Assessment of Nutritional Status; Himes, J.H., Ed.; Wiley-Liss: New York, NY, USA, 1991; pp. 185–96. [Google Scholar]
  23. Lee, R.C.; Wang, Z.; Heo, M.; Ross, R.; Janssen, I.; Heymsfield, S.B. Total-body skeletal muscle mass: development and cross-validation of anthropometric prediction models. Am. J. Clin. Nutr. 2000, 72, 796–803. [Google Scholar] [CrossRef] [PubMed]
  24. Carter, J.E.L.; Heath, B.H. Somatotyping: Development and Applications. Cambridge University Press: Cambridge, UK, 1990; pp. 73–123.
  25. Silva, V.S.; Souza, I.; Rieger, E.D.; Ibáñez, H.E.; Vieira, F. Anthropometric characteristics and physical activity level of Orienteers: a pilot study. Rev. Bras. Cineantropom. Desempenho Hum. 2023, 25, e95102. [Google Scholar] [CrossRef]
  26. R Core Team, version 4.3.1; The R Project for Statistical Computing. R Foundation for Statistical Computing: Vienna, Austria, 2023. Available online: https://www.r-project.org/ (accessed on 16 June 2023).
  27. Tam, R.; Gifford, J.A.; Beck, K.L. Recent developments in the assessment of nutrition knowledge in athletes. Curr. Nutr. Rep. 2022, 11, 241–252. [Google Scholar] [CrossRef]
  28. Thomas, D.T.; Erdman, K.A.; Burke, L.M. Position of the Academy of Nutrition and Dietetics, Dietitians of Canada, and the American College of Sports Medicine: Nutrition and Athletic Performance. J. Acad. Nutr. Diet. 2016, 116, 501–528. [Google Scholar] [CrossRef]
  29. Mountjoy, M.; Sundgot-Borgen, J.K.; Burke, L.M.; Ackerman, K.E.; Blauwet, C.; Constantini, N.; Lebrun, C.; Lundy, B.; Melin, A.K.; Meyer, N.L.; et al. IOC consensus statement on relative energy deficiency in sport (RED-S): 2018 update. Br. J. Sports Med. 2018, 52, 687–697. [Google Scholar] [CrossRef]
  30. Thomas, D.T.; Erdman, K.A.; Burke, L.M. American College of Sports Medicine Joint Position Statement. Nutrition and Athletic Performance. Med. Sci. Sports Exerc. 2016, 48, 543–568. [Google Scholar] [CrossRef]
  31. Fahrenholtz, I.L.; Melin, A.K.; Garthe, I.; Hollekim-Strand, S.M.; Ivarsson, A.; Koehler, K.; Logue, D.; Lundström, P.; Madigan, S.; Wasserfurth, P.; et al. Effects of a 16-week digital intervention on sports nutrition knowledge and behavior in female endurance athletes with risk of relative energy deficiency in sport (REDs). Nutrients 2023, 15, 1082. [Google Scholar] [CrossRef]
  32. Trakman, G.L.; Forsyth, A.; Hoye, R.; Belski, R. Australian team sports athletes prefer dietitians, the internet and nutritionists for sports nutrition information. Nutr. Diet. 2019, 76, 428–437. [Google Scholar] [CrossRef]
  33. Valliant, M.W.; Emplaincourt, H.P.; Wenzel, R.K.; Garner, B.H. Nutrition education by a registered dietitian improves dietary intake and nutrition knowledge of a NCAA female volleyball team. Nutrients, 2012, 4, 506–516. [Google Scholar] [CrossRef] [PubMed]
  34. Spronk, I.; Heaney, S.E.; Prvan, T.; O'Connor, H.T. Relationship between general nutrition knowledge and dietary quality in elite athletes. Int. J. Sport Nutr. Exerc. Metab. 2015, 25, 243–251. [Google Scholar] [CrossRef] [PubMed]
  35. Oyola, F.A.R.; Sánchez, S.G.; Devia, C.P.; Saborido, F.O.; Jurado, J.A.G. Lesiones en trail running, cross-country y Orientación: una revisión sistemática (Trail running, cross-country and Orienteering injuries: a systematic review). Retos 2024, 52, 600–609. [Google Scholar] [CrossRef]
  36. Barth, M.; Güllich, A.; Macnamara, B.N.; Hambrick, D.Z. Predictors of junior versus senior elite performance are opposite: a systematic review and meta-analysis of participation patterns. Sports Med. 2022, 52, 1399–1416. [Google Scholar] [CrossRef]
  37. Creagh, U.; Reilly, T. Physiological and biomechanical aspects of orienteering. Sports Med. 1997, 24, 409–418. [Google Scholar] [CrossRef]
  38. Cych, P.; Machowska-Krupa, W. Characteristics of the medallists of the World Masters Orienteering Championships. Appl. Sci. (Basel) 2024, 14, 10039. [Google Scholar] [CrossRef]
  39. Couture, S.; Lamarche, B.; Morissette, E.; Provencher, V.; Valois, P.; Goulet, C.; Drapeau, V. Evaluation of sports nutrition knowledge and recommendations among high school coaches. Int. J. Sport Nutr. Exerc. Metab. 2015, 25, 326–334. [Google Scholar] [CrossRef]
  40. Heaney, S.; O'Connor, H.; Michael, S.; Gifford, J.; Naughton, G. Nutrition knowledge in athletes: a systematic review. Int. J. Sport Nutr. Exerc. Metab. 2011, 21, 248–261. [Google Scholar] [CrossRef]
  41. Tapsell, L.C.; Neale, E.P.; Satija, A.; Hu, F.B. Foods, nutrients, and dietary patterns: interconnections and implications for dietary guidelines. Adv. Nutr. 2016, 7, 445–454. [Google Scholar] [CrossRef]
  42. Burke, L.M.; Hawley, J.A.; Wong, S.H.S.; Jeukendrup, A.E. Carbohydrates for training and competition. J. Sports Sci. 2011; 29, S17–S27. [Google Scholar] [CrossRef]
  43. Stellingwerff, T.; Morton, J.P.; Burke, L.M. A framework for periodized nutrition for athletics. Int. J. Sport Nutr. Exerc. Metab. 2019, 29, 141–151. [Google Scholar] [CrossRef]
Figure 1. Somatotype profile distribution of non-elite and elite orienteers male.
Preprints 146258 g001
Figure 2. Somatotype profile distribution of non-elite and elite orienteers female.
Preprints 146258 g002
Figure 3. Somatotype profile distribution of male orienteers. The squares are the individual male non-elite somatotypes (the filled square is the male non-elite mean profile) and the circles are the individual male elite somatotypes (the filled circle is the male elite mean profile).
Preprints 146258 g003
Figure 4. Somatotype profile distribution of female orienteers. The squares are the individual female non-elite somatotypes (the filled square is the female non-elite mean profile) and the circles are the individual female elite somatotypes (the filled circle is the female elite mean profile).
Preprints 146258 g004
Table 1. Descriptive statistics (Mean ± SD) for orienteers characteristics (n = 58).
Variables Female, n = 28 Male, n = 30
Non-elite
(n = 18)
Elite
(n = 10)
Non-elite
(n = 17)
Elite
(n = 13)
Age (years) 41.7 ± 10.3 25.5 ± 6.4* 37.2 ± 14.6 24.3 ± 5.0*
OP (years) 11.3 ± 9.6 11.3 ± 5.3 11.6 ± 7.6 12.1 ± 6.2
OTF (days/week) 3.0 ± 2.2 4.9 ± 1.6* 3.6 ± 2.1 6.1 ± 1.3*
OTQ (hours/week) 4.2 ± 3.3 7.7 ± 4.3* 5.5 ± 5.2 8.8 ± 4.0
Body mass (kg) 60.6 ± 8.5 59.5 ± 7.7 71.5 ± 14.2 65.0 ± 5.5
Height (cm) 161.3 ± 11.7 168.1 ± 6.5 174.0 ± 8.8 175.1 ± 6.0
Sitting height (cm) 114.0 ± 20.3 100.5 ± 20.2 122.0 ± 13.6 103.0 ± 18.7*
Arms span (cm) 163.6 ± 7.6 168.2 ± 5.8 183.2 ± 27.0 176.1 ± 6.2
Pectoral ST (mm) 7.9 ± 5.7 8.7 ± 4.4 10.9 ± 9.0 6.4 ± 3.4
Triceps ST (mm) 15.8 ± 4.9 15.2 ± 5.2 9.2 ± 4.4 7.0 ± 2.8
Subscapular ST (mm) 11.5 ± 5.0 9.2 ± 2.7 12.1 ± 8.2 8.4 ± 2.6
Biceps ST (mm) 5.6 ± 2.4 5.3 ± 2.3 3.9 ± 1.6 3.3 ± 1.0
Iliac crest ST (mm) 15.4 ± 5.2 15.7 ± 7.3 15.0 ± 8.7 11.0 ± 7.1
Supraspinal ST (mm) 9.6 ± 4.0 8.1 ± 3.4 9.9 ± 7.8 7.0 ± 3.7
Abdominal ST (mm) 16.3 ± 6.2 13.0 ± 6.0 16.8 ± 9.7 10.1 ± 6.4*
Thigh ST (mm) 21.5 ± 7.3 23.5 ± 8.5 10.6 ± 5.8 9.2 ± 3.2
Calf ST (mm) 11.5 ± 4.6 13.4 ± 6.7 5.7 ± 2.5 5.9 ± 2.7
Neck Girth (cm) 31.6 ± 2.0 30.6 ± 1.6 37.2 ± 3.0 35.1 ± 1.8*
RA Girth (cm) 27.0 ± 2.8 25.8 ± 1.9 28.8 ± 3.3 27.3 ± 2.4
FTA Girth (cm) 27.3 ± 2.1 26.7 ± 1.4 30.1 ± 3.1 29.1 ± 2.3
Chest Girth (cm) 88.6 ± 6.4 85.5 ± 4.4 96.4 ± 8.5 90.3 ± 4.5*
Waist Girth (cm) 74.0 ± 7.4 67.2 ± 4.5* 84.2 ± 12.1 74.2 ± 5.6*
Hips Girth (cm) 96.0 ± 7.1 93.4 ± 10.5 95.7 ± 8.2 91.2 ± 3.4
TM Girth (cm) 49.2 ± 3.5 50.3 ± 3.2 51.1 ± 3.8 51.0 ± 3.1
Calf Girth (cm) 36.0 ± 2.0 35.5 ± 2.7 37.4 ± 2.8 37.2 ± 2.1
Ankle Girth (cm) 21.5 ± 1.1 21.8 ± 2.5 22.6 ± 1.8 22.2 ± 0.9
BF (%) 17.9 ± 3.9 17.6 ± 6.2 11.3 ± 4.8 8.4 ± 2.2*
BM (kg) 7.2 ± 1.0 7.3 ± 1.1 8.6 ± 1.3 8.7 ± 0.8
MM (kg) 21.7 ± 2.3 22.1 ± 1.9 30.4 ± 3.4 30.5 ± 2.0
BMI (kg/m2) 23.4 ± 3.7 21.0 ± 1.9 23.6 ± 4.1 21.3 ± 2.2
Endomorphy 3.9 ± 1.2 3.3 ± 1.1 2.9 ± 1.8 2.1 ± 0.9
Mesomorphy 4.7 ± 1.6 3.5 ± 0.9* 4.5 ± 1.4 4.4 ± 1.3
Ectomorphy 1.9 ± 1.2 3.0 ± 1.0* 2.4 ± 1.7 3.3 ± 1.2
SDM 4.6 ± 2.8 3.5 ± 1.6 5.4 ± 3.5 3.2 ± 3.1
SDD 4.3 3.1
SAM 2.0 ± 1.2 1.5 ± 0.6 2.4 ± 1.5 1.5 ± 1.3
SAD 1.8 1.3
GNK (%) 54.5 ± 12.1 63.6 ± 19.6 49.2 ± 13.3 57.3 ± 19.4
SNK (%) 35.4 ± 15.7 47.5 ± 14.0 26.7 ± 15.8 40.4 ± 15.5*
TNK (%) 41.4 ± 13.1 52.6 ± 13.4* 33.8 ± 13.8 45.7 ± 14.3*
MET-min/week 3941.2 ± 2487.7 4249.5 ± 2346.8 3727.7 ± 3014.7 4451.3 ± 2299.4
kcal/week 4100.2 ± 2486.1 4242.3 ± 1900.7 4281.1 ± 2815.8 4948.8 ± 2520.0
SD = Standard deviation; ST = skinfold thickness; OP = Orienteering practice; OTF = Orienteering training frequency; OTQ = Orienteering training quantity; RA = Relaxed arm; FTA = Flexed and tensed arm; TM = Thigh middle; BF = Body fat; BM = Bone mass; MM = Muscle mass; BMI = Body mass index; SDM = Somatotype dispersion mean; SDD = Somatotype dispersion distance; SAM = Somatotype attitudinal mean; SAD = Somatotype attitudinal distance; GNK = General nutrition knowledge; SNK = Sports nutrition knowledge; TNK = Total nutritional knowledge; MET = Metabolic equivalent; Kcal = kilocalorie; Min = minute. T-test: *statistically significant differences (p < .05).
Table 2. Association of nutrition knowledge with age, training, body composition, somatotype, metabolic equivalent and energy expenditure for Orienteers (Female n = 28; Male n = 30).
Variables MET-min/week kcal/week GNK (%) SNK (%) TNK (%)
F M F M F M F M F M
Age (years) −.17 −.49* −.19 −.46* −.28 −.09 −.40* −.40* −.41* −.34
OP (years) −.02 −.28 −.11 −.27 −.05 .01 .25 −.07 .17 -.05
OTF (days/week) .42* .40* .45* .37 .41* .00 .53** .33 .55** .25
OTQ (hours/week) .54** .64** .52** .59** .38* .04 .53** .23 .54** .19
BF (%) −.39* −.48* −.29 −.42* −.17 −.09 −.25 −.24 −.26 −.22
BM (kg) −.40* −.18 −.22 −.11 −.13 .15 −.02 −.03 −.06 .03
MM (kg) −.18 −.45* −.01 −.37 .08 .25 .13 .13 .13 .18
BMI (kg/m2) −.18 −.57** −.10 −.50** .01 −.07 −.13 −.22 −.10 −.19
Endomorphy −.32 −.44* −.22 −.37 −.21 −.09 −.38* −.26 −.37 −.23
Mesomorphy −.12 −.47* −.08 −.45* .04 .02 −.10 −.07 −.07 −.05
Ectomorphy .11 .59** .02 .54** −.01 .12 .27 .21 .21 .20
SDM .06 .19 .01 .21 .10 −.18 −.01 −.25 .03 −.25
SAM .07 .13 .02 .15 .12 −.13 −.02 −.21 .02 −.21
GNK (%) .23 −.09 .25 −.13 - - .50** .55** .74** .77**
SNK (%) .15 .15 .10 .10 .50** .55** - - .95** .96**
TNK (%) .19 .09 .17 .04 .74** .77** .95** .96** - -
MET-min/week - - .97** .99** .23 −.09 .15 .15 .19 .09
Kcal/week .97** .99** - - .25 −.13 .10 .10 .17 .04
M = Male; F = Female; OP = Orienteering practice; OTF = Orienteering training frequency; OTQ = Orienteering training quantity; BF = Body fat; BM = Bone mass; MM = Muscle mass; BMI = Body mass index; SDM = Somatotype dispersion mean; SAM = Somatotype attitudinal mean; GNK = General nutrition knowledge; SNK = Sports nutrition knowledge; TNK = Total nutritional knowledge; MET = Metabolic equivalent; Kcal = kilocalorie; Min = minute. P-value = *: p < .05; **: p < .01.
Disclaimer/Publisher’s Note: The statements, opinions and data contained in all publications are solely those of the individual author(s) and contributor(s) and not of MDPI and/or the editor(s). MDPI and/or the editor(s) disclaim responsibility for any injury to people or property resulting from any ideas, methods, instructions or products referred to in the content.
Copyright: This open access article is published under a Creative Commons CC BY 4.0 license, which permit the free download, distribution, and reuse, provided that the author and preprint are cited in any reuse.
Prerpints.org logo

Preprints.org is a free preprint server supported by MDPI in Basel, Switzerland.

Subscribe

Disclaimer

Terms of Use

Privacy Policy

Privacy Settings

© 2025 MDPI (Basel, Switzerland) unless otherwise stated