1. Introduction
Education for Sustainable Development (ESD) calls for learning experiences that help students develop not only knowledge, but also the values, attitudes, and dispositions required to support sustainability transitions [
1,
2]. Within this agenda, cultural and built heritage is increasingly understood as more than an object of conservation: it functions as a situated, value-laden resource through which learners can debate what societies choose to preserve, for whom, and with what responsibilities across generations [
3,
4,
5]. In historic urban landscapes, everyday architectural traces can make sustainability tensions tangible, anchoring discussions about stewardship, identity, social cohesion, and the public value of place.
In parallel, mobile augmented reality (AR) has been adopted to connect digital content to real-world contexts and to support outdoor, inquiry-oriented learning. Evidence syntheses indicate that AR can support motivation and engagement and can enable multimodal interaction when activities occur in authentic settings such as cities, museums, and heritage sites [
6,
7]. When combined with game mechanics, Mobile Augmented Reality Games (MARGs) can structure learning as place-based quests and collaborative challenges, making interaction design and attention orchestration between the screen and the environment central to the educational value of these interventions.
To support competence-oriented ESD, the European Commission’s GreenComp framework provides a shared reference for articulating sustainability competences across educational levels. GreenComp defines twelve interrelated competences organized into four competence areas:
Embodying Sustainability Values,
Embracing Complexity in Sustainability,
Envisioning Sustainable Futures, and
Acting for Sustainability [
8]. While GreenComp has been considered as a policy and curriculum reference, two challenges remain salient for empirical work in authentic contexts: embedding competence descriptors into concrete learning tasks and assessing competence development in ways that remain meaningful under real educational limitations, including the frequent need for anonymous participation [
9].
This paper focuses on the
Art Nouveau Path, a heritage-based MARG implemented in Aveiro, Portugal, and developed within the EduCITY digital teaching and learning ecosystem (DTLE) [
10,
11,
12]. The MARG guides students through a curated urban path and uses georeferenced points of interest (POI), AR visual overlays, and question-driven challenges to connect built heritage interpretation with sustainability themes. Prior works have reported the game’s design rationale, its alignment with GreenComp, and its validation with teachers, alongside baseline student diagnostics on sustainability awareness and interest in learning through Art Nouveau heritage. Collectively, this program of works supports the feasibility and pedagogical plausibility of using heritage-based mobile AR to advance ESD aims in situ. However, a key evaluation gap persists in the broader literature and in many heritage-AR interventions: evidence is often limited to single-moment measures or short pre-post comparisons, making it difficult to judge whether perceived competence-related benefits persist beyond the immediate experience [
7].
Recent literature regarding AR in cultural heritage similarly highlight that evaluation is frequently framed around immediate experience and diverse outcomes, while the methodological basis for design and evaluation remains uneven, reinforcing the need for more explicit and robust evaluation approaches in authentic heritage contexts [
13]. This limitation is especially consequential for the value-related aspects of sustainability competences, where durable change is likely to require reinforcement through continued reflection and opportunities to act.
This study addresses this gap using a repeated cross-sectional longitudinal (trend) design focused on students’ self-perceived sustainability competences. Repeated cross-sectional designs are commonly used to estimate population-level change over time when individual linkage is infeasible, and they provide a pragmatic alternative to panel designs in school contexts where anonymity, attrition, and respondent conditioning can threaten inference [
14,
15]. In educational-based settings, repeated anonymous surveys are a common approach for monitoring change at scale [
14,
16,
17]. In this study, self-perceived competences were assessed using a GreenComp-grounded questionnaire adapted from the GreenComp-based Questionnaire (GCQuest) [
18] to the
Art Nouveau Path context.
Data was collected at three stages surrounding the intervention: baseline (S1-PRE; n = 221), immediately post-intervention (S2-POST; n = 439 collected; n = 438 retained for scale-based analyses after applying a predefined completeness criterion), and follow-up (S3-FU; n = 434), yielding 1,094 questionnaires overall (1,093 retained for scale-based analyses). Because participation was anonymous, waves were treated as independent samples, enabling cohort-level comparisons across time while avoiding claims about within-student trajectories. This paper analysis is concentrated, as the GCQuest [
18], on the GreenComp competence area ‘
Embodying Sustainability Values’, which foregrounds valuing sustainability, reflecting on responsibility, and aligning intentions and actions with sustainability principles [
8].
By examining domain scores, item-level trajectories, and threshold-based patterns (as example, shifts in the proportion of students reaching higher perceived competence bands), this study clarifies which value-related perceptions are most responsive immediately after the experience and which appear more sustained over time. Overall, findings aim to inform both the curricular integration of heritage-based mobile AR experiences in ESD and the methodological discussion on how competence-oriented outcomes can be studied under realistic educational context and constraints using repeated cross-sectional datasets [
14,
15,
19].
Accordingly, this study addresses the following research questions (RQ): RQ1. ‘How do students’ perceived sustainability competences in the GreenComp competence area Embodying Sustainability Values evolve across the three waves surrounding the Art Nouveau Path, from baseline (S1-PRE) to immediate post-intervention (S2-POST) and follow-up (S3-FU)?’; RQ2. ‘How does the proportion of students reaching higher perceived competence bands (for example, scores ≥ 4.0 and ≥ 4.5 on the six-point scale) in Embodying Sustainability Values change between baseline, post-intervention, and follow-up?’, and RQ3. ‘Which GCQuest items within Embodying Sustainability Values show the largest and most sustained changes between waves, and what item-level response patterns emerge when comparing baseline, post-intervention, and follow-up?’.
This paper is organized into six sections. Following the Introduction,
Section 2 presents the theoretical framework,
Section 3 describes the materials and methods,
Section 4 reports the results,
Section 5 discusses the findings in relation to the research questions and prior work, and
Section 6 concludes with implications, limitations, and directions for future research paths.
3. Methods and Materials
3.1. Research Design and Study Procedures
This study reports the quantitative survey component of a broader Design-Based Research-approach case study [
44,
45,
46,
47] research project centered on the
Art Nouveau Path, a heritage-based MARG implemented in Aveiro, Portugal, within the EduCITY DTLE. The present work isolates a three-wave questionnaire dataset to examine how students’ perceived sustainability competences vary across measurement moments surrounding participation in the intervention, addressing the persistence and attenuation gap identified in this study.
Methodologically, it was adopted a repeated cross-sectional longitudinal (trend) design. Data was collected at three measurement waves aligned with the same intervention format: baseline prior to participation (S1-PRE), immediately after the game session (S2-POST), and a later follow-up moment (S3-FU). Considering that questionnaires were anonymous and administered in educational settings without any individual identifier, responses could not be linked across waves. Accordingly, the three waves were treated as independent samples, supporting cohort-level comparisons over time while avoiding claims about within-student developmental trajectories [
14,
15,
19].
Data collection followed a sequential procedure aligned with the intervention timeline. At baseline (S1-PRE), students completed the questionnaire before participating in the Art Nouveau Path session. Students then completed the outdoor activity, typically playing in small collaborative groups (3 to 4 elements) while moving between points of interest and completing place-based tasks mediated by EduCITY Project’s mobile devices to ensure the same experiences across groups. Immediately after completing the session, students completed the post-intervention questionnaire (S2-POST). At follow-up (S3-FU), the questionnaire was administered in class to capture medium-term patterns in perceived competences, approximately six to eight weeks after participation. Given anonymous administration and school scheduling constraints, the design involves partially overlapping cohorts rather than individually matched observations. Across waves, administration followed standard anonymous survey practices in educational settings [
14,
16,
17].
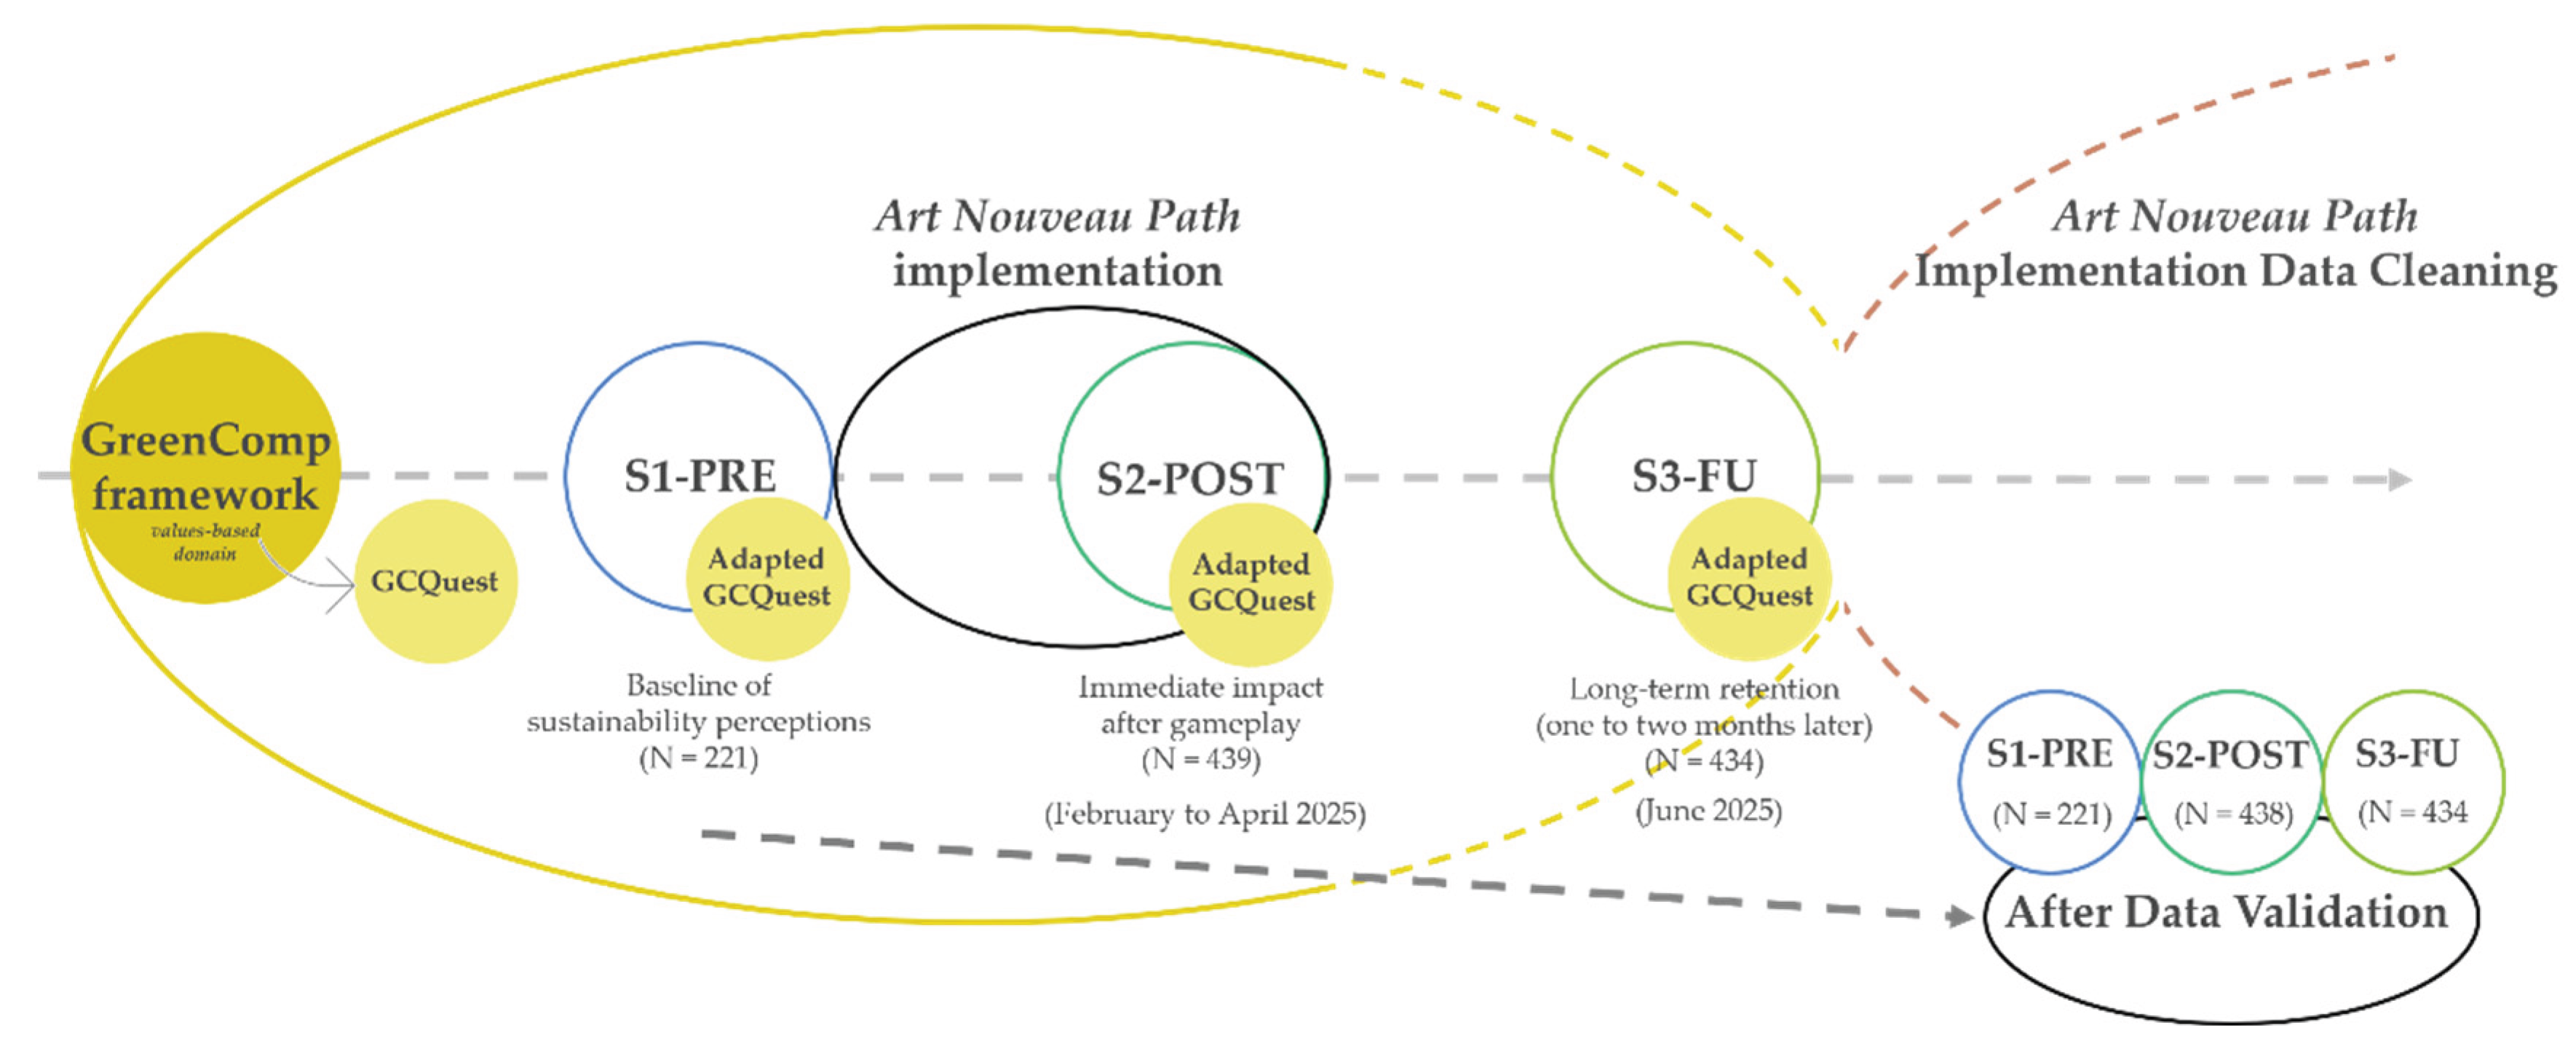
An overview of the three-wave repeated cross-sectional design and the intervention-aligned measurement moments used in this study is presented in
Figure 1.
Prior works detail the intervention rationale, design decisions, and ecosystem integration [
10,
11,
12,
29]. The present manuscript focuses on three-wave questionnaire evidence to address persistence and attenuation beyond immediate post-intervention measures; the intervention setting is followed summarized.
3.2. Context and Intervention Setting
Data was collected with students during the implementation of the Art Nouveau Path, delivered as a location-based outdoor activity in Aveiro, Portugal, through the EduCITY DTLE [
10,
11,
12,
29]. The intervention was structured as a curated urban path comprising eight georeferenced points of interest (POIs) associated with Aveiro’s Art Nouveau built heritage. At each POI, students engage with place-based prompts and challenge items delivered via mobile devices, combining in situ observation of architectural features with digital interpretive content, optional AR, and quiz-driven tasks.
For the purposes of this paper, the intervention is described at a functional level to contextualize why data collection occurred in authentic outdoor school conditions and why anonymous participation and independent-wave sampling were required. Full descriptions of game interaction design decisions and example task instances are available in prior publications [
10,
11,
12,
29].
3.3. Participants
Participants were students recruited through school-based implementations of the Art Nouveau Path in Aveiro, Portugal, within the broader EduCITY project, via the Municipal Educational Action Program of Aveiro (PAEMA, 2024/2025 edition) [
48]. Participation was voluntary, resulting in a convenience sample.
The targeted population, by the MARG’s curricular alignment, comprised lower and upper secondary school students (grades 7 to 12), with an approximate age range of 13 to 18 years. During the on-site implementation of the Art Nouveau Path sessions (S2-POST wave), 439 students participated in the intervention session and completed the post-intervention questionnaire. They were distributed across 19 classes and six grade levels (7th: N = 19; 8th: N = 135; 9th: N = 156; 10th: N = 37; 11th: N = 20; 12th: N = 72), mainly from urban and peri-urban schools. No data on gender or socio-economic background was collected.
For contextual completeness regarding the intervention setting, students typically completed the outdoor game session in collaborative groups of three to four members, as organized by accompanying teachers.
3.4. Data Entry, Questionnaire Waves, and Analytical Samples
Across the three questionnaire waves (S1-PRE, S2-POST, S3-FU), a total of 1,094 questionnaires were collected, namely, baseline prior to gameplay (S1-PRE; n = 221), immediate post-intervention (S2-POST; n = 439 collected), and follow-up after participation (S3-FU; n = 434). Analyses are therefore unadjusted (that is, no covariate control).
To ensure interpretable and stable domain-level scores, a completeness criterion was applied: respondents were included in scale-based analyses if they provided valid responses for at least 20 of the 25 Likert-type items. Applying this criterion led to the exclusion of one respondent in S2-POST and none in S1-PRE or S3-FU, yielding final analytic sample sizes of S1-PRE = 221, S2-POST = 438, and S3-FU = 434, for a total analytic dataset of 1,093 responses. The referred excluded questionnaire had 7 non-answered Likert-type items responses.
Prior to the coding and data entry, the exclusion criterion was defined by the authors, namely, the predefined completeness rule (25 of 25 valid item responses) to define the analytic sample. All paper questionnaires (N = 1094) were coded and entered the spreadsheets by the first author. The missing entries were coded as “No Answered” (NA). The first author screened the datasets ensuring cross-checking the Likert-scale range (1 to 6) using spreadsheet’s tools, as “Find” and function “ISBLANK”. The second author performed a quality control analysis based on a random subsample of approximately 5% of questionnaires per wave. The full analysis pipeline was executed in R by the first author, and key numerical outputs were independently replicated in MATLAB by external researcher as a computational verification step.
3.5. Instruments and Measures
3.5.1. GreenComp-Based Perceived Competence Questionnaire (S1-PRE, S2-POST, S3-FU)
Students’ perceived sustainability competences were assessed using a GreenComp-grounded questionnaire adapted from the GCQuest to the
Art Nouveau Path context. The analyses use the 25-item Likert block, rated on a 6-point scale (1 to 6). A 6-point format was used to avoid a neutral midpoint and to increase discrimination across perceived competence levels in school-based self-report measurement [
49,
50,
51].
To match each measurement moment while preserving conceptual equivalence, the questionnaire used wave-specific stems: baseline (S1-PRE): “In my daily life, I try to...”, post-intervention (S2-POST): “This activity allowed me to...”, and follow-up (S3_FU): “Since the activity, in my daily life I try to...”. Across waves, item cores were kept as consistent as possible so that between-wave differences could be interpreted as trend shifts rather than artefacts of item meaning changes.
Consistent with this work’s focus and RQ, the adapted 25-item instrument is used to capture students’ self-perceived competence within the GreenComp competence area ESV [
8] in the
Art Nouveau Path context. This manuscript does not aim to provide a full psychometric re-validation of the adapted version for each wave; instead, it reports wave-specific internal consistency as a dataset-level quality check and interprets between-wave differences as repeated cross-sectional trend evidence. Prior work within the EduCITY Project reports factorial validity evidence for GCQuest data using ordinal-appropriate Structural Equation Modeling (SEM) estimation [
52].
3.5.2. The ESV Score as Measures Used in This Study
Consistent with this work’s RQ, the 25 Likert-type items were used to compute an ESV domain score for each respondent. The ESV score was computed as the arithmetic mean across available item responses, with higher values indicating higher perceived alignment with sustainability values. Domain scores were computed only for respondents meeting the predefined completeness criterion.
3.5.3. Derived Indicators for Threshold-Based Analyses
To support RQ2, threshold-based indicators were derived from the 1-6 domain score to summarize shifts in the proportion of students positioned in higher perceived competence bands across waves. The first cut point (>= 4.0) was defined to represent performance above the scale midpoint (3.5 in a 1-6 scale) and to align with an agreement band in typical agree-disagree response formats. A second, more stringent cut point (>= 4.5) was defined as a high-agreement benchmark to describe stronger endorsement patterns. These thresholds are reported as descriptive prevalence indicators. To quantify between-wave differences in these prevalence distributions, it was additionally reported chi-square tests with Cramer’s V as effect size. Importantly, the thresholds are not interpreted as categorical evidence of achieved competence; inferential conclusions about between-wave differences rely primarily on ordinal-appropriate tests and effect sizes applied to the continuous domain score, with threshold indicators used to support interpretability and communication.
3.5.4. The GCQuest Validation Context
For completeness, it is summarized the development and validation evidence reported for the GCQuest [
18] within the broader EduCITY Project. The GCQuest data collection tool [
53] was developed within the EduCITY Project to support the assessment of the GreenComp competence area ESV [
8] and is openly available in Portuguese [
54] and in English [
18].
The instrument development was grounded in the GreenComp framework [
8] and focused on ESV by operationalizing three competences, “
Valuing Sustainability”, “
Supporting Fairness”, and “
Promoting Nature”, structured through Knowledge, Skills, and Attitudes (KSAs). The GCQuest includes open-ended prompts and a Likert block, and it was administered in Portuguese using the official EU translation of GreenComp [
8] to ensure linguistic and conceptual consistency with the framework. For the
Art Nouveau Path implementation, item wording and prompts were contextualized to reflect the intervention themes and learner experience, supporting content relevance in the school-based setting.
Evidence supporting the factorial structure has been reported through a second-order Confirmatory Factor Analysis (CFA) within a SEM in JASP 0.19.3, using the Diagonally Weighted Least Squares (DWLS) estimator appropriate for ordinal Likert-type data. The model specified KSA constructs as first-order factors loading onto a second-order factor representing ESV. Overall model fit was good Comparative Fit Index (CFI) = 0.945; Tucker–Lewis Index (TLI) = 0.939; Standardized Root Mean Square Residual (SRMR) = 0.049; Root Mean Square Error of Approximation (RMSEA) = 0.077, with statistically significant factor loadings (p < 0.001). These computation results were calculated with JASP software version 0.19.3 [
55]. A documented workflow and technical materials are available through GCQuest resources, including the SEM technical note [
56][REF]. This prior validation provides context for the use of the 25-item block in the present trend analyses, which focus on between-wave comparisons and wave-specific internal consistency indicators.
3.6. Data Processing and Scoring
Questionnaire data were screened prior to analysis to confirm valid response ranges (1 to 6), identify missing values, and apply the predefined completeness criterion. Missing responses were treated as missing and were not imputed. All items were coded such that higher values indicated higher perceived competence alignment with sustainability values. Scores were computed as following defined.
3.7. Statistical Analysis
Analyses followed the repeated cross-sectional structure of the dataset. Descriptive statistics were computed for the ESV domain score and for each item by wave using distribution-aware summaries appropriate for Likert-type outcomes, prioritizing median and Interquartile Range (IQR) by wave. Means were retained as the operational definition of the domain score (mean of Likert-items Q1-Q25) and for descriptive figures. Inferential conclusions rely primarily on ordinal-robust non-parametric tests and effect sizes; mean-based heteroscedasticity-robust inference is reported as a sensitivity analysis to corroborate robustness.
Internal consistency of the 25-item scale was assessed within each wave (Cronbach’s alpha, complemented by McDonald’s omega). These indices were computed for the 25-item ESV composite and are reported as wave-specific dataset-level quality checks, not as reliability evidence for separate competence-specific subscales in this work. For domain-level comparisons across the three independent samples (RQ1), an omnibus non-parametric comparison was conducted (Kruskal-Wallis), followed by adjusted post hoc pairwise comparisons when warranted (Dunn tests with Holm correction). Effect sizes were computed alongside p-values (epsilon-squared for omnibus effects; rank-biserial correlation for pairwise contrasts).
Because the ESV composite score is defined as the mean of 25 Likert items, we also report mean-based estimates and heteroscedasticity-robust between-wave inference as sensitivity analyses. Specifically, it was used heteroscedasticity-robust omnibus testing (Welch ANOVA) and Holm-adjusted Welch t tests for pairwise contrasts, alongside effect sizes and confidence intervals. These mean-based results are reported in parallel with ordinal-robust non-parametric comparisons to corroborate robustness; substantive conclusions are drawn from the ordinal-robust comparisons under the repeated cross-sectional design.
In addition to the domain and item-level trend analyses, we conducted an exploratory triangulation to contextualize item trajectories using discourse-oriented features of the item prompts. Because the stem framing differs across waves (habitual day-to-day orientation in S1-PRE, activity-attribution framing in S2-POST, and persistence-since-activity framing in S3-FU), discourse coding was performed on the canonical item text excluding the stem to isolate prompt properties from wave framing.
A four-member coding panel (including the authors, an EduCITY Project researcher, and a Portuguese language teacher who supported the field implementation) independently coded all 25 items and then resolved discrepancies through two structured consensus meetings. Coding followed a closed codebook with deterministic rules anchored in the dominant modal verb of the prompt, enabling a reproducible mapping of items to KSA-oriented categories: Knowledge (knowing, being aware), Skills (being able to), and Attitudes (becoming more willing, being more concerned, affective stance such as empathy). The final KSA mapping was used to aggregate item means and deltas by category to support interpretive triangulation.
We further computed simple linguistic-complexity indicators for each item (character count and word count, computed on the item text excluding the stem) and examined descriptive associations between these indicators and item-level change magnitudes (deltas) across waves. These analyses were treated as exploratory and were used to support interpretation rather than inferential claims.
3.8. Cross-software Verification
To ensure data analysis and results quality, key descriptive statistics and score computations were independently cross-checked in MATLAB using the same cleaned datasets and scoring rules. This cross-check was performed by an external researcher who was not involved in the project. This step verified numerical consistency across environments rather than generating additional results. The minor differences were attributable to rounding or display conventions and did not affect the reported conclusions.
3.9. Ethical Considerations and Data Access
The study was conducted in accordance with the ethical protocols established by the University of Aveiro and in compliance with the University of Aveiro’s General Data Protection Regulation (GDPR) on 27 November 2024 and was approved by the Ethics Committee of the same institution (protocol code 1-CE/2025, 5 February 2025).
Participation was voluntary. Informed consent was obtained from all participants. Regarding students, parental or legal-guardian consent was additionally secured in line with school-based procedures for research involving minors. Questionnaire administration was anonymous, and no personally identifiable information was collected.
Given that the datasets were collected in educational contexts involving minors and under GDPR constraints, participant-level questionnaire datasets are not publicly released. Supporting analysis materials are available via the
Art Nouveau Path MARG’s Zenodo community [
57] [REF]. Access to restricted datasets or additional aggregated outputs may be provided upon reasonable request, subject to ethics approval and data protection requirements.
4. Results
4.1. Data Completeness and Internal Consistency
Across the three waves, item-level data quality was high, and responses respected the expected 1 to 6 Likert range, with no out-of-range values detected. S1-PRE (N = 221) and S3-FU (N = 434) contained no missing cells. In S2-POST (N = 439), missingness was concentrated in a single record (7 missing cells across Q11 to Q17). Considering that this record did not meet the predefined completeness criterion and was excluded. The resulting analytic sample comprised N = 221 (S1-PRE), N = 438 (S2-POST), and N = 434 (S3-FU), totaling N = 1,093 responses.
Internal consistency of the 25-item Embodying Sustainability Values (ESV) composite score was acceptable to good across waves (Cronbach’s alpha range: 0.72 to 0.88; McDonald’s omega range: 0.72 to 0.88). Item diagnostics indicated that “alpha if item deleted” did not meaningfully improve the scale at any wave, supporting the use of a single composite score at each time point. Although the composite score deviated from normality in all waves (Shapiro-Wilk tests), the large sample sizes and observed variance heterogeneity (Levene and Brown-Forsythe tests) justified the use of heteroscedasticity-robust and ordinal-robust comparisons in subsequent analyses.
Table 1 summarizes dataset-level quality checks and internal consistency (alpha and omega) by wave.
Table 1 indicates high item-level data quality across waves, with missingness concentrated in a single S2-POST record that was excluded by the predefined completeness rule. Internal consistency is acceptable to good (alpha and omega), supporting the use of a single ESV composite score per wave;
Table 2 then reports wave-level descriptives for the ESV composite score used in subsequent between-wave comparisons.
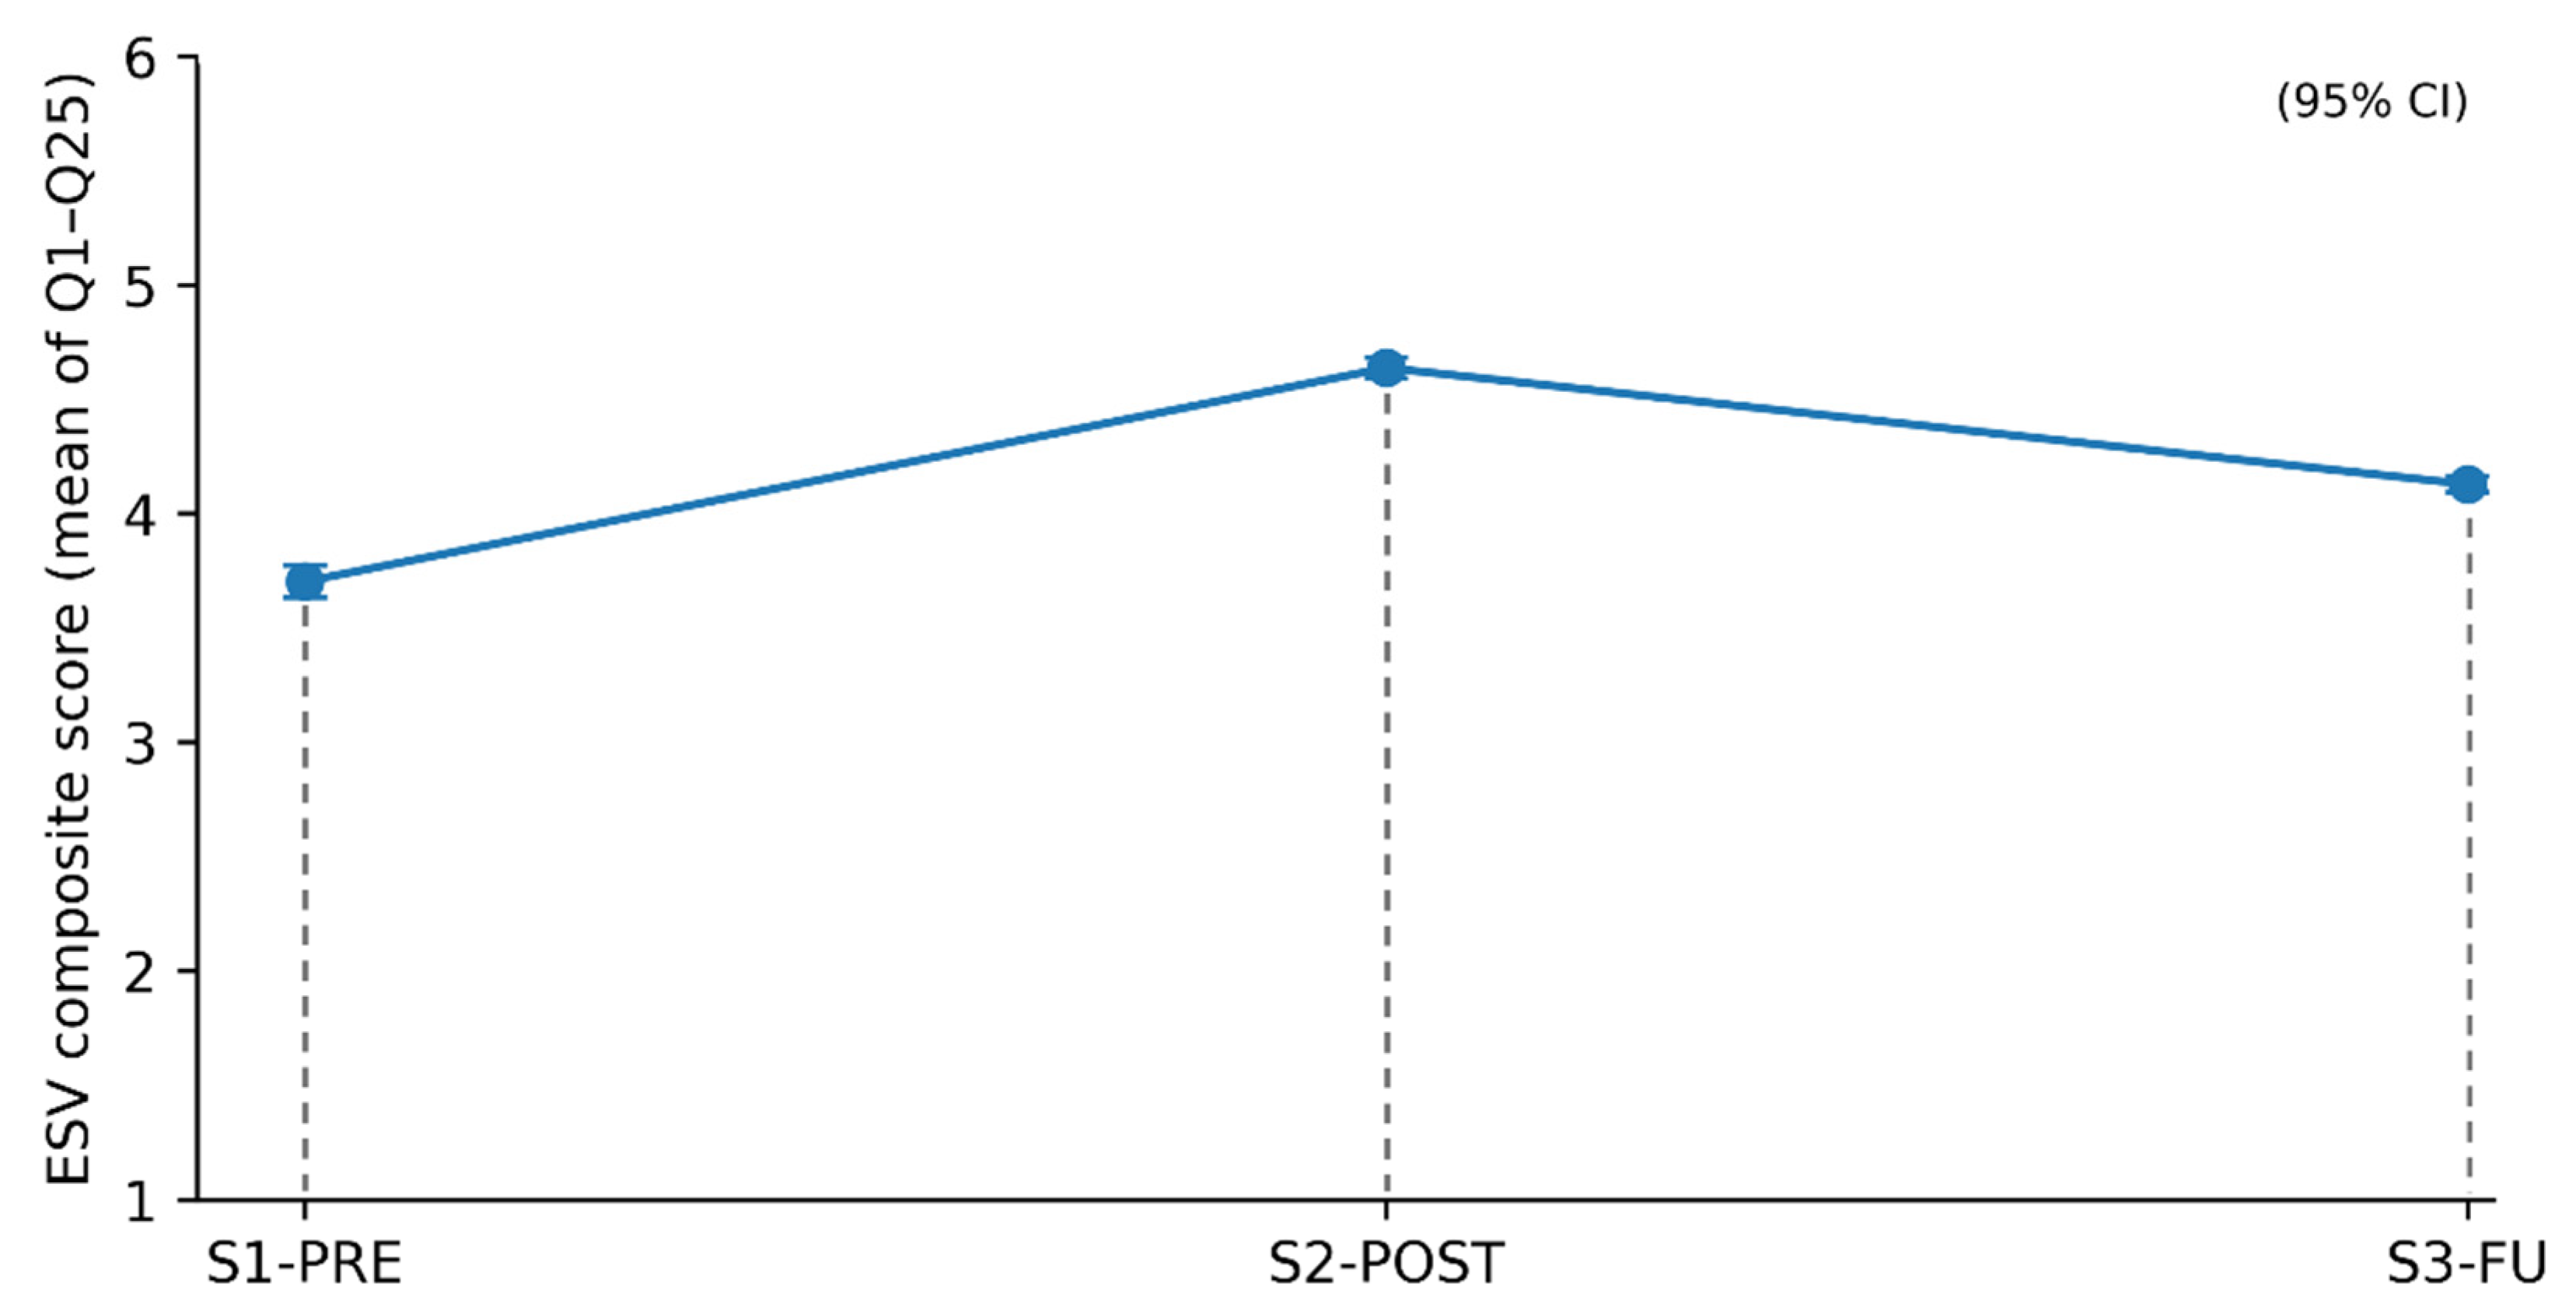
As shown in
Table 2, mean ESV scores increase markedly from S1-PRE to S2-POST and then partially attenuate at S3-FU while remaining above baseline. This pattern is examined next using distribution-aware summaries and ordinal-robust inference at the domain level.
4.2. Domain-Level Evolution of ESV
The evolution of students’ ESV composite score (defined as the mean of Q1-Q25) is summarized in
Figure 2. The Distribution-aware descriptives show a clear post-intervention uplift followed by partial attenuation: S1-PRE median = 3.60 [IQR 3.32-4.08], S2-POST median = 4.68 [IQR 4.44-4.88], and S3-FU median = 4.12 [IQR 4.00-4.28]. Mean scores followed the same pattern (S1-PRE: M = 3.70, SD = 0.54; S2-POST: M = 4.64, SD = 0.50; S3-FU: M = 4.13, SD = 0.36). An omnibus Kruskal-Wallis test confirmed differences across waves, H(2) = 428.06, p < .001, with a large effect (epsilon-squared = 0.391). Post hoc Dunn tests with Holm correction indicated that all pairwise contrasts differed (all p_Holm < .001), with large pairwise effect sizes (rank-biserial r = -0.78 for S1-PRE vs S2-POST, higher in S2-POST; r = -0.49 for S1-PRE vs S3-FU, higher in S3-FU; r = 0.64 for S2-POST vs S3-FU, higher in S2-POST).
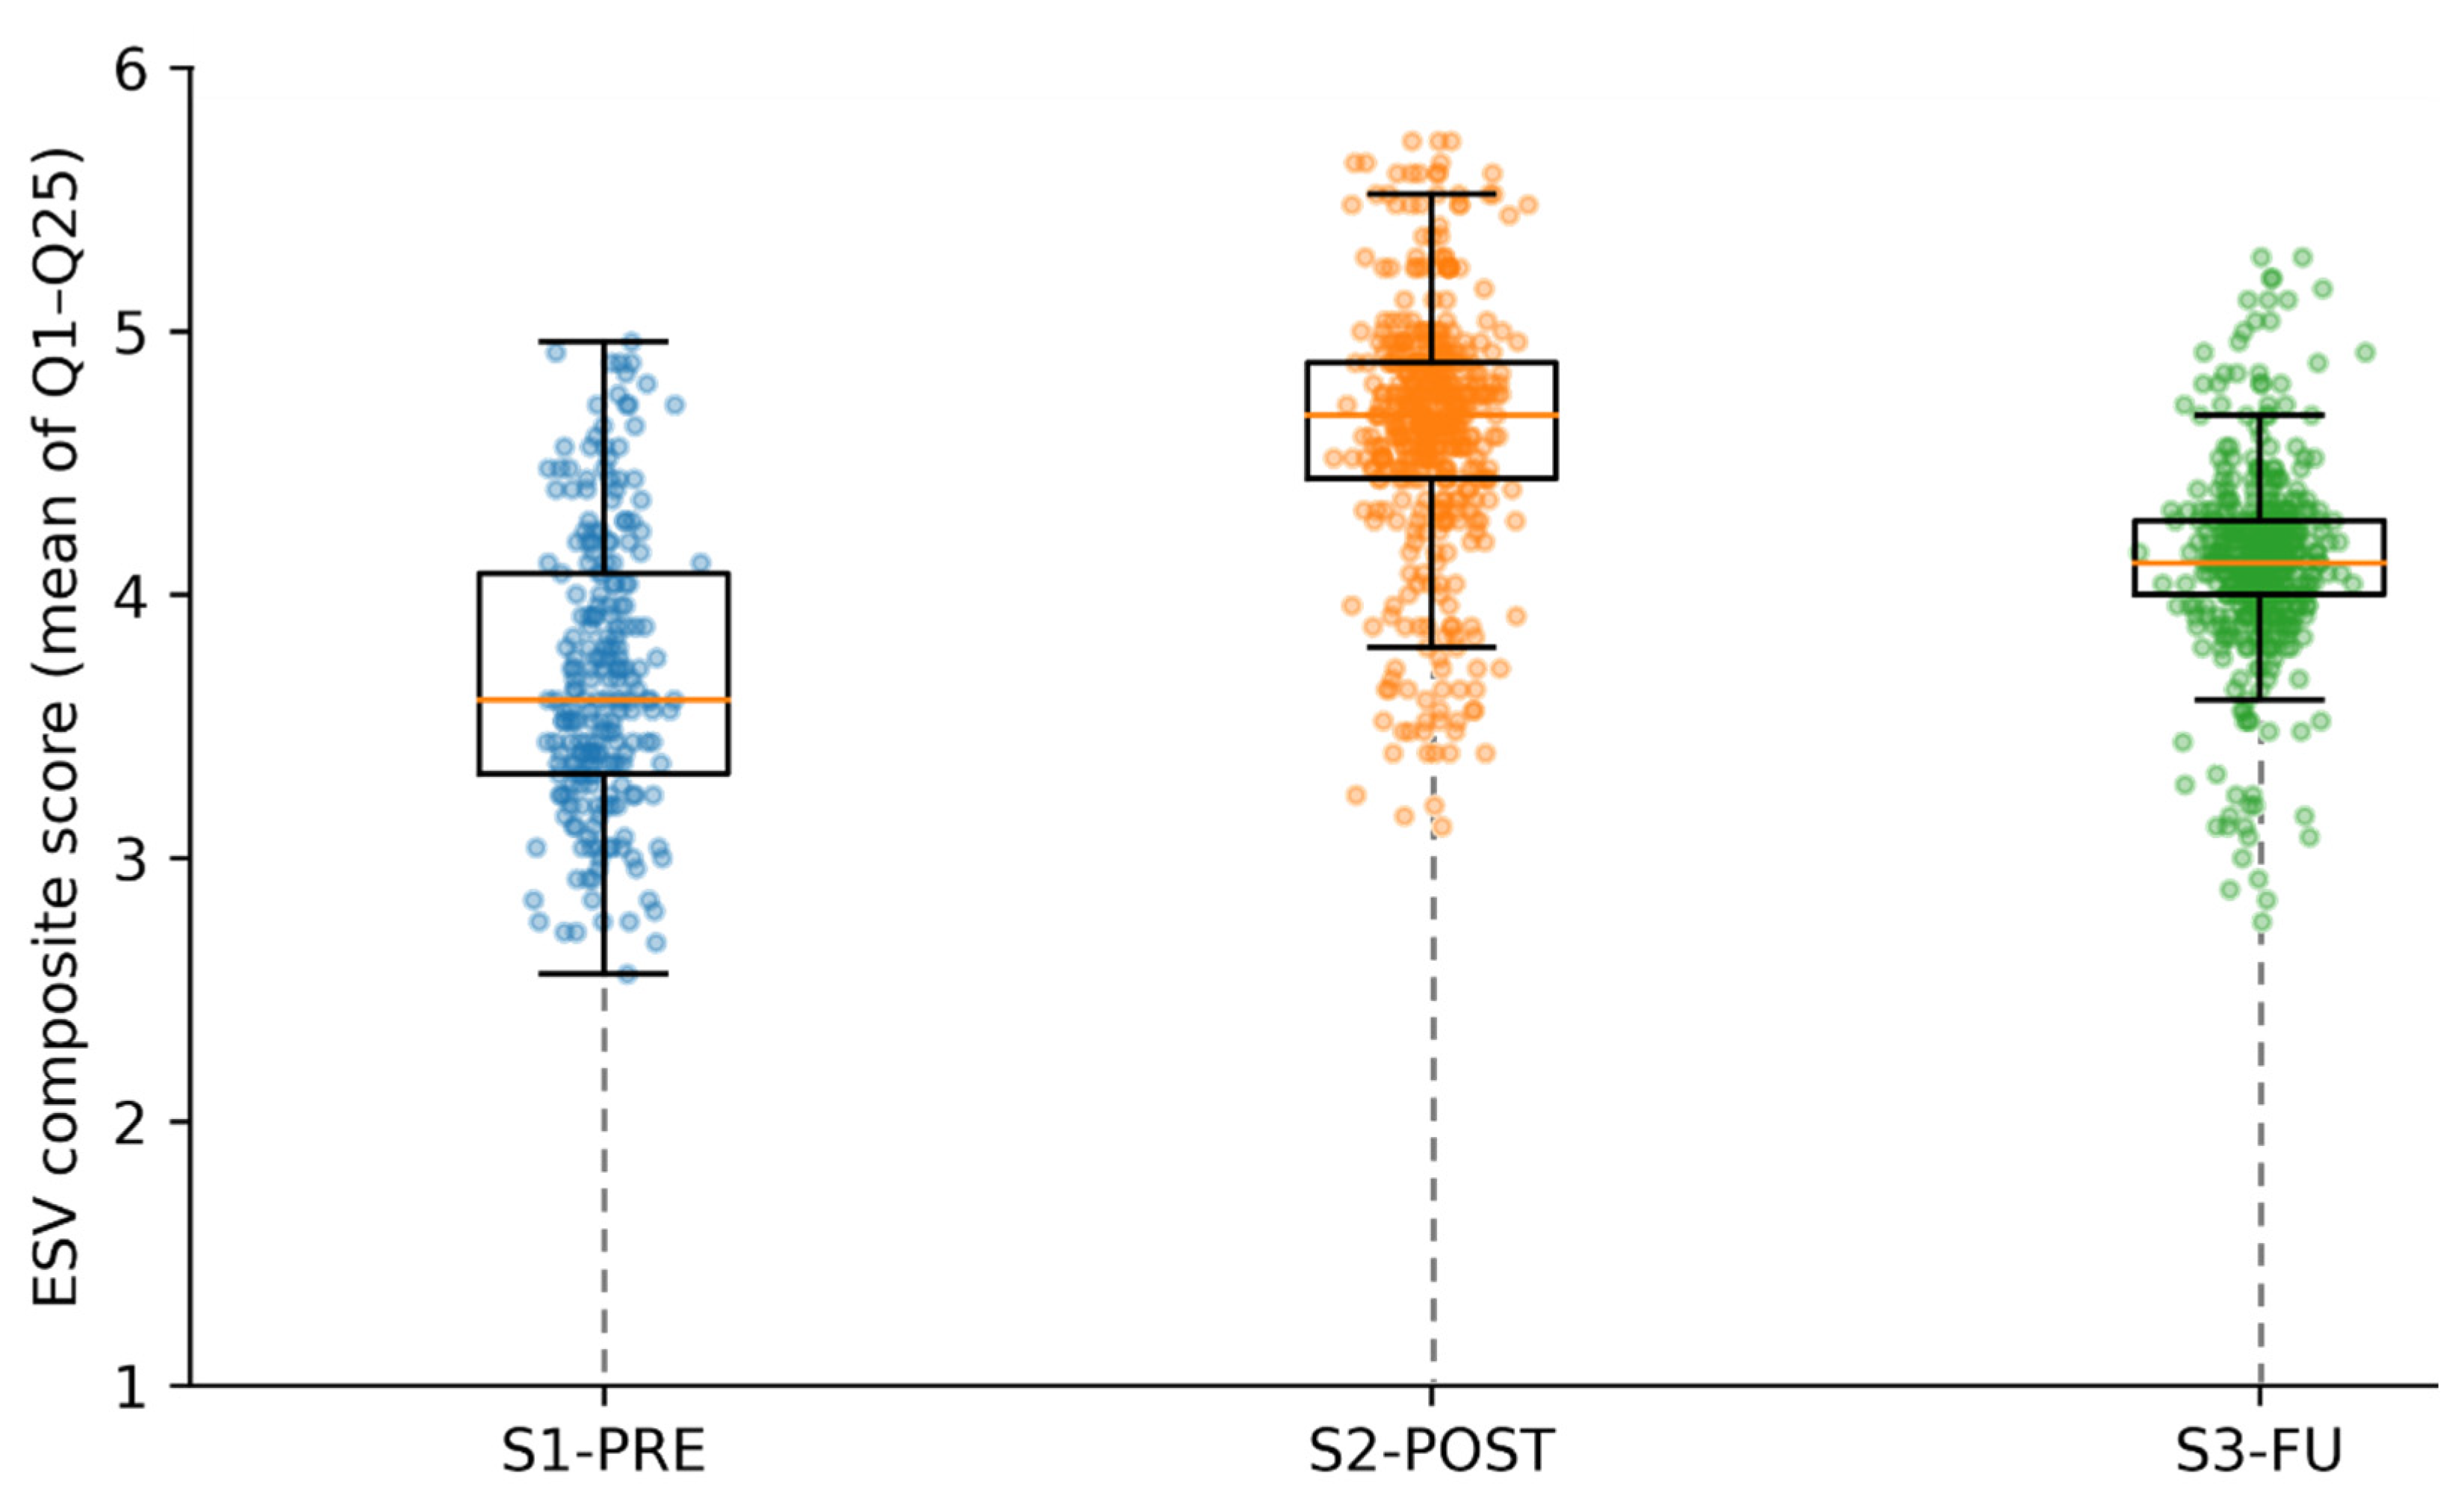
The distributional shift is consistent with these median-based contrasts, as presented in
Figure 3.
Relative to S1-PRE, S2-POST is characterized by a marked concentration of higher values, while S3-FU shows a partial return towards intermediate values yet remains centered above baseline. Sensitivity analyses (winsorisation and trimmed means) reproduced virtually identical mean-based contrasts, indicating that findings were not driven by distributional tails. Mean-based heteroscedasticity-robust inference (Welch ANOVA and Holm-adjusted Welch t tests) yielded the same qualitative conclusions and is reported as a sensitivity analysis (
Table 3).
Table 1 indicates high item-level data quality across waves, with missingness concentrated in a single S2-POST record that was excluded by the predefined completeness rule. Internal consistency is acceptable to good (alpha and omega), supporting the use of a single ESV composite score per wave;
Table 2 therefore reports the corresponding wave-level descriptives for that score.
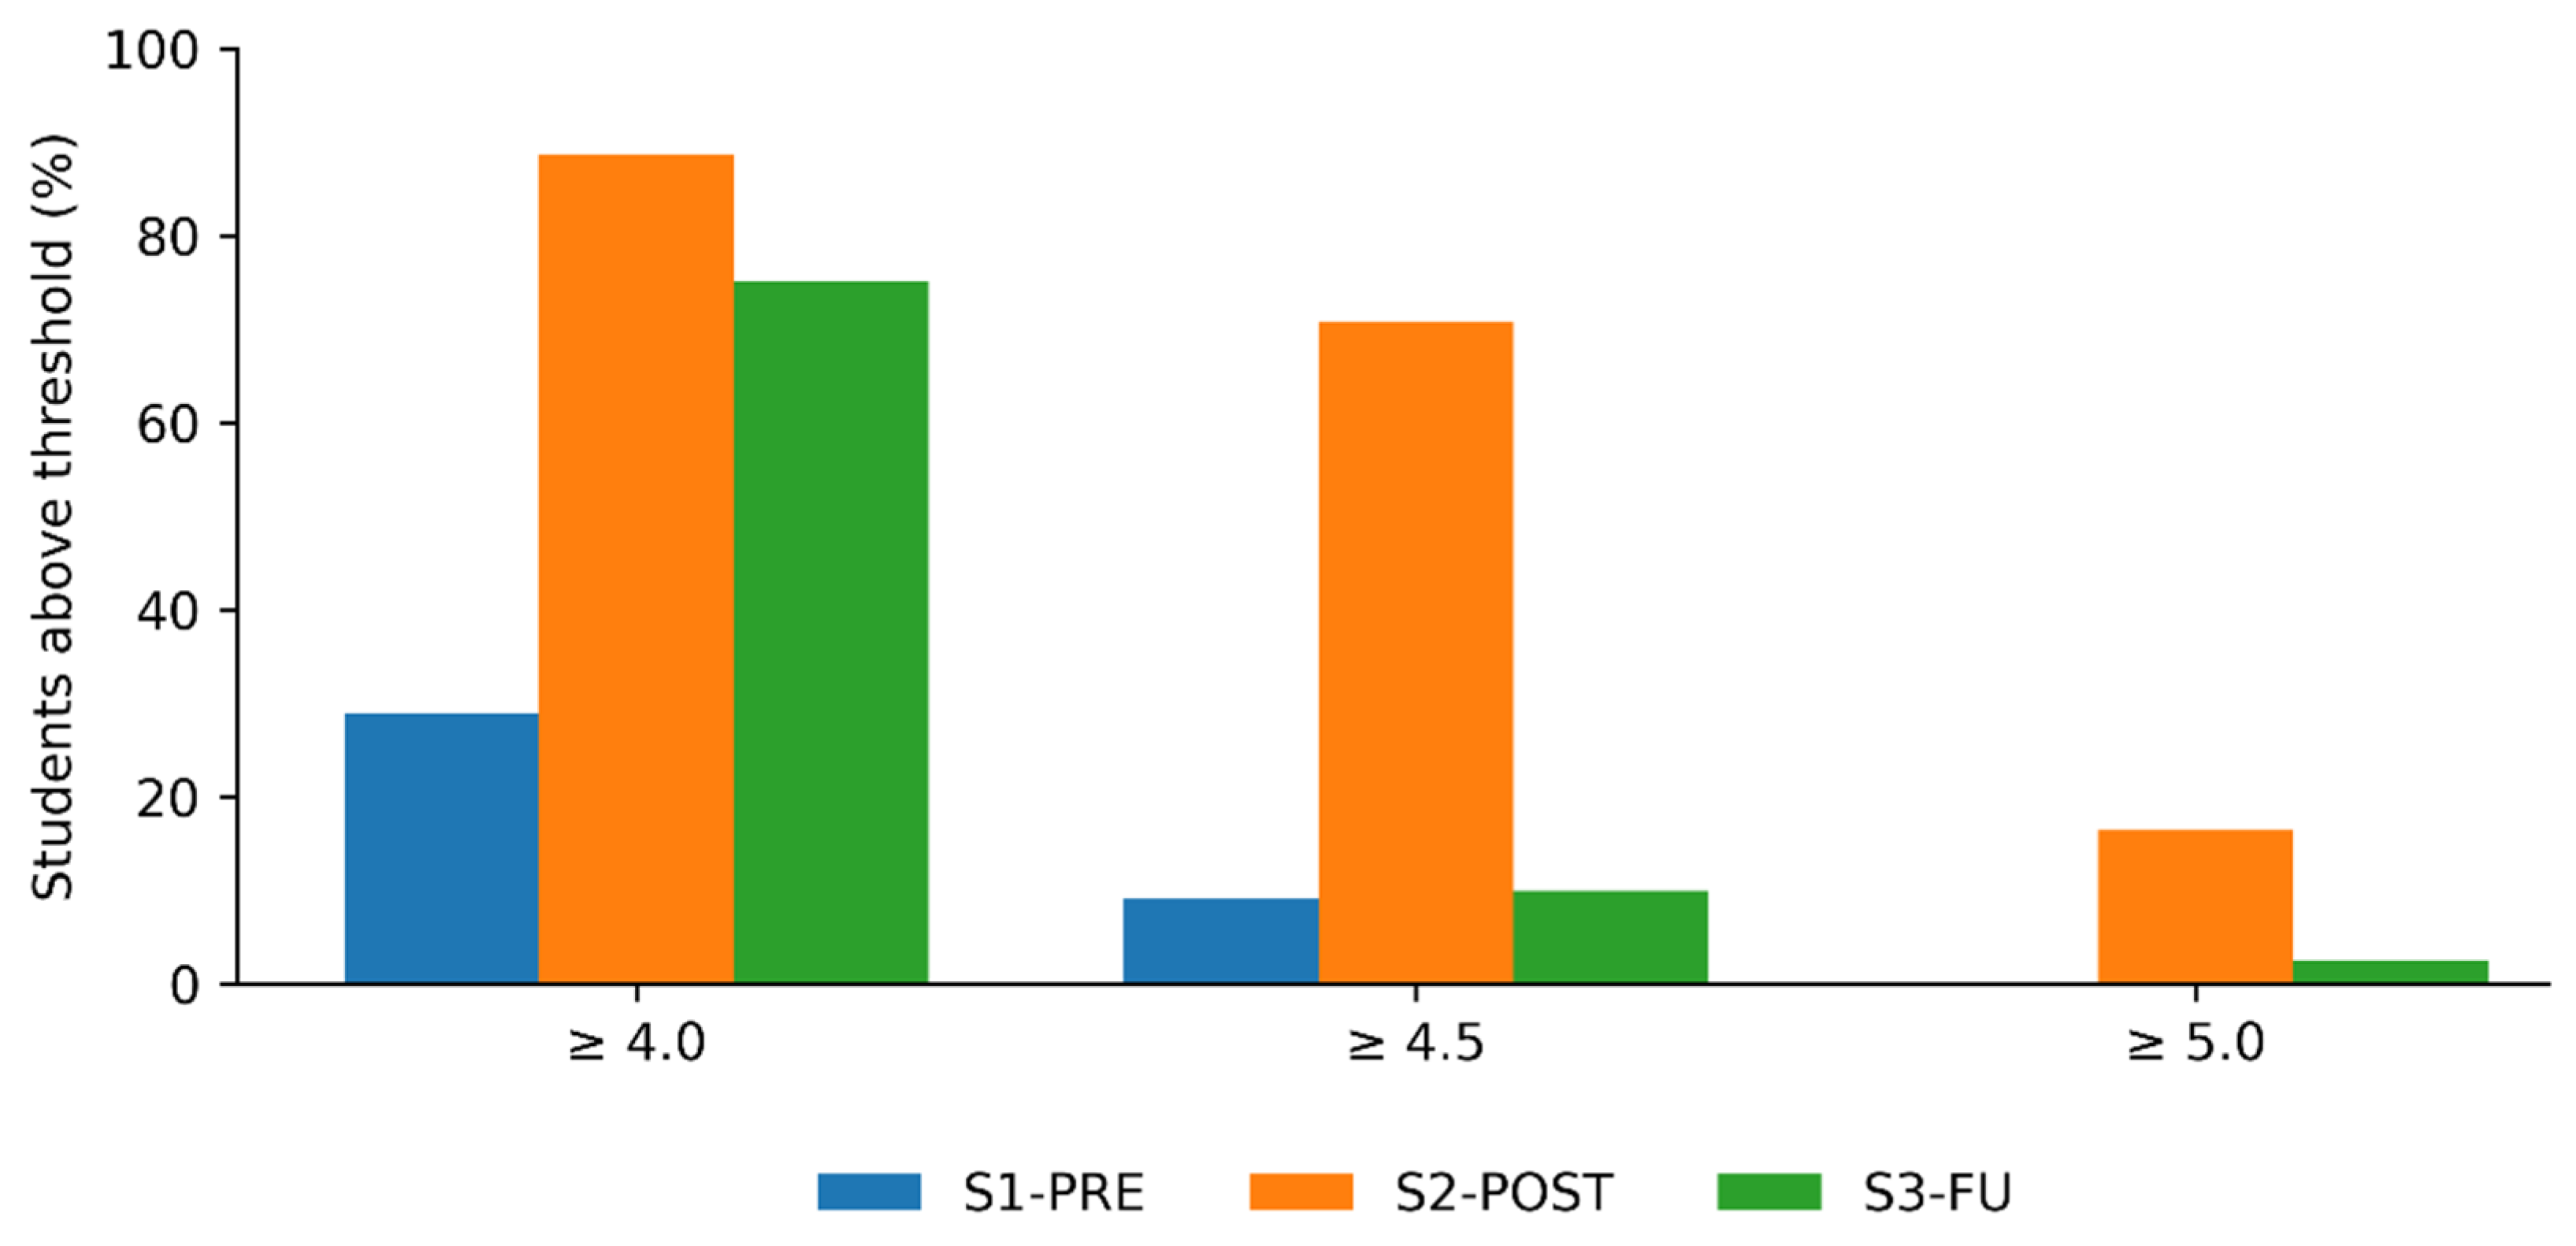
4.3. Proportions of Students Reaching Higher Competence Bands
To complement domain-score contrasts, it was examined the proportion of students exceeding two pragmatic thresholds on the ESV composite score: >= 4.0 (moderate to high endorsement) and >= 4.5 (high endorsement). At the 4.0 threshold, the proportion increased from 28.96% at S1-PRE (64/221) to 88.58% at S2-POST (388/438) and remained elevated at S3-FU (75.12%, 326/434). The prevalence distribution differed strongly across waves (chi-square(2) = 259.99, p < .001, Cramer’s V = 0.49)
At the 4.5 threshold, the proportion increased sharply from 9.05% at S1-PRE (20/221) to 70.78% at S2-POST (310/438) but returned near baseline at follow-up (9.91%, 43/434). This shift was also large at the distribution level (chi-square(2) = 436.76, p < .001, Cramer’s V = 0.63). At a stricter threshold of 5.0, the same pattern was visible (0.00% at S1-PRE; 16.44% at S2-POST; 2.53% at S3-FU), (chi-square(2) = 82.82, p < .001, Cramer’s V = 0.28), reinforcing that the post-intervention surge in very high endorsement was only partially retained, as presented in
Figure 4.
Table 4 reports the proportions of students exceeding the selected ESV thresholds by wave, complementing the domain-score contrasts with a prevalence-oriented view.
Table 4 indicates that the proportion of students above the 4.0 threshold rises sharply at S2-POST and remains elevated at S3-FU, whereas the stricter 4.5 threshold shows a strong post-intervention surge that largely returns near baseline by follow-up. To clarify which aspects of ESV drive these shifts, the next section turns to item-level trajectories and contrasts.
4.4. Item-Level Patterns in ESV
Item-level analyses clarified which aspects of ESV were most responsive and which gains were retained over time. For each item, an omnibus Kruskal-Wallis test indicated between-wave differences (all p < .001). Dunn post hoc tests with Holm correction (Holm-adjusted within each 25-item family) showed that all items increased from S1-PRE to S2-POST and all items decreased from S2-POST to S3-FU (all p_Holm < .001). For the long-term contrast (S1-PRE vs S3-FU), 17 of 25 items remained significantly higher at follow-up; the eight items not significant after Holm adjustment were Q2, Q3, Q9, Q10, Q13, Q23, Q24, and Q25.
The largest immediate gains from S1-PRE to S2-POST were observed in Q7 (Delta = +1.25), Q17 (Delta = +1.24), Q6 (Delta = +1.22), Q15 (Delta = +1.19), and Q5 (Delta = +1.19). The largest declines from S2-POST to S3-FU were observed in Q23 (Delta = -0.77), Q3 (Delta = -0.70), Q17 (Delta = -0.68), Q25 (Delta = -0.67), and Q5 (Delta = -0.64). Despite this partial fade-out, 24 of 25 items remained at or above their baseline mean at follow-up. Only Q9 ended marginally below baseline (Delta = -0.03), and this difference was negligible and statistically non-significant. To visualize immediate responsiveness at the item level,
Figure 5 orders items by their mean gain from S1-PRE to S2-POST.
To support interpretation of item sensitivity, we examined item discrimination and wording-related characteristics. Corrected item-total correlations computed on the pooled sample ranged from approximately 0.31 (Q10) to 0.51 (Q6), with relatively higher correlations for items showing larger and more sustained gains (for example, Q6, Q7, Q12, Q15, Q16, and Q17) and lower correlations for items that showed weaker retention (notably Q9 and Q10, and to a lesser extent Q2). This convergence between longitudinal change patterns, wording characteristics, and item discrimination supports the interpretation that both item content and phrasing shape sensitivity to the situated, place-based learning fostered by the
Art Nouveau Path.
Table 5 summarizes the most salient item-level change patterns, including the largest immediate gains, the largest follow-up losses, and the items whose long-term differences are not robust after multiplicity control.
Table 5 highlights that immediate post-intervention gains are largest for a small subset of items, while follow-up losses are also concentrated in specific items, indicating heterogeneous responsiveness and retention across ESV facets.
To make the post-intervention decay more transparent,
Figure 6 reorders items by their mean loss from S2-POST to S3-FU (Delta S2–S3 = S3 minus S2), thereby highlighting which perceived competences were least stable over time. This visualization complements the S1–S2 gain-oriented ordering in
Figure 5 by focusing on retention rather than immediate responsiveness.
As presented in
Figure 6 and summarized in
Table 6, the steepest declines occurred for Q23, Q3, Q17, Q25, and Q5 (losses between -0.64 and -0.77 points), indicating that the strongest post-test endorsements were not uniformly sustained at follow-up. Conversely, the smallest S2–S3 decreases, and thus the best relative retention, were observed for Q12, Q21, Q10, Q1, and Q9 (losses between -0.25 and -0.41 points). Importantly, this does not imply that these items were unchanged over time, but rather that their post-intervention levels were comparatively more stable when students were asked, at follow-up, to report persistence since the activity.
Table 6 confirms that the steepest declines from S2-POST to S3-FU are concentrated in a subset of items, while other items show comparatively better retention. This motivates the subsequent triangulation that interprets item trajectories in relation to prompt modality and linguistic features.
4.5. Triangulation Between Item Discourse Features and S1-S2-S3 Trajectories
To contextualize the item-level trajectories, we triangulated longitudinal patterns (S1-PRE to S2-POST to S3-FU) with a discourse-oriented characterization of item prompts, focusing on verbal modality and linguistic complexity. Importantly, the response framing differs systematically by wave: S1-PRE used a habitual self-report stem (day-to-day orientation), S2-POST asked respondents to attribute change to the intervention (activity-based attribution), and S3-FU asked for persistence since the activity (practice-based persistence). This shift in stems provides a parsimonious measurement explanation for the typical pattern observed in the dataset, namely a pronounced increase at S2-POST followed by a partial decrease at S3-FU, consistent with recency and attribution effects at post-test and recalibration demands at follow-up.
Items also cluster meaningfully by prompt modality in a way that aligns with the GCQuest [
53] KSA’s framing. Prompts using knowing and awareness verbs (for example, “
to know”, “
to be aware”) were mapped to Knowledge (K), prompts using capability verbs (for example, “
to be able to”) were mapped to Skills (S), and prompts expressing disposition, concern, willingness, or affective stance (including empathy) were mapped to Attitudes (A). When trajectories were aggregated by these KSA categories, Skills and Knowledge items showed comparatively stronger retained gains from S1-PRE to S3-FU, whereas Attitudes items exhibited the sharpest correction at follow-up, consistent with S3-FU implicitly requiring evidence of sustained day-to-day enactment rather than immediate post-activity intention.
Finally, exploratory indicators suggest that item complexity and baseline anchoring shape responsiveness. Item length and word count were negatively associated with the immediate gain from S1-PRE to S2-POST (r approximately -0.45 and -0.32, respectively), indicating that more linguistically complex items tend to show smaller post-intervention inflation. Baseline item means were strongly negatively associated with change magnitudes (S1 mean versus Delta S1 to S2: r approximately -0.59; S1 mean versus Delta S1 to S3: r approximately -0.66), consistent with ceiling effects and reduced headroom for already highly endorsed items. The interpretation that observed item-level patterns reflect a combination of intervention-related change and systematic measurement properties linked to stem framing, modality, and linguistic complexity may by suggested by these findings.
Figure 7 visualizes the aggregated trajectories by KSA category.
The visualization of the aggregated trajectories by KSA category is complemented with numerical summaries in
Table 7.
Table 7 presents that aggregated deltas differ by KSA-oriented prompt modality, with S and K items exhibiting comparatively stronger retained gains than A items. This pattern supports the interpretive claims developed next in the Discussion regarding measurement framing, prompt modality, and differential retention across ESV dimensions.
5. Discussion
5.1. Summary of the Main Findings and Linkage to the RQ
This repeated cross-sectional trend study examined students’ self-perceived sustainability competences within the GreenComp competence area ESV across three questionnaire waves: baseline (S1-PRE), immediate post-intervention (S2-POST), and follow-up (S3-FU). As an exploratory, context-bounded evaluation under authentic school constraints, the study is designed to characterize cohort-level trends rather than within-student change. Overall, results indicate a pronounced increase from S1-PRE to S2-POST, followed by a partial decline at S3-FU, while remaining above baseline at the domain level. Consistent with RQ1, the ESV composite score showed a marked shift in distributional summaries (S1-PRE median = 3.60 [IQR 3.32-4.08], S2-POST median = 4.68 [IQR 4.44-4.88], S3-FU median = 4.12 [IQR 4.00-4.28]). Between-wave differences were supported by an omnibus Kruskal-Wallis test with a large effect (epsilon-squared = 0.391) and Holm-adjusted post hoc contrasts (all p < .001). Mean-based summaries were consistent (M = 3.70, 4.64, and 4.13 for S1-PRE, S2-POST, and S3-FU, respectively) and mean-based Welch comparisons (
Table 3) corroborated the same pattern as a sensitivity analysis.
Regarding RQ2, the competence-band indicators provide a complementary prevalence view of how endorsement shifts across waves. At the 4.0 threshold, the share of students meeting moderate-to-high endorsement increased sharply and remained elevated at follow-up, whereas at the more stringent 4.5 threshold, the post-intervention surge largely returned to near-baseline levels by S3-FU. These shifts were associated with large between-wave differences in prevalence (chi-square with Cramer’s V), but thresholds are interpreted as descriptive indicators rather than categorical evidence of achieved competence.
Finally, addressing RQ3, item-level trajectories show that the intervention’s influence was not uniform across the 25 items. The most durable gains were concentrated in statements that align closely with the game’s place-based narrative and the responsibility to care for concrete heritage places, while more abstract items showed weaker retention.
5.2. Summary of the Main Findings and Linkage to the RQ
The domain-level pattern suggests that a single, heritage-centered mobile AR experience can function as a strong catalyst for students’ perceived sustainability values, particularly in the immediate aftermath of the activity. The degree of the post-intervention shift is consistent with the idea that outdoor, collaborative, and narrative-driven tasks can activate value-oriented reflection by grounding sustainability in tangible, emotionally salient contexts. In the Art Nouveau Path, students are not only exposed to sustainability themes, but are also repeatedly invited to observe architectural details, interpret their cultural meaning, and connect these observations to wider issues of care, responsibility, and the consequences of decisions for shared environments.
At the same time, the partial decline at follow-up indicates that some of the immediate post-intervention uplift does not automatically consolidate into stable day-to-day self-perceptions. This fade-out is compatible with two non-exclusive interpretations. First, it may reflect genuine attenuation over time when learners do not encounter structured opportunities to revisit and apply the values activated during gameplay. Second, it may partly reflect measurement-related factors: the post-intervention wave explicitly attributes perceived change to the activity, whereas baseline and follow-up rely more on day-to-day practice framing. Accordingly, the domain-level trend should be interpreted as evidence of strong immediate activation with partial retention, rather than as definitive proof of sustained competence change in individuals.
5.3. Interpreting Competence Bands: What Shifts in High Endorsement Do and Do Not Imply?
The competence-band results refine the interpretation of the domain-level means by showing that different “levels” of endorsement behave differently over time. Using the descriptive 4.0 threshold, the proportion of students meeting moderate-to-high endorsement increased from 28.96% at S1-PRE to 88.58% at S2-POST and remained elevated at 75.12% at S3-FU. This suggests that the experience may have a durable influence on moving many students away from low-to-moderate positions toward more affirmative self-perceptions on ESV.
However, at the more stringent 4.5 threshold, the pattern is qualitatively different: the proportion rose from 9.05% (S1-PRE) to 70.78% (S2-POST) but returned to 9.91% at S3-FU, close to baseline. A similar pattern is visible at the 5.0 threshold (0.00% at S1-PRE; 16.44% at S2-POST; 2.53% at S3-FU). Together, these findings suggest that very high endorsement immediately after the activity is difficult to sustain without reinforcement. Importantly, this does not undermine the educational relevance of the intervention. Instead, it clarifies the likely mechanism: a single session can trigger strong short-term enthusiasm and confidence, while longer-term consolidation may require repeated engagement, explicit curricular integration, and opportunities to enact sustainability values beyond the game context.
Methodologically, these thresholds should be treated as descriptive indicators aimed to communicate prevalence and distributional shifts. These indicators are useful for interpretation and communication, but they should not be over-read as categorical evidence of “achieved competence”, especially given the ordinal nature of Likert-type data and the known information loss associated with binning.
5.4. Item-Level Insights and Implications for Game and Tasks Design
The item-level results indicate that the
Art Nouveau Path has a differentiated impact across the 25 ESV items. While all items increased immediately after the game and then decreased at follow-up, most items remained significantly above baseline at S3-FU (17 out of 25), indicating that retention was not limited to a single narrow aspect of the construct. At the same time, a small subset of items showed weaker long-term differences once multiplicity control was applied. After Holm adjustment, eight items did not show retained gains at follow-up (Q25, Q23, Q13, Q2, Q24, Q10, Q3, and Q9), returning to values statistically indistinguishable from baseline. This pattern suggests that some value statements were less likely to translate into sustained perceived competences after a single session. This retention pattern is summarized at item level in
Figure 8, which reports baseline to follow-up effect sizes and Holm-adjusted significance.
The strongest and most durable gains were concentrated in items that closely match what the game repeatedly foregrounds, namely caring for places, recognizing cultural and environmental limits, and linking values to decisions that affect shared environments and heritage. The largest baseline-to-follow-up gains were observed for Q7, Q12, Q16, and Q6, with similarly large retained effects for Q21 and Q18. These statements combine value-laden language with actionable or evaluative framing, which likely makes them more mappable to the situated experiences provided by the game. From a design perspective, this supports a clear implication: mobile AR heritage experiences may be most effective for sustainability values when they do more than present information. Accordingly, AR-based activities should be strengthened to require stance-taking, interpretation, and responsibility in relation to concrete places.
By contrast, items that are more abstract, conceptually dense, or dependent on specialized terminology, for example statements involving environmental justice, competing sustainability worldviews, or ontological claims about human–nature relations, showed smaller and less stable long-term shifts. This does not imply that these ideas are pedagogically unsuitable. Rather, it suggests they may require additional scaffolding to become durable, including pre-briefing of key concepts, structured post-game debriefing, classroom follow-up tasks, or explicit prompts that connect in-game heritage dilemmas to higher-abstraction formulations.
Finally, the discrimination pattern is consistent with this interpretation. Corrected item-total correlations ranged from approximately 0.31 to 0.51, with higher values for items that also exhibited larger and more sustained gains, notably Q6, Q7, Q12, Q15, Q16, and Q17. In contrast, Q9 and Q10, and to a lesser extent Q2, showed weaker retention.
Together, the convergence between longitudinal trajectories, wording demands, and item discrimination reinforces a practical conclusion for instrument use in mobile AR heritage contexts. Alignment with a competence framework, although valuable, is not sufficient on its own. Sensitivity to change also depends on how tightly each item’s phrasing connects to the actual learning experience and the kinds of judgements and actions that the activity genuinely affords.
6. Conclusions
6.1. Main Conclusions
Three main conclusions are presented:
- (1)
The post-intervention wave (S2-POST) presents a marked uplift in perceived sustainability values relative to baseline (S1-PRE), accompanied by a clear upward distributional shift and a higher prevalence of students in higher endorsement bands, with moderate-to-high endorsement showing clearer maintenance at follow-up (S3-FU) than very high endorsement. In substantive terms, a short, carefully designed, place-based mobile AR experience may make sustainability values salient and strengthen students’ value-oriented self-appraisals linked to care, responsibility, and stewardship in relation to built heritage and sustainability concepts;
- (2)
The trajectory indicates partial attenuation over time rather than a stable plateau. At follow-up (S3-FU), ESV scores decrease relative to the immediate post-intervention measurement (S2-POST) but remain clearly above baseline (s1-PRE) at the domain level. This pattern is consistent with a residual positive trace of the experience while suggesting that the highest levels of endorsement are difficult to maintain without reinforcement beyond the gameplay session;
- (3)
item-level trajectories indicate heterogeneous sensitivity within ESV. Items closely aligned with concrete, place-centered forms of care and responsibility show more robust retention, whereas more abstract or conceptually dense formulations show weaker long-term differentiation. Methodologically, this reinforces the value of reporting domain-level indicators alongside item-level patterns when evaluating competence-oriented ESD interventions in authentic, technology-mediated contexts;
6.2. Limitations
These main findings should be interpreted considering several limitations: (i) Outcomes rely on self-report. The GCQuest [
18], as a data collection tool, captures self-perceived values and dispositions that are conceptually relevant to ESV, but it does not directly measure behavioral change or observable sustainability action; (ii) The design is repeated cross-sectional rather than panel-based. Considering that responses were anonymous and class composition varied across waves, individual students could not be tracked. The analyses therefore describe cohort-level trends and do not support inference about within-student change or intra-individual variability; (iii) The wave-specific stems differ systematically in framing, which may contribute to between-wave differences. Baseline 8S1-PRE) emphasizes day-to-day orientation, the post-intervention (S2-POST) wave invites attribution to the activity, and follow-up (S3-FU) asks about persistence since participation. Part of the immediate uplift and subsequent attenuation may therefore reflect framing, recency, and reference-shift effects in addition to substantive change; (iv) The absence of a comparison group constrains attribution. Concurrent curriculum activities, school projects, or local heritage and sustainability initiatives may have influenced students’ perceptions between measurement moments, particularly between post-intervention (S2-POST) and follow-up (S3-FU); (v) Generalizability is context-bounded. This study was conducted in a single city using a specific Art Nouveau path and implementation model within the EduCITY DTLE. Transfer to other heritage typologies, age groups, or educational systems may require adaptation; (vi) Implementation took place under authentic in-the-wild conditions and collaborative gameplay arrangements, which introduce heterogeneity that cannot be fully modelled with the available data. Variation in contextual factors such as weather, crowding, and path logistics, together with peer explanation and teacher mediation during group gameplay, may have shaped both the experience and subsequent self-appraisals. These features strengthen ecological validity, but they complicate attribution and may contribute to variability in perceived competence shifts; (vii) The follow-up interval (S3-FU) provides only a limited window for interpreting durability. While the follow-up (S3-FU) wave supports assessing short-term maintenance of perceived competences, it is insufficient for claims about long-term retention and, in particular, for any inference about sustained behavioral change; and, (viii) Considering that the study prioritized data minimization, no socio-demographic profiling was collected, which prevents moderation analyses (for example, whether trajectories differ by background characteristics or prior interest). In addition, the threshold bands used in this paper should be interpreted as descriptive indicators of prevalence and distributional shift, not as categorical evidence of achieved competence.
6.3. Future Paths
The results motivate three complementary directions spanning method, pedagogy, and scaling.
Methodologically, future work should strengthen cross-source triangulation by linking repeated cross-sectional questionnaire trends to behavioral evidence already available in the project, including gameplay logs, spatial trajectories, and structured teacher observations, within a unified analytic framework. Where feasible, a hybrid design could retain anonymous cohort monitoring while adding a smaller consented panel subsample to estimate intra-individual change and to examine who sustains gains over time. Including comparison conditions, such as classes exposed to alternative heritage activities or standard instruction, would further strengthen interpretation.
Pedagogically, the observed partial attenuation supports implementing a structured program of follow-up activities to help sustain gains in perceived sustainability competences. A feasible model is a sequenced package combining preparation, reflection, and action: (i) Pre-game preparation (classroom, 45 to 60 minutes): building on the pre-activity already implemented with students, future iterations should systematize this phase as a structured briefing that introduces the local heritage context, frames sustainability value dilemmas, and sets a brief reflective prompt aligned with ESV; (ii) Immediate post-game consolidation (classroom, 30 to 45 minutes): guided debrief, small-group discussion anchored in specific points of interest, and a short reflective artefact (written or multimodal) connecting observations to responsibility and care. (iii) Short-term reinforcement (1 to 2 weeks): a micro-project in which groups adopt one visited point of interest, document its value and vulnerabilities, and propose one realistic preservation or sustainability-oriented action. (iv) Medium-term follow-up (4 to 8 weeks): a student-led dissemination or civic activity, such as a school exhibition, a digital story map, or a proposal shared with local stakeholders, accompanied by structured reflection on what was sustained in day-to-day choices.
This program is designed to convert post-intervention salience into repeated opportunities for value enactment, which is a plausible mechanism for stabilizing higher endorsement at follow-up.
Finally, future research should broaden the competence lens by replicating the longitudinal approach across additional GreenComp areas [
8] and testing how value trajectories relate to systems thinking, critical reflection, and envisioning sustainable futures. Replications in other heritage settings and cities would help distinguish robust design principles from those requiring local tailoring, strengthening the cumulative evidence base for heritage-based mobile AR in ESD.
Figure 1.
Study design and data collection timeline for the repeated cross-sectional longitudinal (trend) dataset (S1-PRE baseline, S2-POST immediately post-intervention, and S3-FU follow-up; analytic N presented).
Figure 1.
Study design and data collection timeline for the repeated cross-sectional longitudinal (trend) dataset (S1-PRE baseline, S2-POST immediately post-intervention, and S3-FU follow-up; analytic N presented).
Figure 2.
Study design and data collection timeline for the repeated cross-sectional longitudinal (trend) dataset (S1-PRE baseline, S2-POST immediately post-intervention, and S3-FU follow-up; analytic N presented).
Figure 2.
Study design and data collection timeline for the repeated cross-sectional longitudinal (trend) dataset (S1-PRE baseline, S2-POST immediately post-intervention, and S3-FU follow-up; analytic N presented).
Figure 3.
Distribution of ESV composite scores by wave. The plot highlights the post-intervention rightward shift at S2-POST and the partial attenuation at S3-FU.
Figure 3.
Distribution of ESV composite scores by wave. The plot highlights the post-intervention rightward shift at S2-POST and the partial attenuation at S3-FU.
Figure 4.
Proportion of students above pragmatic ESV thresholds (4.0, 4.5, 5.0) by wave. Thresholds are reported as descriptive prevalence indicators to complement distribution-aware score contrasts.
Figure 4.
Proportion of students above pragmatic ESV thresholds (4.0, 4.5, 5.0) by wave. Thresholds are reported as descriptive prevalence indicators to complement distribution-aware score contrasts.
Figure 5.
Item-level mean gains from S1-PRE to S2-POST (Delta S1 to S2), ordered by magnitude to highlight the most responsive ESV items immediately after gameplay.
Figure 5.
Item-level mean gains from S1-PRE to S2-POST (Delta S1 to S2), ordered by magnitude to highlight the most responsive ESV items immediately after gameplay.
Figure 6.
Item-level mean losses from S2-POST to S3-FU (Delta S2 to S3), ordered by magnitude to highlight which perceived gains show the weakest retention at follow-up.
Figure 6.
Item-level mean losses from S2-POST to S3-FU (Delta S2 to S3), ordered by magnitude to highlight which perceived gains show the weakest retention at follow-up.
Figure 7.
Aggregated trajectories by KSA prompt modality, reporting mean deltas across waves to support interpretive triangulation of item discourse features and longitudinal patterns.
Figure 7.
Aggregated trajectories by KSA prompt modality, reporting mean deltas across waves to support interpretive triangulation of item discourse features and longitudinal patterns.
Figure 8.
Item-level retention from baseline (S1-PRE) to follow-up (S3-FU) across the 25 ESV items. Points represent Hedges g for the S3-FU minus S1-PRE difference (positive values indicate higher follow-up scores), with horizontal 95% confidence intervals. Items are ordered by effect size. Filled circles indicate items with retained gains at follow-up (positive mean difference and Holm-adjusted Welch t-test p < .05), while crosses indicate items not retained after multiplicity control. Overall, 17 of 25 items showed retained gains at follow-up; the largest effects are observed for Q7, Q12, Q16, and Q6, with similarly large effects for Q21 and Q18. Items not retained include Q2, Q3, Q9, Q10, Q13, Q23, Q24, and Q25.
Table 1.
Data quality and internal consistency (ESV, 25 items).
Table 1.
Data quality and internal consistency (ESV, 25 items).
| Wave |
Raw Data
(N) |
Analytic Data
(N) |
Missing cells (Raw Data) |
Out-of-range |
Response range |
Cronbach’s alpha |
McDonald’s omega |
| S1-PRE |
221 |
221 |
0 |
0 |
1 to 6 |
0.72 |
0.72 |
| S2-POST |
439 |
438 |
7 |
0 |
1 to 6 |
0.88 |
0.88 |
| S3-FU |
434 |
434 |
0 |
0 |
1 to 6 |
0.75 |
0.76 |
Table 2.
ESV composite score descriptives (mean of Q1-Q25).
Table 2.
ESV composite score descriptives (mean of Q1-Q25).
| Wave |
N |
Mean |
Standard Deviation (SD) |
95% Confidence Interval (CI) |
| S1-PRE |
221 |
3.70 |
0.54 |
[3.63, 3.77] |
| S2-POST |
438 |
4.64 |
0.50 |
[4.59, 4.68] |
| S3-FU |
434 |
4.13 |
0.36 |
[4.09, 4.16] |
Table 3.
Sensitivity analysis: mean-based between-wave comparisons for ESV composite score.
Table 3.
Sensitivity analysis: mean-based between-wave comparisons for ESV composite score.
| Contrast |
Delta (Mean B - Mean A) |
95% CI (Delta) |
Welch t |
Degrees of Freedom (df) |
p (Holm) |
Hedges g |
S1-PRE
vs S2-POST
|
+0.93 |
[0.85, 1.02] |
-21.57 |
413.12 |
p < .001 |
+1.82 |
S2-POST
vs S3-FU
|
-0.51 |
[-0.57, -0.45] |
+17.26 |
798.23 |
p < .001 |
-1.17 |
S1-PRE
vs S3-FU
|
+0.43 |
[0.35, 0.50] |
-10.59 |
324.71 |
p < .001 |
+0.99 |
Table 4.
Proportions above thresholds (competence bands).
Table 4.
Proportions above thresholds (competence bands).
| Threshold |
S1-PRE (n/N) |
S2-POST (n/N) |
S3-FU (n/N) |
| ≥ 4.0 |
64/221 (28.96%) |
388/438 (88.58%) |
326/434 (75.12%) |
| ≥ 4.5 |
20/221 (9.05%) |
310/438 (70.78%) |
43/434 (9.91%) |
| ≥ 5.0 |
0/221 (0.00%) |
72/438 (16.44%) |
11/434 (2.53%) |
Table 5.
Item-level highlights (means and change patterns).
Table 5.
Item-level highlights (means and change patterns).
| Pattern |
Items |
Summary (Delta) |
Largest increases
S1-PRE to S2-POST
|
Q7, Q17, Q6, Q15, Q5 |
+1.25, +1.24, +1.22, +1.19, +1.19 |
Largest decreases
S2-POST to S3-FU
|
Q23, Q3, Q17, Q25, Q5 |
-0.77, -0.70, -0.68, -0.67, -0.64 |
Items not significant
S1-PRE vs S3-FU (Holm)
|
Q2, Q3, Q9, Q10, Q13,
Q23, Q24, Q25 |
Long-term differences not
robust after multiplicity control |
Table 6.
S2-POST to S3-FU loss highlights (
Figure 6 ordering support).
Table 6.
S2-POST to S3-FU loss highlights (
Figure 6 ordering support).
| Pattern |
Items |
Summary (Delta S2–S3 = S3 minus S2) |
Largest decreases
S2-POST to S3-FU
|
Q23, Q3, Q17, Q25, Q5 |
-0.77, -0.70, -0.68, -0.67, -0.64 |
| Smallest decreases S2-POST to S3-FU (best retention) |
Q12, Q21, Q10, Q1, Q9 |
-0.25, -0.29, -0.32, -0.35, -0.41 |
Table 7.
Trajectories by KSA prompt modality (mean deltas aggregated by item category).
Table 7.
Trajectories by KSA prompt modality (mean deltas aggregated by item category).
Item Category
(per KSA) |
Items (Q) |
n items |
Delta S1–S2 |
Delta S2–S3 |
Delta S1–S3 |
| Knowledge (K) |
Q4, Q10, Q16, Q21, Q24 |
5 |
0.85 |
-0.45 |
0.40 |
Skills
(S) |
Q2, Q3, Q6, Q7, Q8, Q12, Q14, Q15, Q18, Q19,
Q20, Q22, Q23 |
13 |
0.98 |
-0.51 |
0.47 |
Attitudes
(A) |
Q1, Q5, Q9, Q11, Q13,
Q17, Q25 |
7 |
0.91 |
-0.55 |
0.36 |