
Submitted:
06 May 2025
Posted:
07 May 2025
You are already at the latest version
Abstract
This study explores the potential of mobile augmented reality games (MARG) in promoting sustainability competencies within the context of a smart learning city environment. Anchored in the [removed] project, which integrates location-based AR-enhanced games into an interactive mobile app, the research investigates how these tools support Education for Sustainable Development (ESD). Employing a mixed-methods approach, data were collected through the [name of questionnaire] and anonymous gameplay logs generated by the app. Thematic analysis of 358 responses revealed four key learning domains: cultural awareness, environmental protection, sustainability awareness, and contextual knowledge. Quantitative performance data highlighted substantial variation across games, with the highest performance found in those with more frequent AR integration and multiple iterative refinements. Participants engaging with AR-enhanced features (optional) outperformed others. The findings provide empirical evidence for the use of MARGs to cultivate sustainability-related knowledge, skills, and attitudes, particularly when grounded in local realities and enhanced through thoughtful design. Beyond the [removed] project, the study proposes a replicable model for assessing sustainability competencies, with implications for broader integration of AR across educational contexts in ESD. The paper concludes with a critical reflection on methodological limitations and suggests future directions, including adapting the [name of questionnaire] for use with younger learners in primary education.
Keywords:
Mobile learning
; game-based learning
; augmented reality
; contextualized learning
; smart city
; learning environment
; [project’s name]
; education for sustainability
; sustainability competencies
; mixed-methods study
1. Introduction
Rapid technological progress and globalisation bring new challenges, increasing complexity, uncertainty, and environmental degradation (Rieckmann, 2018). Although cities cover just 3% of Earth's surface, they consume 75% of resources and generate 70% of greenhouse gas emissions, threatening sustainability [1]. Citizens need sustainability competencies to navigate complex challenges responsibly [2,3,4], considering environmental, economic, and social dimensions [5].
Education for Sustainable Development (ESD) empowers learners to make responsible decisions for environmental integrity [2]. Effective approaches should emphasise interactive, values-based, and transformative learning. Gheorghe et al. [6] highlight interactive teaching and technology’s role in fostering active learning and sustainable behaviour. Huang et al. [7] propose a Values-Based ESD framework to develop change-leaders. Macagno et al. [8] demonstrate that combining transformative learning with design thinking enhances student engagement and sustainability mindsets. These examples stress the need for action-oriented pedagogy, integrating participation, collaboration, real-world problem-solving, and interdisciplinary learning.
Mobile devices, a ubiquitous technology, can support action-oriented pedagogy by enabling seamless transitions between learning contexts [9]. Augmented reality (AR) enhanced environments bridge theory and practice, linking knowledge with real-world challenges [10] and influence attitudes towards sustainability [11]. Mobile augmented reality games (MARG), both in and out of school, promote peer scaffolding and collaborative discourse, crucial for social learning [12]. Integrating MARG into sustainability education fosters experiential, interactive learning [13], contextualising sustainability concepts while developing competencies like anticipatory thinking and strategic action [10,14]. Mobile devices facilitate game-based learning, proven effective in sustainability education [7,15,16,17].
Games, when combined with AR, provide an immersive interface [18] that integrates digital information into physical spaces, supporting situated learning [11,19]. This aligns with smart city concepts, enhancing urban sustainability through technology.
The European competence framework for Sustainability (GreenComp) promotes competencies for tackling global challenges, such as climate change, biodiversity loss, and social inequity [20]. It emphasises systems thinking, critical reflection, and collective problem-solving, aligning with the Sustainable Development Goals [5].
The [removed] project [project webpage] promotes sustainable cities through a smart learning environment. It features a mobile application integrating location-based games that use AR, environmental sensor data, 3D animations, and educational resources along urban paths.
The web platform enables citizens to create games without requiring programming skills, following a socio-constructivist approach [21]. This pedagogy harnesses mobile technology to facilitate hands-on learning, enhancing environmental awareness and transforming cities into living laboratories within a citizen science framework.
With a focus on developing sustainability competencies, the project encourages interdisciplinary, real-world learning. It raises awareness of urban heritage and sustainable development, positioning itself as a benchmark in Education for Sustainable Development (ESD). By treating urban spaces as experimental laboratories, it fosters participatory learning aligned with the Open School movement [22].
Aligned with the 2030 Agenda’s Goal 11 – Sustainable Cities and Communities – the initiative advances the concept of a smart learning city environment through an interactive mobile app and game-creation platform. Its action-oriented pedagogy cultivates sustainability competencies by leveraging smart technology and MARG, extending learning beyond the classroom [23]. The model is replicable across cities, challenging traditional education approaches [24] and encouraging sustainable urban habits.
[Project’s name] research question is: How does a smart learning city environment – integrating a mobile app with co-created AR-enhanced games – promote changes in citizens’ knowledge, skills, values, and attitudes for sustainability? [25]. The study evaluates MARG impact on sustainability education through participants’ perceptions of [project’s name] activities effectiveness. A mixed-method approach combines self-administered questionnaires with automated game data analysis. Subjective data is triangulated with game log data, increasing validity.
This paper continues with a description of the materials and methods, structured into three subsections: ‘[Project’s name] Activities and Participants’, ‘Data Collection’, and ‘Data Analysis’. It then presents the main results and discussion, addressing participants' perceptions of [project’s name] contribution to Education for Sustainability, triangulated with the game logs. The paper concludes with the key findings, the study limitations and future research directions.
2. Materials and Methods
Mixed-method research approaches [26] are known for combining qualitative and quantitative elements, in a robust and balanced methodological design to achieve a level of understanding and corroboration that would not be possible through either approach on its own.
Accordingly, a mixed-methods approach is employed to evaluate the value of the [project’s name] activity in promoting the ‘Embodying Sustainability Values’ area of the GreenComp competency framework [20]. Thus, this option positions this study within European policy priorities for sustainability education.
This section presents, firstly, the [project’s name] activities and participants; secondly, the data collection process; and thirdly, the data analysis method.
2.1. [Project’s Name] Activities and Participants
Data collection was conducted through gameplaying activities with students of different academic levels, and teachers. These activities took place over one year, from February 2024 to February 2025, in different locations in the [city] urban area.
In each [project’s name] activity, the project is presented to the students, as well as the game's objectives and instructions on how to use the [project’s name] app. Subsequently, the students are divided into groups, with 3 to 4 members, using [project’s name] mobile phones, one per group.
The gameplaying activities analysed in this work are directed to participants from 10 years-old to adults, from the 2nd Cycle of Basic Education (CBE) to Higher Education educational contexts. The present study focuses on the games developed by the [project’s name] project team, and excludes those developed by teachers in continuous training, undergraduate and master's students. Thus, the considered games are ‘Visit to the salt pans’, ‘[Project’s name] at the [University] Campus’, ‘[City], cidade de Arte Nova e Liberdade’ [[City], city of Art Nouveau and Liberty], ‘Art Nouveau Path: from heritage to sustainability’, and ‘[City] walking tour’. At the end of each activity, games scores are collected, thus, the three highest-scoring groups are awarded small prizes, and the remaining receive a participation gift, enhancing motivation.
Table 1 presents the number of activities (15 in total) and participants (374 in total), per school level, suggesting a substantial level of engagement and a diversity of involved school levels. This reveals an effort to tailor educational interventions to different age groups, ensuring relevance and effectiveness, in accordance with the literature recommendations [27]. No demographic data on the participants was collected in compliance with personal data protection regulations.
2.2. Data Collection
The data collection process comprised: a) the administration of a questionnaire, and b) the gathering of automatic and anonymous game logs.
At the end of the gameplaying activity, each participant was invited to complete the anonymous questionnaire ‘[questionnaire’s name]’ [28], developed by the [project’s name] team, as described in Ferreira-Santos and colleagues [29]. This data collection process was approved by the institutional General Data Protection Regulation (GDPR) board.
The ‘[questionnaire’s name]’ was developed with the objective of providing a valuable contribution to answer the formulated research question. It was designed to offer sufficient scope to be used in research or studies emerging from the [project’s name] approach, or even to be applicable in other research contexts, as explained by [29]. The questionnaire aims to evaluate the perceptions about the [project’s name] activities on Education for Sustainability.
The ‘[questionnaire’s name]’ comprises two open-ended questions and one Likert scale question with 25 statements, where 1 corresponds to 'disagree' and 6 to 'agree'. The open-ended questions complement the quantitative data, as the first question was designed to identify the key learning outcomes of the game, and the second one was designed to evaluate the participants’ understanding of the sustainability concept. The Likert scale question was designed to analyse and evaluate three dimensions, corresponding to the following GreenComp competencies: ‘Valuing Sustainability’, ‘Supporting fairness’, and ‘Promoting nature’. Each dimension is further structured in Knowledge, Skills, and Attitudes (KSA). The questionnaire is fully available in English and in [removed] languages [28,30]. This questionnaire was applied in all educational levels.
The questionnaire dataset is available in Zenodo (removed for blind review).
The app includes automated mechanisms for generating game logs. The game logs included three variables: final score; AR score (points associated with AR questions); and number of questions answered correctly and incorrectly. Data was collected by the app and anonymously uploaded to the [project’s name] web platform, ensuring user privacy while still enabling data analysis. This provides measurable indicators of user engagement and information interpretation, enabling the evaluation of the [project’s name] games effectiveness in achieving their educational goals. By leveraging this gameplay data, it is possible to identify trends, such as performance variance in longitudinal studies or difficult questions that can inform game improvements.
All data collection, processing, and storage procedures were conducted in accordance with the principles of research ethics. For example, participants completed the questionnaire voluntarily, after playing the selected game. Chen [13] employed a comparable methodology, which reveals effectiveness in sustaining student motivation and enhancing data quality, as evidenced by a lower incidence of incomplete or invalid questionnaire responses.
2.3. Data Analysis
Although 374 participants engaged in the [project’s name] activities, not all opted to complete the voluntary questionnaire. A total of 368 responses were collected. Of these, 11 questionnaires were excluded from the analysis due to incomplete or invalid responses, yielding 358 validated questionnaires. This corresponds to a validated response rate of approximately 95.70%, which is considered high for voluntary survey-based research [33].
As the open-ended questions were designed to explore the content students identified as having been learned through the [project’s name] activity, a qualitative thematic analysis was undertaken to identify key themes and present illustrative quotations from participants’ responses. The unit of analysis was the main themes identified in the answers. The coding process was informed by a reflexive thematic analysis approach [31], integrating inductive and deductive logic. In the first one, regarding question 1, about respondents’ acknowledged learning, coding was grounded in a close interpretation of data, being the themes and subthemes generated from participants' responses and then iteratively organised into broader patterns of meaning. In the deductive approach, themes were based on the GreenComp framework [20], which offers a validated definition of sustainability. No sampling was performed; therefore, all validated responses were included to ensure a comprehensive and inclusive analysis. All units of analysis were included into mutually exclusive subthemes.
The Likert-scale question was submitted to descriptive statistics of frequencies and analysed with the ‘[Questionnaire’s name] Analysis Tool’ [34]. After inputting data, the tool presents a color-coded graph with all the questionnaire statements, offering a global perspective on the dataset and supporting the identification of patterns in respondents’ answers. Analysis includes the possibility of applying filters on specific competencies (Valuing sustainability, Supporting fairness, and/or Promoting nature) and domains (KSA).
The game logs were submitted to descriptive statistics, regarding average, standard deviation and range of the game final scores, game AR scores, as well as correct and incorrect answers. Playtime was excluded from the analysis due to its irrelevance to the study's primary research objectives. Furthermore, game duration is not necessarily indicative of performance, since participants may complete the activity quickly without correctly answering questions or fully engaging with the educational resources available, such as AR content, 3D models, images, or supplementary information. Consequently, playtime data was not included in the scope of this study.
Finally, the questionnaire and app log data were triangulated to provide a more comprehensive understanding of the [project’s name] activity ability to promote changes in knowledge, skills, values, and attitudes in citizens to empower them towards sustainability. The analysis results and discussion are presented in the following section.
3. Results and Discussion
This section reports the study main results and their discussion considering the consulted literature.
3.1. Participants’ Perception About [Project’s Name] Activities Contribution to Education for Sustainability
The results presented in this section were based in data collected with the [questionnaire’s name] [28] from 358 respondents. The initial question of the questionnaire required participants to identify two or three insights learned with the game, as detailed in Table 2. A total of 511 units of analysis were analysed.
Four overarching themes emerged from the analysis: ‘Cultural awareness’, ‘Environmental protection’, ‘Sustainability awareness’, and ‘Contextual knowledge’. Each theme comprises specific subthemes grounded not only in GreenComp (Bianchi et al., 2022), but also in an inductive process based on participants’ responses and in the educational aims of the [project’s name] activities.
‘Cultural awareness’ was the most prominent theme, encompassing 59.49% coded units, overwhelmingly dominating participant responses. Within this theme, ‘local culture’ is the only subtheme identified. This outcome resonates with Baumber’s [35] emphasis on integrating learners’ lived experiences and socio-cultural contexts into sustainability education. Baumber conceptualizes such contexts as 'real-world labs’, capable of fostering transformative learning by anchoring content in local realities.
‘Environmental protection’ included 15.46 % of responses, distributed across five subthemes: ‘Waste management’ (5.68%), ‘Natural resources management’ (3.91%), ‘Biodiversity preservation’ (3.33%), ‘Environment/nature’ references (1.76%), and mentions of ‘Local natural resources’ such as salt (0.78%). These subthemes reflect varying degrees of participant engagement with environmental sustainability competencies.
In contrast, ‘Sustainability Awareness’ accounted for the fewest references (3.52%), with participants primarily identifying elements of ‘Concept knowledge information’ (2.15%) and ‘Sustainability values’ (1.37%). Although this low frequency may suggest a limited perceived impact of the game on values-related learning, it could also imply that participants already felt aligned with sustainability values. This interpretation is supported by Alkaher et al. [36], who argue that cultural backgrounds can shape learners’ self-perceptions regarding sustainability, often embedding these values implicitly through daily practices and societal norms.
Lastly, ‘Contextual knowledge’ theme included a single subtheme, the ‘Specific knowledge information’, with 21% of the units coded. These responses suggest that [project’s name] gameplay activities may foster context-specific or disciplinary knowledge. As Oliveira et al. [37]point out, gamification strategies can yield broader educational benefits, promoting diverse cognitive and behavioural outcomes that extend beyond initial learning goals.
This analysis revealed meaningful learning across four thematic areas: Cultural Awareness, Environmental Protection, Sustainability Awareness, and Contextual Knowledge. The predominance of local cultural insights highlights the power of place-based, context-rich experiences in sustainability education. Although references to values were less frequent, the findings suggest that participants may already embody sustainability principles shaped by their cultural context. Moreover, the acknowledgement of learning knowledge not explicitly related to sustainability points to the broader educational potential of gamified learning environments like [project’s name].
The second question required participants to express their own understanding of Sustainability, as detailed in Table 3. It was possible to include the 392 units of analysis, identified in the responses to this question, in the three themes selected from the GreenComp [20]: ‘Values and behaviours’, ‘Present actions’, and ‘Future thinking’. The most frequently cited subtheme, ‘Responsible use of resources’ (23,79%), reflects an awareness of humanity's integral role within Nature and the necessity of conserving resources. This emphasis is consistent with GreenComp's competence of 'Promoting Nature’, which underscores the importance of recognizing humans as part of Nature and respecting the rights of other species to restore resilient ecosystems.
Similarly, ‘Environmental preservation’ (23,27%), on the theme of ‘Present actions’, emerged as a key concern, with participants highlighting personal responsibility and proactive measures towards a healthier planet. This finding aligns with the ‘Individual Initiative’ competence in GreenComp, which encourages individuals to actively contribute to sustainability efforts.
The theme of ‘Future thinking’ was also prominent, with its single subtheme of ‘Intergenerational equity’ (21,74%). This resonates with GreenComp's ‘Futures Literacy’ competence, which involves imagining and developing alternative sustainable future scenarios.
In contrast, fewer responses referenced ‘Sustainable lifestyle’ (6,14%) or ‘Sustainable values’ (2,30%), suggesting that more abstract or reflective aspects of sustainability may be less commonly articulated among participants. This observation is notable, as it may indicate a gap in the integration of sustainability values into personal and collective worldviews, an area identified as crucial in sustainability education.
It is noteworthy that a significant proportion of the responses (22,76%) did not provide an explicit definition of sustainability, indicating either ambiguity in understanding of the concept or divergence from the conceptual framework adopted by this paper authors. This underscores the ongoing challenge in sustainability education to foster a comprehensive and universally understood set of competences.
The third question of the questionnaire comprised 25 statements, subdivided into three GreenComp competences: a) ‘Valuing Sustainability’; b) ‘Supporting fairness’; and c) ‘Promoting nature’. Graphs were created with the [questionnnaire’s name] Analysis Tool [34], as is the case with graph in Figure 1. As a pair Lickert scale was used, it does not include a neutral midpoint. Consequently, the responses provided can be classified as either positive or negative, with values between 1 and 3 being interpreted as negative perception (red to yellow colours) and those between 4 and 6 as positive (light to dark green).
Statements: S01 "… be prone to act in line with values and principles for sustainability.", S02 "… articulate and negotiate sustainability values, principles and objectives while recognising different viewpoints, while recognizing different points of view.", S03 "… identify processes or action that avoid or reduce the use of natural resources.", S04 "… know that damaging and exhausting natural resources can lead to disasters and conflicts (e.g. loss of biodiversity, draughts, mass migration and war).", S05 "… show empathy with all life forms.", S06 "… evaluate issues and action based on sustainability values and principles.", S07 "… be able to acknowledge cultural diversity within planetary limits.", S08 "… be able to apply equity and justice for current and future generations as criteria for environmental preservation and the use of natural resources.", S09 "… know about environmental justice, namely considering the interests and capabilities of other species and environmental ecosystems.", S10 "… know the main views on sustainability: anthropocentrism (human-centric), technocentrism (technological solutions to ecological problems) and ecocentrism (nature-centred), and how they influence assumptions and arguments.", S11 "… be committed to decreasing material consumption.", S12 "… be able to bring personal choices and action in line with sustainability values and principles.", S13 "… be willing to share and clarify views on sustainability values.", S14 "… be able to find opportunities to spend time in nature and helps to restore it.", S15 "… be able to see and imagine humans living together and respecting other life forms.", S16 "… know that values and principles influence action that can damage, does not harm, restores or regenerates the environment.", S18 "… care about a harmonious relationship existing between nature and humans.", S19 "… respect, understand, and appreciate various cultures in relation to sustainability, including minority cultures, local and indigenous (from a region) traditions and knowledge systems.", S20 "… be able to assess and question personal needs to carefully manage resources in the pursuit of longer-term goals and common interests.", S21 "… be able to assess own impact on nature and consider the protection of nature an essential task for every individual.", S22 "… know that individuals and communities differ in how and how much they can promote sustainability., S23 "… be able to help build consensus on sustainability in an inclusive manner.", S24 "… be able to identify and include values of communities, including minorities, in problem framing and decision making on sustainability.", S24 "… know that people are part of nature and that the divide between human and ecological systems is arbitrary.", S25 "… be ready to critique and value various cultural contexts depending on their impact on sustainability."
Graph 1 provides a global perspective on the collected data, revealing predominant trends and patterns. More specifically, respondents tended to agree with the questionnaire statements, as evidenced by the predominance of green colors in each statement, varying between 70,9% (from 358 respondents) for S10, about the main views on sustainability and how they influence assumptions and arguments, and 91,3% for S07, about acknowledging cultural diversity within planetary limits. Moreover, all the statements gathered at least 18,2% of answers (S02) in the 6th option of the scale (higher intensity of agreement), up to a maximum of about 39,6% (S05). In contrast, at the other extreme of the scale, the stronger red colour (higher intensity of disagreement) varied between 0,27% (S20, about the dilemma of fulfilling personal needs vs. resources management) and 2,51% (S10 and S13), about wiliness to share and clarify sustainability values). In sum, the results presented in Figure 1 indicate that participants have an overall similar perception of the [project’s name] activity they experienced, and also that they perceive that this activity supports the development of the competency area ‘Embodying Sustainability Values’.
In the ‘Dynamic Tables and Graphs’ worksheet of the [questionnaire’s name] analysis tool, applying the filter to the KSA typologies produces the next set of graphs. Graph in Figure 2 corresponds to the analysis of the ‘Knowledge’ typology, graph in Figure 3 corresponds to the analysis of the ‘Skills’ typology and graph in Figure 4 corresponds to the analysis of the ‘Attitudes’ typology.
Figure 2 offers a detailed perspective on participants' knowledge-related responses, showcasing general patterns of agreement across selected statements. A clear tendency toward agreement is visible, with green tones (categories 5 and 6) prevailing in each of the statements shown. Notably, statement S16, which refers to values and principles regarding the environment, stands out with 87.70% of agreeing responses, highlighting a strong consensus on this conceptual aspect of sustainability.
Statement S10, on the other hand, presents the lowest rate of agreement within this graph (70.9%), relating to the understanding of how sustainability views influence assumptions and arguments. This statement also gathers a higher proportion of responses in the disagreement categories, indicating a slightly more varied level of knowledge or confidence in this item. This observation is in line with previous findings in Figure 1, where S10 also demonstrated a comparatively lower agreement rate.
Other notable case is S04, with only 0.56% of participants selecting the extreme end of disagreement, considering that the [project’s name] activity contributes to knowledge about the consequences of damaging and exhausting natural resources, thus further reinforcing the overall tendency towards agreement across all items.
Graph in Figure 3 illustrates the distribution of responses regarding the skills-related statements, also highlighting consistent agreement across all items. Again, the dominance of green tones across all statements suggests a strong alignment with the skill-based dimensions of the [project’s name] activities. In particular, statement S07, focused on acknowledging cultural diversity within planetary boundaries, stands out with 91.30% responses falling into the highest agreement categories, demonstrating the participants’ perception regarding strong commitment to inclusive sustainability values in cultural diversity.
Statement S12 related to personal choices and action in line with sustainability values and principles, and S19, related to respecting, understanding, and valuing diverse cultures, where the two with the lowest levels of agreement, but both still revealing positive perceptions (82.40% each).
As in previous graphs, disagreement remains marginal, with, for example, S03 showing only 0.56% of responses in darker red.
Graph in Figure 4 provides a focused view on the distribution of attitudes towards specific statements, highlighting key patterns among participant responses. Overall, as the previous analysis, there is a strong tendency towards agreement. Notably, the statements S05 regarding empathy with all life forms, stand out, with 90.5% of agreement, with the 5th or 6th option on the scale, which correspond to higher levels of agreement.
In contrast, the statements S01 and S11, besides presenting the lowest range of positive level of agreement, present a very high score, with 84.90% of agreement. This echoes the overall trend in the dataset, where disagreement remains consistently low across statements, and is particularly minimal in items related to personal sustainability perception on values and ethical reasoning.
In summary, the response patterns across Figure 2, Figure 3 and Figure 4 indicate that the [project’s name] activities effectively promotes sustainability-related knowledge, skills, and attitudes, in coherence with Figure 1. Additionally, the activities foster practical, collaborative, and reflective skills, reinforcing the GreenComp area ‘Embodying Sustainability Values’.
3.2. Game Logs: Educational Value
Table 4 displays the game log data of completed games that were successfully uploaded to the [project’s name] web platform. This allows collecting an indicator of the educational value of the [project’s name] app in relation to sustainability promotion. Each game log corresponds to the activity of a group of participants (typically with 3 to 4 members), who engaged collaboratively in gameplay. Between 5 and 59 logs were collected, providing data for subsequent analysis. The data pertaining to the final score, AR score, and the number of correct and incorrect answers are automatically generated by the mobile devices and uploaded to the project web platform upon game completion. The data are anonymous and accessed only by the project team.
Table 4 presents the app game logs, organised according to the game played. Since each game included a different number of questions and corresponding maximum scores, the results are presented as percentages, to ensure comparability across games. Final scores therefore represent the proportion of correct answers relative to the maximum possible score for each game. Higher percentages indicate stronger educational achievement. To perform successfully, teams were required to observe their surroundings, consult the educational resources embedded in the app, critically evaluate alternative solutions to the challenges posed, and collaboratively negotiate their responses.
Participants achieved the highest average performance in the game ‘[city], City of Art Nouveau and Liberty’, with a mean score of 86.40%, ranging from 75.30% to 90.90%, and a notably low standard deviation (SD = 5.35). This suggests a high degree of consistency in learning outcomes across participant groups, indicating that the game may have been particularly effective in supporting educational engagement and comprehension. The strong performance may be attributed to the clear pedagogical alignment between game tasks and intended learning outcomes, the intuitive structure of the game, and the relevance of the content.
Similarly, the game ‘Path of Art Nouveau: From Heritage to Sustainability’ yielded a high average score of 83.30%, though with the widest range in group performance (33.33% to 100.00%) and the highest standard deviation (SD = 29.77). This variation suggests differentiated levels of achievement, likely reflecting the heterogeneity of the participant profile. As shown in Table 1, participants in this game ranged from the 3CBE to Higher Education, introducing a broad spectrum of prior knowledge, cognitive development, and collaborative experience. While some groups were able to achieve higher performance, possibly older or more experienced participants, others may have struggled to extract relevant information from the digital and physical components of the game.
Additionally, the [project’s name] web platform recorded a markedly lower number of logs for ‘[city], City of Art Nouveau and Liberty' (5 logs) compared to 'Path of Art Nouveau: From Heritage to Sustainability' (59 logs). This substantial discrepancy in log volume of game logs may have contributed to the observed consistency in the former, while the higher number and more diverse background of participants in the latter may explain the wider variability in performance.
In contrast, the lowest average performance was observed in the game ‘Visit to the Salt Pan’, with a mean score of 64.29%, ranging from 50.00% to 71.40%, and a similarly low standard deviation (SD = 5.34). Although the narrow score range indicates consistent performance among groups, the overall lower scores suggest that this game may present challenges in terms of its educational effectiveness. Several factors could account for this result. First, the cognitive demands of the tasks, the clarity of the instructions and the available resources may not have been adequately calibrated to the participants’ prior knowledge or learning needs. This hypothesis aligns with literature indicating that task complexity and misalignment with prior knowledge can negatively affect learning outcomes [38]. Second, environmental and contextual factors during gameplay may have influenced participants' levels of engagement and overall performance. Notably, this game was implemented during a single event and under adverse weather conditions, specifically during rainfall. Such less favourable circumstances may have hindered participants' ability to concentrate, interact with their surroundings, and collaborate effectively. These findings align with research in mobile learning, which highlights the critical influence of physical context on learners' cognitive engagement and the quality of the learning experience [39].
For the AR Score, that is, the score achieved on questions associated with AR content (although with optional use), the highest performing game was ‘[project’s name] on [University] Campus’. This game reached an average AR score of 86.84%, with values ranging from 4.17% to 100.00% and a high standard deviation (SD = 21.95). This high variability, especially in contrast with the game average final score (76.70%), suggests differing levels of participant engagement with the AR features. The fact that the AR score exceeds the final score (86.84% vs 76.70%) indicates that users who explored the AR content tended to perform better overall. Notably, this game underwent more refinement cycles by the [project’s name] team, which may explain both the improved AR outcomes and the wider performance variability, possibly reflecting increased interactivity, depth of content, or complexity introduced in the later versions.
Conversely, the lowest AR performance was recorded in ‘Visit to the Salt Pan’, with an average of 56.25% and a broad range from 0.00% to 100.00% and low standard deviation (SD= 3.20). This game included only one AR-enhanced question due to environmental constraints in placing durable AR markers in the salt pan context. The limited integration of AR elements likely contributed to the lower scores and diminished potential for engagement.
These findings highlight marked differences between final and AR-specific scores. While final scores tend to show more consistency across groups, AR scores exhibit greater dispersion, pointing to varying degrees of exploration and engagement with AR features. This suggests that while AR can enhance performance when explored, its impact is dependent on both the quality of integration and user uptake. Importantly, all games achieved a positive average performance, aligning with questionnaire data that also pointed to [project’s name]’s contribution to promoting sustainability learning through game-based experiences.
4. Conclusions
This study explored the pedagogical potential of MARG within the [project’s name] project, which aims to promote Education for Sustainability in urban environments. Drawing upon a mixed-methods design that combined self-reported data from a validated questionnaire ([questionnaire’s name]) with automated game logs, the findings reveal that the [project’s name] activities are effective in fostering sustainability-related competencies, particularly in the area of ‘Embodying Sustainability Values’ as conceptualised by the GreenComp framework [20].
The results demonstrate that participants, spanning a wide range of educational levels, engaged meaningfully with the content and context of the [project’s name] games. The thematic analysis of open-ended questionnaire responses indicated the emergence of learning across four principal domains: ‘Cultural awareness’, ‘Environmental protection’, ‘Sustainability awareness’, and ‘Contextual knowledge’. The predominance of references to local heritage and environmental practices suggests that location-based AR games can effectively situate learning in meaningful real-world contexts, reinforcing the value of experiential and transformative pedagogies in sustainability education [8,35].
Moreover, the questionnaire results confirms that respondents consider that MARG can promote not only cognitive understanding (e.g., knowledge of local culture and environmental protection) but also affective and behavioural dimensions—such as values alignment and intention to act, in coherence with the GreenComp [20]. This reinforces the importance of using pedagogical models that move beyond knowledge transmission to include socio-emotional and ethical learning [4,5].
Participants' emphasis on local culture and contextually grounded environmental knowledge illustrates how learning becomes more meaningful when it is rooted in learners’ lived realities. This supports the argument for place-based sustainability education [35], where physical environments act as ‘living laboratories’ for real-world problem-solving and civic engagement. Moreover, the educational content covered in the games, ranging from biodiversity to architecture and cultural identity, demonstrates the potential for cross-subjects learning.
Game log analysis further supported these insights, providing quantitative indicators of performance and engagement. Notably, games with a stronger alignment between game tasks and intended learning outcomes, such as ‘[city], City of Art Nouveau and Liberty', achieved both high average scores and low performance variability, indicating robust learning outcomes. Conversely, games like 'Visit to the Salt Pan' with fewer AR questions and less favourable environmental conditions during gameplay, demonstrated lower performance levels, underscoring the importance of both content design and contextual variables in situated learning experiences [38,39].
Furthermore, the variability in AR-specific scores across games highlights both the opportunities and challenges of AR integration. While participants who engaged with AR content tended to achieve higher overall scores, suggesting the added pedagogical value of immersive digital media, not all learners decided to interact with these features. This variability points to the need for deeper consideration of user experience design, AR marker feasibility in natural outdoor settings, and instructional scaffolding to ensure effective engagement [10,19].
From the above considerations, ultimately, the study affirms [project’s name] role in advancing sustainability education within smart learning city environments. More specifically, this smart learning city environment, integrating a mobile app with AR-enhanced games, seems to effectively promote changes in citizens’ knowledge, skills, values, and attitudes towards sustainability. The findings indicate that [project’s name] activities foster a deeper understanding of sustainability concepts, particularly in areas such as environmental protection, cultural awareness, and responsible resource use.
This paper presents a contribution to the existing literature on mobile game-based AR learning. It includes empirical evidence regarding the effectiveness of integrating new technologies to promote students' learning. It also bears the report of some examples of excellent cross-subjects educational materials, the learning games, that comprises a very useful tool for teachers and students to explore scientific knowledge by accessing appealing in city centre and [University] Campus. These games can be accessed via the [project’s name] app.
4.1. Limitations of the Study and Future Research
Despite the promising results, several limitations should be acknowledged. The study design relied on single-session activities, limiting insights into the long-term impact of the [project’s name] approach on knowledge retention or behaviour change. Additionally, participation in AR experiences was optional, resulting in varied engagement that may have influenced both performance and perception data. These limitations constrain the generalisability of the findings and highlight the need for future longitudinal and comparative studies that can assess the sustained effects of AR-enhanced game-based learning.
Another limitation relates to the absence of demographic data due to ethical and privacy considerations, which restricts more nuanced analysis of participant profiles and their relation to learning outcomes. Moreover, while the [questionnaire’s name] demonstrated reliability and validity in capturing perceptions aligned with GreenComp competencies in earlier study [29], its applicability to younger learners (e.g., in primary education) remains limited.
Future research will therefore focus on adapting the [questionnaire’s name] to better serve primary education contexts. Improvements to the app’s usability, accessibility, and visual appeal may enhance learner engagement across diverse user groups.
Ultimately, this study affirms the value of integrating mobile technology and AR into game-based learning environments to cultivate sustainability competencies. It contributes to the growing body of literature advocating for context-rich, interactive, and learner-centered approaches to Education for Sustainability, and highlights the role of smart learning city environments in shaping informed, reflective, and engaged citizens
Data Availability Statement
Data is available at: [Zenodo url, removed for blind review]
Abbreviations
The following abbreviations are used in this manuscript:
| MARG | mobile augmented reality games |
| ESD | Education for Sustainable Development |
| AR | Augmented Reality |
| CBE | Cycle of Basic Education |
| KSA | Knowledge, Skills, and Attitudes |
| [Removed] | [University’s name] |
References
- D. Perrotti, P. Verma, K. K. Srivastava, and P. Singh, “Challenges and opportunities at the crossroads of Environmental Sustainability and Economy research,” in Environmental Sustainability and Economy, Elsevier, 2021, pp. 345–360.
- T. Konrad, A. Wiek, and M. Barth, “Embracing conflicts for interpersonal competence development in project-based sustainability courses,” Int. J. Sustain. High. Educ. 2020. [CrossRef]
- M. Rieckmann, Issues and trends in Education for Sustainable Development Issues and trends in Education. United Nations, 2018.
- A. Wiek, L. Withycombe, and C. Redman, “Key competencies in sustainability: A reference framework for academic program development,” Sustain. Sci., vol. 6, no. 2, pp. 2011; 203–218. [CrossRef]
- UNESCO, Education for Sustainable Development: A Roadmap. UNESCO, 2020.
- D. Gheorghe, O. M. D. Martins, A. J. Santos, and L. Urdes, “Education for Sustainable Development : What Matters ?,” Sustainability, vol. 16, no. 9493, pp. 2024; 1–16. [CrossRef]
- Y.-L. Huang, D.-F. Chang, and B. Wu, “Mobile Game-Based Learning with a Mobile App: Motivational Effects and Learning Performance,” J. Adv. Comput. Intell. Intell. Informatics, vol. 21, no. 6, pp. 2017; 963–970. [CrossRef]
- T. Macagno, A. Nguyen-Quoc, and S. P. Jarvis, “Nurturing Sustainability Changemakers through Transformative Learning Using Design Thinking: Evidence from an Exploratory Qualitative Study,” Sustainability, vol. 2024; 16. [CrossRef]
- K. Mettis and T. Väljataga, “Designing learning experiences for outdoor hybrid learning spaces,” Br. J. Educ. Technol., vol. 52, no. 1, pp. 2021; 498–513. [CrossRef]
- L. D. Cosio, O. Buruk, D. Fernández Galeote, I. D. V. Bosman, and J. Hamari, “Virtual and Augmented Reality for Environmental Sustainability: A Systematic Review,” Conf. Hum. Factors Comput. Syst. - Proc. 2023. [CrossRef]
- T. H. Laine, “Mobile Educational Augmented Reality Games: A Systematic Literature Review and Two Case Studies,” Computers. 2018; 7, 1–218. [CrossRef]
- D. M. Bressler, J. Oltman, and F. L. Vallera, “Inside, Outside, and Off-Site: Social Constructivism in Mobile Games,” in Handbook of Research on Mobile Technology, Constructivism, and Meaningful Learning, J. Keengwe, Ed. IGI Global Scientific Publishing, 2018, pp. 1–22.
- S.-Y. Chen, “To explore the impact of augmented reality digital picture books in environmental education courses on environmental attitudes and environmental behaviors of children from different cultures,” Front. Psychol., vol. 13, Dec. 2022. [CrossRef]
- G. Lampropoulos, E. Keramopoulos, K. Diamantaras, and G. Evangelidis, “Integrating Augmented Reality, Gamification, and Serious Games in Computer Science Education,” Educ. Sci., vol. 13, no. 2023; 6. [CrossRef]
- P. Beça et al. Citizen, Territory and Technologies: Smart Learning Contexts and Practices, S: Web App,” in Citizen, Territory and Technologies, 2018. [CrossRef]
- [Removed].
- J. M. Zydney and Z. Warner, “Mobile apps for science learning: Review of research,” Comput. Educ., vol. 94, pp. 2016; 94, 1–17. [CrossRef]
- Sousa Santos, P. Dias, and J. Madeira, “A Virtual and Augmented Reality Course Based on Inexpensive Interaction Devices and Displays,” EuroGraphics 2015- Educ. Pap. 2015. [Google Scholar] [CrossRef]
- M. Akçayır and G. Akçayır, “Advantages and challenges associated with augmented reality for education: A systematic review of the literature,” Educ. Res. Rev., vol. 20, no. February, pp. 1–11, 2017. [CrossRef]
- G. Bianchi, U. Pisiotis, M. Cabrera, Y. Punie, and M. Bacigalupo, The European sustainability competence framework. 2022.
- R. B. Toma, I. Yánez-Pérez, and J. Á. Meneses-Villagrá, “Towards a Socio-Constructivist Didactic Model for,” Interchange. 2024; 55, 75–19. [CrossRef]
- M. Kalz, “Open Education as Social Movement? Between Evidence-Based Research and Activism,” in Handbook of Open, Distance and Digital Education, O. Zawacki-Richter and I. Jung, Eds. Singapore: Springer, 2023, pp. 43–53.
- OECD, OECD Future of Education and Skills 2030: OECD Learning Compass. OECD, 2019.
- [Removed].
- [Removed].
- J. Schoonenboom and R. B. Johnson, “How to Construct a Mixed Methods Research Design,” Köln Z Soziol, vol. 69, no. Suppl 2, pp. 2017; 107–131. [CrossRef]
- A. Redman and A. Wiek, “Competencies for Advancing Transformations Towards Sustainability,” Front. Educ., vol. 6, no. November, pp. 1–11, 2021. [CrossRef]
- [Removed].
- [Removed].
- [Removed].
- V. Braun and V. Clarke, “Using thematic analysis in psychology,” Qual. Res. Psychol., vol. 3, no. 2, pp. 77–101, 2003. [CrossRef]
- J. W. Creswell and J. D. Creswell, Research Design: Qualitative, Quantitative, and Mixed Methods Approaches, 6th ed. Thousand Oaks: SAGE Publications, Inc., 2023.
- R. Groves, F. Fowler Jr., M. Couper, J. Lepkowski, E. Singer, and R. Tourangeau, Survey Methodology, 2nd ed. Wiley, 2009.
- [Removed].
- A. Baumber, Transforming sustainability education through transdisciplinary practice,” Environ. Dev. Sustain., vol. 24, no. 6, pp. 7622–7639, 2022. [CrossRef]
- I. Alkaher, D. Goldman, and G. Sagy, Culturally based education for sustainability-Insights froma pioneering ultraorthodox city in Israel,” Sustain., vol. 10, no. 10, pp. 1–25, 2018. [CrossRef]
- R. P. Oliveira and C. G. De Souza, “Gamification in E-Learning and Sustainability : A Theoretical Framework,” Sustainability, vol. 13, no. 11945, pp. 1–20, 2021.
- J. Sweller, P. Ayres, and S. Kalyuga, Cognitive Load Theory. Springer, 2011.
- T. H. Brown and L. S. Mbati, “Mobile learning: Moving past the myths and embracing the opportunities,” Int. Rev. Res. Open Distrib., vol. 16, no. 2, pp. 1–21, 2015. [CrossRef]
Figure 1.
[Project’s name] respondents’ perception on the competence dimensions and typologies of the ‘Embodying sustainability values’ competence area.
Figure 1.
[Project’s name] respondents’ perception on the competence dimensions and typologies of the ‘Embodying sustainability values’ competence area.
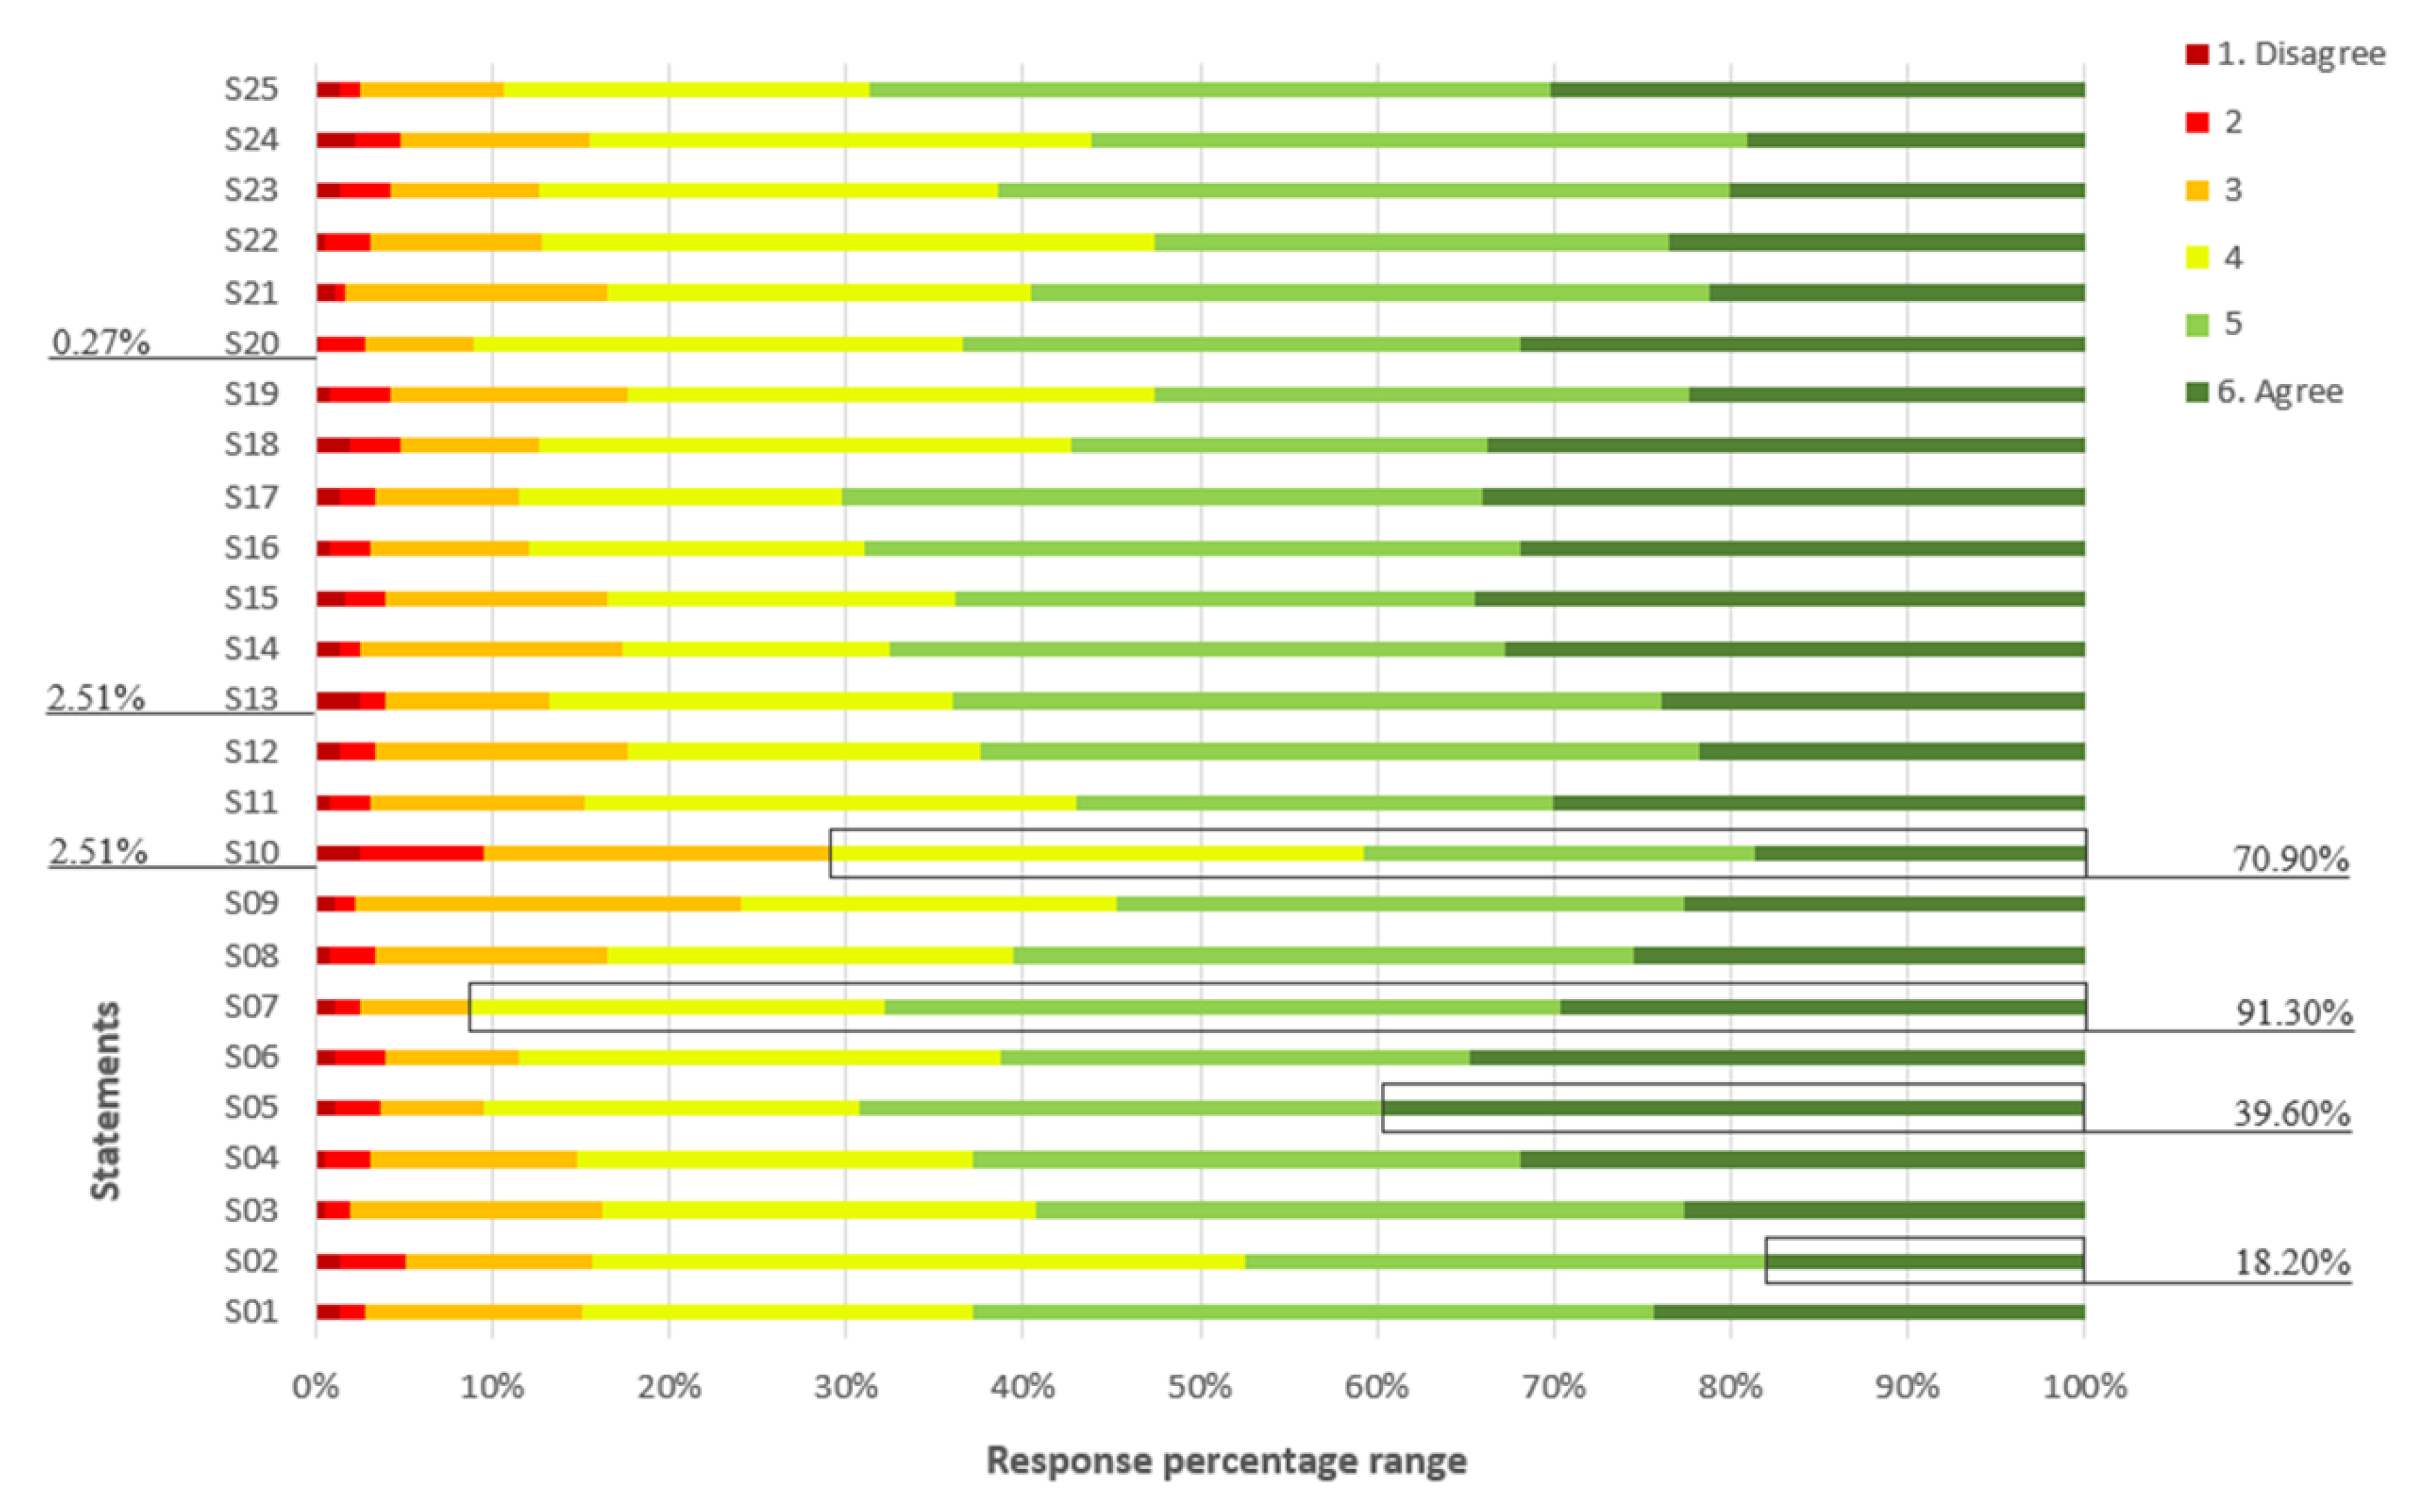
Figure 2.
[project’s name] respondents’ perception on the Knowledge Typology of the ‘Embodying sustainability values’ competence area.
Figure 2.
[project’s name] respondents’ perception on the Knowledge Typology of the ‘Embodying sustainability values’ competence area.
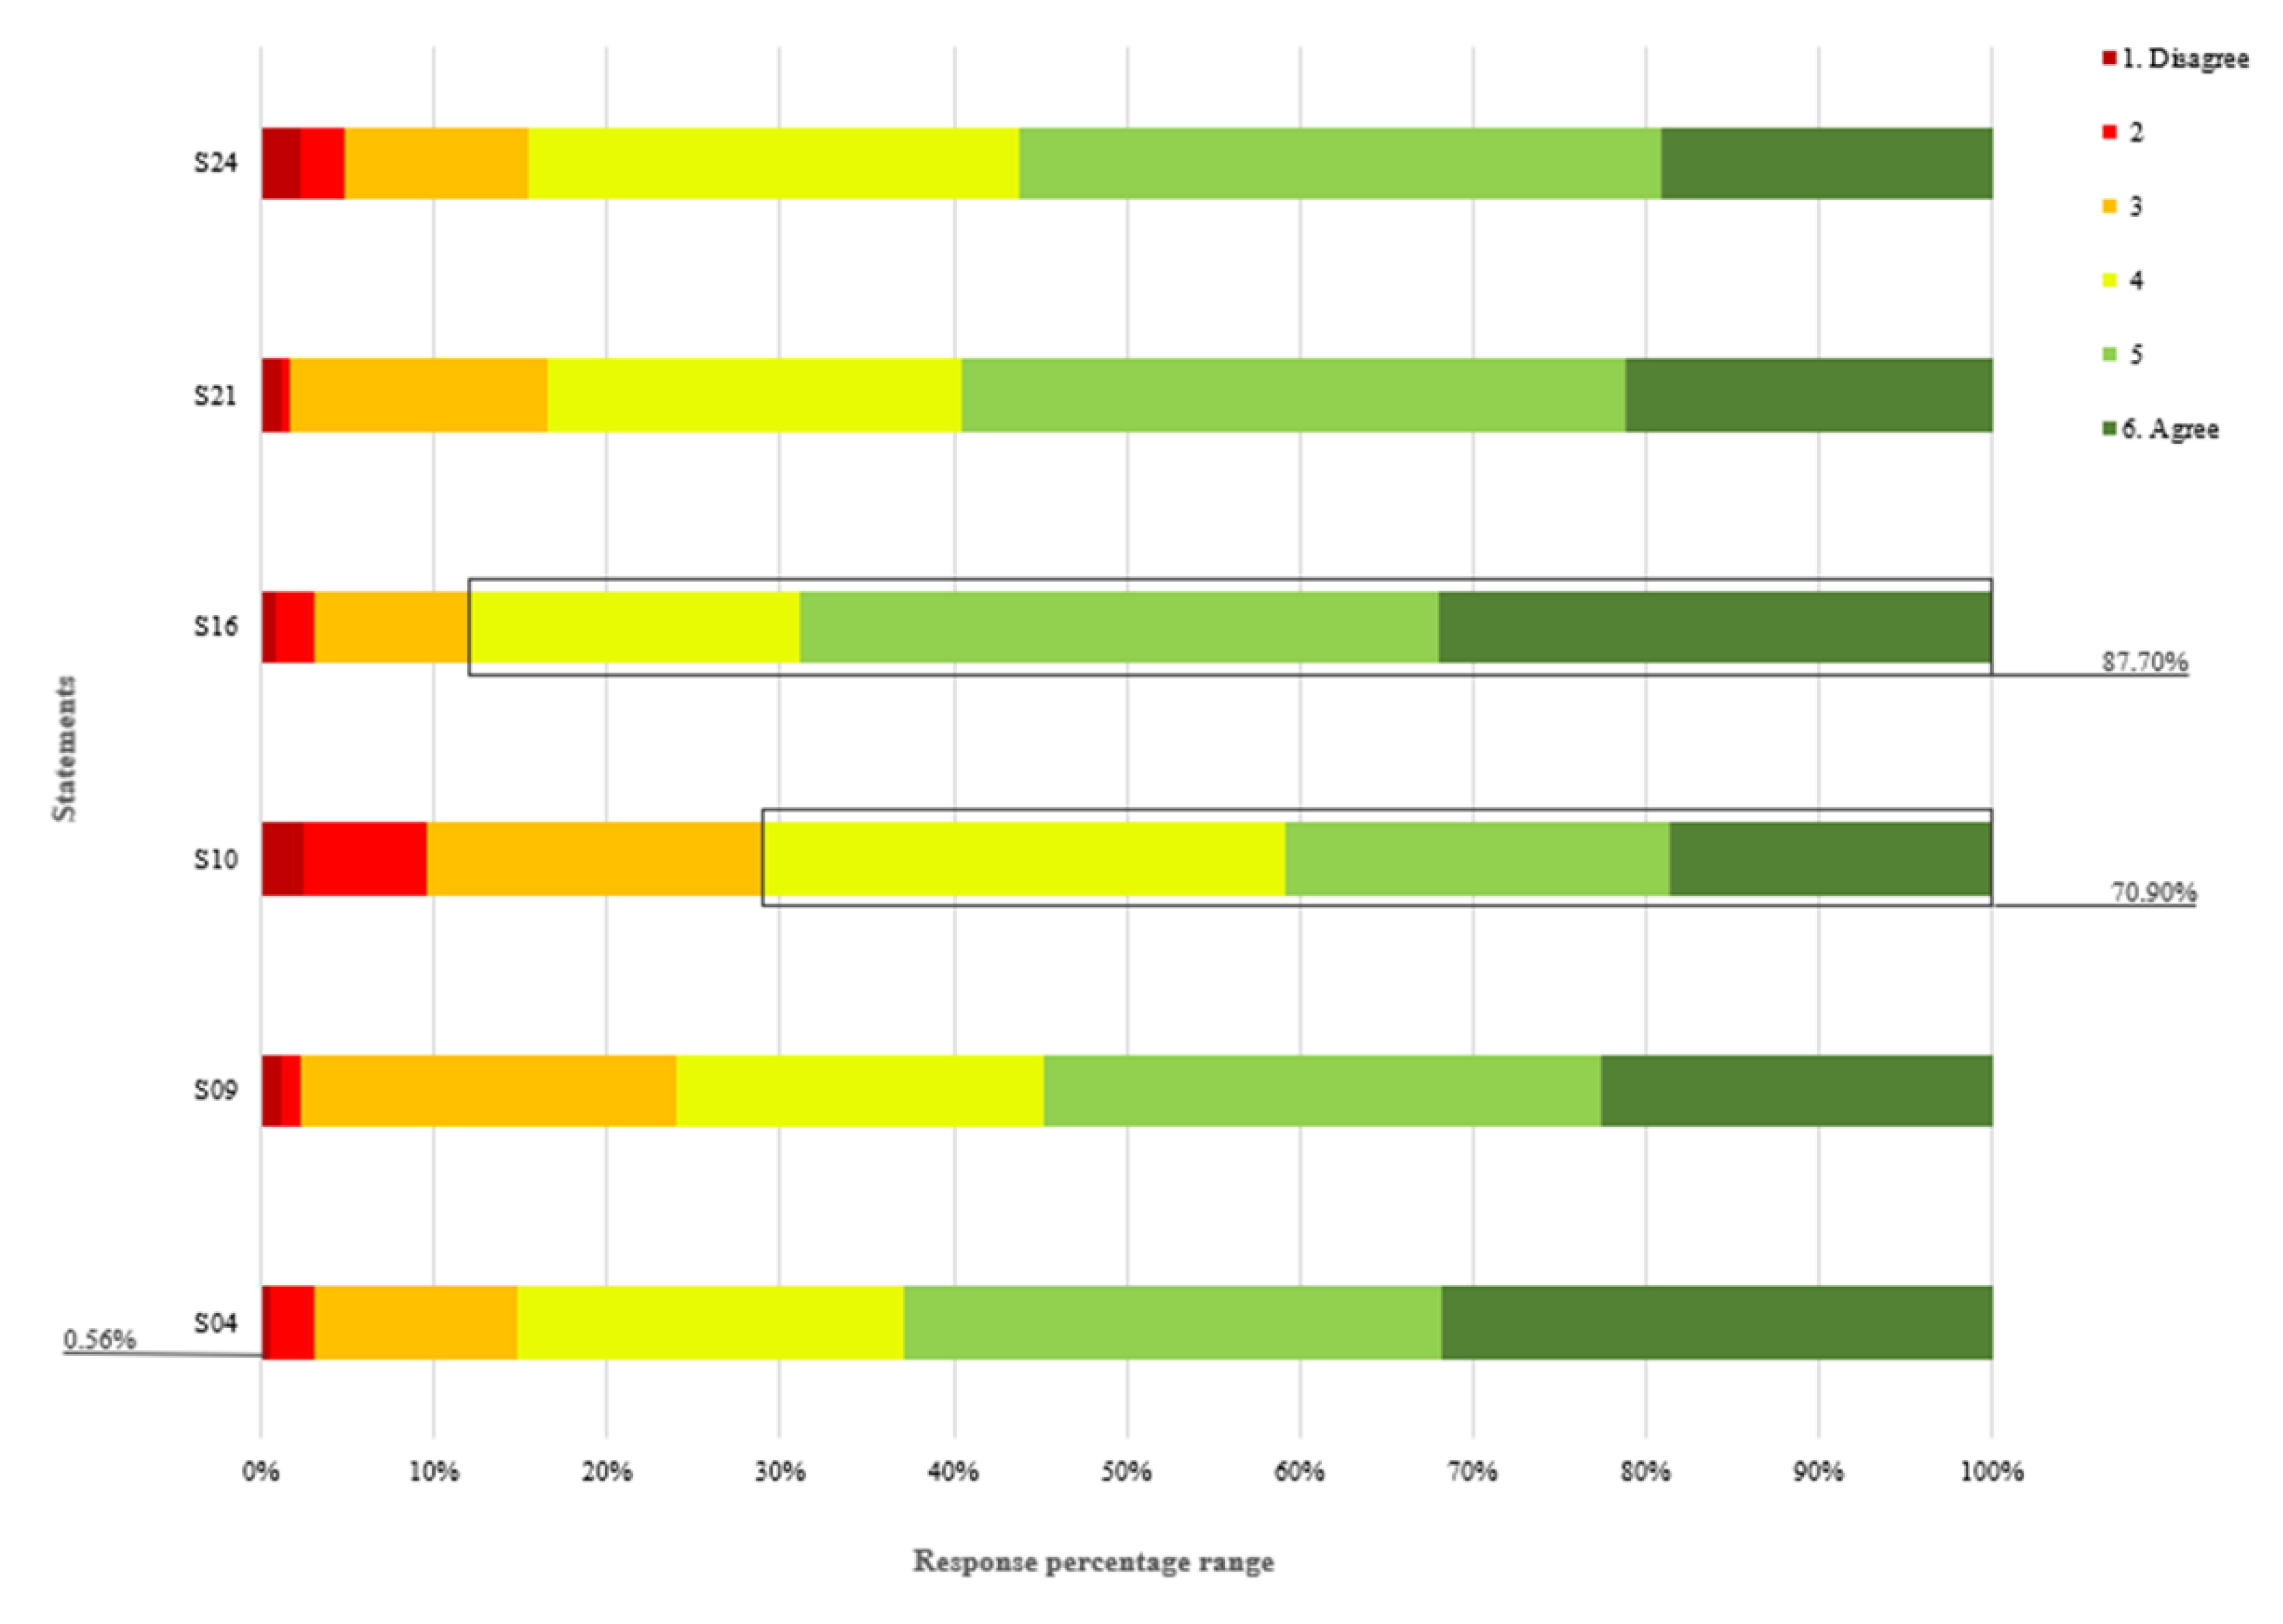
Figure 3.
[project’s name] respondents’ perception on the Skills Typology of the ‘Embodying sustainability values’ competence area.
Figure 3.
[project’s name] respondents’ perception on the Skills Typology of the ‘Embodying sustainability values’ competence area.
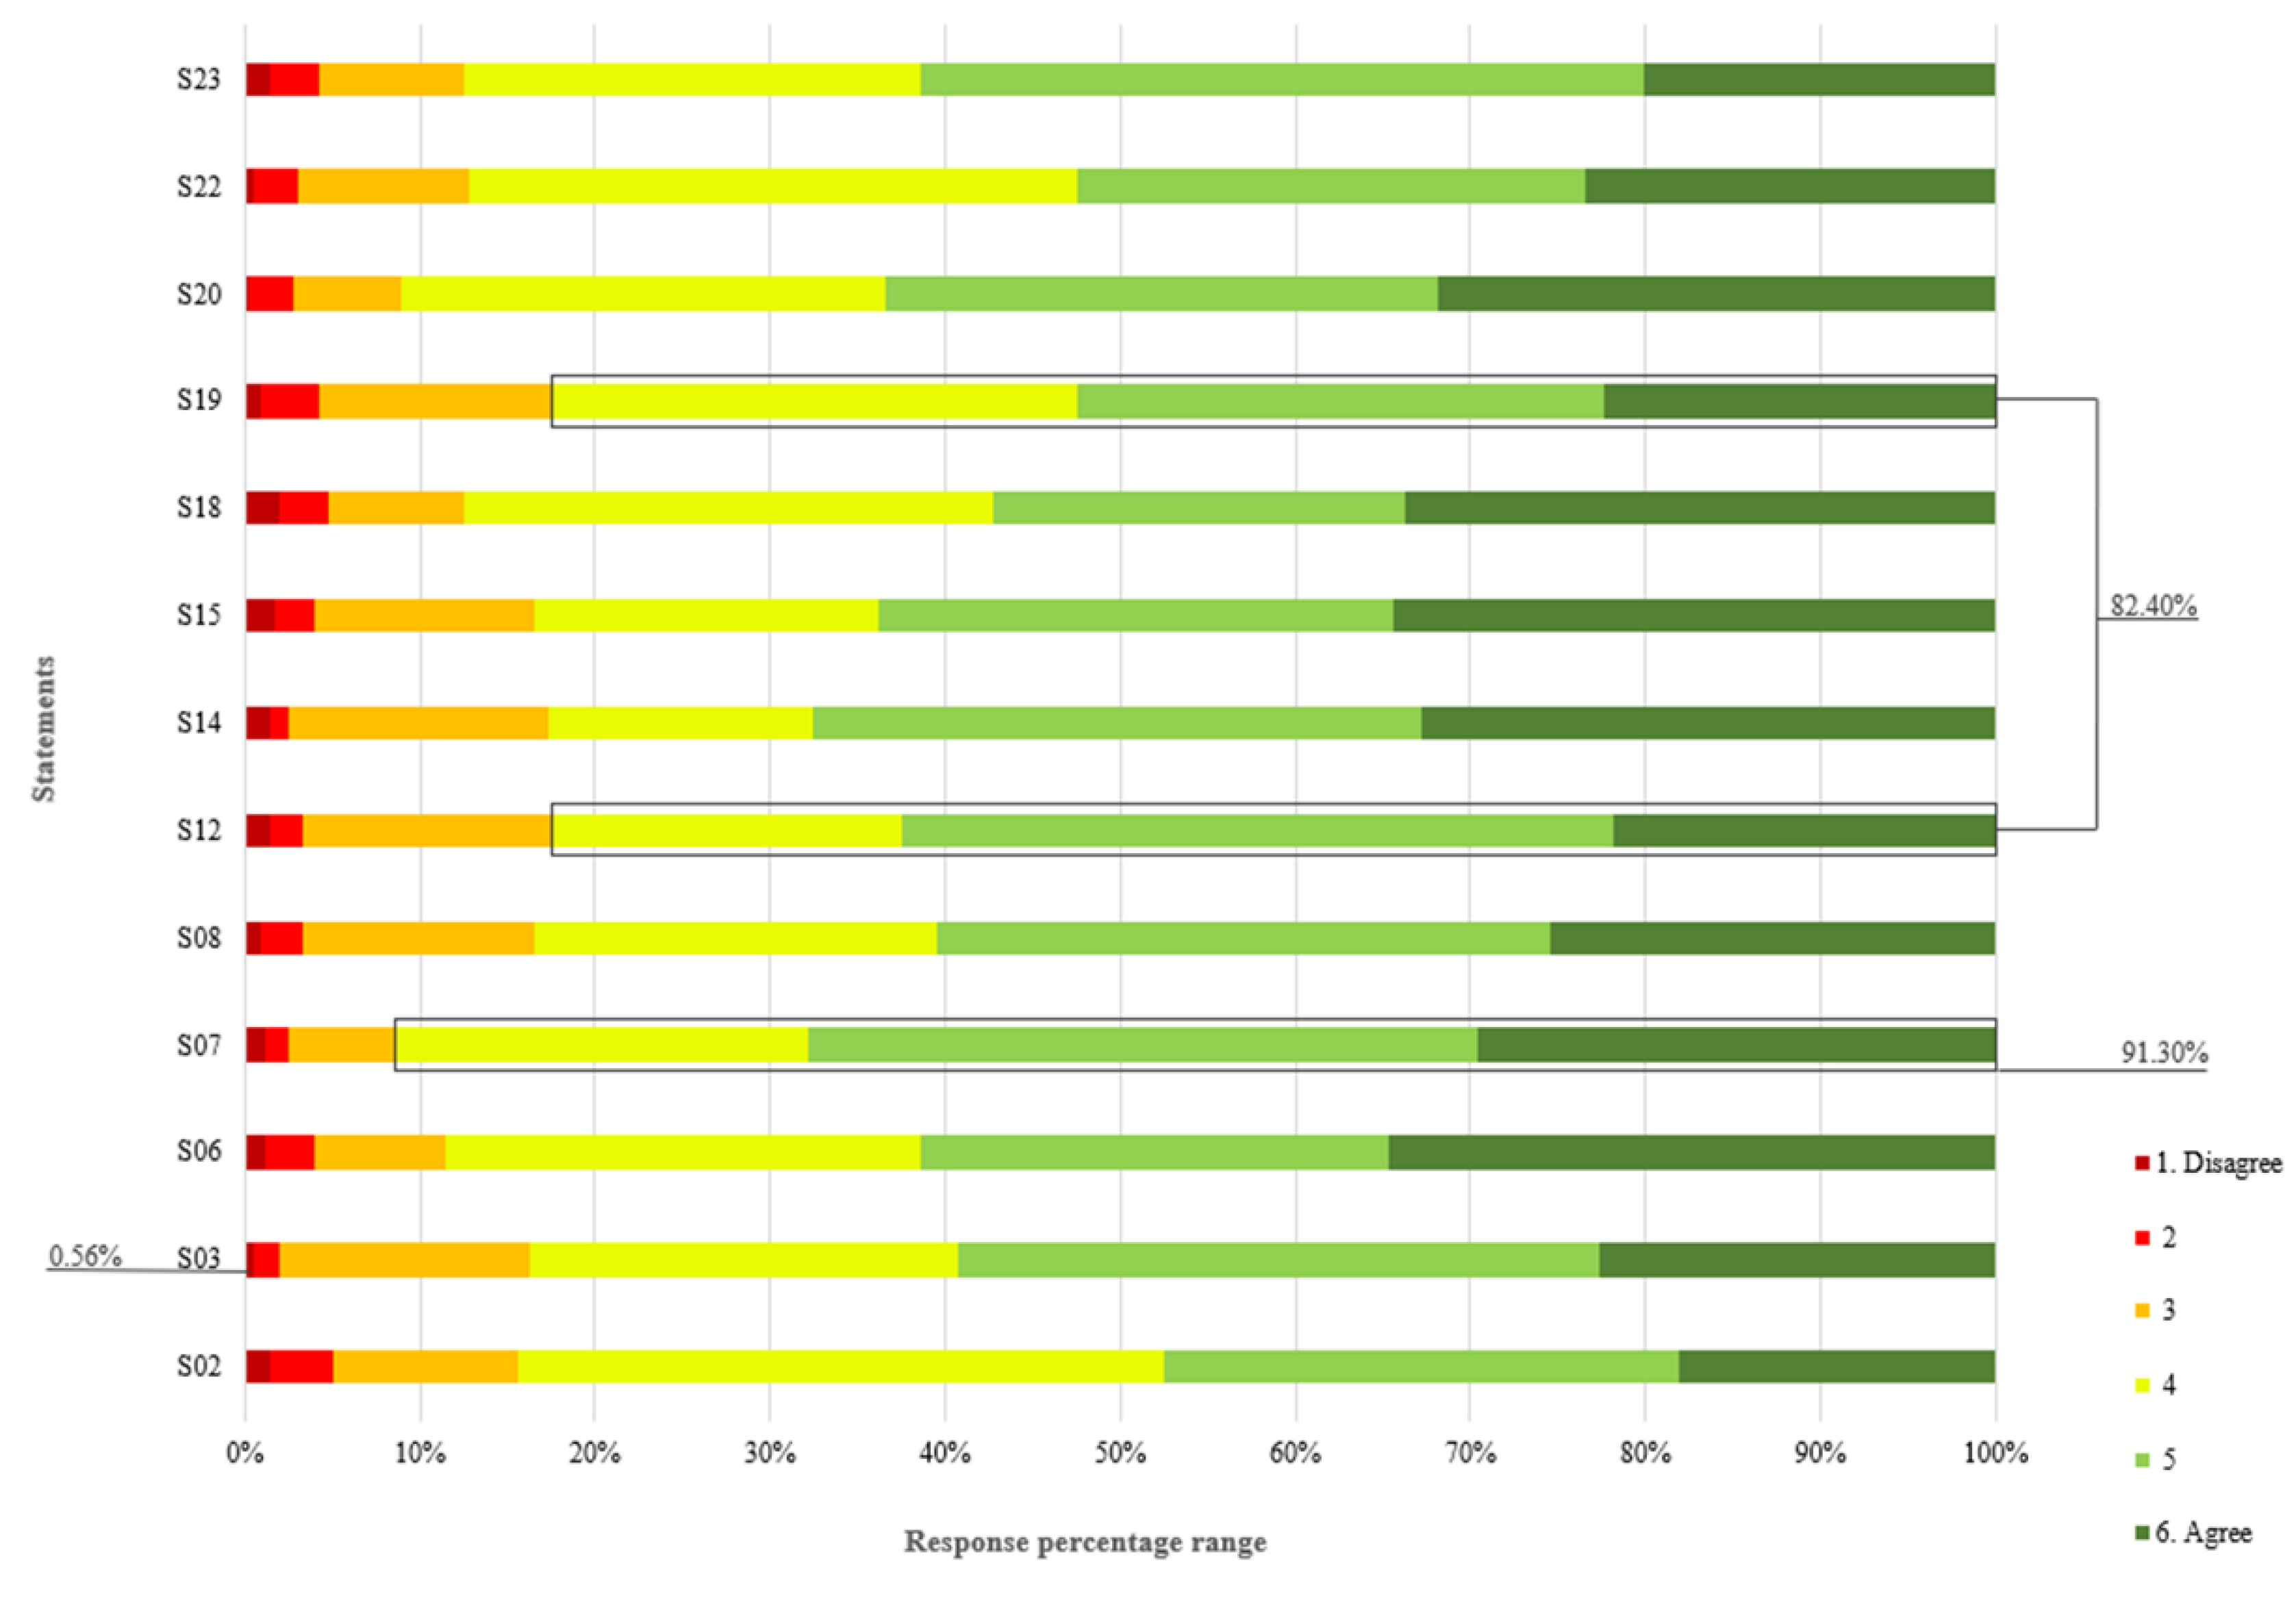
Figure 4.
[project’s name] respondents’ perception on the Attitude Typology of the ‘Embodying sustainability values’ competence area.
Figure 4.
[project’s name] respondents’ perception on the Attitude Typology of the ‘Embodying sustainability values’ competence area.
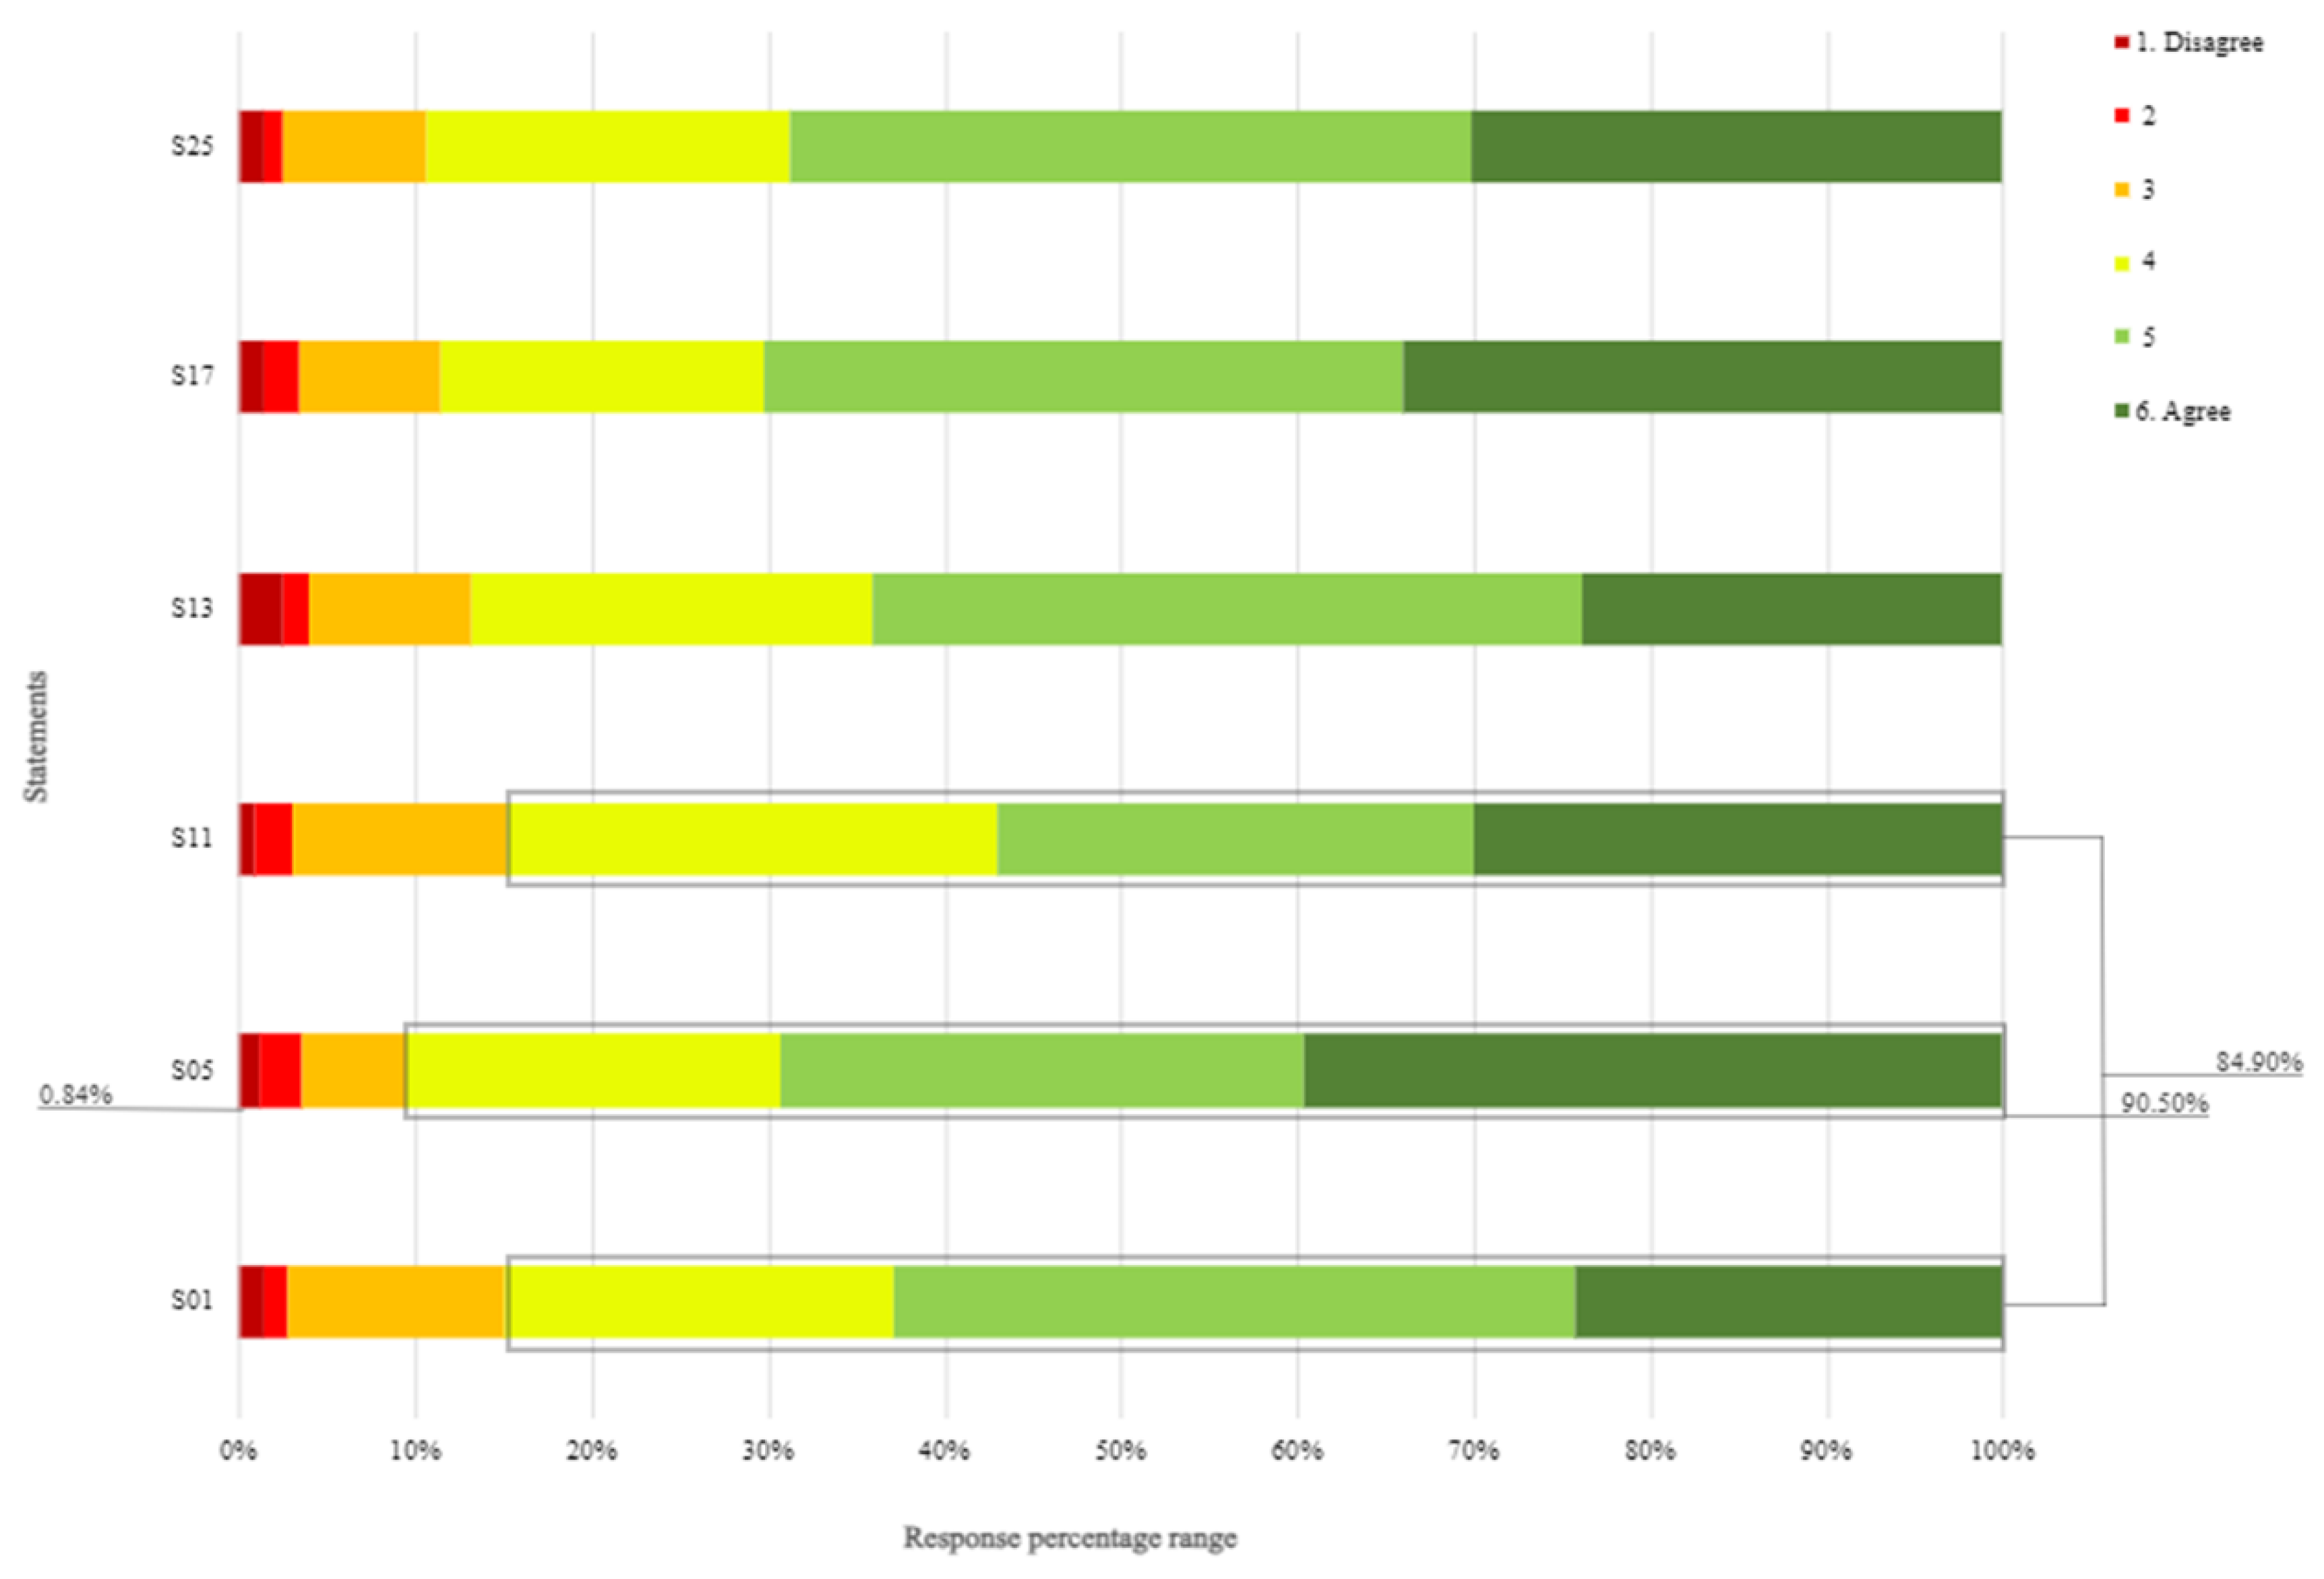

Table 1.
Synthesis of the games, number of activities and students who played each game, by academic level.
Table 1.
Synthesis of the games, number of activities and students who played each game, by academic level.
| Games | Number of Activities | Number of Players | ||||
| 2nd / 3rd CBE | Secondary Education | Higher Education | Teacher Training | Total | ||
| Visit to the salt pans | 1 | 30 | - | - | - | 30 |
| [Project’s name] at the [University] Campus | 2 | - | 27 | 46 | 19 | 92 |
| [City], city of Art Nouveau and Liberty | 1 | 20 | - | - | - | 20 |
| Art Nouveau Path | 9 | 118 | 49 | 25 | - | 192 |
| [City], walking tour | 1 | - | - | - | 40 | 40 |
| Total | 15 | 168 | 76 | 71 | 59 | 374 |
Table 2.
Synthesis of the participants' responses about what they learned from the [project’s name] activities.
Table 2.
Synthesis of the participants' responses about what they learned from the [project’s name] activities.
| Theme | Subtheme | Descriptor |
Citation (translated sentence) |
N | Rel. Freq (%) |
| Cultural Awareness |
Local culture | Engagement with local identity, traditions, and heritage | ‘[Learn about the Arte Nova Museum and the José Estêvão Monument]’ | 304 | 59.49 |
| Environmental Protection | Waste management (e.g., microplastics, food waste) | Consequence awareness and actions related to reducing, reusing, and recycling waste | ‘[Food waste at the [University]]’ | 29 | 5.68 |
| Natural resources management (e.g., water, soil, stone and wood as building materials) | Responsible use and understanding of ecological materials | ‘[Examples of Art Nouveau buildings; sand/adobe constructions; materials used]’ | 20 | 3.91 | |
| Biodiversity preservation | Appreciation and care for ecosystems and species diversity | ‘[Preserving the environment and animals; What is salt and salt pans; Microplastics]’ | 17 | 3.33 | |
| Environment/ nature | General concern and connection to the natural world | ‘[soil composition, statue materials, carder materials]’ | 9 | 1.76 | |
| Local natural resources (e.g., salt) | Knowledge of region-specific environmental assets | ‘[Curiosities about salt and microplastics]’ | 4 | 0.78 |
Note: As participants were allowed to submit up to three responses, the bolded entries in the table correspond to the subthemes under which each unit of analysis was categorized.
Table 3.
Synthesis of the participants’ responses about their own understanding of Sustainability.
| Theme | Subtheme |
Descriptor (based on GreenComp Framework) |
Citation (translated sentence) |
N | Rel. Freq (%) |
| Values and behaviors |
Responsible use of resources | To acknowledge that humans are part of Nature; and to respect the needs and rights of other species and of Nature itself to restore and regenerate healthy and resilient ecosystems | ‘[Don't spend all resources in the present’] | 93 | 23.79 |
| Sustainable lifestyle | To support equity and justice for current and future generations and learn from previous generations for sustainability | ‘[Sustainability is essential if we are to continue living on our planet.’] | 24 | 6.14 | |
| Sustainable values | To reflect on personal values; identify and explain how values vary among people and over time, while critically evaluating how they align with sustainability values | ‘[the formation of aware and committed citizens for a balanced future’] | 9 | 2.30 | |
| Present actions | Environmental preservation | To identify own potential for sustainability and to actively contribute to improving prospects for the community and the planet | ‘[It's about being responsible towards nature and the animals around us. In this way we can have a more cared and healthier planet to live on.’] | 91 | 23.27 |
| Future thinking | Intergenerational equity | To envision alternative sustainable futures by imagining and developing alternative scenarios and identifying the steps needed to achieve a preferred sustainable future | To manage transitions and challenges in complex sustainability situations and make decisions related to the future in the face of uncertainty, ambiguity and risk | ‘[thinking about the future of the planet’] | 85 | 21.74 |
| (Unspecified information or not related to sustainability) | 89 | 22.76 | |||
Table 4.
Average, standard deviation, minimum and maximum score for the final score, correct and incorrect answers of game logs collected in the [project’s name] web platform.
Table 4.
Average, standard deviation, minimum and maximum score for the final score, correct and incorrect answers of game logs collected in the [project’s name] web platform.
| [project’s name] Games | ||||||
| Visit to the salt pan | [project’s name] on [University] Campus | [city], city of Art Nouveau and Liberty | Path of Art Nouveau: from Heritage to Sustainability | [city], walking tour | ||
| Number of groups who played the game | 7 | 39 | 5 | 59 | 14 | |
| Final score | Average | 64.29% | 76.70% | 86.40% | 83.30% | 66.30% |
|
Standard deviation |
5.34 | 10.33 | 5.35 | 29.77 | 19.83 | |
| Minimum-maximum | 50.00%- 71.40% |
35.00%- 100.00% |
75.30%- 90.90% |
33.33%- 100.00% |
29.20%- 95.00% |
|
| AR score | Average | 56.25% | 86.84% | 81.81% | 75.00% | 81.80% |
|
Standard deviation |
3.20 | 21.95 | 19.00 | 40.16 | 3.16 | |
| Minimum-maximum | 0.00%- 100.00 |
4.17%- 100.00% |
83.33%- 100.00% |
27.27%- 100.00% |
57.14%- 100.00% |
|
| Correct answers | Average | 64.30% | 80.58% | 85.40% | 86.11% | 72.40% |
|
Standard deviation |
1.07 | 18.89 | 1.07 | 4.96 | 3.26 | |
| Minimum-maximum | 50,00%- 71.40% |
45.83%- 100.00% |
77.30%- 90.90% |
44.44%- 100.00% |
41.20%- 95.90% |
|
| Incorrect answers | Average | 35.70% | 19.42% | 13.60% | 13.89% | 30.30% |
|
Standard deviation |
1.07 | 5.11 | 1.07 | 4.96 | 3.55 | |
| Minimum-maximum | 28.60%- 50.00% |
0.00%- 54.17% |
9.10%- 22.70% |
0.00%- 55.56% |
4.20%- 62.50% |
|
Disclaimer/Publisher’s Note: The statements, opinions and data contained in all publications are solely those of the individual author(s) and contributor(s) and not of MDPI and/or the editor(s). MDPI and/or the editor(s) disclaim responsibility for any injury to people or property resulting from any ideas, methods, instructions or products referred to in the content. |
© 2025 by the authors. Licensee MDPI, Basel, Switzerland. This article is an open access article distributed under the terms and conditions of the Creative Commons Attribution (CC BY) license (http://creativecommons.org/licenses/by/4.0/).
Copyright: This open access article is published under a Creative Commons CC BY 4.0 license, which permit the free download, distribution, and reuse, provided that the author and preprint are cited in any reuse.


