
Submitted:
24 December 2025
Posted:
24 December 2025
You are already at the latest version
Abstract
The quality of muscle is a significant economic trait in livestock, the development of which is contingent on the coordinated regulation of both coding and non-coding genes. The Anhui White Goat is a breed that is native to central China. It is characterised by its high levels of adaptability and tolerance, which enable it to thrive under extensive management conditions. Furthermore, it is renowned for producing meat that is particularly flavourful. However, in comparison with the growth rate and meat yield of introduced breeds such as the Boer goat, the local breed exhibits a lower level of productivity. In the present study, we conducted a comprehensive analysis of the transcriptomes of longissimus dorsi muscle samples from Anhui White Goats and Boer Goats. We identified 490 key candidate microRNAs associated with muscle growth and development, among which 19 were differentially expressed (|log₂FC| ≥ 1.5, P < 0.05), including 7 up-regulated and 12 down-regulated microRNAs. Further prediction of the target genes of differentially expressed miRNAs revealed that these miRNAs target genes such as BDNF, MAPT, MYB, STC1, and SMAD7. These target genes are primarily involved in signaling pathways including MAPK, GABAergic synapse, HIF-1, Toll-like receptor, PI3K/Akt, and cAMP. Subsequent refinement revealed five key candidate microRNAs potentially involved in this process: chi-miR-10b-5p, chi-miR-122, chi-miR-novel-7_9719, chi-miR-143-3p, and chi-miR-424-3p. These findings provide a theoretical foundation for further elucidating the molecular mechanisms underlying muscle growth and development in Anhui White Goats.
Keywords:
microRNA
; goat
; RNA-seq
; muscle development
; ceRNA
1. Introduction
Anhui white goat, commonly known as Huaihe goat, is a local breed of goat valued for its skin and meat. It has been included in the provincial catalogue of genetic resources for livestock and poultry. The Anhui white goat is characterised by its strong adaptability and high reproductive rate. However, it faces challenges in the form of a slower growth rate and lower meat yield compared to the Boer goat. The Boer goat is the first type of meat goat from South Africa to be introduced to our country, having come from Germany. It has a good cross effect, a fast growth rate, and a high meat yield. The report mentions that the Anhui white goat and the Boer goat have large allele differences and a rich genetic structure. Eight microsatellite loci are highly polymorphic and the genetic differentiation between the two populations is significant. The Anhui white goat has a higher genetic diversity and stronger environmental adaptability than the Boer goat. This was also confirmed in previous study, in which seven microsatellite markers were selected to analyse the genetic diversity of Anhui white goats, resulting in the detection of 45 alleles and 54 genotypes [1]. The PIC and heterozygosity of seven microsatellite markers were high. These results suggest that the Anhui white goat retains a wide range of genetic traits and is well-suited to breeding.
The quality of meat is an important economic trait of domestic animals. It is mainly determined by factors such as breed, age, sex, feeding method, feed ratio, muscle colour, pH level, water-holding capacity, tenderness, intermuscular fat content and flavour substance content [2]. In addition, from a genetic perspective, the type and composition of skeletal muscle fibers not only affect skeletal muscle growth and development, but also affect meat quality. Skeletal muscle growth and development is a complex process. In addition to mRNA, a large number of ncRNAs (non-coding RNAs) have been shown to be involved in skeletal muscle growth and development in a variety of species, including pig, sheep, chicken, and cattle [3,4,5,6].
MicroRNAs (miRNAs) are small, non-coding RNAs that are evolutionarily conserved and are usually located in intergenic or intronic regions. They repress target gene expression at the post-transcriptional level by degrading or preventing the translation of specific messenger RNAs (mRNAs). It also plays a key role in cell proliferation and maintaining metabolic stability. Many microRNAs (miRNAs) have now been confirmed to play a role in regulating myoblast proliferation and differentiation. Key specific regulators involved in myogenesis include miR-1, miR-133, miR-206 and miR-486. In addition, many microRNAs (miRNAs) that are widely expressed in skeletal muscle, such as miR-489, miR-195, miR-128, miR-29 and miR-24, are also necessary for regulating muscle development. Myoblasts are one of the most important components of embryonic muscle development and endogenous repair. Studies have shown that microRNA-27b-3p (miRNA-27b-3p) can inhibit the proliferation of skeletal muscle satellite cells in Great Black sheep [7]. Targeting ANGPT1, miR-452 can promote the proliferation of C2C12 cells and inhibit their differentiation [8]. The expression of miR-193b-3p is high in goat skeletal muscle. It activates IGF2BP1 by binding to the 3’UTR region, thereby promoting myoblast proliferation [9]. This study has confirmed that the expression of microRNAs (miRNAs) 133 and 299-5p in the skeletal muscle of Urank sheep is higher than in other tissues [10]. Previous study found that miR-487b-3p targets IRS1 through the IRS1/PI3K/Akt signalling pathway to inhibit the proliferation and differentiation of goat myoblasts. miR-378a-3p, on the other hand, can promote differentiation and inhibit proliferation by targeting HDA4 [11]. Several studies have demonstrated the important role of microRNA (miRNA) in muscle growth and development across a variety of organisms.
However, the regulatory mechanism of microRNA (miRNA) in the muscle growth and development of Anhui White goats has not been thoroughly explored. Using bioinformatics methods based on whole-transcriptome sequencing technology, we predicted and analysed the functions of microRNA (miRNA) expression profiles in the longissimus dorsi muscle of Anhui white goats and Boer goats. We also screened new molecular targets that regulate muscle growth and development in Anhui white goats. This provided a scientific theoretical basis for the breeding selection of Anhui white goats and the improvement of meat quality.
2. Materials and Methods
2.1. Sample Preparation
Three healthy Boer goats and three Anhui white goats of a similar age and body condition were selected from a sheep farm in Funan County. They were all fed the same level of nutrition. On the same day, the experimental goats were slaughtered and their longissimus dorsi muscle removed between the 12th and 13th ribs. This muscle was then placed in a cryopreserved tube and taken back to the laboratory in liquid nitrogen. A portion of muscle tissue from each goat was sent to Shanghai Yun sequence Biotechnology Co., Ltd. for whole transcriptome sequencing, while the remaining samples were stored in a refrigerator at -80 °C for subsequent use.
2.2. Total RNA Isolation, Library Construction, and Sequencing
Total RNA was extracted from the longissimus dorsi muscle of goats using the Trizol method. After extraction, the concentration of RNA in each sample was measured using a NanoDrop ND-1000 spectrophotometer, and the integrity of the RNA was assessed using denaturing agarose gel electrophoresis. The GenSeq® rRNA Removal Kit was then used to remove ribosomal RNA (rRNA) from the samples. The samples were then used to construct sequencing libraries using the GenSeq® Low Input RNA Library Prep Kit, and small RNA libraries were sequenced on an Illumina HiSeq sequencer after quality control.
2.3. Data Quality Control and Read Mapping
Quality control and quantification of the constructed sequencing library were performed using a BioAnalyzer 2100 system. Raw reads were generated from the sequencing data following image analysis, base identification and quality control. The raw reads contain sequence and quality information for each read, as well as some reads with connectors and low quality. Using a Q30 quality control standard of >80%, the cutadapt software (v1.9.3) was used to remove sequences with adapters at the 3′ end, as well as low-quality reads with a base quality of less than 20, in order to obtain clean, high-quality reads.
2.4. Identification and Screening of Differentially Expressed miRNA
Align the trimmed reads of each sample to the combined human pre-miRNAs database (miRNA database (V22) + newly predicted pre-miRNAs). Count the number of tags aligned to each mature microRNA (miRNA) as its original expression level, and then normalise this using the transcripts per million (TPM) method. Merge the trimmed reads of all samples and use the miRDeep2 software (version 2.0.0.5) to predict new miRNAs, labelling them as ‘novel’. Calculate the fold change between the two samples and screen for differentially expressed miRNAs using the criteria of |log2FC| ≥ 1.5 and P < 0.05.
2.5. Functional Analysis of Differentially Expressed miRNAs
The target genes of differentially expressed microRNAs (DE-miRNAs) were subjected to Gene Ontology (GO) functional enrichment analysis and Kyoto Encyclopedia of Genes and Genomes (KEGG) pathway analysis. The focus was on the biological processes and signalling pathways involved in muscle growth and development that were significantly enriched by DE-miRNAs.
2.6. Construction of the ceRNA(lncRNA–miRNA–mRNA) Network
In this study, the miRNA and TargetScan software packages were used to analyse the interaction between long non-coding RNAs (lncRNAs) and microRNAs (miRNAs) and between miRNAs and 3’UTR mRNA separately. The miRNAs identified in the lncRNA-miRNA and miRNA-mRNA analyses were then intersected, and the corresponding lncRNAs and mRNAs were extracted for negative correlation analysis. A ceRNA network was constructed using Cytoscape software. 2.8 Validation of differentially expressed RNA using RT-qPCR.
2.7. Validation of DE RNA Using RT-qPCR
To verify the accuracy and reliability of the differentially expressed RNAs (DE RNAs) identified by RNA-seq, four DE mRNAs and three DE miRNAs were randomly selected for RT-qPCR. The RNA was reverse transcribed into cDNA using the PrimeScript™ RT reagent Kit with gDNA Eraser (Takara). The mRNA primers were designed using Primer Premier (version 5.0) software, and their specificity was tested at the NCBI. Due to the short miRNA sequence, reverse transcription primers were designed using the tail-adding method for qPCR primers, and qPCR reactions were performed using the TB Green® Fast qPCR Mix kit. β-Actin was used as the endogenous control for mRNA and U6 for miRNA. To verify the accuracy of the sequencing data, four differentially expressed genes (DE-mRNAs) and three differentially expressed miRNAs were randomly selected for quantitative detection by qPCR, and the relative expression was calculated using the 2^(−ΔΔ) CT method. GraphPad Prism (version 8.0) software was used to analyse the data. A T-test was used to compare the data between the two groups, and P < 0.05 was considered statistically significant.
3. Results
3.1. Total RNA Quality Test Results
Six samples of longissimus dorsi muscle tissue from Boer and Anhui White goats were collected for sequencing. Total RNA was extracted using the Trizol method, and the quality of the total RNA was assessed in terms of purity and integrity. In this study, all the OD260/OD280 values were above 1.8, indicating that the RNA was pure, the RNA bands were clear, there was no tailing phenomenon, the integrity of the RNA was good, and there was no DNA contamination. After sequencing, FastQC software was used to assess the quality of the data in terms of base and read length distributions and GC content.
3.2. Screening of Differentially Expressed mRNAs
A total of 15,954 genes were identified and screened for differentially expressed genes (DE-mRNAs) by analysing and comparing their expression profiles. A total of 1,552 differentially expressed genes were identified following statistical analysis (Figure 1A). Of these, 733 were found to be up-regulated, while 819 were found to be down-regulated. The standardised count number was used as the original data for the cluster analysis of differentially expressed genes, in order to obtain a cluster heat map. (Figure 1B). The volcano map was obtained using the difference fold and p-value (Figure 1C), with the standardised average expression serving as the original data. The log2 transformation was performed to obtain scatter plots (Figure 1D). Further analysis of the three plots revealed significant differences between groups, strong correlations within groups, and a greater number of up-regulated genes (red) than down-regulated genes (blue). The top 10 differentially expressed genes with significantly up-regulated expression (see Table 1) and the top 10 differentially expressed genes with significantly down-regulated expression (see Table 2) are listed here.
GO functional enrichment and KEGG pathway analyses were performed on these differentially expressed genes to further speculate and annotate their possible biological functions. GO functional enrichment analysis revealed that these differentially expressed genes were enriched in 577 functional groups (P < 0.05). Of these, 555 were enriched in the biological process (BP) category (Figure 2A,B). The term with the most enriched genes was ‘ATP metabolic process’. KEGG enrichment analysis (Figure 3A,B) revealed that the differentially expressed genes were enriched in 53 pathways involved in regulating muscle growth and development. This article lists GO entries and genes (Table 3) and signalling pathways and genes (Table 4) that are related to muscle growth and development.
To more accurately explore the key genes affecting goat muscle growth and development, the GO entries in Table 2.10 were cross-referenced with the signalling pathways in Table 2.11. Twenty-eight genes were found to be present in three or more cross-references. They were MYOG, BCL2, ACTN3, NRG1, MAPK10, ADCY5, ADCY8, JUN, FOS, FGF6, CREB5, CASP3, MYLK3, GNGT1, GNG4, HGF, and PLA2G4A, SOX8, LOX, ATP2A2, DNER, CASQ2, WFIKKN1, PROX1, EGR1, TBX3, TNNI3, TNNI1. Among them, MYOG, BCL2, ACTN3, NRG1 and MAPK10 were 5 up-regulated genes, and the remaining 23 down-regulated genes. These genes were all present in the longissimus dorsi muscle of Anhui White goats and Bohr goats (P < 0.05). Four up-regulated genes (BCL2, ACTN3, NRG1, MAPK10) were significantly different (P < 0.01). There were 17 down-regulated genes (ADCY5, JUN, SOX8, FOS, FGF6, CREB5, MYLK3, HGF, PLA2G4A, ATP2A2, CASQ2, WFIKKN1, PROX1, EGR1, TBX3, TNNI3, TNNI1) were highly significant, suggesting that these 28 genes might be key candidates for muscle growth and development in goats.
3.3. Screening of Differentially Expressed miRNAs
A total of 490 microRNAs (miRNAs) were obtained in this sequencing, of which 232 were novel (Figure 4A). These 490 miRNAs were considered to be the known miRNAs of goats. Analysis of these 490 known miRNAs revealed that highly conserved, muscle-specific miRNA families such as miR-208, miR-499 and miR-206 were differentially expressed in the longissimus dorsi muscle of both the Anhui white goat and the Boer goat.
Similarly to the screening and analysis of DE-mRNAs, the heat map (Figure 4B), volcano map (Figure 4C), and scatter plot (Figure 4D) were used to visualize the DE-miRNAs. Using |log2FC| ≥ 1.5 and P < 0.05 as the criteria, differentially expressed miRNAs (DE-miRNAs) between Anhui White goat and Boer goat were screened. A total of 19 differentially expressed miRNAs (Figure 4C) were obtained, including 7 significantly up-regulated and 12 significantly down-regulated DE-miRNAs. Among the significantly down-regulated DE-miRNAs, two novel miRNAs were identified: chi-miR-novel-7_9719 and chi-miR-novel-LWLT01000027.1_26273.
In this study, target gene prediction was performed for all DE-miRNAs, and then the miRNA-mRNA network was plotted using Cytoscape software (v3.9.0). In order to explore the function of miRNAs more comprehensively, GO functional enrichment analysis and KEGG signaling pathway analysis were performed on the target genes of the top 10 DE-miRNAs.
The predicted target genes of microRNA, combined with the results of GO and KEGG enrichment, were used to screen out genes that may affect muscle growth and development (Table 5). The genes in the GO and KEGG pathways related to muscle growth and development were analysed together, and the key candidate genes that may affect goat muscle development and are targeted by DE-miRNAs were found to be BDNF, MAPT, MYB, STC1 and SMAD7. Then, a correlation analysis was performed between these key candidate genes and the expression profile of DE-miRNAs. Finally, five key candidate miRNAs that may regulate the growth and development of goat muscles were obtained. These genes were identified as chi-miR-10b-5p, chi-miR-122, chi-miR-novel-7_9719, chi-miR-143-3p and chi-miR-424-3p.
To verify the accuracy of the sequencing data, three differentially expressed miRNAs were randomly selected for quantitative detection by qPCR, and the 2-ΔΔCT theory was used to calculate their relative expression. We found that the expression trend of these three miRNAs was essentially consistent with the sequencing results. (Figure 5).
4. Discussion
In this study, the microRNA target gene prediction software programs miRanda and TargetScan were used to predict microRNA target genes. The overlapping results from these two programs were used as the final microRNA target gene predictions. GO and KEGG function analysis of the predicted target genes showed that they were mainly enriched in cell metabolism, nitrogen compound metabolism, cell biological system process, organic matter biosynthesis process, carbon metabolism, Toll-like receptor, PI3K/Akt, cAMP, MAPK and other signaling pathways. Cross analysis of genes in these GO items and KEGG pathways, combined with the network map of miRNA target genes, The key candidate mirnas (chi-miR-10b-5p, chi-miR-122, chi-miR-novel-7_9719, chi-miR-143-3p, chi-miR-424-3p) with significant differences were screened out.
Previous studies have shown that microRNA-10b-5p is widely expressed in the heart, vertical body, brain, lungs and leg muscles of chickens, and that it has evolved relatively conservatively. It may regulate the proliferation and differentiation of muscle cells via the P53 and Wnt pathways [12]. It can also encourage the growth of C2C12 myoblasts by preventing the production of NFAT5 [13] . The function of miR-122 is to downregulate the TGF-β/Smad pathway. It can inhibit the TGF-β/Smad signalling pathway by directly targeting TGFBR2, thereby restoring myogenesis [14]. Upregulation of microRNA-143 (miRNA-143) can increase the number of skeletal muscle satellite cells, but inhibit the expression of insulin-like growth factor binding protein 5 (IGFBP5), thereby inhibiting the differentiation of bovine skeletal muscle satellite cells and reducing the number of myotubes [15]. Over-expression of miR-424-5p can target HSP90AA1 and promote the proliferation of myoblasts while inhibiting their differentiation [16].
Although the regulatory effects of these microRNAs on muscle growth and development in other animals have been preliminarily explored, their potential to regulate muscle growth and development in the Anhui white goat has not yet been reported. These miRNAs are significantly differentially expressed in the muscles of Anhui White goats and Boer goats. Among them, chi-miR-10b-5p, chi-miR-novel-7_9719, and chi-miR-143-3p were significantly different, and their target genes were all found in signaling pathways related to muscle growth and development. Therefore, it is speculated that these microRNAs (miRNAs) may play a role in regulating muscle growth and development in Anhui white goats.
5. Conclusions
In this study, the whole transcriptome sequencing technology was used to perform differential expression analysis, functional enrichment analysis and ceRNA network analysis of the longissimus dorsi muscle of Anhui white goat and Boer goat. A total of 490 miRNAs were identified in this sequencing, and 19 miRNAs were differentially expressed (|log2FC|≥1.5, P < 0.05), including 7 up-regulated mirnas and 12 down-regulated mirnas. Muscle-derived mirnas such as miR-206, miR-208 and miR-499 were also found. The target genes of the differentially expressed mirnas were predicted, and the results showed that the differentially expressed mirnas targeted BDNF, MAPT, MYB, STC1, SMAD7 and other genes. GO and KEGG enrichment analysis of these target genes was performed. It was found that these target genes were mainly involved in MAPK, GABAergic synapse, HIF-1, Toll-like receptor, PI3K/Akt, cAMP signal pathway, cell metabolism, organic matter biosynthesis and other biological processes Five key candidate mirnas that might be involved in muscle growth and development were chi-miR-10b-5p, chi-miR-122, chi-miR-novel-7_9719, chi-miR-143-3p and chi-miR-424-3p.
Author Contributions
Conceptualization, Y.L. and G.X.; data curation, F.L.; formal analysis, F.L.; funding acquisition, Y.L. and G.X.; investigation, S.D.; methodology, L.F.; project administration, C.H.; resources, G.X.; software, Y.L.; supervision, C.H.; validation, F.L.; visualization, F.L.; writing – original draft, F.L.; writing – review & editing, F.L. All authors have read and agreed to the published version of the manuscript.
Funding
This work was supported by the Key Projects of Scientific Research Plan of Colleges and Universities of Anhui Province (2023AH050427).
Institutional Review Board Statement
The tissues materials were taken with informed consent, and approved by the Institutional Animal Care and Use Committee at the Fuyang Normal University.
Informed Consent Statement
Not applicable.
Conflicts of Interest
The authors declare no conflict of interest.
References
- Zhao, L.; Zhou, L.; Hao, X.; Wang, L.; Han, F.; Liu, L.; Duan, X.; Guo, F.; He, J.; Liu, N. Identification and Characterization of Circular RNAs in Association With the Deposition of Intramuscular Fat in Aohan Fine-Wool Sheep. Frontiers in genetics 2021, 12, 759747. [Google Scholar] [CrossRef]
- Wang, X.; Yan, P.; Feng, S.; Luo, Y.; Liang, J.; Zhao, L.; Liu, H.; Tang, Q.; Long, K.; Jin, L.; et al. Identification and expression pattern analysis of miRNAs in pectoral muscle during pigeon (Columba livia) development. PeerJ 2021, 9, e11438. [Google Scholar] [CrossRef]
- Cai, B.; Li, Z.; Ma, M.; Wang, Z.; Han, P.; Abdalla, B.A.; Nie, Q.; Zhang, X. LncRNA-Six1 Encodes a Micropeptide to Activate Six1 in Cis and Is Involved in Cell Proliferation and Muscle Growth. Frontiers in physiology 2017, 8, 230. [Google Scholar] [CrossRef] [PubMed]
- Wang, S.; Tan, B.; Xiao, L.; Zeng, J.; Zhao, X.; Hong, L.; Li, Z.; Cai, G.; Zheng, E.; Gu, T.; et al. Long non-coding RNA Gm10561 promotes myogenesis by sponging miR-432. Epigenetics 2022, 17, 2039–2055. [Google Scholar] [CrossRef] [PubMed]
- Zhan, S.; Zhang, Y.; Yang, C.; Li, D.; Zhong, T.; Wang, L.; Li, L.; Zhang, H. LncR-133a Suppresses Myoblast Differentiation by Sponging miR-133a-3p to Activate the FGFR1/ERK1/2 Signaling Pathway in Goats. Genes (Basel) 2022, 13. [Google Scholar] [CrossRef] [PubMed]
- Zhang, W.; Sun, B.; Zhao, Y.; Raza, S.H.A.; Li, Y.; Wang, J.; Ma, X.; Almohaimeed, H.M.; Shaheen, S.; Al-Sarraj, F.; et al. Proliferation of bovine myoblast by LncPRRX1 via regulation of the miR-137/CDC42 axis. International journal of biological macromolecules 2022, 220, 33–42. [Google Scholar] [CrossRef] [PubMed]
- Katuwawala, K.; Bharadwaj, P.; Martins, I.; De Silva, B.; Ho, V.; Dissanayake, A.; Martins, R.N.; Fernando, W. Unraveling the Significance of Fecal MicroRNA Profile in Alzheimer’s Disease. Molecular neurobiology 2025, 63, 319. [Google Scholar] [CrossRef] [PubMed]
- Gan, X.N.; Gan, T.Q.; He, R.Q.; Luo, J.; Tang, R.X.; Wang, H.L.; Zhou, H.; Qing, H.; Ma, J.; Hu, X.H.; et al. Clinical significance of high expression of miR-452-5p in lung squamous cell carcinoma. Oncology letters 2018, 15, 6418–6430. [Google Scholar] [CrossRef] [PubMed]
- Li, L.; Zhang, X.; Yang, H.; Xu, X.; Chen, Y.; Dai, D.; Zhan, S.; Guo, J.; Zhong, T.; Wang, L.; et al. miR-193b-3p Promotes Proliferation of Goat Skeletal Muscle Satellite Cells through Activating IGF2BP1. Int J Mol Sci 2022, 23. [Google Scholar] [CrossRef] [PubMed]
- Huang, Y.; Chen, H.; Gao, X.; Ren, H.; Gao, S. Identification and functional analysis of miRNAs in skeletal muscle of juvenile and adult largemouth bass, Micropterus salmoides. Comparative biochemistry and physiology. Part D, Genomics & proteomics 2022, 42, 100985. [Google Scholar] [CrossRef]
- Lyu, M.; Wang, X.; Meng, X.; Qian, H.; Li, Q.; Ma, B.; Zhang, Z.; Xu, K. chi-miR-487b-3p Inhibits Goat Myoblast Proliferation and Differentiation by Targeting IRS1 through the IRS1/PI3K/Akt Signaling Pathway. Int J Mol Sci 2021, 23. [Google Scholar] [CrossRef] [PubMed]
- Zha, D.; Gamez, J.; Ebrahimi, S.M.; Wang, Y.; Verma, N.; Poe, A.J.; White, S.; Shah, R.; Kramerov, A.A.; Sawant, O.B.; et al. Oxidative stress-regulatory role of miR-10b-5p in the diabetic human cornea revealed through integrated multi-omics analysis. Diabetologia 2026, 69, 198–213. [Google Scholar] [CrossRef] [PubMed]
- Ge, G.; Yang, D.; Tan, Y.; Chen, Y.; Jiang, D.; Jiang, A.; Li, Q.; Liu, Y.; Zhong, Z.; Li, X.; et al. miR-10b-5p Regulates C2C12 Myoblasts Proliferation and Differentiation. Bioscience, biotechnology, and biochemistry 2019, 83, 291–299. [Google Scholar] [CrossRef] [PubMed]
- Ding, Z.; Lin, J.; Sun, Y.; Cong, S.; Liu, S.; Zhang, Y.; Chen, Q.; Chen, J. miR-122-5p negatively regulates the transforming growth factor-β/Smad signaling pathway in skeletal muscle myogenesis. Cell biochemistry and function 2020, 38, 231–238. [Google Scholar] [CrossRef] [PubMed]
- Zhang, W.R.; Zhang, H.N.; Wang, Y.M.; Dai, Y.; Liu, X.F.; Li, X.; Ding, X.B.; Guo, H. miR-143 regulates proliferation and differentiation of bovine skeletal muscle satellite cells by targeting IGFBP5. In vitro cellular & developmental biology. Animal 2017, 53, 265–271. [Google Scholar] [CrossRef]
- Chen, X.; Zhu, Y.; Song, C.; Chen, Y.; Wang, Y.; Lai, M.; Zhang, C.; Fang, X. MiR-424-5p targets HSP90AA1 to facilitate proliferation and restrain differentiation in skeletal muscle development. Animal biotechnology 2023, 34, 2514–2526. [Google Scholar] [CrossRef] [PubMed]
Figure 1.
Transcriptome sequencing analysis of longus dorsi muscle of Anhui white goat and Boer goat. (A)Using |log2FC|≥1 and P < 0.05 as the threshold for differential screening, 1552 differentially expressed genes (DE-mRNAs) were found, of which 733 were up-regulated and 819 were down-regulated. (B)The standardized count number was used as the original data to perform cluster analysis of differentially expressed genes to obtain a cluster heat map. (C)The volcano map was obtained by using the difference fold and p-value. (D)The standardized average expression was used as the original data, log2 transformation was performed to obtain scatter plots.Further analysis of the three plots revealed significant differences in samples between groups, good correlations in samples within groups, and more up-regulated genes (red) than down-regulated genes (blue).
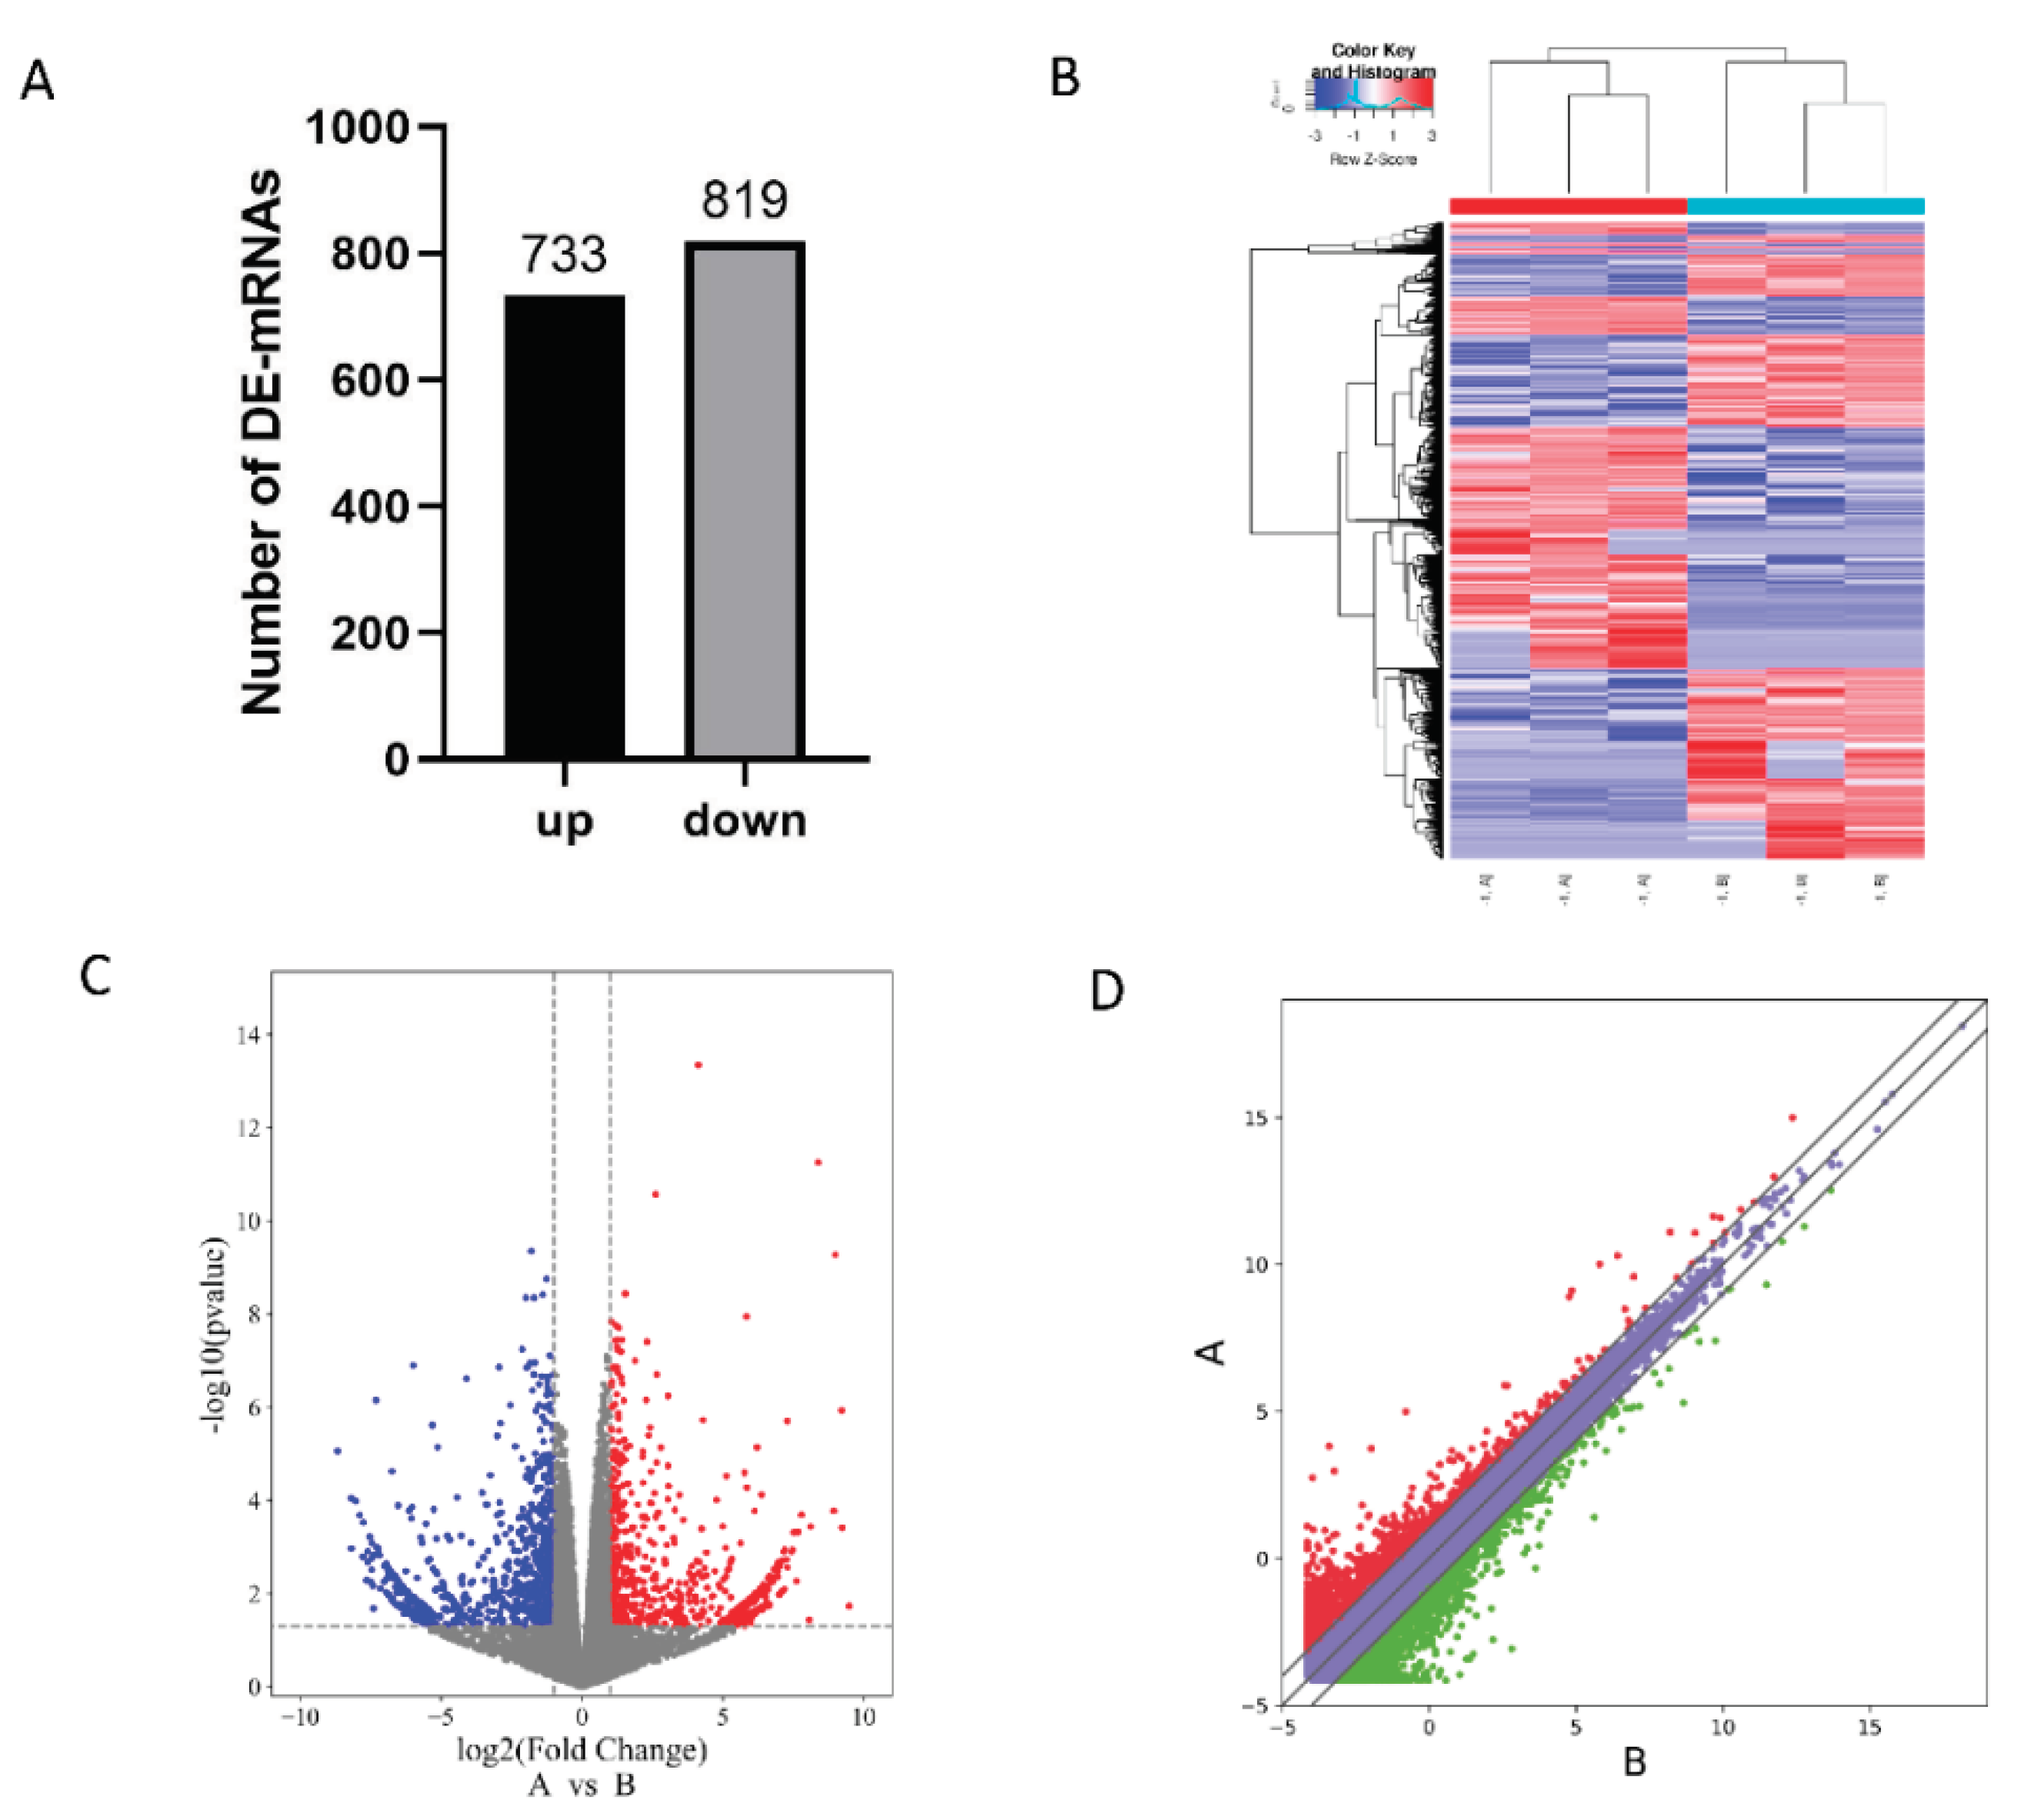
Figure 2.
GO Enrichment Analysis of DE-mRNAs. (A) BP classification of up-regulated expressed DE-mRNAs. (B) BP classification of down-regulated expressed DE-mRNAs. (C) CC classification of up-regulated expressed DE-mRNAs. (D) CC classification of down-regulated expressed DE-mRNAs. (E) MF classification of up-regulated expressed DE-mRNAs. (F) MF classification of down-regulated expressed DE-mRNAs.
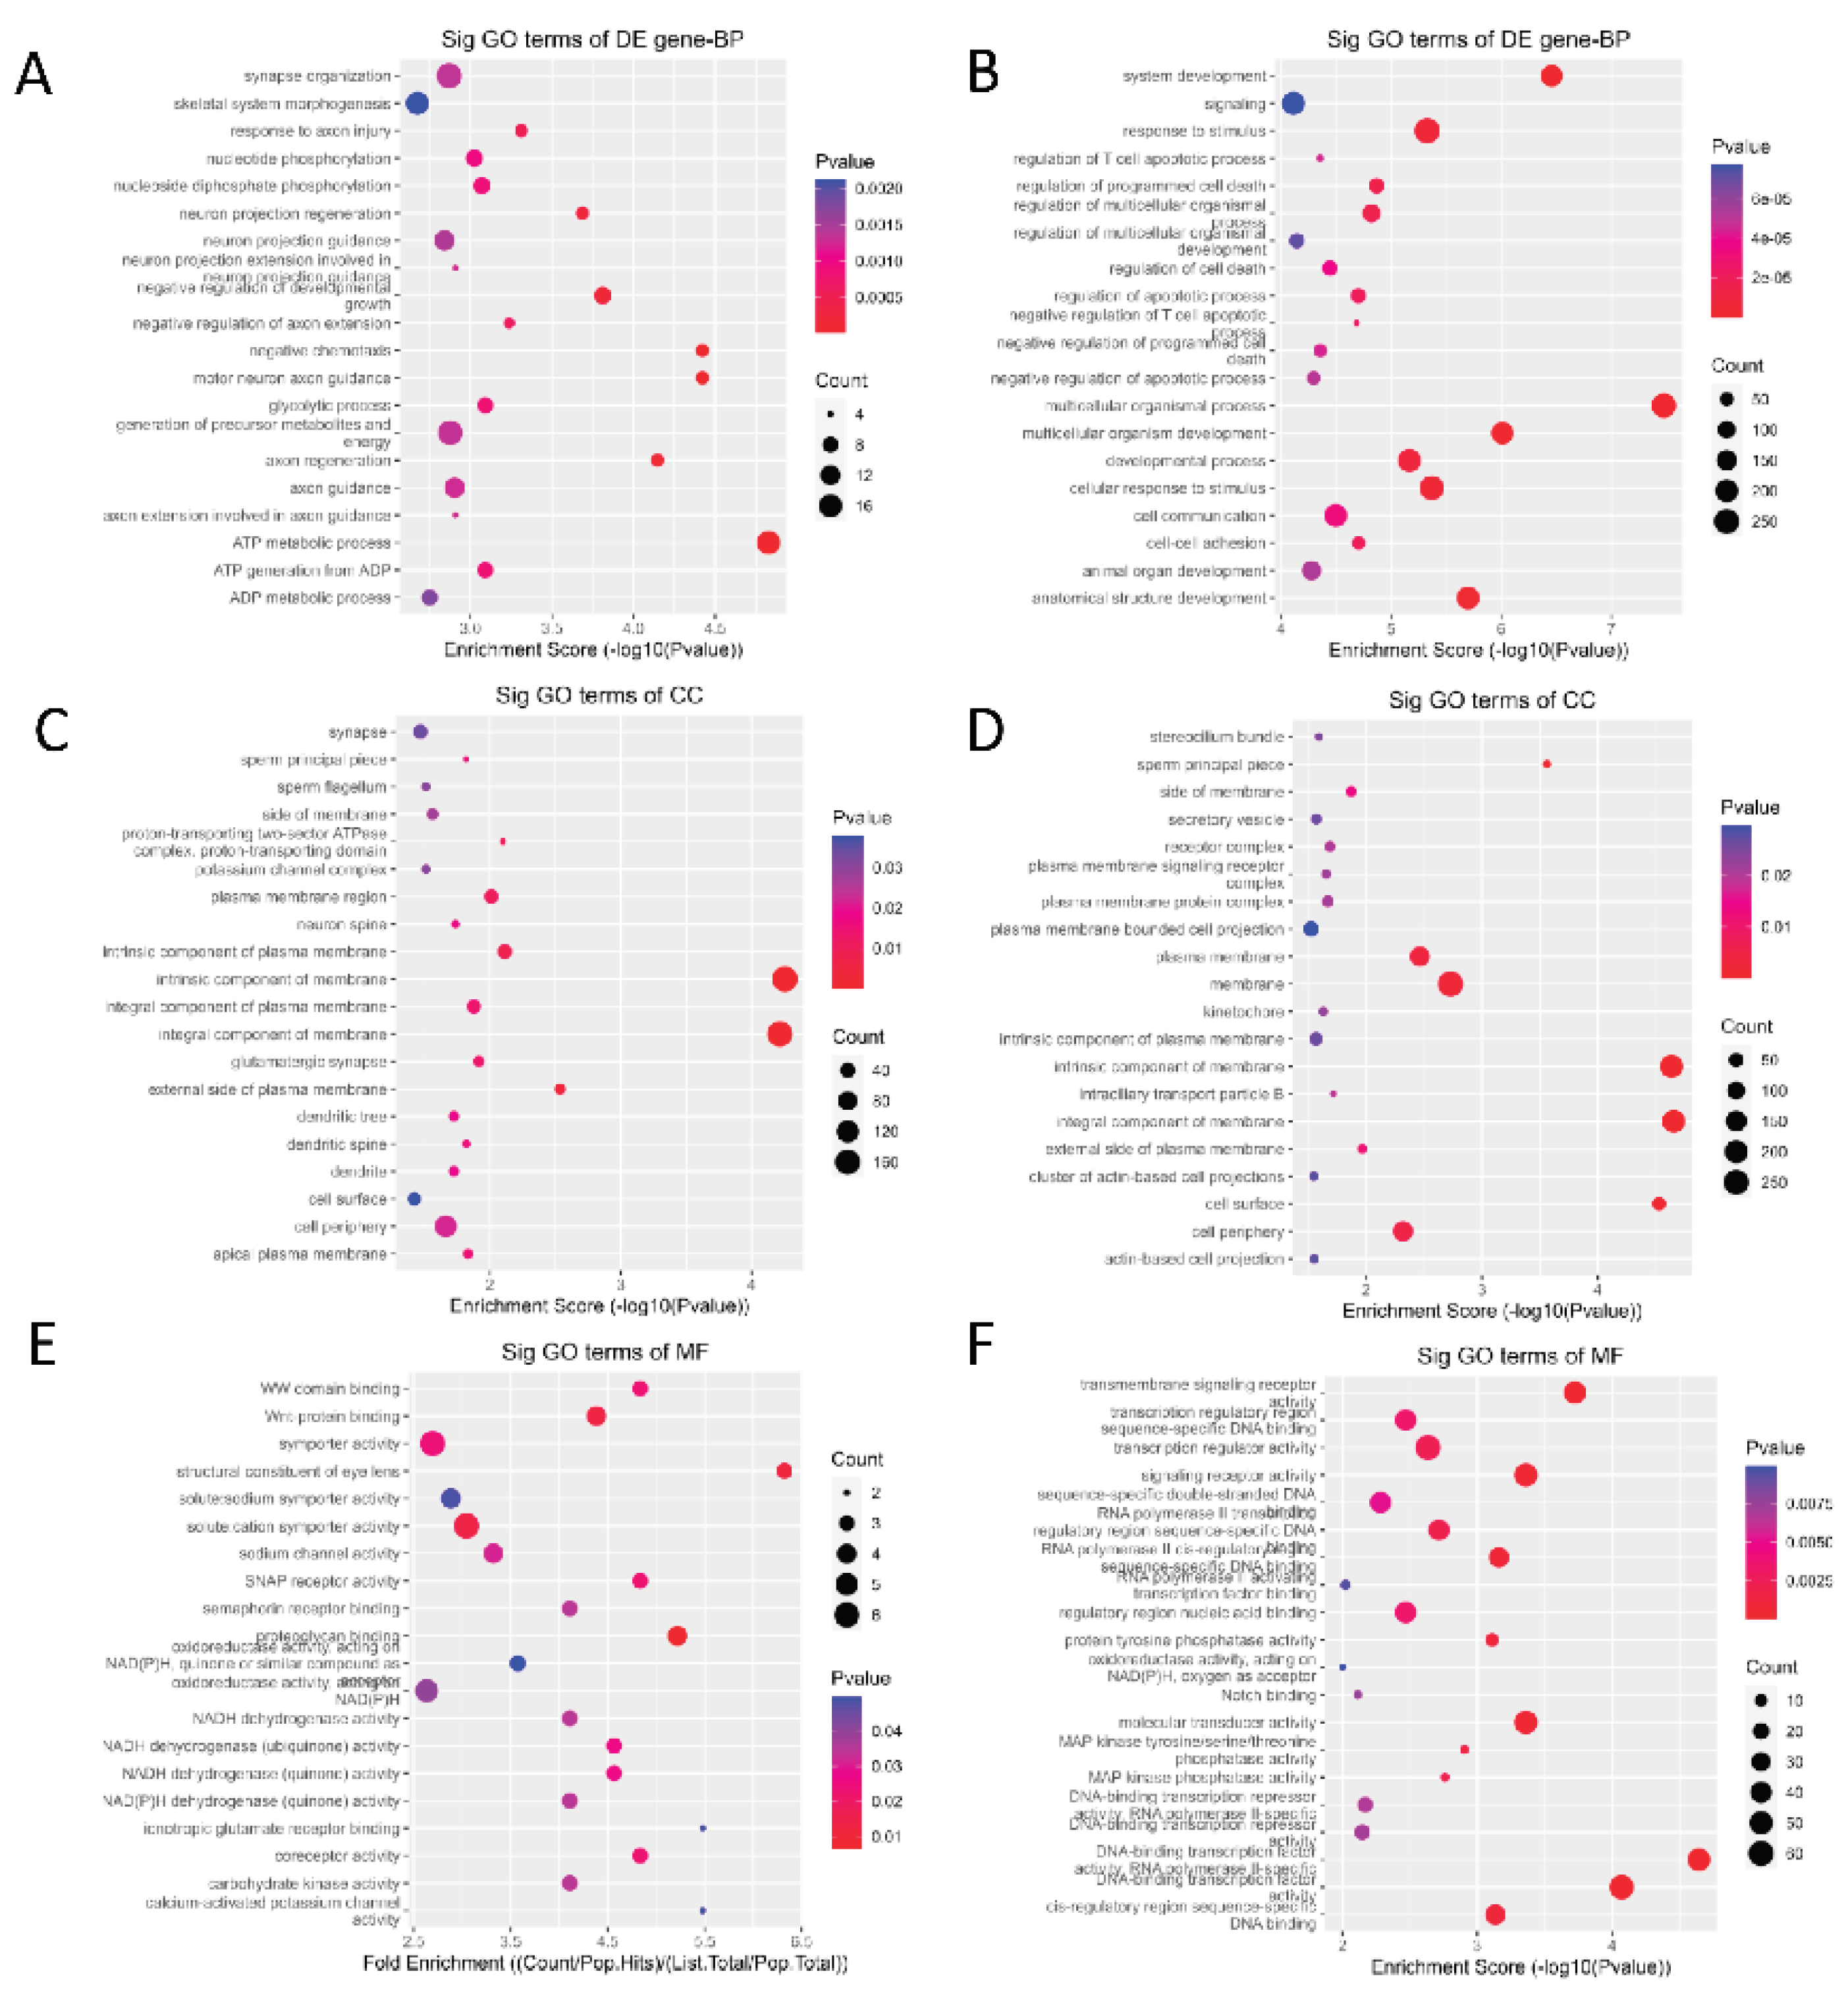
Figure 3.
The Kyoto Encyclopedia of Genes and Genomes pathways of the differentially expressed mRNAs. (A)KEGG pathway of up-regulated expressed DE-mRNAs. (B)KEGG pathway of down-regulated expressed DE-mRNAs.
Figure 3.
The Kyoto Encyclopedia of Genes and Genomes pathways of the differentially expressed mRNAs. (A)KEGG pathway of up-regulated expressed DE-mRNAs. (B)KEGG pathway of down-regulated expressed DE-mRNAs.
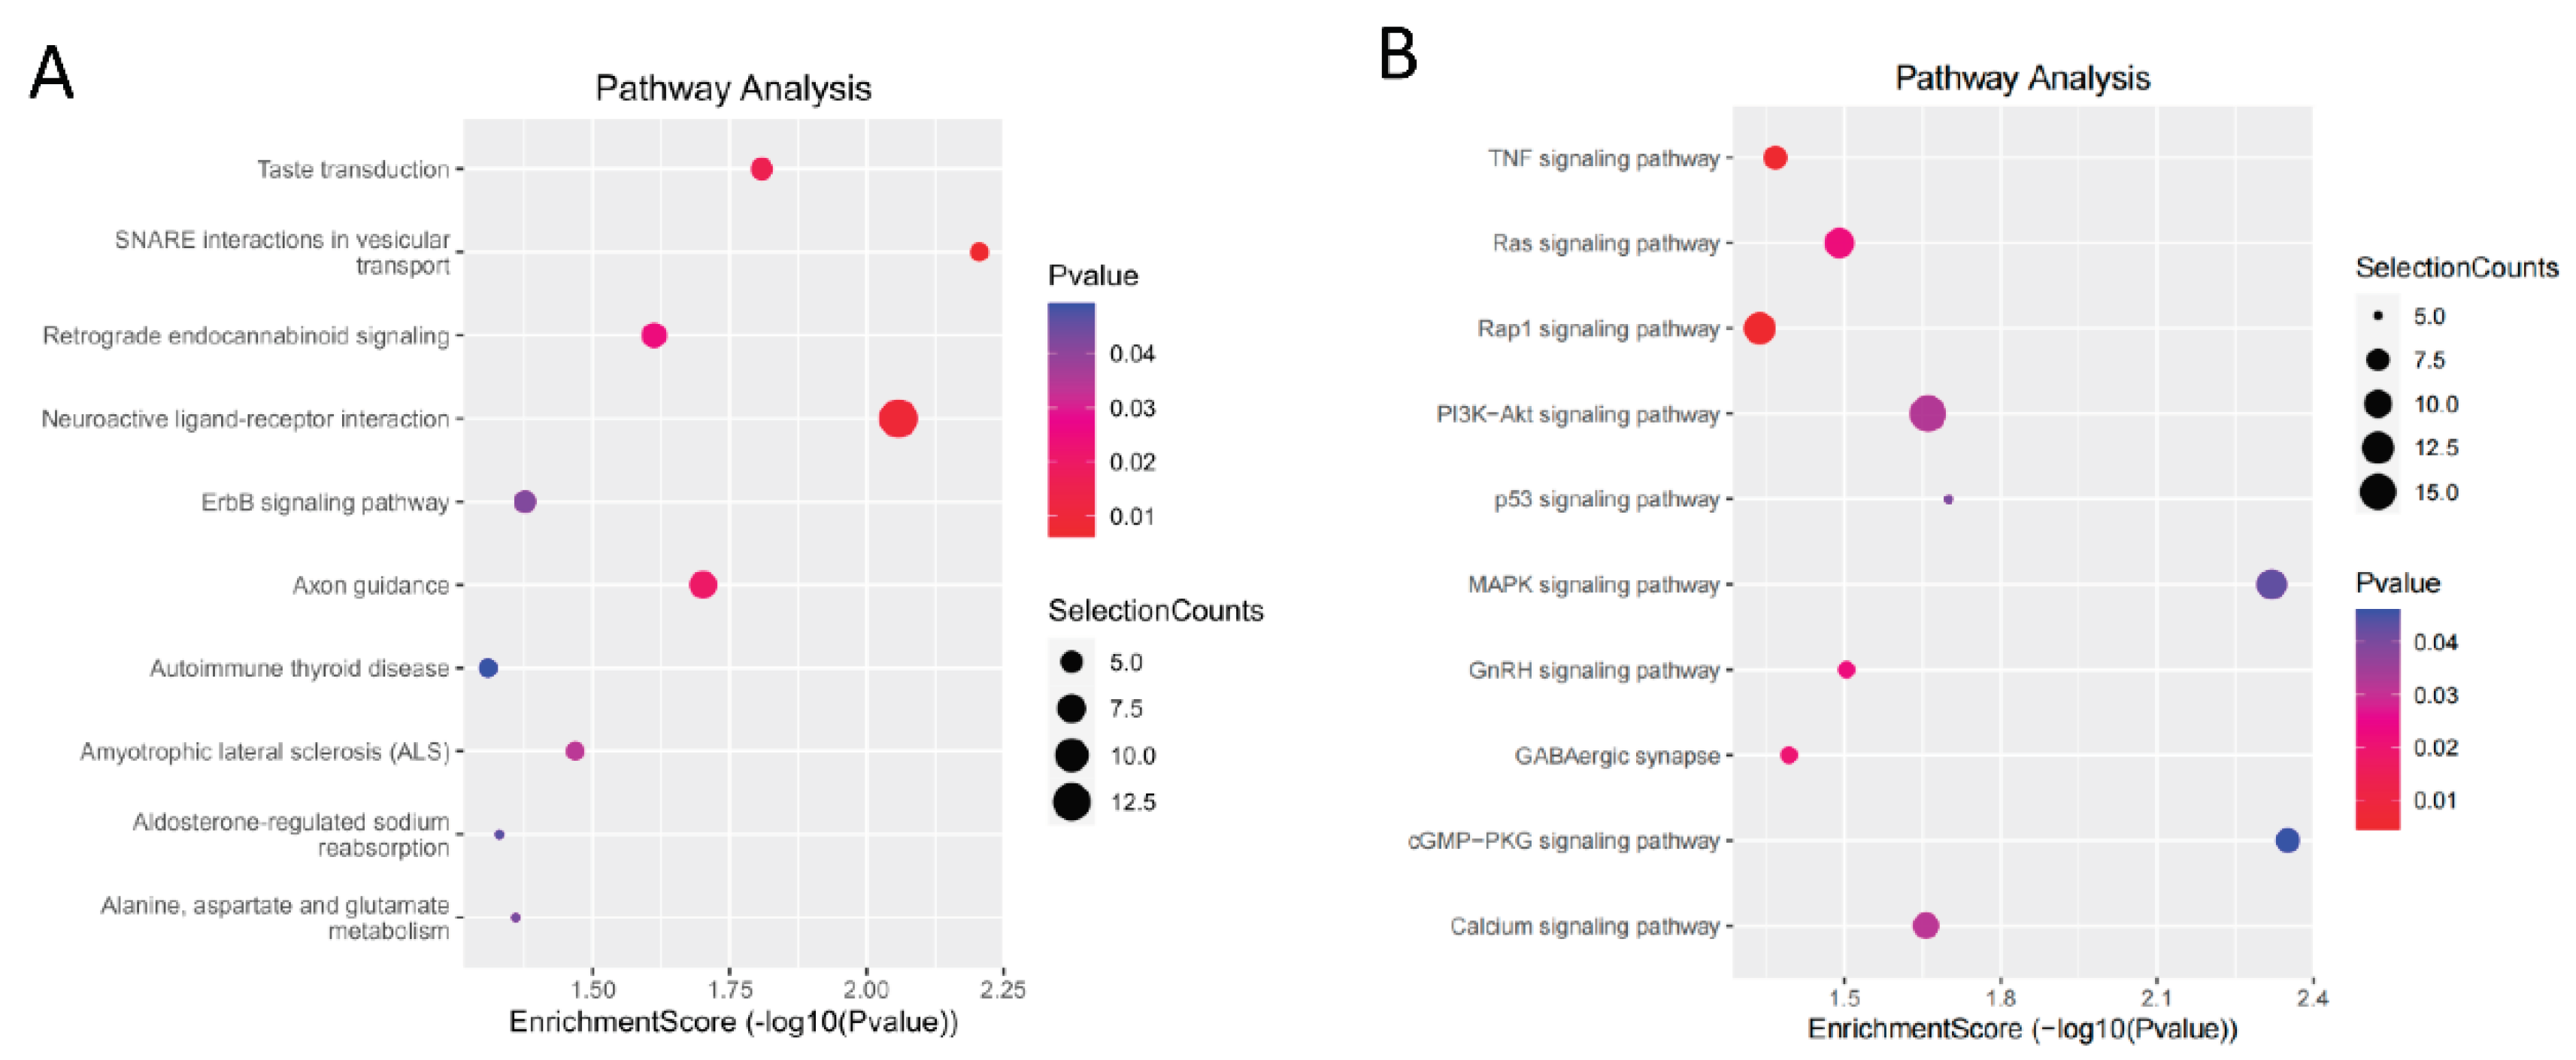
Figure 4.
Differentially expressed miRNAs in goat skeletal muscle. Similarly to the screening and analysis of DE-mRNAs, the heat map (B), volcano map (C), and scatter plot (D) were used to visualize the DE-miRNAs. (C)Using |log2FC| ≥ 1.5 and P < 0.05 as the criteria, differentially expressed miRNAs (DE-miRNAs) between Anhui White goat and Boer goat were screened. A total of 19 differentially expressed miRNAs were obtained, including 7 significantly up-regulated and 12 significantly down-regulated DE-miRNAs.
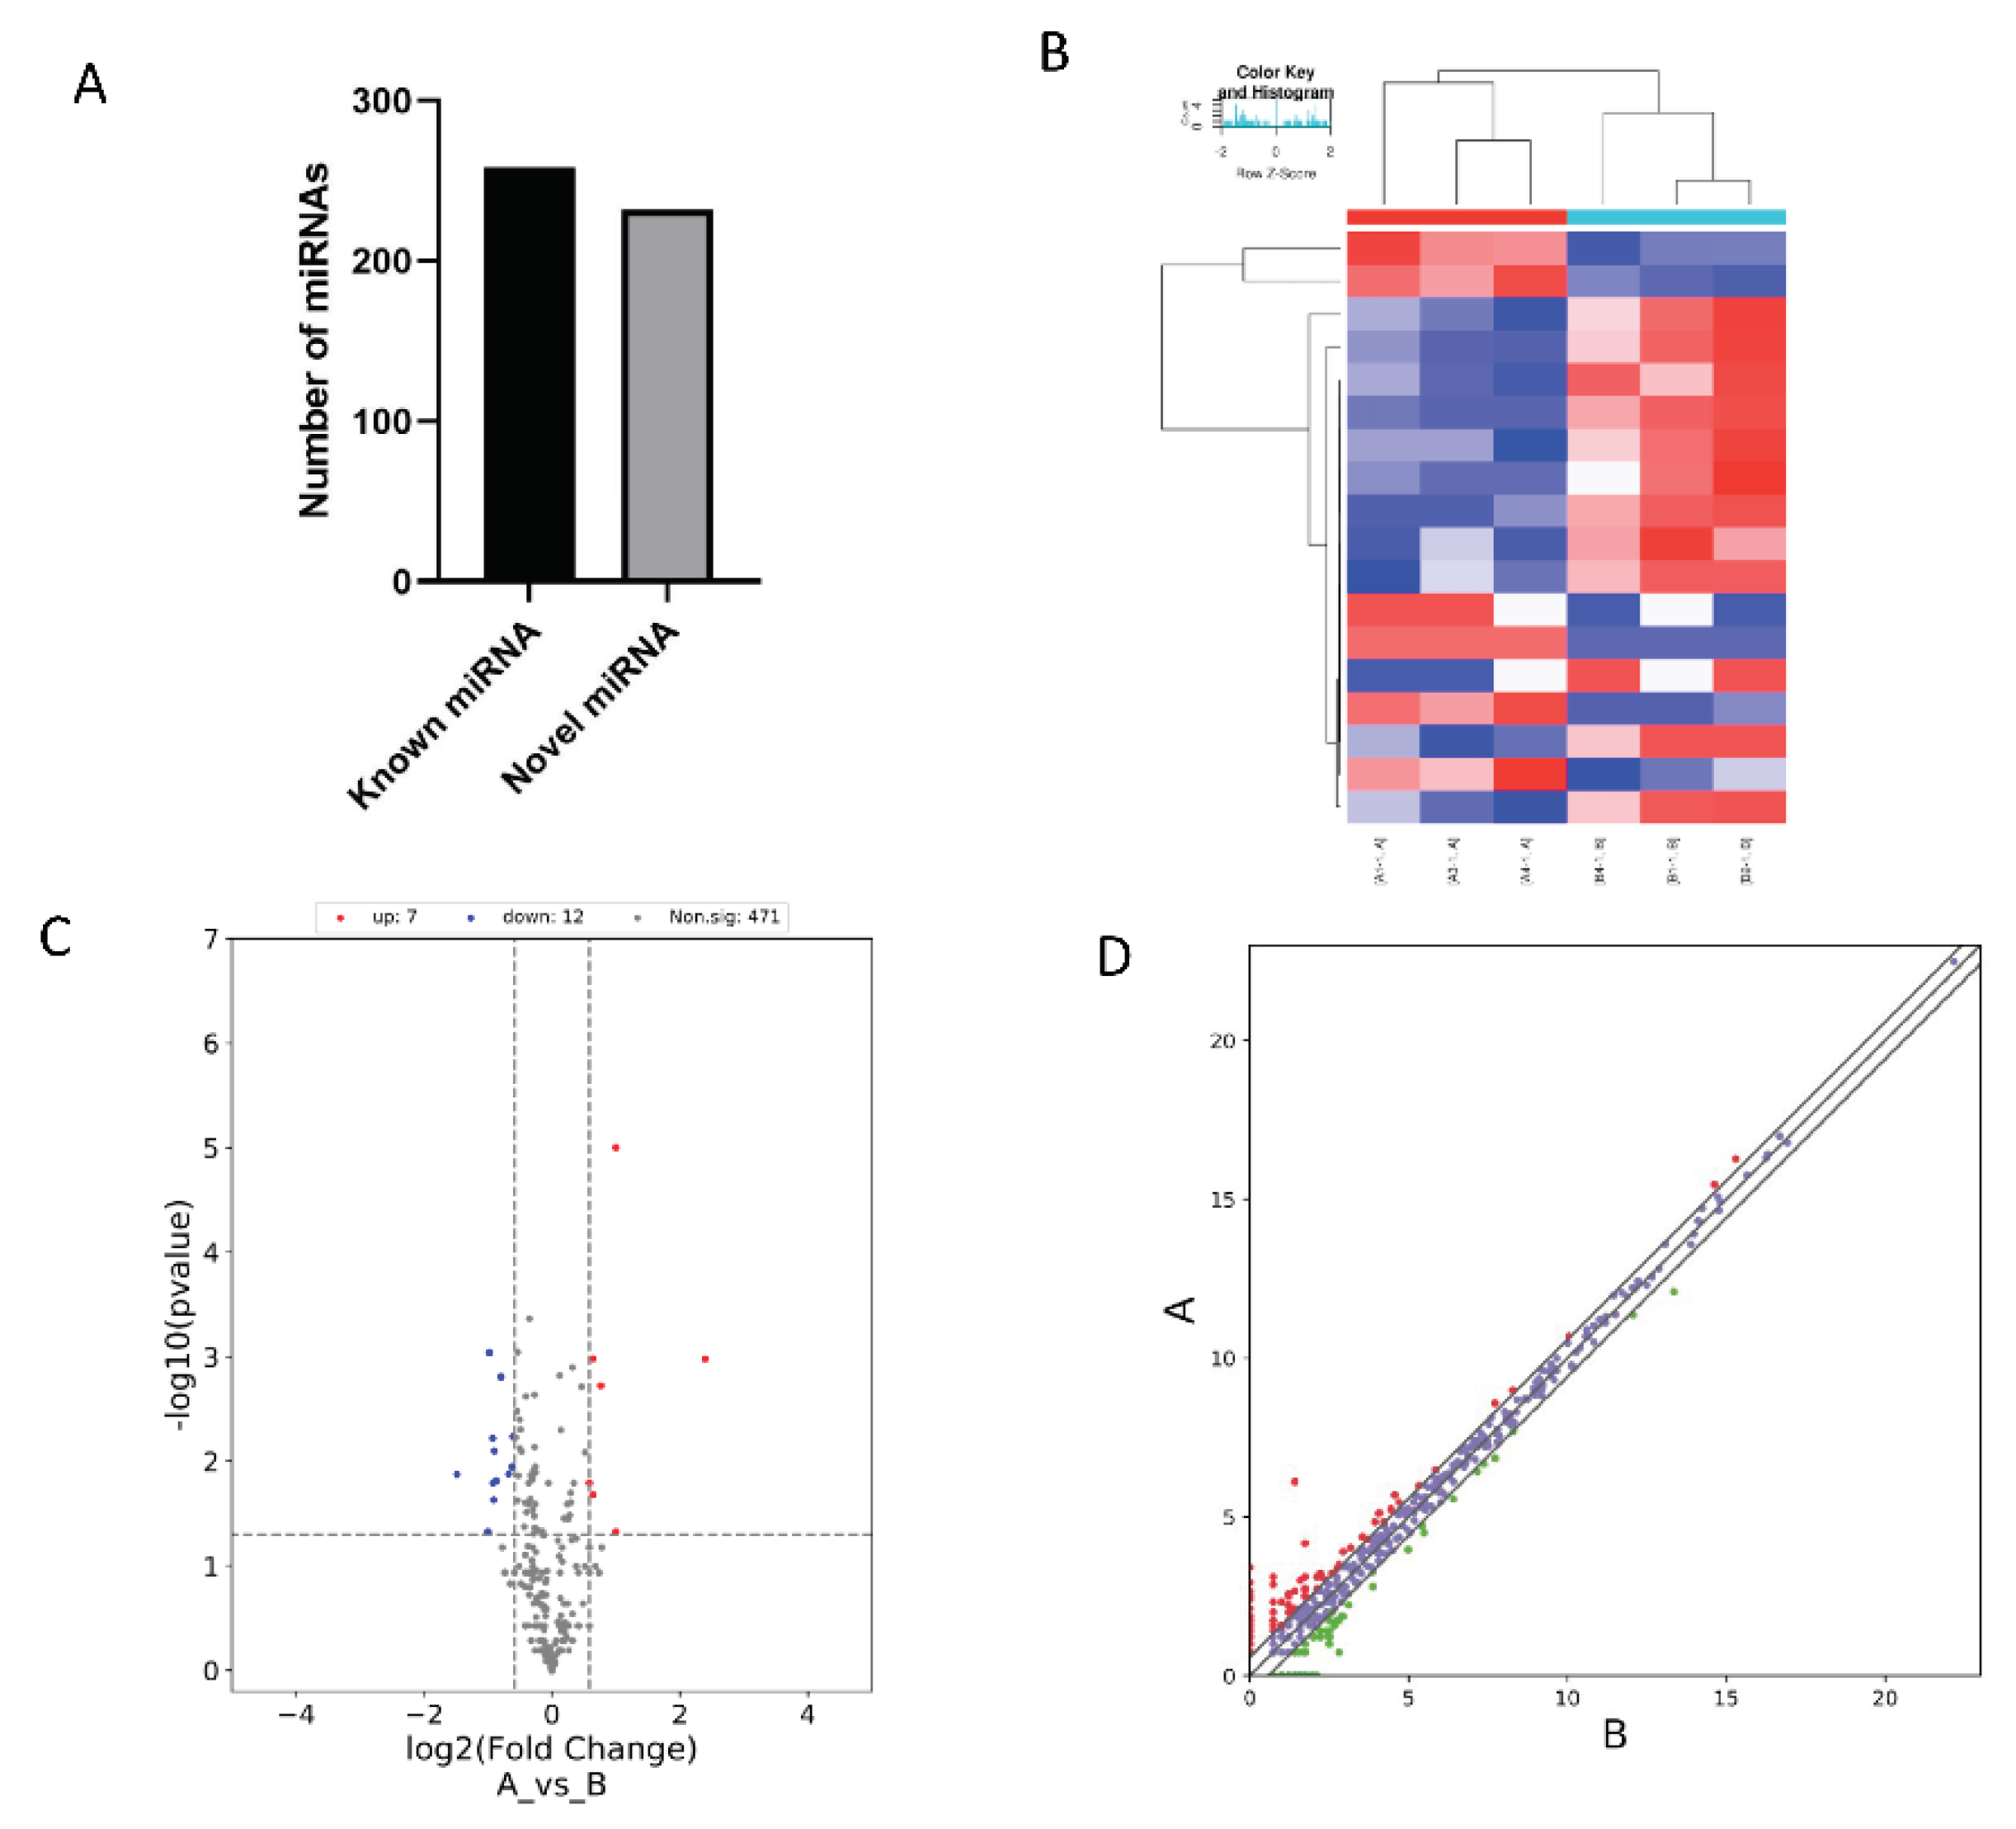
Figure 5.
qPCR validation of miRNA.
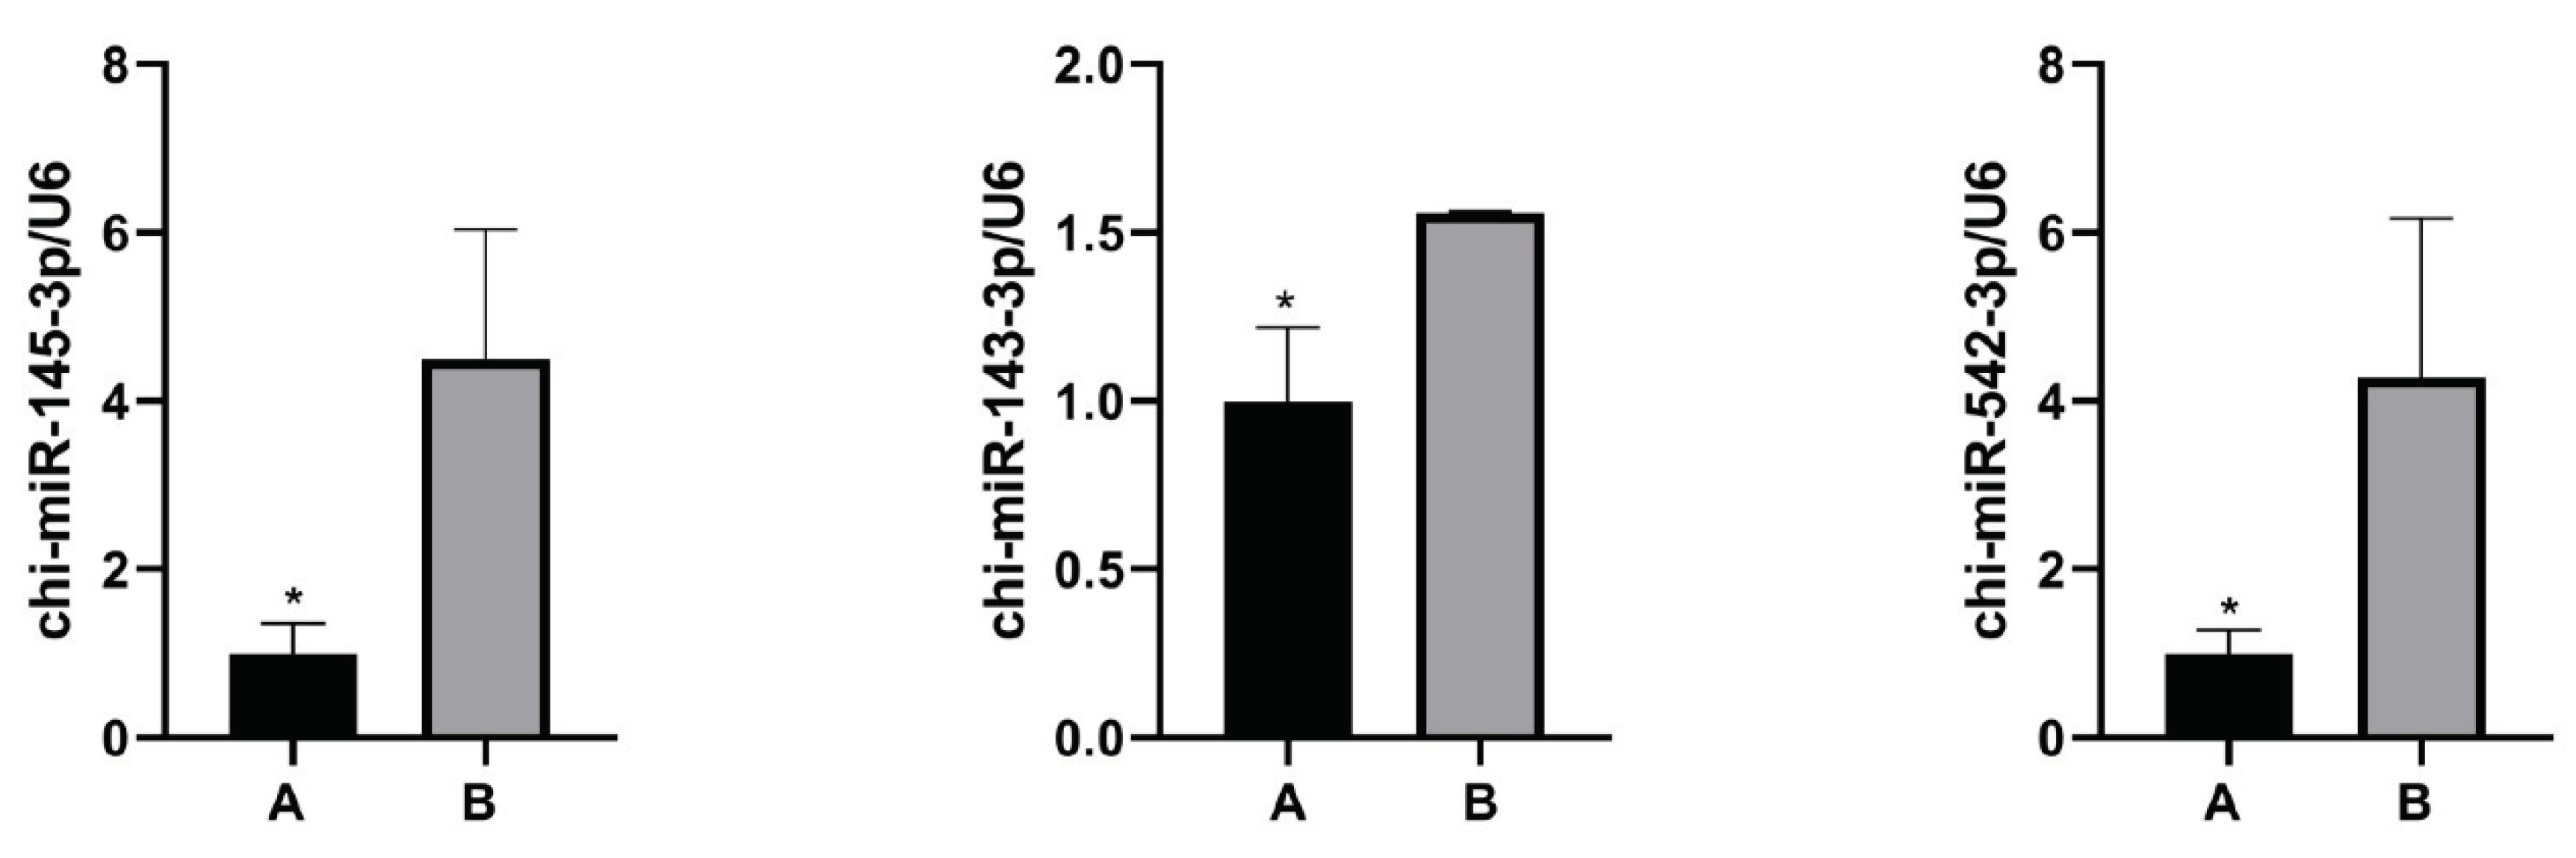

Table 1.
The top 10 up-regulated expresssed Genes.
| GeneID | logFC | logCPM | F | P-value | Regulation |
|---|---|---|---|---|---|
| ENSCHIG00000010149 | 9.483423262 | 0.388072195 | 13.97268681 | 0.018372197 | up |
| ENSCHIG00000015152 | 9.23231796 | 0.150017661 | 33.91012002 | 0.000381799 | up |
| ENSCHIG00000004716 | 9.221642314 | 0.148494891 | 95.54483529 | 1. 16495E-06 | up |
| ENSCHIG00000014836 | 8.996956131 | 1.781080744 | 277.6579615 | 5.30434E-10 | up |
| ENSCHIG00000024172 | 8.934747024 | -0.136865875 | 35.25108874 | 0.000166319 | up |
| ENSCHIG00000006808 | 8.386670169 | 2.840369439 | 582.4092394 | 5.53185E-12 | up |
| ENSCHIG00000022598 | 8.110432472 | -0.890438883 | 26.26202894 | 0.000362517 | up |
| ENSCHIG00000000021 | 8.058706474 | 6.435928313 | 9.225720533 | 0.036331736 | up |
| ENSCHIG00000023072 | 7.795546093 | -1.140677813 | 30.38773443 | 0.000202595 | up |
| ENSCHIG00000001027 | 7.675300773 | -1.253188927 | 24.52803296 | 0.000472517 | up |
Table 2.
The top 10 down-regulated expressed Genes.
| GeneID | logFC | logCPM | F | P-value | regulation |
|---|---|---|---|---|---|
| ENSCHIG00000023243 | -8.677711373 | -0.384347732 | 62.54951441 | 8.6873E-06 | down |
| ENSCHIG00000025604 | -8.196927153 | -0.797685237 | 20.52253855 | 0.001076735 | down |
| ENSCHIG00000023011 | -8.193064894 | -0.813435811 | 36.98252703 | 8.96723E-05 | down |
| ENSCHIG00000015540 | -8.034299245 | -0.976075084 | 35.75101682 | 0.000103459 | down |
| ENSCHIG00000019747 | -7.887940544 | -1.087381495 | 30.2803584 | 0.000205525 | down |
| ENSCHIG00000000274 | -7.779904299 | -1.222892406 | 17.54689267 | 0.001610265 | down |
| ENSCHIG00000021401 | -7.766111107 | -1.193534509 | 27.61848769 | 0.000297268 | down |
| ENSCHIG00000025475 | -7.646978079 | -1.34250276 | 12.70154628 | 0.005168074 | down |
| ENSCHIG00000026287 | -7.614444494 | -1.366237102 | 18.93024168 | 0.00123331 | down |
| ENSCHIG00000021980 | -7.609058815 | -1.326972937 | 16.27707078 | 0.002082884 | down |
Table 3.
Go terms and genes involved in muscle develpoment.
| GO terms | Genes |
|---|---|
| muscle cell | RAMP2, HES1, ADRA1A, LOX, TBX3, DNER, CSRP3, MYLK3, |
| development |
CASQ2, ATP2A2, WFIKKN1, PROX1 PRICKLE1, CD53, RAMP2, HES1, ADRA1A, TNNI3, TNNI1, CAMK1, |
| muscle structure | WFIKKN1, DNER, CHRND, FGF6, MYLK3, CASQ2, IFRD1, BTG2, |
| development |
EGR1, FOS, ATF3, ANKRD1, SOX8, ATP2A2, CSRP3, PROX1, LOX, CCN3, TBX3 OSR1, ADRA1A, TENM4, TNNI3, TNNI1, PROX1, DNER, CSRP3, |
| muscle tissue | PLN, CHRND, BTG2, EGR1, FOS, ATF3, ANKRD1, SOX8, LOX, |
| development |
EYA1, IFRD1, TBX3 EYA1, IFRD1, ADRA1A, TENM4, TNNI3, TNNI1, PROX1, DNER, |
| striated muscle tissue | CSRP3, PLN, CHRND, BTG2, EGR1, FOS, ATF3, ANKRD1, SOX8, |
| development | LOX, TBX3 |
| skeletal muscle cell | BTG2, EGR1, FOS, ATF3, ANKRD1, SOX8 |
| differentiation | |
| muscle cell | IFRD1, CD53, RAMP2, HES1, ADRA1A, CAMK1, LOX, WFIKKN1, |
| differentiation striated muscle cell |
DNER, MYLK3, CASQ2, ATP2A2, CSRP3, PROX1, CCN3, TBX3 CSRP3, LOX, WFIKKN1, DNER, MYLK3, CASQ2, PROX1 |
| development | |
| positive regulation of | |
| muscle tissue | MYOG, BCL2, ACTN3 |
| development | |
| positive regulation of | |
| striated muscle cell | NRG1, ACTN3, BCL2, MYOG |
| differentiation | |
| regulation of muscle | DSG2, ADORA2B, MYLK2, PRKAG3, MYOG, ACTN3, ADRA2B, |
| system process | TNNT3, TNNT2 |
Table 4.
Signal pathways and genes related to muscle growth and development.
| Pathway | Gene |
|---|---|
| ADCY5, ADCY8, FGF6, FLT4, HGF, ID1, ITGA2B, LPAR3, LPAR4, | |
| Rap1 | PDGFC, PRKCZ, RAPGEF5 |
| TNF | CASP3, CREB5, FADD, FOS, JUN, JUNB, PTGS2, SOCS3 |
| GABAergic | ADCY5, ADCY8, GAD2, GNG4, GNGT1, SLC38A3 |
| synapse | ETS2, FGF6, FLT4, GNG4, GNGT1, HGF, PDGFC, PLA2G4, PLD2, |
| Ras | RAPGEF5, SHC3 |
| GnRH |
ADCY5, ADCY8, HBEGF, JUN, PLA2G4A, PLD2 ADCY8, ADRA1A, ATP2A2, BDKRB2, CACNA1E, CHRM3, MYLK3, |
| Calcium |
NOS2, PLN CCNE2, CREB5, FGF6, FLT4, GNG4, GNGT1, HGF, ITGA2B, ITGB6, |
| PI3K-Akt | JAK3, LPAR3, LPAR4, MYC, PDGFC, RELN |
| p53 |
CASP3, CCNE2, CDK1, RRM2, SERPINE1 CACNA1E, CASP3, DUSP1, DUSP10, DUSP16, DUSP5, FGF6, FOS, |
| MAPK | JUN, MYC, PLA2G4A |
| ErbB | MAPK10, NRG1, NRG2, NRG4, RPS6KB2 |
| cGMP-PKG | ADCY5, ADCY8, ADRA1A, ATP2A2, BDKRB2, CREB5, MYLK3, PLN |
Table 5.
DE miRNAs and corresponding target genes related to muscle growt.
| miRNA | Target genes | regulation |
|---|---|---|
| chi-miR-122 | MAPT, GABRP | up |
| chi-miR-10b-5p | BDNF | up |
| chi-miR-21-5p | IL6ST | up |
| chi-miR-217-5p | ICK, ANLN, URB2, MAGEL2 | up |
| chi-miR-425-5p | HTR2A | up |
| chi-miR-novel-LWLT01000027. 1_2673 | GABRG1 | down |
| chi-miR-450-5p | GPHN, CCNE1 | down |
| chi-miR-145-5p | TLR8, BIRC2 | down |
| chi-miR-424-3p | FOS, SMAD7 | down |
| chi-miR-424-5p | MYB, CCNE1 | down |
| chi-miR-499-5p |
ENSCHIG00000024144, THAP6, TMEM207, EMC7, KYNU, TCFL5 |
down |
| chi-miR-novel-7_9719 | STC1 | down |
| chi-miR-143-3p | SMAD4, MBTPS2 | down |
Disclaimer/Publisher’s Note: The statements, opinions and data contained in all publications are solely those of the individual author(s) and contributor(s) and not of MDPI and/or the editor(s). MDPI and/or the editor(s) disclaim responsibility for any injury to people or property resulting from any ideas, methods, instructions or products referred to in the content. |
© 2025 by the authors. Licensee MDPI, Basel, Switzerland. This article is an open access article distributed under the terms and conditions of the Creative Commons Attribution (CC BY) license (http://creativecommons.org/licenses/by/4.0/).
Copyright: This open access article is published under a Creative Commons CC BY 4.0 license, which permit the free download, distribution, and reuse, provided that the author and preprint are cited in any reuse.


