1. Introduction
1.1. The Payload-Processing Trade-Off in UAV Operations
The rapid proliferation of Unmanned Aerial Vehicles (UAVs) has fundamentally reshaped environmental monitoring by shifting remote sensing from predominantly satellite-based observation to on-demand, ultra-high-resolution aerial data acquisition [
1,
2]. As UAV-based sensing becomes increasingly ubiquitous, operational decision-making is no longer limited by data availability but by the practical constraints of acquiring usable information within limited flight time. In real-world deployments, operators face a persistent operational dilemma: optimizing the trade-off between data fidelity, payload weight, and flight endurance [
3].
While active sensors such as light detection and ranging (LiDAR) and data-rich imaging payloads (e.g., hyperspectral systems) can provide detailed three-dimensional or spectral information, these instruments substantially increase takeoff weight and power consumption. This directly tightens Size, Weight, and Power (SWaP) constraints, reducing battery life, operational range, and mission flexibility [
4]. Furthermore, the massive data volume generated by these sensors typically requires offloading to high-performance workstations for post-flight processing. This creates a significant "latency gap" that limits rapid, in-field decision-making and undermines time-sensitive management actions, such as immediate disaster response or rapid infrastructure inspection.
1.2. The Operational Gap: Edge Computing vs. Environmental Heterogeneity
To reduce SWaP burdens and enable scalable UAV operations, there is a growing paradigm shift toward utilizing lightweight RGB payloads coupled with advanced computer vision (CV) methods. This approach aims to move analysis from centralized servers to "the edge"—the UAV platform itself—through embedded computing systems such as NVIDIA Jetson modules [
5,
6]. However, the practical deployment of deep learning on aerial platforms remains constrained by two coupled barriers.
First, embedded hardware limits the feasibility of computationally intensive architectures. Two-stage instance segmentation frameworks (e.g., Mask R-CNN) are widely recognized for high precision, yet their computational cost often prevents real-time onboard inference under typical embedded configurations [
7]. In contrast, one-stage frameworks are designed for higher throughput and may better satisfy onboard latency requirements, but they must balance speed with accuracy, particularly when precise instance-level delineation is required for object counting and inventory tasks.
Second, UAV monitoring targets are rarely homogeneous. Urban environments, in particular, introduce extreme heterogeneity through complex backgrounds, cast shadows, and strong occlusion effects. In urban forestry, overlapping tree crowns can appear as continuous vegetation masses in 2D RGB imagery, confusing segmentation pipelines that perform well in open or low-clutter scenes [
8,
9]. Consequently, robust operational systems must remain effective under dense canopy overlap and data-sparse conditions without depending on heavy, specialized sensors. This creates a critical operational gap: while edge computing promises responsiveness and scalability, environmental complexity can rapidly erode segmentation reliability if models and workflows are not designed with heterogeneity-aware constraints in mind.
1.3. Research Objectives
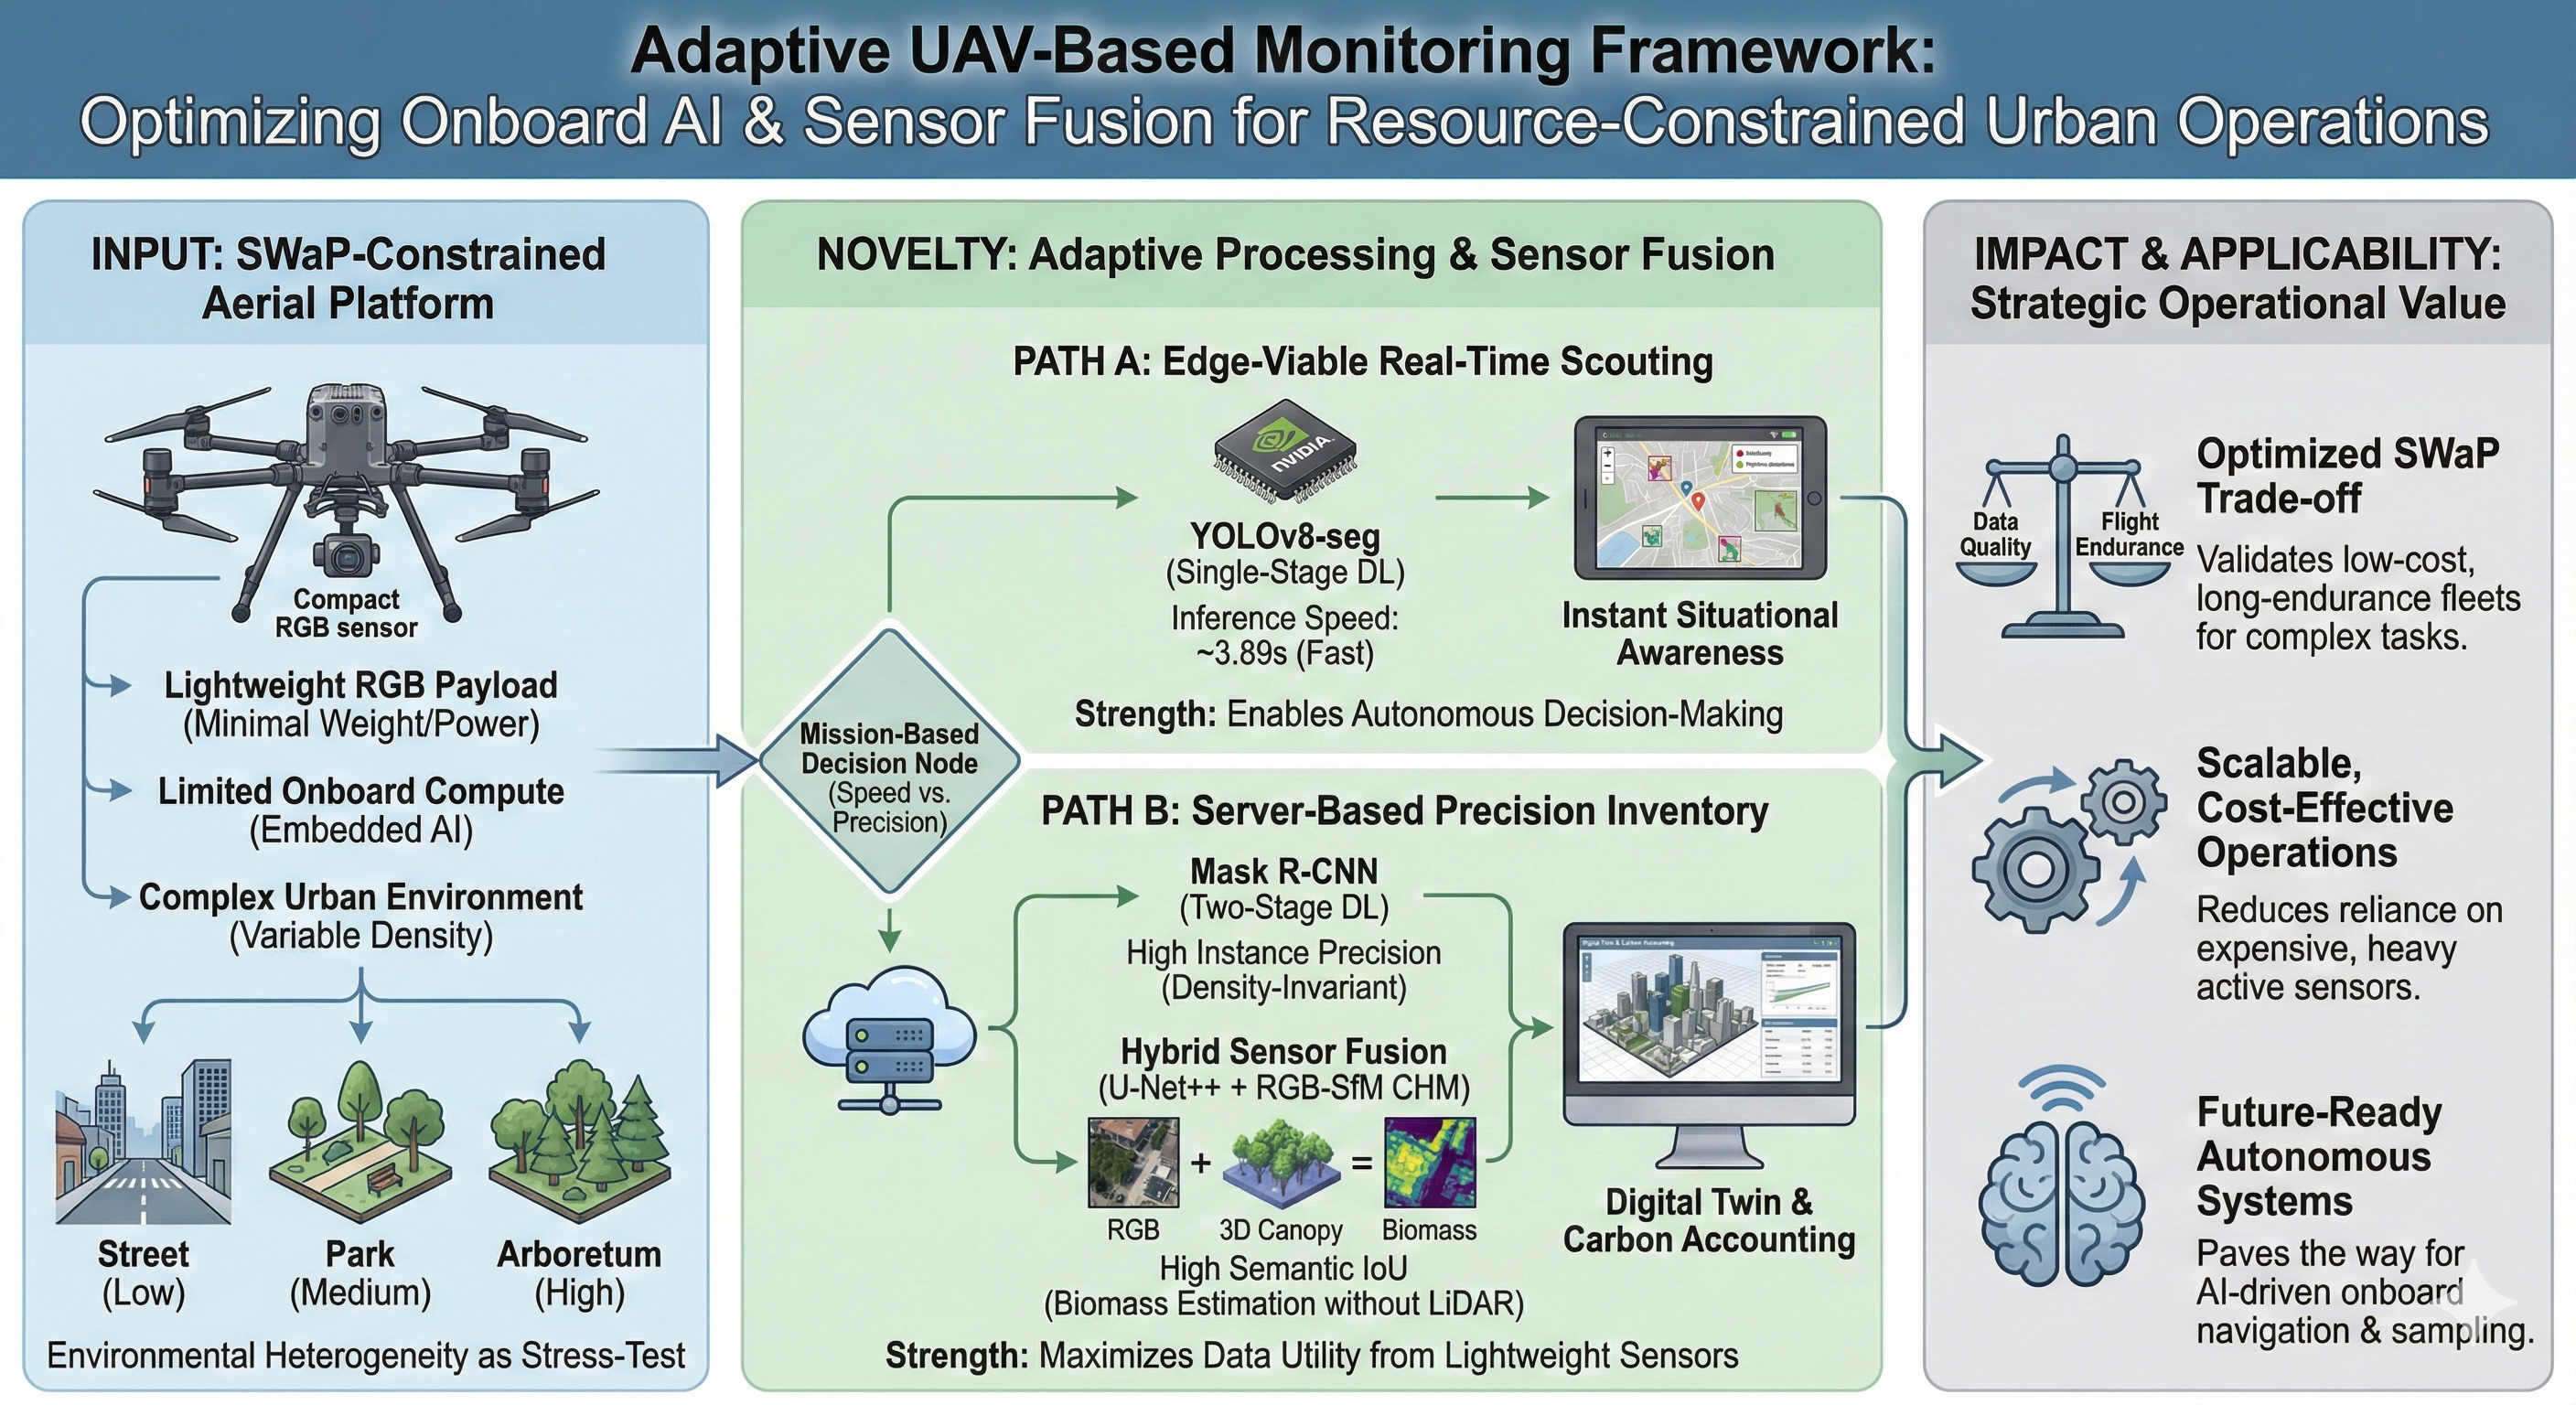
In response to these challenges, this study proposes an Adaptive UAV Monitoring Framework that optimizes the utility of lightweight sensor payloads under resource-constrained conditions. Urban forestry is selected as a representative high-difficulty testbed due to its heterogeneous backgrounds and severe canopy occlusion, which stress both deep learning and traditional CV approaches [
8,
9]. The uniqueness of this study lies in its rigorous "stress-testing" of algorithms across varying density zones to derive engineering-grade operational rules. Accordingly, the objectives of this study are as follows:
Validate low-SWaP sensing using RGB + SfM-derived structure: Evaluate whether photogrammetric Structure-from-Motion (SfM) products generated from basic RGB imagery can provide effective structural cues for tree crown segmentation, thereby supporting workflows that reduce reliance on heavier payloads while maintaining practical segmentation utility [
10,
11].
Assess onboard viability via speed–accuracy benchmarking: Quantify the feasibility of edge deployment by benchmarking inference speed and segmentation performance across representative one-stage and two-stage architectures—specifically YOLOv8-seg as an edge-oriented candidate and Mask R-CNN as a precision-oriented reference—to clarify the speed–accuracy trade-off under constrained computation [
12,
13].
Derive operational guidance through a mission-oriented decision matrix: Translate empirical benchmarking results into actionable deployment rules by establishing a mission-oriented decision matrix that supports model selection based on allowable latency, onboard compute availability, and expected canopy density/occlusion regimes.
Collectively, these objectives aim to bridge the gap between algorithmic performance and operational feasibility, providing a reproducible basis for selecting UAV sensor–algorithm combinations suited to heterogeneous urban environments.
2. Materials and Methods
2.1. Study Area and Environmental Stratification
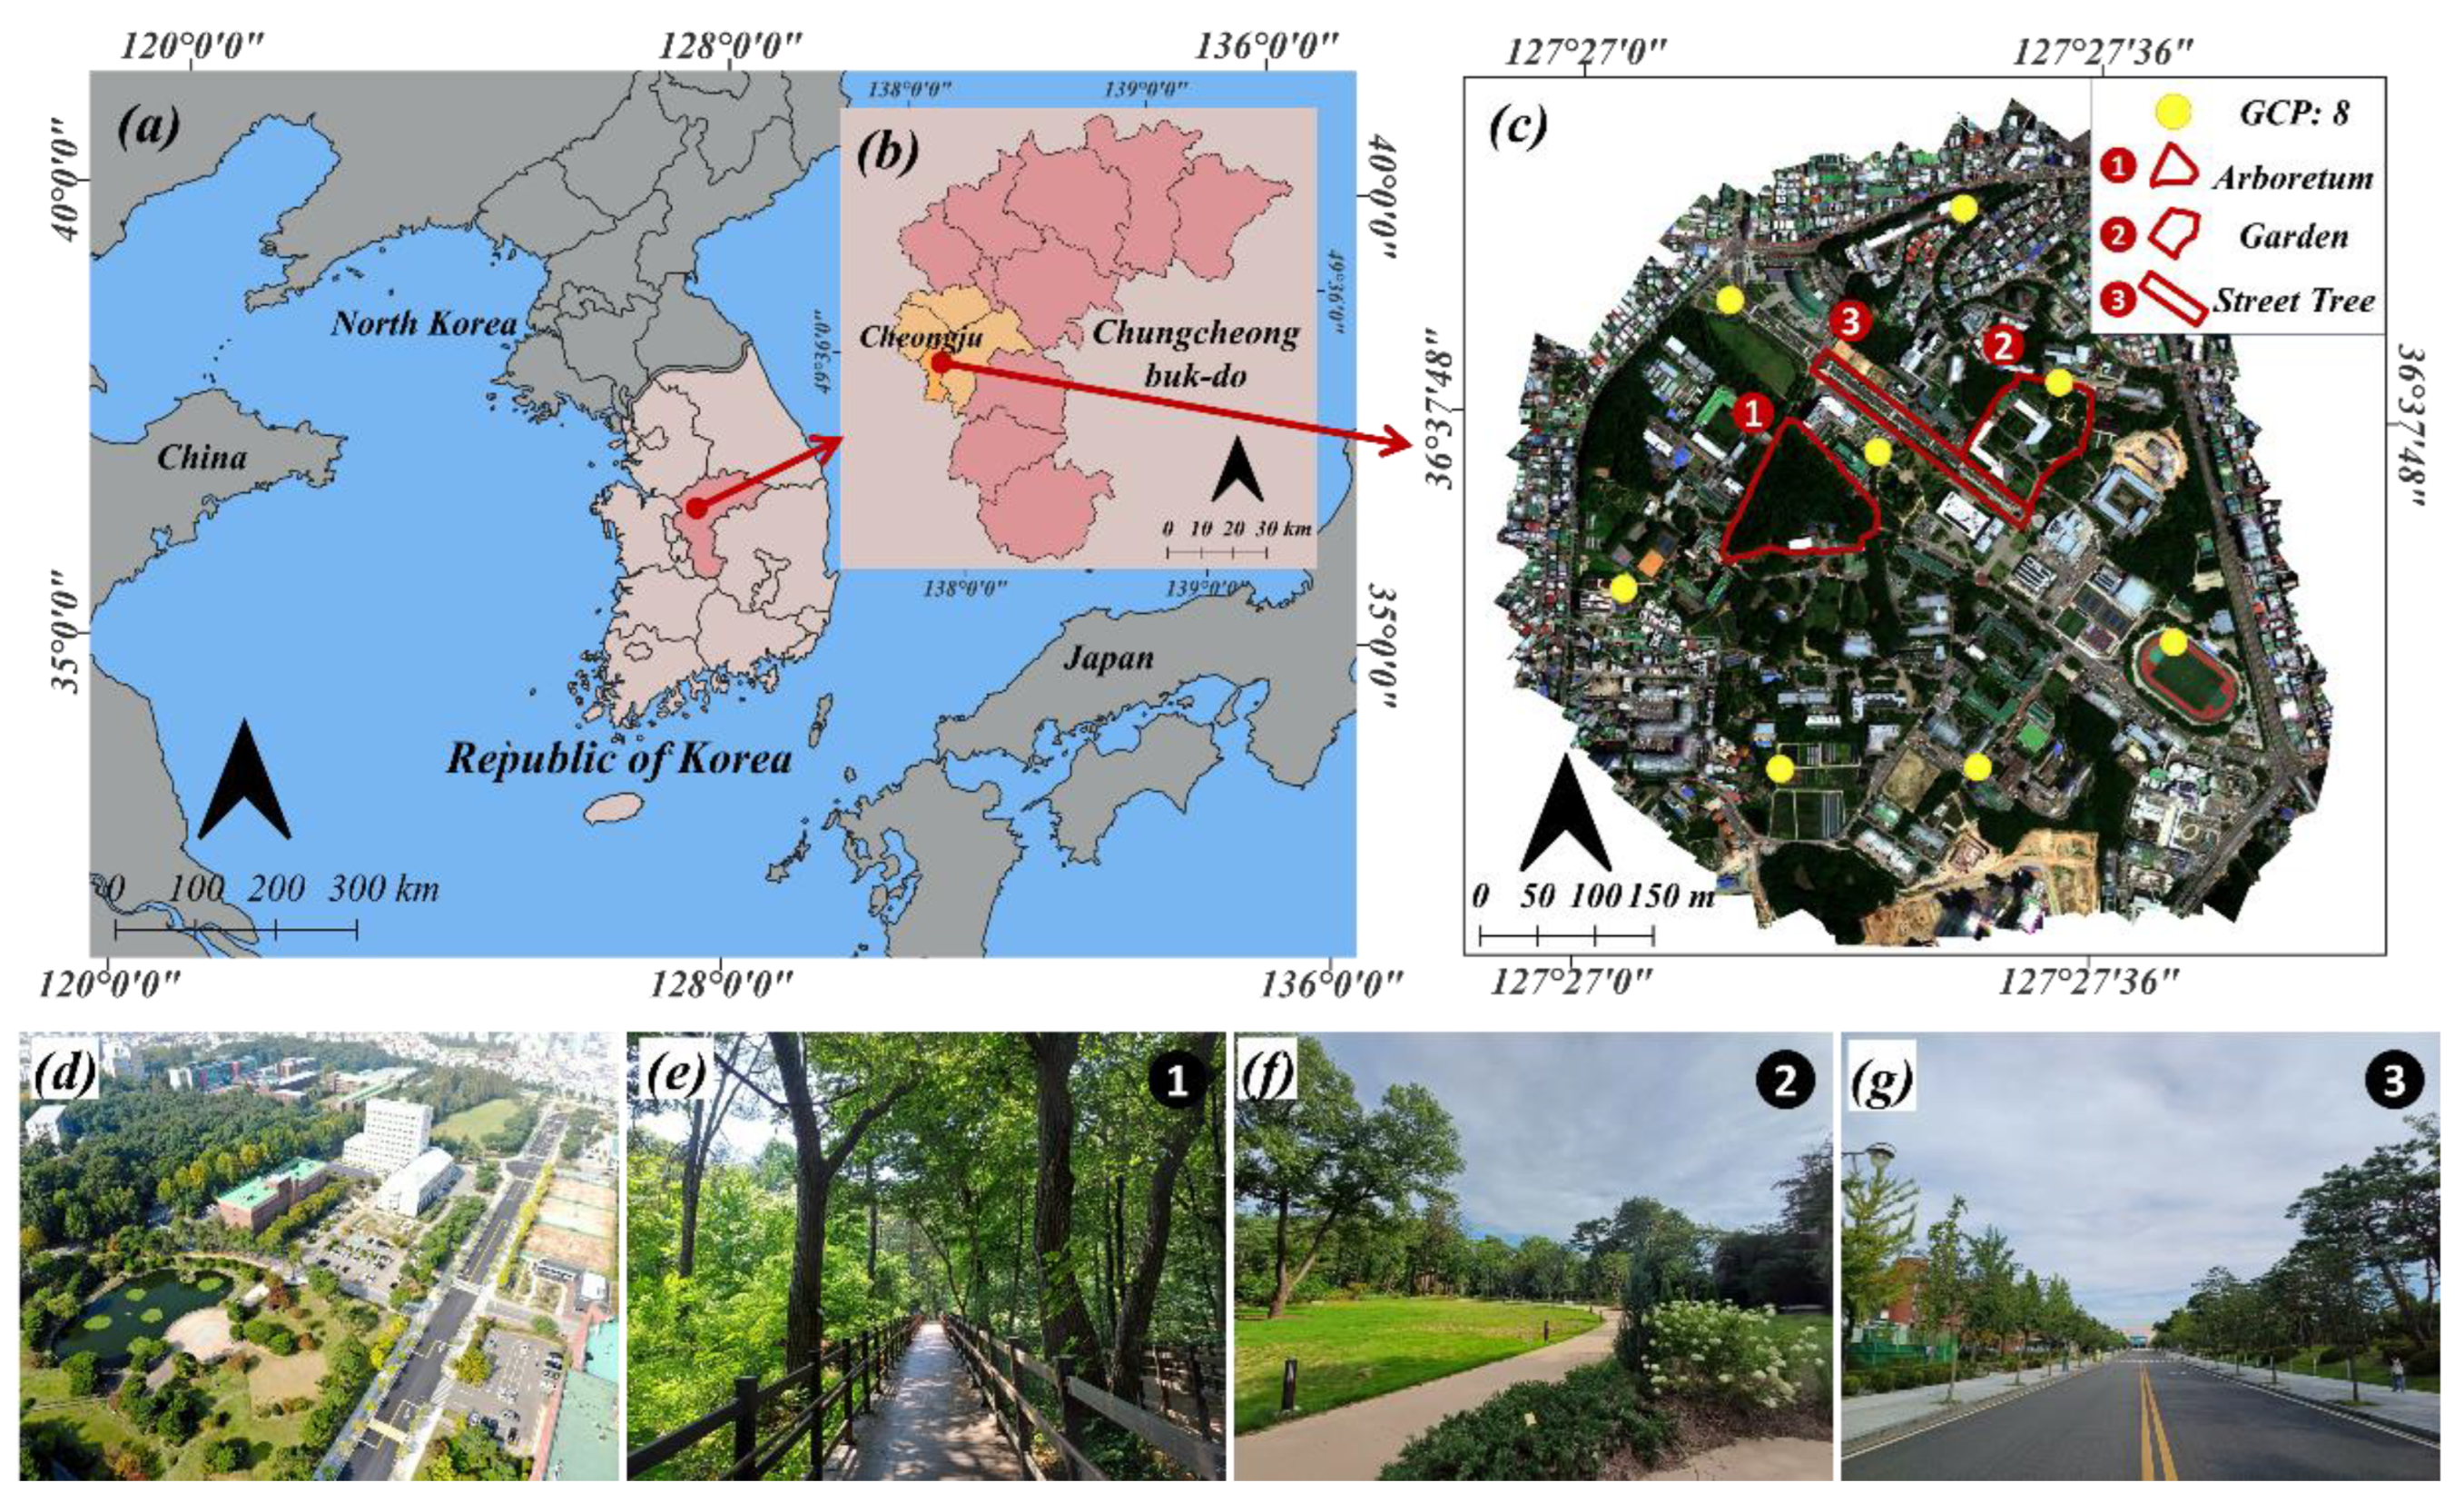
This research was conducted at Chungbuk National University in Cheongju-si, Chungcheongbuk-do, Republic of Korea ). Located in the Temperate Central Forest Zone, Cheongju features distinct seasonal variations and a diverse mix of coniferous and deciduous vegetation. The region is ecologically significant, ranking 5th in South Korea for urban forest area (70,209 ha) and 2nd in per capita living urban forest area 23.10).
To rigorously analyze instance delineation performance across varying vegetation densities, we selected three distinct Ecological Functional Zones (EFZs) within the campus (
Figure 1). Data collection occurred in July 2025 during the leaf-on season to ensure optimal canopy visibility.
Zone I: High-Density Forest (Arboretum): A mixed forest comprising broadleaf species (e.g., Quercus acutissima, Cornus controversa) and conifers (Pinus densiflora, Pinus strobus). This zone presents the most challenging segmentation conditions due to continuous canopy cover, severe crown overlap, and high species diversity lacking distinct boundaries.
Zone II: Medium-Density Park (Yeonriwon): Characterized by individual trees and small clusters within open grassy areas. While less dense than the arboretum, complex boundaries and heterogeneous backgrounds create an intermediate difficulty level.
Zone III: Low-Density Street (Main Gate Avenue): Features Ginkgo biloba and Chionanthus retusus planted at regular intervals. The clear contrast against asphalt and minimal crown overlap offer the most favorable conditions for instance separation.
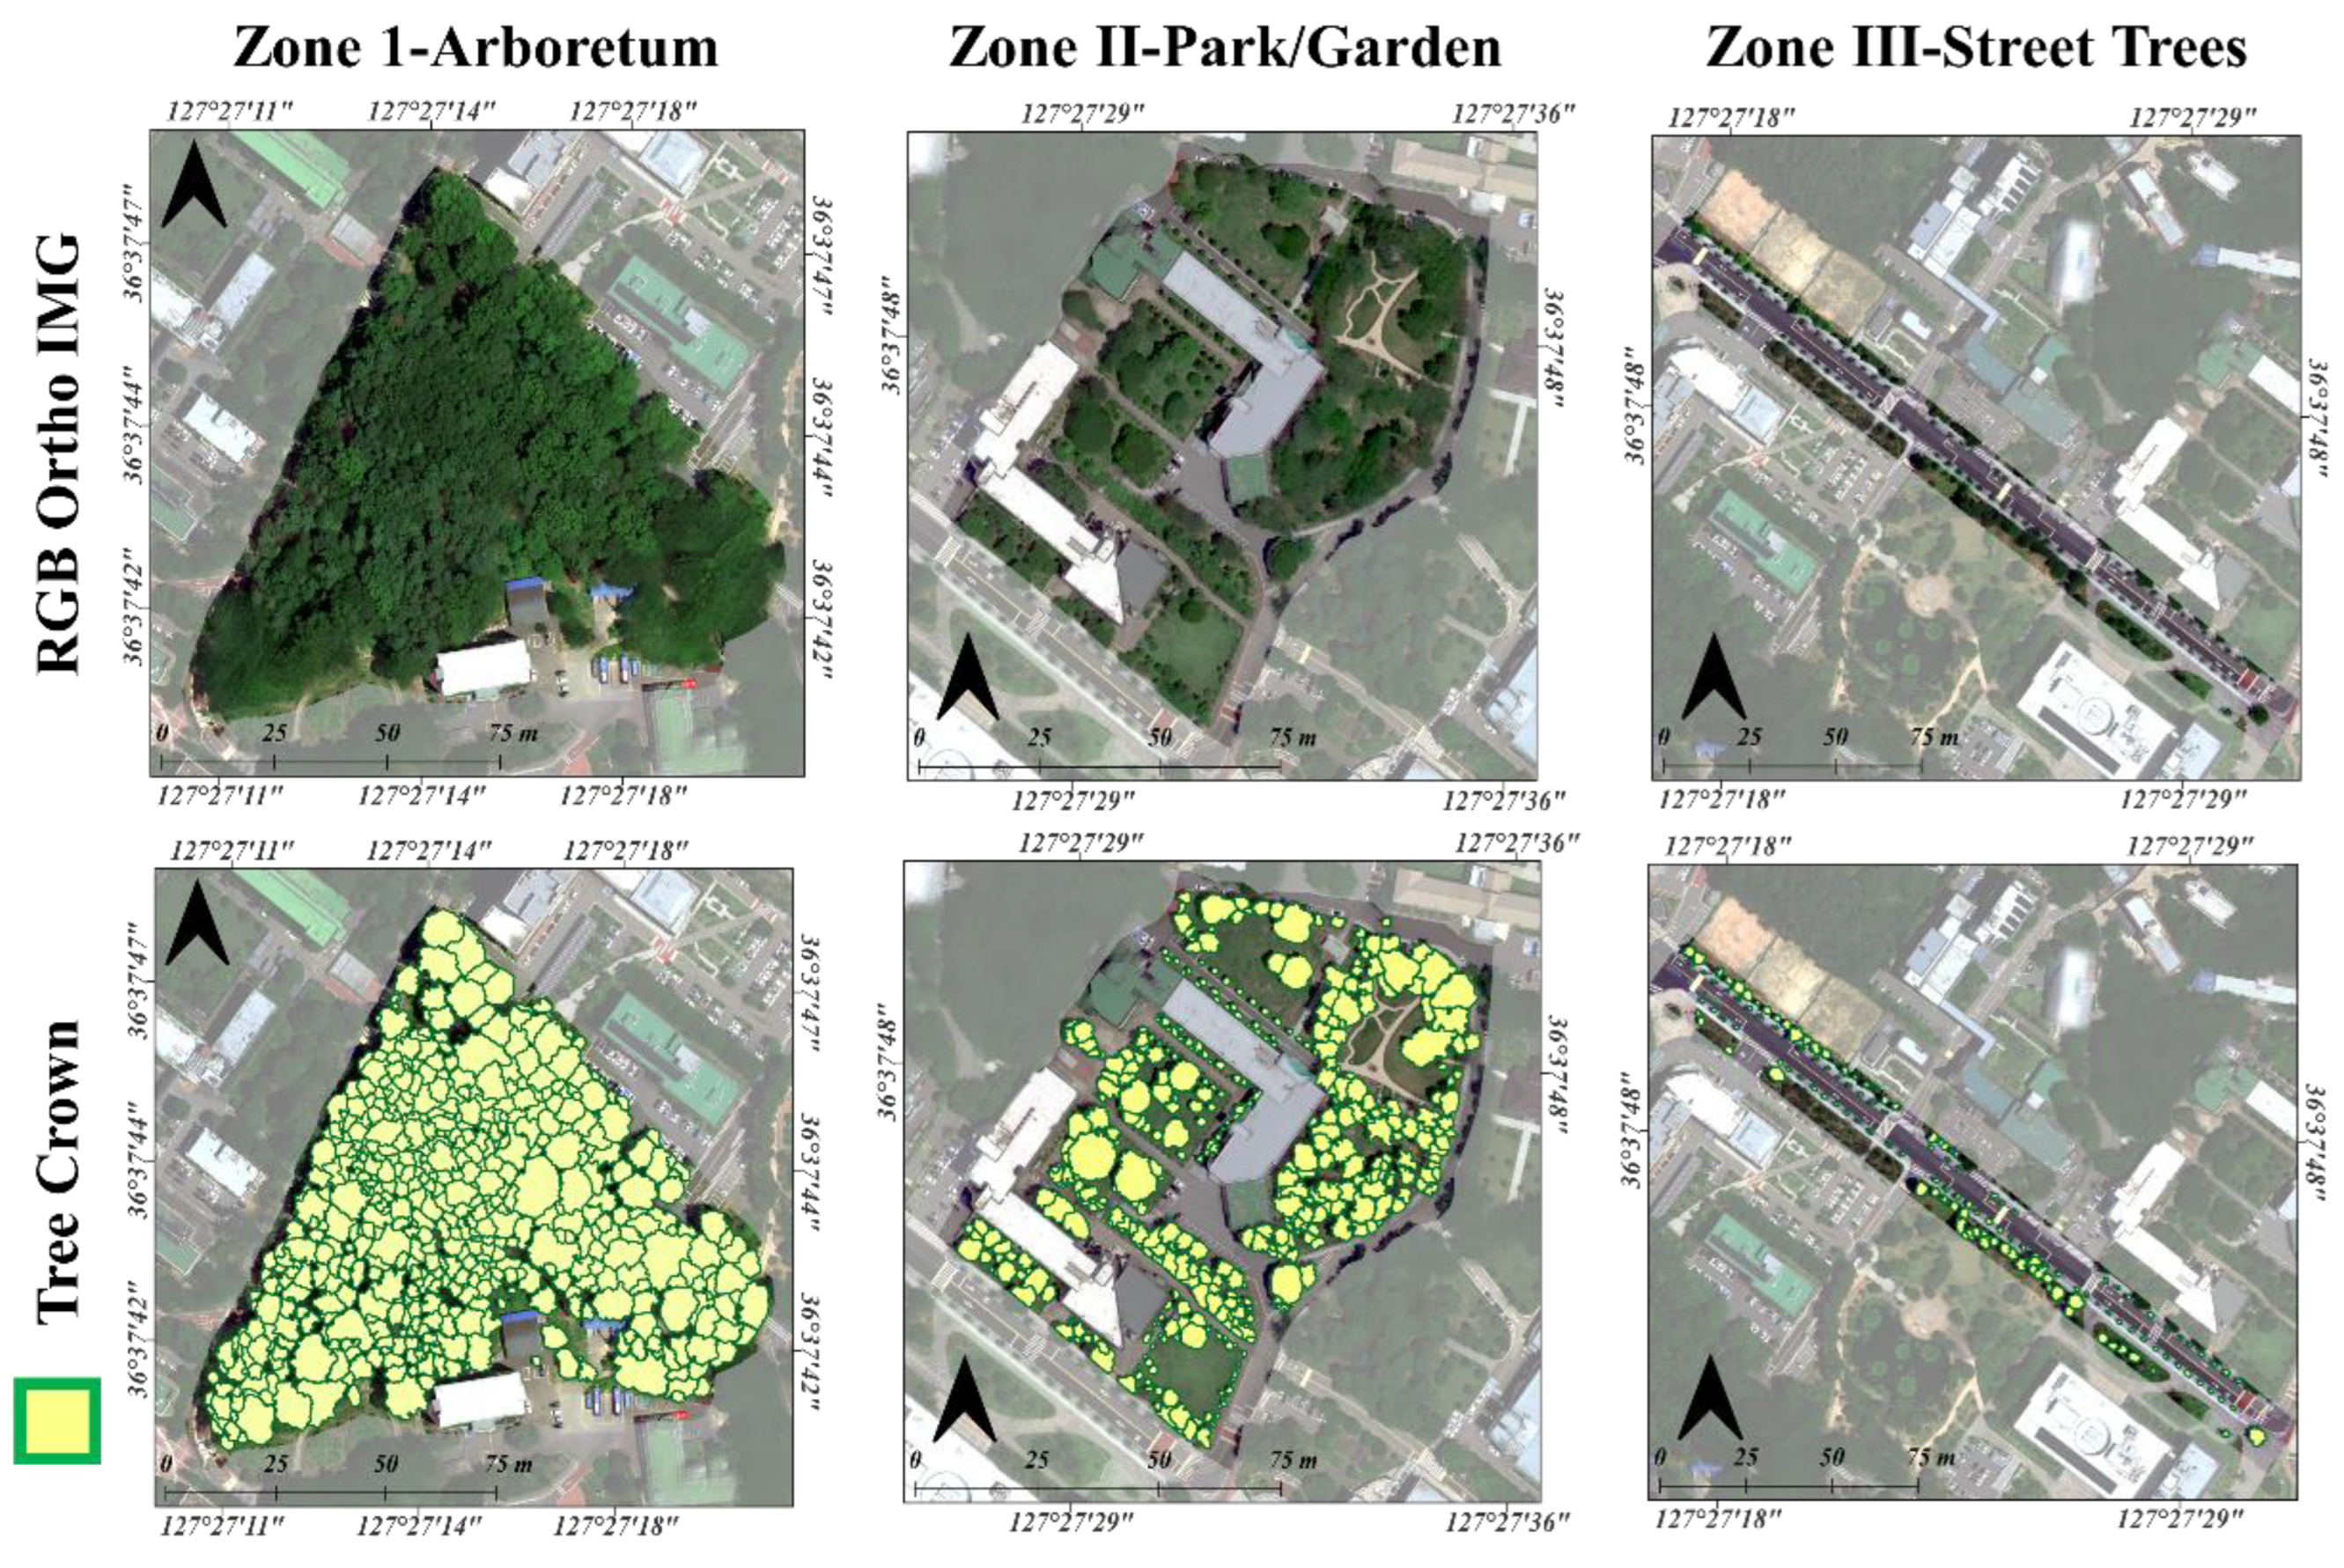
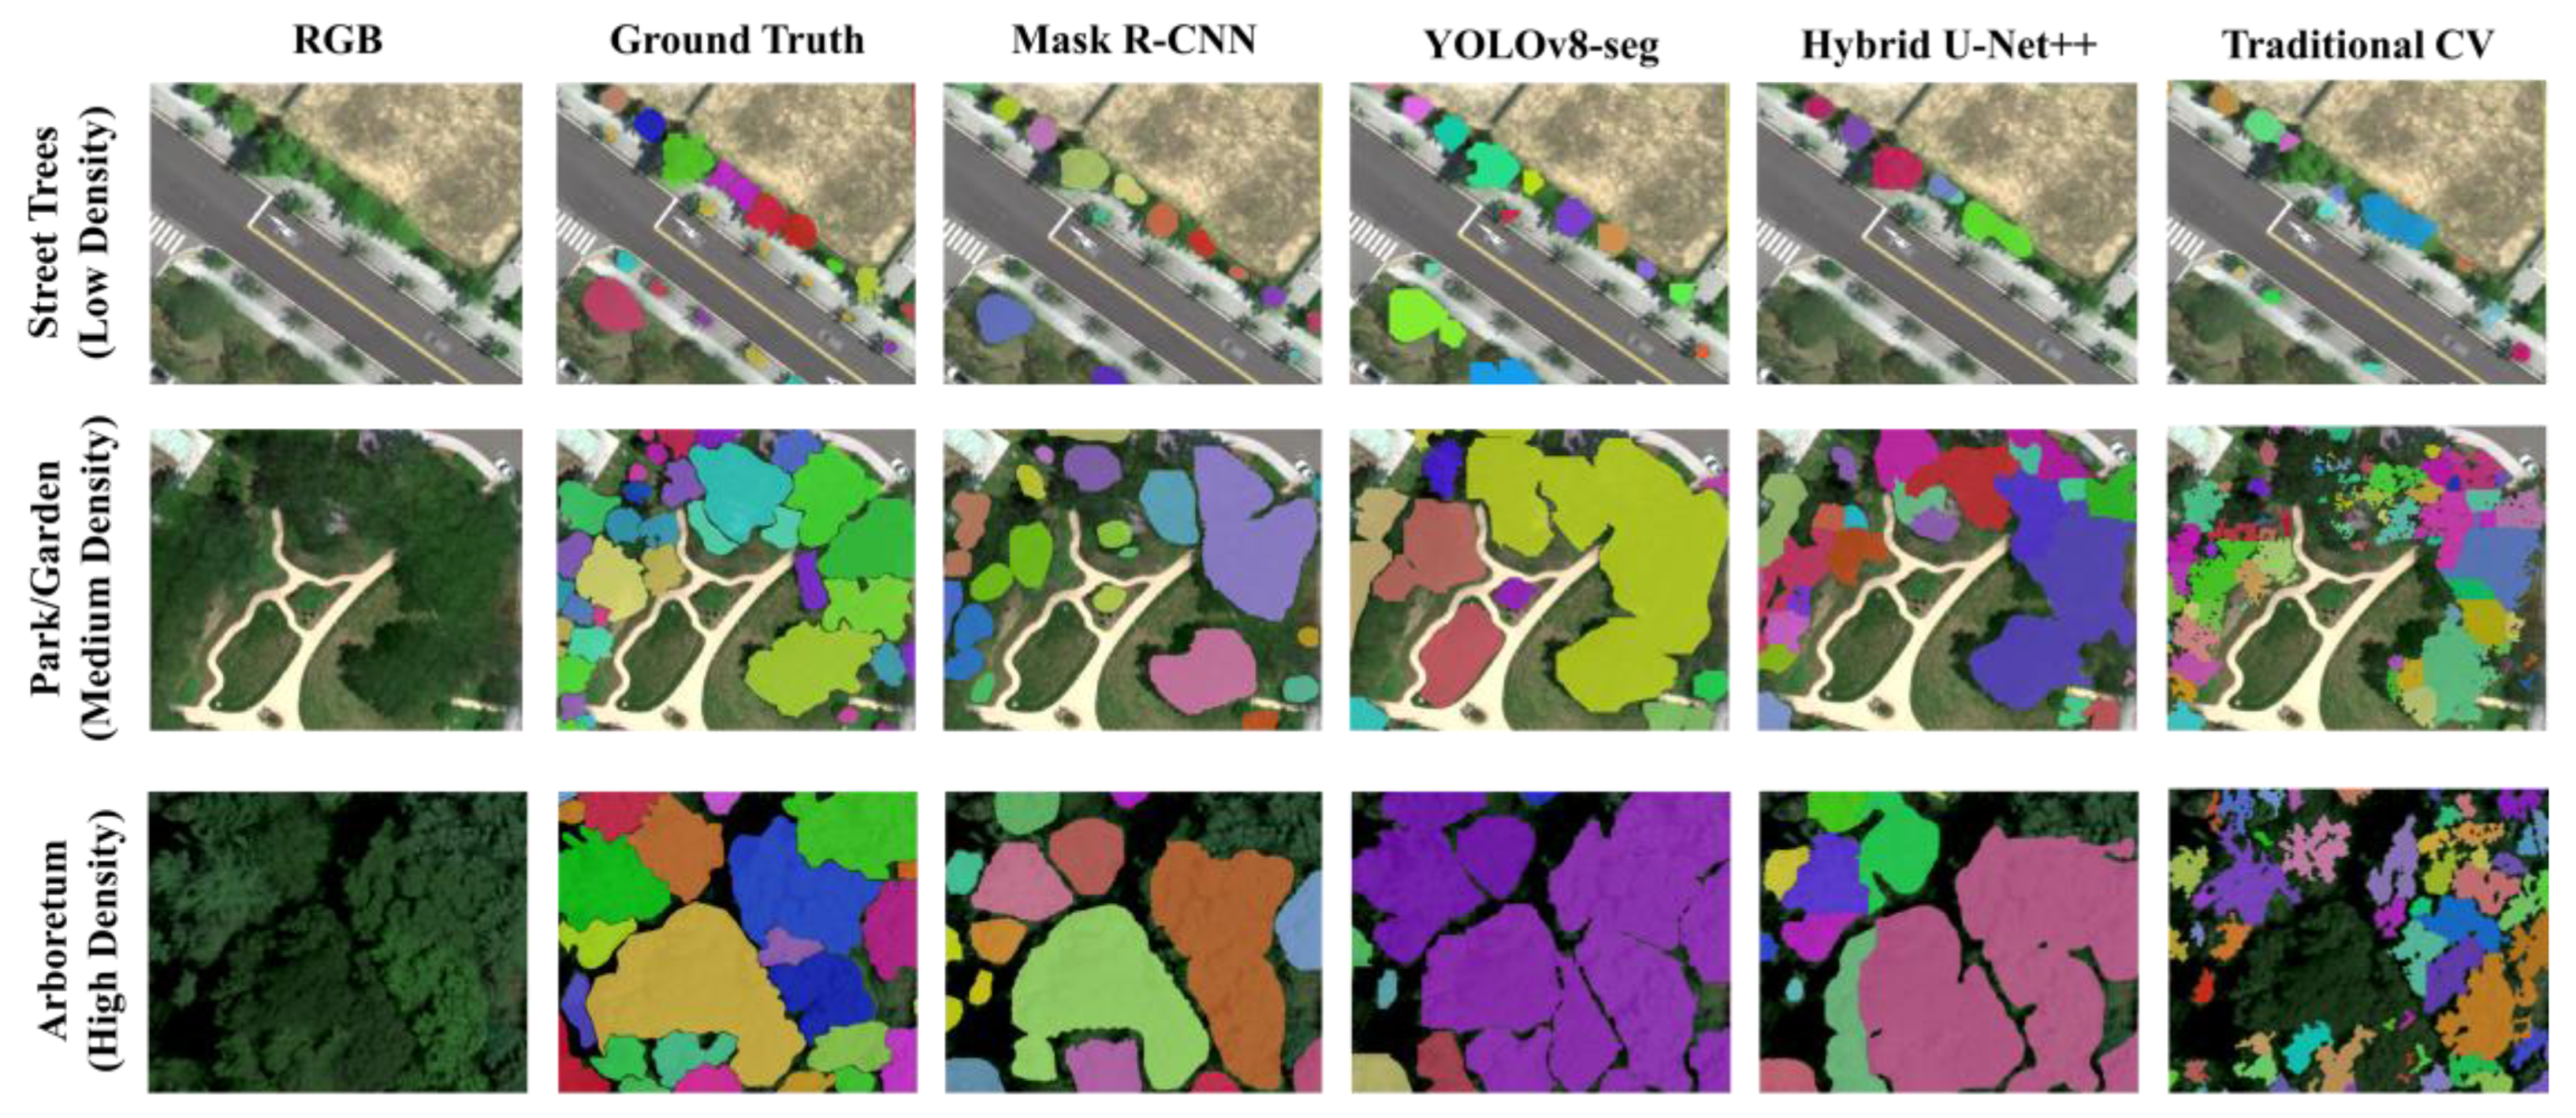
Corresponding to these ecological classifications,
Figure 2 presents representative samples of the tiled orthomosaics alongside their corresponding ground truth delineations, visually summarizing the distinct computer vision challenges inherent to each density regime. The top row (RGB Ortho IMG) illustrates the complexity of the input data that the segmentation models must navigate. In the High-Density Arboretum (Zone I), the primary obstacle is not merely the number of trees but the lack of distinct spectral boundaries. The continuous, interlocking canopy creates deep shadow gaps and uniform green textures, obscuring the edges between individual crowns and making boundary inference highly ambiguous for optical sensors. Conversely, the Medium-Density Park (Zone II) introduces significant spectral confusion. As seen in the imagery, the spectral signature of the grassy understory is nearly identical to that of the tree crowns. This similarity poses a risk of false positives, where models may incorrectly classify lawn areas as vegetation canopy unless they can leverage textural or structural cues. In the Low-Density Street Zone (Zone III), while the contrast between the trees and the asphalt background is sharp, the presence of rectilinear man-made objects (e.g., vehicles, road markings) introduces hard-edge artifacts that can be misidentified as geometric features of the trees.
The bottom row (Tree Crown) visualizes the manually annotated ground truth masks, depicted as yellow polygons, which serve as the gold standard for model training and evaluation. Unlike simple bounding box annotations often used in object detection, this study employed precise polygonal segmentation to trace the exact jagged perimeters of each crown. This rigorous annotation protocol is particularly evident in the Arboretum zone, where complex, non-convex polygons were constructed to separate merging canopies. This high-fidelity labeling ensures that the performance metrics reflect the model's ability to handle fine-grained boundary separation rather than just approximate localization, thereby validating the framework's applicability to precision forestry tasks.
2.2. UAV Platform and Data Acquisition Protocol
Data acquisition was performed using the DJI Matrice 300 RTK, selected for its robust flight stability. The payload consisted of a MicaSense RedEdge-MX Dual camera. To simulate a standard cost-effective RGB workflow, we restricted the data input to the visible spectrum bands: Blue (475 nm), Green (560 nm), and Red (668 nm). Radiometric consistency was ensured using a Downwelling Light Sensor (DLS 2) and a Calibrated Reflectance Panel (CRP) to correct for illumination variance.
Flights were conducted between 10:00 and 12:00 KST to minimize shadow effects. The meteorological conditions at the time of acquisition were optimal for optical remote sensing, characterized by clear sunny skies with specific environmental parameters recorded as follows: an ambient temperature of 31.0°C, a relative humidity of 35%, and a gentle easterly wind of 1.8 m/s. These stable conditions minimized canopy motion blur and ensured high-quality image clarity.
Missions were executed autonomously at an altitude of 150 m AGL with a flight speed of 10.0 m/s, yielding a Ground Sampling Distance (GSD) of approximately 8.0 cm/pixel. A high frontal and lateral overlap of 75% was maintained to satisfy the requirements for Structure-from-Motion (SfM) reconstruction in dense vegetation. Spatial accuracy was guaranteed via the Real-Time Kinematic (RTK) mode connected to a Virtual Reference Station (VRS), achieving centimeter-level precision without the need for manual Ground Control Points (GCPs).
2.3. Dataset Preparation and Preprocessing
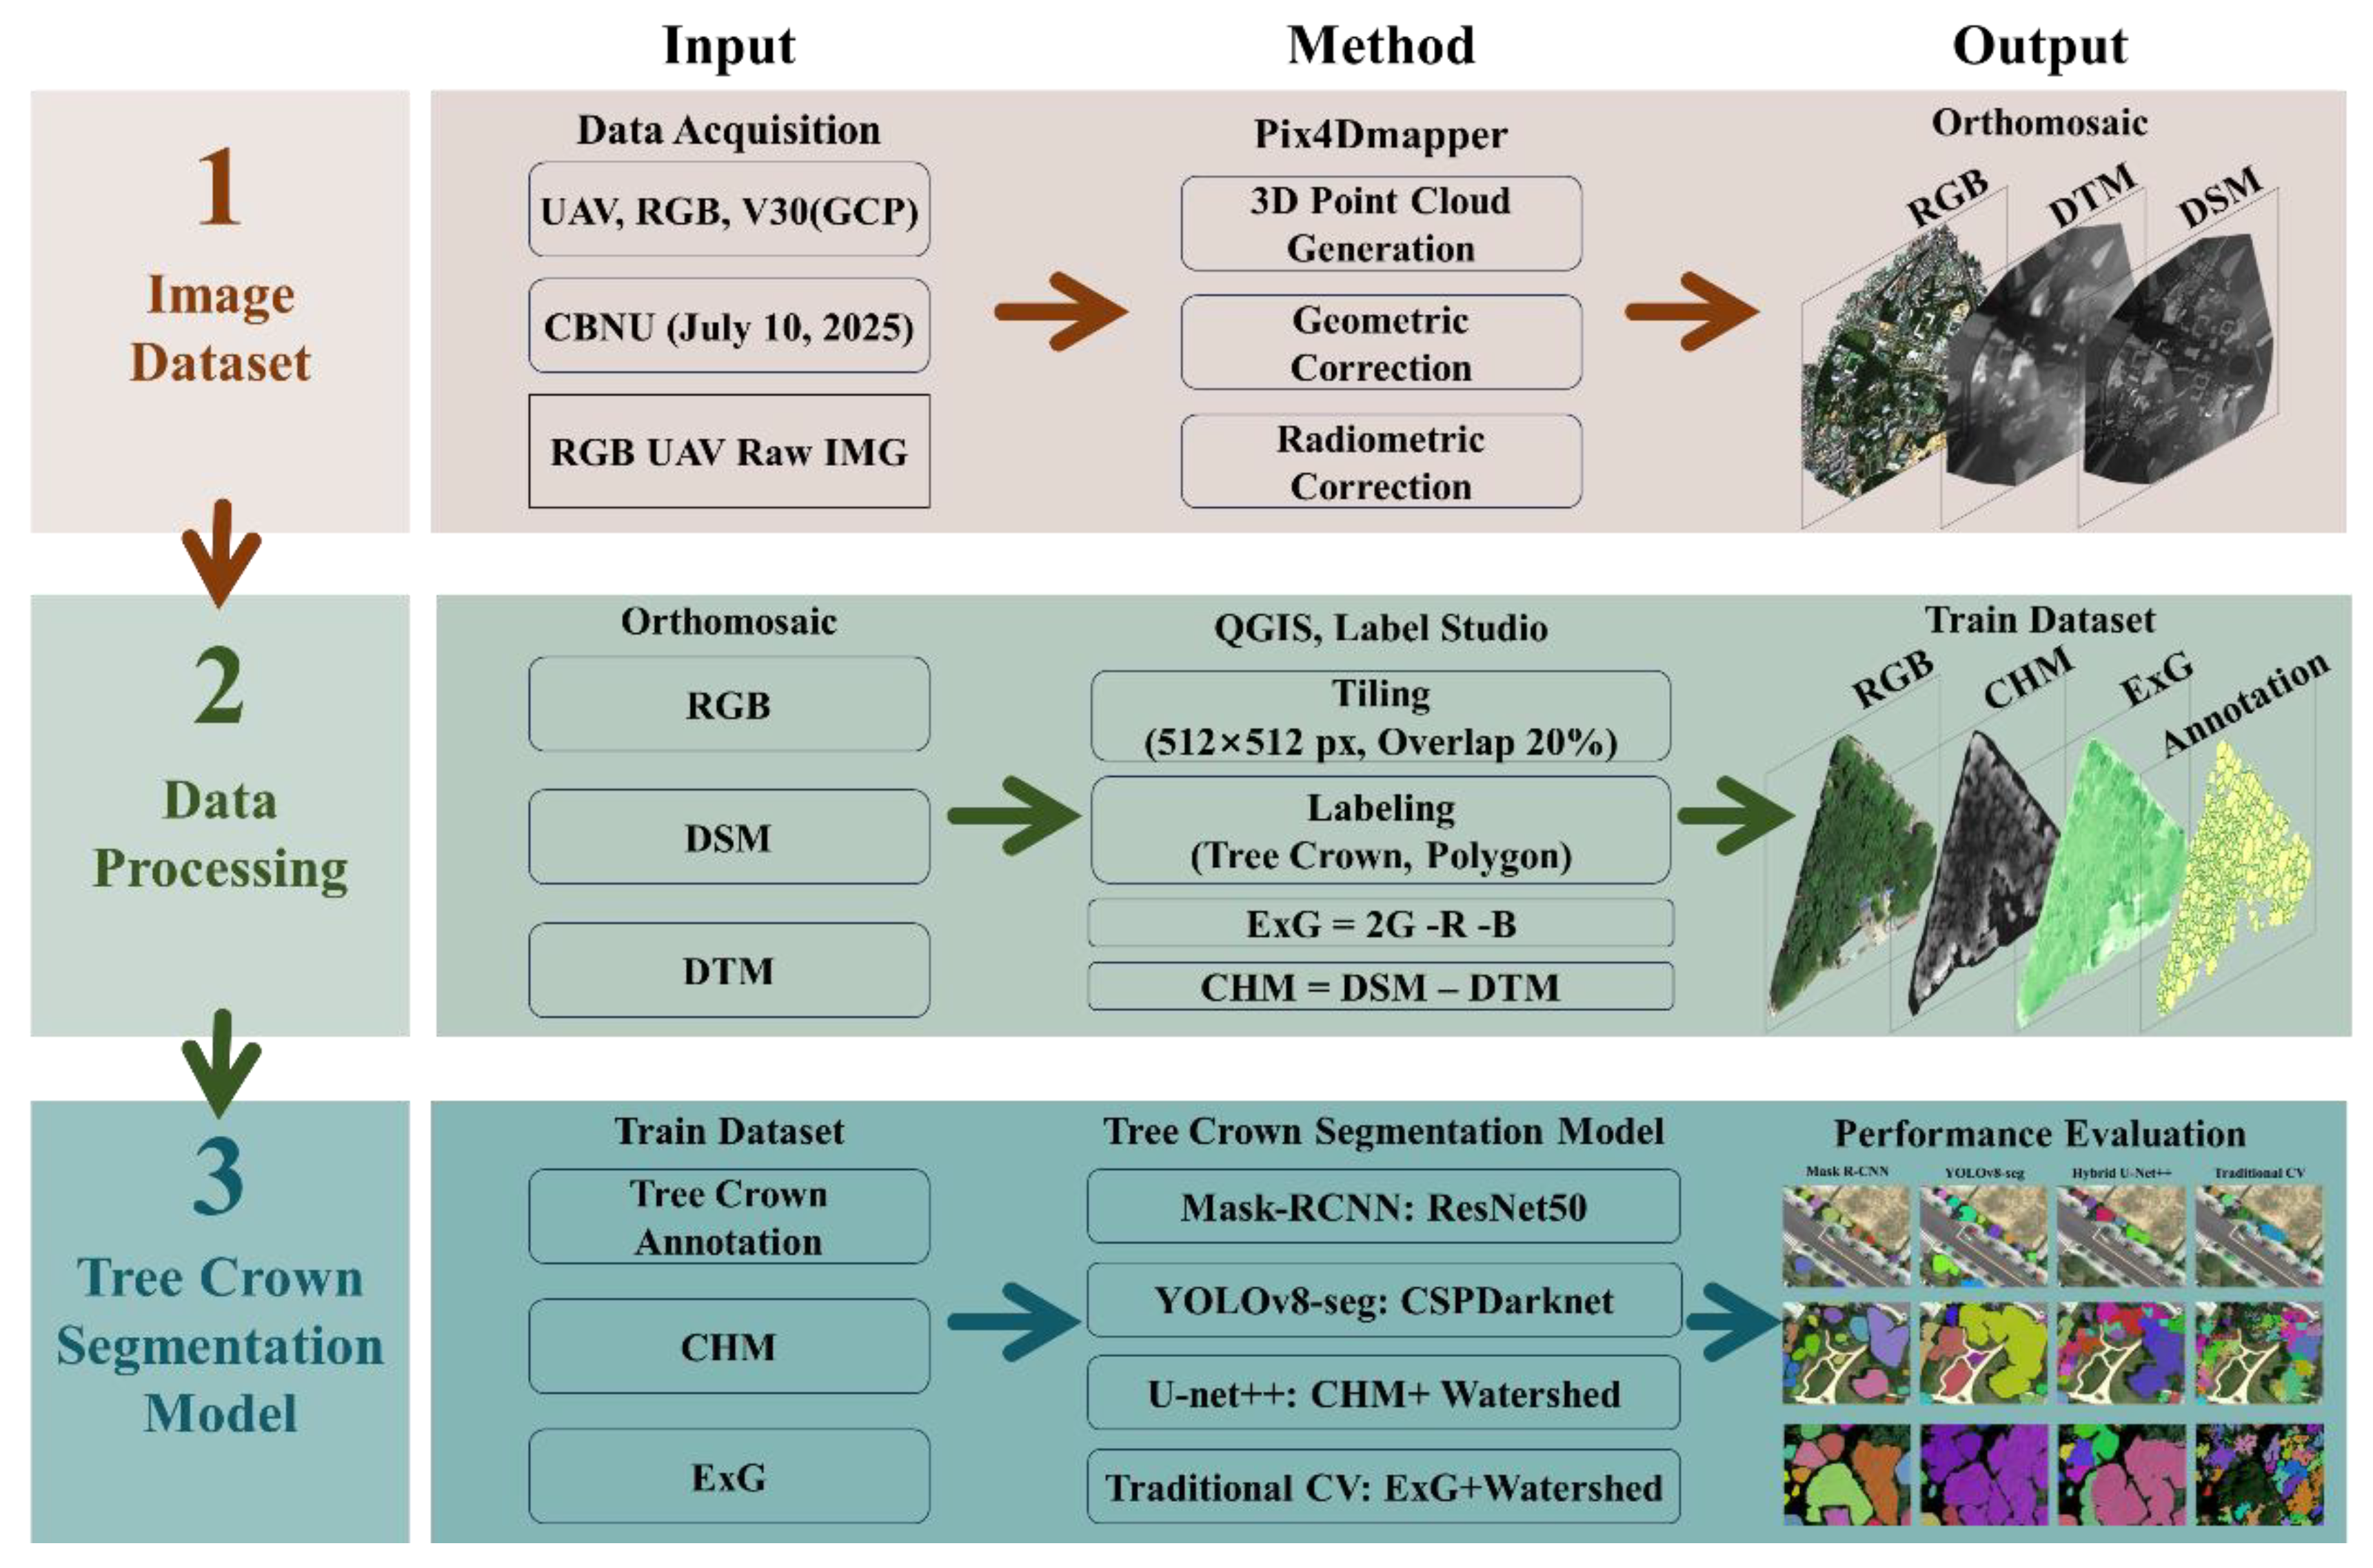
The workflow (
Figure 3) follows a sequential pipeline: image acquisition, geometric correction, standardized tiling, and model training.
Raw aerial imagery was processed using Pix4Dmapper to generate high-resolution orthomosaics. To ensure absolute positional accuracy, eight Ground Control Points (GCPs) measured with a V30 GPS-RTK system were incorporated, and all spatial data were referenced to the WGS 84 / UTM Zone 52N coordinate system. A Structure-from-Motion (SfM)–based workflow was employed to generate a dense point cloud, from which the Digital Surface Model (DSM) and Canopy Height Model (CHM) were derived [
14].
All analyses were conducted in a Python (v3.12) environment using the PyTorch deep learning framework (v2.3.1). Model training and inference were accelerated with an NVIDIA GeForce GTX 1080 Ti GPU under CUDA v12.1.
Ground truth annotations were created using Label Studio, where all arbor-layer tree crowns were annotated as a single class labeled “Tree.” Annotations were stored in COCO format. To facilitate efficient model training and reduce memory constraints, the orthomosaics were divided into tiles of 512×512 pixels [
20,
21]. A 20% overlap between adjacent tiles was applied to mitigate information loss at tile boundaries, resulting in a total of 51 valid image tiles.
The dataset was split into training (57%), validation (18%), and testing (25%) subsets. To address potential overfitting caused by limited data availability, data augmentation was applied exclusively to the training set using the Albumentations library. Augmentation strategies included geometric transformations (horizontal and vertical flips, rotations) and pixel-level transformations such as brightness adjustment, noise injection, motion blur, and Contrast Limited Adaptive Histogram Equalization (CLAHE). As a result, the training dataset was expanded to 261 tiles, comprising a total of 4,819 annotated tree crown instances.
2.4. Input Feature Engineering
Urban forest environments present a unique challenge for remote sensing due to the extreme spectral similarity between the canopy of interest and the underlying herbaceous layers, such as lawns and shrubs. To address this ambiguity and enhance the discriminability of the input data without relying on additional active sensors, we engineered two physics-informed feature layers that augment the raw RGB imagery with bio-optical and structural information.
Excess Green (ExG) Index: Since the UAV payload was strictly limited to the visible spectrum to maintain cost-effectiveness, traditional vegetation indices that rely on Near-Infrared (NIR) bands were not available. To overcome this spectral limitation, the Excess Green (ExG) index was utilized as a robust alternative. This index is specifically designed to accentuate vegetation by exploiting the inherent biological properties of leaf tissues, which exhibit a distinct reflectance peak in the green channel due to chlorophyll content, while absorbing strongly in the red and blue channels. The ExG is computed using the narrow-band spectral channels as follows:
By mathematically applying a double weight to the green channel and subtracting the red and blue channels, this formula effectively suppresses the signals from non-vegetated surfaces such as asphalt, soil, and building shadows, which typically exhibit flat or low reflectance across the visible spectrum. In our framework, this layer functions as a "spectral attention map," enabling the model to automatically localize potential vegetation regions and ignore complex urban background noise before semantic features are even extracted.
Canopy Height Model (CHM): While the ExG index is effective at isolating vegetation from artificial structures, it remains two-dimensional and cannot inherently distinguish between a tall tree and a patch of well-maintained grass. To resolve this vertical ambiguity, a Canopy Height Model (CHM) was generated to provide explicit structural cues. The CHM represents the absolute height of objects above the ground and is derived by calculating the difference between the surface elevation and the terrain elevation:
Here, the Digital Surface Model (DSM) captures the top of the canopy, while the Digital Terrain Model (DTM) represents the underlying ground topography. However, CHMs derived directly from photogrammetric point clouds often contain high-frequency noise and "pitting" artifacts caused by the irregular texture of leaves and gaps within the canopy. To mitigate this, a Gaussian smoothing filter ((σ = 1.5) was applied as a necessary preprocessing step. This low-pass filter removes spurious noise while preserving the dominant geometric shape of the tree crowns. By incorporating this height data, the segmentation model gains the ability to physically filter out ground-level vegetation, ensuring that only objects meeting a specific structural height criterion are classified as trees, regardless of their spectral appearance.
2.5. Network Architectures
To rigorously evaluate the operational trade-offs between segmentation accuracy and computational efficiency under the strict Size, Weight, and Power (SWaP) constraints of UAV platforms, four distinct segmentation pipelines were implemented and compared. These methodologies encompass the full spectrum of current computer vision capabilities, ranging from heavy, precision-oriented deep learning models to lightweight, speed-oriented architectures, and finally to traditional unsupervised techniques.
First, to establish a high-precision upper bound for the comparative analysis, Mask R-CNN was adopted as the reference model [
16]. As a representative two-stage instance segmentation framework, Mask R-CNN is characterized by its ability to disentangle complex, overlapping objects through a sequential process. It employs a deep residual network (ResNet-50) as a backbone to extract rich semantic features from the aerial imagery. Crucially, to handle the extreme scale variation observed in urban forests—where small saplings coexist with massive mature trees—a Feature Pyramid Network (FPN) was integrated. This mechanism constructs a multi-scale feature map, allowing the model to recognize tree crowns regardless of their pixel size. The architecture first generates potential object regions using a Region Proposal Network (RPN) and subsequently refines these proposals using the RoIAlign operation. RoIAlign is particularly vital for forestry applications as it preserves the exact spatial alignment of pixel features, ensuring that the jagged, irregular boundaries of tree crowns are delineated with high fidelity. Although this two-stage process yields robust segmentation results even in cluttered environments, its high computational complexity typically limits its application to offline server-based processing rather than real-time onboard analytics.
In contrast to the heavy computational demand of two-stage detectors, YOLOv8-seg was evaluated as a candidate for edge-computing viability [
15]. This model represents the state-of-the-art in single-stage detection, designed specifically to balance inference speed with accuracy. Unlike Mask R-CNN, which processes proposal generation and classification separately, YOLOv8-seg unifies object detection and instance mask prediction into a single forward pass through the network. This architecture utilizes a CSPDarknet backbone, which is engineered to optimize gradient flow and reduce the number of parameters without sacrificing feature extraction capability. By eliminating the need for predefined anchor boxes and instead adopting an anchor-free approach, the model becomes more flexible in detecting trees with unusual or irregular shapes that do not fit standard aspect ratios. The simultaneous prediction of bounding boxes and segmentation masks significantly reduces inference latency, making this architecture exceptionally well-suited for deployment on resource-constrained embedded systems where rapid decision-making is required during flight.
While pure deep learning models rely solely on spectral and textural information, they often struggle to separate tightly interlocked canopies that share similar color characteristics. To overcome this limitation, a Hybrid Segmentation Framework was developed, integrating deep learning with photogrammetric structural data. In this approach, the U-Net++ architecture was employed to generate a precise binary mask of the vegetation cover [
17,
18]. U-Net++ improves upon the standard U-Net by introducing nested skip pathways that bridge the semantic gap between the encoder and decoder sub-networks, thereby facilitating more effective feature propagation for capturing fine grain boundary details. However, to resolve the issue of adjacent crowns being merged into a single object, we incorporated a post-processing step utilizing the Canopy Height Model (CHM). A marker-controlled watershed algorithm was applied, where the local maxima of the CHM served as markers for individual tree tops. By using the physical height information to guide the segmentation boundaries, this hybrid method effectively forces the separation of individual trees based on their vertical structure, providing a distinct advantage in high-density arboretums where RGB information alone is insufficient.
Finally, to provide a baseline for scenarios where training data is unavailable or computational resources are extremely limited, a Traditional Computer Vision (CV) pipeline was implemented. This unsupervised approach does not require GPU acceleration or extensive training datasets. Instead, it leverages bio-optical properties through the Excess Green (ExG) index to highlight vegetation against the urban background. An automatic thresholding method is applied to the ExG index to create a binary vegetation mask, followed by morphological filtering operations to refine canopy regions [
19]. Individual tree crowns are then separated using a geometry-based watershed transform applied to the distance map of the binary mask. While this method is the most computationally efficient, offering the fastest processing speeds, it lacks the semantic understanding of deep learning models and is therefore used primarily to benchmark the performance gains achieved by introducing AI-based architectures. All deep learning models in this study were initialized using transfer learning with pre-trained weights to ensure training stability and reproducibility.
2.6. Performance Evaluation Metrics
A multi-dimensional evaluation protocol was adopted to comprehensively assess segmentation performance in terms of detection quality, canopy area agreement, computational efficiency, and robustness across varying canopy densities.
Instance-level detection performance was quantified using the Instance F1-score (
). Predicted instances were matched to ground truth annotations based on an Intersection over Union (IoU) threshold of 0.5. Precision and Recall were computed from the number of true positives (TP), false positives (FP), and false negatives (FN), and combined to derive the F1-score as follows:
To evaluate agreement at the semantic level, independent of individual instance boundaries, Semantic Intersection over Union
was employed. This metric measures the overlap between the predicted total canopy area (
) and the ground truth canopy area
), providing an assessment of overall canopy extent accuracy:
Computational efficiency was assessed using inference speed, expressed as seconds per tile (s/tile). This metric captures the end-to-end runtime required to process a single 512×512 pixel tile, including all pre-processing and post-processing steps, thereby reflecting practical deployment performance.
Robustness to variations in canopy density was quantified using the Density Decay Rate (DDR). This metric measures the relative change in instance-level performance when transitioning from low-density canopy regions (
) to high-density regions (
), and is defined as:
DDR values closer to zero indicate density-invariant performance, which is particularly critical for applications in heterogeneous urban environments characterized by highly variable tree crown distributions.
3. Results
3.1. Operational Efficiency: Edge Computing Viability
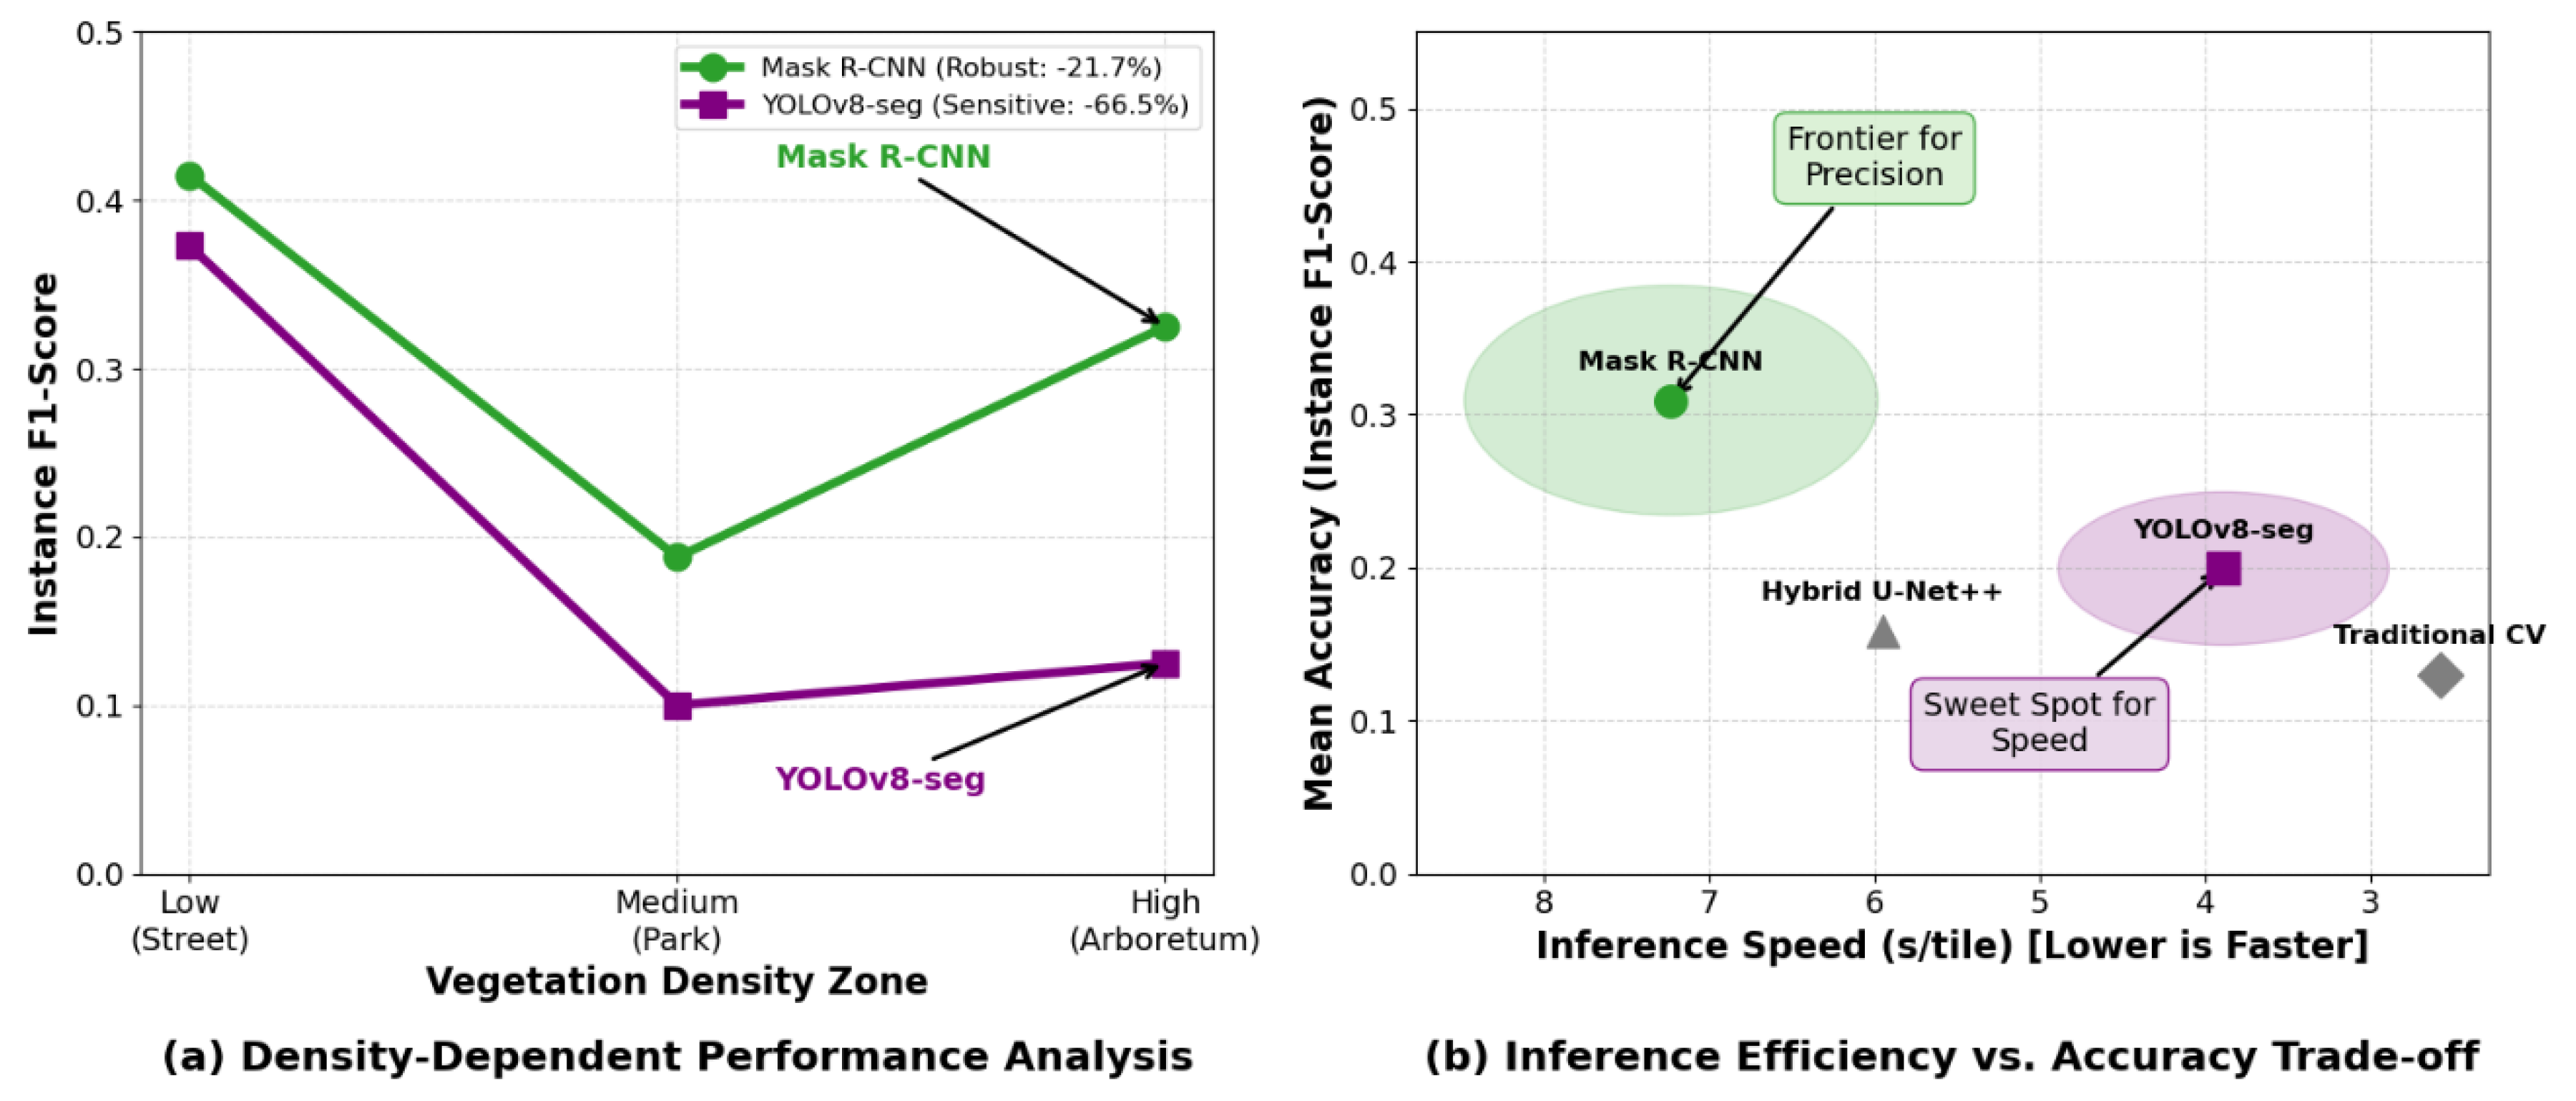
Inference speed is a first-order determinant of whether UAV-derived imagery can be processed onboard for time-sensitive decision-making or must be deferred to post-flight analysis. Across all density zones (
Table 1), YOLOv8-seg provided the most practical balance of deep-learning segmentation and computational latency for edge-oriented scenarios, achieving 3.89 s/tile, which is approximately 1.86× faster than Mask R-CNN (7.23 s/tile). This speed advantage supports the interpretation that YOLOv8-seg is a realistic candidate for near–real-time onboard scouting, particularly when paired with embedded accelerators (e.g., Jetson-class modules), whereas Mask R-CNN’s latency typically necessitates offline server processing for inventory-grade products. In this context, the traditional CV baseline exhibited the lowest latency (2.58 s/tile) but lacked competitive instance-level accuracy (
Table 1), indicating that speed alone is insufficient for reliable instance-based crown inventory.
3.2. Payload Optimization and Robustness Across Densities
A core objective of this study was to validate whether a lightweight RGB payload, enhanced by advanced AI processing, could effectively substitute for heavy, power-hungry active sensors like LiDAR or multispectral cameras. This substitution is key to optimizing Size, Weight, and Power (SWaP) constraints, directly translating to extended flight endurance and operational range.
Our analysis of density-dependent behavior (
Figure 4) and robustness (
Table 2) provides compelling evidence for this hypothesis. We "stress-tested" the algorithms by progressively increasing canopy complexity from the Low-Density (Street) zone to the High-Density (Arboretum) zone. Under the severe occlusion of the High-Density zone, Mask R-CNN demonstrated remarkable resilience, retaining a comparatively robust instance performance (
$F1 = 0.325
$) and exhibiting the smallest performance decay across the gradient (-21.7%,
Table 2). This indicates a superior architectural capacity to disentangle overlapping features and maintain instance separation even when visual boundaries are ambiguous.
In sharp contrast, YOLOv8-seg exhibited a significant vulnerability to occlusion, with performance collapsing to an F1 score of 0.125 in the high-density zone—a steep decay of -66.5%. This behavior is consistent with the limitations of single-stage detectors, which often struggle to resolve tightly packed objects, leading to under-segmentation and the merging of adjacent crowns. This finding is crucial for mission planning, identifying a clear operational boundary for lightweight models.
The Hybrid U-Net++ pipeline offered a distinct trade-off. While it showed intermediate sensitivity to density (F1 = 0.103 in High-Density; -47.7% decay), it excelled in area-based accuracy, achieving the highest overall Semantic IoU (0.551) among all tested methods. This discrepancy highlights a fundamental divergence in model utility: two-stage detectors like Mask R-CNN are essential for counting objects (inventory), whereas the hybrid approach is superior for measuring total vegetation cover (biomass/carbon estimation). The hybrid model's success validates the efficacy of fusing RGB imagery with SfM-derived Canopy Height Models (CHM), proving that structural cues derived from software processing can effectively replace hardware-based depth sensing.
A notable irregularity observed was the performance dip in the Medium-Density (Park) zone for several methods (e.g., Mask R-CNN: 0.188; YOLOv8-seg: 0.100). Despite being structurally less dense than the Arboretum, the Park zone presents unique challenges: a highly heterogeneous background interspersed with artificial surfaces (pavements, buildings) and complex shadow patterns. This environmental "noise" appears to increase confusion at crown edges, elevating false positives and negatives. This finding suggests that background heterogeneity can be as disruptive as canopy occlusion, necessitating robust training strategies that include diverse urban textures.
Collectively, these results support the central hypothesis: software-based sensor fusion (RGB + SfM-CHM) offers a viable, competitive alternative to hardware-heavy solutions. It reduces payload mass and operational complexity while delivering task-appropriate performance for varied monitoring objectives [
22].
3.3. The SWaP Trade-Off: Balancing Speed and Precision
To provide actionable guidance for UAV mission planning under strict SWaP constraints, we conducted a qualitative inspection of pipeline behavior across varying scene complexities (
Figure 5).
In the Low-Density Street setting, the distinction between models was minimal; most methods successfully delineated individual crowns due to the spatial separation of targets and limited background clutter. This easy environment confirms that for linear infrastructure inspection, lightweight models like YOLOv8-seg are sufficient and highly efficient.
However, as complexity increased, the performance gap widened. In the Medium-Density Park, the introduction of heterogeneous backgrounds destabilized the faster models. The presence of hardscapes and shadows introduced boundary ambiguity, leading to fragmented masks and false detections. This visually corroborates the quantitative dip observed in
Table 2, emphasizing the need for robust feature extraction in mixed-use urban areas.
The High-Density Arboretum represented the ultimate stress test. Here, the trade-off became stark. Mask R-CNN consistently preserved instance separation, effectively parsing complex, overlapping canopies where other models failed. In contrast, the faster, edge-oriented YOLOv8-seg tended to merge adjacent crowns into single super-objects or under-segment occluded regions, losing the granularity required for precise inventory. The Hybrid U-Net++ + SfM-CHM pipeline produced coherent, contiguous canopy extents ideal for area monitoring but lacked the fine boundary resolution of Mask R-CNN. Meanwhile, the Traditional CV baseline proved highly sensitive to illumination variability, rendering it unstable for complex scenes.
Overall,
Figure 5 visually reinforces the critical operational trade-off: pipelines optimized for onboard speed (SWaP-friendly) typically sacrifice instance-level separation under occlusion, while precision-oriented methods resolve dense canopies at the cost of higher computational load. This dichotomy is the foundation for our operational decision matrix, guiding operators to select the right tool for the specific mission profile—whether it be rapid scouting or high-fidelity inventory.
4. Discussion
4.1. Optimizing Size, Weight, and Power (SWaP)
The benchmarking results reveal a fundamental trade-off between architectural complexity and operational throughput, directly impacting the SWaP constraints of UAV platforms. Mask R-CNN achieved the highest instance-level fidelity
), confirming its role as the upper-bound baseline for precision. However, this accuracy comes with the highest computational cost (7.23 s/tile), a latency inherent to its two-stage design where region proposals must be sequentially refined [
16]. In contrast, YOLOv8-seg demonstrated superior viability for edge computing, reducing latency to 3.89 s/tile. By unifying detection and segmentation into a single forward pass, it operates approximately 1.86 times faster than the two-stage baseline. Although this speed advantage results in a trade-off in instance precision
), particularly in dense clusters, YOLOv8-seg remains a defensible choice for rapid scouting missions where immediate situational awareness is prioritized over exact stem counts [
15].
The analysis of alternative pipelines highlights the specific utility of structural data. The Hybrid U-Net++ approach, which fuses RGB features with the Canopy Height Model (CHM), achieved the highest semantic overlap (
). This indicates that height cues effectively differentiate vegetation from the urban background. However, its low instance F1-score (0.159) suggests that the watershed-based post-processing is less effective than learning-based regression at separating tightly interlocking crowns [
22]. Meanwhile, the Traditional CV baseline offered the lowest latency (2.58 s/tile) but failed to provide competitive accuracy (
), proving that non-learning-based methods are insufficient for handling the complex shadows and heterogeneity of urban environments.
From an operational perspective, these findings demonstrate that heavy active sensors like LiDAR are not always strictly necessary for routine monitoring. Instead, a "software-defined sensor fusion" approach—leveraging RGB imagery and photogrammetric products (DSM/DTM)—can derive necessary structural cues without increasing payload weight [
21,
23]. For KFS-style missions where precise inventory is the primary objective, prioritizing
and robustness is essential; thus, Mask R-CNN remains the most reliable option for offline processing. Conversely, for time-sensitive deployments under strict battery limits, YOLOv8-seg offers a balanced pathway to achieve actionable insights with significantly reduced latency.
4.2. Operational Decision Matrix for UAV Fleets
The density-stratified analysis reveals that canopy overlap is the dominant operational stressor for instance segmentation in urban forests. Consequently, model performance degrades in markedly different ways depending on the architecture, necessitating a shift from a generic "one-size-fits-all" approach to a mission-oriented selection framework. To address this, we propose the Operational Decision Matrix (
Table 3), which translates the empirical benchmark outcomes into actionable deployment rules. This matrix guides operators in selecting the optimal sensor–algorithm pairing based on three practical constraints: (i) the required output type (precise instance inventory vs. total canopy coverage), (ii) the allowable latency and available compute resources (real-time onboard vs. offline server), and (iii) the expected canopy occlusion regime (low, medium, or high density).
Empirical Justification via Density Decay Rate (DDR): The necessity of this matrix is quantitatively supported by the Density Decay Rate (DDR), which measures the risk of performance degradation when transitioning from low-density street conditions to high-density arboretum conditions.
Precision-Critical Inventory: Mask R-CNN exhibited the most stable behavior, with a relatively low DDR of -21.7% (F1 score decreasing from 0.415 to 0.325). This stability confirms that for missions requiring high-fidelity "Digital Twins" or individual tree health tracking, the computational overhead of the two-stage architecture is a necessary investment to ensure reliability in complex environments [
13,
16].
Rapid Response Scenarios: In contrast, YOLOv8-seg degraded substantially, with a steep DDR of -66.5%. This sharp decline indicates that while YOLOv8-seg is a defensible choice for linear street inspections due to its low latency (3.89 s/tile), it poses a high risk of under-counting in dense arboretum-like environments. Therefore, its deployment should be restricted to "Rapid Response" or scouting scenarios where speed is paramount and approximate counts are acceptable [
15].
Biomass & Coverage Estimation: The Hybrid (RGB+CHM) method also showed sensitivity in instance separation (DDR = -47.7%) but maintained the highest Semantic IoU. Thus, for "Carbon Reporting" tasks where the primary goal is estimating total biomass volume rather than counting stems, this RGB+CHM fusion strategy offers the most efficient pathway, leveraging photogrammetric structure without the need for heavy active sensors [
22].
Operationalizing a Two-Tier Workflow: Based on these findings,
Table 3 implicitly suggests a "Two-Tier Operational Workflow" for large-scale urban monitoring, optimizing the trade-off between speed and precision.
Tier 1 (Onboard Screening): For initial scouting, operators can deploy lightweight UAVs running YOLOv8-seg. This allows for the rapid scanning of linear corridors and low-density parks to identify priority areas (e.g., detecting fallen trees or encroachments) with minimal latency.
Tier 2 (Targeted Analysis): Upon identifying high-density clusters or areas requiring precise inventory during the screening phase, the data should be offloaded for processing with Mask R-CNN or the Hybrid model on a centralized server. This targeted approach ensures that computationally expensive resources are allocated only to the zones that strictly require them (e.g., Zone I), thereby maximizing the overall efficiency of the UAV fleet.
By adopting this structured decision matrix, forestry practitioners can move beyond trial-and-error model selection and deploy reproducible, mission-appropriate monitoring pipelines that align with the specific constraints of heterogeneous urban environments.
4.3. Future Directions: Autonomous UAVs
The observed latency advantages of YOLOv8-seg and the traditional CV baseline motivate a realistic pathway toward onboard-assisted UAV monitoring, shifting the paradigm from the current "store-and-process" workflow to a "sense-and-act" capability. However, the present evidence should be interpreted as onboard potential rather than a confirmed in-flight guarantee. In particular, true onboard feasibility must be validated on embedded hardware (e.g., NVIDIA Jetson Orin or Xavier modules) under dynamic flight conditions. Unlike static benchmarks, real-world operations introduce external stressors such as motion blur from wind gusts, rapid illumination shifts due to passing clouds, and thermal throttling of the GPU, all of which can materially affect throughput and inference accuracy [
24]. Therefore, future engineering efforts must focus on optimizing model quantization (e.g., TensorRT conversion) to maintain inference speeds within the strict power budget of battery-operated platforms.
Nevertheless, once tile-level inference can be reliably executed within mission-relevant bounds (e.g., < 100ms per frame), UAV operations can transition from passive mapping to "Closed-Loop Autonomy." In this paradigm, the UAV does not merely follow a pre-programmed waypoint grid but uses real-time model outputs to guide adaptive decision-making. For instance, upon detecting a cluster of ambiguous tree crowns or a potential disease hotspot, the flight controller could dynamically trigger a "re-inspection maneuver," lowering altitude to acquire higher GSD imagery or adjusting the gimbal angle to overcome occlusion [
6]. This capability is particularly relevant for KFS-scale operations, where human interpretation of massive datasets currently forms the primary bottleneck as monitoring frequency and spatial coverage expand.
To support this autonomous vision, future algorithmic research should prioritize density-invariant instance separation under SWaP limits. The current results indicate that appearance-based deep learning struggles in high-density canopies. Improving separation in these zones will likely require augmenting RGB models with lightweight structural priors. For example, developing more robust algorithms for real-time CHM generation—such as marker-controlled watershed parameterization that adapts to local canopy height variance—could significantly reduce under-segmentation errors while maintaining the low computational footprint required for edge deployment [
22].
Furthermore, to address the spectral confusion observed in mixed-vegetation parks, integrating complementary cues is essential. Since RGB sensors lack spectral depth, incorporating texture descriptors (e.g., Gray Level Co-occurrence Matrix or Local Binary Patterns) into the feature extraction layer may help mitigate failure cases in heterogeneous urban backgrounds and shadowed regions. Prior studies suggest that texture-informed classification can effectively distinguish between the chaotic texture of tree leaves and the uniform texture of manicured lawns, offering a computation-efficient alternative to multispectral sensors [
25,
26].
Finally, to bridge the gap between academic research and operational adoption, the proposed framework should be coupled with standardized data packaging and reproducible execution protocols. By providing versioned model configurations and clear inference scripts (e.g., Dockerized containers), we can enable KFS practitioners to deploy mission-appropriate models with transparent performance expectations across varying density regimes. Ultimately, this leads to the realization of a "Digital Twin" for urban forests, where autonomous fleets continuously update inventory data with minimal human intervention.
5. Conclusions
This study rigorously benchmarked four UAV-based segmentation pipelines—Mask R-CNN, YOLOv8-seg, a Hybrid U-Net++ framework, and a traditional CV baseline—to clarify the operational trade-offs between segmentation fidelity, computational latency, and density robustness in heterogeneous urban forests.
Our results confirm a distinct dichotomy between precision and speed. Mask R-CNN established the upper bound for instance-level accuracy () and density-invariant robustness (DDR= -21.7%), making it the premier choice for high-fidelity inventories in complex arboretums, albeit with the highest computational cost (7.23 s/tile). Conversely, YOLOv8-seg demonstrated superior viability for edge computing, achieving an inference speed of 3.89 s/tile—approximately 1.86 times faster than the two-stage baseline—while maintaining competitive semantic overlap (). This validates its potential for real-time scouting missions, although its performance degrades significantly under severe occlusion (DDR= -66.5%). The Hybrid framework offered a strategic middle ground, leveraging photogrammetric structural cues (CHM) to achieve the highest canopy-area agreement ()) without additional active sensor payloads.
These findings translate into a concrete Operational Decision Matrix for UAV fleet deployment. For rapid corridor inspections where latency is critical, single-stage detectors like YOLOv8-seg provide a resource-efficient solution. For biomass estimation dependent on total coverage, the hybrid RGB-CHM approach maximizes utility. For precise object counting in dense canopies, the computational overhead of Mask R-CNN is a necessary investment.
While this study is limited by the geographic scope of the dataset and the inherent noise in photogrammetric reconstruction, it successfully demonstrates that lightweight RGB sensors, when paired with adaptive AI architectures, can effectively substitute for heavy active sensors. This significantly optimizes SWaP constraints, extending flight endurance and reducing operational barriers. Future research should focus on validating these models on embedded hardware under real-flight conditions and integrating texture-based descriptors to further mitigate background heterogeneity. Ultimately, this work provides a reproducible, data-driven pathway for deploying scalable, autonomous UAV monitoring systems capable of adapting to the complex realities of urban environments.
Author Contributions
Conceptualization, Jo, W.K.; methodology, Jo, W.K. and Park, J.H.; software, Jo, W.K.; validation, Park, J.H.; formal analysis, Jo, W.K.; investigation, Jo, W.K. and Go, S.H.; resources Jo, W.K. and Park, J.H.; data curation Jo, W.K.; writing—original draft preparation, Jo, W.K.; writing—review and editing, Park, J.H.; visualization, Jo, W.K.; supervision, Park, J.H.
Funding
This research was supported by the Regional Innovation System & Education(RISE) program through the (Chungbuk Regional Innovation System & Education Center), funded by the Ministry of Education(MOE) and the (Chungcheongbuk-do), Republic of Korea(2025-RISE-11-014-01).
Data Availability Statement
The data presented in this study are available on request from the corresponding author. The data are not publicly available due to privacy restrictions of the university campus testbed.
Acknowledgments
Not applicable.
Conflicts of Interest
The authors declare no conflicts of interest.
References
- Nex, F.; Armenakis, C.; Cramer, M.; Cucci, D.A.; Gerke, M.; Honkavaara, E.; Kukko, A.; Persello, C.; Skaloud, J. UAV in the advent of the twenties: Where we stand and what is next. ISPRS J. Photogramm. Remote Sens. 2022, 184, 215–242. [CrossRef]
- Floreano, D.; Wood, R.J. Science, technology and the future of small autonomous drones. Nature 2015, 521, 460–466. [CrossRef]
- Boon, M.A.; Drijfhout, A.P.; Tesfamichael, S. Comparison of a fixed-wing and multi-rotor UAV for environmental mapping applications: A case study. Int. Arch. Photogramm. Remote Sens. Spatial Inf. Sci. 2017, XLII-2/W6, 47–54. [CrossRef]
- Gupta, S.G.; Ghonge, M.M.; Jawandhiya, P.M. Review of unmanned aircraft system (UAS). Int. J. Adv. Res. Comput. Eng. Technol. 2013, 2, 1646–1658.
- McEnroe, P.; Wang, S.; Liyanage, M. A survey on the convergence of edge computing and AI for UAVs: Opportunities and challenges. IEEE Internet Things J. 2022, 9, 15435–15459. [CrossRef]
- Palmas, A.; Andronico, P. Deep learning computer vision algorithms for real-time UAVs on-board camera image processing. arXiv 2022, arXiv:2211.01037. [CrossRef]
- Wilson, A.N.; Kumar, A.; Jha, A.; Cenkeramaddi, L.R. Embedded sensors, communication technologies, computing platforms and machine learning for UAVs: A review. IEEE Sens. J. 2022, 22, 1807–1826. [CrossRef]
- Kattenborn, T.; Leitloff, J.; Schiefer, F.; Hinz, S. Review on Convolutional Neural Networks (CNN) in vegetation remote sensing. ISPRS J. Photogramm. Remote Sens. 2021, 173, 24–49. [CrossRef]
- Osco, L.P.; Marcato Junior, J.; Marques, A.P.; Jorge, L.A.d.C.; Matsubara, E.T.; Li, H. A review on deep learning in UAV remote sensing. Int. J. Appl. Earth Obs. Geoinf. 2021, 102, 102456. [CrossRef]
- Neuville, R.; Bates, J.S.; Jonard, F. Estimating forest structure from UAV-mounted LiDAR point cloud using machine learning. Remote Sens. 2021, 13, 352. [CrossRef]
- Costa, L.; Kunwar, S.; Ampatzidis, Y.; Albrecht, U. Determining leaf nutrient concentrations in citrus trees using UAV imagery and machine learning. Precis. Agric. 2022, 23, 854–875. [CrossRef]
- Terven, J.; Cordova-Esparza, D.; Romero-Gonzalez, J.A. A comprehensive review of YOLO architectures in computer vision: From YOLOv1 to YOLOv8 and YOLO-NAS. Mach. Learn. Knowl. Extr. 2023, 5, 1680–1716. [CrossRef]
- He, K.; Gkioxari, G.; Dollár, P.; Girshick, R. Mask R-CNN. In Proceedings of the IEEE International Conference on Computer Vision (ICCV), Venice, Italy, 22–29 October 2017; pp. 2961–2969. [CrossRef]
- Iglhaut, J.; Cabo, C.; Puliti, S.; Piermattei, L.; O’Connor, J.; Rosette, J. Structure from motion photogrammetry in forestry: A review. Curr. For. Rep. 2019, 5, 155–168. [CrossRef]
- Jocher, G.; Chaurasia, A.; Qiu, J. Ultralytics YOLOv8. 2023. Available online: https://github.com/ultralytics/ultralytics (accessed on 1 December 2025).
- Cai, Z.; Liu, Z.; Kou, L. Reliable UAV monitoring system using deep learning approaches. IEEE Trans. Reliab. 2022, 71, 973–983. [CrossRef]
- Zhou, Z.; Siddiquee, M.M.R.; Tajbakhsh, N.; Liang, J. Unet++: A nested U-net architecture for medical image segmentation. In Deep Learning in Medical Image Analysis; Springer: Cham, Switzerland, 2018; pp. 3–11. [CrossRef]
- Ronneberger, O.; Fischer, P.; Brox, T. U-Net: Convolutional networks for biomedical image segmentation. In Proceedings of the Medical Image Computing and Computer-Assisted Intervention (MICCAI), Munich, Germany, 5–9 October 2015; pp. 234–241. [CrossRef]
- Dainelli, R.; Toscano, P.; Di Gennaro, S.F.; Matese, A. Recent advances in Unmanned Aerial Vehicles forest remote sensing—A systematic review. Part II: Research applications. Forests 2021, 12, 397. [CrossRef]
- Shorten, C.; Khoshgoftaar, T.M. A survey on image data augmentation for deep learning. J. Big Data 2019, 6, 60. [CrossRef]
- Weiss, K.; Khoshgoftaar, T.M.; Wang, D. A survey of transfer learning. J. Big Data 2016, 3, 9. [CrossRef]
- Dalponte, M.; Coomes, D.A. Tree-centric mapping of forest carbon density from airborne laser scanning and hyperspectral data. Methods Ecol. Evol. 2016, 7, 1236–1245. [CrossRef]
- Wallace, L.; Lucieer, A.; Malenovský, Z.; Turner, D.; Vopěnka, P. Assessment of forest structure using two UAV techniques: A comparison of airborne laser scanning and structure from motion point clouds. Forests 2016, 7, 62. [CrossRef]
- Alzubaidi, L.; Bai, J.; Al-Sabaawi, A.; Santamaría, J.; Albahri, A.S.; Al-Dabbagh, B.S.N.; Gu, Y. A survey on deep learning tools dealing with data scarcity: Definitions, challenges, solutions, tips, and applications. J. Big Data 2023, 10, 46. [CrossRef]
- Haralick, R.M.; Shanmugam, K.; Dinstein, I. Textural features for image classification. IEEE Trans. Syst. Man Cybern. 1973, SMC-3, 610–621. [CrossRef]
- Jo, W.K.; Park, J.H. High-accuracy tree type classification in urban forests using drone-based RGB imagery and optimized SVM. Korean J. Remote Sens. 2025, 41, 209–223. [CrossRef]
|
Disclaimer/Publisher’s Note: The statements, opinions and data contained in all publications are solely those of the individual author(s) and contributor(s) and not of MDPI and/or the editor(s). MDPI and/or the editor(s) disclaim responsibility for any injury to people or property resulting from any ideas, methods, instructions or products referred to in the content. |
© 2025 by the authors. Licensee MDPI, Basel, Switzerland. This article is an open access article distributed under the terms and conditions of the Creative Commons Attribution (CC BY) license (http://creativecommons.org/licenses/by/4.0/).