Submitted:
23 December 2025
Posted:
24 December 2025
You are already at the latest version
Abstract
In this study, an electrochemical valorization strategy on liquid byproducts from hazel-nut shell gasification was developed to couple waste remediation with energy-efficient hydrogen production. The aqueous phase, rich in organic compounds, is processed in an anion exchange membrane (AEM) cell, where pure hydrogen evolved at the cathode while organic pollutants are oxidized at the anode. First, the feedstock is thoroughly charac-terized using gas chromatography-mass spectrometry (GC-MS), identifying a complex matrix of water-soluble aromatic compounds such as phenols, catechols, and other aro-matics compounds, with concentrations reaching up to 2.9 g/kg for catechols. Then, the electro-reforming process is optimized using Nickel oxide-hydroxide (Ni(O)OH) elec-trodes with a loading of 0.75 mg/cm2. This methodology relies on the favorable thermo-dynamics of organic oxidation, which requires a lower onset potential (0.4 V) compared to the oxygen evolution reaction (OER) observed in the alkaline control (0.52 V), and the low overpotential of the Nickel oxide-hydroxide electrode towards the oxidized species. Consequently, the organic load undergoes progressive oxidation into hydrophilic and less bioaccumulating species and carbon dioxide, allowing for the simultaneous genera-tion of pure hydrogen at the cathode at a reduced cell voltage. Elevated stability was observed, with a substantial abatement of organic compounds achieved over 80 hours at a fixed cell voltage of 0.5 V. This represents a step forward in the development of tech-nologies that reduces the energy intensity of hydrogen generation while valorizing bio-mass gasification residues.
Keywords:
hydrogen
; power to gas
; electrolysis
; electro-reforming
; biomass gasification
; waste valorization
1. Introduction
The transition towards a circular economy and a bioeconomy has become an imperative to mitigate the global reliance on fossil fuels, which are finite, polluting, and the primary drivers of climate change due to greenhouse gas emissions. In this context, hydrogen has emerged as a promising alternative energy carrier, capable of decarbonizing many sectors by offering clean oxidation with water as the sole byproduct [1]. However, the environmental sustainability of hydrogen is currently limited by its production methods; the vast majority is still derived from fossil fuel reforming - the so called grey hydrogen - negating many of its potential benefits [2]. To align with the ambitious goals of international frameworks such as the European Green Deal, research must move towards coupling hydrogen generation with renewable energy sources - such as wind, solar, and biomass - to obtain a truly sustainable industrial framework [3].
Among these renewable sources, biomass stands out as a uniquely versatile feedstock because, unlike intermittent renewables, biomass offers a continuous supply of carbon and hydrogen, serving as a precursor for both energy and chemicals with added values. Various conversion routes, including thermochemical, biochemical, and electrochemical processes, have been developed to harness this potential [4]. Nevertheless, thermochemical processes like gasification often generate complex byproducts that pose significant technical challenges [5]. Specifically, updraft gasification of agro-industrial residues, such as hazelnut shells, produces a syngas contaminated with organic condensable molecules, collectively known as “tars”. These tars are typically considered detrimental contaminants that poison downstream catalysts and require costly scrubbing units for removal and special reforming units [6]. Beyond technical inefficiencies, tars pose a severe environmental threat; composed largely of hydrophobic aromatic structures, they are prone to bioaccumulation and persistence in ecosystems, rendering their untreated discharge ecologically hazardous [7].
From a bioeconomic perspective, however, these residues represent an untapped resource rather than a mere waste stream [8]. The aqueous phase resulting from gasification scrubbing is rich in oxidizable organic molecules, predominantly aromatic compounds such as phenols, catechols, and methoxy-phenols. Disposing of these streams constitutes a significant economic and environmental burden for gasification plants. A biorefinery approach that valorizes this stream can improve the economic feasibility of the entire process. By using these organic residues as fuels for electrochemical processes, it is possible to transform waste management cost into a productive asset, fostering circular economy principles and improving overall resource efficiency [9].
This study focuses on the electro-reforming of these liquid byproducts derived from biomass gasification to achieve more cost-effective hydrogen production. Standard water electrolysis is energetically demanding, largely due to the high thermodynamic potential required for the Oxygen Evolution Reaction (OER) at the anode (1.23 V ideally) [10]. Replacing the OER with the oxidation of organic molecules derived from biomass allows for hydrogen production at significantly lower cell voltages [11,12]. Notably, the thermodynamic oxidation of organic substrates, such as the tars, occurs at a lower potential than water oxidation at the same pH and with the same setup (0.4 V vs 0.52 V as here reported, respectively), reducing the electrical energy consumption required for hydrogen evolution. Moreover, from an ecological standpoint, this oxidation process is critical: it targets the hydrophobic aromatic cores of tar molecules, converting them into more hydrophilic (hence more water-soluble), oxygenated species with lower bioaccumulation potential, or achieving complete mineralization [13].
Also, until now, research has largely focused on using noble and costly metals like platinum or iridium to oxidize model biomass compounds such as alcohol or sugars [14,15,16]. This study aims to bridge the gap towards industrial viability by using non-strategic, cheaper and abundant metals [17]. Specifically, we investigated the use of nickel foam electrodes coated with electrodeposited nickel oxide-hydroxide, Ni(O)OH, as robust anodes for the electro-reforming of real tar solutions obtained from scrubbing plants after hazelnut shell gasification. The overarching objective is to develop a method that is both economically viable and environmentally sustainable, thereby validating a scalable pathway for Power-to-Gas applications that integrate waste remediation with the generation of pure hydrogen [18,19,20].
2. Materials and Methods
2.1. Materials
Sodium hydroxide (≥ 99%, NaOH basis), sodium acetate (≥ 99.0%), nickel sulfate (≥ 99.9%, trace metals basis), and sodium sulfate (ACS reagent, ≥ 99.0%) were purchased from Merck KGaA, Darmstadt, Germany. Nickel foam was purchased from Nanografi, Estonia (Pärnu mnt. 139c - 14, Tallinn, 11317, Estonia). The Fumasep FAA-3-50 anion exchange membrane (AEM) was sourced from Longgang District, Shenzhen 518000, China. Prior to use, the Fumasep FAA-3-50 AEM was soaked in a 1 M NaOH solution for 30 hours and subsequently rinsed with Milli-Q water. Milli-Q water was used throughout all experiments. All commercial chemicals were used as received without further purification.
2.2. Feedstock Collection
Tar used were contained as soluble matter in the aqueous phase of the scrubbing unit following the gasification of hazelnut shells in an updraft reactor (PRAGA) at the ENEA Trisaia Research Center.
Tar production as a waste gasification and collection procedure were reported and described elsewhere [21].
2.3. Analytical Methods
2.3.1. Dry Matter Determination and Thermogravimetric Analysis (TGA)
Dry matter content was determined by drying the samples in a ventilated oven at 80 °C until constant weight was achieved. The mass difference between the initial and final weight allowed for the quantification of moisture and volatile substances.
Subsequently, the non-volatile component dissolved in the scrubbing water was subjected to thermogravimetric analysis for the simultaneous quantification of residual moisture, volatile matter, fixed carbon, and ash. The analysis was carried out using a Hi-Res TGA 2950 thermogravimetric analyzer (TA Instruments) under a nitrogen flow, in the temperature range from 20 to 900 °C, using 15 mg of sample. The thermal program consisted of multiple heating ramps and isothermal steps: heating from 15 to 100 °C at a rate of 15 °C min⁻¹, followed by an isothermal hold at 100 °C for 10 min; subsequent heating from 100 to 900 °C at 100 °C min⁻¹, followed by an isothermal hold at 900 °C for 20 min; cooling from 900 to 580 °C at −65 °C min⁻¹, and a final isothermal step at 580 °C for 6 min.
2.3.2. Elemental Analysis
Elemental composition (C, H, N, S) was determined using a Vario MACRO Cube analyzer. Samples were previously dried in a ventilated oven at 80 °C, weighed into tin capsules, and analyzed in triplicate. The method involved sample combustion followed by the reduction of the produced gases (converted into CO2, N2, H2O, and SO2), which were separated and sent to specific detectors (infrared spectroscopy and TCD for nitrogen).
2.3.3. High-Performance Liquid Chromatography (HPLC)
Characterization of soluble molecules and molecular weight distribution was performed using an Agilent 1260 Infinity II HPLC system.
Organic acids were determined using a Phenomenex Rezex ROA-Organic Acid H+ column with isocratic elution of 5 mM sulfuric acid, coupled with Refractive Index (RID) and Diode Array (DAD) detectors at 210 nm.
Furanic aldehydes were analyzed using an Agilent Poroshell 120 EC-C18 column, with a water/acetonitrile gradient elution and a DAD detector set at 280 nm.
Molecular weight distribution was determined using Polysep 1000 (range 20 - 3000 Da) and Polysep 3000 (range 250 Da - 75 kDa) Gel Filtration Chromatography (GFC) columns (Phenomenex®) in series, with RID and DAD detectors (full scan acquisition 205 - 400 nm). Calibration was performed using 8 polyethylene glycol (PEG) standards with known molecular weights ranging from 20 Da to 75 kDa. Samples were injected after dilution with water.
2.3.4. Gas Chromatography-Mass Spectrometry (GC-MS)
The analysis of organic compounds was conducted using an Agilent 8890 GC system coupled with an MSD 5977C mass detector. Separation was performed on a DB-5 MS capillary column (60 m). The operating conditions included an injector temperature of 285 °C and a column temperature ramp from 40 to 320 °C at a rate of 5 °C/min.
The analysis involved simultaneous dual detection: mass spectrometry (EI mode) for molecular qualification and a Flame Ionization Detector (FID) for quantification, using naphthalene as the internal reference standard. Prior to injection, samples were prepared by filtration on Supelclean ENVI-18 cartridges (Supelco); the retained residue was eluted and diluted with methanol.
2.3.5. Electrochemical Measurements and Analysis (LSV, CA, CP, Bulk Electrolysis)
For the electrochemical measurements and tests, a BioLogic VSP-3e potentiostat was used (purchased from BioLogic). All potential measurements were made and recorded against an Ag/AgCl standard reference electrode.
2.4. Nickel Oxide-Hydroxide on Nickel Foam Electrodeposition
Nickel oxide-hydroxide was deposited on nickel foams by anodic electrodeposition at a current density of 1 mA/cm2 for 1 hour in a solution containing 0.13 M sodium acetate, 0.13 M nickel sulfate, and 0.1 M sodium sulfate at 25 °C, with the cell temperature controlled using a water bath. After deposition, the samples were rinsed with water and annealed in air at 200 °C for 1 hour [22,23]. The mass of the active material was determined by weighing the nickel foam before and after NiO(OH) deposition and was calculated to be 0.75 mg/cm2. The pictures of the materials are reported in Figure 1.
2.5. Hydrogen Generation and Biomass Valorization
A 30 mL H-type electrolysis cell was used, equipped with a nickel foam cathode (5.1 cm² surface area), a Fumasep FAA-3-50 anion exchange membrane (AEM), and two different anodes were used (2.7 cm²), one made of nickel foam and the other of nickel foam with electrodeposited nickel oxide-hydroxide, as previously described. Before assembly, the AEM was pretreated as detailed above. In each experiment, 30 mL of 1 M NaOH solution was added to the cathode chamber. The anode chamber was filled with either 1 M NaOH solution or a tar solution in 1 M NaOH. The electrochemical setup was controlled using the potentiostat. Temperature was maintained at 25 °C using a water bath. Hydrogen production was calculated from the current generated during electrolysis and through comparison with water displacement. The electrolysis apparatus is shown in Figure 2. No oxygen evolution was detected at the anode during the electrolytic processes. Since an anion exchange membrane was used, hydrogen was the only gas produced at the cathode. Electrochemical analysis was performed by linear sweep voltammetry (LSV) applying a potential ranging from 0 V to 1.20 V at a scan rate of 40 mV/s and by chronoamperometry (CA) and chronopotentiometry (CP) experiments.
In all the electrochemical experiments involving tar, a concentration of 1.3 g/L of dry matter in 1 M NaOH was used.
3. Results and Discussion
3.1. Biomass Byproduct Characterization
3.1.1. Dry Matter and Thermal Behavior
The gasification scrubbing water appeared as a dark liquid with a density of 1.05 g/mL. Initial evaporation measurements indicated a dry matter (DM) content of 13.6 wt%, suggesting a relatively high concentration of substances transferred from the syngas to the liquid phase. The dried residue presented as a black, tarry solid with a characteristic biomass pyrolysis oil odor. Thermogravimetric analysis (TGA) revealed a thermal profile where approximately 2% of light volatiles were removed at low temperatures, correcting the effective dry matter content to 13.3 wt%. Upon increasing temperature under nitrogen flow, the sample exhibited significant volatilization and degradation, accounting for approximately 88% of the mass. The remaining residue was composed of fixed carbon (~7 wt%) and inorganic ash (~2.8 wt%) in the form of oxides. All this information is reported in Figure 3.
3.1.2. Elemental Composition
Elemental analysis performed on the dried residue confirmed a composition typical of carbonaceous organic byproducts. The solid fraction contained carbon, hydrogen, and nitrogen. Sulfur content was negligible (< 0.02 wt%), indicating a low potential for sulfur-based emissions during subsequent thermal or electrochemical valorization steps. The results are shown in Table 1.
3.1.3. Analysis of Soluble Molecules and Molecular Weight Distribution
HPLC analysis determined the liquid fraction’s content of organic acids and furanic compounds. The solution was remarkably rich in acetic acid, with a concentration of . Conversely, formic acid was negligible (< 3 ppm). Furanic derivatives were present in minor quantities, with 2-furaldehyde and 5-hydroxymethylfurfural (5-HMF) concentrations of 0.95 g/kg and 0.36 g/kg respectively, as reported in Table 2.
Regarding the molecular weight distribution, Gel Filtration Chromatography (GFC) indicated that the sample contains a complex mixture of high-molecular-weight species (> 200 Da).
Data obtained from the Diode Array Detector (DAD) confirmed the presence of distinct chemical functionalities: absorption at 210 nm indicated phenolic groups, 254 nm suggested benzenic structures, and 280 nm pointed to condensed aromatic systems (e.g., naphthalene derivatives), consistent with the presence of oligomeric lignin degradation products, as reported in Figure 4.
3.1.4. Volatile and Semi-Volatile Organic Compounds (GC-MS)
Gas chromatography-mass spectrometry (GC-MS) identified a series of volatile and semi-volatile organic compounds (VOCs and SVOCs). The total concentration of identified substances, quantified against a naphthalene internal standard, was approximately 12.7 g/kg. The profile was dominated by aromatic and cyclic structures, attributed to unburned or thermally degraded lignin residues and condensation phenomena occurring at high gasification temperatures.
The most abundant species included catechol (2.09 g/kg); 2-cyclopenten-1-one derivatives (cumulatively > 1 g/kg); and various methoxy-phenols such as 2-methoxy-phenol (0.52 g/kg); 4-methyl-1,2-benzenediol (0.59 g/kg); and creosol (0.55 g/kg). Value-added compounds like vanillin were also detected (0.37 g/kg). Comparing the total organic load in the dry matter with the GC-MS results reveal that most of the organic substances consist of high-molecular-weight condensation products that are not detectable via gas chromatography, aligning with the findings from the molecular weight distribution analysis.
3.2. Polarization Curves
Polarization curves were obtained for the following cases: (a) nickel foam electrode in 1 M NaOH; (b) nickel foam electrode in the presence of tar in 1 M NaOH; (c) nickel foam electrode modified with nickel oxide-hydroxide in 1 M NaOH; (d) nickel foam electrode modified with nickel oxide-hydroxide in the presence of tar in 1 M NaOH.
As shown in Figure 5, both electrodes in the presence of tar generate current at a lower potential compared to the cases without tar. Notably, the nickel oxide-hydroxide electrode exhibits an onset potential for tar electrolysis as low as 0.4 V, compared to 0.52 V of NaOH 1 M.
3.3. Tar Oxidation vs OER
The chronopotentiometric experiments were carried out using the best-performing electrode identified through LSV experiments: the nickel oxide-hydroxide electrode.
From the chronopotentiometric experiments, it was possible to identify the transition from the oxidation of tar components at the electrode surface to the point where the predominant process becomes OER, once the oxidizable species in the tar were depleted.
As shown in Figure 6, this transition is marked by a noticeable increase in potential under constant current conditions. This indicates that the kinetically favored process at the nickel oxide-hydroxide electrode is the oxidation of organic species in the tar, rather than the OER.
3.4. Hydrogen Production
The electrochemical performance of the system was evaluated to quantify hydrogen evolution rates and energy consumption. Chronoamperometric (CA) measurements (Figure 7) served as the primary dataset for determining the total charge passed through the electrolytic cell. According to Faraday’s laws, the moles of hydrogen produced are directly proportional to the integrated charge (Q) over the electrolysis time (t), as described by Equation (1):
where I(t) is the current (A), z is the number of electrons involved in the cathodic hydrogen evolution reaction (HER) (where z = 2 for ) and F is the Faraday constant (96485 C/mol).
To validate the stoichiometry of the process, the actual volume of gas generated at the cathode was measured using the water displacement method and compared against the values derived from the CA data, assuming the hydrogen gas behavior as ideal at 25 °C and 1 atm. The gas purity was subsequently analyzed via gas chromatography equipped with a thermal conductivity detector (GC-TCD), confirming that hydrogen was the sole gaseous product that evolved at the cathode.
Based on the volumetric analysis, a Faradaic efficiency (FE) of 90% was determined. This high efficiency allows for the confident assumption that the current recorded during chronoamperometry is almost exclusively utilized for the water reduction half-reaction. Consequently, the actual mass of hydrogen produced () can be estimated using Equation (2):
where is the molecular weight of hydrogen (2.016 g /mol).
Comparing the hydrogen yield with the mass of organic feedstock consumed allows for the determination of the specific conversion efficiency. Under the optimized conditions at a cell potential of 0.4 V, the electro-reforming of tar demonstrated a highly favorable energy profile. The specific energy consumption () required to produce hydrogen was calculated to be . This value indicates a significant reduction in energy demand compared to conventional water electrolysis, attributed to the thermodynamic advantage of oxidizing organic biomass residues at the anode rather than water.
3.5. Tar Electro-Reforming
Electrolysis of tar was performed at a fixed cell voltage of 0.5 V. Samples were collected after 80 hours and analyzed by GC-MS. As shown in Table 3, a substantial decrease in aromatic compounds was observed. The most effective result was obtained using a nickel oxide-hydroxide electrode as the anode. Under these conditions, the organic molecules undergo progressive oxidation, potentially leading to their complete conversion into carbon dioxide.
4. Conclusions
This work establishes a comprehensive framework for the electrochemical valorization of liquid byproducts generated during biomass gasification, demonstrating that these streams, currently handled as wastes, can be effectively repurposed as anodic fuels for efficient hydrogen production. The detailed chemical characterization of the scrubbing water revealed a highly heterogeneous mixture of aromatic compounds, organic acids, and oligomers, confirming both the environmental burden and the chemical potential of this stream. Such complexity makes these residues particularly suitable for oxidation processes capable of coupling pollutant abatement with renewable hydrogen generation [24,25].
The use of nickel foam electrodes functionalized with electrodeposited nickel oxyhydroxide proved central to the success of the process. These abundant and cheap material exhibited substantial catalytic activity toward the oxidation of the organic compounds found in tars, enabling a marked reduction in the anodic onset potential relative to the conventional oxygen evolution reaction. This thermodynamic advantage translates into reduced specific energy consumption and supports the selective evolution of pure hydrogen at the cathode. The electrode architecture also demonstrated robust operational stability under extended electrolysis periods.
Electro-reforming tests conducted for long periods of time at low cell voltages (0.5 V) confirmed both the durability of the system and its capacity to significantly degrade toxic aromatic species, as evidenced by GC-MS analysis of the treated solutions. Almost 80% of the initial organic load was removed or transformed into more oxidized, hydrophilic intermediates, and in many cases, complete oxidation was observed. Meanwhile, the hydrogen was produced at high Faradaic efficiency and with a reduced energetic demand compared to commercial water electrolysis.
Finally, this study demonstrates that integrating biomass gasification units with electrochemical upgrading technologies to create a more circular and energy-efficient process chain, is possible. The coupling of wastewater remediation with hydrogen production offers a transformative approach to lowering operational costs, enhancing resource efficiency, and supporting the development of sustainable biorefinery models [26,27].
Future research directions include optimization of electrode design, scale-up the reactor configuration using continuous-flow technology, and the extension of this methodology to other industrial branches. In conclusion, the results highlight the potential of electro-reforming as an emerging way for sustainable hydrogen generation and simultaneous environmental remediation.
Author Contributions
Conceptualization, F.Z. and U.C.; methodology, U.C., V.V. F.Z.; validation, U.C., N.C. and F.Z.; formal analysis, F.Z and U.C.; investigation, U.C., V.V.; resources, N.C.; data curation, F.Z.; writing—original draft preparation, U.C.; writing—review and editing, F.Z.; supervision, F.Z.; project administration, N.C.; funding acquisition, N.C and F.Z. All authors have read and agreed to the published version of the manuscript.
Funding
This study has been performed within the program agreement MiTE-ENEA, PNRR- Hydrogen Research Mission M2-C4 - Investment 3.5 research and development on hydrogen financed by the Italian Ministry of the environment and Energy.
Data Availability Statement
Data will be made available on request.
Conflicts of Interest
The authors declare no conflicts of interest. The funders had no role in the design of the study; in the collection, analyses, or interpretation of data; in the writing of the manuscript; or in the decision to publish the results.
Abbreviations
The following abbreviations are used in this manuscript:
| AEM | Anion Exchange Membrane |
| CA | Chronoamperometry |
| CP | Chronopotentiometry |
| DAD | Diode Array Detector |
| DM | Dry Matter |
| EI | Electron Impact |
| FE | Faradaic Efficiency |
| FID | Flame Ionization Detector |
| GC | Gas Chromatography |
| GC-MS | Gas Chromatography–Mass Spectrometry |
| GFC | Gel Filtration Chromatography |
| HPLC | High-Performance Liquid Chromatography |
| LSV | Linear Sweep Voltammetry |
| MW | Molecular Weight |
| Ni(O)OH | Nickel Oxide-Hydroxide |
| OER | Oxygen Evolution Reaction |
| PEG | Polyethylene Glycol |
| RID | Refractive Index Detector |
| SVOCs | Semi-Volatile Organic Compounds |
| TCD | Thermal Conductivity Detector |
| TGA | Thermogravimetric Analysis |
| VOCs | Volatile Organic Compounds |
References
- Giakoumakis, G.; Sidiras, D. Production and Storage of Hydrogen from Biomass and Other Sources: Technologies and Policies. Energies 2025, 18, 650. [Google Scholar] [CrossRef]
- Suleman, F.; Dincer, I.; Agelin-Chaab, M. Environmental Impact Assessment and Comparison of Some Hydrogen Production Options. Int J Hydrogen Energy 2015, 40, 6976–6987. [Google Scholar] [CrossRef]
- Skjærseth, J.B. Towards a European Green Deal: The Evolution of EU Climate and Energy Policy Mixes. Int Environ Agreem 2021, 21, 25–41. [Google Scholar] [CrossRef]
- Obiora, N.K.; Ujah, C.O.; Asadu, C.O.; Kolawole, F.O.; Ekwueme, B.N. Production of Hydrogen Energy from Biomass: Prospects and Challenges. Green Technologies and Sustainability 2024, 2, 100100. [Google Scholar] [CrossRef]
- Liu, W.; Liu, C.; Gogoi, P.; Deng, Y. Overview of Biomass Conversion to Electricity and Hydrogen and Recent Developments in Low-Temperature Electrochemical Approaches. Engineering 2020, 6, 1351–1363. [Google Scholar] [CrossRef]
- Valderrama Rios, M.L.; González, A.M.; Lora, E.E.S.; Almazán del Olmo, O.A. Reduction of Tar Generated during Biomass Gasification: A Review. Biomass Bioenergy 2018, 108, 345–370. [Google Scholar] [CrossRef]
- Cortazar, M.; Santamaria, L.; Lopez, G.; Alvarez, J.; Zhang, L.; Wang, R.; Bi, X.; Olazar, M. A Comprehensive Review of Primary Strategies for Tar Removal in Biomass Gasification. Energy Convers Manag 2023, 276, 116496. [Google Scholar] [CrossRef]
- Melis, N.; Mais, L.; Mascia, M.; Vacca, A. Assessing an Electrochemical Process for the Treatment of Tar-Containing Wastewater with Hydrogen Recovery. Chemical Engineering Journal 2024, 500, 156736. [Google Scholar] [CrossRef]
- Tian, Z.; Lu, Y.; Wang, J.; Shu, R.; Wang, C.; Chen, Y. Advances in Hydrogen Production by Aqueous Phase Reforming of Biomass Oxygenated Derivatives. Fuel 2024, 357, 129691. [Google Scholar] [CrossRef]
- Miller, H.A.; Bouzek, K.; Hnat, J.; Loos, S.; Bernäcker, C.I.; Weißgärber, T.; Röntzsch, L.; Meier-Haack, J. Green Hydrogen from Anion Exchange Membrane Water Electrolysis: A Review of Recent Developments in Critical Materials and Operating Conditions. Sustain Energy Fuels 2020, 4, 2114–2133. [Google Scholar] [CrossRef]
- Dolle, C.; Neha, N.; Coutanceau, C. Electrochemical Hydrogen Production from Biomass. Curr Opin Electrochem 2022, 31, 100841. [Google Scholar] [CrossRef]
- Zhao, H.; Lu, D.; Wang, J.; Tu, W.; Wu, D.; Koh, S.W.; Gao, P.; Xu, Z.J.; Deng, S.; Zhou, Y.; et al. Raw Biomass Electroreforming Coupled to Green Hydrogen Generation. Nature Communications 2021, 1 2021(12), 2008. [Google Scholar] [CrossRef] [PubMed]
- Grasset, C.; Groeneveld, M.; Tranvik, L.J.; Robertson, L.P.; Hawkes, J.A. Hydrophilic Species Are the Most Biodegradable Components of Freshwater Dissolved Organic Matter. Environ Sci Technol 2023, 57, 13463–13472. [Google Scholar] [CrossRef]
- Shi, K.; Si, D.; Teng, X.; Chen, L.; Shi, J. Enhanced Electrocatalytic Glycerol Oxidation on CuCoN0.6/CP at Significantly Reduced Potentials. Chinese Journal of Catalysis 2023, 53, 143–152. [Google Scholar] [CrossRef]
- Bolarinwa, M.O.; Zakari, R.S.B.; Talib, S.H.; Stephen, S.; Polychronopoulou, K.; Elkadi, M.; Anjum, D.H. Electrochemical Oxidation of Glycerol to Glyceric Acid Using Iridium-Vanadium (IrV) Dual Atom Catalysts on Graphene Variants: Experimental and Computational Approach. Appl Surf Sci 2025, 688, 162457. [Google Scholar] [CrossRef]
- Velázquez-Hernández, I.; Álvarez-López, A.; Álvarez-Contreras, L.; Guerra-Balcázar, M.; Arjona, N. Electrocatalytic Oxidation of Crude Glycerol from the Biodiesel Production on Pd-M (M = Ir, Ru or Pt) Sub-10 Nm Nanomaterials. Appl Surf Sci 2021, 545. [Google Scholar] [CrossRef]
- White, J.; Peters, L.; Martín-Yerga, D.; Terekhina, I.; Anil, A.; Lundberg, H.; Johnsson, M.; Salazar-Alvarez, G.; Henriksson, G.; Cornell, A. Glycerol Electrooxidation at Industrially Relevant Current Densities Using Electrodeposited PdNi/Nifoam Catalysts in Aerated Alkaline Media. J Electrochem Soc 2023, 170, 086504. [Google Scholar] [CrossRef]
- Wulf, C.; Linssen, J.; Zapp, P. Power-to-Gas-Concepts, Demonstration, and Prospects. In Hydrogen Supply Chain: Design, Deployment and Operation; 2018; pp. 309–345. [Google Scholar] [CrossRef]
- Tichler, R.; Bauer, S.; Böhm, H. Power-to-Gas. In Storing Energy: with Special Reference to Renewable Energy Sources; 2022; pp. 595–612. [Google Scholar] [CrossRef]
- Cigolotti, V.; Genovese, M.; Piraino, F.; Fragiacomo, P. Applications | Overview of Energy Storage Systems. Encyclopedia of Electrochemical Power Sources: Volume 1-7, Second Edition 2024, 7, V7:47–V7:59. [Google Scholar] [CrossRef]
- Cerone, N.; Zimbardi, F. Gasification of Agroresidues for Syngas Production. Energies 2018, 11, 1280. [Google Scholar] [CrossRef]
- Srinivasan, V.; Weidner, J.W. An Electrochemical Route for Making Porous Nickel Oxide Electrochemical Capacitors. J Electrochem Soc 1997, 144, L210–L213. [Google Scholar] [CrossRef]
- Wu, M.S.; Huang, Y.A.; Yang, C.H.; Jow, J.J. Electrodeposition of Nanoporous Nickel Oxide Film for Electrochemical Capacitors. Int J Hydrogen Energy 2007, 32, 4153–4159. [Google Scholar] [CrossRef]
- Abawalo, M.; Pikoń, K.; Landrat, M.; Ścierski, W. Hydrogen Production from Biowaste: A Systematic Review of Conversion Technologies, Environmental Impacts, and Future Perspectives. Energies (Basel) 2025, 18. [Google Scholar] [CrossRef]
- Mustapha, S.I.; Anekwe, I.M.S.; Akpasi, S.O.; Muritala, K.B.; Tetteh, E.K.; Joel, A.S.; Isa, Y.M. Biomass Conversion for Sustainable Hydrogen Generation: A Comprehensive Review. Fuel Processing Technology 2025, 272, 108210. [Google Scholar] [CrossRef]
- Sun, Y.; Miao, J.; Fan, X.; Zhang, K.; Zhang, T. Recent Progress in Electrochemical Conversion from Biomass Derivatives into High-Value-Added Chemicals. Small Struct 2024, 5, 2300576. [Google Scholar] [CrossRef]
- Wang, Z.; Li, B.; Yang, T.; Wang, J.; Li, R. Valorization to Hydrogen of Aqueous Phase from Biomass Hydrothermal Liquefaction Via Aqueous Phase Reforming Over Ni/Ac Catalyst. 2024. [Google Scholar] [CrossRef]
Figure 1.
Nickel foam electrodes before (left) and after (right) electrodeposition of nickel oxide-hydroxide. Both electrodes have a diameter of 1.8 cm.
Figure 1.
Nickel foam electrodes before (left) and after (right) electrodeposition of nickel oxide-hydroxide. Both electrodes have a diameter of 1.8 cm.
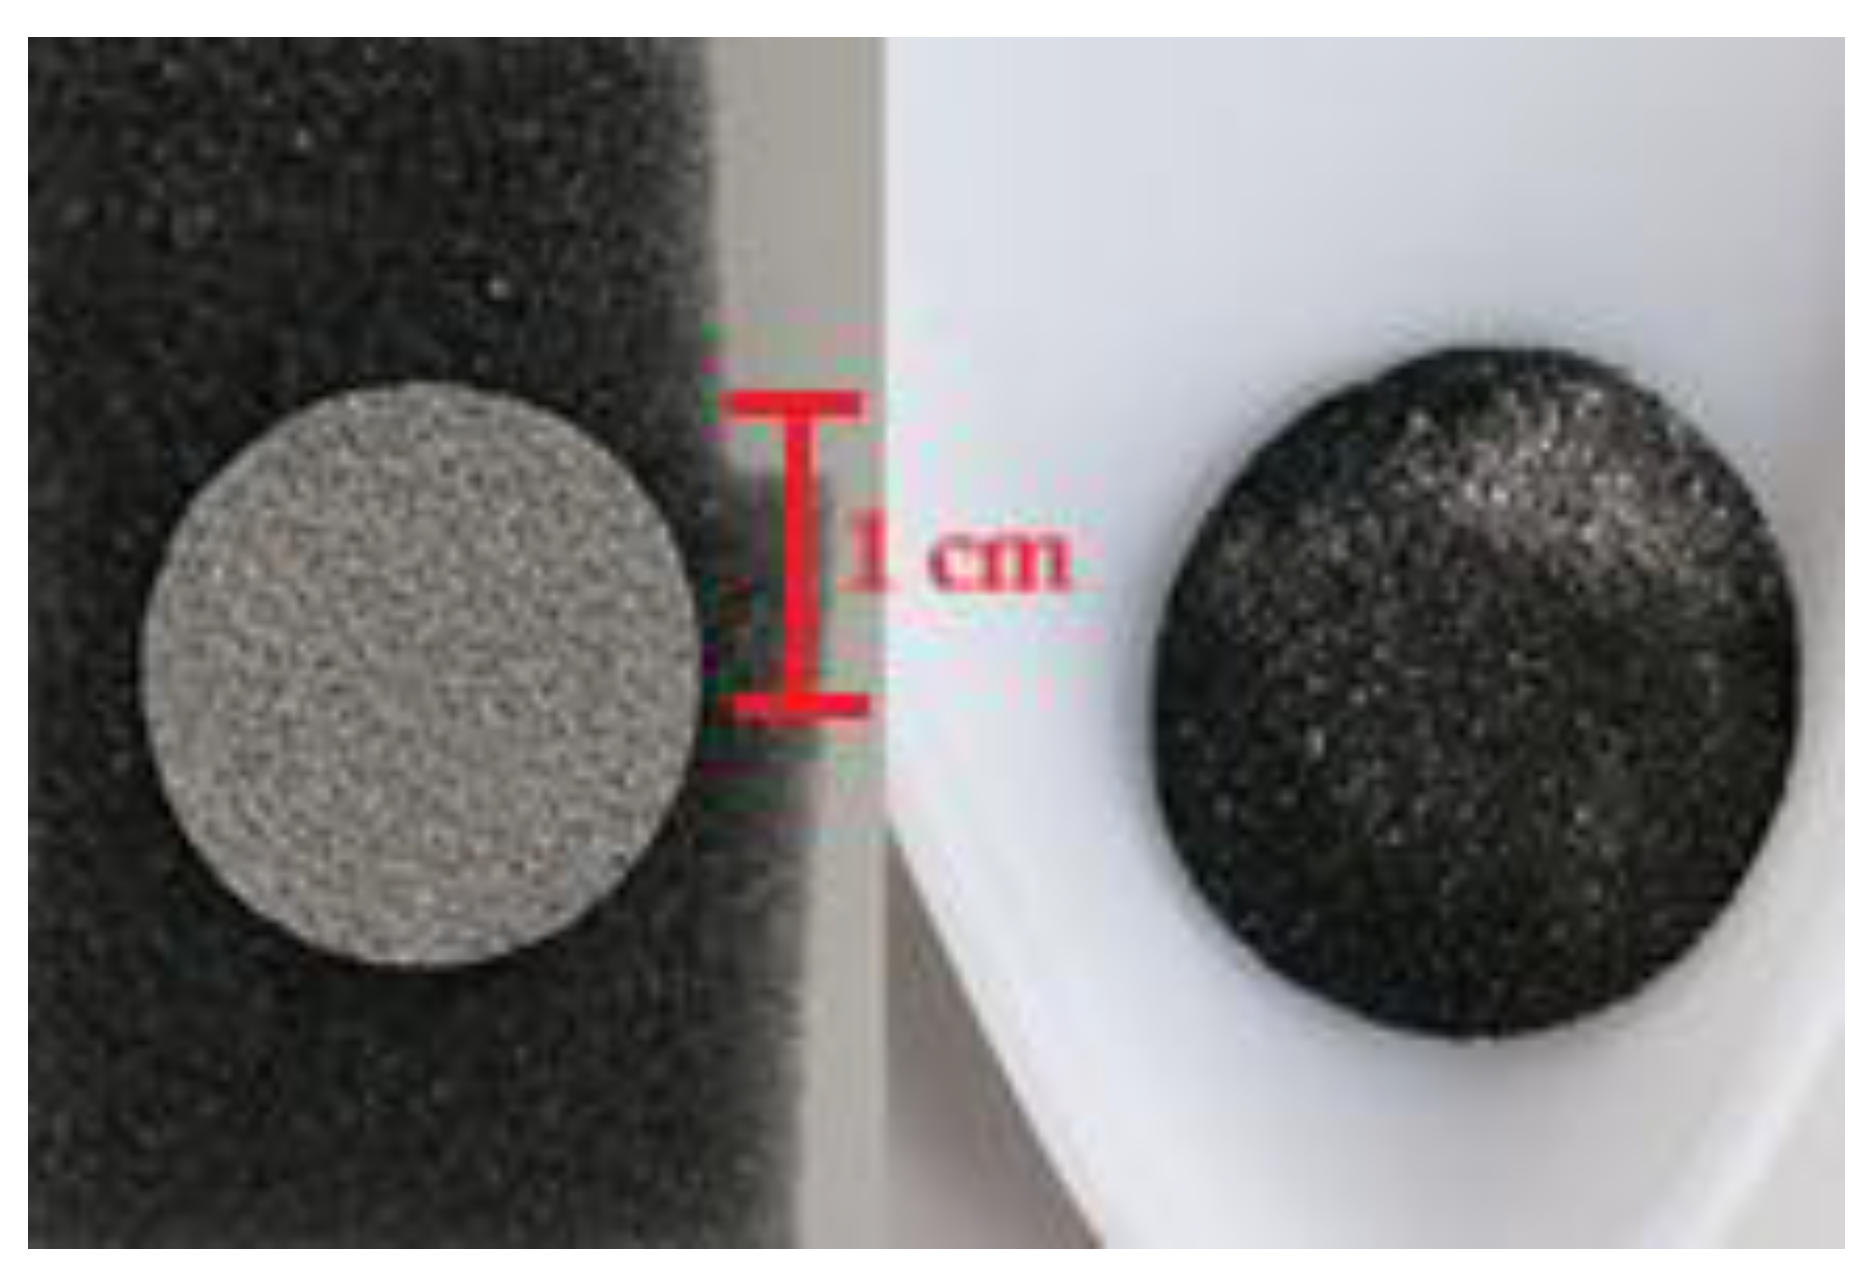
Figure 2.
Scheme of the sealed H-type electrolysis cell. (1) Burette for gas collection from the anode by water displacement. (2) Anolyte: tar solution in 1 M NaOH. (3) NiOOH working electrode (anode), connected to the positive terminal of the potentiostat. (4) Standard Ag/AgCl reference electrode. (5) Anion-exchange membrane. (6) Catholyte: 1 M NaOH. (7) Nickel foam counter electrode (cathode), connected to the negative terminal of the potentiostat. (8) Burette for gas collection from the cathode by water displacement. (9) Thermostated water bath maintained at constant temperature. (10) Magnetic stirrer for anolyte agitation and heating of the water bath.

Figure 3.
TGA analysis of the dried residue from scrubbing water.
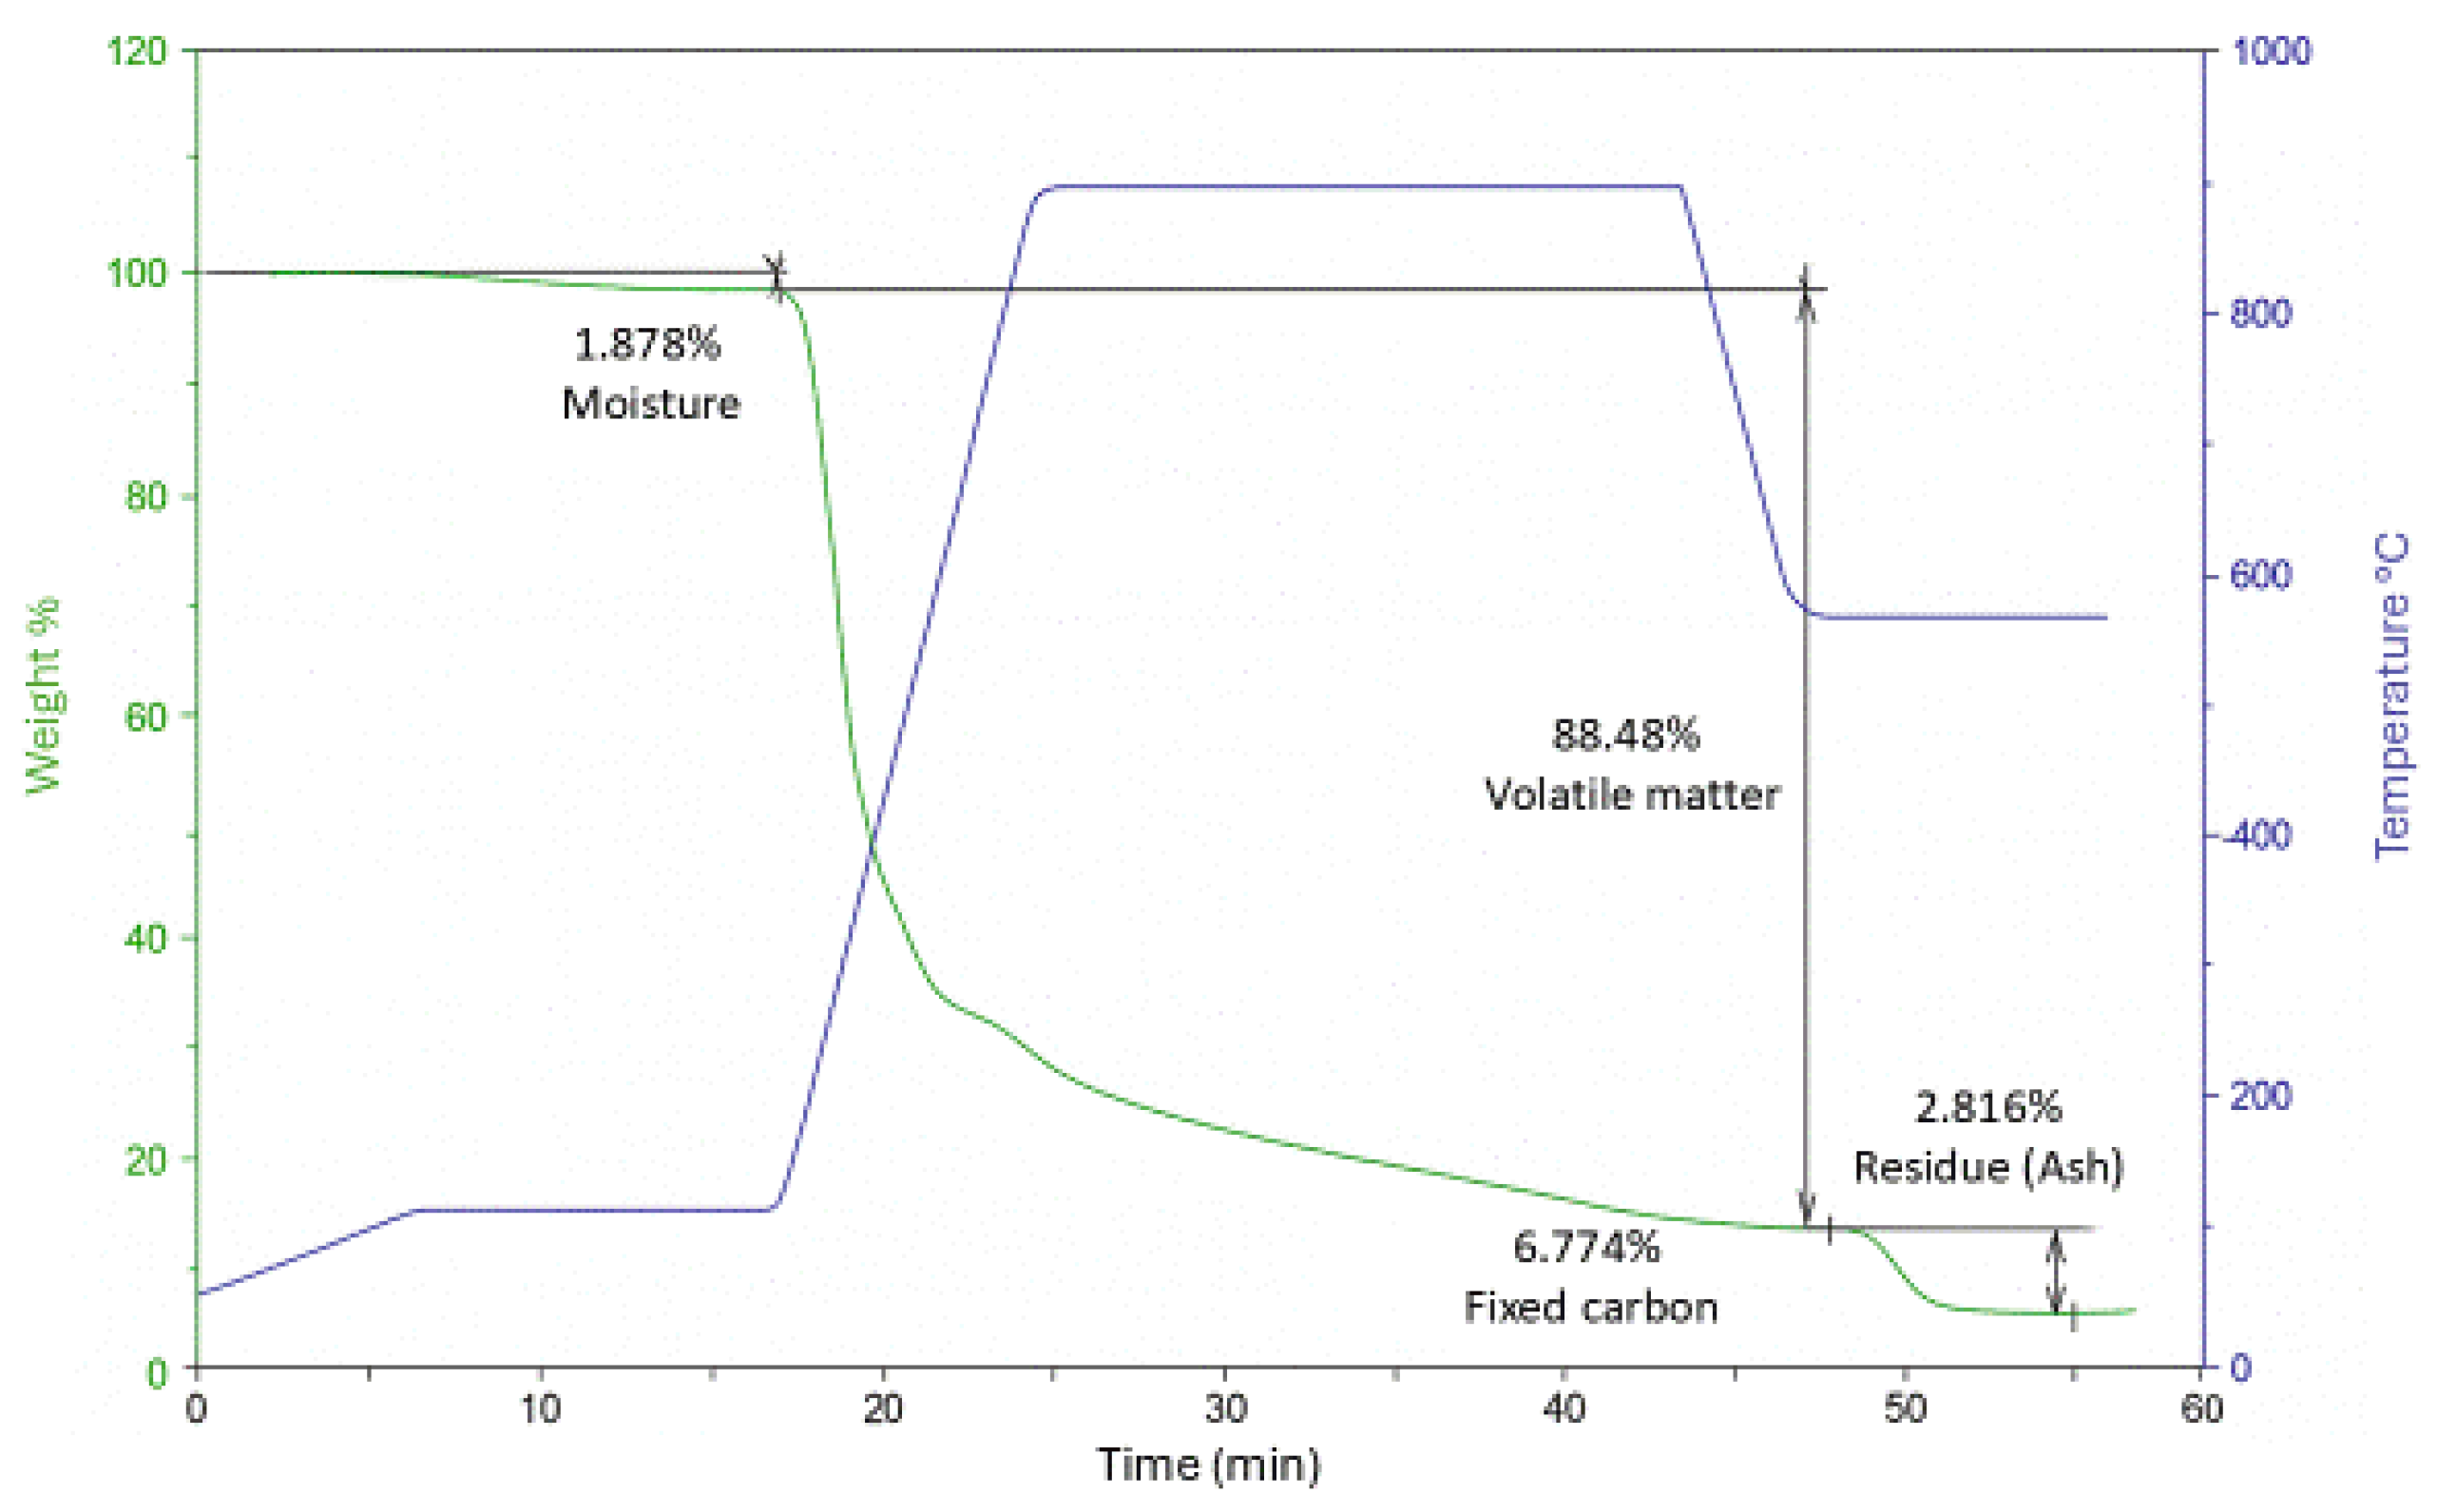
Figure 4.
Molecular weight distribution of water-soluble molecules by GFC. Signal acquisition using a DAD at three different wavelengths. In the background, in orange, acquisition using a RID.
Figure 4.
Molecular weight distribution of water-soluble molecules by GFC. Signal acquisition using a DAD at three different wavelengths. In the background, in orange, acquisition using a RID.
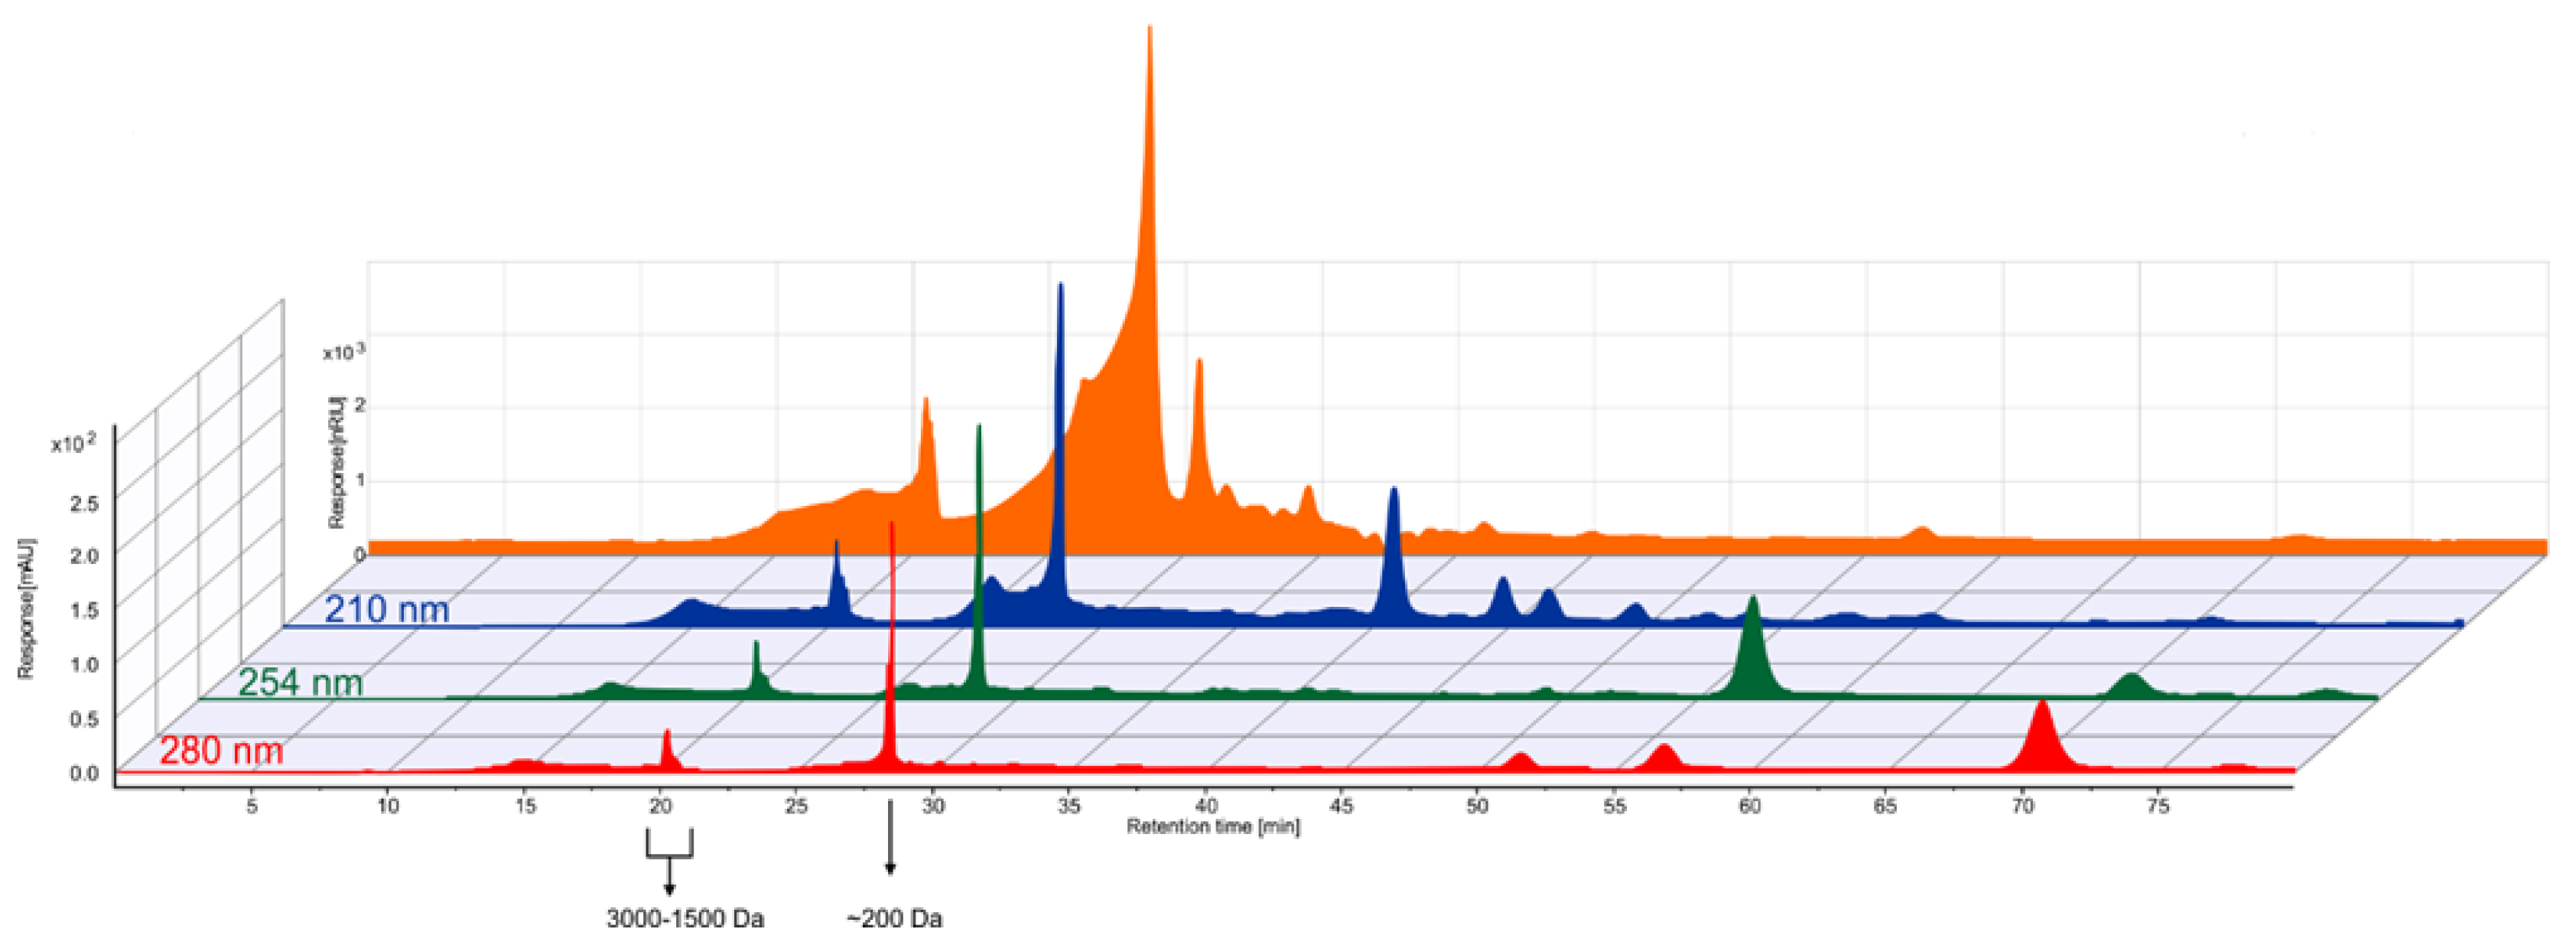
Figure 5.
Polarization curves of (a) nickel foam electrode in 1 M NaOH; (b) nickel foam electrode with tar in 1 M NaOH; (c) nickel foam electrode modified with nickel oxide-hydroxide in 1 M NaOH; (d) nickel foam electrode modified with nickel oxide-hydroxide with tar in 1 M NaOH.
Figure 5.
Polarization curves of (a) nickel foam electrode in 1 M NaOH; (b) nickel foam electrode with tar in 1 M NaOH; (c) nickel foam electrode modified with nickel oxide-hydroxide in 1 M NaOH; (d) nickel foam electrode modified with nickel oxide-hydroxide with tar in 1 M NaOH.
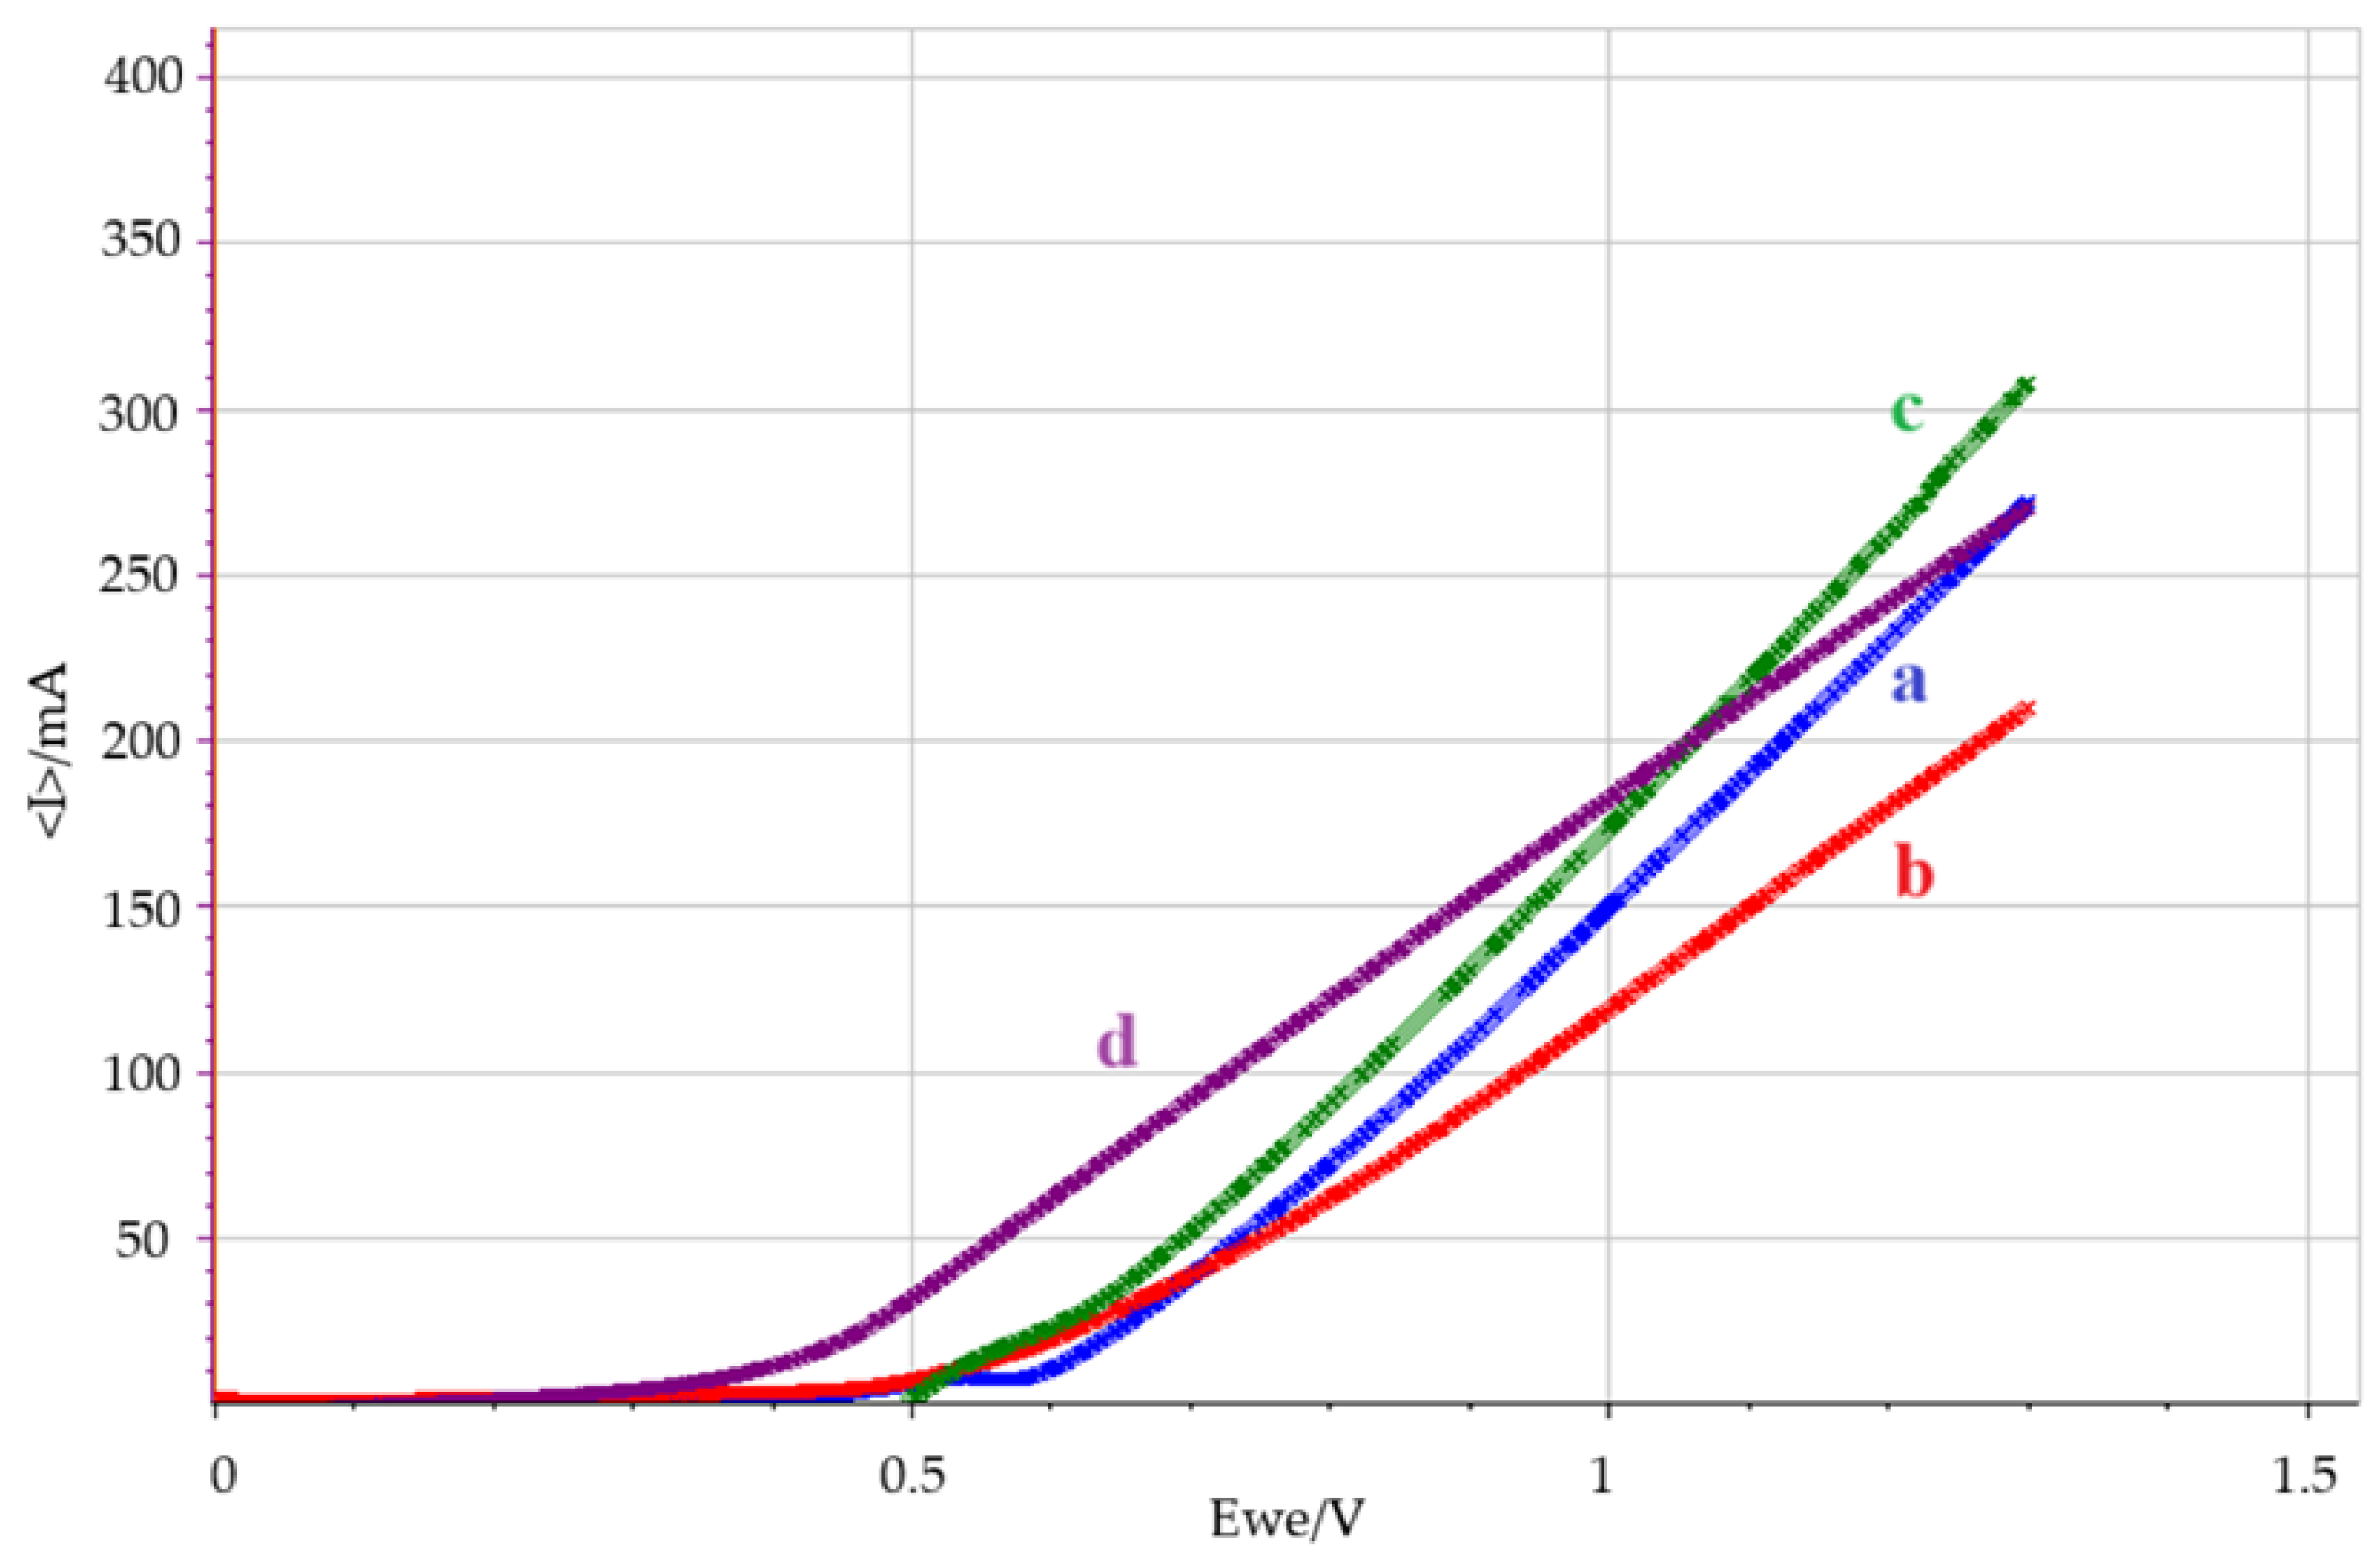
Figure 6.
CP experiment at 5 mA/cm² in 1 M NaOH with tar as the substrate. A potential increase of 0.2 V is observed upon depletion of oxidizable species in the sample, indicating the transition to predominant OER activity.
Figure 6.
CP experiment at 5 mA/cm² in 1 M NaOH with tar as the substrate. A potential increase of 0.2 V is observed upon depletion of oxidizable species in the sample, indicating the transition to predominant OER activity.
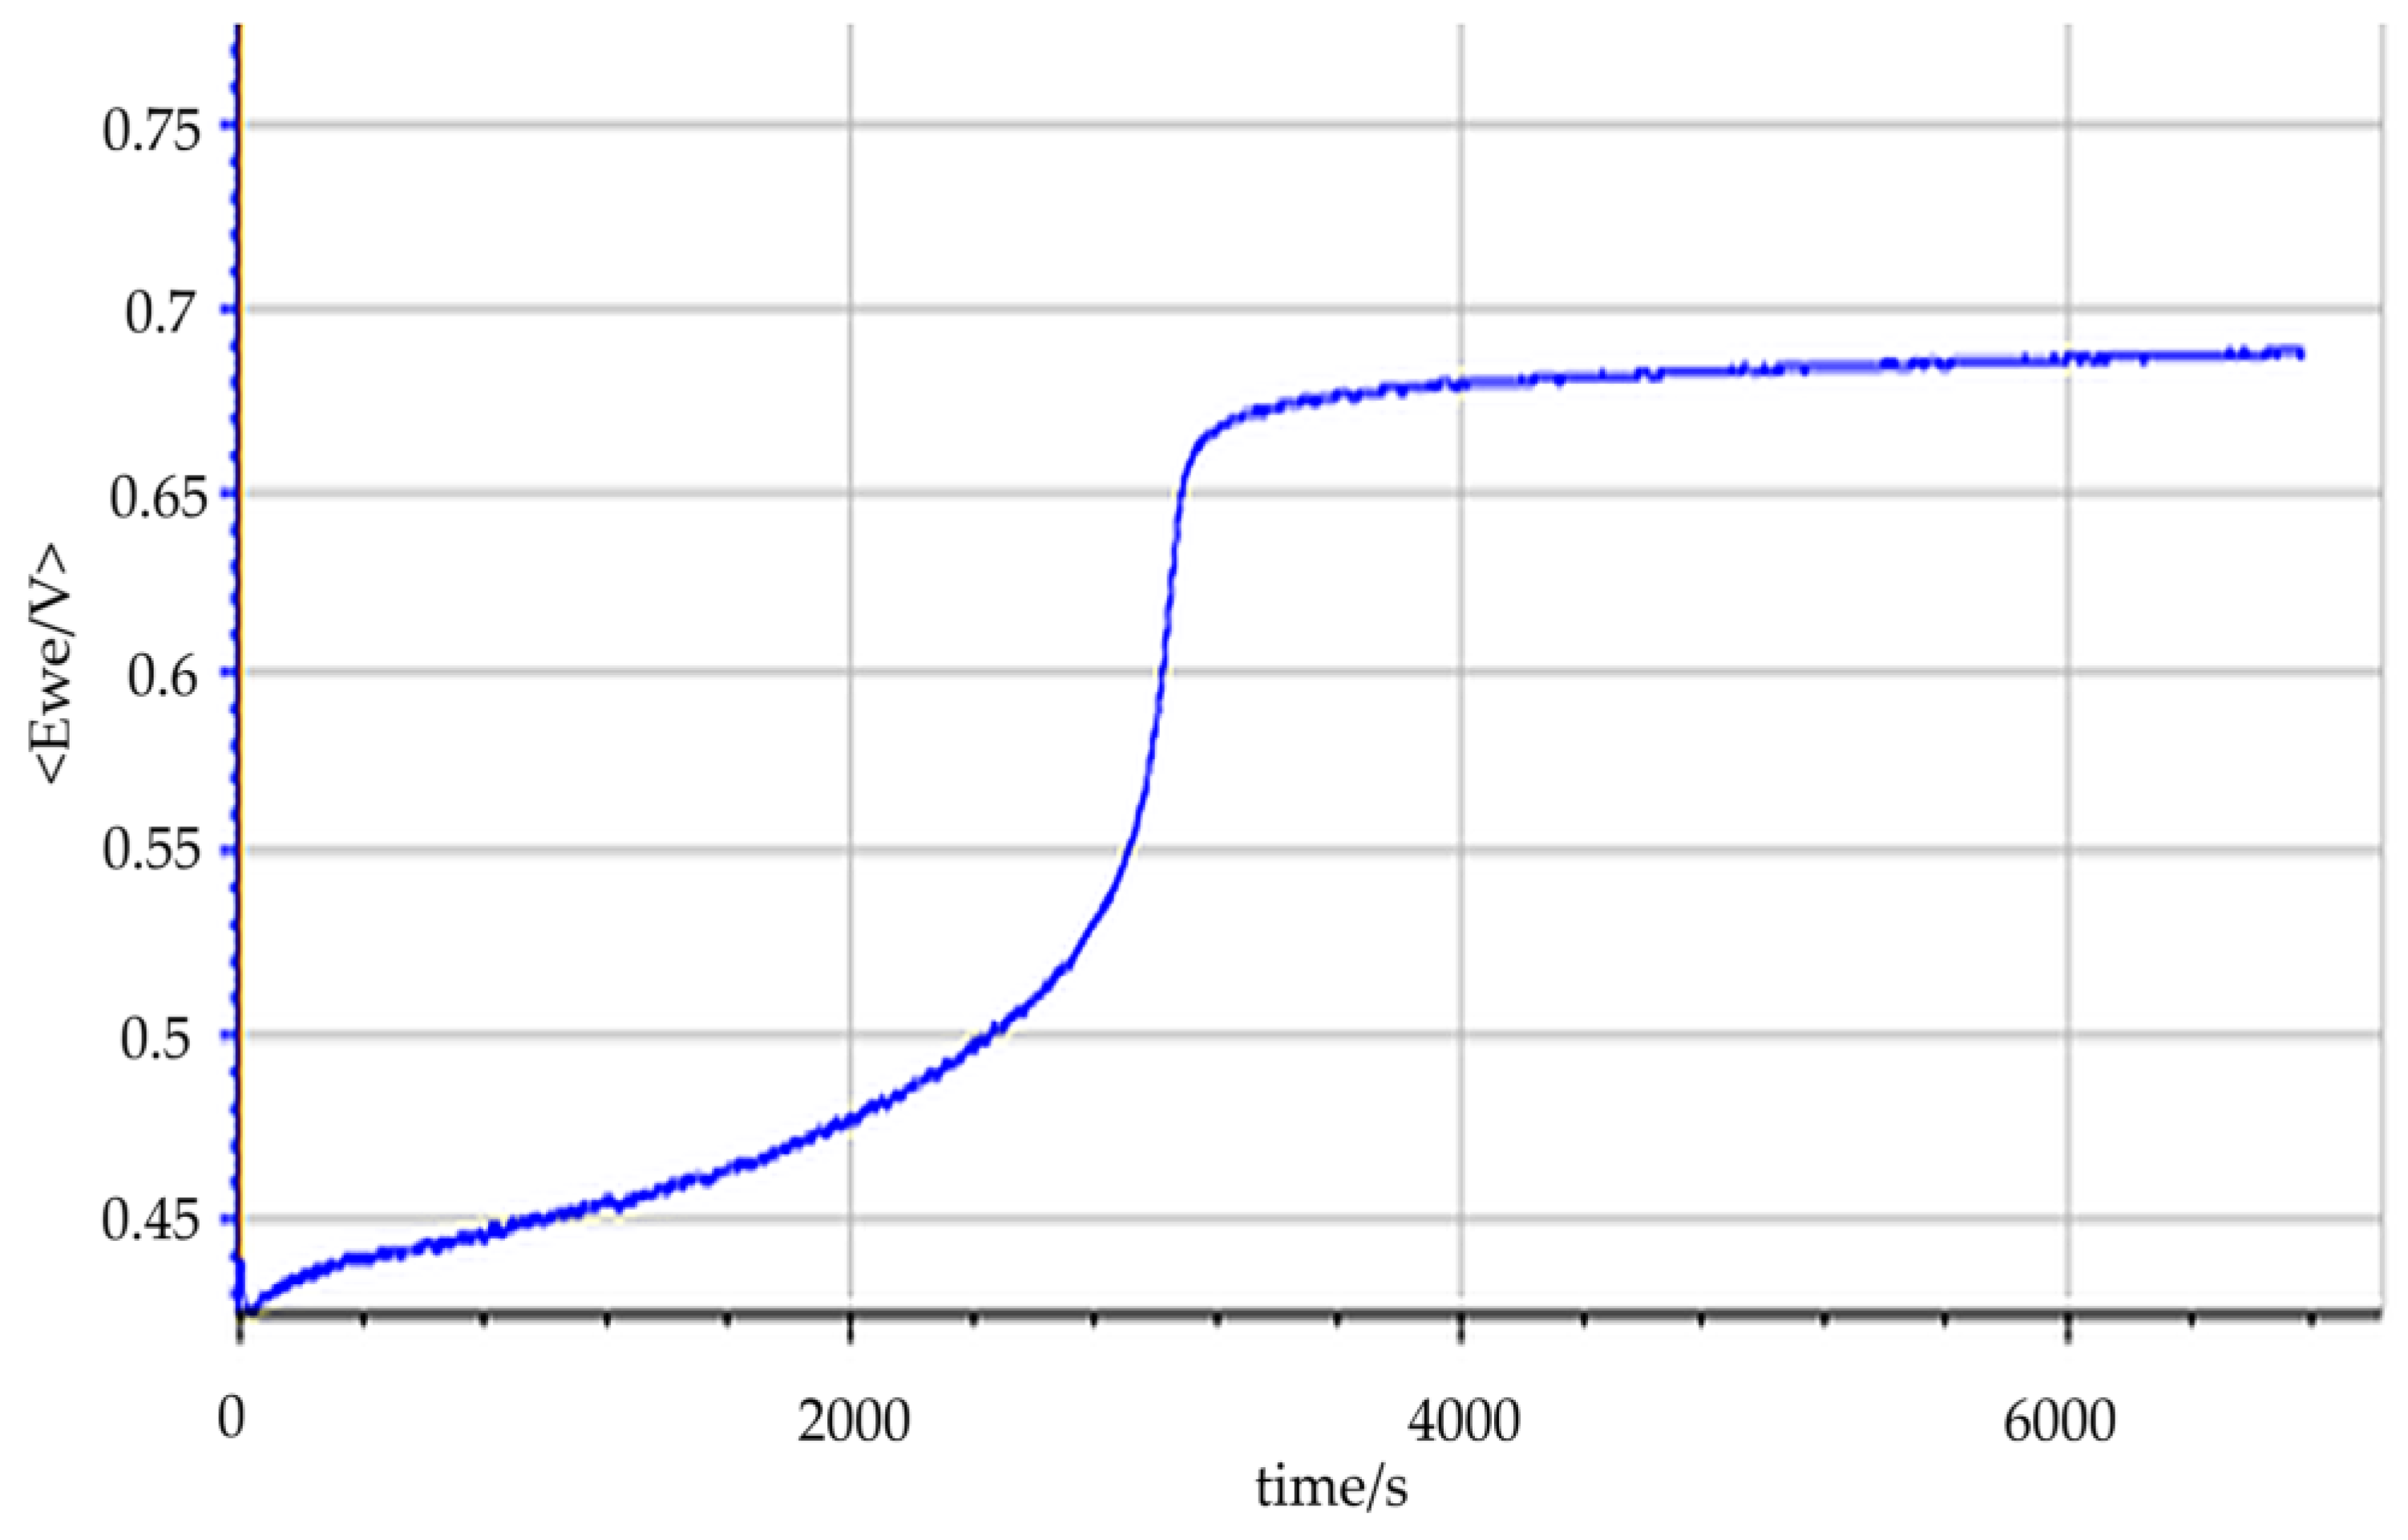
Figure 7.
Chronoamperometric profile of the electro-reforming process of tar in 0.1 M NaOH at a fixed potential of 0.45 V.
Figure 7.
Chronoamperometric profile of the electro-reforming process of tar in 0.1 M NaOH at a fixed potential of 0.45 V.
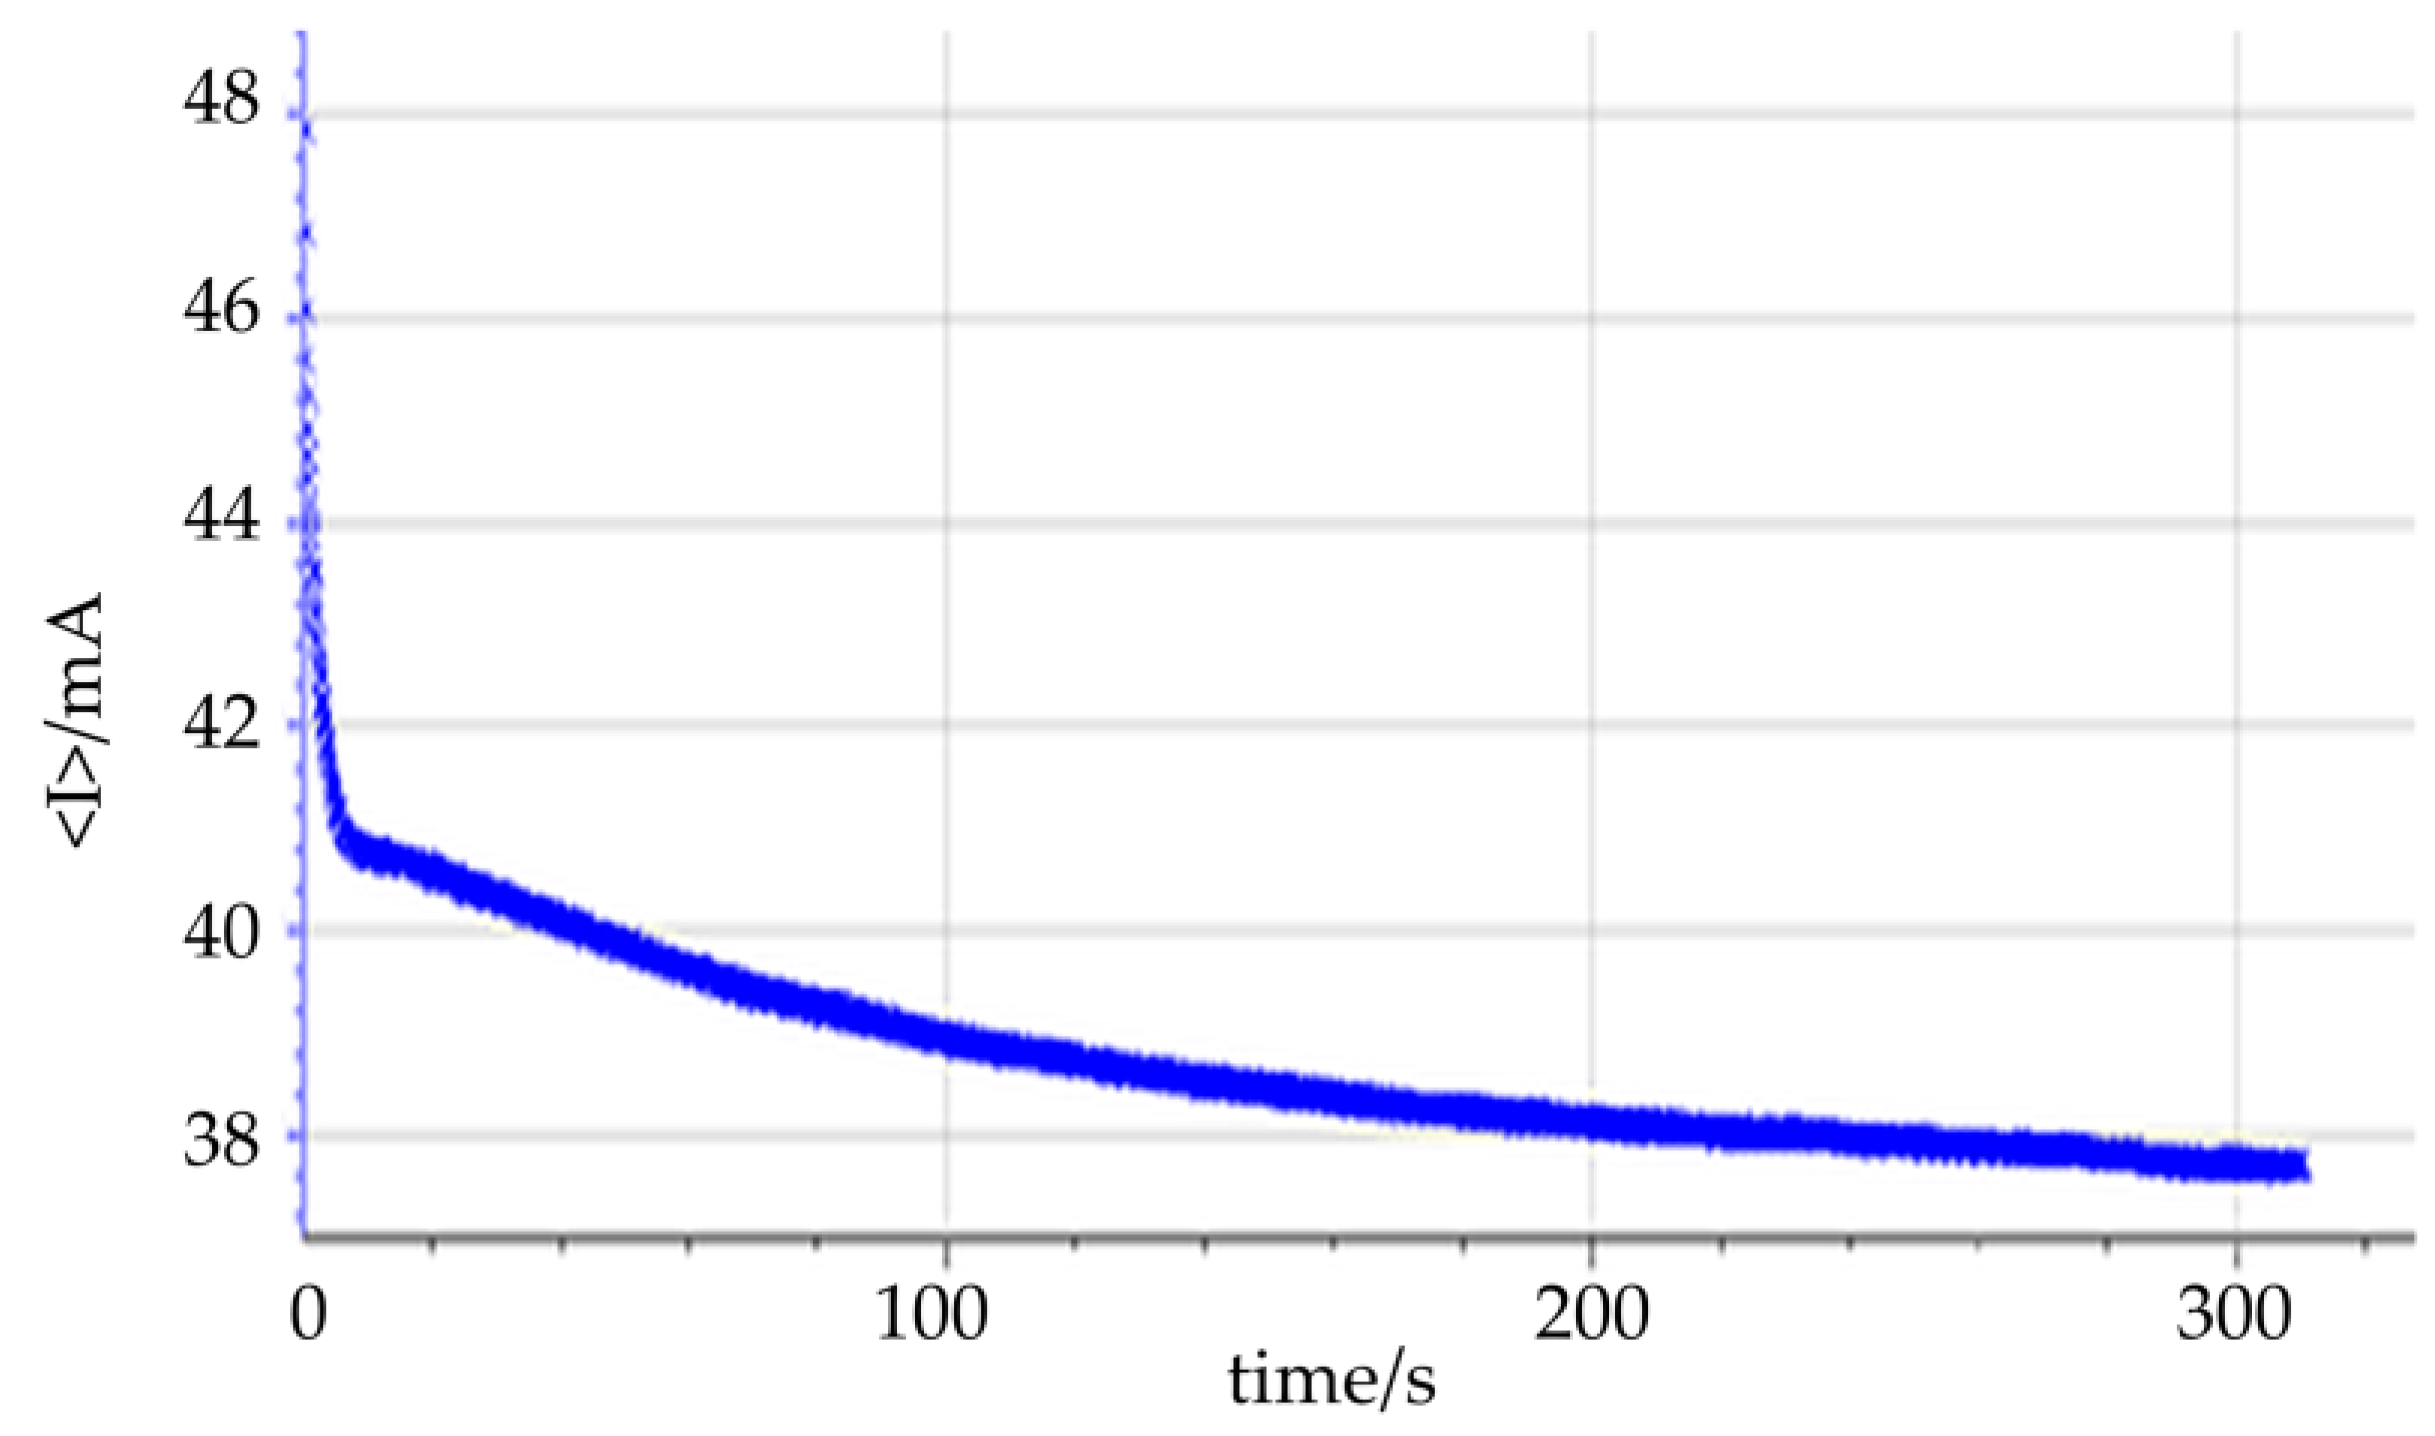

Table 1.
Dry matter and elemental composition of the scrubbing water samples.
| Unit | Value | ± (sd) | ||
|---|---|---|---|---|
| DM (80 °C) | % | 13.6 | 0.1 | |
| Carbon | % | 53.39 | 0.04 | |
| Hydrogen | % | 5.4 | 0.1 | |
| Nitrogen | % | 0.91 | 0.02 | |
| Sulfur | % | < 0.02 | ||
Table 2.
HPLC liquid fraction analysis for polar compound detection and quantification.
| Unit | Value | ± (sd) | ||
|---|---|---|---|---|
| DM (80 °C) | % | 13.6 | 0.1 | |
| Acetic acid | g/kg | 114 | 3 | |
| Formic acid | g/kg | <0.003 | ||
| 2-furaldehyde | g/kg | 0.95 | 0.04 | |
| 5-hydroxymethylfurfural | g/kg | 0.36 | 0.02 | |
Table 3.
Concentration of detected compounds after 80 hours of electro-reforming, as determined by GC-MS analysis, and comparison with the initial concentration.
Table 3.
Concentration of detected compounds after 80 hours of electro-reforming, as determined by GC-MS analysis, and comparison with the initial concentration.
| Compound | Initial concentration | Final concentration | Conversion |
|---|---|---|---|
| g/kg | g/kg | % | |
| 1-Hydroxy-2-butanone | 0.58 | 0 | 100 |
| 3-Furaldehyde | 0.69 | 0 | 100 |
| 2-Propanone, 1-(acetyloxy)- | 0.16 | 0 | 100 |
| 1H-Imidazole-4-carboxaldehyde | 0.09 | 0 | 100 |
| 1H-1,2,4-Triazole, 1-vinyl- | 0.09 | 0 | 100 |
| 2(5H)-Furanone | 0.35 | 0 | 100 |
| Butyrolactone | 0.38 | 0 | 100 |
| 2-Cyclopenten-1-one, 2-hydroxy- | 0.1 | 0 | 100 |
| 2-Cyclopenten-1-one, 3-methyl- | 0.18 | 0 | 100 |
| Phenol | 0.13 | 0 | 100 |
| 2-Cyclopenten-1-one, 2-hydroxy-3-methyl- | 0.90 | 0.47 | 48 |
| 1-Propanone, 1-cyclopropyl- | 0.07 | 0 | 100 |
| Propanoic acid, 2-methyl-, anhydride | 0.2 | 0 | 100 |
| Phenol, 2-methoxy- | 0.52 | 0.07 | 86 |
| 2-Cyclopenten-1-one, 3-ethyl-2-hydroxy- | 0.12 | 0 | 100 |
| Catechol | 2.09 | 0.78 | 73 |
| Creosol | 0.55 | 0 | 100 |
| Naphthalene | 0.22 | 0 | 100 |
| 1,2-Benzenediol, 3-methyl- | 0.29 | 0 | 100 |
| 1,2-Benzenediol, 3-methoxy- | 0.13 | 0 | 100 |
| 1,2,4,5-Tetrazine | 0.17 | 0 | 100 |
| 1,2-Benzenediol, 4-methyl- | 0.59 | 0 | 100 |
| 2,3-Dimethoxyphenol | 0.18 | 0 | 100 |
| Vanillin | 0.37 | 0 | 100 |
| Ethanone, 1-(3-hydroxy-4-methoxyphenyl)- | 0.26 | 0 | 100 |
| b-D-Glucopyranose, 1,6-anhydro- | 0.24 | 0 | 100 |
| 2-Propanone, 1-(4-hydroxy-3-methoxyphenyl)- | 0.44 | 0.24 | 45 |
| Benzenepropanol, 4-hydroxy-3-methoxy- | 0.62 | 0.42 | 32 |
| 2-Methoxy-5-methylphenol | 0.29 | 0 | 100 |
| 1,4:3,6-Dianhydro-α-d-glucopyranose | 0.18 | 0.13 | 29 |
| Benzene, 1,3-bis(1,1-dimethylethyl)- | 0.08 | 0.07 | 6 |
| Hydroquinone | 0.3 | 0.19 | 36 |
| Phenol, 2,6-dimethoxy- | 0.21 | 0.11 | 49 |
| Apocynin | 0.47 | 0.27 | 42 |
| 2H-1-Benzopyran-2-one, 3,4-dihydro-6-hydroxy- | 0.31 | 0 | 100 |
| TOTAL | 12.7 | 2.75 | 78 |
Disclaimer/Publisher’s Note: The statements, opinions and data contained in all publications are solely those of the individual author(s) and contributor(s) and not of MDPI and/or the editor(s). MDPI and/or the editor(s) disclaim responsibility for any injury to people or property resulting from any ideas, methods, instructions or products referred to in the content. |
© 2025 by the authors. Licensee MDPI, Basel, Switzerland. This article is an open access article distributed under the terms and conditions of the Creative Commons Attribution (CC BY) license (http://creativecommons.org/licenses/by/4.0/).
Copyright: This open access article is published under a Creative Commons CC BY 4.0 license, which permit the free download, distribution, and reuse, provided that the author and preprint are cited in any reuse.


