
Submitted:
23 December 2025
Posted:
23 December 2025
You are already at the latest version
Abstract
The Landauer energy of information/entropy associated with stars, galaxies, and galaxy clusters provides a dark energy dependent on source temperature, in turn, related to source mass. Combining a general source mass-temperature relation with a survey of stellar mass density measurements yields a dynamic Information Dark Energy with predicted dark energy equation of state, ω, CPL parameters: ω0= -0.76, ωa= -1.29. These parameter values match those obtained from the latest dark energy experiment results and would support the interpretation of universe expansion rate as having already changed from acceleration to deceleration. However, a polynomial fit to stellar mass density measurements provides a more complete description of the Information Dark Energy history, especially at low redshifts, z< 0.5. This approach shows that Information Dark Energy has still not reached a maximum, yet to cross ω=-1. This significant difference in interpretation highlights the limits of simple parameterisations, while also providing a prediction that enables Information Dark Energy to be falsified by future measurements, independent of parameterisation. Information Dark Energy has the potential to resolve the cosmological constant and cosmological coincidence problems, both H0 and σ8 tensions, and, concentrated in structures, may account for effects previously attributed to dark matter.
Keywords:
landauer’s principle
; dark energy
; dark energy experiments
1. Introduction
John Wheeler [1] considered information to be more fundamental than matter and used his slogan “It from Bit” to emphasize his view that all things physical are information-theoretic in origin. Rolf Landauer [2,3] showed that “Information is Physical”, as each bit of information has a minimum equivalent energy of kB T ln 2 at temperature, T. Landauer’s principle has now been proven experimentally for both classical bits and quantum qu-bits [4,5,6,7], and, linking information to thermodynamics, provides an important solution to the problem of Maxwell’s Demon [8].
A “Foundational Principle” proposed by Anton Zeilinger [9] considers the attributes of all particles correspond to elemental systems, at their most fundamental level. These are effectively simple 1bit, ‘yes’/’no’, results of experimental inquiry. In a simple universe without star formation, the Landauer equivalent energy of a Zeilinger elemental particle attribute has been shown [10] to be defined exactly the same as, and with the same value as, the characteristic energy of a cosmological constant [11]. This implies a strong similarity between information energy and dark energy.
Landauer equivalent energy has been shown to contribute a significant Information Dark Energy, IDE [12,13,14,15,16,17] to the universe. The information energy contribution of each phenomena is proportional to the product NT, where N is the information/entropy bit total and T is the representative temperature. Figure 1 summarizes published entropy estimates and typical temperatures for the main entropy components to the universe [17,18,19,20]. The strongest energy contributions are provided by stellar heated gas and the intra-cluster gas within galaxy clusters, with total information energy approaching 1070 J, the total mc2 equivalent energy of the 1053 kg baryons in the universe.
A key test for any proposed source of dark energy is to compare the predicted dark energy density variation over the history of the universe with the measured dark energy density history. The latest results of the Dark Energy Spectrograph Instrument, DESI, [21] and the Dark Energy Survey, DES, [22] provide evidence for a dynamic dark energy, evidence that excludes the previously assumed cosmological constant at a level >3.5 σ.
A previous IDE publication [17] only compared IDE against the initial data from DESI and DES, whereas the present work applies the updated final published DESI and DES results. Two versions of the relation between temperature and mass of astrophysical objects are applied here; one direct from a survey of galaxy and galaxy cluster measurements, and one derived from the DESI and DES results, assuming the IDE source of dark energy. The IDE prediction based on a survey of Stellar Mass Density, SMD, measurements is compared against the DES and DESI results. Also the SMD variation required for IDE to explain the DES and DESI results is compared against the SMD measurements. We find a limitation in the commonly used parameterisation of the dark energy equation of state parameter at low redshifts. Proceeding without parameterisation leads us to discover a different IDE history and identifies a future measurement that enables IDE to be falsified.
2. Information Dark Energy
2.1. Temperature Dependence on Object Mass
The Landauer equivalent energy of each bit in any system is solely dependent on the system’s temperature. We find that the typical temperatures, T, of several astrophysical structures ranging in mass, M, from 0.1 solar mass, M⊙, to >1015 M⊙ , each follow a similar relation. The results of a large survey of measured galaxy, galaxy group, and galaxy cluster temperatures [23] have been shown, on average, to closely follow the T α Mp relation over the range <1012 M⊙ to >1015 M⊙ with an overall value of p=0.606, illustrated in Figure 2 A & 2B. In Figure 2 C we see that the temperature of stars, from 10-1 M⊙ to 3 x 101 M⊙ in the seven main sequence spectral classes also follow the same relation, with the same value of p. In this work the SMD measurements [24,25,26,27,28,29,30,31,32,33,34,35,36,37,38,39,40,41,42,43,44,45,46,47,48,49,50,51] used previously is extended to include measurements at universe scale sizes, a<0.2, [52,53] where a is related to redshift, z, by a=1/(1+z), and today a=1.
2.2. CPL ω0-ωa Parameters
The time variation of the dark energy density is proportional to a-3(1+ω) , where ω is the dark energy equation of state parameter. Any dynamic form of dark energy requires a time varying value of ω(a). In order to account for a dynamic dark energy most experimental measurements of dark energy have adopted the common CPL [54] parameters, ω0 and ωa , where ω(a)= ω0 + (1-a) ωa . The most recent DES and DESI dark energy results show ω0 > -1 and ωa < 0, significantly different from a cosmological constant ( ω0 = -1, ωa =0 ). It is therefore convenient to initially predict the IDE source of dark energy also in terms of CPL parameters.
2.3. Predicted IDE in ω0 – ωa Space
The SMD is a universe-wide average mass density that changed with time and is thus a function of universe scale size: SMD(a). Then we expect that IDE(a), being proportional to temperature, to vary as IDE(a) ∝ SMD(a)p. At the same time each CPL combination of ω0 - ωa values defines a curve of dark energy density as a function of scale size, IDE(a) α a-3(1 + ω(a)) . Then, assuming an IDE source of dark energy, the p value transfers the ω(a) curve of each ω0--ωa combination to a SMD(a) curve whose measure of fit to the measured SMD(a) values [24,25,26,27,28,29,30,31,32,33,34,35,36,37,38,39,40,41,42,43,44,45,46,47,48,49,50,51,52,53] is given by a R2 coefficient of determination. The coefficient R2 is defined as R2=1-(RSS/TSS), where RSS is the residual sum of squares, and TSS is the total sum of squares.
There are four DESI and DES dark energy derived ω0 - ωa combinations listed in Table 1. DESI combines Baryon Acoustic Oscillation, BAO, and Cosmic Microwave Background, CMB, measurements with three different sets of supernova measurements, Union3, DESY5, and Pantheon plus, to provide three ω0 -ωa values [21]. The most constrained DES ω0 -ωa value is listed for a combination of BAO, Supernovae, SN, and CMB, measurements [22].
In Figure 3. the value of R2 is plotted as a function of p for each of the four experimentally derived DESI and DES ω0 - ωa values. The grey line is the average R2 of the four values. Shown below are the values of p determined from the temperatures and masses of galaxies and clusters using X-ray and lensing measurements [23]. Figure 3. enabled us to select two data driven values of p to better illustrate the similarity of dark energy history to star formation history. The value p=0.606 was determined solely by the overall p value of actual mass and temperature measurements of galaxy and clusters (Figure 2 ) [23]. The value p=0.461 is determined from the maximum R2 of the average of all four DES and DESI measurements, assuming IDE (Figure 3). In Figure 3 the value p=0.606 coincides with the maximum of the single DES measurement, and the value p=0.461 coincides with the maximum of the DESI BAO+CMB+Union3 measurement.
For all combinations of ω0 and ωa values in steps of 0.01, over the wide range +0.9 to -3.0, we found the best fit to SMD(a) measurements (maximum R2 ) listed in Table 1 for the two chosen values of p. Both of these ω0 - ωa combinations lie well within the range determined by DESI and DES. These maximum R2, best fit values are listed in Table 2, together with the R2 values for the four DES & DESI ω0 - ωa values. The DES R2 values at p=0.606 and the DESI/Union3 at p=0.461 are high at 0.947, close to the maximum of 0.953 over all ω0 - ωa space for fits to this survey of SMD(a) measurements.
In Figure 4 we illustrate the clear similarity between star/structure formation and dark energy histories. For each of the two selected values of p we provide 2 plots. The right-hand plot shows the four DESI and DES 68% and 95% likelihood plots as a function of ω0 and ωa . Superimposed are the >0.90 and >0.94 R2 contours of IDE over all ω0–ωa space derived solely from the survey of measured SMD(a). The location of centre points of DESI and DES plots (listed in Table 1) are highlighted by small coloured circles together with the point of maximum R2 of the IDE plot. The left-hand plots illustrate how well the curves corresponding to those highlighted ω0 - ωa values fit the SMD measurements.
Figure 4 (Left-hand plots) and the R2 values in Table 2 show that the DES most constrained result and the DESI BAO+CMB+Union 3 result both make a good fit to the SMD(a) measurement survey with curves closely following the highest R2 red curve. Moreover, the range in ω0 – ωa space that fits SMD(a) measurements with R2 >0.94 makes a good fit to the DESI and DES dark energy measurements (Figure 4. Right-hand plots). This suggests that the dark energy history is directly related to the history of astrophysical structure temperature and formation, as we expect for an IDE source. Figure 5 provides an interpretation of predicted IDE in terms of the DES & DESI measurements based on a plot used previously [55] to interpret DESI results.
Both the IDE prediction and DESI/DES measurements are consistent with a dark energy that was phantom (increasing energy density) throughout the majority of universe history. Using CPL, it appears that both IDE predicted and DESI/DES measured energy densities are now starting to decrease after recently reaching a maximum. The DESI/DES measurements are both consistent with a maximum located in the range 0.2 < z < 0.6. Figure 4 (right-hand side) illustrates a difference of the predicted IDE contours in ω0 - ωa space between the two selected values of p. Figure 5 (thick black line) further illustrates this by showing how the maximum R2 point moves over a wider range of p values. The predicted maximum IDE energy density remains around z~0.2 over this wide range of p values, close to the time of the DES/DESI measured maximum dark energy density. The application of CPL parameters has shown that IDE has a history that closely matches the dark energy history determined by the DES and DESI instrument consortia.
2.4. A Different IDE History When Independent of CPL Parameter Limitations
While the use of CPL parameters has facilitated comparisons between different experiments, and between experiments and theory, there is no reason to expect that the actual dark energy can be fully described over a wide redshift range by any particular CPL ω0 - ωa combination. After a search over a range of ω0 - ωa values the red curve in Figure 4. (left-hand side plots) makes the overall best CPL fit (after the T α SMDp transformation) to the SMD(a) data. The majority of SMD(a) data are located at redshifts z>0.2, beyond the maximum, but much closer to z=0 the red curves for both values of p clearly lie below SMD data points.
In contrast, the polynomial curve fit to SMD(a) (grey curve) fits data across a wider range of redshifts. That fit just shows the rate of star formation reducing as z→ 0, but arriving at z=0 just before reaching a constant level of stellar mass density, i.e. without exhibiting a maximum. Other surveys of SMD measurements [56,57,58] are all consistent with the grey line polynomial fit to the SMD data in Figure 4, and similarly the highest SMD value to date also occurs at z=0. The polynomial fit to all SMD data points, grey curves in Figure 4, is given by Eq(1):
where SMD is in units of M⊙ Mpc-3, and b = log10 ( universe scale size, a ).
log10 (SMD(a)) = 0.19556 b3 - 2.5267 b2 + 0.21949 b + 8.6446
Here we apply the value p=0.606 from the direct measurements of galaxy, and galaxy cluster temperatures and masses [23] in order to avoid any dependence on CPL. Then as IDE(a) α SMD(a)0.606 and IDE(a) α a-3(1 + ω(a)), the IDE equation of state parameter is described in terms of redshift, z, by Eq (2), (continuous black curves in Figure 6A & B):
ωide(z) = - 0.002703 z3 + 0.04409 z2 - 0.3194 z - 1.074
Figure 6A shows the polynomial fit to SMD(a) provides an IDE that exhibits a primarily phantom behaviour, ω< -1, with values of ωide similar to both the DESI/DES measured CPL, and IDE predicted CPL values over a wide range of redshifts, z≳0.5. However, at lower redshifts, z≲0.5, the polynomial fitting derived IDE differs significantly by tending towards a constant dark energy density (ωide= -1.07 at z=0) and has not yet reached a period of decreasing energy density. This clearly contrasts with the CPL parameters describing DESI/DES results and the CPL description of SMD data in Figure 6A which all cross the ω=-1 (maximum dark energy), changing from increasing (ω<-1) to decreasing (ω>-1) energy density while z>0.
This difference between polynomial and CPL fitting is primarily due to CPL only being able to provide a limited set of ω(a) curves. It is therefore possible that this effective bias of CPL has lead to a false impression, not just with IDE but perhaps also with the dark energy measurements. In order to illustrate this aspect of CPL we checked to see how CPL parameters would describe the ωide(z) curve of equation 2 by taking 280 values of ωide(z) distributed evenly in the range z=0 to z=7. This set of values was tested against all ω0 and ωa combinations, each in the range +1 to -3. The R2>0.80 and R2>0.85 contours are shown in Figure 5 by the dashed and continuous black lines respectively. The maximum of R2=0.86 occurred at ω0=-0.77, ωa =-1.33. Not surprisingly, these values from CPL fit to the polynomial are similar to the best CPL, ω0=-0.76, ωa =-1.29, when fitting CPL directly to the SMD data in Figure 4 (fitting to SMD0.606). The ω(z) curve corresponding to the maximum ω0 – ωa combination (black dashed line in Figure 6B) closely follows the other CPL derived histories in exhibiting a recent maximum dark energy density while equation 2 without parameterisation clearly has yet to reach a maximum (black continuous line in Figure 6A & 6B). This clear difference illustrates the limits of using CPL parameters.
The use of CPL parameters has lead to interpreting DES and DESI data as exhibiting a maximum dark energy density, 0.2<z<0.6. Further work has shown [59] a correction to supernova data due to progenitor age bias may be required (dashed coloured lines in Figure 6A) that would even further emphasize the present deceleration period, but again derived through the use of CPL.
The ωide(z) of equation 2 is derived directly from the stellar mass density measurements assuming p=0.606. This value of p is the overall value found in the review [23] of observed halo mass-temperature relations for galaxies, groups, and clusters, and differs from the theoretical expected value of p=2/3. The effect of changing p to 0.5 and 0.7 is illustrated in Figure 6B, showing that the precise value of p is not too critical. The ωide(z=0) values are similar at -1.061, -1.074 and -1.086, for p=5, 6.06, and 7 respectively. The main differences occur at higher z values where the weaker effects of dark energy are less significant in the presence of the much higher matter energy densities at that time. The ωide(z) behaviour of IDE is similar to the dark energy freezing/thawing models [60,61] that describe the dark energy equation of state parameter in terms of generally moving either towards or away from ω=-1, rather than crossing ω=-1.
2.5. Information Dark Energy Is Falsifiable
As the IDE proposed explanation of dark energy differs significantly from the usual sources considered (see, for example, review [62]), it is important to identify a dark energy characteristic predicted by IDE that will be significantly different to the present consensus. A future measurement of such a feature then enables IDE to be falsified. The polynomial curve fit to all SMD(a) measurements is more consistent with the actual maximum IDE energy density occurring in the near future. This prediction that dark energy density has not yet passed a maximum provides a means by which IDE can be falsified when a detailed measurement of dark energy ωide(z) is eventually obtained, independent of the above CPL parameter limitations.
3. Discussion
The expanding universe has lead to overall matter and radiation energy densities naturally falling as a-3 and a-4 respectively. In contrast, both the stellar mass density and the dark energy density have increased over time, in a way that is consistent with a dark energy source directly related to star and structure formation. Within the uncertainties of entropy estimates (Figure 1), IDE could be strong enough to account for the present dark energy density. Future dark energy experiments should be able to compare measured ω(z) values directly against the ωide(z) of equation 2, without applying any parameterisation.
While IDE fits a CPL description over redshifts, z>0.2, Figure 4 & 6 show that the predicted behaviour of IDE over all redshifts, including z<0.2, is better described by a polynomial curve fit. The different behaviour of IDE at low redshifts, yet to cross ω=-1, provides a clear prediction that allows IDE to be falsified. The significant difference between the ωide(z) of equation 2 and the ω(z) from the CPL parameterisation of equation 2 (continuous and dashed black lines in Figure 6B, respectively) illustrates the limitation of CPL parameterisation. Then it is possible that the existing interpretation of DESI/DES data as providing evidence for a recent dark energy maximum may also be purely the direct result of CPL bias. The actual dark energy equation of state parameter could follow a redshift dependence closer to equation 2, regardless of the source of dark energy.
The dark energy epoch of accelerating expansion is considered [63,64] responsible for the observed reduction in star and structure formation rate, clearly evident in the SMD(a) data in Figure 4. If IDE, driven by star formation, is the main source of dark energy it appears to have fed back via accelerating expansion and has begun to effectively limit itself. Star formation is thought to be already within 5% of the maximum possible [65]. After maximum star formation IDE energy density will fall, with deceleration and eventually contraction leading to either a “big crunch” end to the universe, or a continuously cyclic “bouncing universe” [66].
The potential of IDE to solve several problems of cosmology has been covered before [17], and nine aspects are listed briefly again here for completeness, and summarised in Table 3, for comparison against other proposed dark side explanations:
- In Figure 1 information/entropy estimates show that IDE might account for the value of the present dark energy density.
- The most likely time for intelligent beings to have evolved is around maximum star formation and thus maximum IDE source of dark energy. An IDE source of dark energy naturally resolves the “Why now?” Cosmological Coincidence problem.
- The primarily phantom time history of IDE is similar to several dark energy histories [68,69,70] that have been shown capable of resolving both H0 and σ8 tensions. Over a range of redshifts, 1<z<5, predicted IDE ω values, -1.3>ω>-1.9, in Figure 6, centre around ω~-1.6, a condition that can account for the H0 tension [71] .
- The latest dark matter search has still not registered a single confirmed dark matter particle detection[72]. As the information energy of matter is clumped in astrophysical structures at a similar energy density to matter, IDE may account for some dark matter attributed effects. General relativity shows that space-time will be equally distorted by mass and an equivalent energy. This equivalence has also been stated specifically as a ‘mass-energy-information equivalence principle’ [73].
- Early emerging massive galaxies and clusters of galaxies require a non-linear accelerating structure formation. This would be expected from increasing local IDE matter effects but not with the linear hierarchical structure formation of ɅCDM [76].
- Equation 2. and Figure 6B predict a difference by which IDE can be falsified.
4. Summary
This work emphasizes simplicity, wielding Occam’s razor, and naturalness, relying on mostly proven physics. The approach has been primarily driven by data and indicates a strong connection between stellar mass density and dark energy histories. We have shown that IDE predicts a dark energy history that matches the dark energy measurements of DESI and DES with a clear overlap in ω0 – ωa space. But the use of CPL parameters, with the associated limited range of ω(a) functions fails to model IDE accurately at low reshifts (z<0.2). The predicted different behaviour of IDE at those low redshifts, yet to reach a maximum dark energy density, provides a means of falsification. IDE has the potential ability to resolve many dark side problems and tensions.
Funding
This research received no external funding.
Institutional Review Board Statement
Not applicable.
Data Availability Statement
No new experimental data was generated in this
work. All experimental data used is available in a publicly accessible repository.
Acknowledgments
This work was enabled by the award of Emeritus Professor of Space Science from the University of Sussex.
Conflicts of Interest
The author declares no conflicts of interest.
References
- Wheeler, J.A.; Ford, K. It from bit in Geons, Black Holes and quantum foam: A life in Physics; Norton: New York; ISBN -13: 978-0393046427.
- Landauer, R. Irreversibility and heat generation in the computing process. IBM J. Research and Development 1961, 3, 183–191. [Google Scholar] [CrossRef]
- Landauer, R. Information is physical. Physics Today 1991, 44, 23–29. [Google Scholar] [CrossRef]
- Toyabe, S.; Sagawa, T.; Ueda, M.; Muneyuki, E.; Sano, M. Experimental demonstration of information-to-energy conversion and validation of the generalized Jarzynski equality. Nature Physics 2010, 6, 988–992. [Google Scholar] [CrossRef]
- Berut, A.; Arakelyan, A.; Petrosyan, A.; Ciliberto, A.; Dillenschneider, R.; Lutz, E. Experimental verification of Landauer's principle linking information and thermodynamics. Nature 2012, 483, 187–189. [Google Scholar] [CrossRef]
- Jun, Y.; Gavrilov, M.; Bechhoefer, J. High-PrecisionTest of Landauer's Principle in a Feedback Trap. Phys.Rev. Let. 2014, 113, 190601-1 to -5. [Google Scholar] [CrossRef]
- Yan, L.I.; et al. Single Atom Demonstration of the Quantum Landauer Principle. Phys.Rev. Let. 2018, 120, 210601. [Google Scholar] [CrossRef]
- Leff, H.S.; Rex, A.F. Maxwell’s Demon 2; Institute of Physics Publishing, 1990; ISBN 0-7503-0759-5. [Google Scholar]
- Zeilinger, A. A Foundational Principle of Quantum Mechanics. Foundations of Physics 1999, 29, 631–643. [Google Scholar] [CrossRef]
- Gough, M.P.; Carozzi, T.; Buckley, A.M. On the similarity of Information Energy to Dark Energy. Physics Essays 2006, 19, 446–450, arXiv: astro-ph/0603084. [Google Scholar] [CrossRef]
- Peebles, P.J.E. Principles of Physical Cosmology; Princeton University Press: Princeton NJ, USA, 1993; ISBN 978-0691209814. [Google Scholar]
- Gough, M.P. Information Equation of State. Entropy 2008, 10, 150–159. [Google Scholar] [CrossRef]
- Gough, M.P. Holographic Dark Information Energy. Entropy 2011, 13, 924–035. [Google Scholar] [CrossRef]
- Gough, M.P. Holographic Dark Information Energy: Predicted Dark Energy Measurement. Entropy 2013, 15, 1133–1149. [Google Scholar] [CrossRef]
- Gough, M.P. A Dynamic Dark Information Energy Consistent with Planck Data. Entropy 2014, 16, 1902–1916. [Google Scholar] [CrossRef]
- Gough, M.P. Information Dark Energy can Resolve the Hubble Tension and is Falsifiable by Experiment. Entropy 2022, 24, 385–399. [Google Scholar] [CrossRef]
- Gough, M.P. Evidence for a dark energy driven by star formation: Information Dark Energy. Entropy 2025, 27, 110. [Google Scholar] [CrossRef]
- Frampton, P.H.; Hsu, S.D.H.; Kephart, T.W.; Reeb, D. What is the entropy of the universe? Classical Quantum Gravity 2009, 26, 145005. 7pp. [Google Scholar] [CrossRef]
- Egan, C.A.; Lineweaver, C.H. A larger estimate of the entropy of the universe. Astrophys. J. 2010, 710, 1825–1834. [Google Scholar] [CrossRef]
- Basu, B.; Lynden-Bell, D. A survey of entropy in the universe. Q. Jl., R. Astr. Soc. 1990, 31, 359–369. [Google Scholar]
- 21. DESI Collaboration, DESI 2024 VI: cosmological constraints from the measurements of baryon acoustic oscillations. Journal of Cosmology and Astroparticle Physics 2025. [CrossRef]
- DES CollaboArration, Dark Energy Survey: implications for cosmological expansion models from the final DES Baryon Acoustic Oscillation and Supernova data, arXiv: 2503.06712v1, 9th March, 2025. [CrossRef]
- Babyk, I.V.; McNamara, B.R. The Halo Mass-Temperature Relation for Clusters, Groups, and Galaxies. Astrophysical Journal 2023, 946, 54. [Google Scholar] [CrossRef]
- Li, C.; White, S.D.M. The distribution of stellar mass in the low-redshift universe. Mon. Not. R. Astron. Soc. 2009, 398, 2177–2187. [Google Scholar] [CrossRef]
- Gallazzi, A.; Brinchmann, J.; Charlot, S.; White, S.D.M. A census of metals and baryons in stars in the local universe. Mon. Not. R. Astron. Soc. 2008, 383, 1439–1458. [Google Scholar] [CrossRef]
- Moustakas, J. PRIMUS: constraints on star formation quenching and Galaxy merging and the evolution of the stellar mass function from z=0-1. Astrophys. J. 2013, 767, 50. [Google Scholar] [CrossRef]
- Bielby, R. The WIRCam Deep Survey. I. Counts, colours, and mass functions derived from near-infrared imaging in the CFHTLS deep fields. Astron. Astrophys. 2012, 545, A23. [Google Scholar] [CrossRef]
- Perez-Gonzalez, P.G. The stellar mass assembly of galaxies from z=0-4: analysis of a sample selected in the rest-frame near infrared with Spitzer. Astrophys. J. 2008, 675, 234–261. [Google Scholar] [CrossRef]
- Ilbert, O. Mass assembly in quiescent and star-forming Galaxies since z >4 from UltraVISTA. Astron.Astrophys 2013, 556, A55. [Google Scholar] [CrossRef]
- Muzzin, A.; et al. The evolution of the stellar mass functions of star-forming and quiescent galaxies to z=4 from the COSMOS/UltraVISTA survey. Astrophys. J. 2013, 777, 18. [Google Scholar] [CrossRef]
- Arnouts, S.; et al. The SWIRE-VVDS-CFHTLS surveys: Stellar Assembly over the last 10Gyr Astron. Astrophys. 2007, 476, 137–150. [Google Scholar] [CrossRef]
- Pozzetti, L. zCOSMOS -10k bright spectroscopic sample. The bimodality in the galaxy stellar mass function. Astron. Astrophys. 2010, 523, A13. 23pp. [Google Scholar] [CrossRef]
- Kajisawa, M.; et al. MOIRCS deep survey IV evolution of galaxy stellar mass function back to z 3. Astrophys. J. 2009, 702, 1393–1412. [Google Scholar] [CrossRef]
- Marchesini, D.; van Dokkum, P.G.; Forster Schreiber, N.M.; Franx, M.; Labbe, I.; Wuyts, S. The evolution of the stellar mass function of galaxies from z=4 and the first comprehensive analysis of its uncertainties. Astrophys. J. 2009, 701, 1765–1769. [Google Scholar] [CrossRef]
- Reddy, N.A.; et al. GOODS-HERSCHEL measurements of the dust attenuation of typical star forming galaxies at high redshift. Astrophys. J. 2012, 744, 154. 17pp. [Google Scholar] [CrossRef]
- Caputi, K.J.; Cirasuolo, M.; Jdunlop, J.S.; McLure, R.J.; Farrah, D.; Almaini, O. The stellar mass function of the most massive Galaxies at 3>z>5 in the UKIDSS Ultra Deep Survey. Mon. Not. R. Astron. Soc. 2011, 413, 162–176. [Google Scholar] [CrossRef]
- Gonzalez, V.; Labbe, I.; Bouwens, R.J.; Illingworth, G.; Frank, M.; Kriek, M. Evolution of galaxy stellar mass functions, mass densities, and mass-to light ratios from z 7 to z 4. Astrophys. J. 2011, 735, L34. [Google Scholar] [CrossRef]
- Lee, K.S.; et al. How do star-forming galaxies at. Astrophys. J. 2012, 752(66), 21pp. [Google Scholar] [CrossRef]
- Cole, S. The 2dF galaxy redshift survey. Mon. Not. R. Astron. Soc. 2001, 326, 255–273. [Google Scholar] [CrossRef]
- Dickinson, M.; Papovich, C.; Ferguson, H.C.; Budavari, T. The evolution of the global stellar mass density a 0 <z <3. Astrophys. J. 2003, 587, 25–40. [Google Scholar] [CrossRef]
- Rudnick, G. The rest-frame optical luminosity density, colour, and stellar mass density of the universe from z = 0 to z = 3. Astrophys. J. 2003, 599, 847–864. [Google Scholar] [CrossRef]
- Brinchmann, J.; Ellis, R.S. The ma.ss assembly and star formation characteristics of field galaxies of known morphology. Astrophys. J. 2000, 536, L77–L80. [Google Scholar] [CrossRef] [PubMed]
- Elsner, F.; Feulner, G.; Hopp, U. The impact of Spitzer infrared data on stellar mass estimates. Astron. Astrophys. 2008, 477, 503–512. [Google Scholar] [CrossRef]
- Drory, N.; Salvato, M.; Gabasch, A.; Bender, R.; Hopp, U.; Feuler, G.; Pannella, M. The stellar mass function of galxies to z 5. Astrophys. J. 2005, 619, L131–L134. [Google Scholar] [CrossRef]
- Drory, N.; Alvarez, M. The contribution of star formation and merging to stellar mass buildup in galaxies. Astrophys.J 2008, 680, 41–53. [Google Scholar] [CrossRef]
- Fontana, A. The assembly of massive galaxies from near Infrared observations of Hubble deep-field south. Astrophys. J. 2003, 594, L9–L12. [Google Scholar] [CrossRef]
- Fontana, A.; et al. The galaxy mass function up to z=4 in the GOODS-MUSIC sample. Astron. Astrophys. 2006, 459, 745–757. [Google Scholar] [CrossRef]
- Cohen, J.G. CALTECH faint galaxy redshift survey. Astrophys. J. 2002, 567, 672–701. [Google Scholar] [CrossRef]
- Conselice, C.J.; Blackburne, J.A.; Papovich, C. The luminosity, stellar mass, and number density evolution of field galaxies. Astrophys. J. 2005, 620, 564–583. [Google Scholar] [CrossRef]
- Borch, A.; et al. The stellar masses of 25000 galaxies at 0.2. Astron. Astrophys. 2006, 453, 869–881. [Google Scholar] [CrossRef]
- Madau, P.; Dickinson, M. Cosmic Star Formation History. Ann. Rev. Astron. Astrophys. 2014, 52, 415–486. [Google Scholar] [CrossRef]
- Yabe, K.; Ohta, K.; Iwata, I.; Sawicki, M.; Tamura, N.; Akiyama, M.; Aoki, K. The stellar populations of Lyman break galaxies at z~5. Astrophys. J. 2009, 693, 507. [Google Scholar] [CrossRef]
- Labbe, I.; Oesch, P.A.; Bouwens, R.J.; Illingworth, G.D.; Magee, D.; Gonzalez, V.; Carollo, C.M.; Franx, M.; Trenti, M.; van Dokkkum, P.G.; et al. The spectral energy distributions of z = 8 galaxies from the IRAC ultra deep fields. Astrophys. J. 2013, 777, L19. [Google Scholar] [CrossRef]
- Chevallier, M.; Polarski, D. Accelerating universes with scaling dark matter. Int. J. Mod. Phys. 2001, D. 10, 213–224. [Google Scholar] [CrossRef]
- Cortes, M.; Liddle, A.R. Interpreting DESI’s evidence for evolving dark energy. JCAP 2024, 12, 007. [Google Scholar] [CrossRef]
- Wilkins, S. M.; Trentham, N.; Hopkins, A. M. The evolution of stellar mass and the implied star formation history. MNRAS 2008, 385, 687. [Google Scholar] [CrossRef]
- Driver, S.P.; et al. GAMA/G10-COSMOS/3D-HST: the 0 <z <5 cosmic star formation history, stellar-mass, and dust-mass densities. MNRAS 2018, 475, 2891 (D18. [Google Scholar] [CrossRef]
- Koushan, S.; Driver, S.P.; et al. GAMA/DEVILS: constraining the cosmic star formation history from improved measurements of the 0.3–2.2 μ m extragalactic background light. MNRAS 2021, 503, 2033–2052. [Google Scholar] [CrossRef]
- Son, J. Strong progenitor age bias in supernova cosmology- II Alignment with DESI Bao and signs of a non-accelerating universe. MNRAS 2025, 544(1), 975–987. [Google Scholar] [CrossRef]
- Dinda, B.R.; Maartens, R. Physicsl versus phantom energy after DESI: thawing quintessence in a curved background. MNRAS 2025, 542, L31–L35. [Google Scholar] [CrossRef]
- Huterer, D; Peiris, H.V. Dynamical behaviour of generic quintessence potentials: Constraints on key dark energy observable. Phys.Rev.D 2007, 75, 083503. [Google Scholar] [CrossRef]
- Wu, Peng-ju. Comparison of dark energy models using late-universe observations. Phys Rev. D 2025, 112, 043527. [Google Scholar] [CrossRef]
- Guzzo, L.; Pierleoni, M.; Meneux, B.; Branchini, E.; LeFevre, O.; Marinoni, C.; Garilli, B.; Blaizot, J.; DeLucia, G.; Pollo, A.; et al. A test of the nature of cosmic acceleration using galaxy redshift distortions. Nature 2008, 451, 541. [Google Scholar] [CrossRef]
- Frieman, J.A.; Turner, M.S.; Huterer, D. Dark energy and the accelerating universe. Ann. Rev. Astron. Astrophys. 2008, 46, 385. [Google Scholar] [CrossRef]
- Sobral, D.; Small, I.; Best, P.N.; Geach, J.E.; Yuichi, M.; Stott, J.P.; Cirasuolo, M.; Jaron, K. A large Hα survey at z = 2.23, 1.47, 0.84 and 0.40: The 11 Gyr evolution of star-forming galaxies from HiZELS. Mon. Not. R. Astron. Soc. 2013, 428, 1128. [Google Scholar] [CrossRef]
- Steinhardt, P.J; Turok, N. A Cyclic Model of the Universe. Science 2002, 296/5572, 1436. [Google Scholar] [CrossRef]
- Weinberg, S. The cosmological constant problem. Rev. Mod. Phys. 1989, 61, 1–23. [Google Scholar] [CrossRef]
- Benevento, G.; Hu, W.; Raven, M. Can late dark energy raise the Hubble constant? Phys. Rev. D 2020, 101, 103517-1-7. [Google Scholar] [CrossRef]
- Keeley, R.; Joudaki, S.; Kaplinghat, M.; Kirkby, D. Implications of a transition in the dark energy equation of state for the H0 and σ8 tensions. J. Cosmol. Astropart. Phys. 2019, 12, 035. [Google Scholar] [CrossRef]
- Peracaula, J.S.; Gomez-Valent, A.; De Cruz Perez, J.; Moreno-Pulido, C. Running vacuum against the H0 and σ8 tensions. Exploring the Frontiers of Physics 2021, 134, 19001. p1–p7. [Google Scholar] [CrossRef]
- Di Valentino, E; et al. In the realm of the Hubble tension- a Review of Solutions. Class. Quant. Grav. 2021, 38, 153001. [Google Scholar] [CrossRef]
- Albers, J.; et al. Dark Matter search results from the 4.2 Tonne-years of the LUX-Zeplin (LZ) experiment. Phys. Rev.,Lett 2025, 135, 011802. [Google Scholar] [CrossRef]
- Vopson, M.M. The mass-energy-information equivalence principle. AIP Advances 2019, 9, 095206. [Google Scholar] [CrossRef]
- McGaugh, S.S.; Lelli, F.; Schombert, J.M. The Radial Acceleration Relation in Rotationally Supported Galaxies. Phys. Rev. Lett. 2016, 117, 201101-1 to -6. [Google Scholar] [CrossRef] [PubMed]
- Lelli, F.; McGaugh, S.S.; Schombert, J.M.; Pawlowski, M.S. One Law to Rule them all: the Radial Acceleration relation of Galaxies. Astrophys. J. 2017, 836, 152. 23pp. [Google Scholar] [CrossRef]
- McGaugh, S.S.; et al. Accelerated Structure Formation: The Early Emergence of Massive Galaxies and Clusters of Galaxies. The Astrophysical Journal 2024, 976, 13. [Google Scholar] [CrossRef]
Figure 1.
Universe sources of information energy with NT products compared against values that provide a Landauer energy equivalent to the universe total baryon mc2. (adapted from Fig 7 of [17]).
Figure 1.
Universe sources of information energy with NT products compared against values that provide a Landauer energy equivalent to the universe total baryon mc2. (adapted from Fig 7 of [17]).
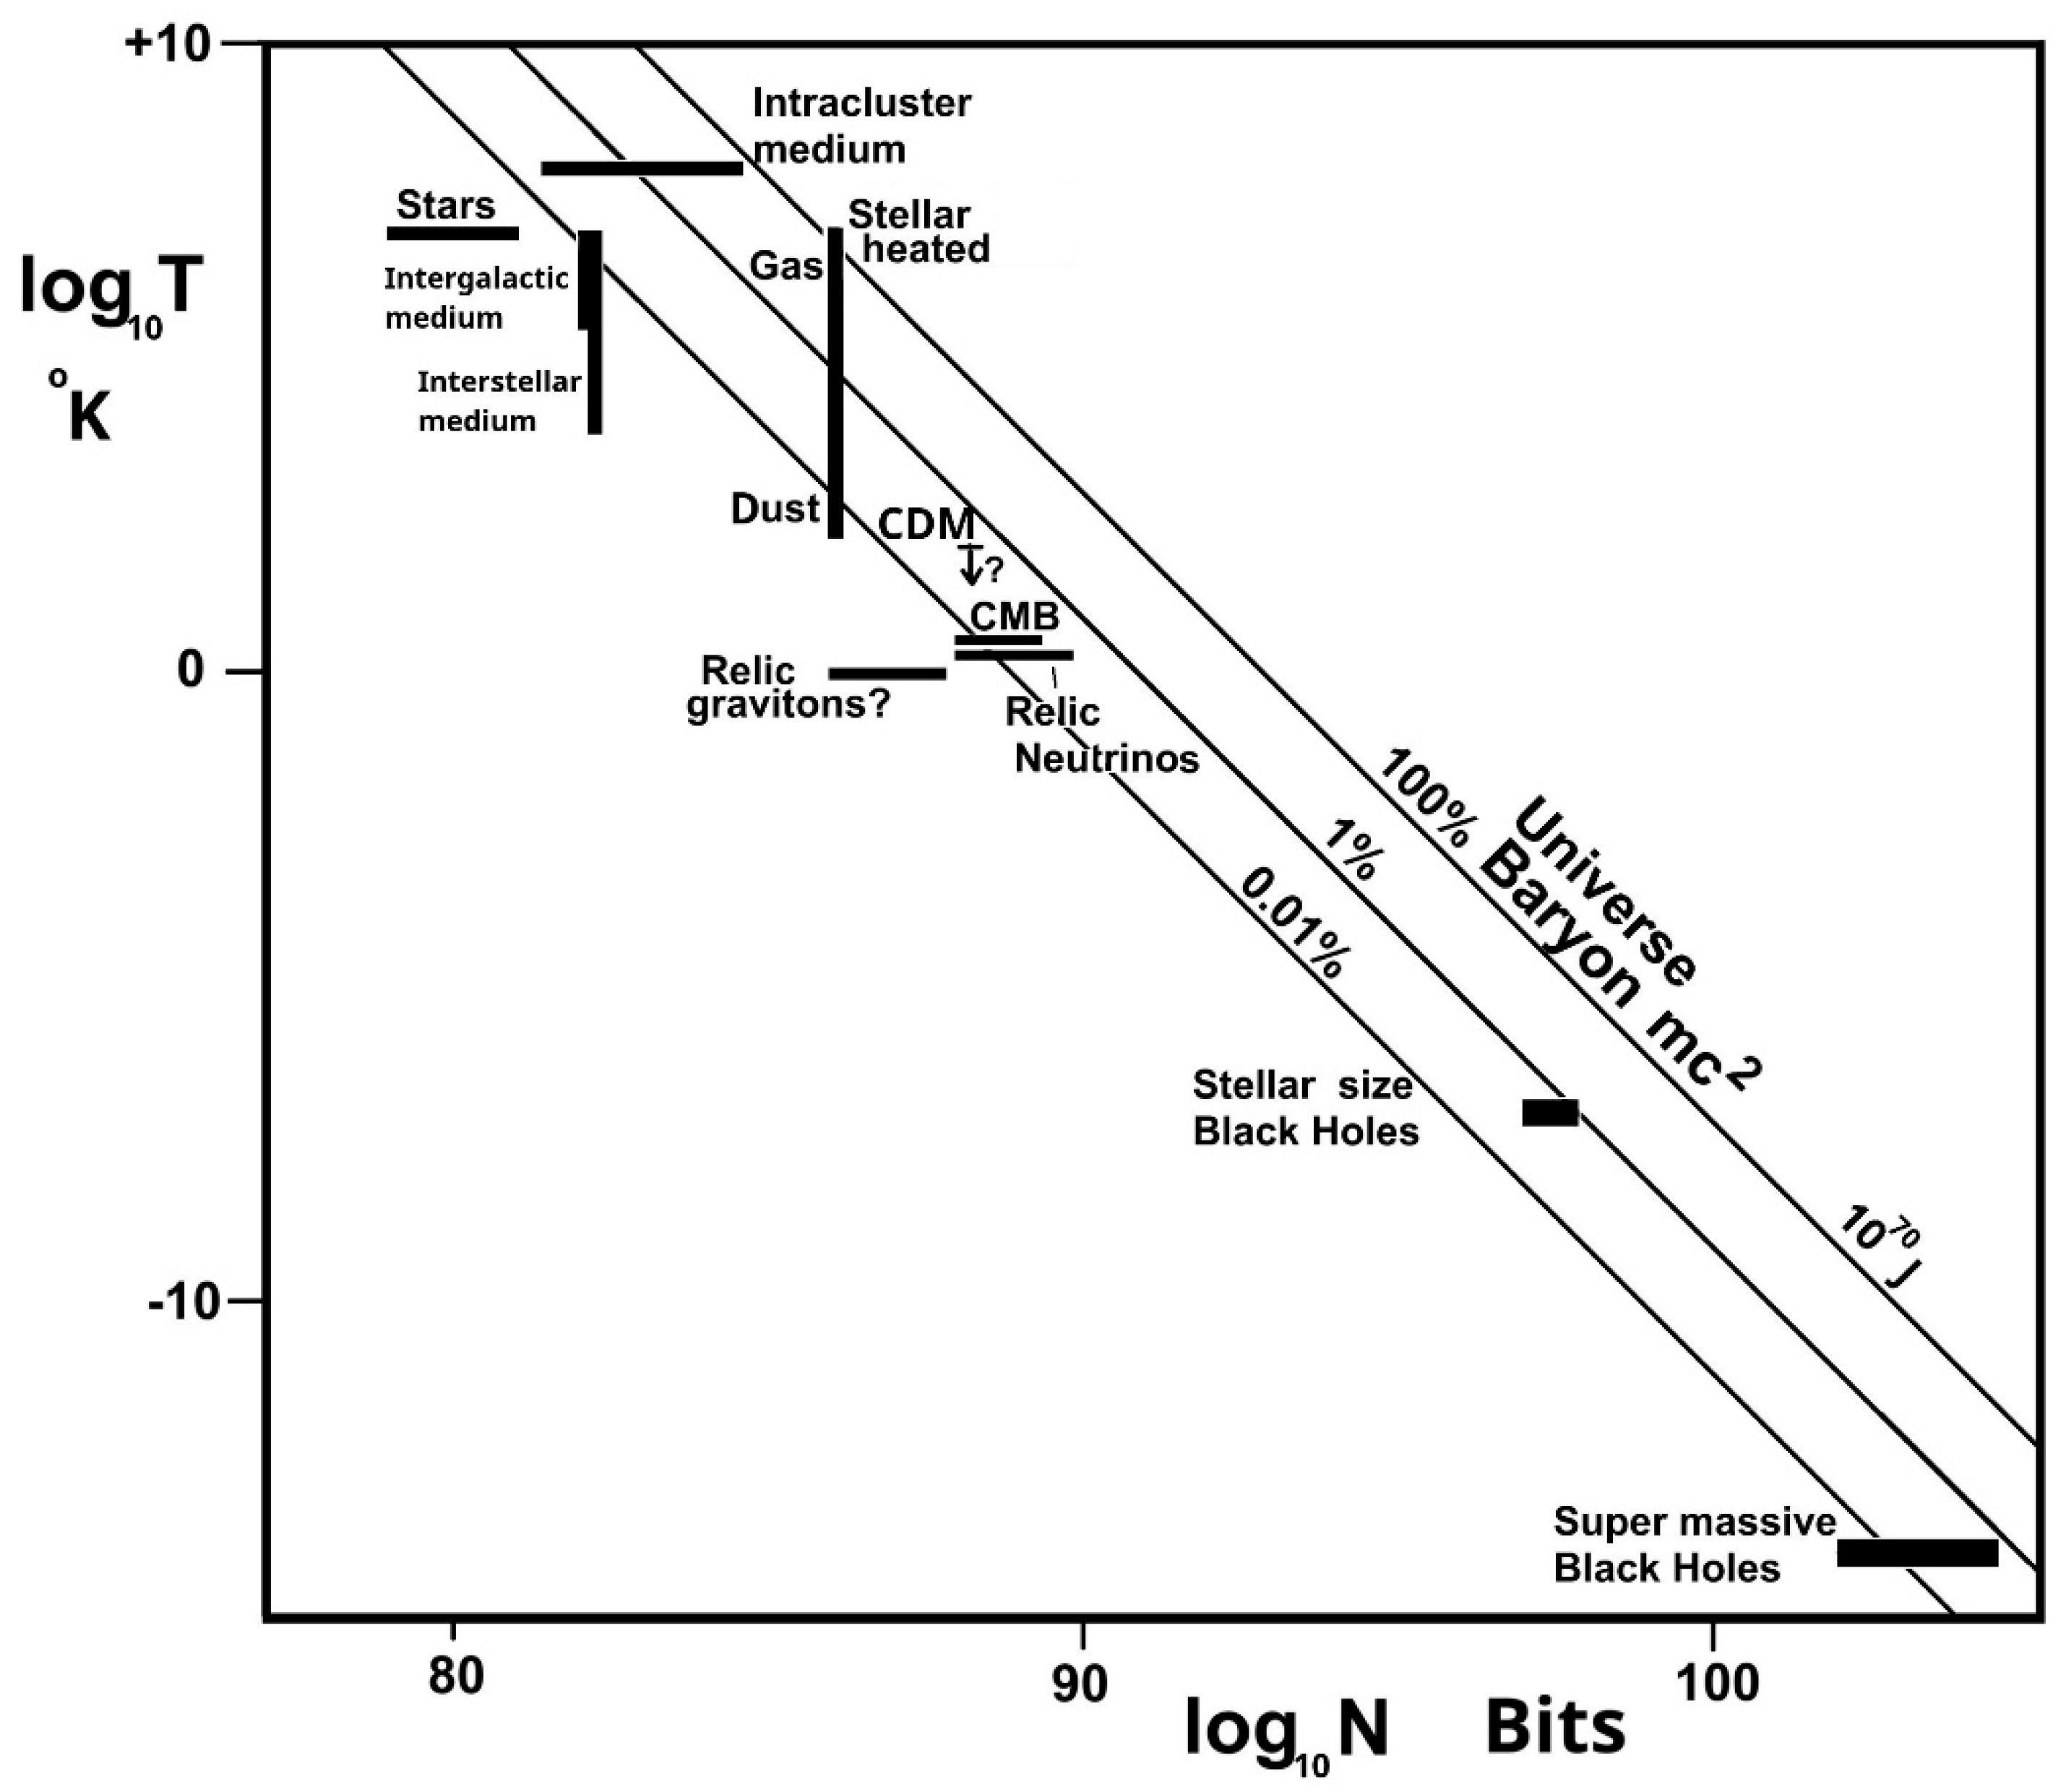
Figure 2.
The red lines correspond to temperature proportional to (mass)0.606 in all three plots: A & B, Galaxies, galaxy groups & galaxy clusters with mass integrated over two different source radii, adapted from Figures 2 and 4 of a review of temperature-mass measurements [23]; C Main sequence star spectral classes.
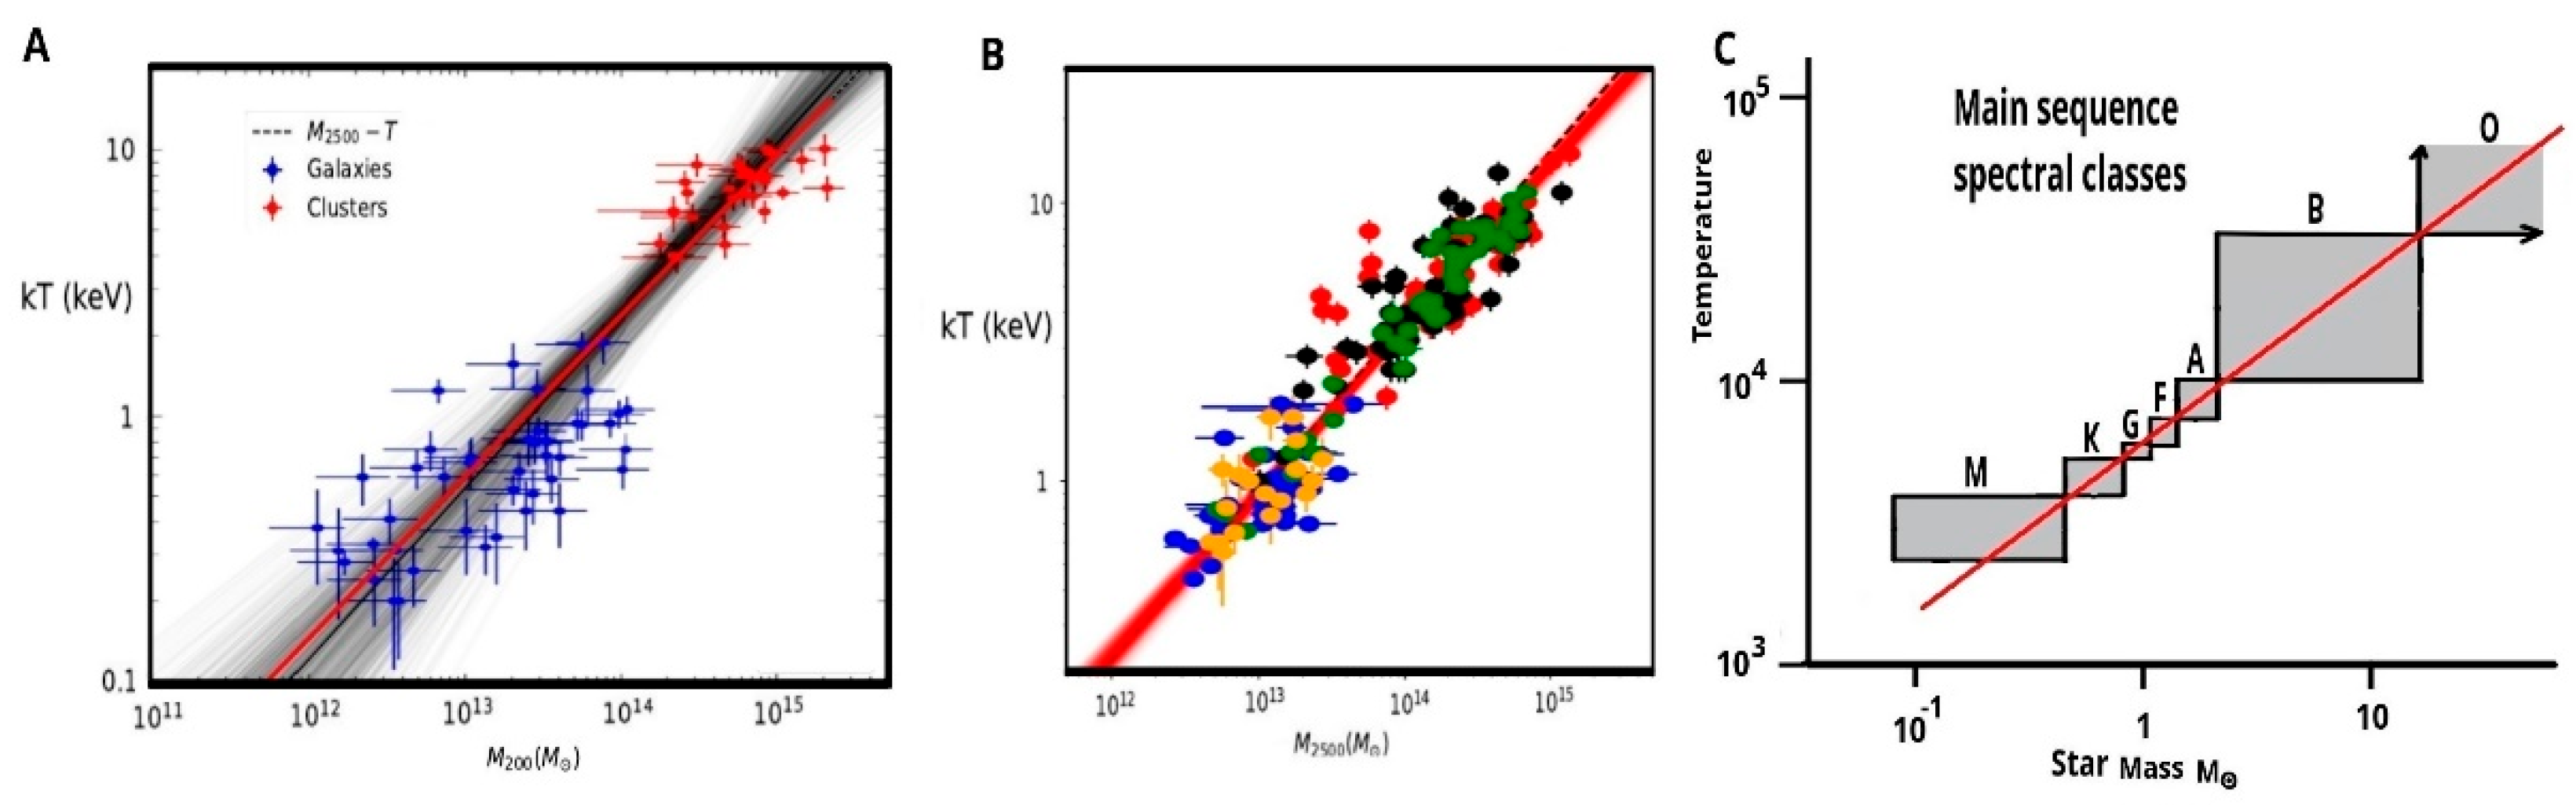
Figure 3.
Plot of the variation of the R2 coefficient of determination against p for each of the three DESI and one DES ω0 -ωa CPL values listed in Table 1. The grey curve is the average of all four. The measured p values for galaxies, groups and galaxy clusters shown below is taken from [23].
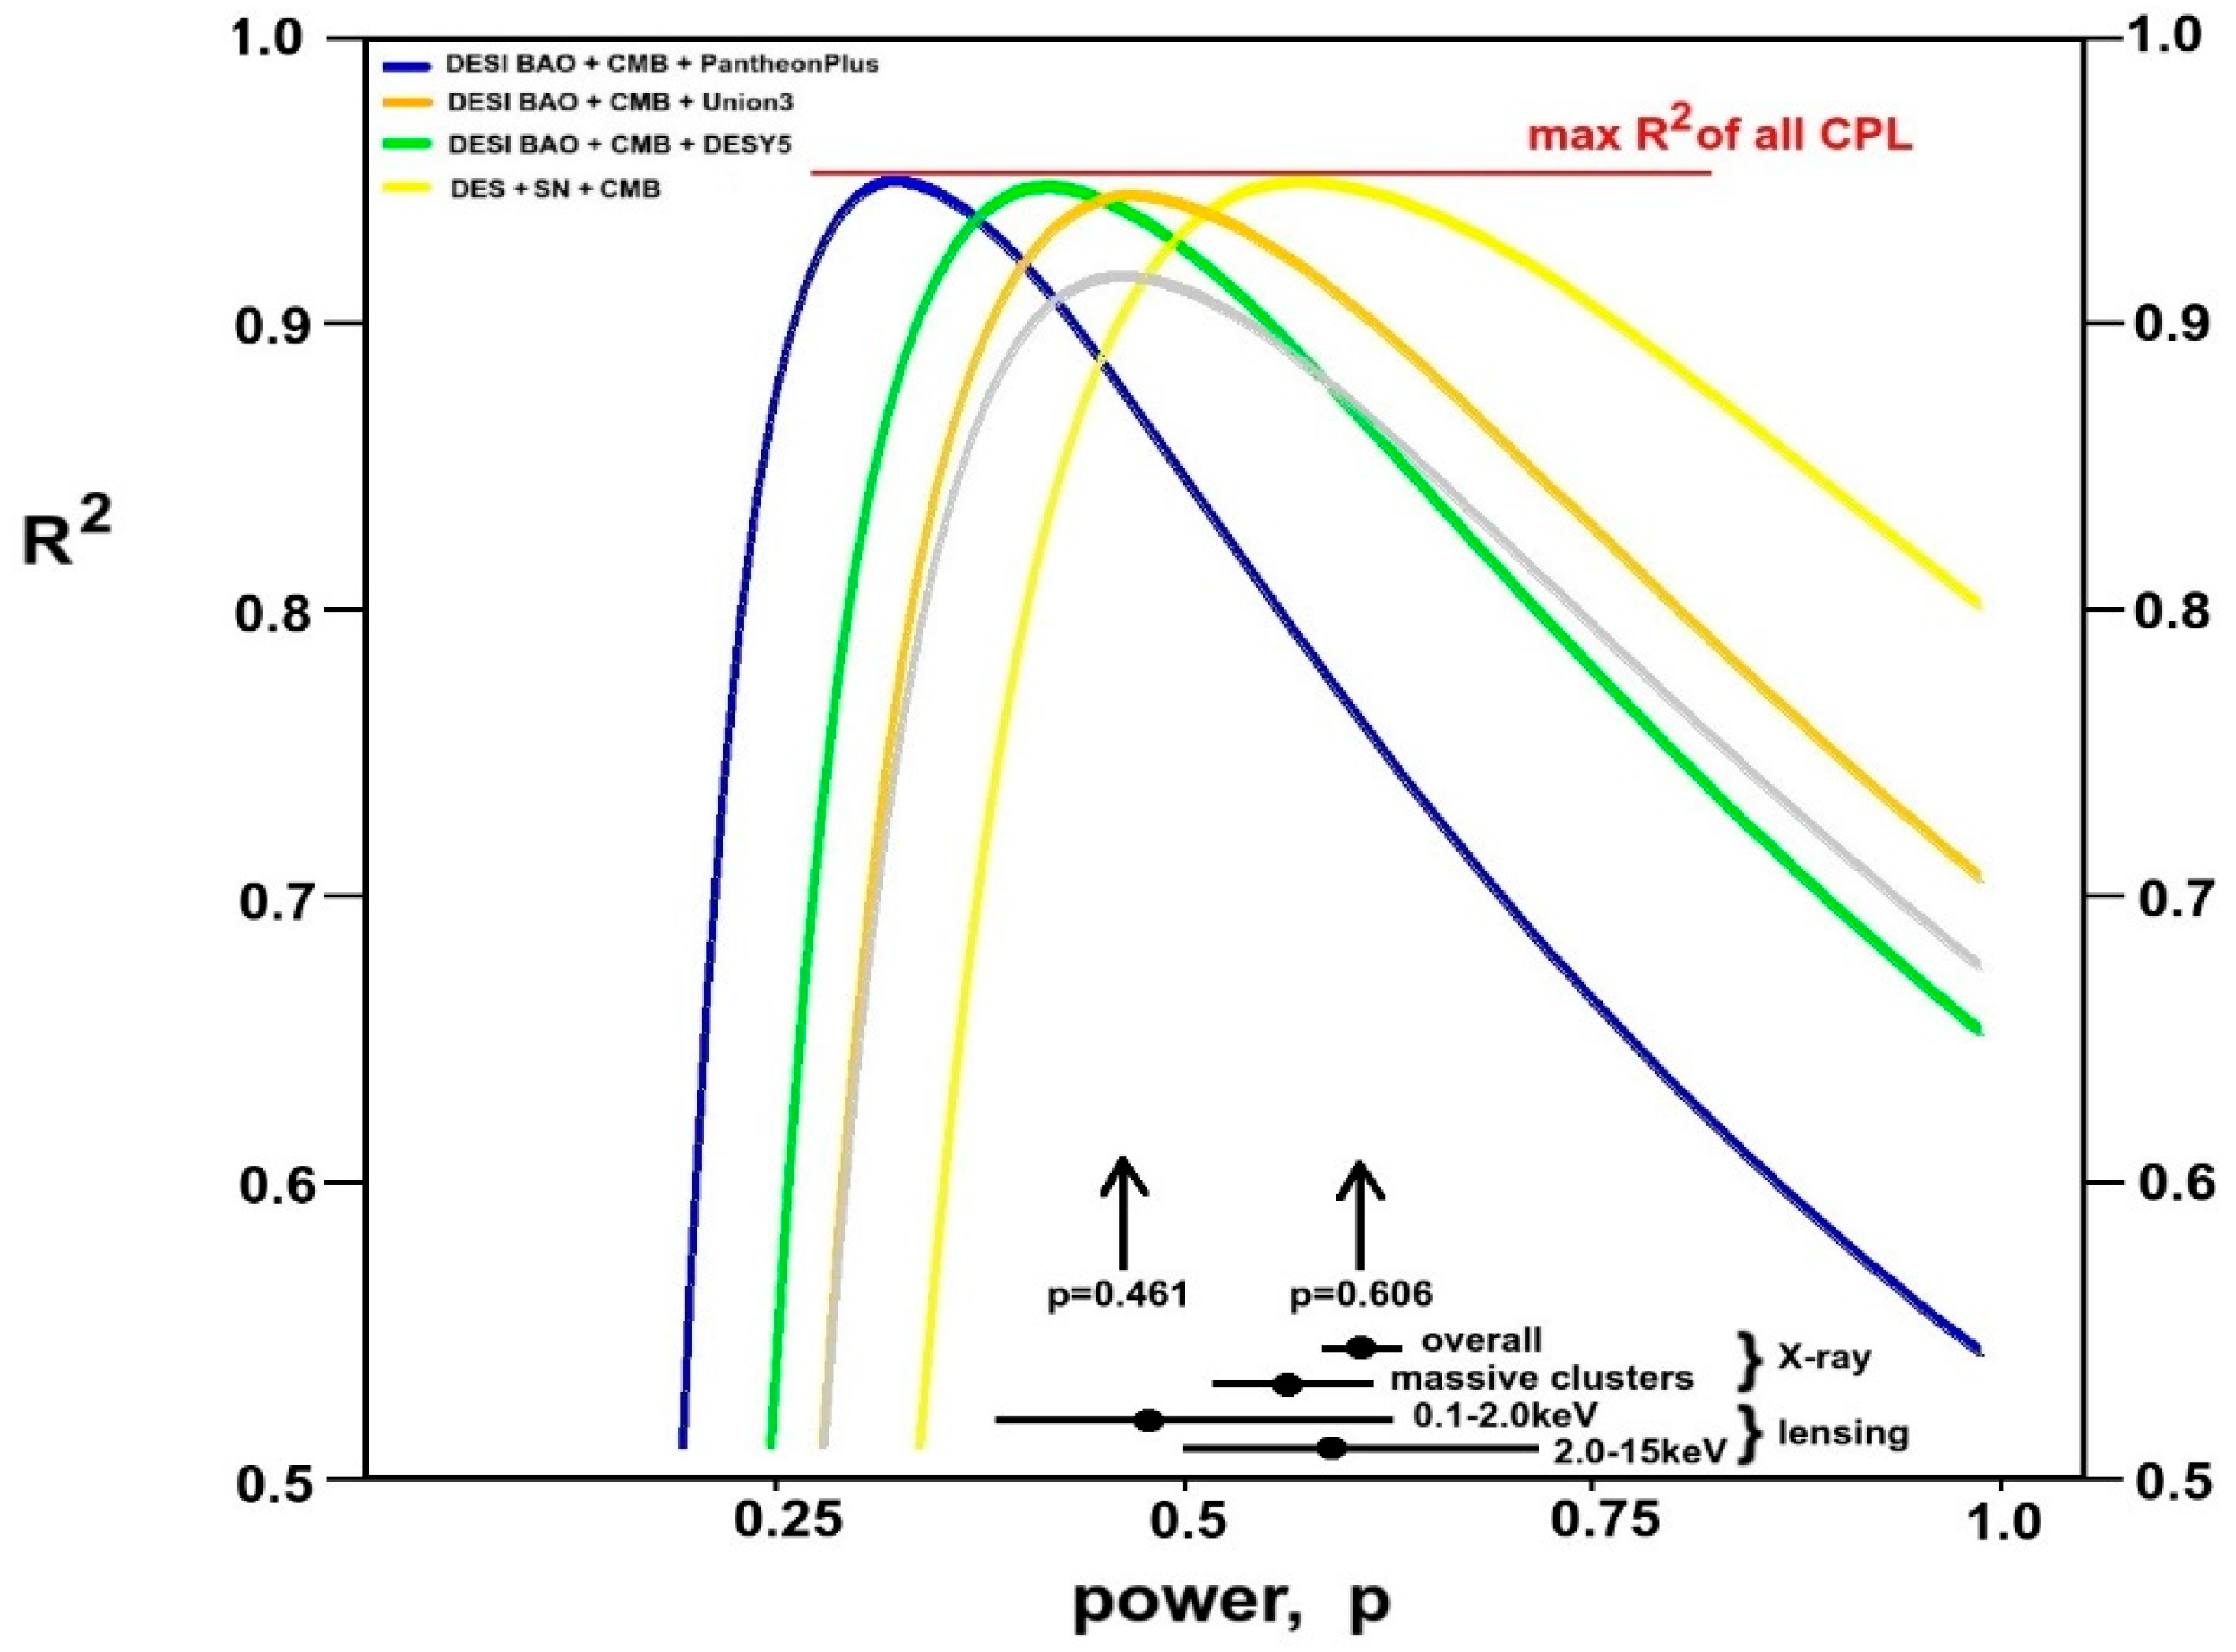
Figure 4.
Predicted IDE ω0 -ωa space contours for R2 > 0.90 and R2 > 0.94 are compared against the measured dark energy 68% and 95% likelihood contours of DESI and DES on the right-hand side. The coloured circles indicate the relevant ω0 - ωa peak locations, and used to define the relevant curves on the left-hand side for comparison against the survey of SMD(a) measurements [24,25,26,27,28,29,30,31,32,33,34,35,36,37,38,39,40,41,42,43,44,45,46,47,48,49,50,51,52,53]. The grey curve illustrates the polynomial curve fit to SMD(a). Upper plots are for p=0.606 and lower plots are for p=0.461.
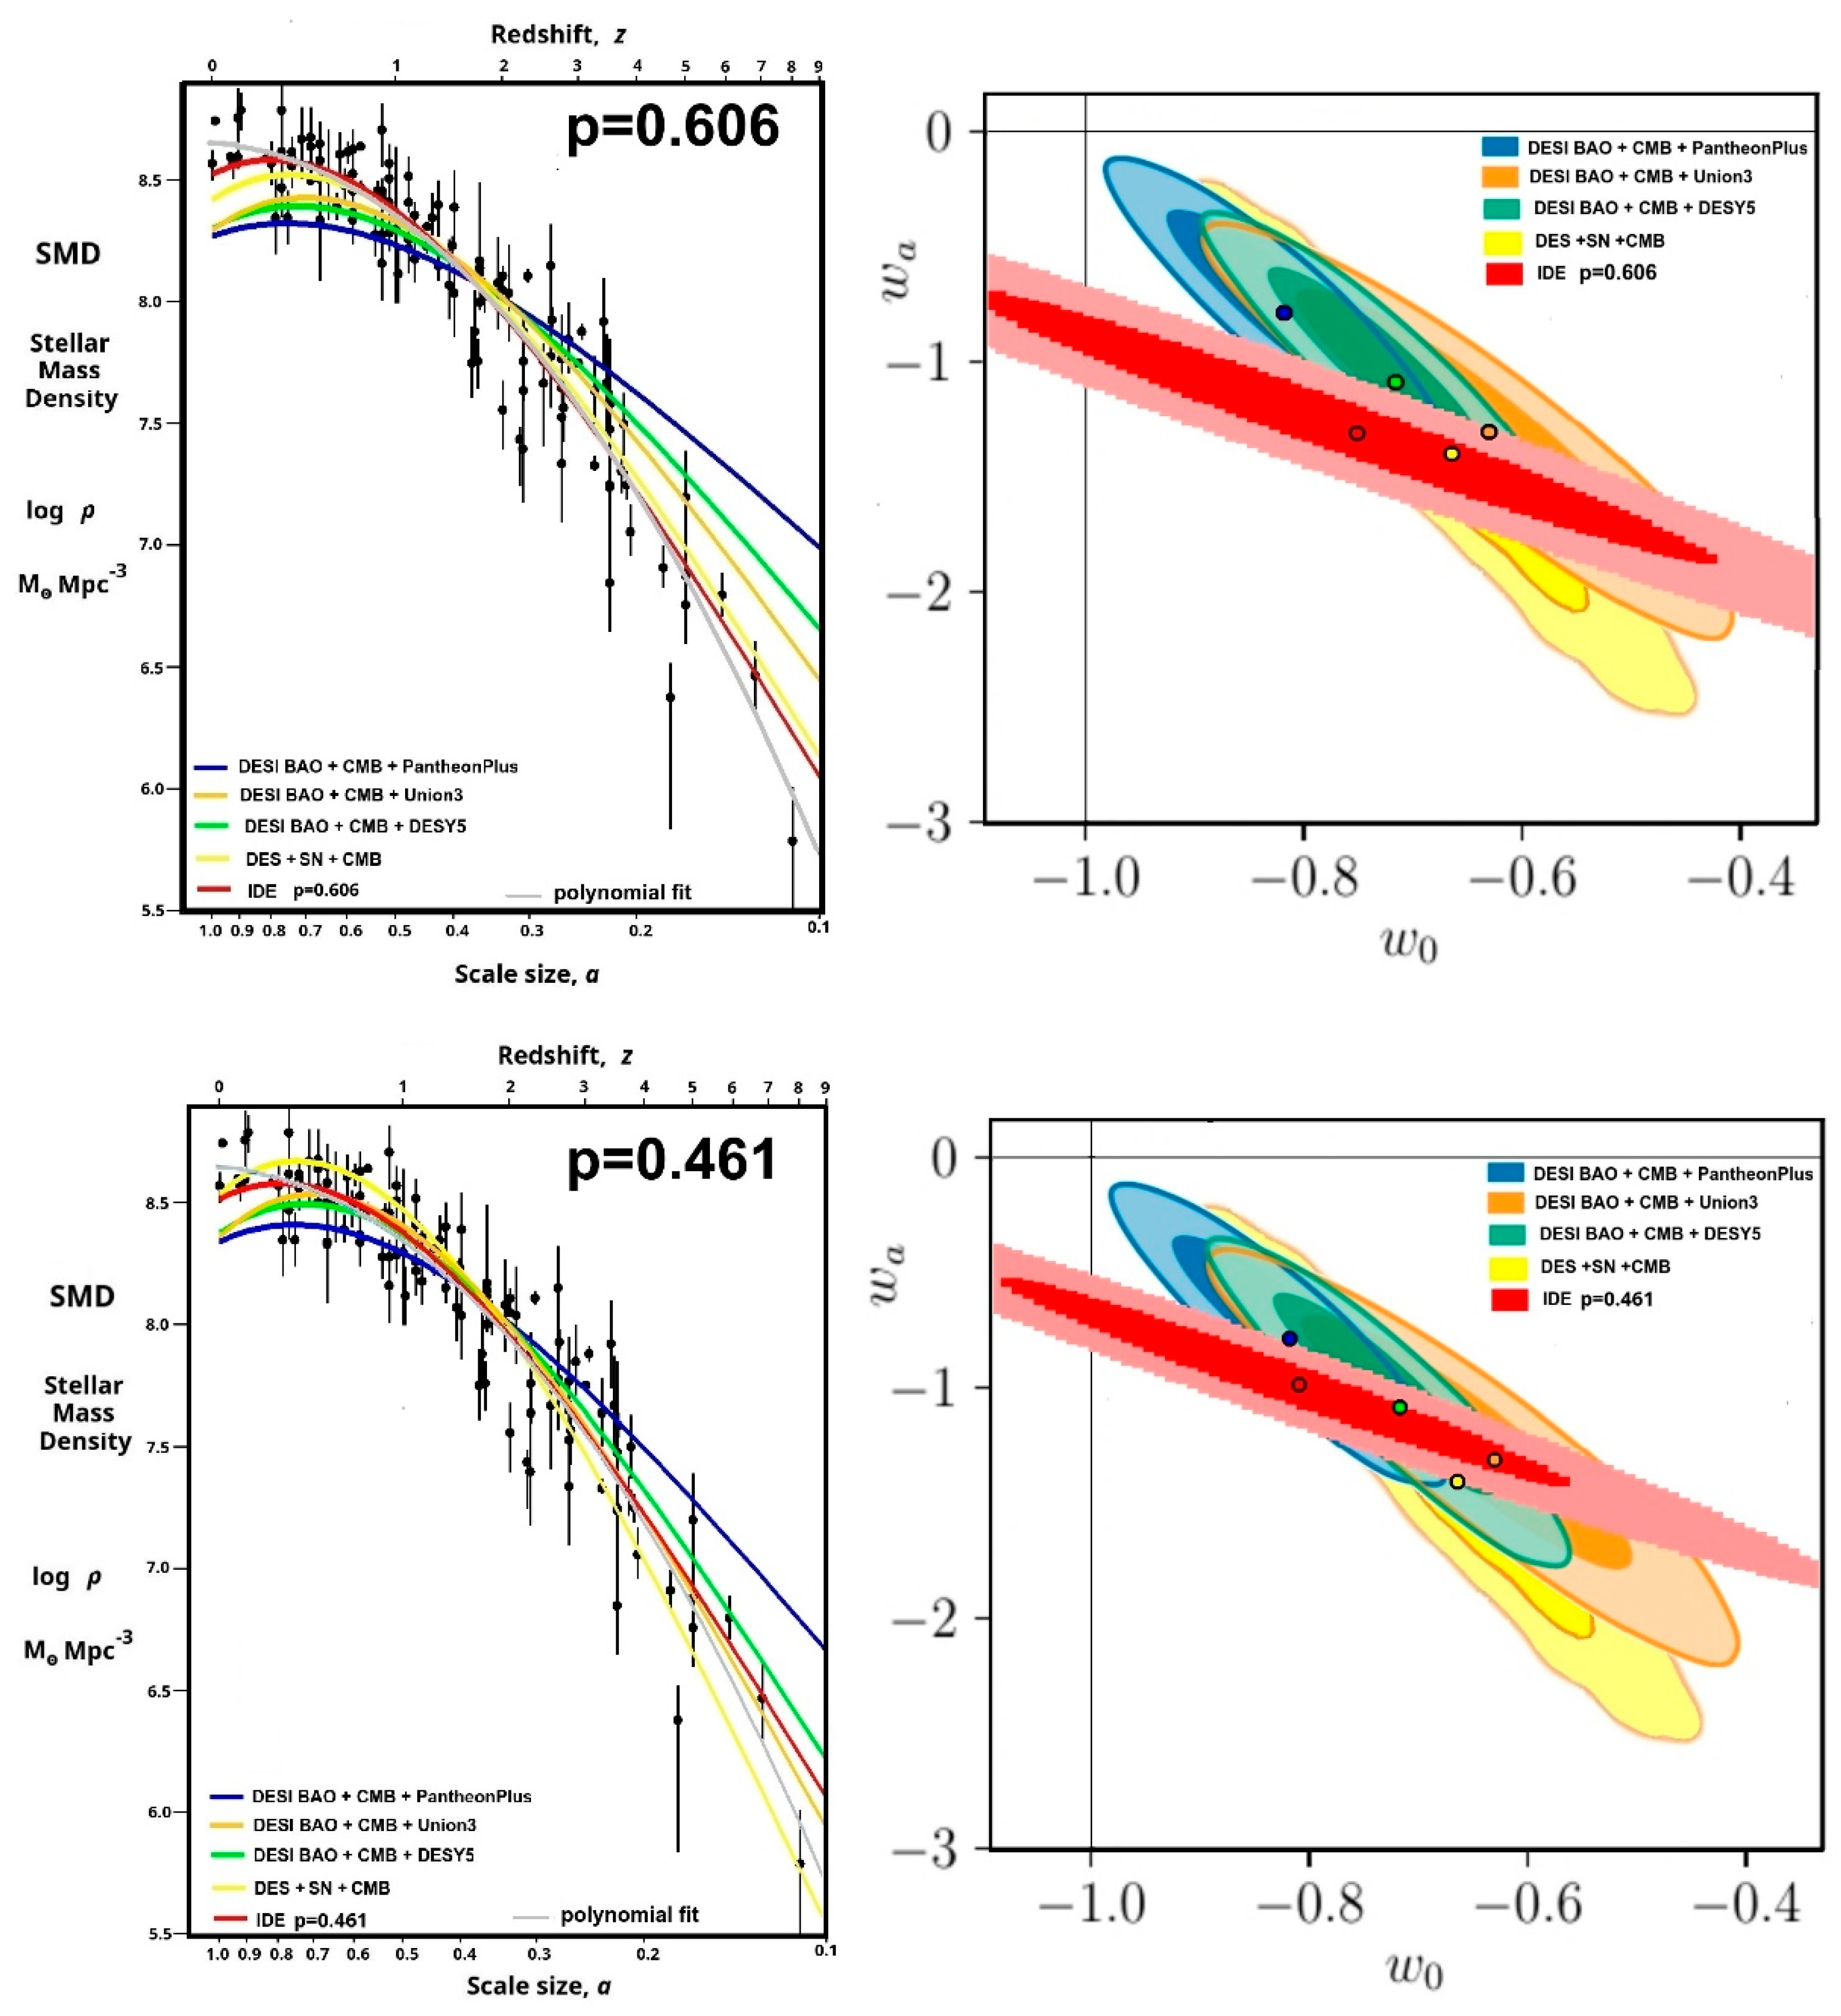
Figure 5.
Interpretation of the predicted IDE, and measured DESI and DES, dark energy CPL parameters as describing a phantom dark energy that reached a maximum in the redshift range 0.2<z<0.6, and significantly different from the cosmological constant, Ʌ. The thick black line indicates how the IDE peak and contours move with different values of p. See §2.4 for explanation of continuous and dashed black contours.
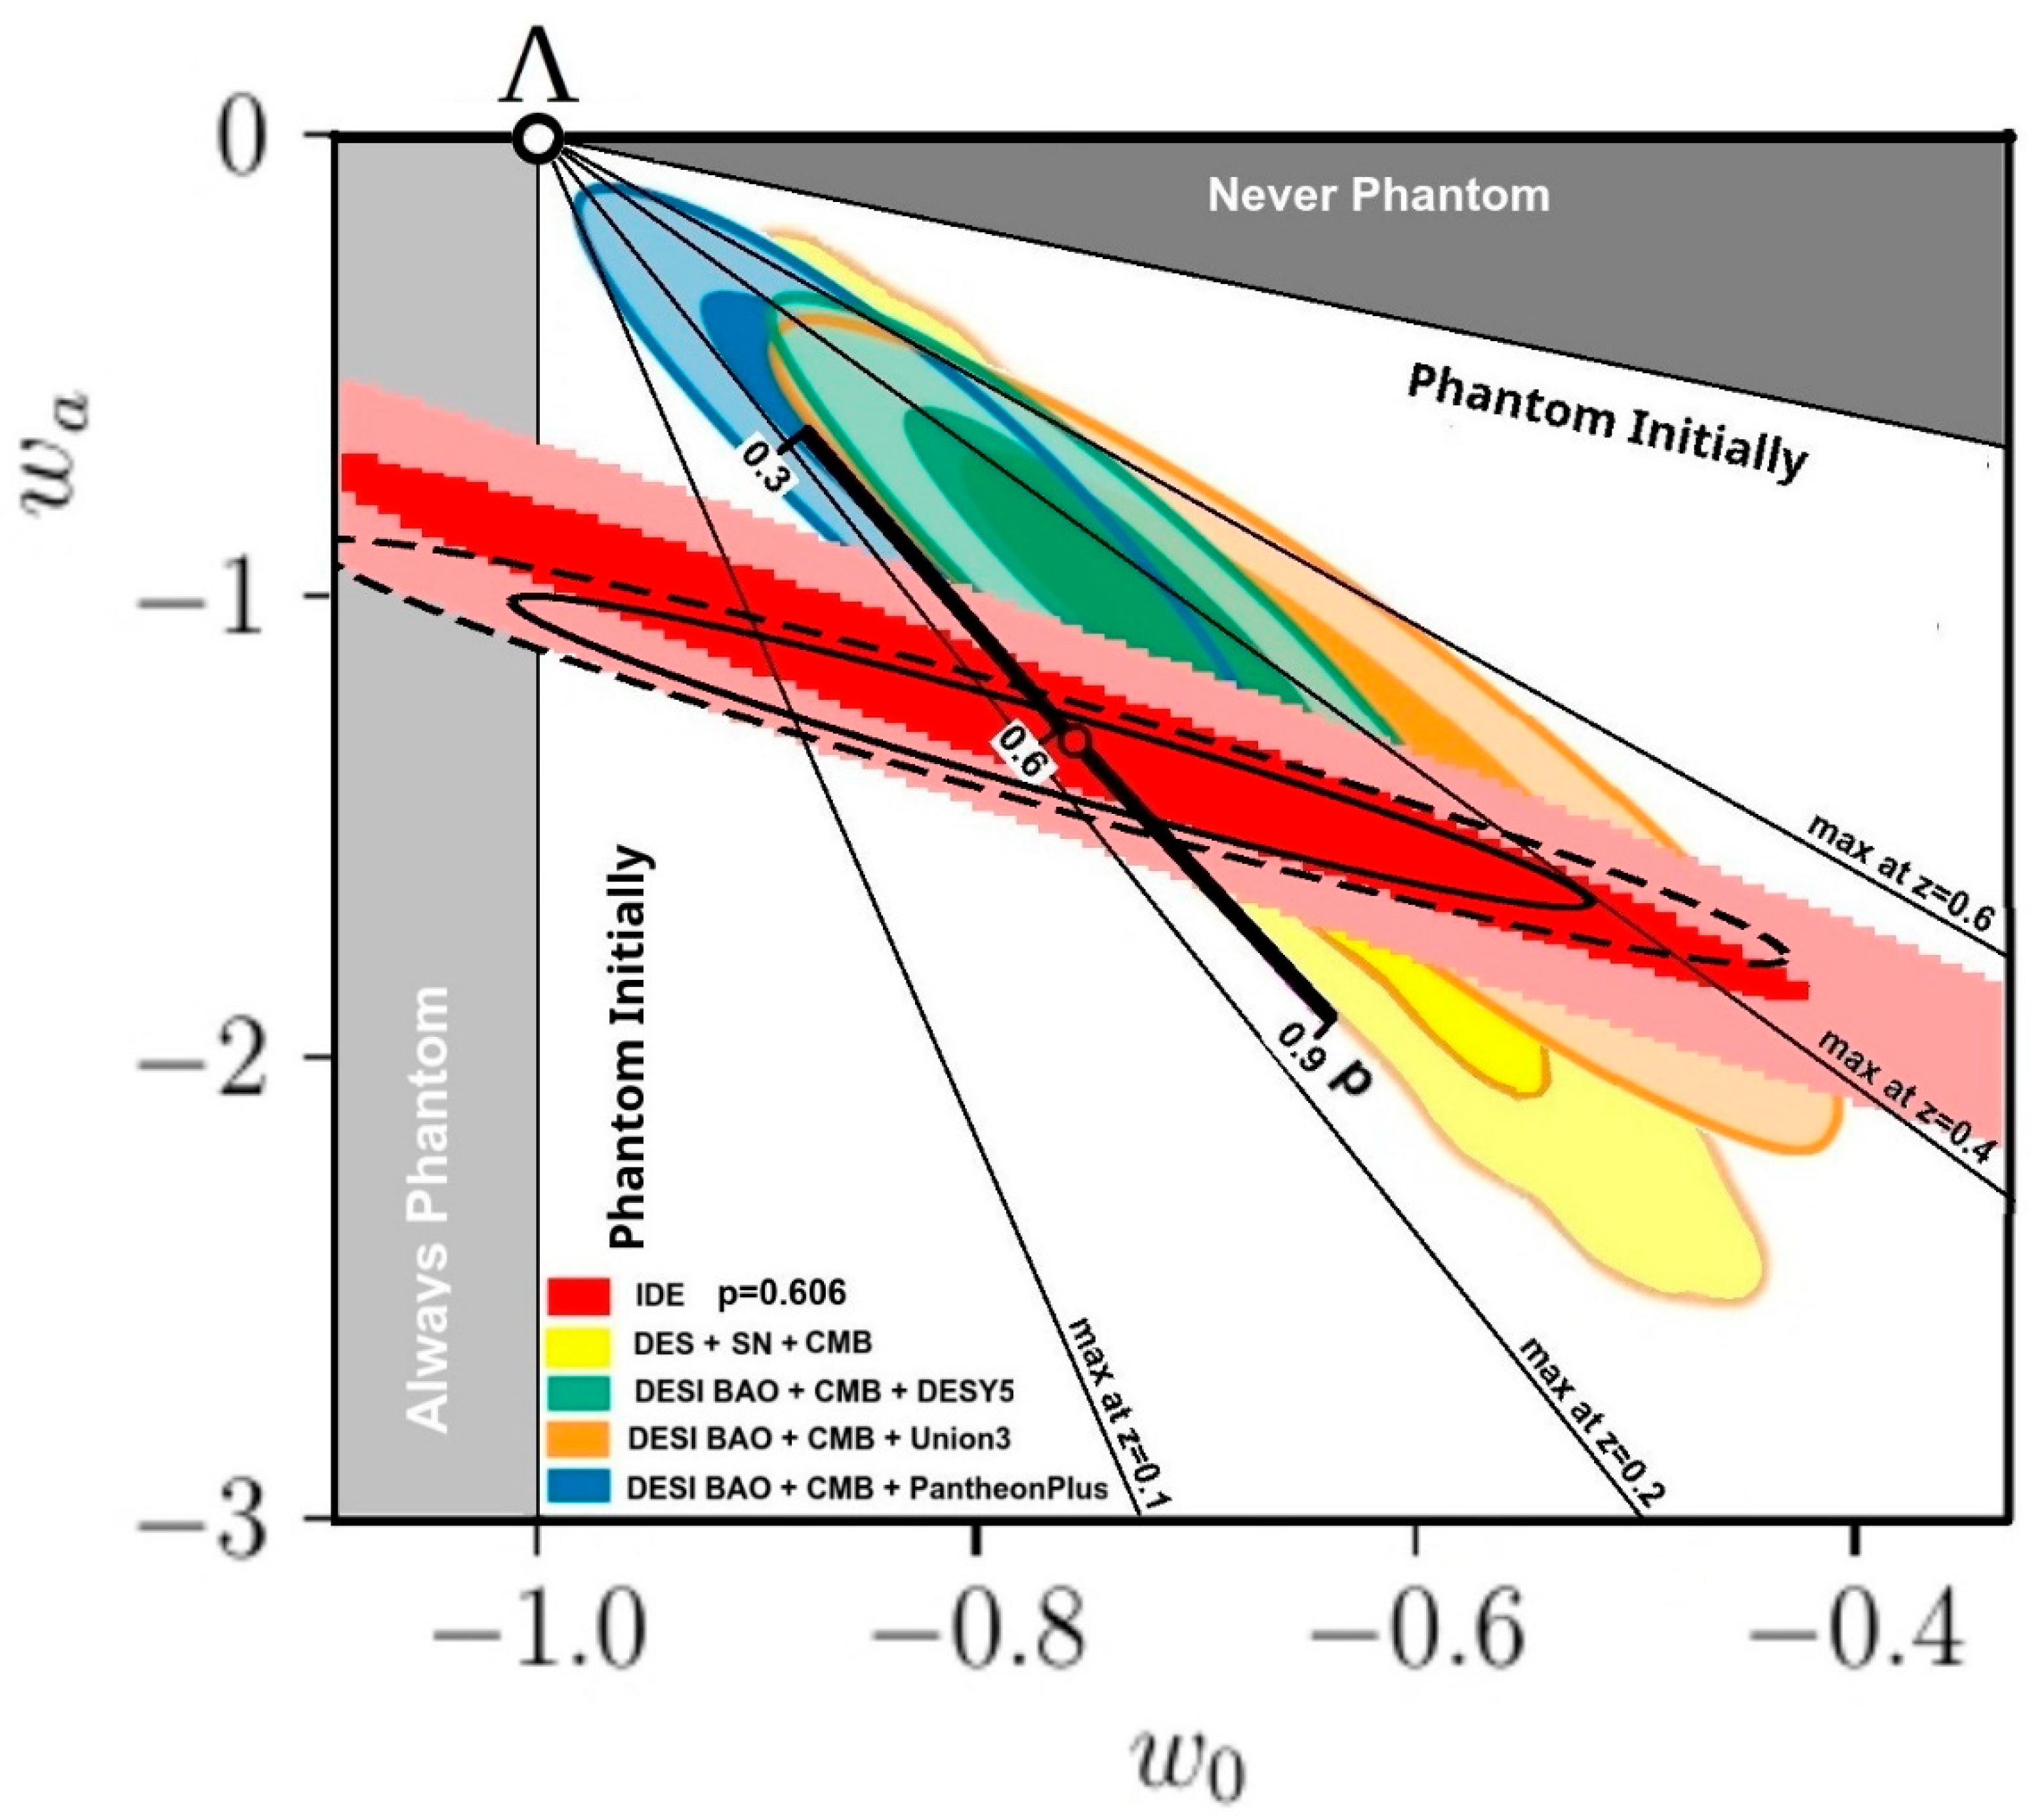
Figure 6.
A, Upper plot: Comparison of DESI & DES resulting ω(z) using CPL parameters, against an IDE source using both CPL and polynomial curve fits to SMD(a), with p=0.606. Two of the DESI results have also been corrected (dashed lines) [62] for possible supernova progenitor age bias. B, Lower plot: All with p=-0.606, ωide(z) (continuous black line, equation 2) has yet to cross ω=-1 while both the best CPL fit to ωide(z) (dashed black line), and the CPL fit to the SMD data (dashed red line), have already crossed ω=-1 at z>0. Also illustrated is the effect of two different values of p (thin grey lines).
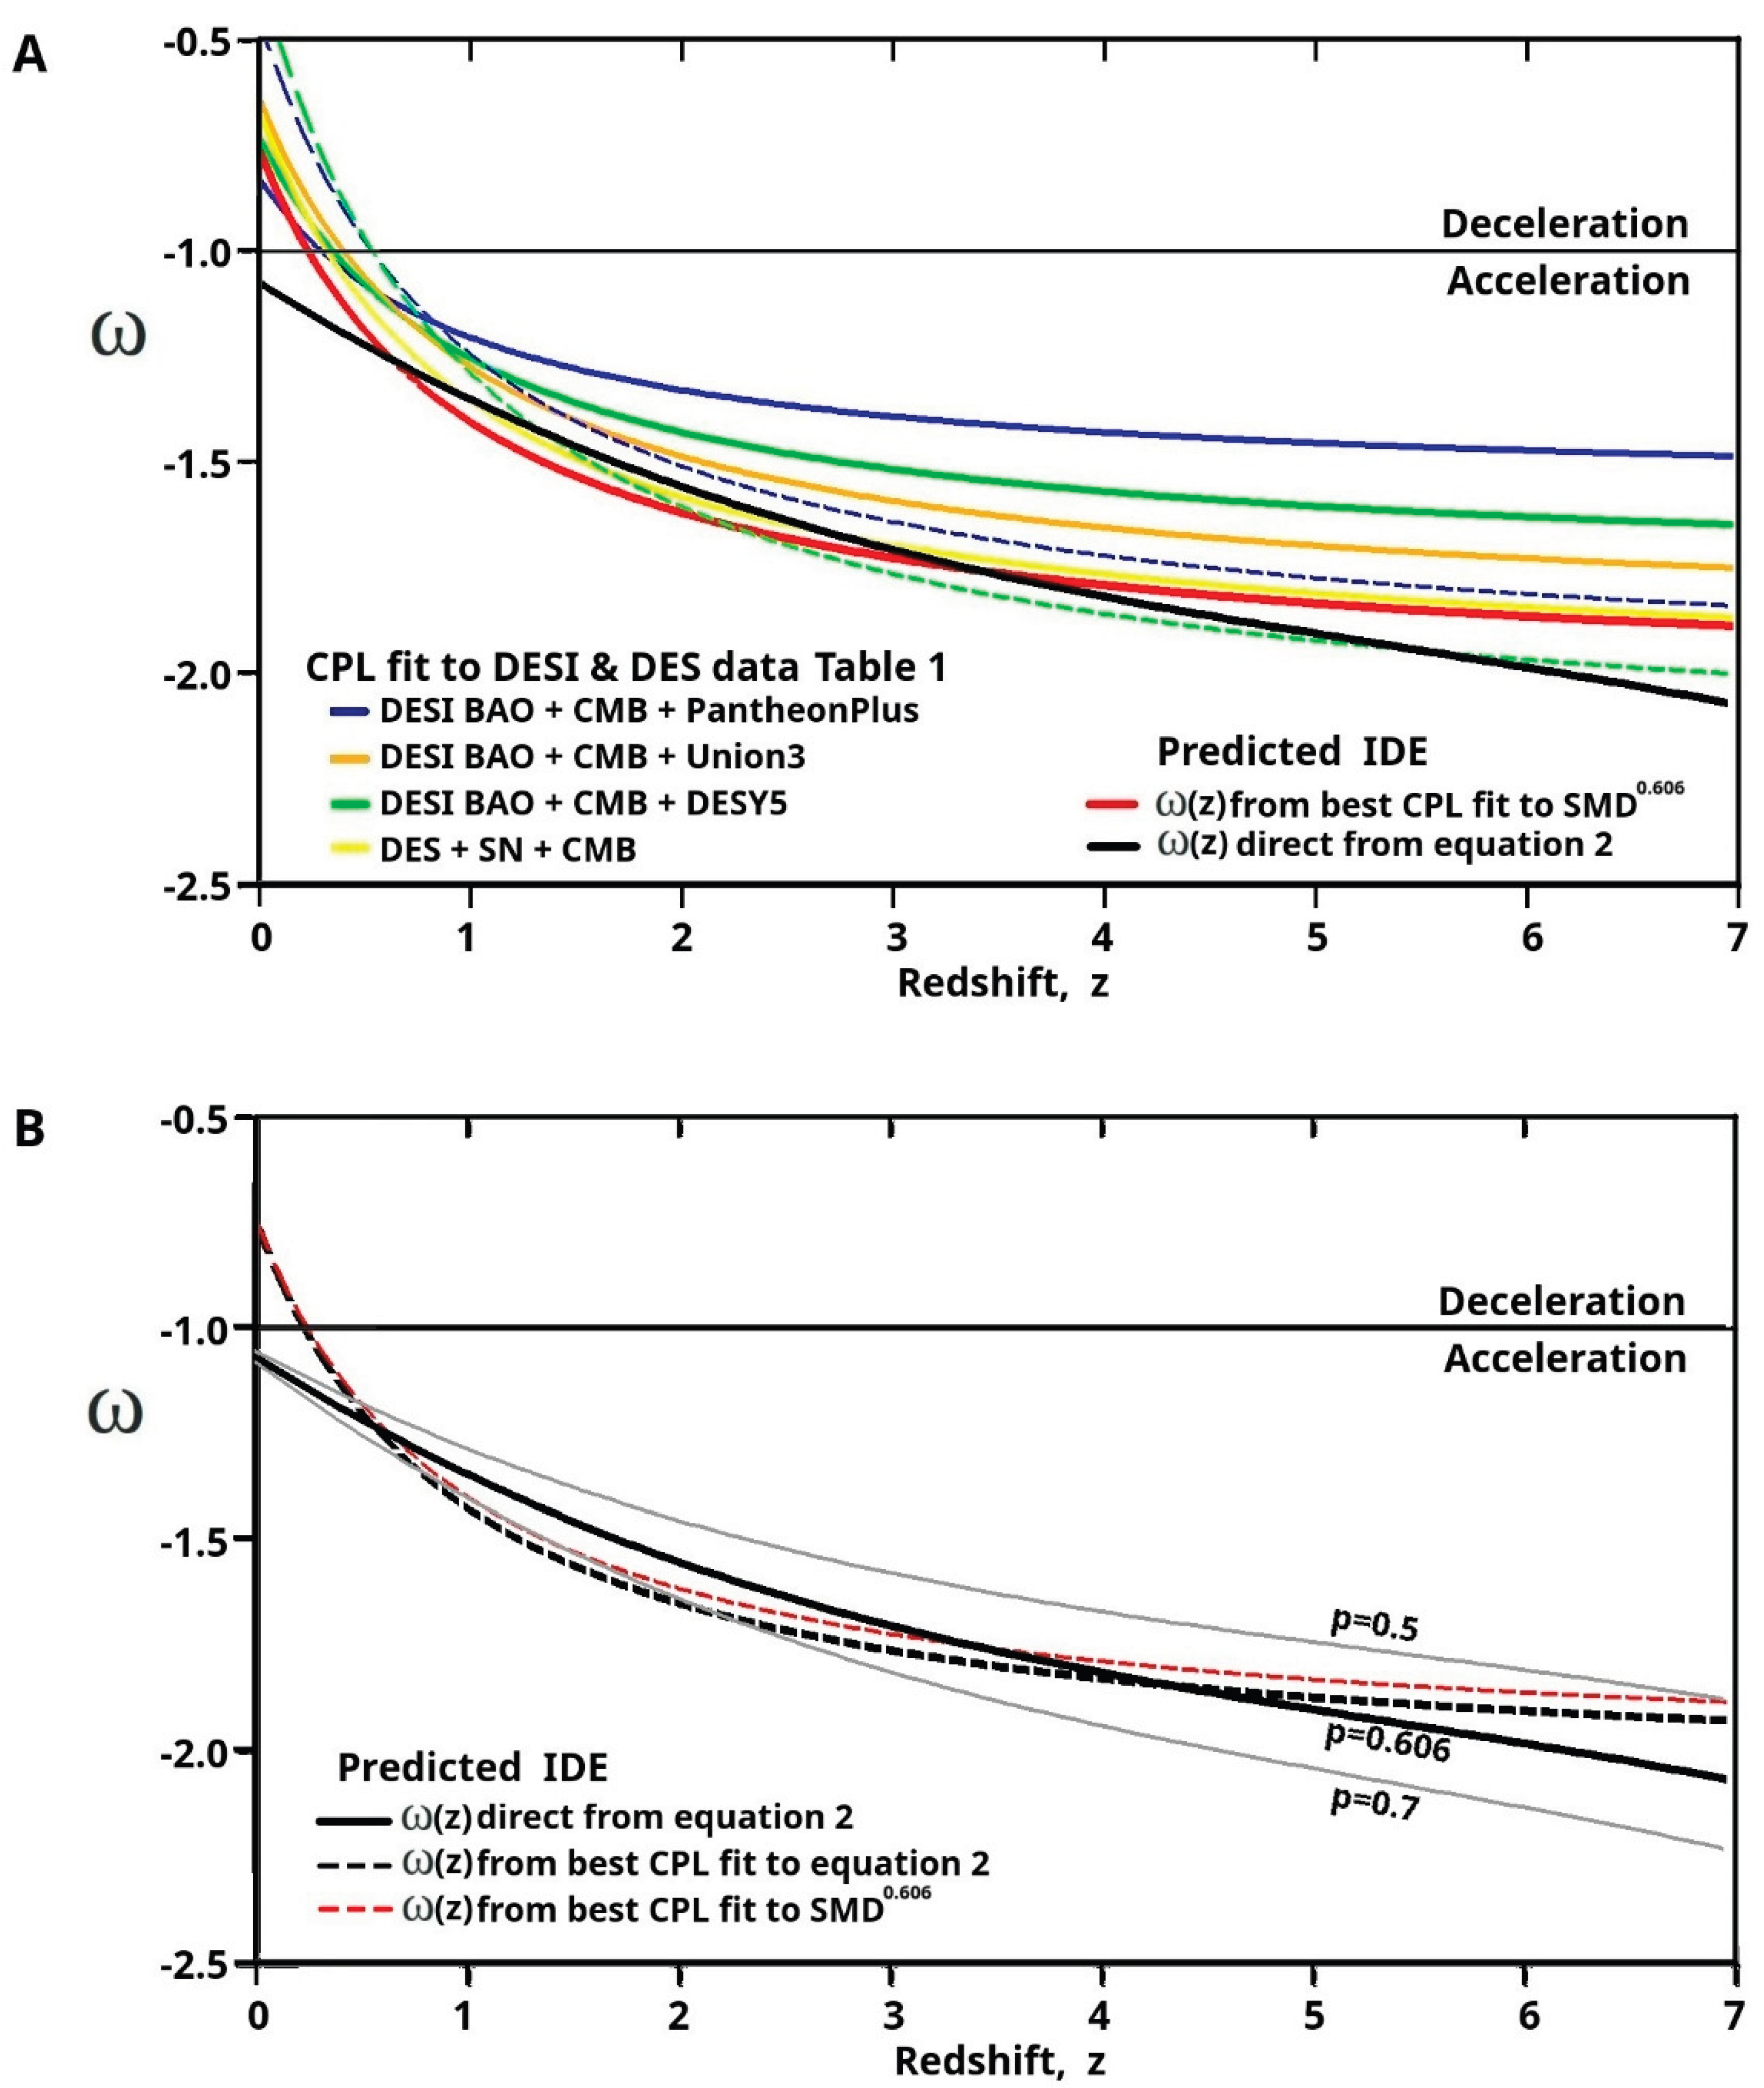

Table 1.
Published dark energy ω0 - ωa CPL values for DES and three DESI combinations of measurement types compared with the best CPL fit to SMD(a)p for the two p cases studied here. The assigned colours listed are used consistently in Figure 3, Figure 4, Figure 5 and Figure 6.
| ω0 | ωa | plot | |
| DES: BAO+SN+CMB | -0.67±0.10 | -1.37±0.50 | |
| DESI: BAO+CMB+Union3 | -0.64±0.10 | -1.27±0.37 | |
| DESI: BAO+CMB+DESY5 | -0.73±0.07 | -1.05±0.29 | |
| DESI: BAO+CMB+Pantheon plus | -0.83±0.06 | -0.75±0.27 | |
| Best CPL fit to SMD(a) with p=0.606 | -0.76 | -1.29 | |
| Best CPL fit to SMD(a) with p=0.461 | -0.81 | -0.99 |
Table 2.
Assuming an IDE source of dark energy and with temperature proportional to (mass)p , the coefficients of determination, R2, show how well the ω0 - ωa values of Table 1 fit the survey of SMD(a) measurements.
Table 2.
Assuming an IDE source of dark energy and with temperature proportional to (mass)p , the coefficients of determination, R2, show how well the ω0 - ωa values of Table 1 fit the survey of SMD(a) measurements.
| R2 | ||
| p=0.606 | p=0.461 | |
| IDE: best CPL fit ( highest R2 ) | 0.953 | 0.953 |
| DES: BAO+SN+CMB | 0.947 | 0.912 |
| DESI: BAO+CMB+Union3 | 0.904 | 0.947 |
| DESI: BAO+CMB+DESY5 | 0.866 | 0.94 |
| DESI: BAO+CMB+Pantheon plus | 0.76 | 0.874 |
Table 3.
Potential of IDE to resolve many problems of cosmology, compared against ɅCDM, scalar fields/ quintessence, and MOND.
Table 3.
Potential of IDE to resolve many problems of cosmology, compared against ɅCDM, scalar fields/ quintessence, and MOND.
| Required dark side property | IDE | ɅCDM | Scalar fields/ | MOND | |
| Quintessence | |||||
| 1 | Account for present dark energy density |
YES, order of magnitude, ~1070 J | NO, not by many orders |
Only by much fine tuning |
---- |
| 2 | Consistent with DESI & DES CPL parameters |
YES, CPL agrees but very different! |
NO, >3.5σ disagreement | Not specific -1<ω<+1 |
---- |
| 3 | Resolve Cosmological constant problem |
YES, Ʌ → 0 |
NO | Only by much fine tuning |
---- |
| 4 | Resolve Cosmological coincidence problem |
YES, naturally |
NO | Only by much fine tuning |
---- |
| 5 | Resolve H0 and σ8 tensions |
YES, probably |
NO | NO | ---- |
| 6 | Account for size of dark matter attributed effects |
YES, order of magnitude | NO, DM not detected yet | ---- | YES, sometimes |
| 7 | Account for location of DM attributed effects |
YES, coincident with baryons |
NO, not coincident |
---- | YES, coincident with baryons |
| 8 | Account for early massive galaxies | YES, expect non-linear growth | NO, expect hierarchical |
---- | YES, non-linear growth |
| 9 | Falsifiable? | YES | ? | ? | ? |
Disclaimer/Publisher’s Note: The statements, opinions and data contained in all publications are solely those of the individual author(s) and contributor(s) and not of MDPI and/or the editor(s). MDPI and/or the editor(s) disclaim responsibility for any injury to people or property resulting from any ideas, methods, instructions or products referred to in the content. |
© 2025 by the authors. Licensee MDPI, Basel, Switzerland. This article is an open access article distributed under the terms and conditions of the Creative Commons Attribution (CC BY) license (http://creativecommons.org/licenses/by/4.0/).
Copyright: This open access article is published under a Creative Commons CC BY 4.0 license, which permit the free download, distribution, and reuse, provided that the author and preprint are cited in any reuse.


