
Submitted:
19 November 2024
Posted:
20 November 2024
You are already at the latest version
Abstract
Evidence is presented for a dark energy resulting directly from star formation. A survey of Stellar Mass Density, SMD, measurements are found to be described by a simple CPL w0-wa parameterisation that is in good agreement with the dark energy results of Planck, and with the recent results of Pantheon 2022, Dark Energy Survey 2024, and the Dark Energy Spectroscopic Instrument 2024. The (SMD)^k best fit CPL values found are w0 =-0.90, wa =-1.49 for k=+1.0, and w0 =-0.94, wa =-0.76 for k=+0.5, corresponding, respectively, to good and very good agreement with all dark energy results. The preference for k=+0.5, suggests that it is the temperature of astrophysical objects that determines the dark energy density. The equivalent energy of the information/entropy of gas and plasma heated by star and structure formation is a possible candidate for such a dark energy source. An Information Dark Energy, is also capable of resolving many of the problems and tensions of ɅCDM: cosmological constant problem, cosmological coincidence problem, the H0 and σ8 tensions, and may account for some effects previously attributed to dark matter.
Keywords:
Landauer’s Principle
; Dark Energy
; Dark Energy Experiments
1. Introduction
The ɅCDM model has been very successful despite our inability to account for either the cosmological constant, Ʌ, or cold dark matter, CDM. It is well known that the natural value of Ʌ is a factor of ~10120 different from the observed value. Also there has not been a single confirmed detection of a CDM particle of any type: WIMP, axion, etc. In addition, when using ɅCDM to extrapolate from early universe measurements to the late universe, there appears to be a significant difference, or tension, with the Hubble constant, Ho, and with the σ8 matter fluctuation parameter measured today. Therefore, despite the success of ɅCDM, we are encouraged to also consider alternative explanations. Here we are considering the role of information energy.
Information must play a significant physical role in the universe. Rolf Landauer [1,2] showed that “Information is Physical”, as each bit of information in a system at temperature, T, has an energy equivalence of kB T ln(2). Laboratory experiments have since proven the Landauer information energy equivalence [3,4,5,6]. John Wheeler [7] even considered information to be more fundamental than matter, with all things physical being information-theoretic in origin, a view encapsulated by his famous slogan “It from Bit”. In the same vein Anton Zeilinger [8] proposed a “Foundational Principle” whereby the attributes of all particles at their most fundamental level correspond to elemental systems, each with just one classical bit or quantum qu-bit of information.
A strong similarity was found [9] between information energy and a cosmological constant. Consider a Zeilinger elemental bit of a particle attribute in a simple universe, without star formation. The Landauer equivalent energy of such a bit has been shown to be defined exactly the same as, and have the same value as, the characteristic energy of a cosmological constant [9,10].
These ideas of information have encouraged research [11,12,13,14,15] into the possible role information energy may play as a source of dark energy. Such a source would be governed by the product of source bit number total, N, [16,17] with typical source temperature, T. Previously, the time history of alternative dark energy contributions was compared against the generally assumed cosmological constant, Ʌ. By definition, Ʌ has a constant energy density, or a total energy proportional to a3, where a is the scale size of the universe, given by a =1/(1+z), z is redshift, and a=1 today. A time history of information energy was obtained by combining the stellar mass density history, SMD(a) for T, with the Holographic Principle [18,19,20] for N. At late universe times, z<1.35, the NT product was found to also vary as a3 with a near constant information energy density, emulating a cosmological constant. At earlier times, z>1.35, the steeper gradient would provide a means by which the information dark energy could be differentiated from a cosmological constant and effectively falsified [15].
But the universe information content is well below the holographic bound (~10124 bits) and, so far, the Holographic Principle has only been verified as applying to black holes at that bound. The approach taken in this present work is to show that the information energy can account for dark energy history based solely on the measured SMD(a), without invoking the Holographic Principle. Compared with the above most recent work [15], the approach here is simpler and more natural. Moreover, the predicted time history of this information dark energy is provided in the same form as the results from dark energy measurements, enabling a direct comparison between theory and experiment.
2. Information Dark Energy, IDE
The equation of state parameter, w, of dark energy sets the time variation of the dark energy density as being proportional to a-3(1+w). While baryon and dark matter energy densities vary as a-3, w=0, the energy density of a cosmological constant is, by definition, constant, unchanging as a0, w=-1. In contrast, a dynamic form of dark energy varies at different rates at different times. In order to take any such time variation into account most dark energy studies have adopted the CPL [21] parameters w0,wa for a variable equation of state parameter, w(a) = w0 + ( 1 – a ) wa . This provides w(a) with a smooth variation from the very early value of w0 + wa to the present value of w0 . While there is no reason to expect that any source of dark energy with a time varying w(a) can be fully described by CPL parameters, it does have the advantage of being simple, and for that reason is widely applied to studies of dark energy. CPL provides a common testing ground between experiment and theory. Dark energy measurements were originally expected to strengthen the cosmological constant hypothesis by converging on the values of w0 = -1 and wa = 0, but recent dark energy measurements [22,23,24] clearly tend towards a dynamic dark energy description with w0 > -1 and wa < 0.
As the main source of Information Dark Energy, IDE(a) is the information energy of hot gases and plasma heated by stars and general structure formation [15], we must consider the Stellar Mass Density, SMD(a), as a function of universe scale size, a. Figure 1 provides a survey of SMD(a) measurements in units of solar masses per cubic co-moving megaparsec. A total of 121 SMD(a) measurements from 27 published sources [25,26,27,28,29,30,31,32,33,34,35,36,37,38,39,40,41,42,43,44,45,46,47,48,49,50,51] (some of which were covered in a review [52]) are plotted in Figure 1 on a logarithmic scale of stellar mass density against the logarithm of universe scale size, a. Note that only values a>0.2 are used in the analysis below. This is because values a<0.2 would correspond to times when the information energy density was so much weaker, <<1%, of the matter energy density (varying as a-3), and thus could not affect universe expansion measurements. Dark energy is only evident from measurements of the expansion rate history.
As SMD(a) is a universe-wide average mass density and IDE(a) is a universe-wide average information energy density, both effectively energy densities, we expect IDE(a) to vary at some power, k, of proportionality: SMD(a)k. In this way we can account for time variations in the NT product (without recourse to employing the Holographic Principle as was done previously).
The Friedmann equation [53] describes the Hubble parameter H(a) in terms of the Hubble constant H0, and dimensionless density parameters, Ω, expressed as a fraction of today’s total energy density. We can assume that the curvature term is zero and that the radiation term has been negligible for some time. The ɅCDM model is then given by Equation (1) and the equivalent IDE model is then described by Equation (2) where the present fractional energy density contributions: Ωtot from all matter (baryons+dark matter); ΩɅ the cosmological constant, and ΩIDE is information dark energy, IDE.
ɅCDM: (H(a)/H0)2 = Ωtot a-3 + ΩɅ
IDE: (H(a)/H0)2 = Ωtot a-3 + ΩIDE ( SMD(a)/SMD(1.0) )k
In Figure 2 a CPL parameterisation has been fitted to each case. Each w0, wa parameter combination sets the variation in the power of a and thus the gradient on this log-log plot at different values of a. As this is a log-log plot, any curve corresponding to a given w0, wa combination is fixed in the log(a), abscissa direction, but can be moved in the log(SMDk), ordinate direction, to obtain that curve’s maximum R2 coefficient of determination, to find that curve’s best fit to the data points of Figure 2. The overall best fit was then obtained for all pertinent w0, wa combinations: w0 values in the range +0.9 to -3.0 in steps of 0.01 were tested for each wa value in the range +0.9 to -3.5, also in steps of 0.01. The best w0, wa parameter fits to the SMD(a) data, both with highest maximum R2 values of 0.93, is shown by the red curves in Figure 2 for the cases k=1.0 and k=0.5. In Figure 3. each of the 121 SMD(a) measurements are then plotted against the SMD(a) values predicted by the best fit CPL curve at the measured a value. In both cases the measured and predicted sets of values are related with a Pearson correlation coefficient value, r=0.92.
The maximum R2 coefficients are plotted in Figure 4. for all of the above w0 -wa tested combinations on a colour scale to show the extent of fit for different w0, wa values for both k=+1.0 and k=+0.5. Clearly, it seems most natural to assume that the heating of gases and plasmas are directly proportional to the amount of star formation, k=+1. However, we see in section 4 that there are many general cases in the universe where temperatures closely follow the square root of mass, corresponding to k=+0.5. So we examine here these two values: k=+1.0 and k=+0.5.
3. Comparison of IDE Prediction with Experimental Measurements
In this section we compare the IDE(a) contribution (proportional to SMD(a)k) against several experimental measurements of dark energy. In Figure 5, Figure 6 and Figure 7 we illustrate the expected information dark energy contribution in w0-wa space for the cases k=+1.0 and k=+0.5 by re-plotting the R2>0.86 and R2>0.92 contours from Figure 4 in two shades of red, adjusted to the scales of the various published w0-wa experimental plots.. The IDE(a) prediction is compared in these figures directly against the results of Planck 2013, [54]; Planck 2015, [55]; Planck 2018, [56]; Pantheon 2022, [22]; Dark Energy Survey 2024, [23]; and the Dark Energy Spectroscopic Instrument, DESI, 2024, [24].
These combined plots allow the region of predicted IDE(a) in w0-wa space to be compared directly with the w0-wa space required to explain the experimental measurements of dark energy. In each measurement plot there are several combinations of experimental techniques using different colours to differentiate between the different combinations and each with two shades per combination corresponding to the 68% (stronger colour) and 95% (lighter colour) likelihood contours. The combinations include several different techniques: Cosmic Microwave Background; Baryon Acoustic Oscillations; Weak Lensing, etc. The reader is referred to the cited publications for more information on these techniques and for how data from the techniques were combined together.
The IDE predicted w0 -wa spaces for k=+1.0 in Figure 5, Figure 6 and Figure 7 clearly show a strong overlap with the three Planck plots of likelihood space, and lie close to, but with less direct overlap with, the more recent measurements of Pantheon, Dark Energy Survey, and Dark Energy Spectrographic Instrument. However, the predicted IDE w0-wa spaces for k=+0.5 show an even stronger overlap in all plots. The best fit IDE R2>0.92, overlaps the deeper colour 68% likelihood area of all experimental data combinations in all plots.
4. Discussion
4.1. IDE Can Account for the Observed Dark Energy
While we might well expect k=+1.0, a direct proportionality between IDE(a) and SMD(a), to exhibit the observed reasonable agreement in w0-wa space, we find that the k=+0.5 provides an even better, fuller, agreement. With k=+0.5, two decades of SMD(a) mass density provide only one decade of IDE(a). Information energy, N kB T ln(2) is proportional to temperature and we note that there are many cases in the universe where the temperature of objects scale approximately with the (object mass)0.5 relation.
This approximate proportionality is observed over a wide range of scales, from the largest universe scales of galaxy clusters, to galaxy scales, and down to the much smaller scales of individual stars. In galaxy clusters most of the baryons, 60-90%, are found in the X-ray emitting intracluster medium, ICM, at temperatures of 1-15keV (approximately 107 – 1.5 x 10⁸ K) with all the remaining baryons located in galaxies. Galaxy cluster masses over the two decade range 1013-1015 solar masses, M⊙, correspond closely to only a single decade of ICM X-ray luminous temperature range of 1-10keV, corresponding to k~0.5, see Figure 15 of [57]. ICM accounts for most of the baryon entropy in the universe [58], and may make a significant contribution to IDE. The halo mass-temperature relation shows a similar value of k=0.6 over a range of over 3 decades of mass for galaxy clusters, groups of galaxies, and individual galaxies, see Figure 4 of [59] (in that publication deduced as mass proportional to T1.65 ). At the other extreme of universe scale, in the main sequence stars, again k~0.5, since over the two decades of star size, from 0.5M⊙ to 60M⊙, the stellar photosphere temperature ranges over just one decade from 3800 to 44,500 K.
The two CPL w0-wa parameter combinations that best describe SMD(a)+1.0 and SMD(a)+0.5 show respectively, a reasonable and a very good, overlap with the w0-wa limits placed by dark energy measurements. This strongly supports the suggestion that there is a dynamic dark energy that is directly related to star/structure formation and determined primarily by temperature. Clearly, IDE can explain such a relation.
In Figure 8 we provide a survey of possible sources of information energy [16,17,58]. with total information energies of these phenomena determined by their NT product. Their information energy relevance is illustrated by comparison to the ~1070 Joules mc2 energy equivalence of the 1053 kg universe baryons. While there is much uncertainty in these NT values, it appears that the strongest sources of IDE, provided by stellar heated gas and by the intracluster medium, are approaching the baryon mc2 energy. Therefore, this work has established that IDE can account for the dark energy of the universe, very approximately accounting for the present energy density, but, more clearly and importantly, providing a clear agreement with the latest experimentally observed dark energy history in w0-wa space [22,23,24].
4.2. Cause and Effect
We have established a clear similarity between the history of dark energy and the history of star formation via the w0-wa parameter plots. This has led us to consider IDE as the source of dark energy. But this similarity could also be explained by the reverse possibility, that dark energy might be responsible for some of the SMD(a) history. Indeed, the very recent reduction in star formation, reduction in galaxy merging, and a reduction in general structure growth rate has been attributed to the accelerating expansion caused by dark energy [60,61]. This reduction in SMD(a) is evident in Figure 2 by the decrease down to z=0 shown by the fitted CPL red curves, corresponding to a present equation of state parameter, w0 >-1. However, we should expect this would also happen if IDE is the source of dark energy. Increasing star formation provided an increasing IDE energy density that eventually overtook the falling matter energy density to initiate the accelerating expansion. In turn, acceleration fed back to limit the star formation rate and IDE.
Over the late universe history considered here, a>0.2, there are two factors that support the main causal direction: SMD → IDE→ accelerating expansion. The first is the fact that k=0.5 gives the best fit in all the w0-wa parameter plots, corresponding to the temperature dependence expected for IDE, rather than a mass dependence. The second is the close similarity in earlier growth rates, similar wa values, before dark energy was strong enough (relative to falling mass density) to affect general structure growth rate.
4.3. IDE Should Resolve Some Problems and Tensions of ɅCDM
A late universe dark energy in the form of information dark energy was previously shown [15] able to address many problems and tensions of ɅCDM. Some of the most relevant are briefly restated here. A dark energy theory that can account for the observed effects of dark energy, as an alternative to the cosmological constant, would allow Ʌ to take the more likely zero value [62], and effectively solve the cosmological constant problem, Ʌ→0. Also we see in Figure 6 and Figure 7 that the cosmological constant (w0=-1, wa =0) generally lies outside, or in some cases only on the margins of, the w0-wa likelihood space of the recent experiments [22,23,24].
A late universe dynamic dark energy which was insignificant at z>2 and increases from z~2 to the present energy density has been previously shown [63] to provide a possible explanation for both the Hubble and σ8 tensions, similar to a transitional dark energy [64], or to a dynamic cosmological constant / running vacuum model [65]. The time history of IDE described here would have a very similar characteristic time history and thus may also account for these tensions.
A dark energy that increased with star formation to become the dominant energy today naturally solves the cosmological coincidence problem. Increasing star formation also increased the probability of intelligent beings evolving to live in the dark energy dominated epoch, and to subsequently discover dark energy.
4.4. IDE Can Also Account for Dark Matter Attributed Effects
At the time of writing the latest results from the most sensitive WIMP dark matter detector to date [66] managed to further limit the possible WIMP dark matter energy range, and still without any confirmed dark matter particle detection. Now IDE has a similar universe wide total energy as matter, and is primarily concentrated around stars and structures where it should have a local energy density at least as high as that from baryons. The General Theory of Relativity shows that space-time will be distorted by accumulations of energy in any form, not just by the mc2 of matter, illustrated in Figure 9.
Therefore IDE in galaxies will have the same effect as an extra unseen dark matter component, and thus be difficult to distinguish from dark matter. The dark matter attributed effects in many galaxies have been shown to have their location fully specified by the location of baryons [67,68]. This observation is difficult to reconcile with ɅCDM, but is clearly compatible with effects expected from IDE, but also compatible with modified Newtonian dynamics, MOND. In a cluster of galaxies the brightest, and highest temperature, galaxy is often found to have the strongest dark matter attributed effects [69], again consistent with an IDE source of the effects. When galaxies collide the dark matter attributed effects generally pass straight through, remaining co-located with the stars and structures, while the gas clouds slow down with collisions [70,71,72]. This is also consistent with an IDE source of the effects.
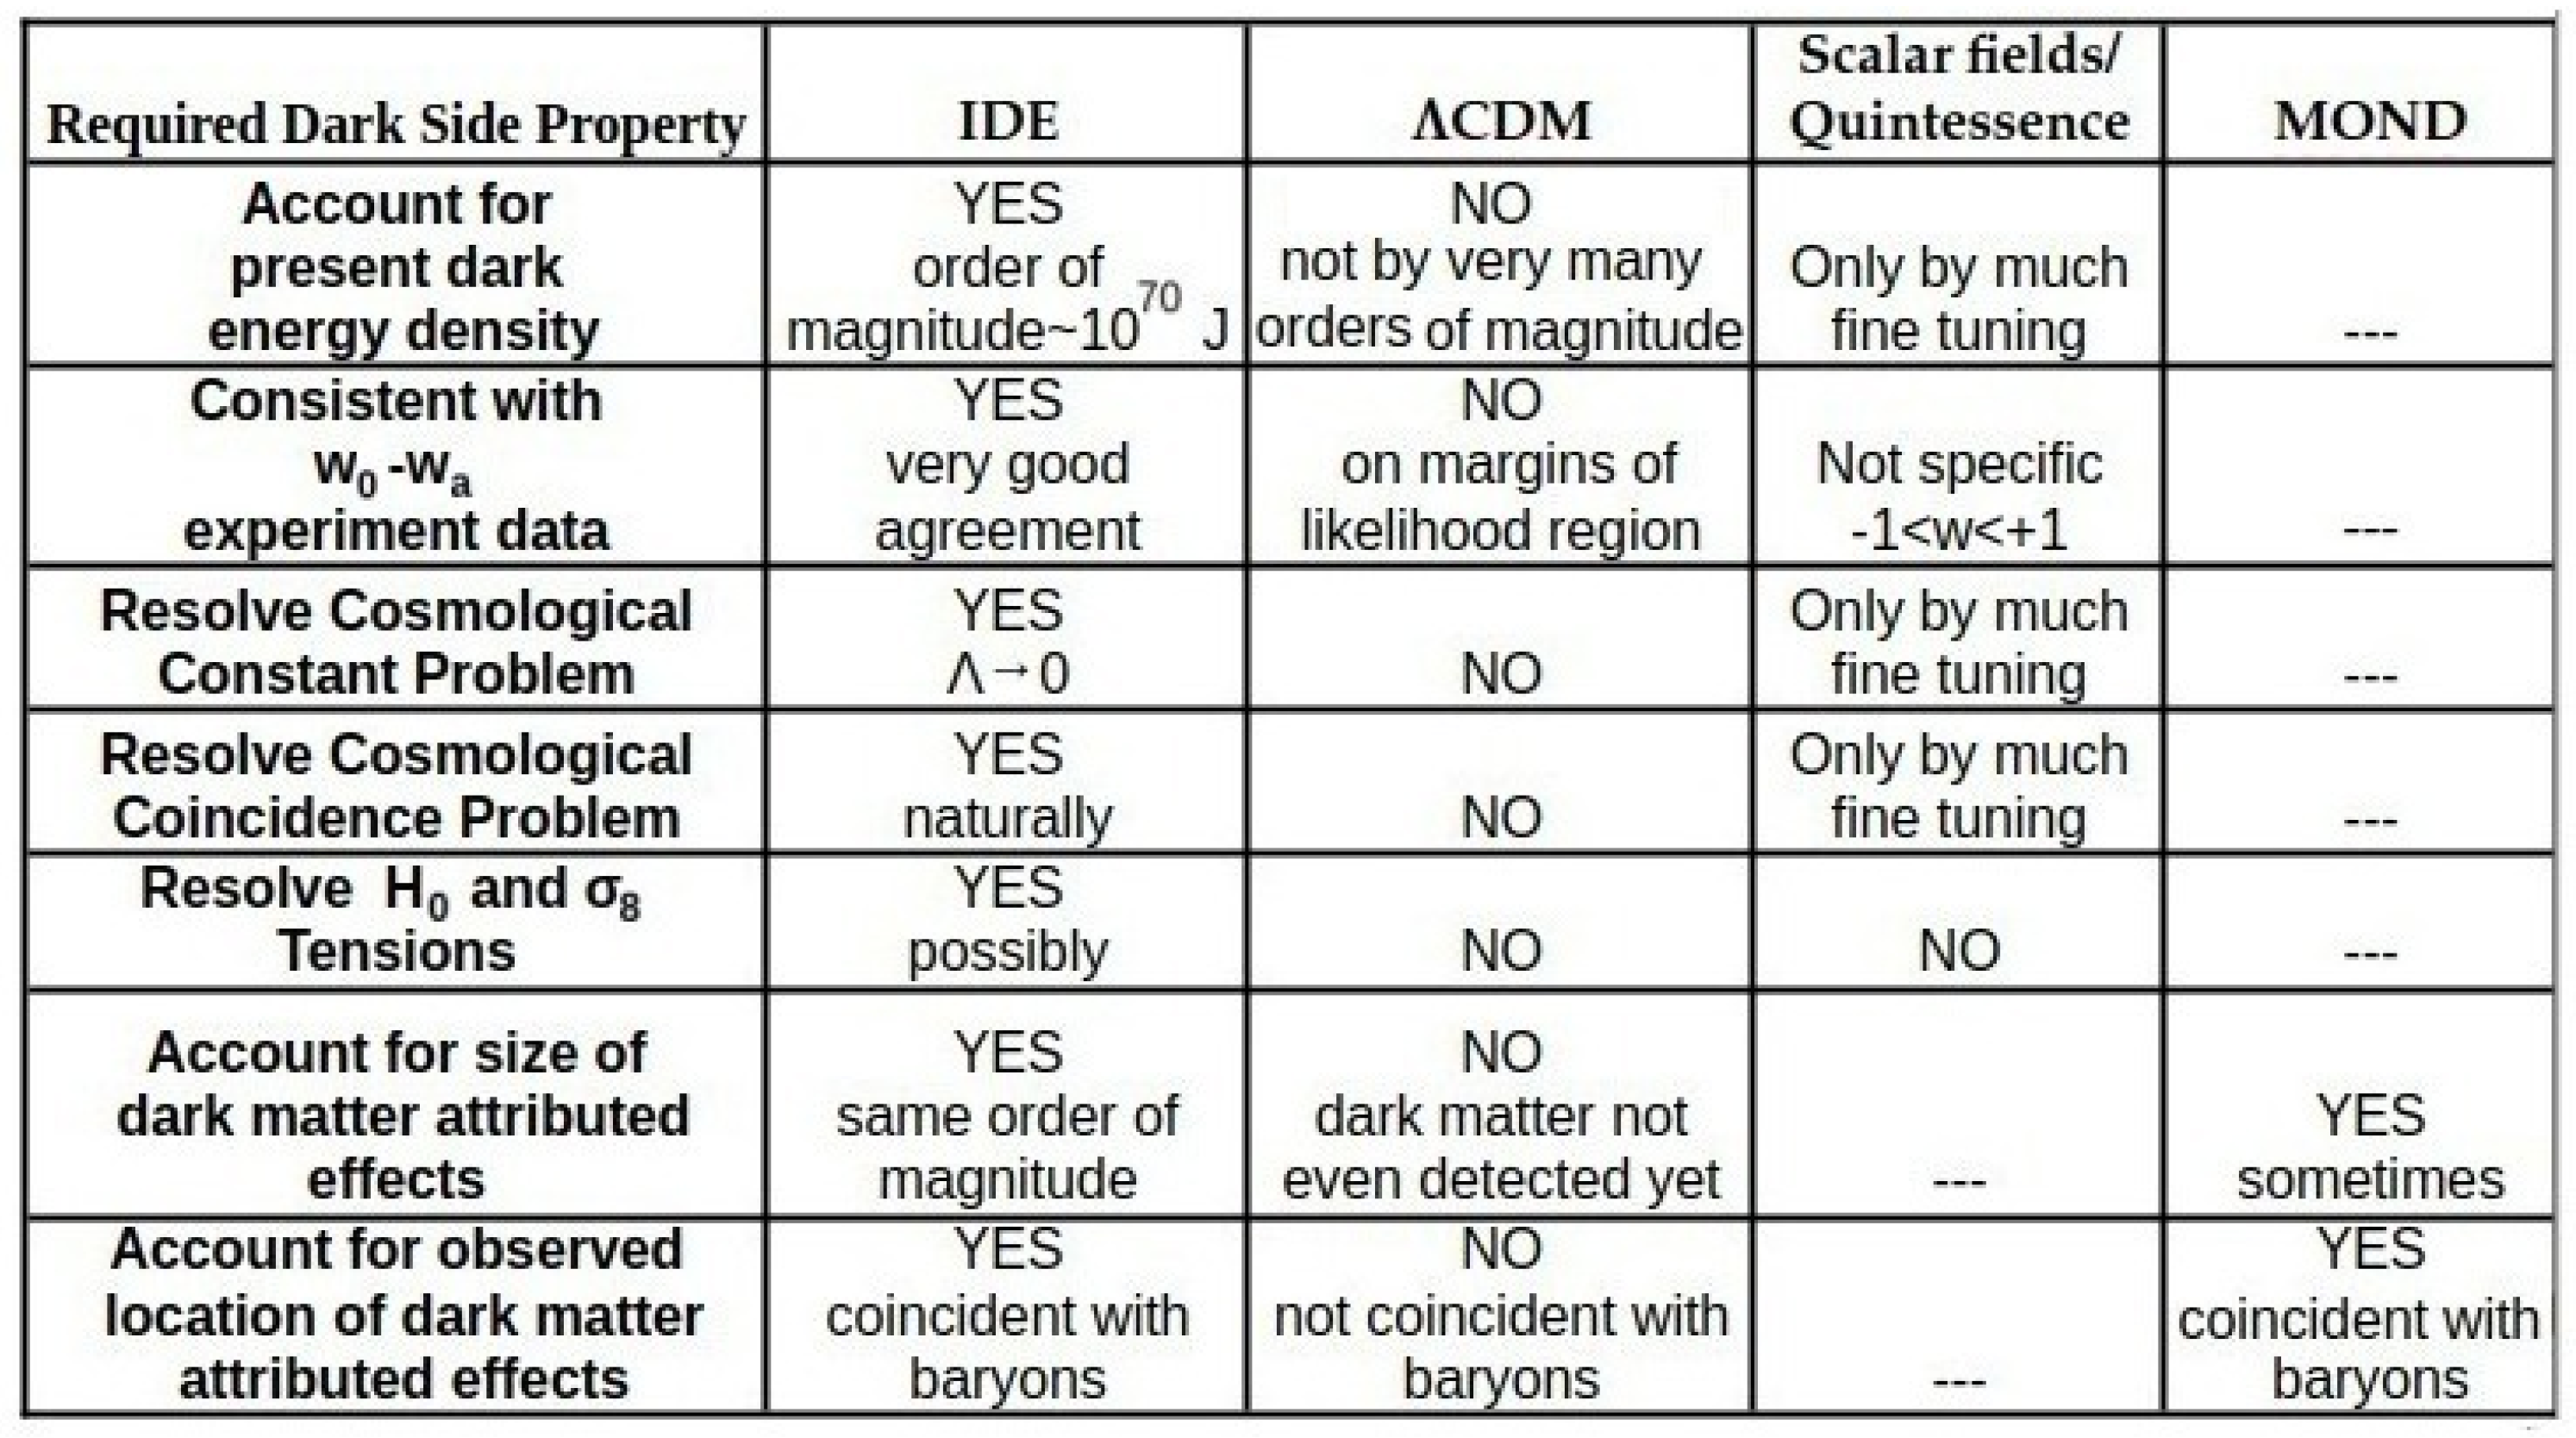
Overall we therefore expect IDE to account for at least some of the effects previously attributed to a dark matter. Then, locally, IDE is attractive like an invisible dark matter, but, universe-wide, IDE is repulsive as a dark energy. These results are summarised in a simplified form, in Table 1, where IDE is compared against other sources of dark energy and dark matter
5. Summary
When compared in w0-wa space, the measured stellar mass density history, SMD(a), makes a very good fit to all measurements of dark energy history. This suggests that dark energy is driven directly by star and structure formation. The preference of fit for k=0 .5 over k=1.0 further suggests that the dark energy density is primarily determined by the temperature of structures at many levels of scale, whether galaxy clusters, galaxies, or stars.
The dark energy dependence on structure formation, in particular with the dependence on temperature, is compatible with an information dark energy, IDE, explanation. Moreover, IDE has the potential to resolve many problems and tensions of ɅCDM: cosmological constant problem; cosmological coincidence problem; Hubble and σ8 tensions; and we expect to account for some dark matter effects.
Funding
This research received no external funding.
Acknowledgments
This work was enabled by the award of Emeritus Professor of Space Science from the University of Sussex.
Conflicts of Interest
The author declares no conflict of interest.
References
- Landauer,R., Irreversibility and heat generation in the computing process, IBM J. Research and Development 1961, 3, 183-191. [CrossRef]
- Landauer, R., Information is physical, Physics Today, 1991, 44 , 23-29. [CrossRef]
- Toyabe, S., Sagawa, T., Ueda,M., Muneyuki,E., Sano,M., Experimental demonstration of information-to-energy conversion and validation of the generalized Jarzynski equality, Nature Physics, 2010, 6, 988-992. [CrossRef]
- Berut, A., Arakelyan,A., Petrosyan, A., Ciliberto,A., Dillenschneider, R., Lutz,E., Experimental verification of Landauer's principle linking information and thermodynamics, Nature , 2012, 483, 187-189. [CrossRef]
- Jun,Y., Gavrilov,M., Bechhoefer, J.,High-PrecisionTest of Landauer's Principle in a Feedback Trap, Phys.Rev. Let. 2014, 113, 190601-1 to -5. [CrossRef]
- Yan, L.I.,et al., Single Atom Demonstration of the Quantum Landauer Principle, Phys.Rev. Let. 2018, 120, 210601. [CrossRef]
- Wheeler, J.A., Ford,K., It from bit in Geons, Black Holes and quantum foam: A life in Physics, New York, Norton. ISBN-13 : 978-0393046427.
- Zeilinger,A., A Foundational Principle of Quantum Mechanics, Foundations of Physics, 1999, 29, 631-643. http://doi.org/10.1023/A:1018820410908.
- Gough,M.P., Carozzi, T., Buckley,A.M., On the similarity of Information Energy to Dark Energy, Physics Essays, 2006, 19, 446-450. [CrossRef]
- Peebles,P.J.E., Principles of Physical Cosmology, 1993, Princeton University Press, Princeton NJ, USA. ISBN 978-0691209814.
- Gough,M.P., Information Equation of State, Entropy, 2008,10, 150-159. [CrossRef]
- Gough,M.P., Holographic Dark Information Energy, Entropy, 2011, 13 , 924-035. [CrossRef]
- Gough,M.P., Holographic Dark Information Energy: Predicted Dark Energy Measurement, Entropy, 2013, 15, 1133-1149. [CrossRef]
- Gough,M.P., A Dynamic Dark Information Energy Consistent with Planck Data, Entropy, 2014, 16, 1902-1916. [CrossRef]
- Gough,M.P., Information Dark Energy can Resolve the Hubble Tension and is Falsifiable by Experiment, Entropy, 2022, 24, 385-399. [CrossRef]
- Frampton, P.H., Hsu,S.D.H., Kephart, T.W., Reeb,D., What is the entropy of the universe? Classical Quantum Gravity, 2009, 26, 145005. 7pp. [CrossRef]
- Egan,C.A., Lineweaver, C.H., A larger estimate of the entropy of the universe, Astrophys. J., 2010, 710, 1825-1834. [CrossRef]
- T'Hooft, G., Obstacles on the way towards the quantization of space, time and matter- and possible solutions, Stud. Hist. Philosophy of Mod. Phys.,2001, 32, 157-180. [CrossRef]
- Susskind, L.,The world as a hologram, J. Math. Phys. 1995, 36, 6377-6396. [CrossRef]
- Buosso, R., The holographic principle, Rev. Mod. Phys. 2002, 74, 825-874. [CrossRef]
- Chevallier,M., Polarski, D., Accelerating universes with scaling dark matter, Int. J. Mod. Phys. 2001, D. 10 , 213-224. [CrossRef]
- Brout,D., et al., The Pantheon+ Analysis: Cosmological Constraints, Astrophysical Journal, 2022, 938:110. [CrossRef]
- DES Collaboration, The Dark Energy Survey: Cosmology Results with ~1500 new High-redshift Type 1a Supernovae using the full 5-year Dataset, Astrophys.J. Lett, 2024, 973, L14. [CrossRef]
- DESI Collaboration, DESI 2024 VI: Cosmological Constraints from the Measurements of Baryon Acoustic Oscillations, 2024, Arxiv 2404.03002, submitted to JCAP. [CrossRef]
- Li,C., White, S.D.M., The distribution of stellar mass in the low-redshift universe, Mon. Not. R. Astron. Soc. , 2009, 398 , 2177-2187. [CrossRef]
- Gallazzi,A., Brinchmann, J., Charlot, S., White, S.D.M., A census of metals and baryons in stars in the local universe, Mon. Not. R. Astron. Soc. 2008, 383, 1439-1458. [CrossRef]
- Moustakas,J., et al., PRIMUS: constraints on star formation quenching and Galaxy merging and the evolution of the stellar mass function from z=0-1, Astrophys. J. , 2013, 767, 50. 34pp. [CrossRef]
- Bielby,R., et al., The WIRCam Deep Survey. I. Counts, colours, and mass functions derived from near-infrared imaging in the CFHTLS deep fields, Astron. Astrophys. 2012, 545, A23. 20pp. [CrossRef]
- Perez-Gonzalez,P.G., et al., The stellar mass assembly of galaxies from z=0-4: analysis of a sample selected in the rest-frame near infrared with Spitzer, Astrophys. J.,2008, 675, 234-261. [CrossRef]
- Ilbert,O., et al., Mass assembly in quiescent and star-forming Galaxies since z >4 from UltraVISTA, Astron.Astrophys. 2013, 556, A55. 19pp. [CrossRef]
- Muzzin,A., et al., The evolution of the stellar mass functions of star-forming and quiescent galaxies to z=4 from the COSMOS/UltraVISTA survey, Astrophys. J. , 2013, 777 , 18. 30pp. [CrossRef]
- Arnouts,S., et al., The SWIRE-VVDS-CFHTLS surveys: Stellar Assembly over the last 10Gyr Astron.Astrophys. 2007, 476, 137-150. [CrossRef]
- Pozzetti,L., et al., zCOSMOS -10k bright spectroscopic sample. The bimodality in the galaxy stellar mass function, Astron. Astrophys. 2010, 523, A13. 23pp. [CrossRef]
- Kajisawa,M., et al., MOIRCS deep survey IV evolution of galaxy stellar mass function back to z 3, Astrophys. J. 2009, 702, 1393-1412. [CrossRef]
- Marchesini,D., van Dokkum, P.G., Forster Schreiber,N.M., Franx, M., Labbe, I., Wuyts, S., The evolution of the stellar mass function of galaxies from z=4 and the first comprehensive analysis of its uncertainties, Astrophys. J. 2009, 701, 1765-1769. [CrossRef]
- Reddy,N.A., et al., GOODS-HERSCHEL measurements of the dust attenuation of typical star forming galaxies at high redshift, Astrophys. J. 2012, 744 , 154. 17pp. [CrossRef]
- Caputi, K.J., Cirasuolo, M., Jdunlop,J.S., McLure, R.J., Farrah,D., Almaini, O.,The stellar mass function of the most massive Galaxies at 3<z<5 in the UKIDSS Ultra Deep Survey, Mon. Not. R. Astron. Soc. 2011, 413 , 162-176. [CrossRef]
- Gonzalez, V., Labbe,I., Bouwens, R.J., Illingworth,G., Frank,M., Kriek M., Evolution of galaxy stellar mass functions, mass densities, and mass-to light ratios from z 7 to z 4, Astrophys. J. 2011, 735, L34. 6pp. [CrossRef]
- Lee ,K.S., et al., How do star-forming galaxies at z>3 assemble their masses?, Astrophys. J. 2012, 752, 66, 21pp. [CrossRef]
- Cole,S., al., The 2dF galaxy redshift survey, Mon. Not. R. Astron. Soc. 2001, 326, 255-273. [CrossRef]
- Dickinson,M., Papovich,C., Ferguson, H.C., Budavari,T., The evolution of the global stellar mass density a 0 < z < 3, Astrophys. J. 2003, 587, 25-40. [CrossRef]
- Rudnick,G., et al., The rest-frame optical luminosity density, colour, and stellar mass density of the universe from z = 0 to z = 3., Astrophys. J. 2003, 599, 847-864. [CrossRef]
- Brinchmann,J., Ellis, R.S.,The ma.ss assembly and star formation characteristics of field galaxies of known morphology, Astrophys. J. 2000, 536 , L77-L80. [CrossRef]
- Elsner,F., Feulner,G., Hopp, U.,The impact of Spitzer infrared data on stellar mass estimates, Astron. Astrophys. 2008, 477, 503-512. [CrossRef]
- Drory,N., Salvato,M., Gabasch,A., Bender, R., Hopp, U., Feuler,G., Pannella, M.,The stellar mass function of galxies to z 5, Astrophys. J. 2005, 619, L131-L134. [CrossRef]
- Drory, N., Alvarez,M., The contribution of star formation and merging to stellar mass buildup in galaxies, Astrophys.J. 2008, 680, 41-53. [CrossRef]
- Fontana,A., et al., The assembly of massive galaxies from near Infrared observations of Hubble deep-field south, Astrophys. J. 2003, 594, L9-L12. [CrossRef]
- Fontana,A., et al., The galaxy mass function up to z=4 in the GOODS-MUSIC sample, Astron. Astrophys. 2006, 459, 745-757. [CrossRef]
- Cohen, J.G., CALTECH faint galaxy redshift survey, Astrophys. J. 2002, 567, 672-701. [CrossRef]
- Conselice, C.J., Blackburne,J.A., Papovich,C., The luminosity, stellar mass, and number density evolution of field galaxies, Astrophys. J. 2005, 620, 564-583. [CrossRef]
- Borch,A., et al., The stellar masses of 25000 galaxies at 0.2<z < 1.0 estimated by COMBO-17 survey, Astron. Astrophys. 2006, 453 , 869-881. [CrossRef]
- Madau, P., Dickinson, M., Cosmic Star Formation History, Ann. Rev. Astron. Astrophys. 2014, 52, 415-486. [CrossRef]
- Friedmann, A. On the Curvature of Space, Gen. Relativ. Gravit ,1999, 31,1991.
- Ade P. et al., Plank Collaboration. Planck 2013 results. XVI. Cosmological parameters, Astron. Astrophys. 2014, 571, A16, 66pp. [CrossRef]
- Ade P. et al., Plank Collaboration. Planck 2015 results. XIII. Cosmological parameters, Astron. Astrophys. 2016, 594, A13, 63pp. [CrossRef]
- Plank Consortium, Aghanim.N. et al., Planck 2018 results. VI, Cosmological Parameters, Astron. Astrophys. 2020, 641, A6, 67pp. [CrossRef]
- Voit, G.M., Tracing cosmic evolution with clusters of galaxies, Reviews of Modern Physics, 2005, 77, 207-258. [CrossRef]
- Basu,B., and Lynden-Bell,D., A survey of entropy in the universe, Q. Jl., R. Astr. Soc., 1990, 31, 359-369. ISSN 0035-8738.
- Babyk,I.V., McNamara,B.R., The Halo Mass-Temperature Relation for Clusters, Groups, and Galaxies, Astrophysical Journal, 2023, 946, 54. [CrossRef]
- Guzzo, L.; Pierleoni, M.; Meneux, B.; Branchini, E.; LeFevre, O.; Marinoni, C.; Garilli, B.; Blaizot, J.; DeLucia, G.; Pollo, A.; et al. A test of the nature of cosmic acceleration using galaxy redshift distortions. Nature 2008, 451, 541. [CrossRef]
- Frieman,J.A.,Turner, M.S., Huterer,D., Dark energy and the accelerating universe. Ann.Rev.Astron.Astrophys. 2008,46,385. [CrossRef]
- Weinberg, S.,The cosmological constant problem, Rev. Mod. Phys. 1989, 61, 1-23. [CrossRef]
- Benevento,G., Hu,W., Raven,M., Can late dark energy raise the Hubble constant?, Phys. Rev. D, 2020, 101, 103517-1-7. [CrossRef]
- Keeley,R., Joudaki,S., Kaplinghat, M., Kirkby,D., Implications of a transition in the dark energy equation of state for the H0 and σ8 tensions, J. Cosmol. Astropart. Phys. 2019, 12, 035. [CrossRef]
- Peracaula,J.S., Gomez-Valent,A., De Cruz Perez,J., Moreno-Pulido,C., Running vacuum against the H0 and σ8 tensions, Exploring the Frontiers of Physics, 2021, 134, 19001. p1-p7. [CrossRef]
- Aalbers, J., et al, First constraints on WIMP-nucleon effective field theory couplings in an extended energy region from LUX-ZEPLIN, Phys. Rev. D, 2024, 109, 092003-1 to -17. [CrossRef]
- McGaugh, S.S., Lelli,F., Schombert, J.M.,The Radial Acceleration Relation in Rotationally Supported Galaxies, Phys. Rev. Lett. 2016, 117, 201101-1 to -6. [CrossRef]
- Lelli,F., McGaugh,S.S., Schombert, J.M., Pawlowski, M.S.,One Law to Rule them all: the Radial Acceleration relation of Galaxies, Astrophys. J. 2017, 836, 152. 23pp. [CrossRef]
- Viola,M., et al.,Dark matter halo properties of GAMA galaxy groups from 100 square degrees of KiDS weak lensing data, Mon. Not. R. Astron. Soc. 2015, 452, 3529-3550. [CrossRef]
- Markevich,M., Gonzalez,A.H., Clowe,D., Vikhlinin,A., Forman, W., Jones, C., Murray, S., Tucker,W., Direct constraints on the dark matter self-interaction cross-section from the merging galaxy cluster, Astrophys. J. 2004, 606, 819-824. [CrossRef]
- Harvey,D., Massey,R., Kitching, T., Taylor, A., Tittley,E., The non gravitational interactions of dark matter in colliding galaxy clusters, Science 2015, 347, 1462-1465. [CrossRef]
- Massey,R., et al. The behaviour of dark matter associated with four bright Cluster galaxies in the 10kpc core of Abell 3827, Mon. Not. R. Astron. Soc. 2015, 449, 3393-3406. [CrossRef]
Figure 1.
Survey of 121 measurements of stellar mass density measurements. Data sources:[25,26,27,28,29,30,31,32,33,34,35,36,37,38,39,40,41,42,43,44,45,46,47,48,49,50,51].
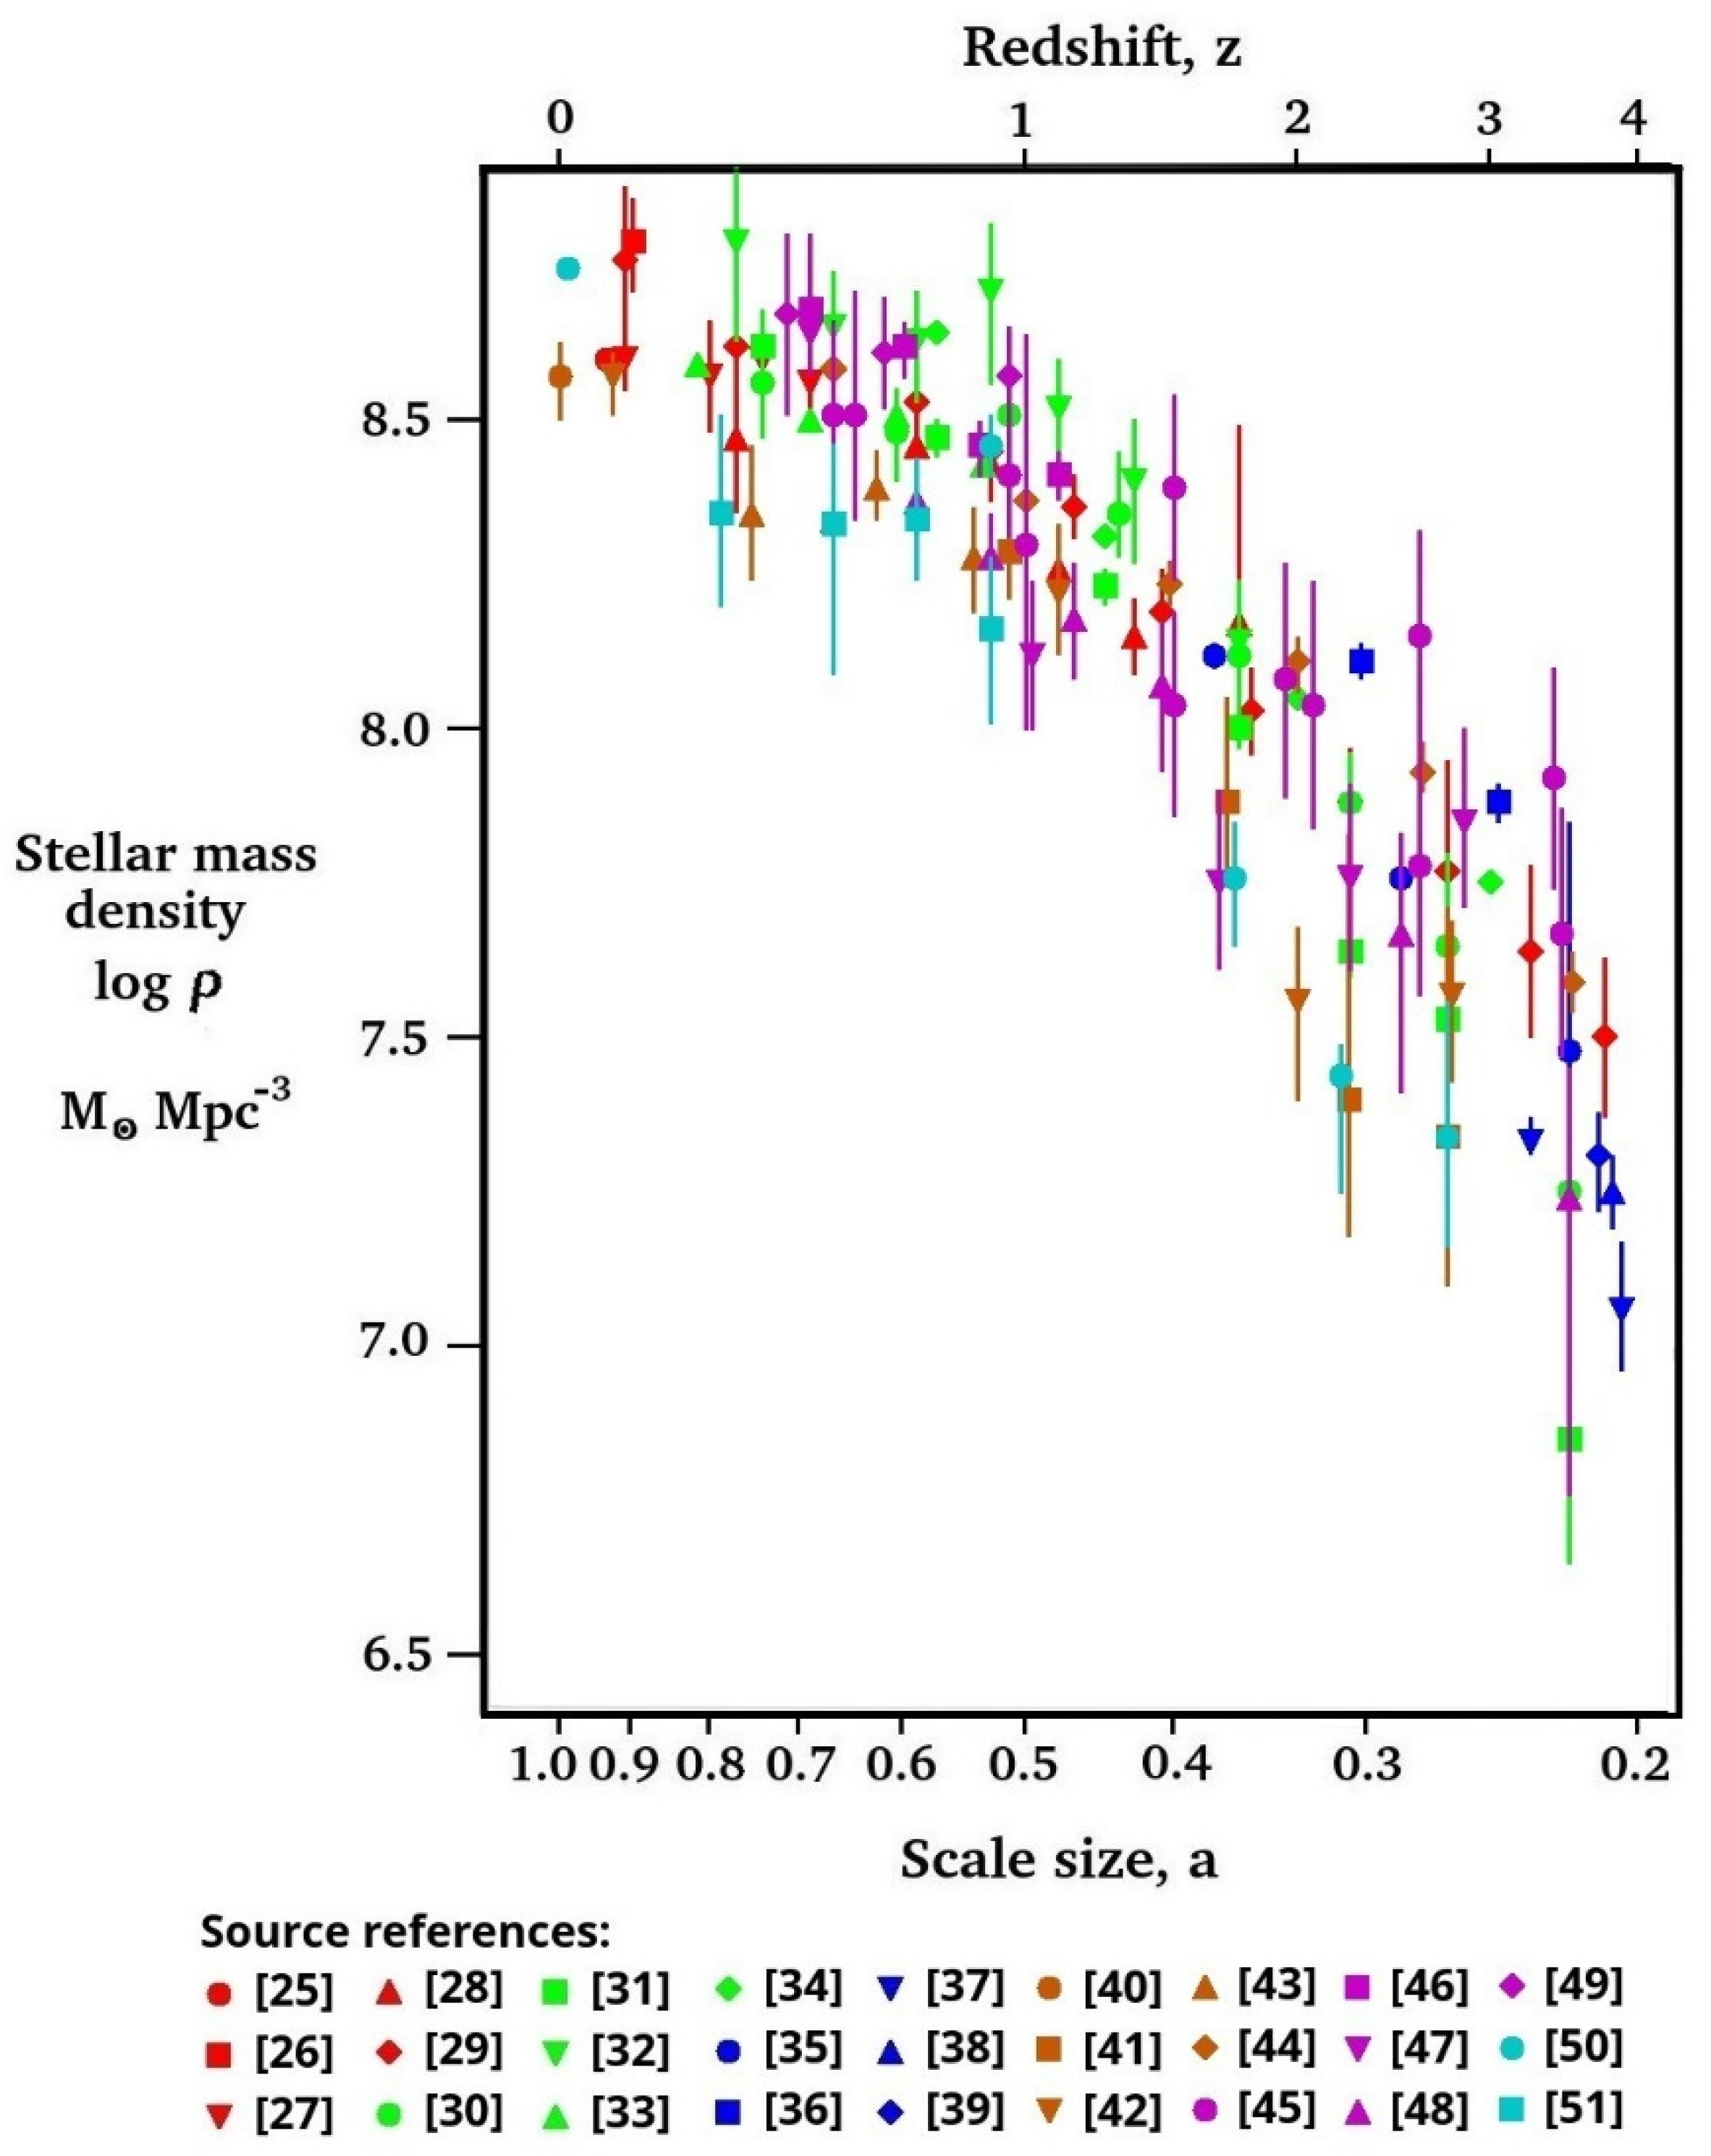
Figure 2.
Measured stellar mass densities[25-51} plotted against universe scale size. The red curves correspond to the CPL best fit parameters: w0= -0.90 wa= -1.49, for k=+1.0, and w0= -0.94 wa= -0.76, for k=+0.5.
Figure 2.
Measured stellar mass densities[25-51} plotted against universe scale size. The red curves correspond to the CPL best fit parameters: w0= -0.90 wa= -1.49, for k=+1.0, and w0= -0.94 wa= -0.76, for k=+0.5.
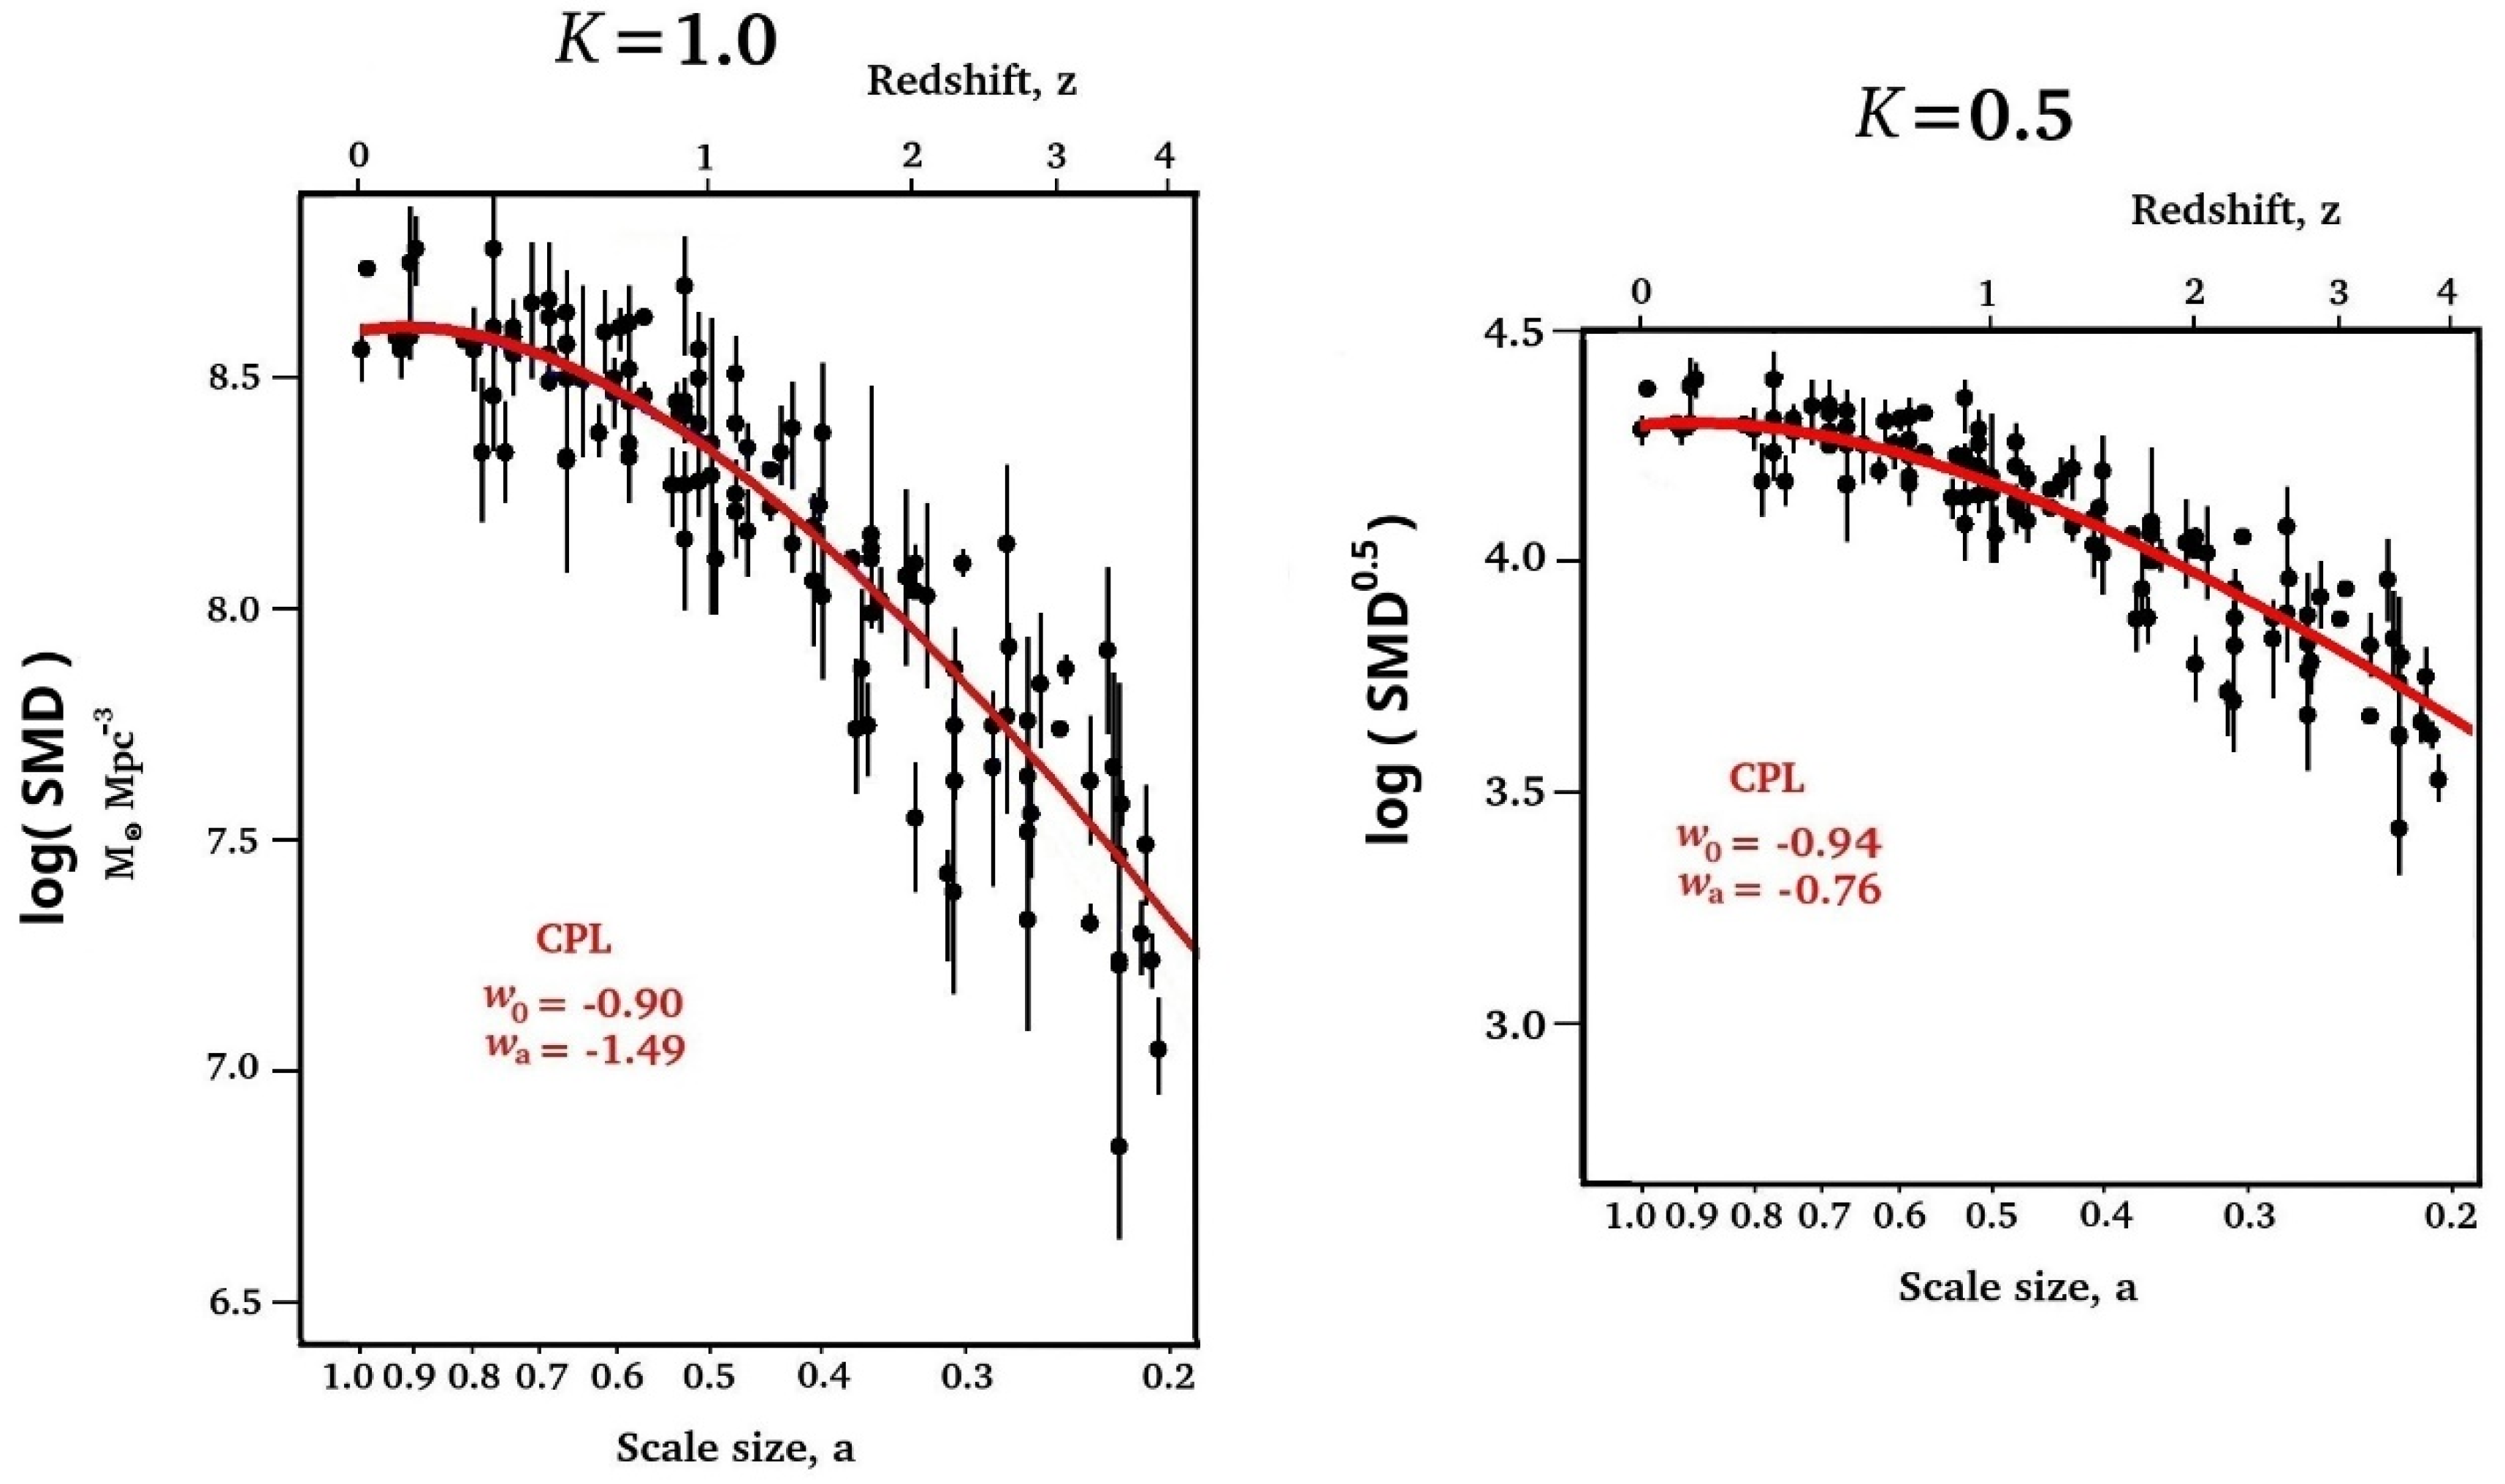
Figure 3.
Identical plots of SMD measurements predicted by the best fit CPL parameters against measured stellar mass densities at the same scale size, for k=+1.0 and 0.5. Both plots show a Pearson correlation, r = 0.92.
Figure 3.
Identical plots of SMD measurements predicted by the best fit CPL parameters against measured stellar mass densities at the same scale size, for k=+1.0 and 0.5. Both plots show a Pearson correlation, r = 0.92.
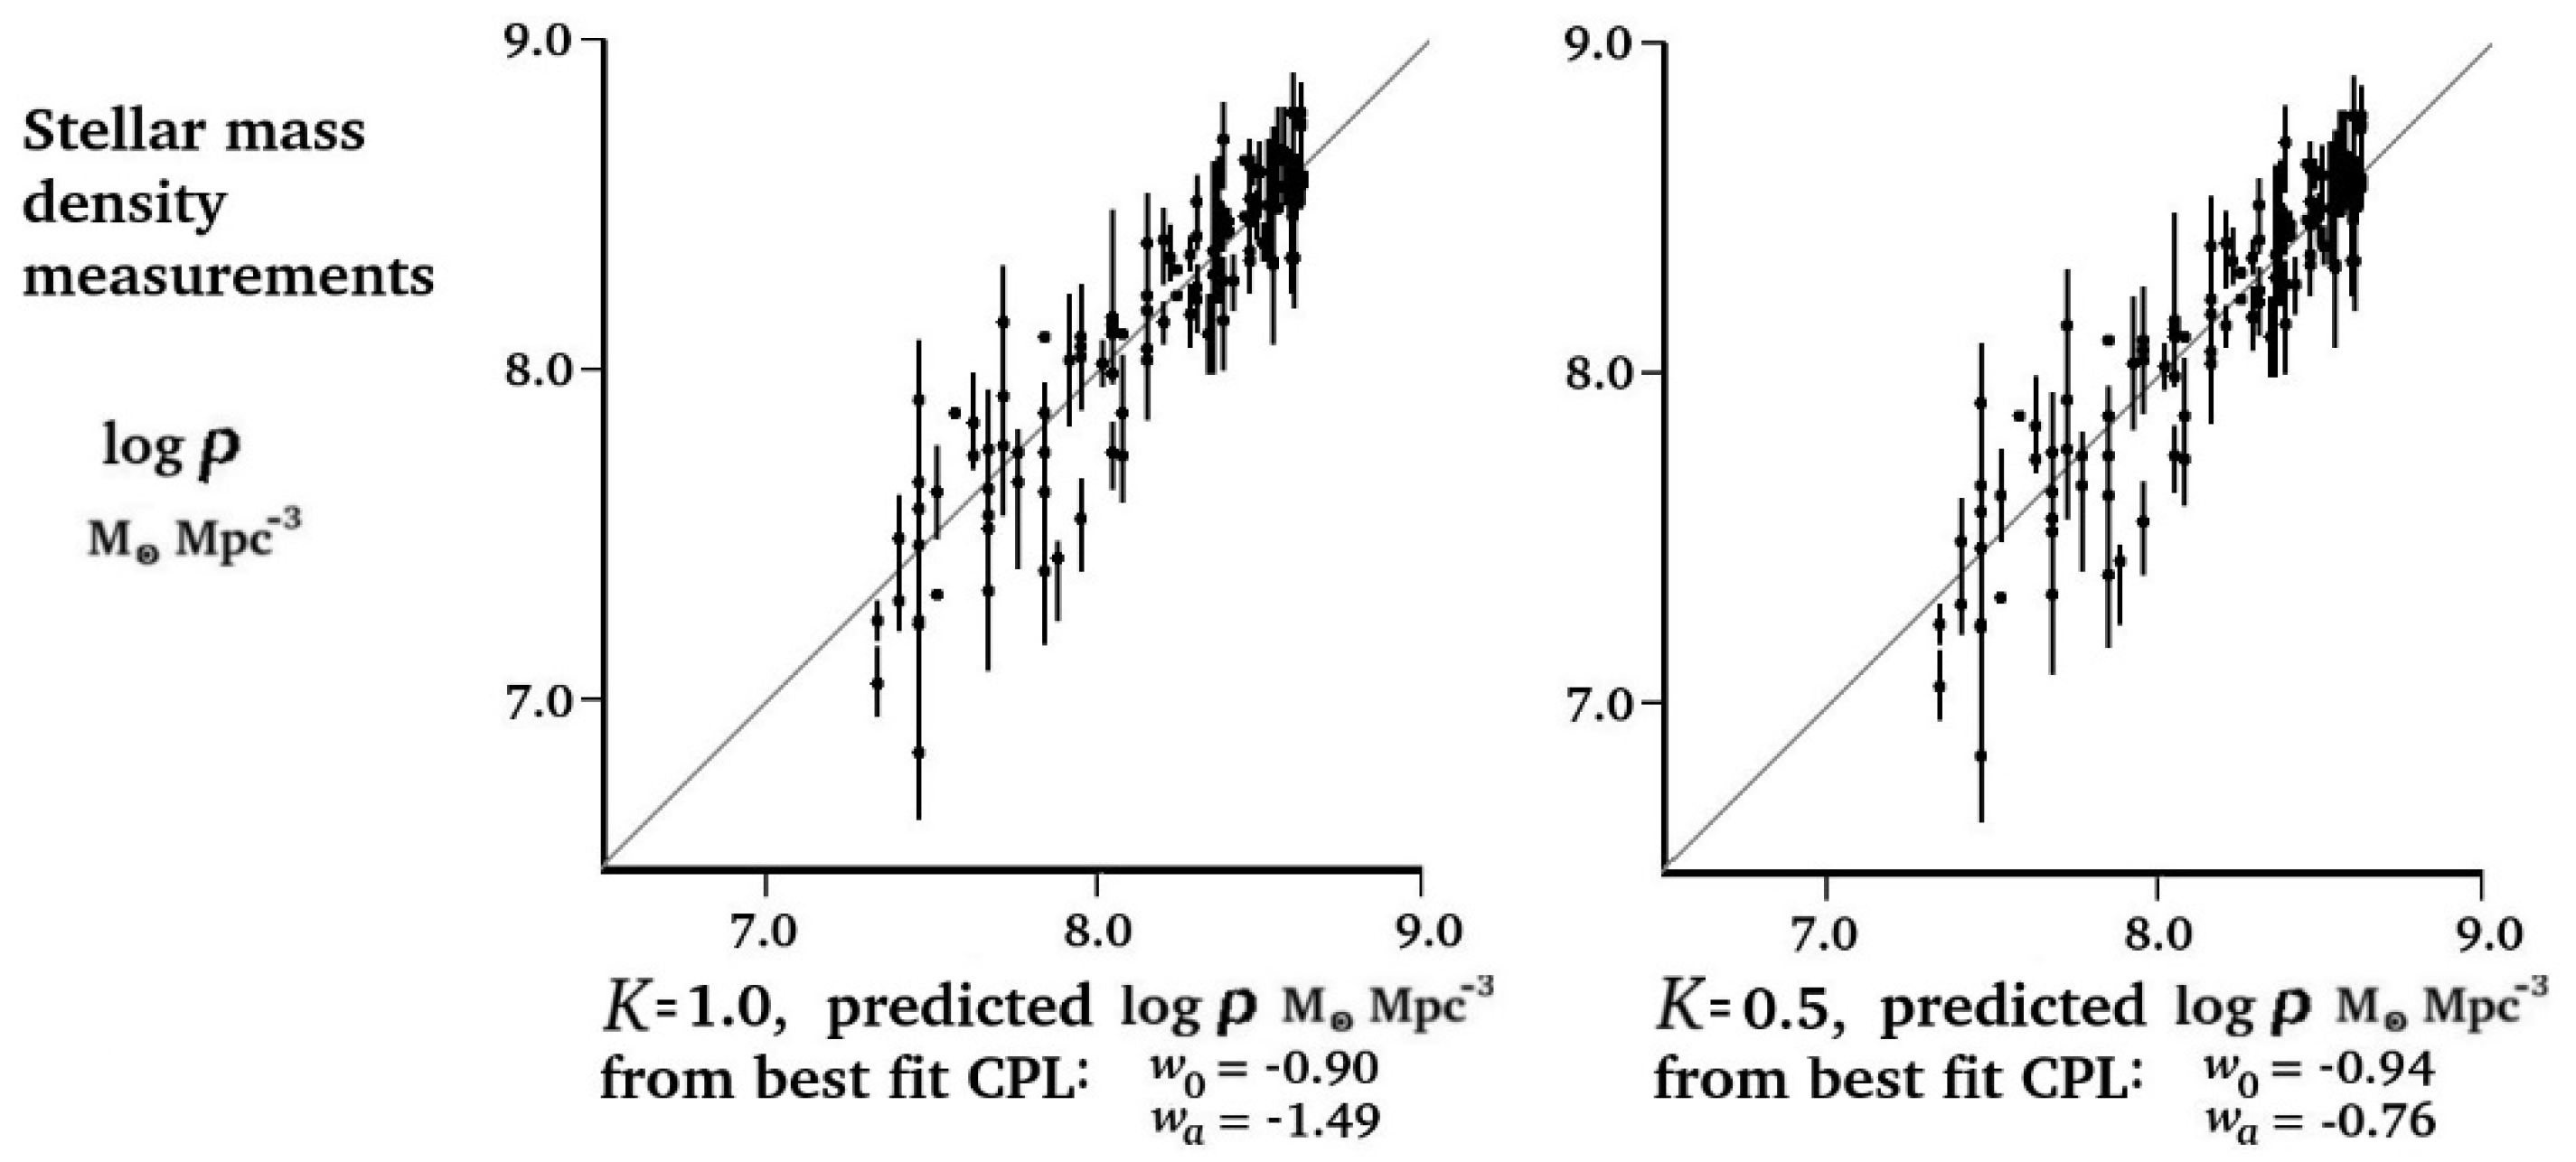
Figure 4.
Plot of SMD(a)k measurement maximum R2 coefficient of determination values in w0-wa parameter space in parameter steps of 0.01 for k=+1.0 and k=+0.5.
Figure 4.
Plot of SMD(a)k measurement maximum R2 coefficient of determination values in w0-wa parameter space in parameter steps of 0.01 for k=+1.0 and k=+0.5.
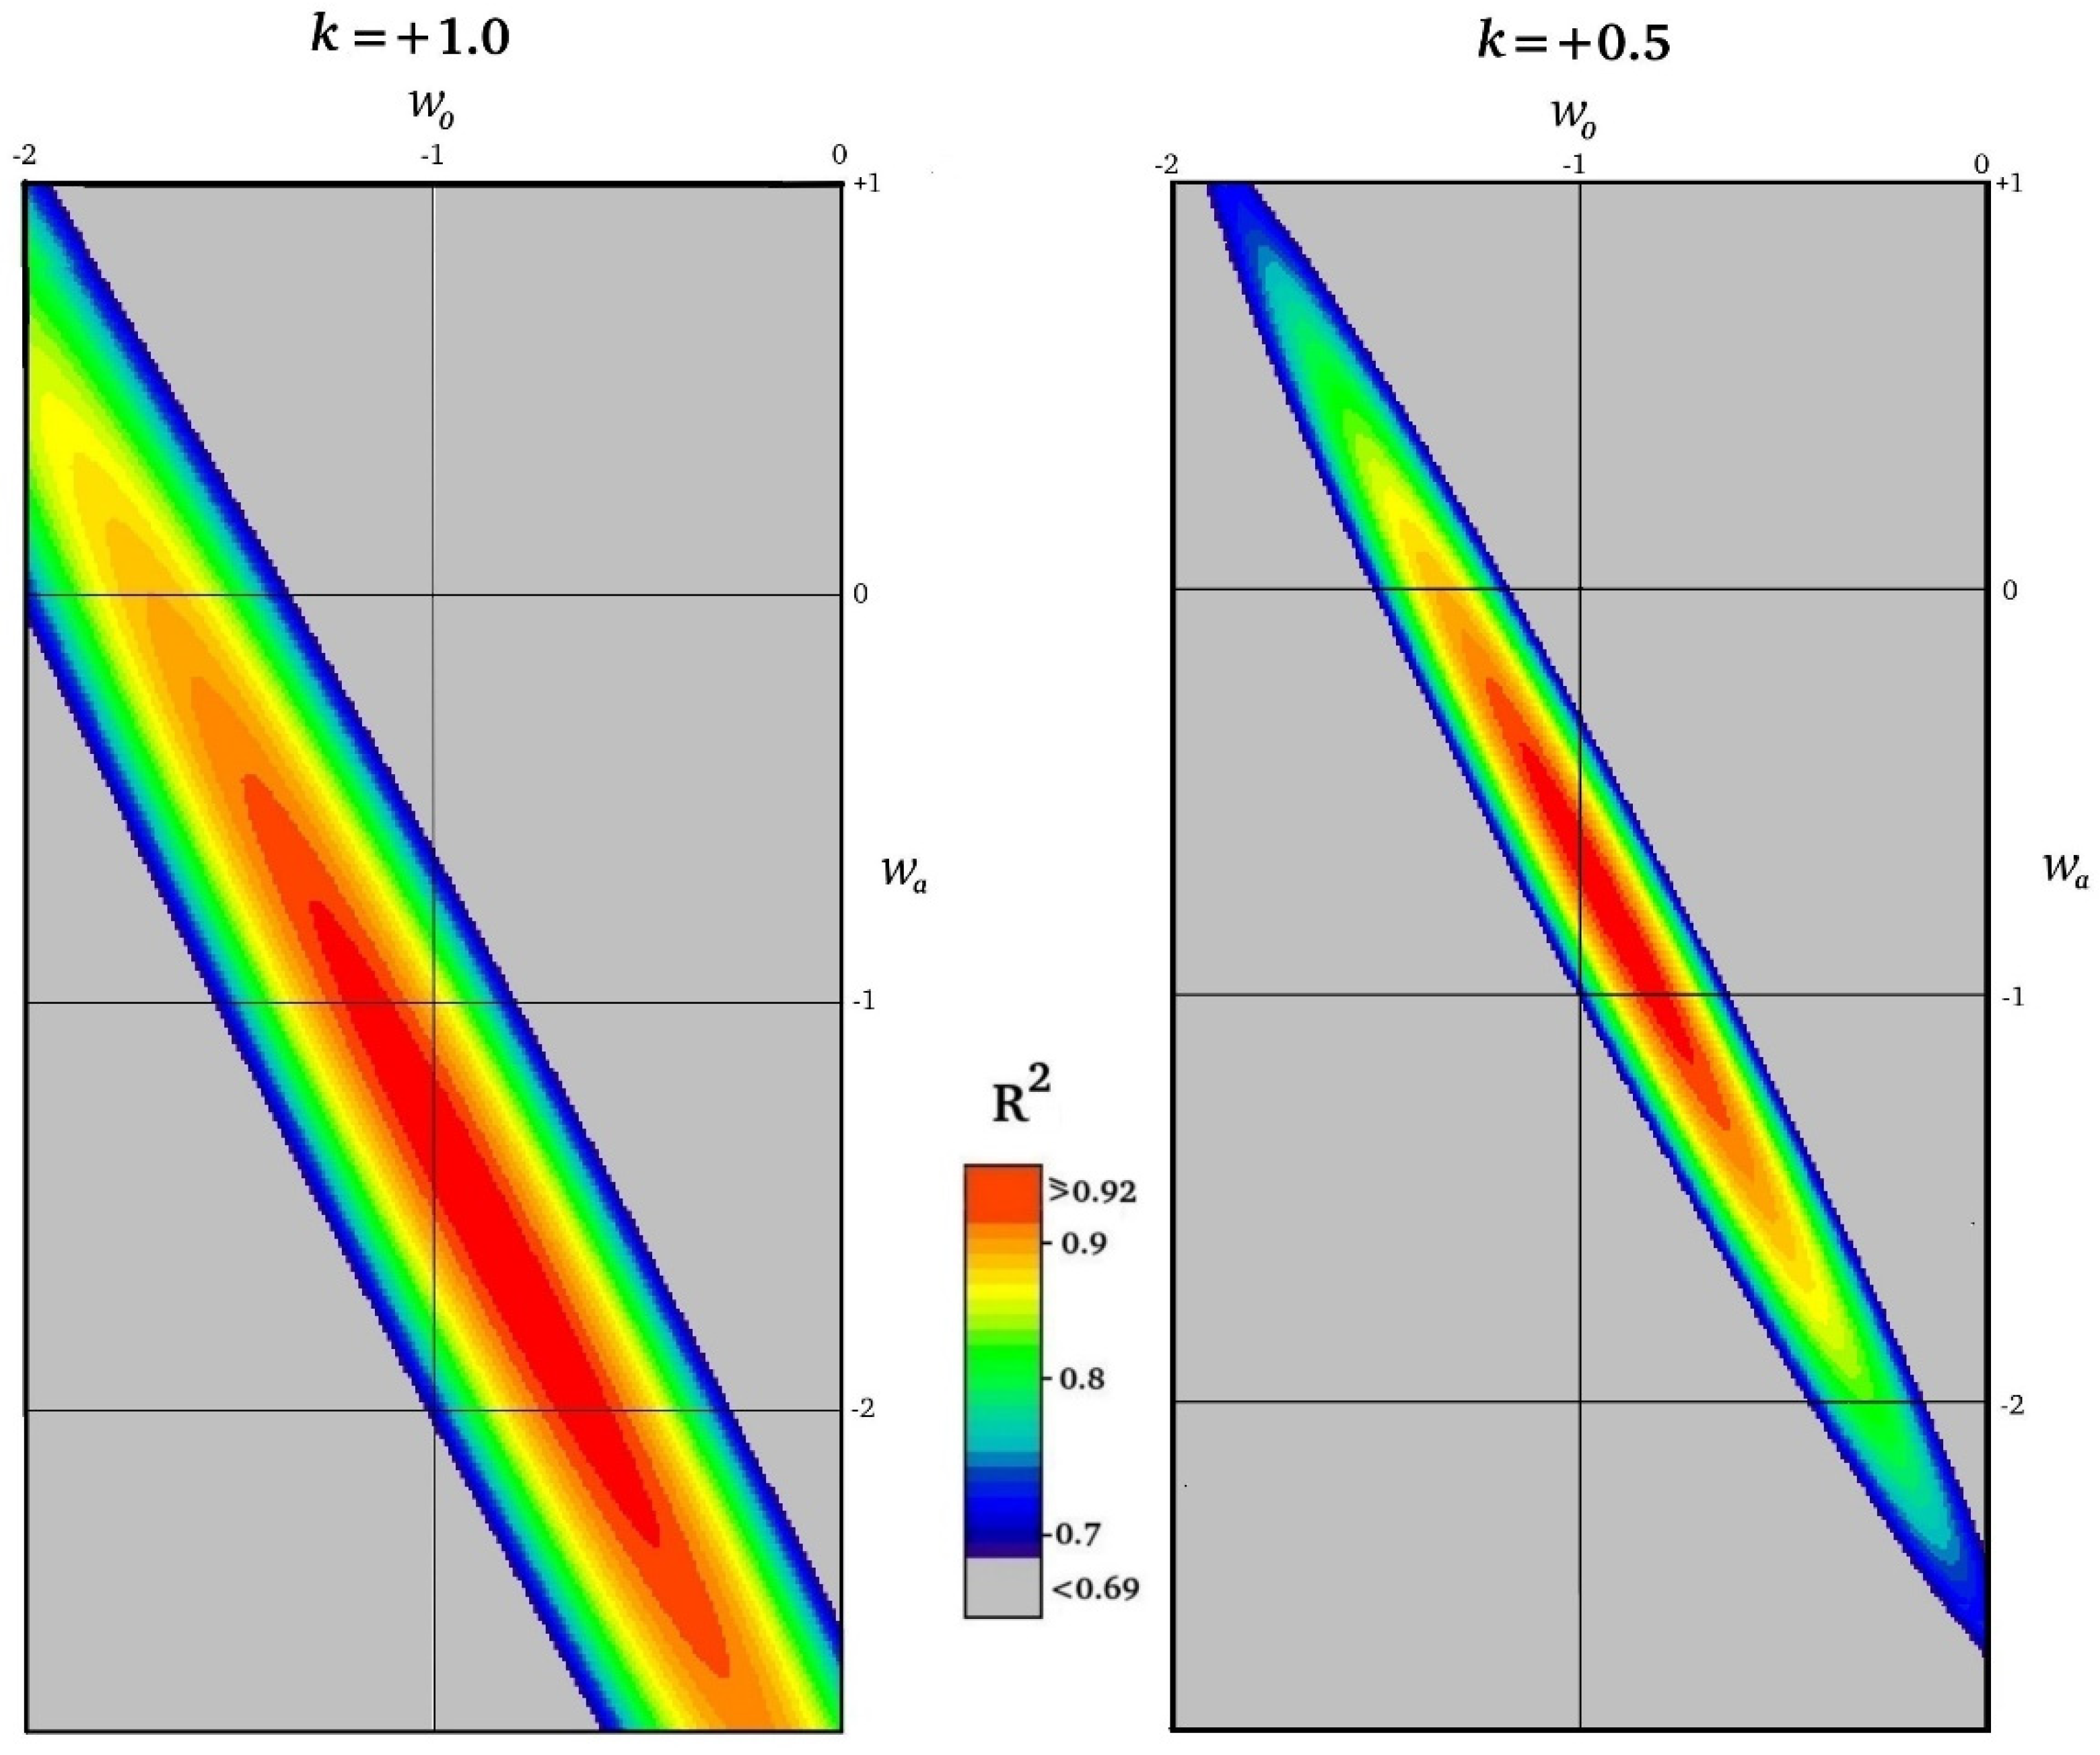
Figure 5.
Information Dark Energy predicted contribution for k=1.0 and k=0.5, compared in w0-wa space with Planck results. Data sources: Planck 2013, Figure 36 of [54] ; Planck 2015, Figure 25 of [55] ; Planck 2018, Figure 30 of [56].
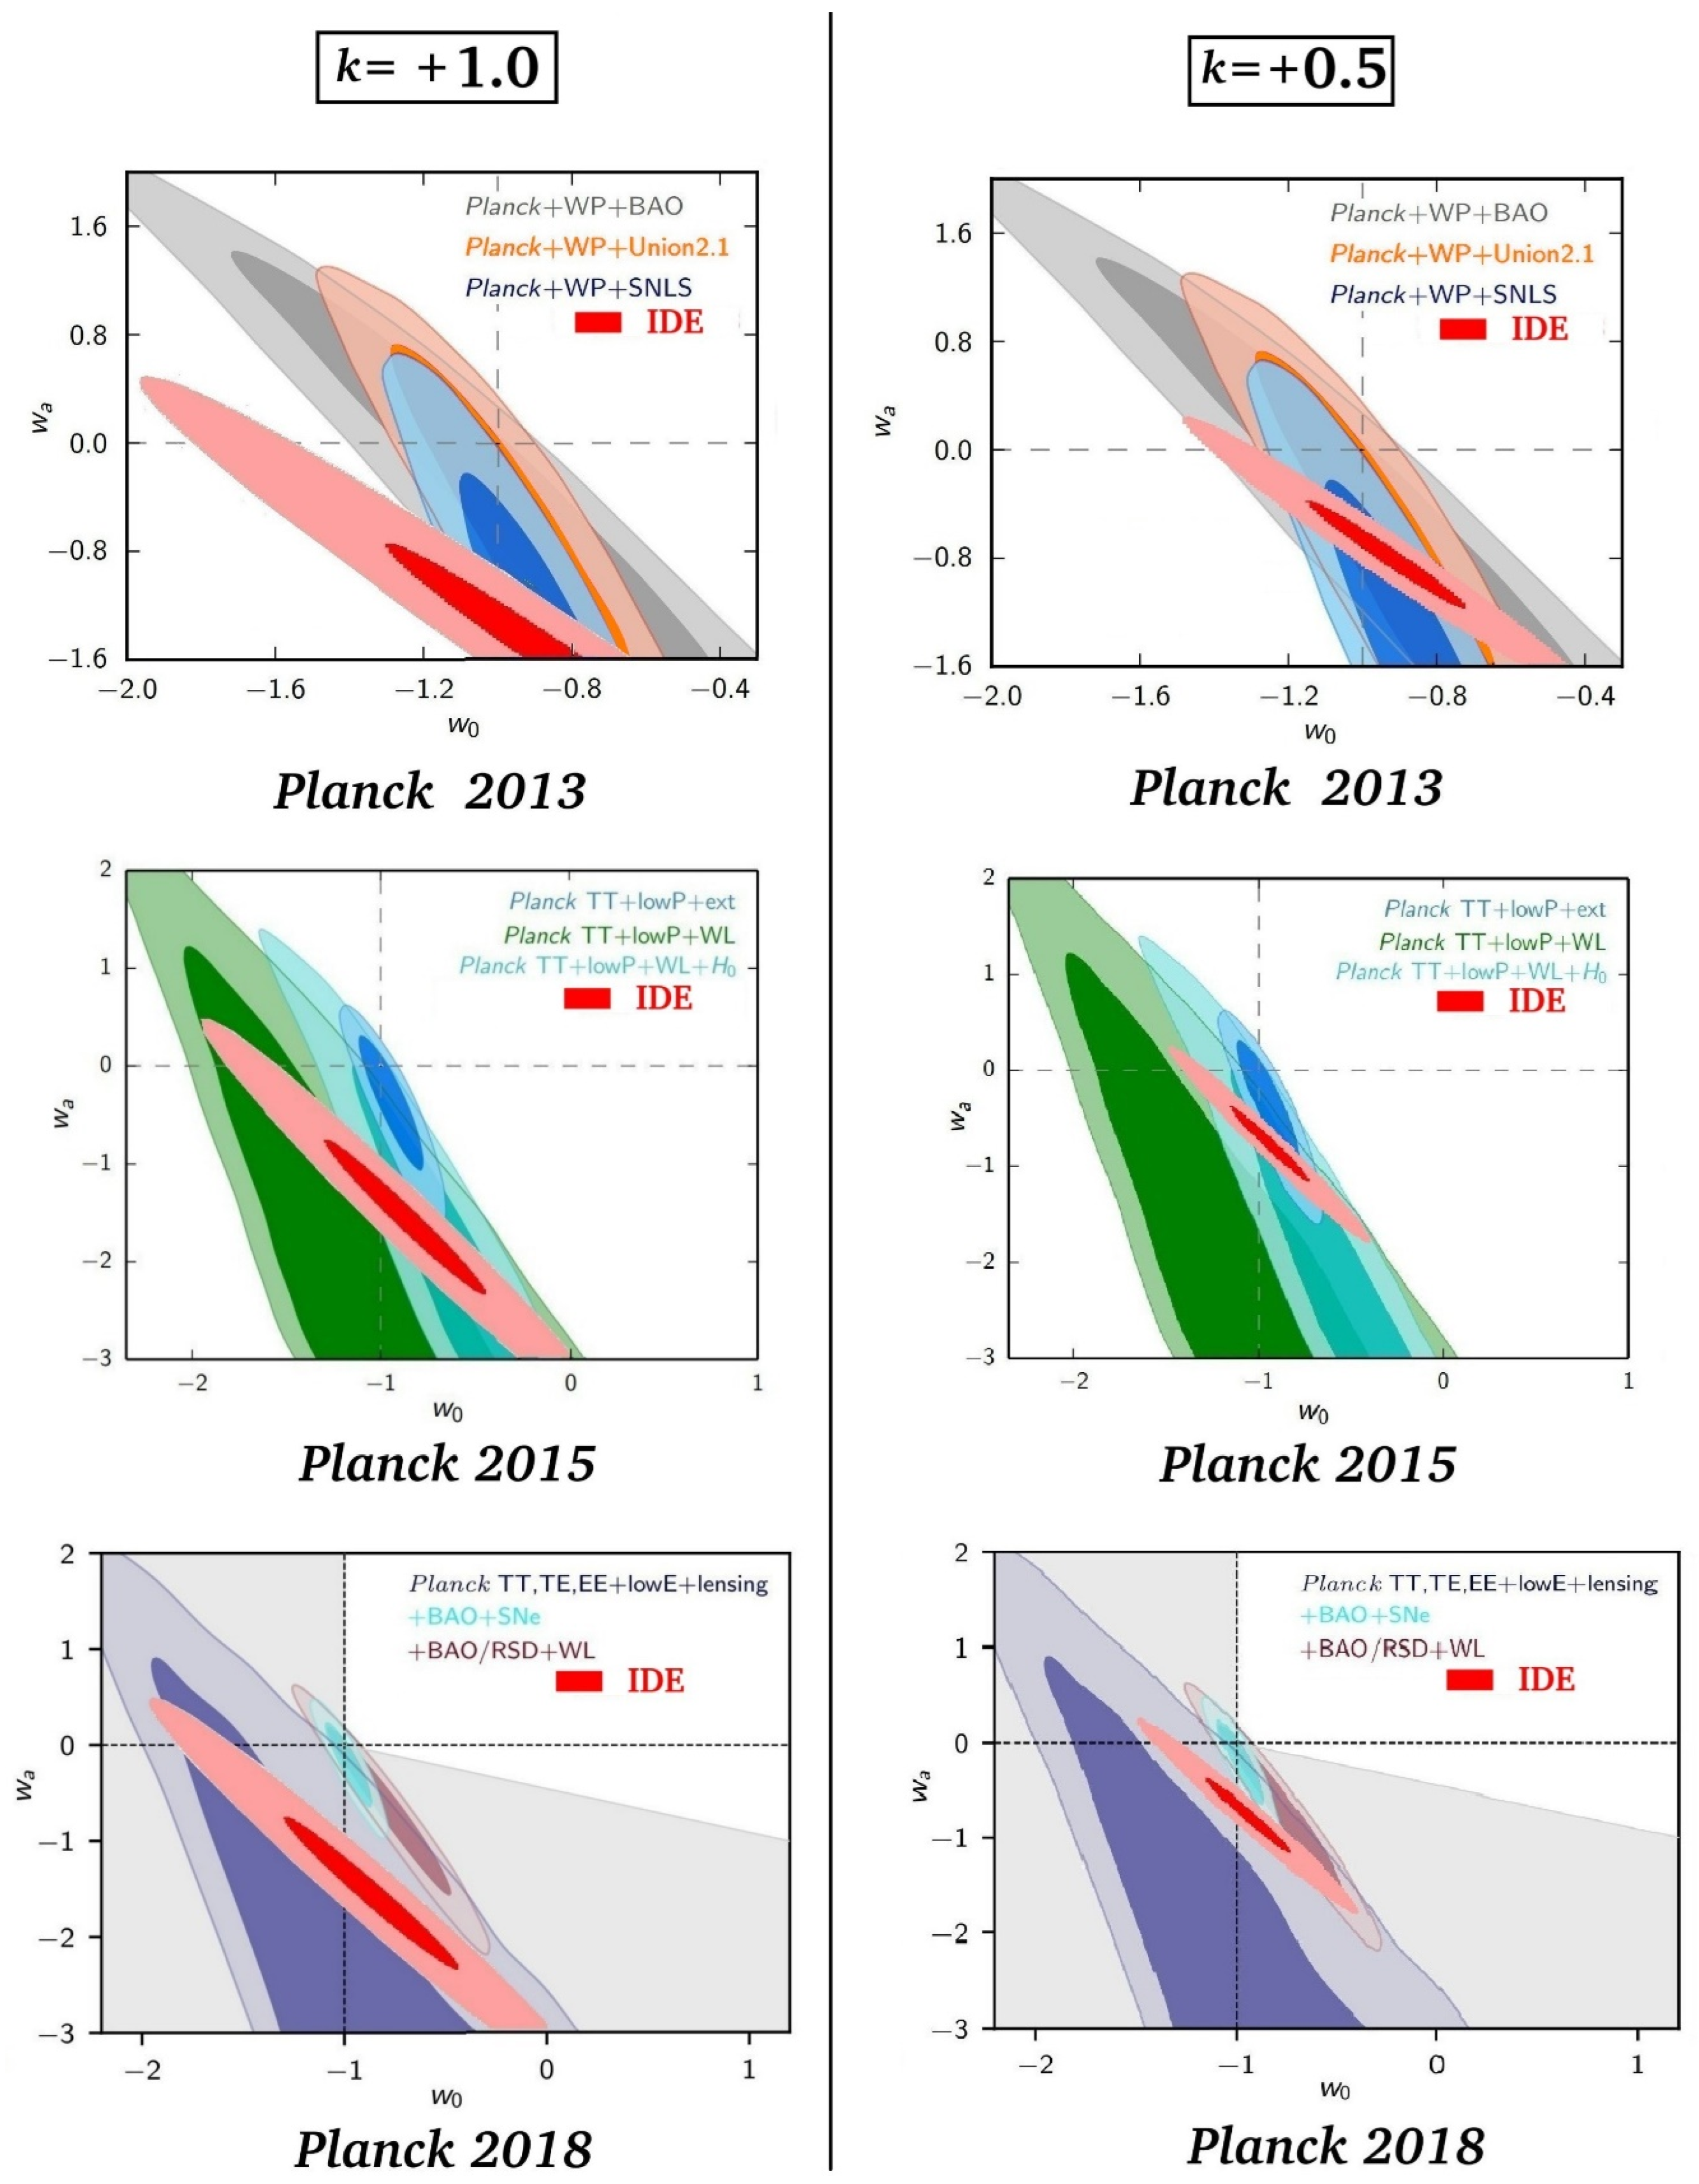
Figure 6.
Information Dark Energy predicted contribution for k=1.0 and k=0.5, compared in w0-wa space with Pantheon 2022 and Dark Energy Survey 2024 results. Data sources: Pantheon+, Figure 12 of [22] ; Dark Energy Survey, Figure 8 of [23].
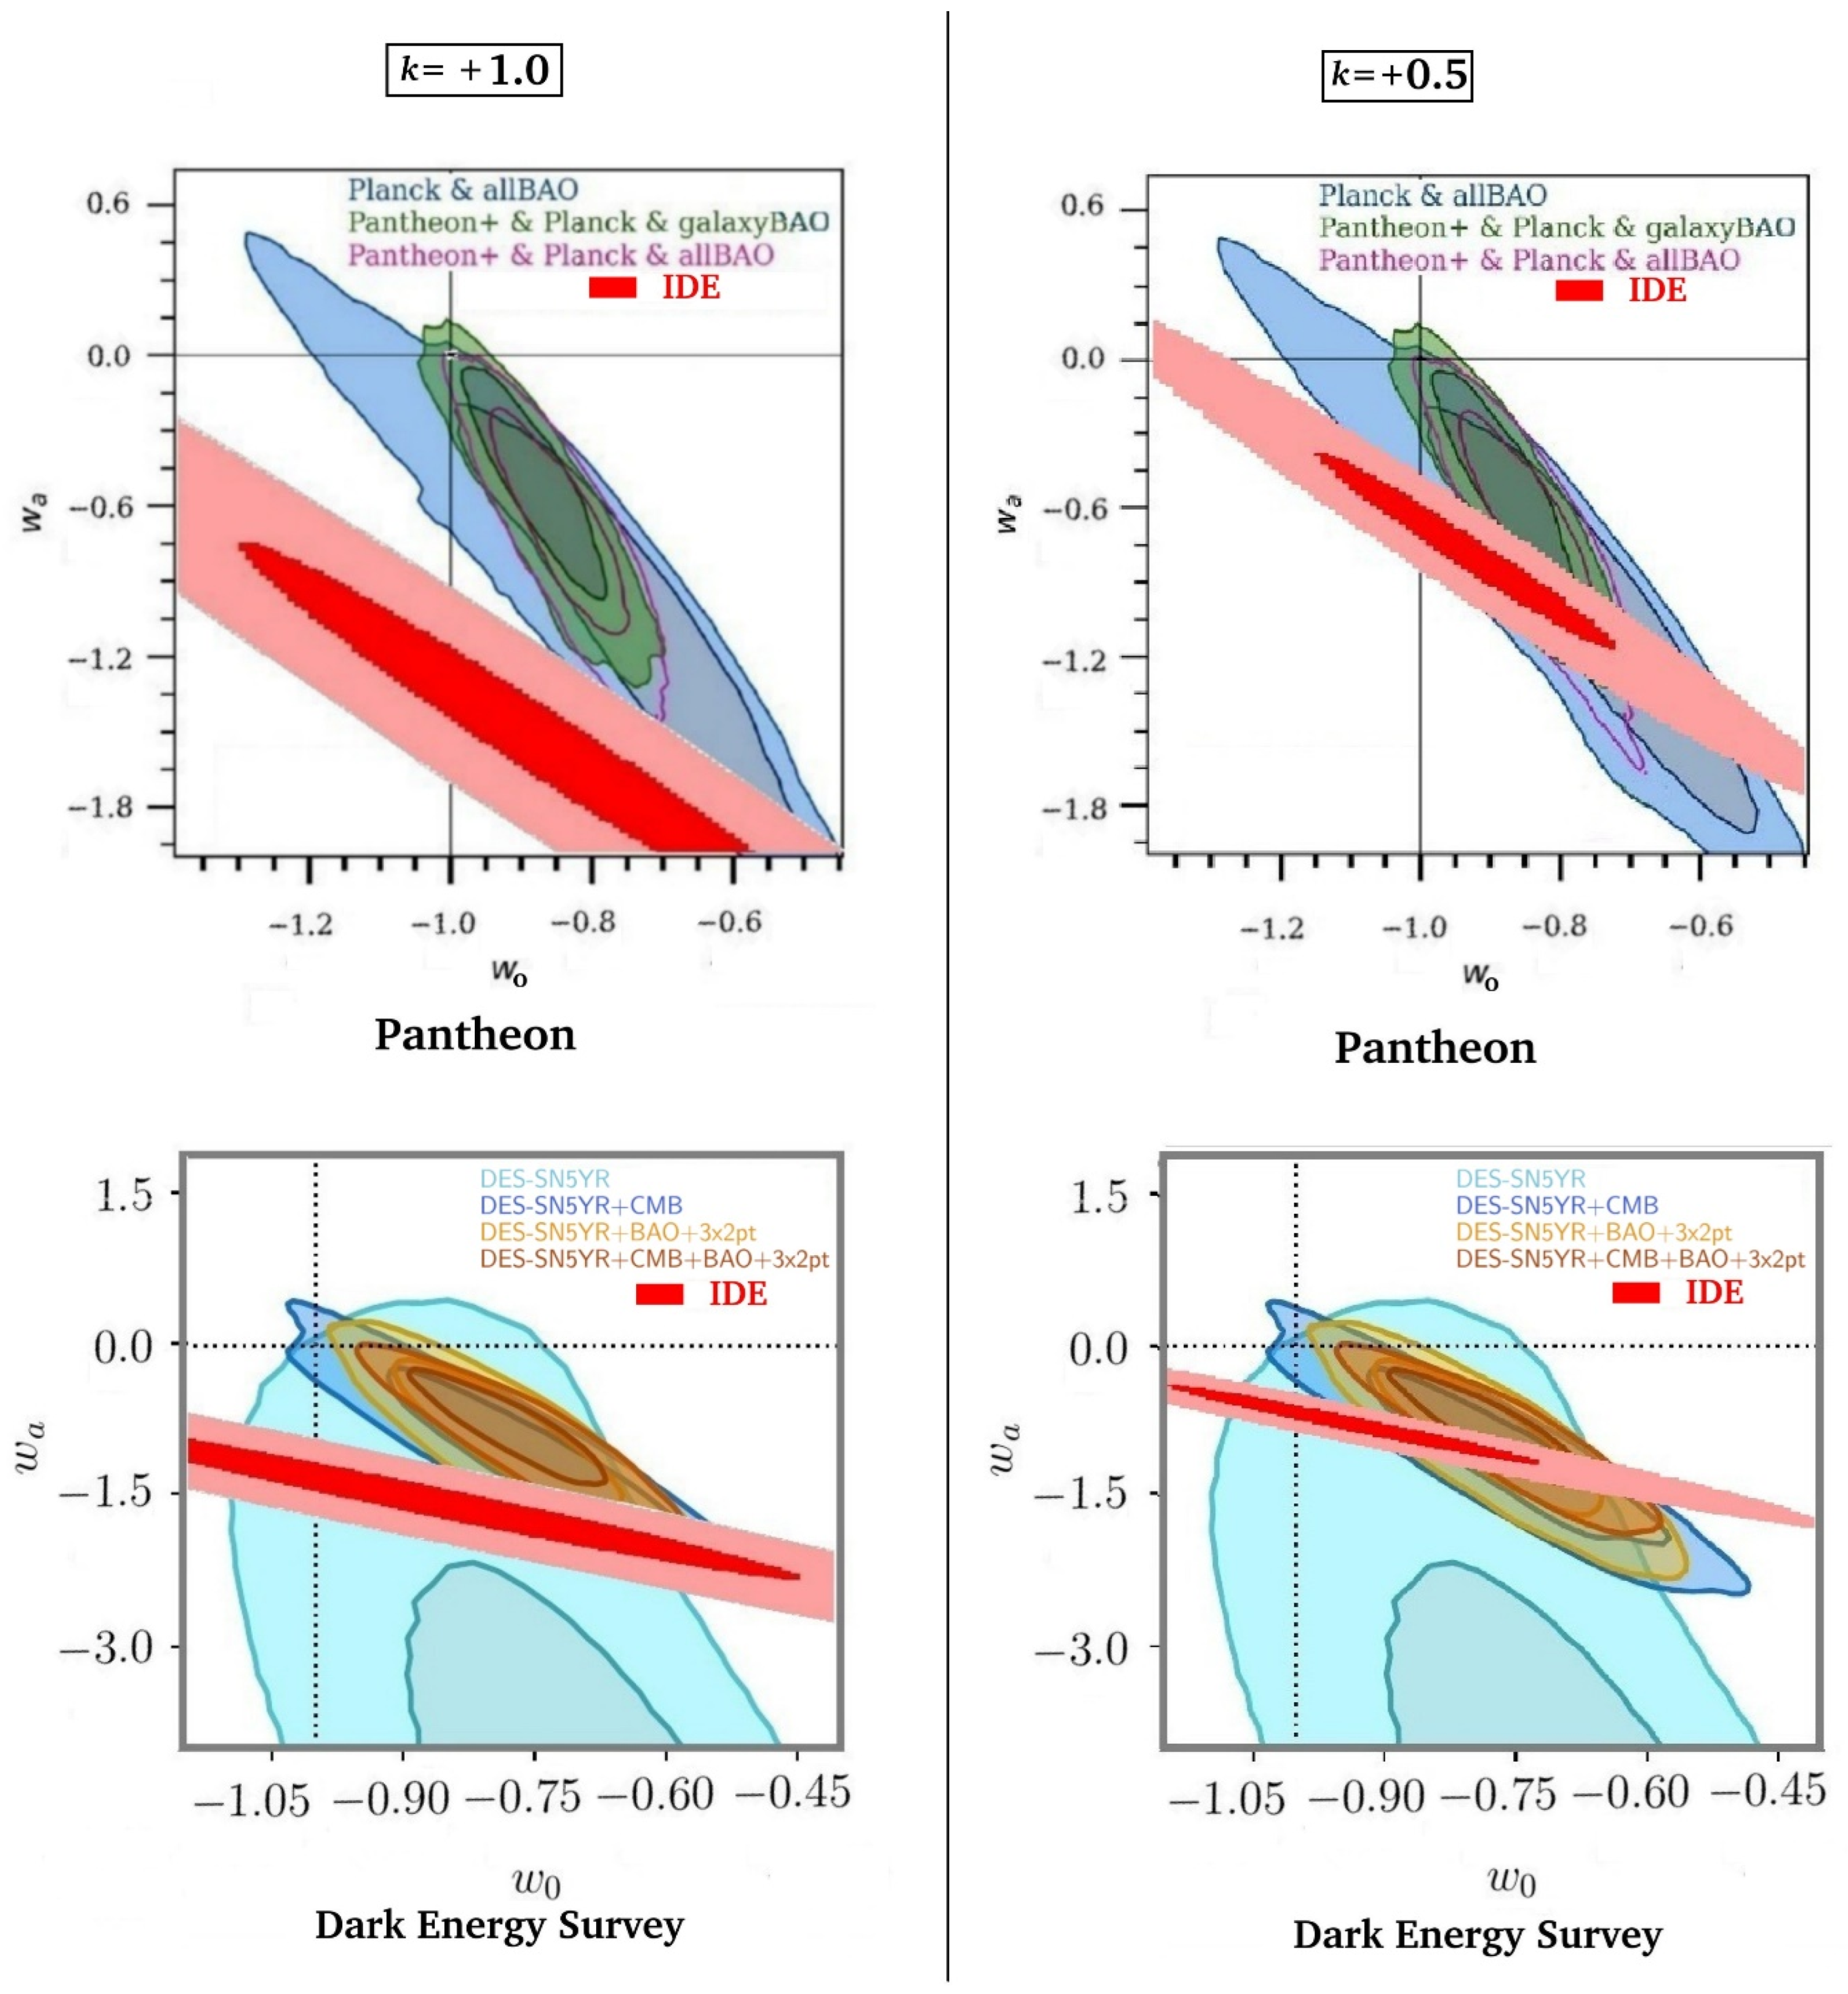
Figure 7.
Information Dark Energy predicted contribution for k=1.0 and k=0.5, compared in w0-wa space with Dark Energy Spectroscopic Instrument 2024 results, Figure 6 of [24].
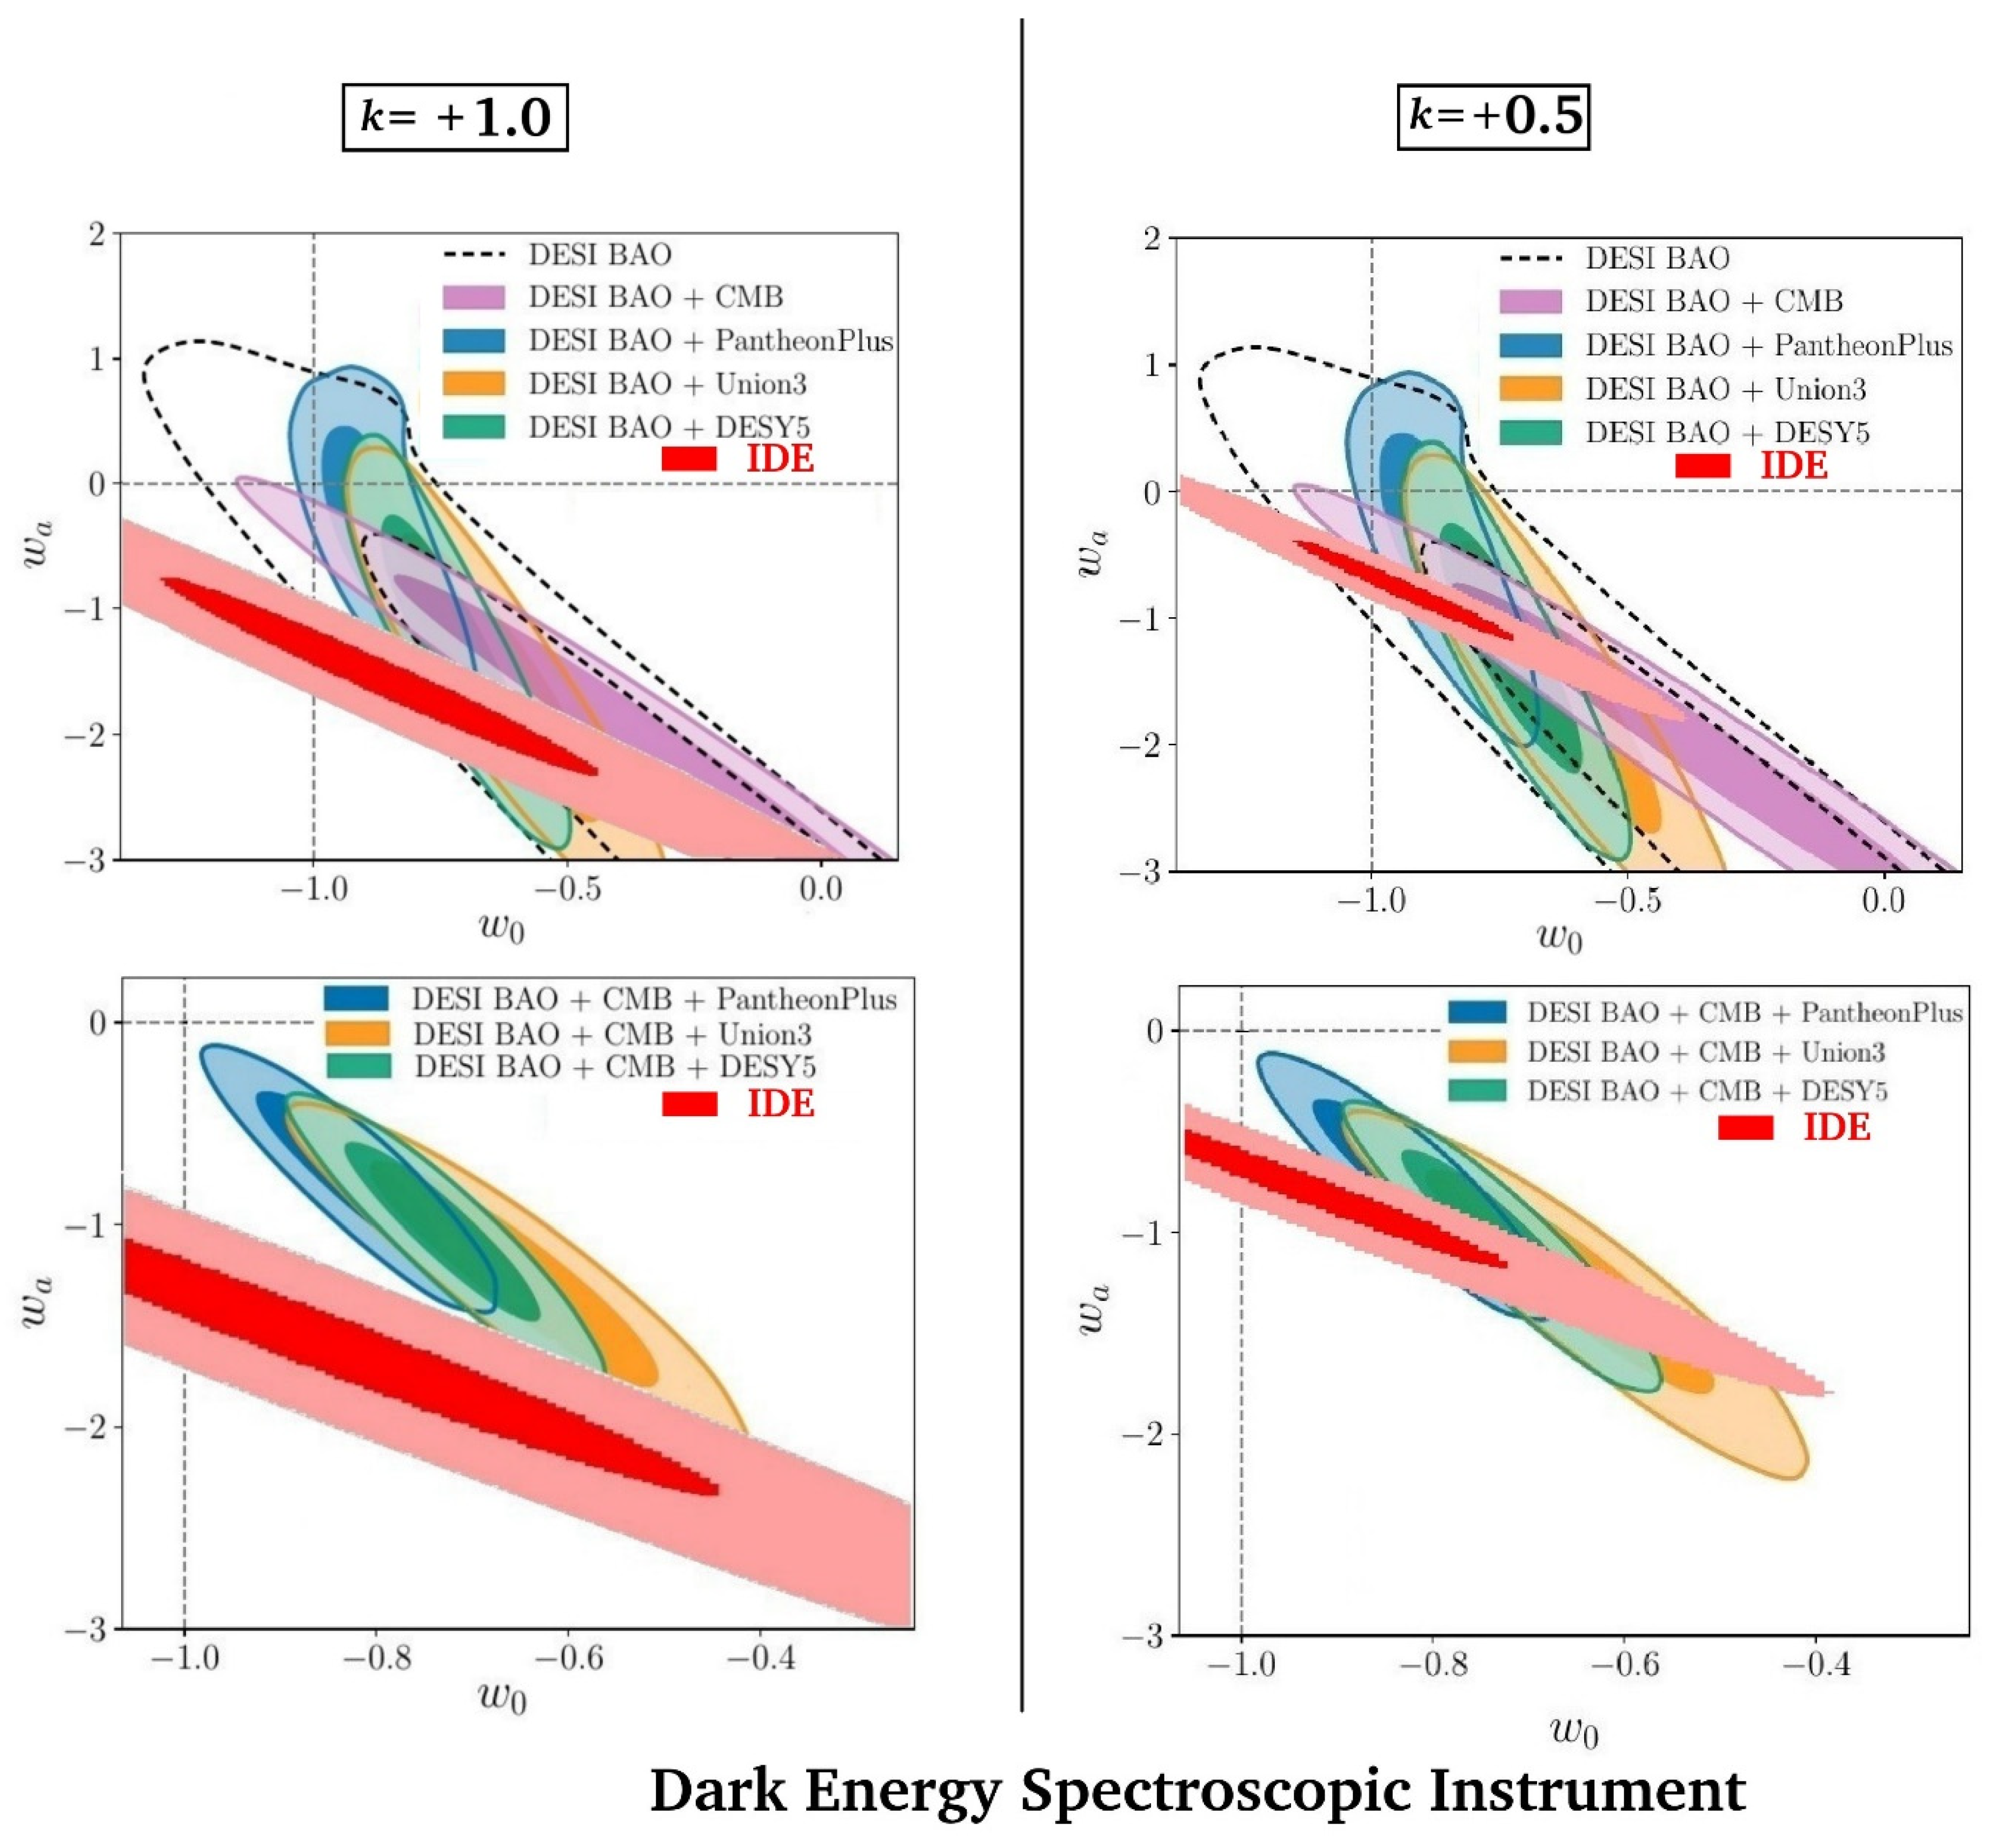
Figure 8.
Sources of information energy with NT products compared against values that provide an information energy equivalent to the universe total baryon mc2.
Figure 8.
Sources of information energy with NT products compared against values that provide an information energy equivalent to the universe total baryon mc2.
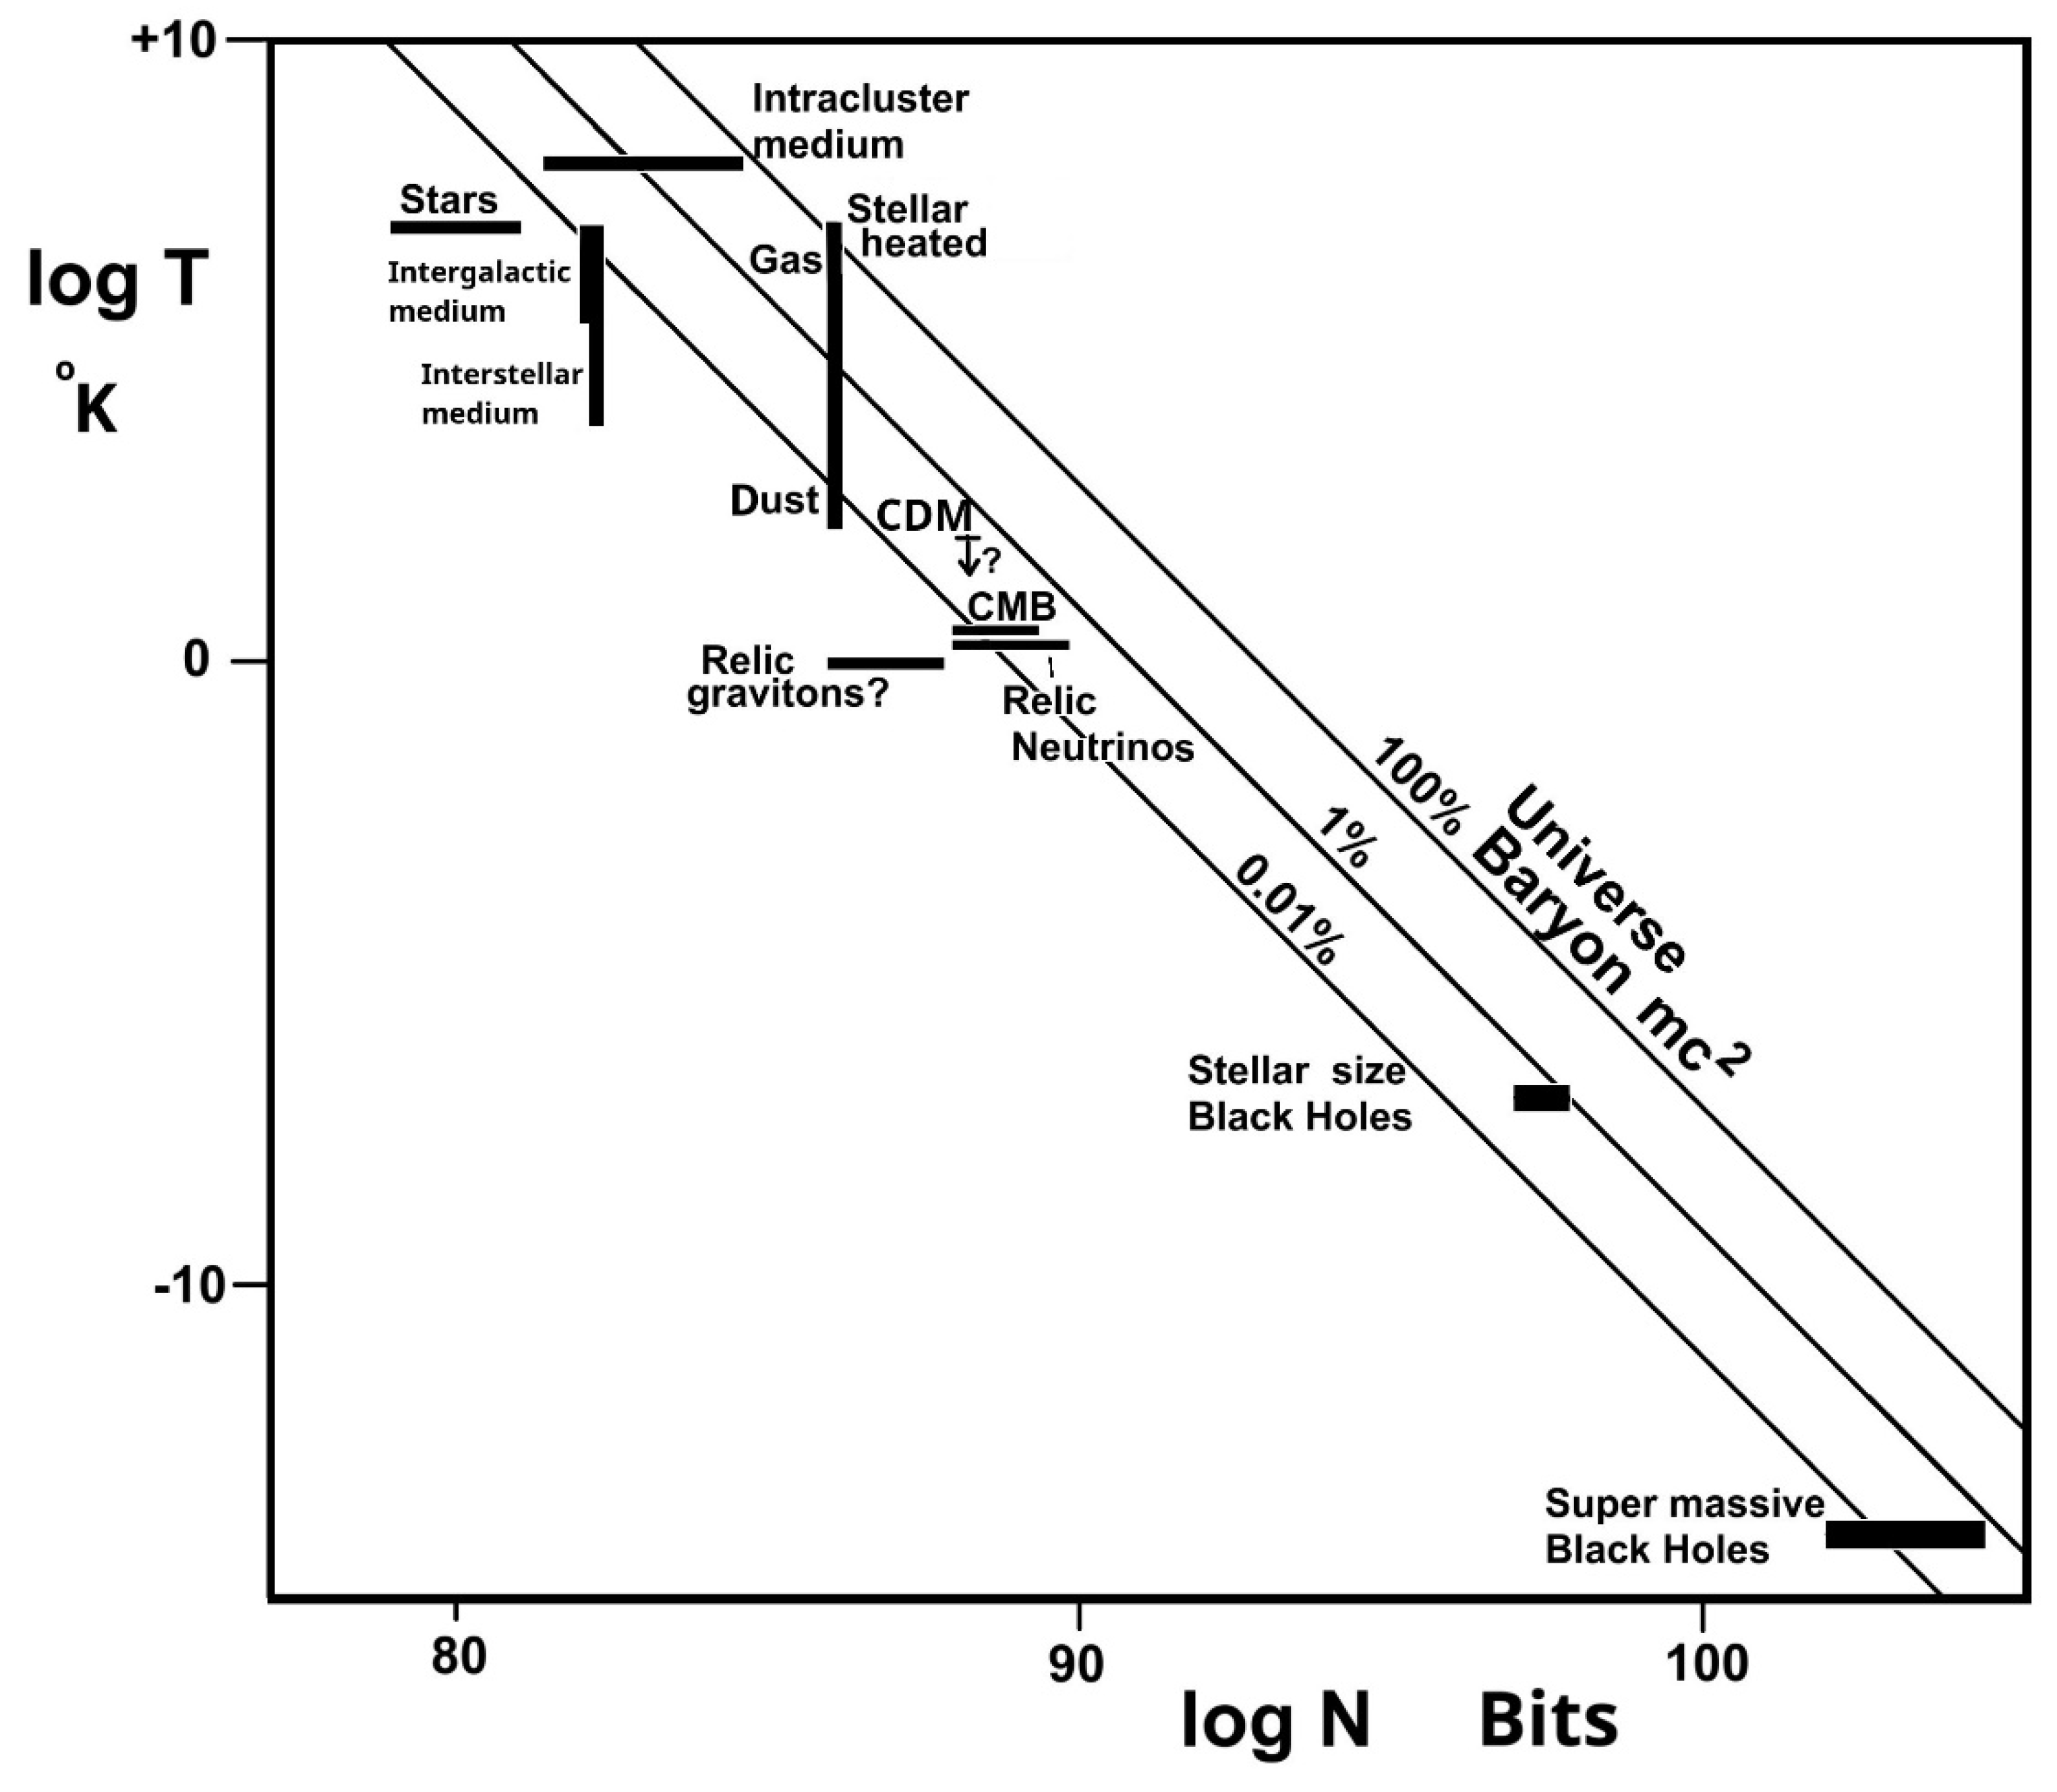
Figure 9.
Space-time is equally distorted by an accumulation of energy in any form, comparing here the N kB T ln(2) energy of information with an equivalent effect of mc2 energy of matter .
Figure 9.
Space-time is equally distorted by an accumulation of energy in any form, comparing here the N kB T ln(2) energy of information with an equivalent effect of mc2 energy of matter .
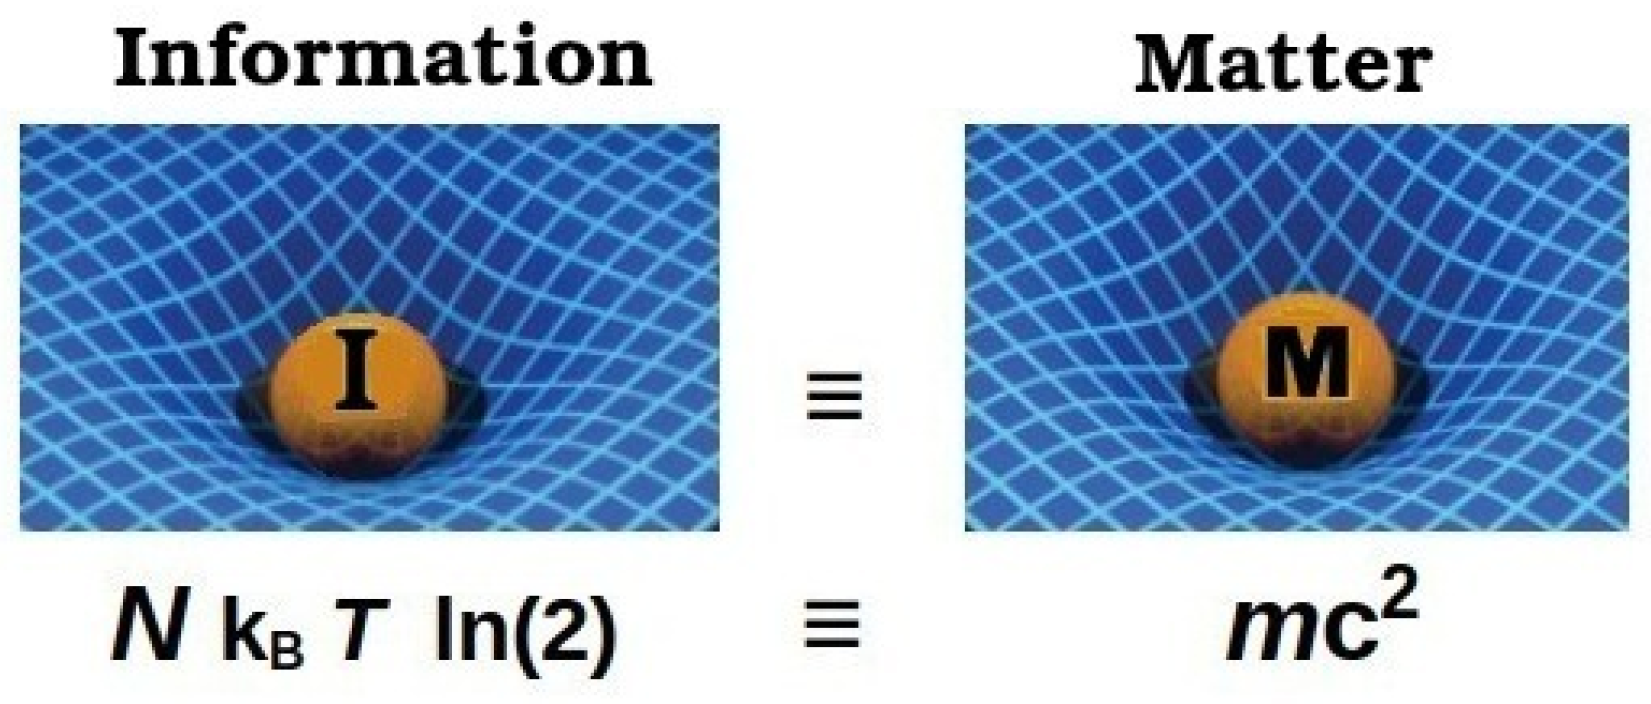

Table 1.
Simple comparison of IDE against ɅCDM, Scalar fields/Quintessence, and MOND.
 |
Disclaimer/Publisher’s Note: The statements, opinions and data contained in all publications are solely those of the individual author(s) and contributor(s) and not of MDPI and/or the editor(s). MDPI and/or the editor(s) disclaim responsibility for any injury to people or property resulting from any ideas, methods, instructions or products referred to in the content. |
© 2024 by the authors. Licensee MDPI, Basel, Switzerland. This article is an open access article distributed under the terms and conditions of the Creative Commons Attribution (CC BY) license (http://creativecommons.org/licenses/by/4.0/).
Copyright: This open access article is published under a Creative Commons CC BY 4.0 license, which permit the free download, distribution, and reuse, provided that the author and preprint are cited in any reuse.


