
Submitted:
22 December 2025
Posted:
23 December 2025
You are already at the latest version
Abstract
Background/Objectives: Prolonged stays in the emergency department (ED) may contribute to an increase in the rate of healthcare-associated infections (HAIs) with an increased risk of mortality. Early identification of the risk profile of these patients could reduce both complications and adverse outcomes. The study aimed to verify whether the development of an HAI was associated with mortality. Design, settings and participants: This prospective multicentre study involved all subjects, who required urgent admission to an acute care hospital from the ED, between 2023 and 2024. Outcome measures: The primary endpoint was 30-day mortality. A Cox proportional hazards model was used to test the hypothesis. Results: Of the 27,516 patients included in the analysis, with a mean age of 79 [20] years (median [IQR]), 1,575 (7.8%) died. The main features, in order of importance, selected for predicting mortality were: diagnosis of neoplasm; older age; NEWS; diagnosis of infectious diseases; HAIs; diagnosis of respiratory diseases; CCI; priority level on arrival; and male gender, yielding an accuracy of 0.804 ± 0.012. The development of a nosocomial infection was associated with a mortality risk ratio of 1.518 (95% confidence interval (CI): 1.338–1.721; p < 0.001), particularly high for bloodstream infections (2.54; 2.12–3.06) and pneumonia (1.44; 1.20–1.73). Conclusion: In patients admitted to acute care hospital from the ED, the development of HAIs is associated with an increased risk of mortality. This risk is particularly elevated in cases of bloodstream infections and pneumonia.
Keywords:
older age
; predictors
; comorbidity
; mortality
; nosocomial infections
1. Introduction
1.1. Background/Rationale
Healthcare-associated infections (HAIs), defined as infections occurring on or after the third day of hospital admission, are more prevalent among the elderly, the seriously ill, those with prolonged stays and those undergoing invasive procedures [2,3,4,5].
A study found that elderly patients admitted from the ED to long-term care facilities were around three times more likely to develop respiratory and gastrointestinal infections within seven days of admission than younger patients. This was attributed to the increased risk of infection resulting from the high density of acutely ill patients and overcrowding in emergency departments [6].
1.2. Objectives
In this multicentre study we aimed to evaluate whether developing HAIs affects mortality during hospital stays.
2. Methods
2.1. Study Design, Setting and Participants
This is a multicenter analysis from all digital health records collected from the official registry from four first level ED of the Local Health Agency of Romagna, Italy, between June 1, 2023, and December 31, 2024 (18 consecutive months) including 495,631 encounters / 1,172,853 inhabitants / area.
The analysis was performed on all subjects visited in the ED and admitted to acute care hospital, using a link between ED and inpatient records (Figure 1). A total of 468,115 patients were excluded for the following reasons: 433,592 (87.5%) were discharge directly from the ED; 25,635 (5.1%) had insufficient data quality; 2,645 (0.5%) were aged <18 years, and 591 (0.1%) died in the ED. A further 5,046 patients were excluded because their hospital stays was less than 3 days, and 2,236 (0.4%) were excluded due to transfer to external hospitals. The final analysis was performed on a sample of 20,234 for whom all information from the initial ED visit to complete acute care hospital records was available.
2.2. Variables
Most baseline patient characteristics, including age (for decades) and sex, were collected at the time of ED registration. Vital signs at arrival in ED, specifically systolic blood pressure (SBP), heart rate (HR), respiratory rate (RR), and temperature, were recorded upon arrival to calculate the National Early Warning Score (NEWS) [7]. NEWS was computed and considered as a categorical variable (0-4 low risk, 5-6 medium risk, >6 high risk).
The chief complaint at entry was considered using the Canadian Emergency Department Information System (CEDIS) Complaints List (V2.0) classification [8]. All presenting complaints were further divided into two categories, traumatic vs. non-traumatic origin.
The Charlson Comorbidity Index (CCI) [9] was calculated using free-text patient reports extracted during the ED visit. The CCI was categorised as follows (mild, 1-2; moderate, 3-4; severe, >4), using selection criteria and disease categories recently validated [10]. Additionally, age adjustments were applied, with each decade over 40 years adding 1 point (e.g., 50-59 years, +1; 60-69 years, +2; 70-79 years, +3, etc.), with these “age points” added to the total CCI score [11].
Healthcare acquired infections by ECDC disease categories [12,13] were considered as: pneumonia (PN), urinary tract (UT) infections, bloodstream (BS) infections, gastrointestinal (GI) infections, surgical site (SS) infections and skin and soft tissue (SST) infections. To reduce false positives, patients staying less than 3 days were excluded [13]. As HAI diagnoses were not associated with a definite date of identification, we estimated them by information derived from clinical, laboratory, microbiological and radiological reports in the electronic medical record. If a patient had more than one HAI, it was counted only once.
2.3. Statistical Methods
Data analysis was conducted on a cohort of 20,234 adult patients. Data were summarised as counts and percentages. Continuous variables were reported as either the mean (standard deviation, SD) or median [interquartile range, IQR]. Differences in patient characteristics, along with the corresponding 95% confidence intervals (CIs), were calculated using the Agresti-Caffo method [14]. For all statistical analyses, a p-value of less than 0.001 was considered significant.
The primary outcome measure was 30-day mortality following an ED visit. The demographic characteristics taken into consideration were: age, sex and comorbidities. Comorbidities were considered both as individual variables and as a categorised value of CCI >4. Additional variables tested were NEWS, five triage priority levels (0 to 4) [15], ICD9-CM main diagnosis codes, trauma and non-trauma related visits, ED length of stay (EDLoS), calculated as the difference between entry and exit times, as categorical values (< 6, 7-12, 13-24, >24 hours) in-hospital length of stay (iHLoS) (days), any ED participation center.
A generalised linear mixed Cox proportional mortality risk model at 30 days was developed, adjusting for baseline characteristics such as age, sex, CCI, NEWS, triage priority level, trauma-related diseases. In a second step, the model was expanded to include the EDLoS, and main ICD9-CM diagnosis codes, HAI categories, in-hospital length of stay
The odds ratio (OR) and 95% confidence intervals (95% CI) were calculated. A score for mortality risk was calculated for each patient based on the coefficients computed by the logistic model derived from variables entering the stepwise procedure. The accuracy of such a risk score was then evaluated by the area under the receiver operating characteristic (ROC) curves. The optimal cutoff point, i.e., the value that simultaneously maximises the sensitivity and the specificity, was calculated by the Youden index [16]. To avoid ambiguity, no synthetic data were generated to address missing data; hence, the analysis utilised only complete cases. The statistical model was ultimately validated using event-number balancing techniques [17]. For feature selection, stepwise feature selection is used. The Cox proportional hazard model was used to calculate the cumulative mortality risk.
Using a two-tailed binomial test, we estimated that, for a study with adequate statistical power and an acceptable margin of error of ±1%, assuming a significance level (α) of 5%, a power of 80%, and an expected prevalence of HAI cases of 7.7%, as reported in the ECDC last publication [13], the required initial sample size would be at least 2,731 patients, a lower number of cases than what was considered. The logistic model used a rule of thumb of at least 10 events per variable. A model with 10 to 20 predictors would require at least 200 cases of HAI. Assuming an incidence rate of 7.7%, this would be about 2,600 patients, in line with the previous estimate.
Statistical analyses were conducted in Python 3.10.12 using the following libraries: pandas (2.2.3), numpy (1.24.1), scipy (1.10.0), scikit-learn (1.6.0), seaborn (0.12.2), matplotlib (3.6.3), statsmodels (0.13.5), and lifelines (0.30.0).
3. Results
3.1. Participants
Out 27,516 hospitalised patients, 20,234 were included in uor cohort and considered for the analyses. A total of 5,046 cases (18.3%) were excluded because hospital stay was <3 days and 2,236 (8.1%) because transferred to different hospital facilities (Figure 1).
3.2. Descriptive Data
The characteristics of patients in the two groups are summarised in Table 1. No differences were found between men and women, and the age was 79 [20] years median [IQR], but when the different age groups were compared, patients over 80 were more likely to be in the dead group. Patients with a high-risk NEWS score and those with a comorbidity index (CCI) greater than 4 were also more likely to be in the dead group.
The most reported comorbidities in order of frequency were DM, HF, D COPD, CAD and CKD (Table A1 in the Appendix A). All of these conditions were more prevalent in the dead group.
The median length of EDLoS was 7 [10] hours, median [IQR], with 40.1% of cases lasting less than 6 hours, 16.2% lasting between 12 and 24 hours, and 13.5% lasting more than 24 hours.
The main diagnoses by category in order of frequency according to the ICD-9-CM classification system are listed the Table A2 (in the Appendix A). The most frequently reported diagnoses were those of respiratory diseases (21.7%) and circulatory diseases (20.5%). When dead vs. alive groups were compared, respiratory, infectious and parasitic disease, and neoplasms diagnoses were more represented in the dead group, while all other diseases were more represented in the alive group.
HAI diagnoses in order of frequency, divided by category according to ECDC criteria are reported in Table 2. The majority (90%) of these diagnoses belonged to the pneumonia (PN), urinary tract infection (UTI) and bloodstream infection (BS) category.
3.3. Outcome Data
A total of 1,575 out of 20,234 cases (7.8%) admitted to hospital died during their stay. The percentage of subjects with HAI was higher in the group of deceased patients (22.1%; 95% CI 20.1-24.2) than in subjects discharged alive (9.6%; 95% CI 9.2-10.0); P-value < 0.001 (Figure 1).
3.4. Main Results
The list of independent variables selected from the Cox hazard model to predict 30-day mortality are shown in order of importance in Figure 2. Among those selected fromt the model, one of the most important was a diagnosis of HAI.
Variables not included in the prognostic model were individual comorbidities, length of stay in the ED, overnight stay in the ED, trauma-related visits, and factors such as different seasons, months, years, and the COVID period. Additionally, ICD-9-CM diagnosis codes related to neoplasms (140-239), endocrine, nutritional, metabolic diseases and immune system disorders (240-279), diseases of the blood and blood-forming organs (280-289), diseases of the nervous system and sense organs (320-389), mental and behavioral disorders (290-319), digestive system diseases (520-579), genitourinary system diseases (580-629), musculoskeletal system and connective tissue diseases (710-739), complications of pregnancy, childbirth, and puerperium (630-679), symptoms, signs, and laboratory findings (780-799), injury and poisoning, external causes (800-999), and external causes (E, V codes) were also excluded.
The ROC curve for the mortality risk score, calculated on the coefficients from the logistic regression, is shown in Figure A1 in the Appendix A. The accuracy of the model in predicting the outcome was 0.804 ± 0.012, with a sensitivity of 84% and a specificity of 65% at the optimal cutoff point (score of 0.470), simultaneously maximising both sensitivity and specificity.
Survival rate at 30 days was lower in the HAI group (97.7% vs. 47.1%) than in the non-HAI group (98.7% vs. 60.9%) (Figure 3), with an increased risk for the HAI group (Hazard Ratio 1.518; 95% CI: 1.338–1.721; p-value: <0.001).
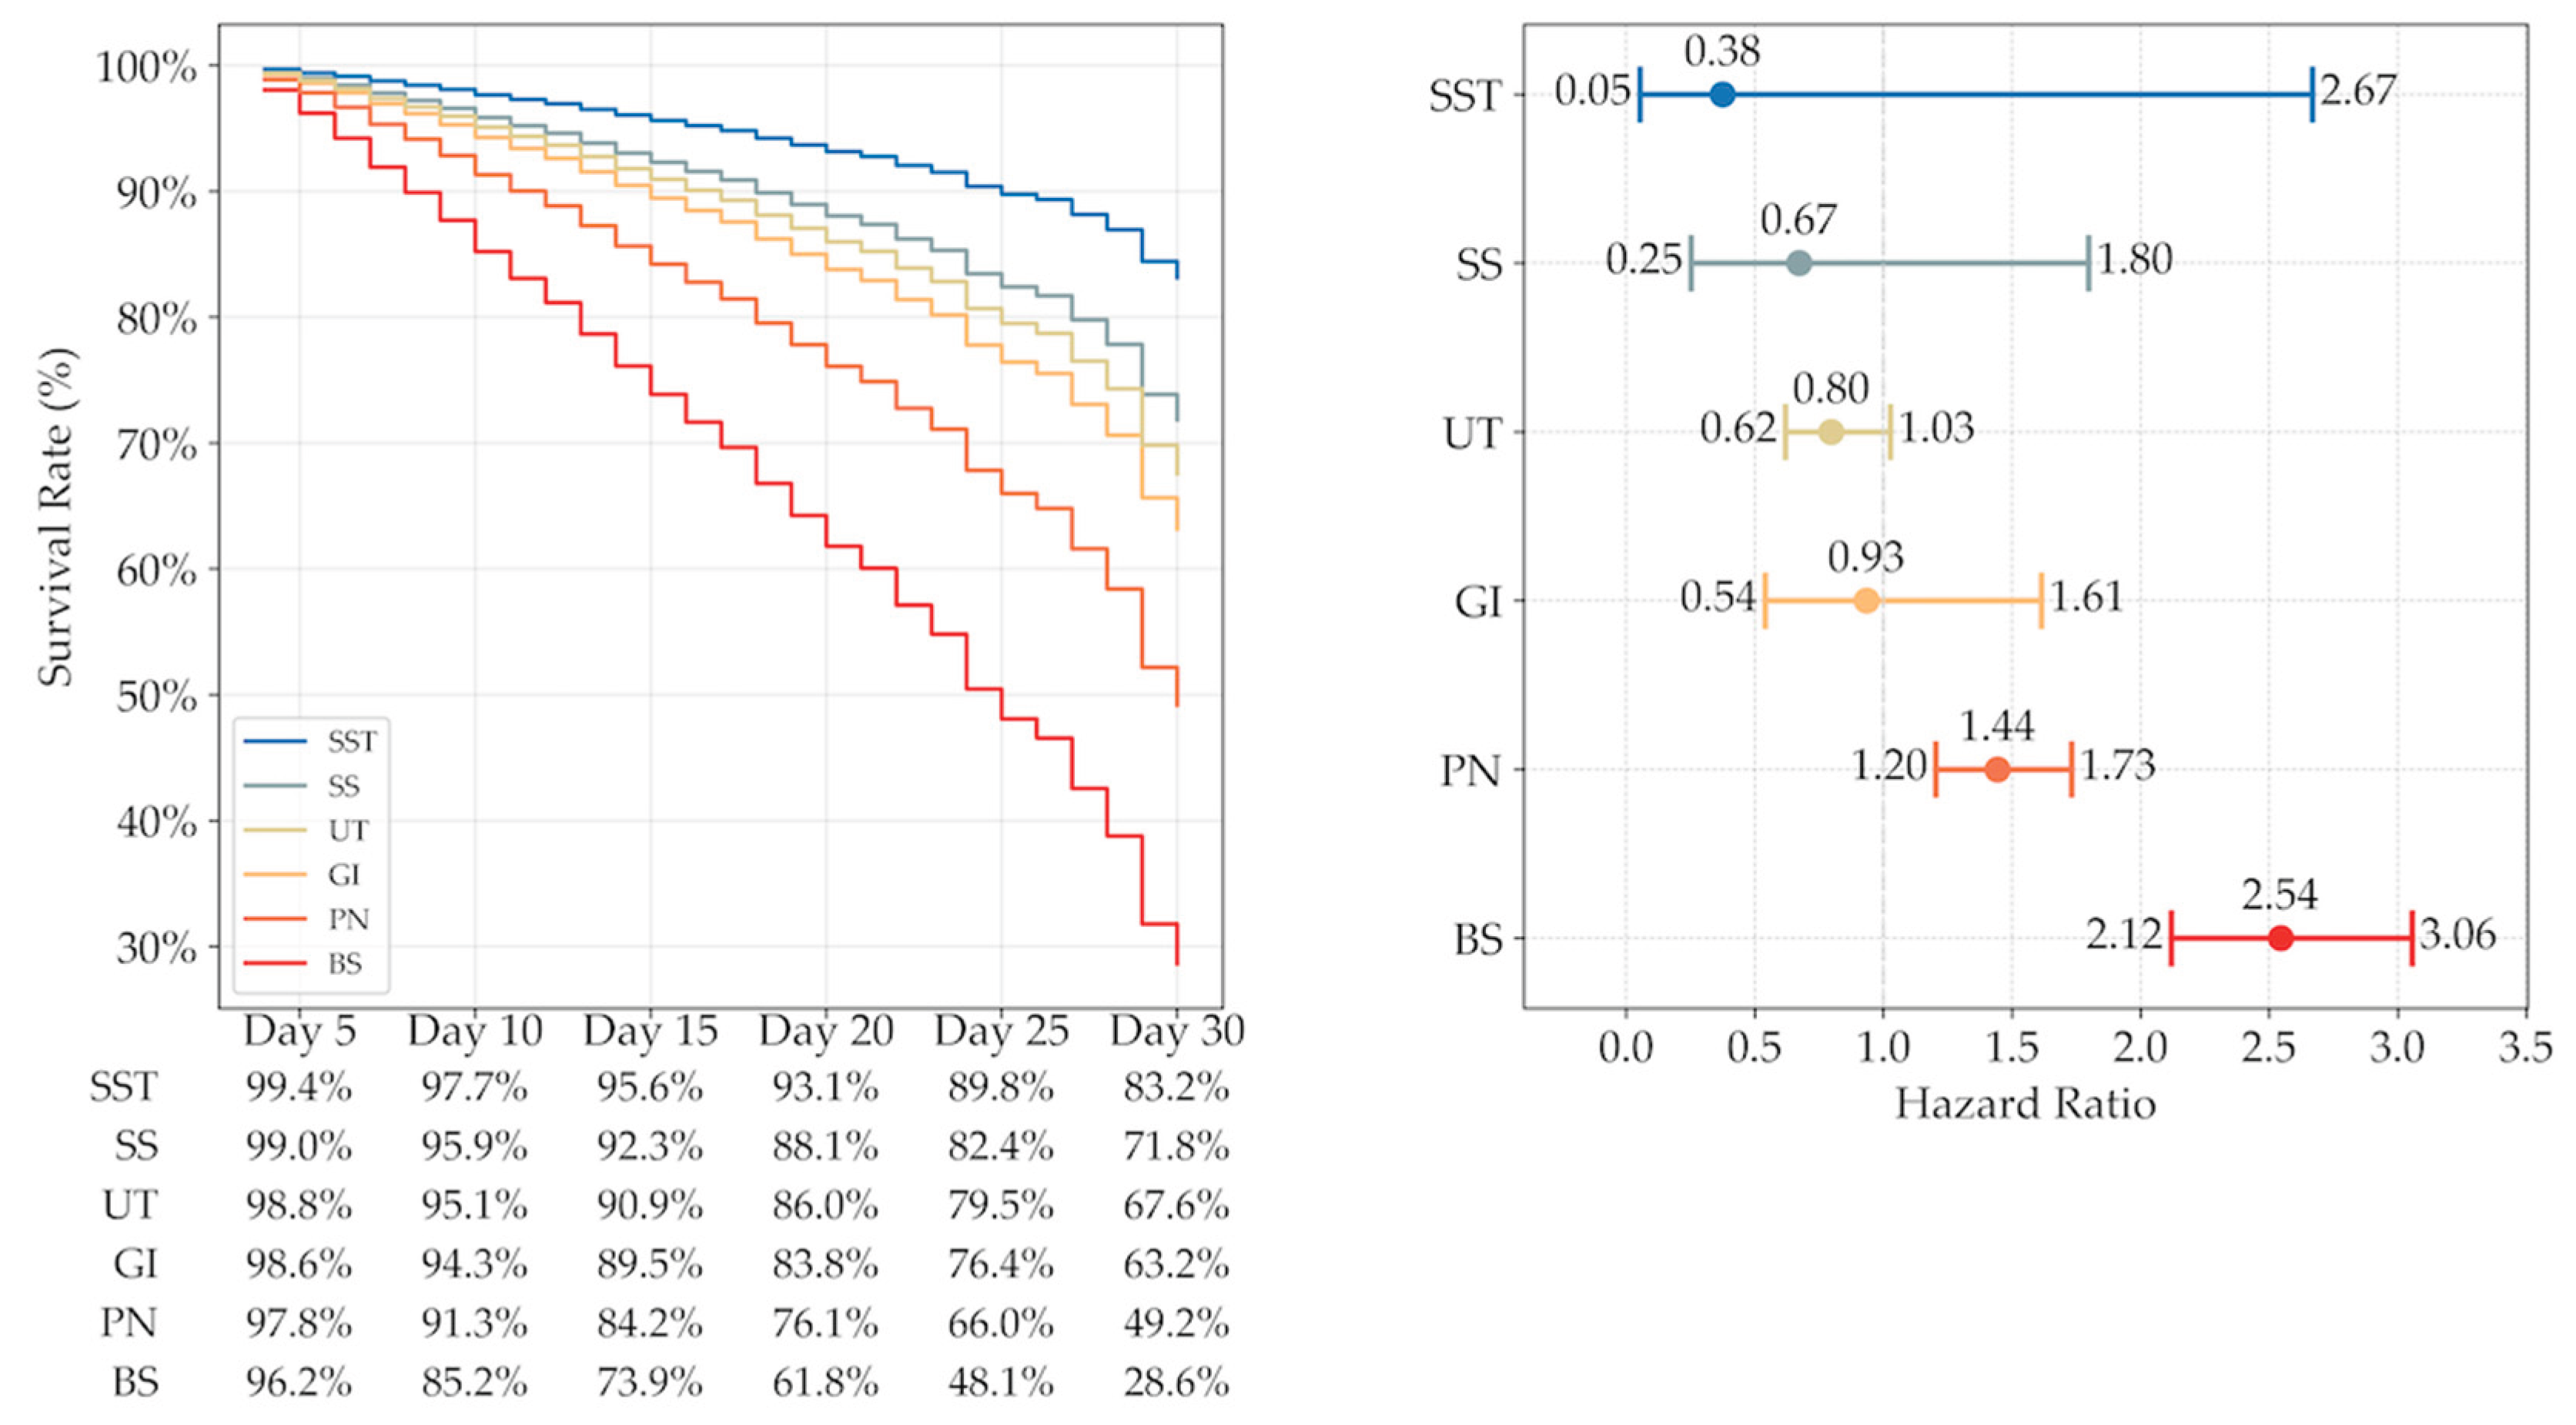
Subsequent analysis, which divided HAIs into individual categories, revealed that the percentage of 30-day survivors was particularly low among subjects with BS and PN (left part), with a mortality hazard ration particularly high (right part) (see Figure A2 in the Appendix A).
4. Discussion
4.1. Key Results
This prospective, multicenter study found that HAIs were associated with an increased risk of mortality, after adjusting for all other predictive variables selected by the statistical model. This risk was particularly elevated for patients, who had contracted infections such as pneumonia or bloodstream infections.
Our study protocol excluded 5,046 cases (18.3%) from the analysis due to a hospital stay of less than three days. This decision was made to reduce the confounding effect of cases where an infection was already present at the time of admission [18]. The percentage of cases involving an infection that was present, but not evident at the time of admission, could be problematic: the ECDC’s latest report estimates these cases to range from 15.6% (Czech Republic) to 41.2% (Sweden) [19]. However, we believe that our decision did not introduce significant selection bias [20]. Nonetheless, it should be noted that it would be very difficult to establish reliable criteria for determining the exact date of diagnosis anyway, given the numerous variables to consider.
The incidence of hospital infections has been reported to be associated with risk factors such as advanced age and male gender. The site of infection is also important. It should also be noted that infection rates could vary in different geographical areas, hospital settings and levels of care. For instance, infections are more prevalent in intensive care and specialist areas than in general wards. In EDs the risk mainly arises from overcrowding, the complexity and severity of diseases, and invasive procedures being performed in an unprotected environment. In this setting, respiratory infections (such as pneumonia), bloodstream infections and urinary tract infections appear to be the most common [21]. In our dataset, a diagnosis of HAI was recorded in 10.6% of patients admitted from the emergency department, a figure consistent with the official data reported in the European registry [13]. It should be noted that this percentage was higher in deceased patients (22.1%) than in survivors (9.6%) and that the most frequent nosocomial infections were, in order, PN (41%), UTI (34.3%) and BS (26.5%), although in the proportional risk model only BS and PN were associated with the risk of death (Figure 3).
A primary cancer diagnosis was one of the main risk factors associated with mortality. It is well known that a significant percentage of patients receive their first cancer diagnosis during an emergency room visit [22] and that these cases, often immunocompromised, have an increased risk of infection and death [23]. The types of cancer with the highest risk of infection and death are those of the pancreas, lung, biliary tract, anaplastic thyroid, and head and neck [23]. In our series, there were 1,135 cases of primary cancer, accounting for 4.5% of all cases. Among these, the most common were pancreatic (1 in 7 cases), lung (1 in 6) and colon (1 in 5)
In patients with HAI, advanced age (particularly in the over-80 age group) and male gender have been identified as risk factors for mortality [24]. Our analysis confirms that advanced age in both the 70–80 and >80 age groups, as well as male gender, are associated with an increased risk of death. The inclusion of only the most advanced age categories in the model may be explained by the stepwise procedure used in the logistic model, which prioritises the most important variables.
The National Early Warning Score (NEWS) is a clinical tool currently used in emergency departments to estimate the risk of adverse outcomes and short-term mortality. Its reliability appears to be particularly high in predicting the risk of adverse events in elderly patients (>65 years) admitted to hospital for acute care [28], particularly in elderly patients with pneumonia [25]. In our series, only high-risk NEWS, present in 6.7% of cases, was confirmed among the variables included in the logistic model.
The logistic model includes the category of infectious or parasitic disease diagnoses and respiratory diseases among the group of key predictive characteristics associated with an increased risk of death (Figure 2). Patients in this category are known to be at high risk of developing multiple infections due to frequent immunodeficiency and visits to the emergency room in severely overcrowded conditions [13,18]. In our series, the most frequent primary diagnoses in the infectious diseases category were E. coli sepsis, unspecified sepsis and Staphylococcus aureus sepsis. In the respiratory system diseases category, the most frequent primary diagnoses were bacterial pneumonia, COPD with exacerbation and pneumonia caused by SARS-CoV-2.
It should be noted that, in some cases, HAIs belonging to the same category as the primary diagnosis developed; for example, PN developed in patients with a primary diagnosis belonging to the respiratory disease category. Specifically, 16.3% of cases of respiratory disease developed a PN-type HAI; 5.1% of cases with a primary diagnosis of an infectious disease developed BS; and finally, 3.0% of cases of genitourinary disease developed an additional UT infection.
A high burden of comorbidity is one of the characteristics associated with an increased risk of mortality. The CCI has been confirmed as an indicator for patient risk stratification and the prediction of adverse outcomes in hospitalised patients, particularly those with a high index. In our study, the CCI was high (≥4) in 47.8% of cases, with a significantly higher prevalence (75.4%) among deceased patients than survivors. Diabetes is a particular risk factor for infection, especially in cases of poor glycaemic control and in elderly patients [26]. In our study, the most common comorbidities were, in order of frequency, ST, D, COPD, DM and CKD. All of these were more prevalent in the deceased group than in the survivors.
4.2. Limitations
Several limitations of this study must be acknowledged: First: the data were collected from multicenter first-level EDs of the same regional area. Results might not be fully replicable due to homogeneous facility’s characteristics.
Second, we used ICD-9-CM diagnosis codes to identify HAIs. Early studies showed these coded diagnoses had high specificity (≥93%), particularly for SS, Clostridium and BS infections. The percentage of HAI cases in our study (8.9%) was in line with the official ECDC registers (7% -10% for the Italian registry). Case assessment bias may have inflated the estimate of the risk of HAIs, primarily because we created a posteriori estimate of cases [27], without having objective diagnostic tests in most cases. However, multivariate regression approaches that adjust the results for confounding variables should have contained any initial error [28].
Third, the accuracy of our model was 0.804 [SE 0.012], with an optimal cutoff point of 0.417, a level of discriminatory power considered acceptable for clinical purposes [27]. Unfortunately, it cannot be expected that the group of variables available during the ED visit will have such a high impact on accurately predicting the patient’s medium- and long-term prognosis [29]. In order to improve the statistical validity of the model, it is essential to minimise the risk of bias. This is achieved through careful selection of the variables to be tested, good outcome measures, careful analysis of the results, and elimination of the “self-fulfilling prophecy” effect [30]. Additional clinical events, such as complications and severity scores, with appropriate use of statistical models (e.g., survival analysis with inclusion of time to event or Bayesian models), could improve the predictive performance [27].
4.3. Interpretation
This multicentre study found that, after adjusting for all other variables selected by the statistical model, HAIs were associated with an increased risk of mortality. This risk was particularly high for patients who had contracted pneumonia or bloodstream infections. Further investigation is needed to determine whether additional variables not included in the current models, such as multidimensional assessments [18] and quality of care could provide valuable insights into the prognostic outcomes of these elderly patients.
4.4. Generalizability
In our study the data were collected from a multicentre, 4 first level EDs within a Local Health Agency, which may limit the generalisability of the findings. As a result, while the study spanscovers an observation period of 18 months, its conclusions may not be fully applicable to other facilities.
Author Contributions
AF had full access to all of the data in the study and took responsibility for the integrity of the data and the accuracy of the results. All authors were involved in the study concept and design and statistical analyses. ABT, FB, BB were responsible for the collection, management, analysis and interpretation of the data. AF, ABT, FB, and DM conducted the statistical analyses and drafted the manuscript. All authors contributed substantially to its revision and agreed to be accountable for all aspects of the work. AF takes responsibility for the paper as a whole.
Funding
The study was supported by Regione Emilia Romagna, FIN-RER project 2020: AVIN code 22 MIPE.
Ethics Approval and Consent to Participate
The study was approved by the ethical committee of CEROM - Comitato Etico della Romagna, Italy (9437/2019/I.5/268, November 05, 2021).
Availability of Data and Materials
The datasets generated during and/or analysed during the current study are available from the corresponding author upon reasonable request.
Acknowledgments
We are grateful to AUSL Romagna for helpful support.
Conflicts of Interest
All the Authors declare that they have no competing interests. The funders had no role in the design of the study; in the collection, analyses, or interpretation of data; in the rewriting of the manuscript; or in the decision to publish the results.
Abbreviations
The following abbreviations are used in this manuscript:
| BS | Blood Stream infections |
| CCI | Charlson Comorbidity Index |
| CHF | Congestive Heart Failure |
| HM | History of Hemiplegia, |
| CKD | Chronic Kidney Disease |
| COPD | Chronic Obstructive Pulmonary Disease |
| CVA | Acute Cerebrovascular Accidents or Transient Ischemic Attacks |
| D | Dementia |
| DM | Diabetes Mellitus |
| ED | Emergency Department |
| EDLos | Emergency Department length of stay |
| HLoS | Hospital length of stay |
| GI | Gastro Interstinal Infections |
| GTD | Connective Tissue diseases, |
| PUD | Peptic Ulcer Disease |
| HAI | Healthcare Associated Infection |
| HR | Hazard ratio |
| L | Lymphoma and Leukaemia |
| LD | Liver Disease |
| MI | History of Myocardial Infarction |
| NEWS | National Early Warning Score |
| PN | Pneumonia |
| PVD | Peripheral Vascular Disease |
| ROC | Receiver Operating Characteristic |
| SS | Surgical Site infection |
| SST | Skin and Soft Tissue infections |
| ST | Solid Tumours |
| UTI | Urinary tract infections |
Appendix A

Table A1.
List of main comorbidities in order of frequency in the dead vs. the alive group. The difference with 95% Confidence Intervals and p-values refer to a comparison between the dead group and the alive Group. Data are reported as N. of cases (%), difference as Odds Ratio (OR) with 95% Confidence Intervals (95% CI). Percent of subjects referred to the total number of cases. p value < 0.001 for significance.
| Comorbidities | Total, No. (%) | Dead, No. (%) | Alive, No. (%) | OR (95% CI) | P-value |
|---|---|---|---|---|---|
| Sex (males) | 12,694 (50.2) | 1,177 (50.1) | 11,517 (50.2) | 0.99 (0.91–1.08) | 0.896 |
| D | 4,157 (16.4) | 459 (19.5) | 3,698 (16.1) | 1.26 (1.13–1.41) | <0.001 |
| COPD | 3,657 (14.5) | 534 (22.7) | 3,123 (13.6) | 1.86 (1.68–2.07) | <0.001 |
| DM | 3,371 (13.3) | 671 (28.5) | 2,700 (11.8) | 2.99 (2.71–3.30) | <0.001 |
| CKD | 2,678 (10.6) | 457 (19.4) | 2,221 (9.7) | 2.25 (2.01–2.52) | <0.001 |
| CVA | 2,669 (10.6) | 345 (14.7) | 2,324 (101) | 1.53 (1.35–1.72) | <0.001 |
| MI | 2,168 (8.6) | 218 (9.3) | 1,950 (8.5) | 1.10 (0.95–1.27) | 0.203 |
| CHF | 2,166 (8.6) | 344 (14.6) | 1,822 (7.9) | 1.99 (1.76–2.25) | <0.001 |
| HM | 1,881 (7.4) | 257 (10.9) | 1,624 (7.1) | 1.61 (1.40–1.85) | <0.001 |
| LD | 1,656 (6.5) | 203 (6.8) | 1,453 (6.3) | 1.40 (1.20–1.63) | <0.001 |
| CTD | 1,545 (6.1) | 153 (6.5) | 1,392 (6.1) | 1.08 (0.91–1.28) | 0.396 |
| PVD | 517 (2.0) | 62 (2.6) | 455 (2.0) | 1.34 (1.02–1.75) | 0.033 |
| PUD | 470 (1.91) | 52 (2.2) | 418 (1.8) | 1.22 (0.91–1.63) | 0.183 |
| L | 406 (1.6) | 63 (2.7) | 343 (1.5) | 1.81 (1.38–2.38) | <0.001 |
| Ly | 142 (0.6) | 20 (0.8) | 1 22 (0.5) | 1.60 (1.00–2.58) | 0.001 |
| AIDS | 13 (0.1) | 0 (0.0) | 13 (0.6) | NA | NA |
Abbreviations: diabetes mellitus (DM), solid tumors (ST), dementia (D), chronic obstructive pulmonary disease (COPD), acute cerebrovascular accidents or transient ischemic attacks (CVA), chronic kidney disease (CKD), history of myocardial infarction (MI), congestive heart failure (CHF), hemiplegia (HM), liver disease (LD), connective tissue diseases (CTD), peripheral vascular disease (PVD), peptic ulcer disease (PUD), leukemia (L), lymphoma (Ly), Acquired Immune Deficiency Syndrome (AIDS).
Table A2.
Number of subjects (%) of the EDOS group and Ward group in relation to different time categories. Data are reported as No. of cases (%) and comparison between groups as difference with 95% confidence intervals. P value <0.05 was considered statistically significant. Patient characteristics concerning ICD-9-CM main diagnosis codes in ED, listed in order of frequency, are reported as the number of cases (%) and Odds Ratio (OR) between dead and alive groups with 95% confidence intervals (95% CI). P-value < 0.001 was considered statistically significant.
| ICD-9 Diagnosis codes | Total, No. | Dead, No. (%) | Alive, No. (%) | OR (95% CI) | p-value |
|---|---|---|---|---|---|
| Diseases of the Respiratory System 460-519) | 5,478 (21.7) | 910 (38.7) | 4,568 (19.9) | 2.54 (2.32–2.78) | <0.001 |
| Diseases of the Circulatory System (390-459) | 5,195 (20.5) | 395 (16.8) | 4,800 (20.9) | 0.76 (0.68–0.85) | <0.001 |
| Diseases of the Digestive System (520-579) | 3,343 (13.2) | 171 (7.3) | 3,172 (13.8) | 0.49 (0.42–0.57) | <0.001 |
| Injury and Poisoning (800-999) | 2,605 (10.3) | 65 (2.8) | 2,540 (11.1) | 0.23 (0.18–0.29) | <0.001 |
| Diseases of the Genitourinary System (580-629) | 2,026 (8.0) | 139 (5.9) | 1,887 (8.2) | 0.70 (0.59–0.84) | <0.001 |
| Infectious and Parasitic Diseases (001-139) | 1,926 (7.6) | 348 (14.8) | 1,578 (6.9) | 2.35 (2.08–2.66) | <0.001 |
| Neoplasms (140-239) | 1,135 (4.5) | 185 (7.9) | 950 (4.1) | 1.98 (1.68–2.33) | <0.001 |
| Symptoms, Signs, & Lab. Findings (780 – 799) | 981 (3.9) | 50 (2.1) | 931 (4.1) | 0.51 (0.39–0.68) | <0.001 |
| Mental Disorders (290-319) | 623 (2.5) | 3 (0.1) | 620 (2.7) | 0.05 (0.01–0.14) | <0.001 |
| Diseases of the Nervous System (320-389) | 490 (1.9) | 26 (1.1) | 464 (2.0) | 0.54 (0.36–0.81) | 0.002 |
| Diseases of the Blood (280-289) | 483 (1.9) | 18 (0.8) | 465 (2.0) | 0.37 (0.23–0.60) | <0.001 |
| Endocrine, Nutritional, and Metabolic (240-279) | 339 (1.3) | 24 (1.0) | 315 (1.4) | 0.74 (0.49–1.12) | 0.157 |
| Diseases of the Musculoskeletal System (710-739) | 230 (0.9) | 11 (0.5) | 219 (1.0) | 0.49 (0.27–0.89) | 0.018 |
| Complications of Pregnancy (630-679) | 224 (0.9) | 0 (0.0) | 224 (1.0) | NA | NA |
| Diseases of the Skin (680-709) | 112 (0.4) | 4 (0.2) | 108 (0.5) | 0.36 (0.13–0.98) | 0.037 |
| External Causes (E, V codes) | 70 (0.3) | 1 (0.1) | 69 (0.3) | 0.14 (0.02–1.02) | 0.023 |
| Congenital Malformations (740-759) | 20 (0.1) | 0 (0.0) | 20 (0.1) | NA | NA |
Figure A1.
ROC plots of the risk score obtained from the logistic model, evaluating its ability to identify the increased mortality risk in patients admitted to conventional units.
Figure A1.
ROC plots of the risk score obtained from the logistic model, evaluating its ability to identify the increased mortality risk in patients admitted to conventional units.
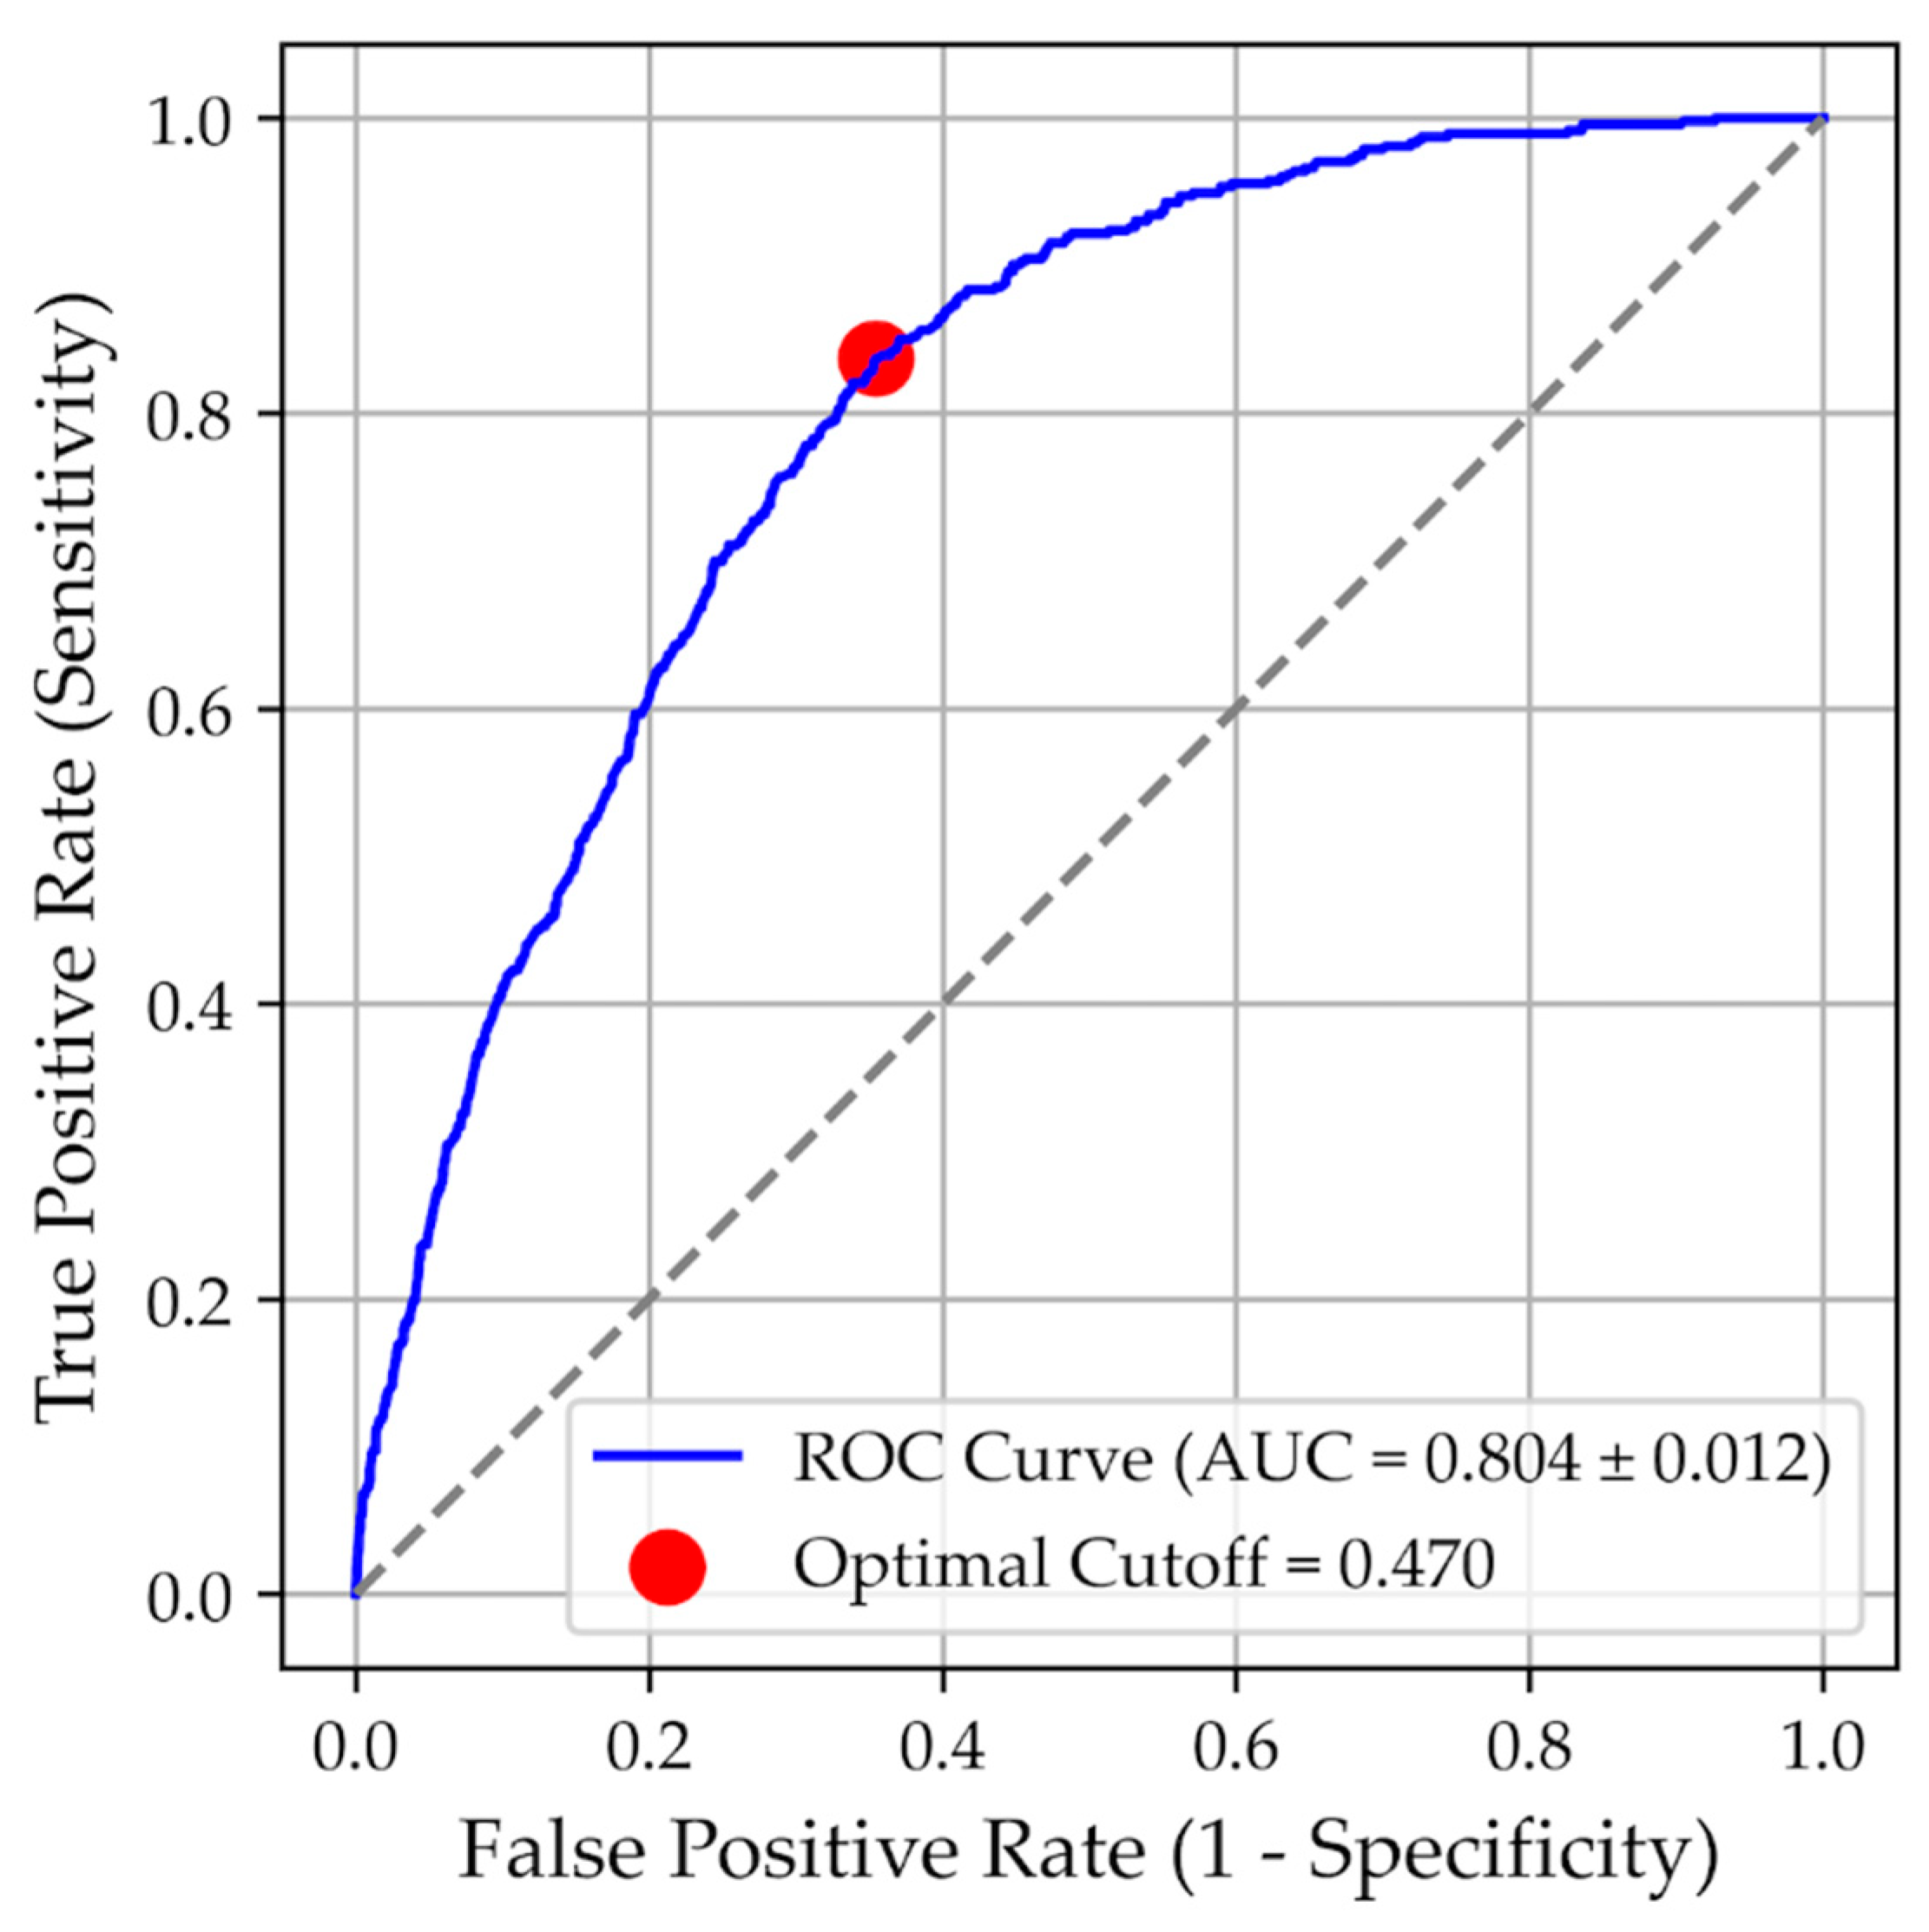
Figure A2.
Survival rate with percent of 30-day survival rate (left part) and hazard ratio with 95% Confidence Intervals (right part) in relation to individual HAI categories: SST is for skin and soft tissue, SS surgical site, UT for urinary tract, GI for gastrointestinal, PN: pneumonia, BS: blood stream. The hazard ratio increased, especially in categories BS and PN (left area).
References
- Sklar DP, Crandall CS, Loeliger E, Edmunds K, Paul I, Helitzer DL. Unanticipated Death After Discharge Home From the Emergency Department. Ann Emerg Med [Internet]. 2part007 June [cited 2025 Jan 10];49(6):735–45. Available from: https://linkinghub.elsevier.com/retrieve/pii/S019606440602542X.
- Adal O, Tsehay YT, Ayenew B, Abate TW, Mekonnen GB, Mulatu S, et al. The burden and predictors of hospital-acquired infection in intensive care units across Sub-Sahara Africa: systematic review and metanalysis. BMC Infect Dis [Internet]. 2025 Apr 29 [cited 2025 June 19];25:634. Available online: https://www.ncbi.nlm.nih.gov/pmc/articles/PMC12042380/. [CrossRef]
- Barrasa-Villar, JI; Aibar-Remón, C; Prieto-Andrés, P; Mareca-Doñate, R; Moliner-Lahoz, J. Impact on Morbidity, Mortality, and Length of Stay of Hospital-Acquired Infections by Resistant Microorganisms. Clin Infect Dis Off Publ Infect Dis Soc Am 2017, 65(4), 644–52. [Google Scholar] [CrossRef]
- Evans, S. Could a risk-assessment tool prevent hospital-acquired pneumonia? Br J Nurs Mark Allen Publ 2018, 27(7), 402–4. [Google Scholar] [CrossRef]
- McFee, RB. Nosocomial or Hospital-acquired Infections: An Overview. Dis Mon [Internet] 2009 July [cited 2025 June 19], 55(7), 422–38. Available online: https://www.ncbi.nlm.nih.gov/pmc/articles/PMC7094512/. [CrossRef] [PubMed]
- Quach, C; McArthur, M; McGeer, A; Li, L; Simor, A; Dionne, M; et al. Risk of infection following a visit to the emergency department: a cohort study. CMAJ Can Med Assoc J [Internet] 2012 Mar 6 [cited 2025 Oct 21], 184(4), E232–9. Available online: https://pmc.ncbi.nlm.nih.gov/articles/PMC3291696/. [CrossRef]
- Williams, B. The National Early Warning Score: from concept to NHS implementation. Clin Med Lond Engl. 2022, 22(6), 499–505. [Google Scholar] [CrossRef] [PubMed]
- Grafstein, E; Unger, B; Bullard, M; Innes, G. Canadian Emergency Department Information System (CEDIS) Presenting Complaint List (Version 1.0). CJEM 2003, 5(1), 27–34. [Google Scholar] [CrossRef]
- Huang Y qun, Gou R, Diao Y shu, Yin Q hua, Fan W xing, Liang Y ping, et al. Charlson comorbidity index helps predict the risk of mortality for patients with type 2 diabetic nephropathy. J Zhejiang Univ Sci B 2014, 15(1), 58–66.
- Fabbri, A; Tascioglu, AB; Bertini, F; Montesi, D. Overnight Stay in the Emergency Department and In-Hospital Mortality Among Elderly Patients: A 6-Year Follow-Up Italian Study. J Clin Med. 2025, 14(9), 2879. [Google Scholar] [CrossRef] [PubMed]
- Charlson, ME; Pompei, P; Ales, KL; MacKenzie, CR. A new method of classifying prognostic comorbidity in longitudinal studies: development and validation. J Chronic Dis. 1987, 40(5), 373–83. [Google Scholar] [CrossRef]
- Kärki T, Plachouras D, Cassini A, Suetens C. Burden of healthcare-associated infections in European acute care hospitals. Wien Med Wochenschr [Internet]. 2019 Feb 1 [cited 2025 Mar 3];169(1):3–5. [CrossRef]
- Point prevalence survey of healthcare-associated infections and antimicrobial use in European acute care hospitals – 2022-2023 [Internet]. 2024 [cited 2025 Mar 13]. Available online: https://www.ecdc.europa.eu/en/publications-data/PPS-HAI-AMR-acute-care-europe-2022-2023.
- Agresti A, Caffo B. Simple and Effective Confidence Intervals for Proportions and Differences of Proportions Result from Adding Two Successes and Two Failures. Am Stat [Internet]. 2000 Nov 1 [cited 2025 Jan 10];54(4):280–8. [CrossRef]
- Mirhaghi, A; Heydari, A; Mazlom, R; Ebrahimi, M. The Reliability of the Canadian Triage and Acuity Scale: Meta-analysis. North Am J Med Sci 2015, 7(7), 299–305. [Google Scholar] [CrossRef]
- Fluss, R; Faraggi, D; Reiser, B. Estimation of the Youden Index and its Associated Cutoff Point. Biom J [Internet] Available from. 2005 [cited 2025 Jan 13], 47(4), 458–72. [Google Scholar] [CrossRef]
- Ali, H; Salleh, MNM; Hussain, K; Ahmad, A; Ullah, A; Muhammad, A; et al. A review on data preprocessing methods for class imbalance problem. Int J Eng.
- Raoofi S, Kan FP, Rafiei S, Hosseinipalangi Z, Mejareh ZN, Khani S, et al. Global prevalence of nosocomial infection: A systematic review and meta-analysis. PLOS ONE [Internet]. 2023 Jan 27 [cited 2025 June 20];18(1):e0274248. Available online: https://journals.plos.org/plosone/article?id=10.1371/journal.pone.0274248. [CrossRef]
- Schuttevaer, R; Boogers, W; Brink, A; van Dijk, W; de Steenwinkel, J; Schuit, S; et al. Predictive performance of comorbidity for 30-day and 1-year mortality in patients with bloodstream infection visiting the emergency department: a retrospective cohort study. BMJ Open 2022, 12(4), e057196. [Google Scholar] [CrossRef] [PubMed]
- Yu XL, Zhou LY, Huang X, Li XY, Pan QQ, Wang MK, et al. Urgent call for attention to diabetes-associated hospital infections. World J Diabetes [Internet]. 2024 Aug 15 [cited 2025 June 20];15(8):1683–91. Available online: https://www.ncbi.nlm.nih.gov/pmc/articles/PMC11346093/. [CrossRef]
- Deng B, Li P, Liu Y, Xie J, Huang Y, Sun Q, et al. Investigation of hospital-acquired infections prevalence and analysis of influencing factors: a case study of a specialized infectious disease hospital in Chongqing, 2017–2023. Front Public Health [Internet]. 2024 Oct 17 [cited 2025 Nov 6];12:1417645. Available online: https://pmc.ncbi.nlm.nih.gov/articles/PMC11524860/. [CrossRef] [PubMed]
- McPhail, S; Swann, R; Johnson, SA; Barclay, ME; Abd Elkader, H; Alvi, R; et al. Risk factors and prognostic implications of diagnosis of cancer within 30 days after an emergency hospital admission (emergency presentation): an International Cancer Benchmarking Partnership (ICBP) population-based study. Lancet Oncol 2022, 23(5), 587–600. [Google Scholar] [CrossRef] [PubMed]
- Battaglia CC, Hale K. Hospital-Acquired Infections in Critically Ill Patients With Cancer. J Intensive Care Med [Internet]. 2019 July 1 [cited 2025 Nov 12];34(7):523–36. [CrossRef] [PubMed]
- van Mourik MSM, van Duijn PJ, Moons KGM, Bonten MJM, Lee GM. Accuracy of administrative data for surveillance of healthcare-associated infections: a systematic review. BMJ Open [Internet]. 2015 Aug 27 [cited 2025 July 24];5(8):e008424. Available online: https://www.ncbi.nlm.nih.gov/pmc/articles/PMC4554897/. [CrossRef]
- Kakehi, E; Uehira, R; Ohara, N; Akamatsu, Y; Osaka, T; Sakurai, S; et al. Utility of the New Early Warning Score (NEWS) in combination with the neutrophil-lymphocyte ratio for the prediction of prognosis in older patients with pneumonia. Fam Med Community Health 2023, 11(2), e002239. [Google Scholar] [CrossRef]
- Liang, SY; Theodoro, DL; Schuur, JD; Marschall, J. Infection Prevention in the Emergency Department. Ann Emerg Med [Internet] 2014 Sept [cited 2025 Mar 6], 64(3), 299–313. Available online: https://www.ncbi.nlm.nih.gov/pmc/articles/PMC4143473/. [CrossRef] [PubMed]
- Magill, SS; Edwards, JR; Bamberg, W; Beldavs, ZG; Dumyati, G; Kainer, MA; et al. Multistate point-prevalence survey of health care-associated infections. N Engl J Med. 2014, 370(13), 1198–208. [Google Scholar] [CrossRef] [PubMed]
- Stewart, S; Robertson, C; Pan, J; Kennedy, S; Haahr, L; Manoukian, S; et al. Impact of healthcare-associated infection on length of stay. J Hosp Infect 2021, 114, 23–31. [Google Scholar] [CrossRef]
- Muehlschlegel S, Rajajee V, Wartenberg KE, Alexander SA, Busl KM, Creutzfeldt CJ, et al. Guidelines for Neuroprognostication in Critically Ill Adults with Moderate–Severe Traumatic Brain Injury. Neurocrit Care [Internet]. 2024 [cited 2025 June 17];40(2):448–76. Available online: https://www.ncbi.nlm.nih.gov/pmc/articles/PMC10959796/. [CrossRef]
- Nelson, RE; Nelson, SD; Khader, K; Perencevich, EL; Schweizer, ML; Rubin, MA; et al. The Magnitude of Time-Dependent Bias in the Estimation of Excess Length of Stay Attributable to Healthcare-Associated Infections. Infect Control Hosp Epidemiol 2015, 36(9), 1089–94. [Google Scholar] [CrossRef]
Figure 1.
Flow diagram of study patients during the study period 2023-2024.
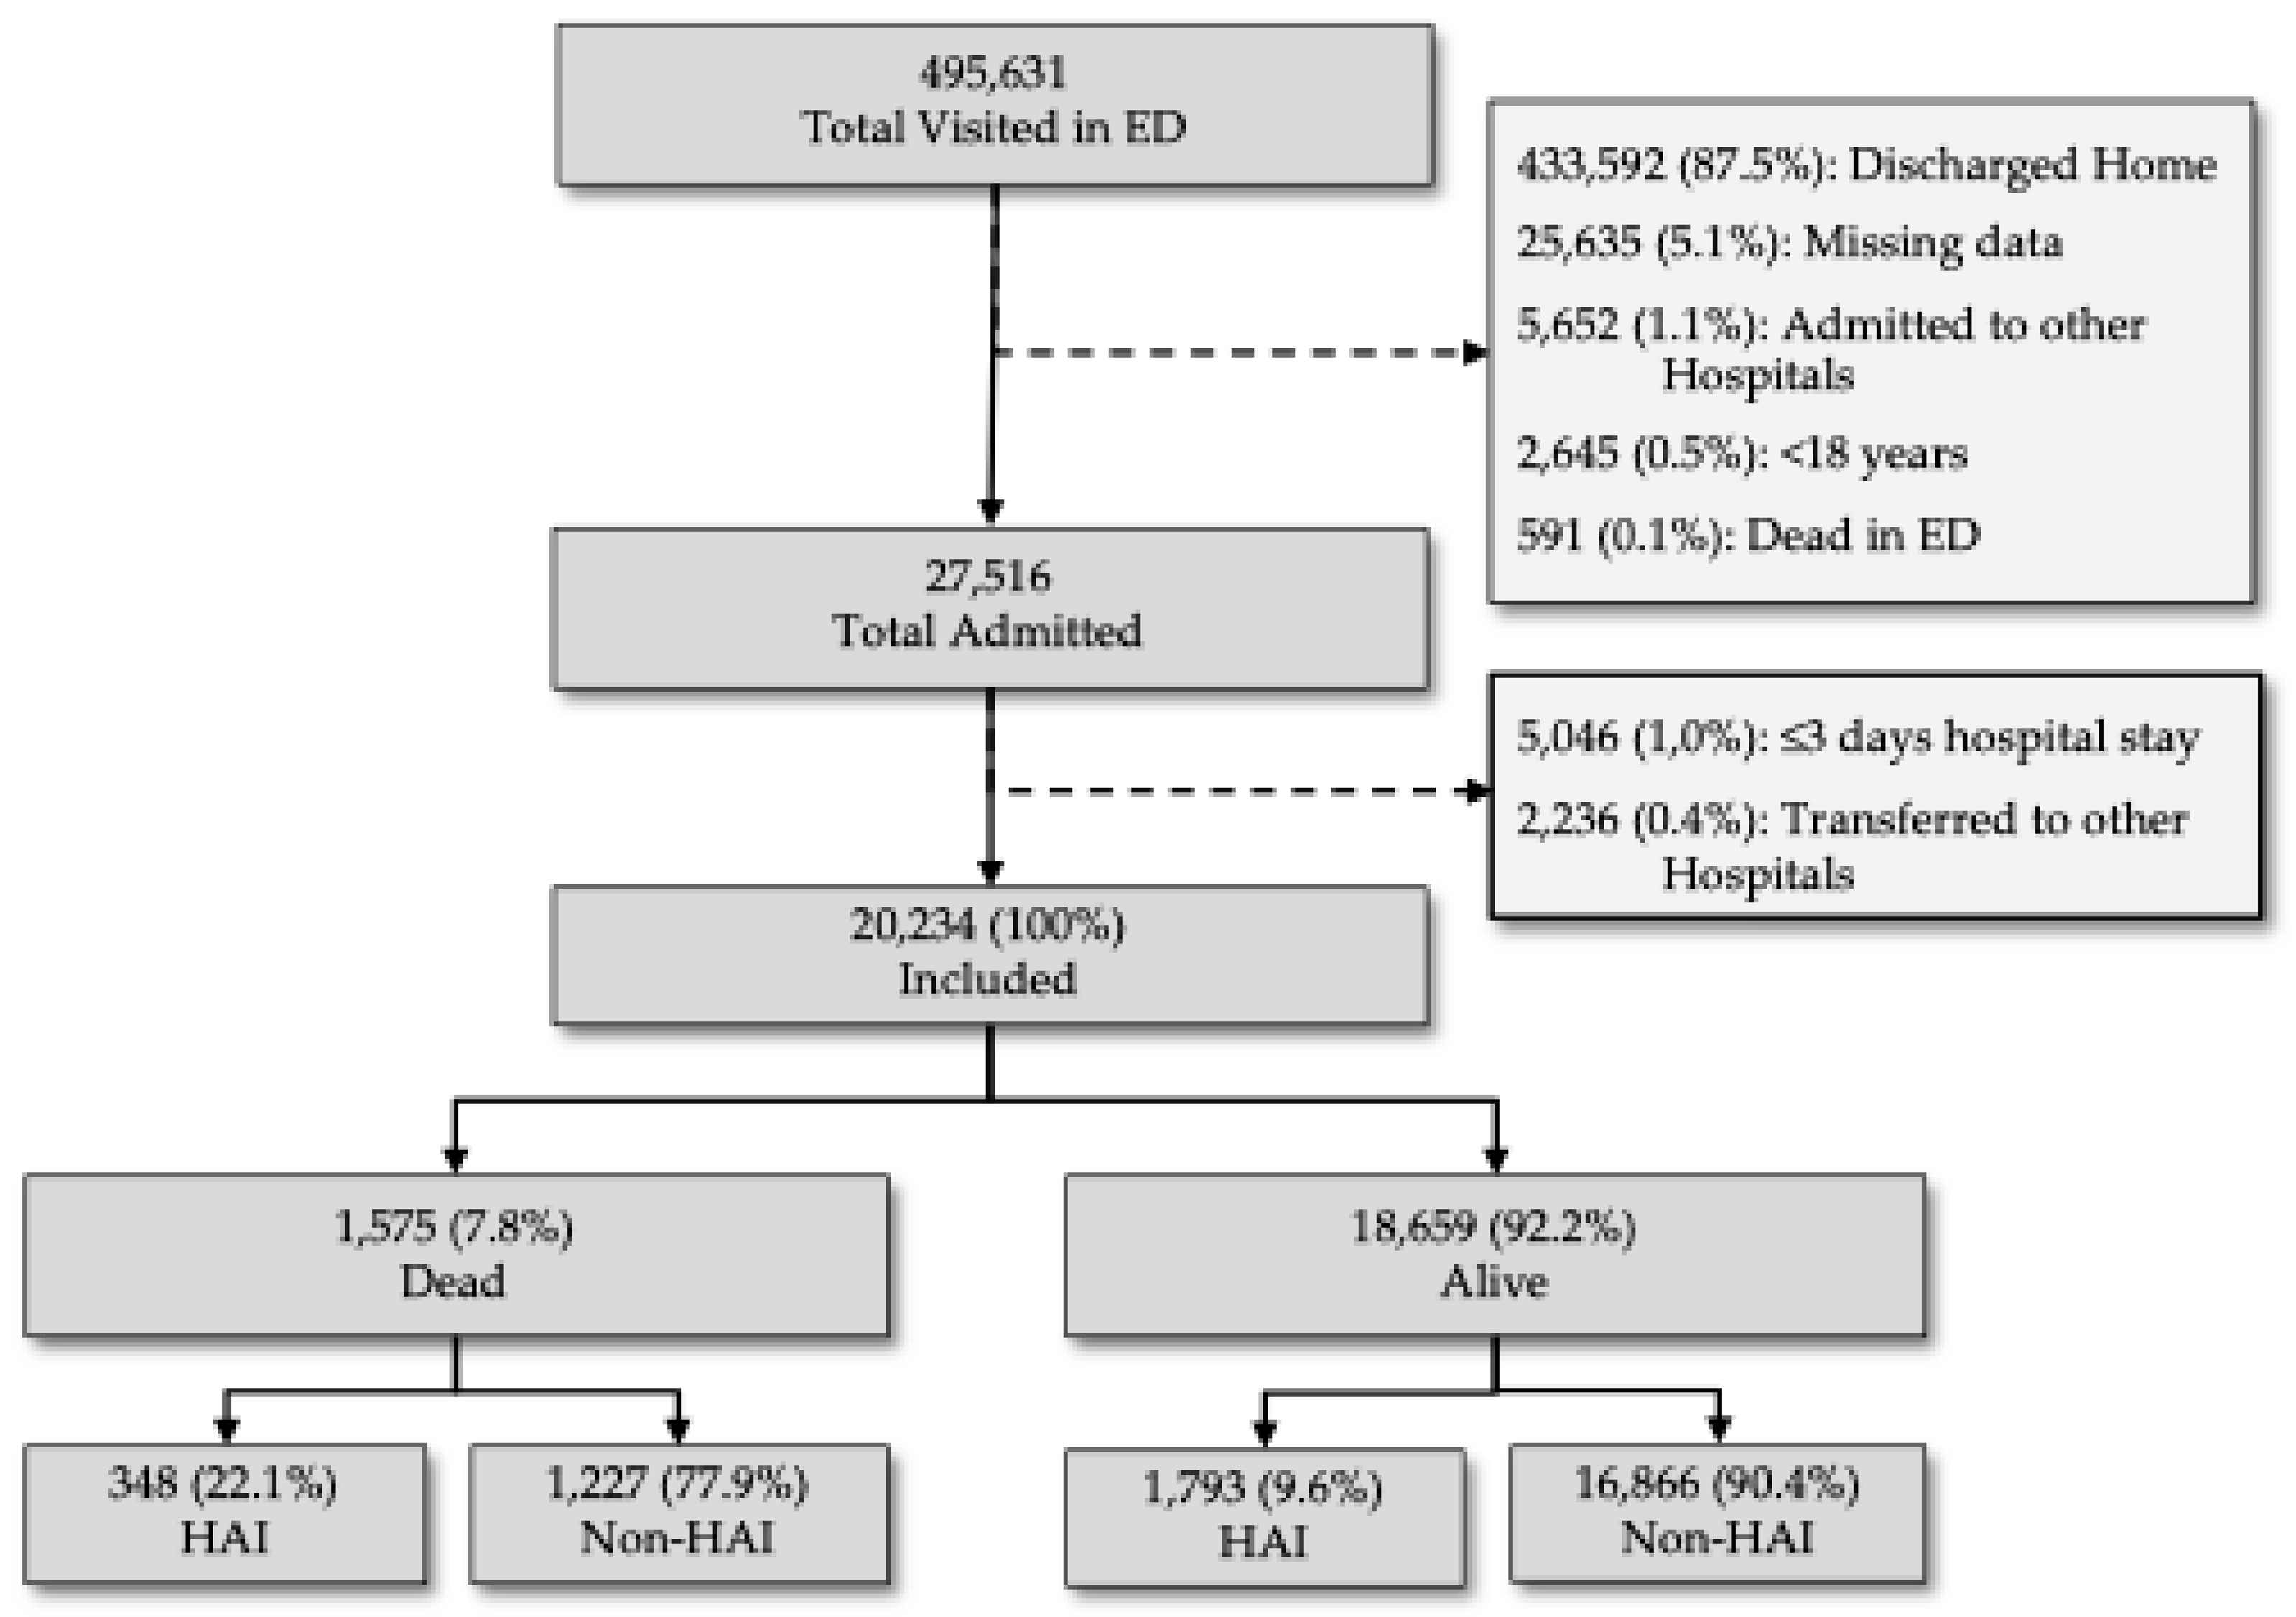
Figure 2.
Forest plot of the selected variables entered into the Cox hazard model in the prediction of mortality. Data are reported in order of importance as Hazard Ratio and 95% Confidence intervals.
Figure 2.
Forest plot of the selected variables entered into the Cox hazard model in the prediction of mortality. Data are reported in order of importance as Hazard Ratio and 95% Confidence intervals.
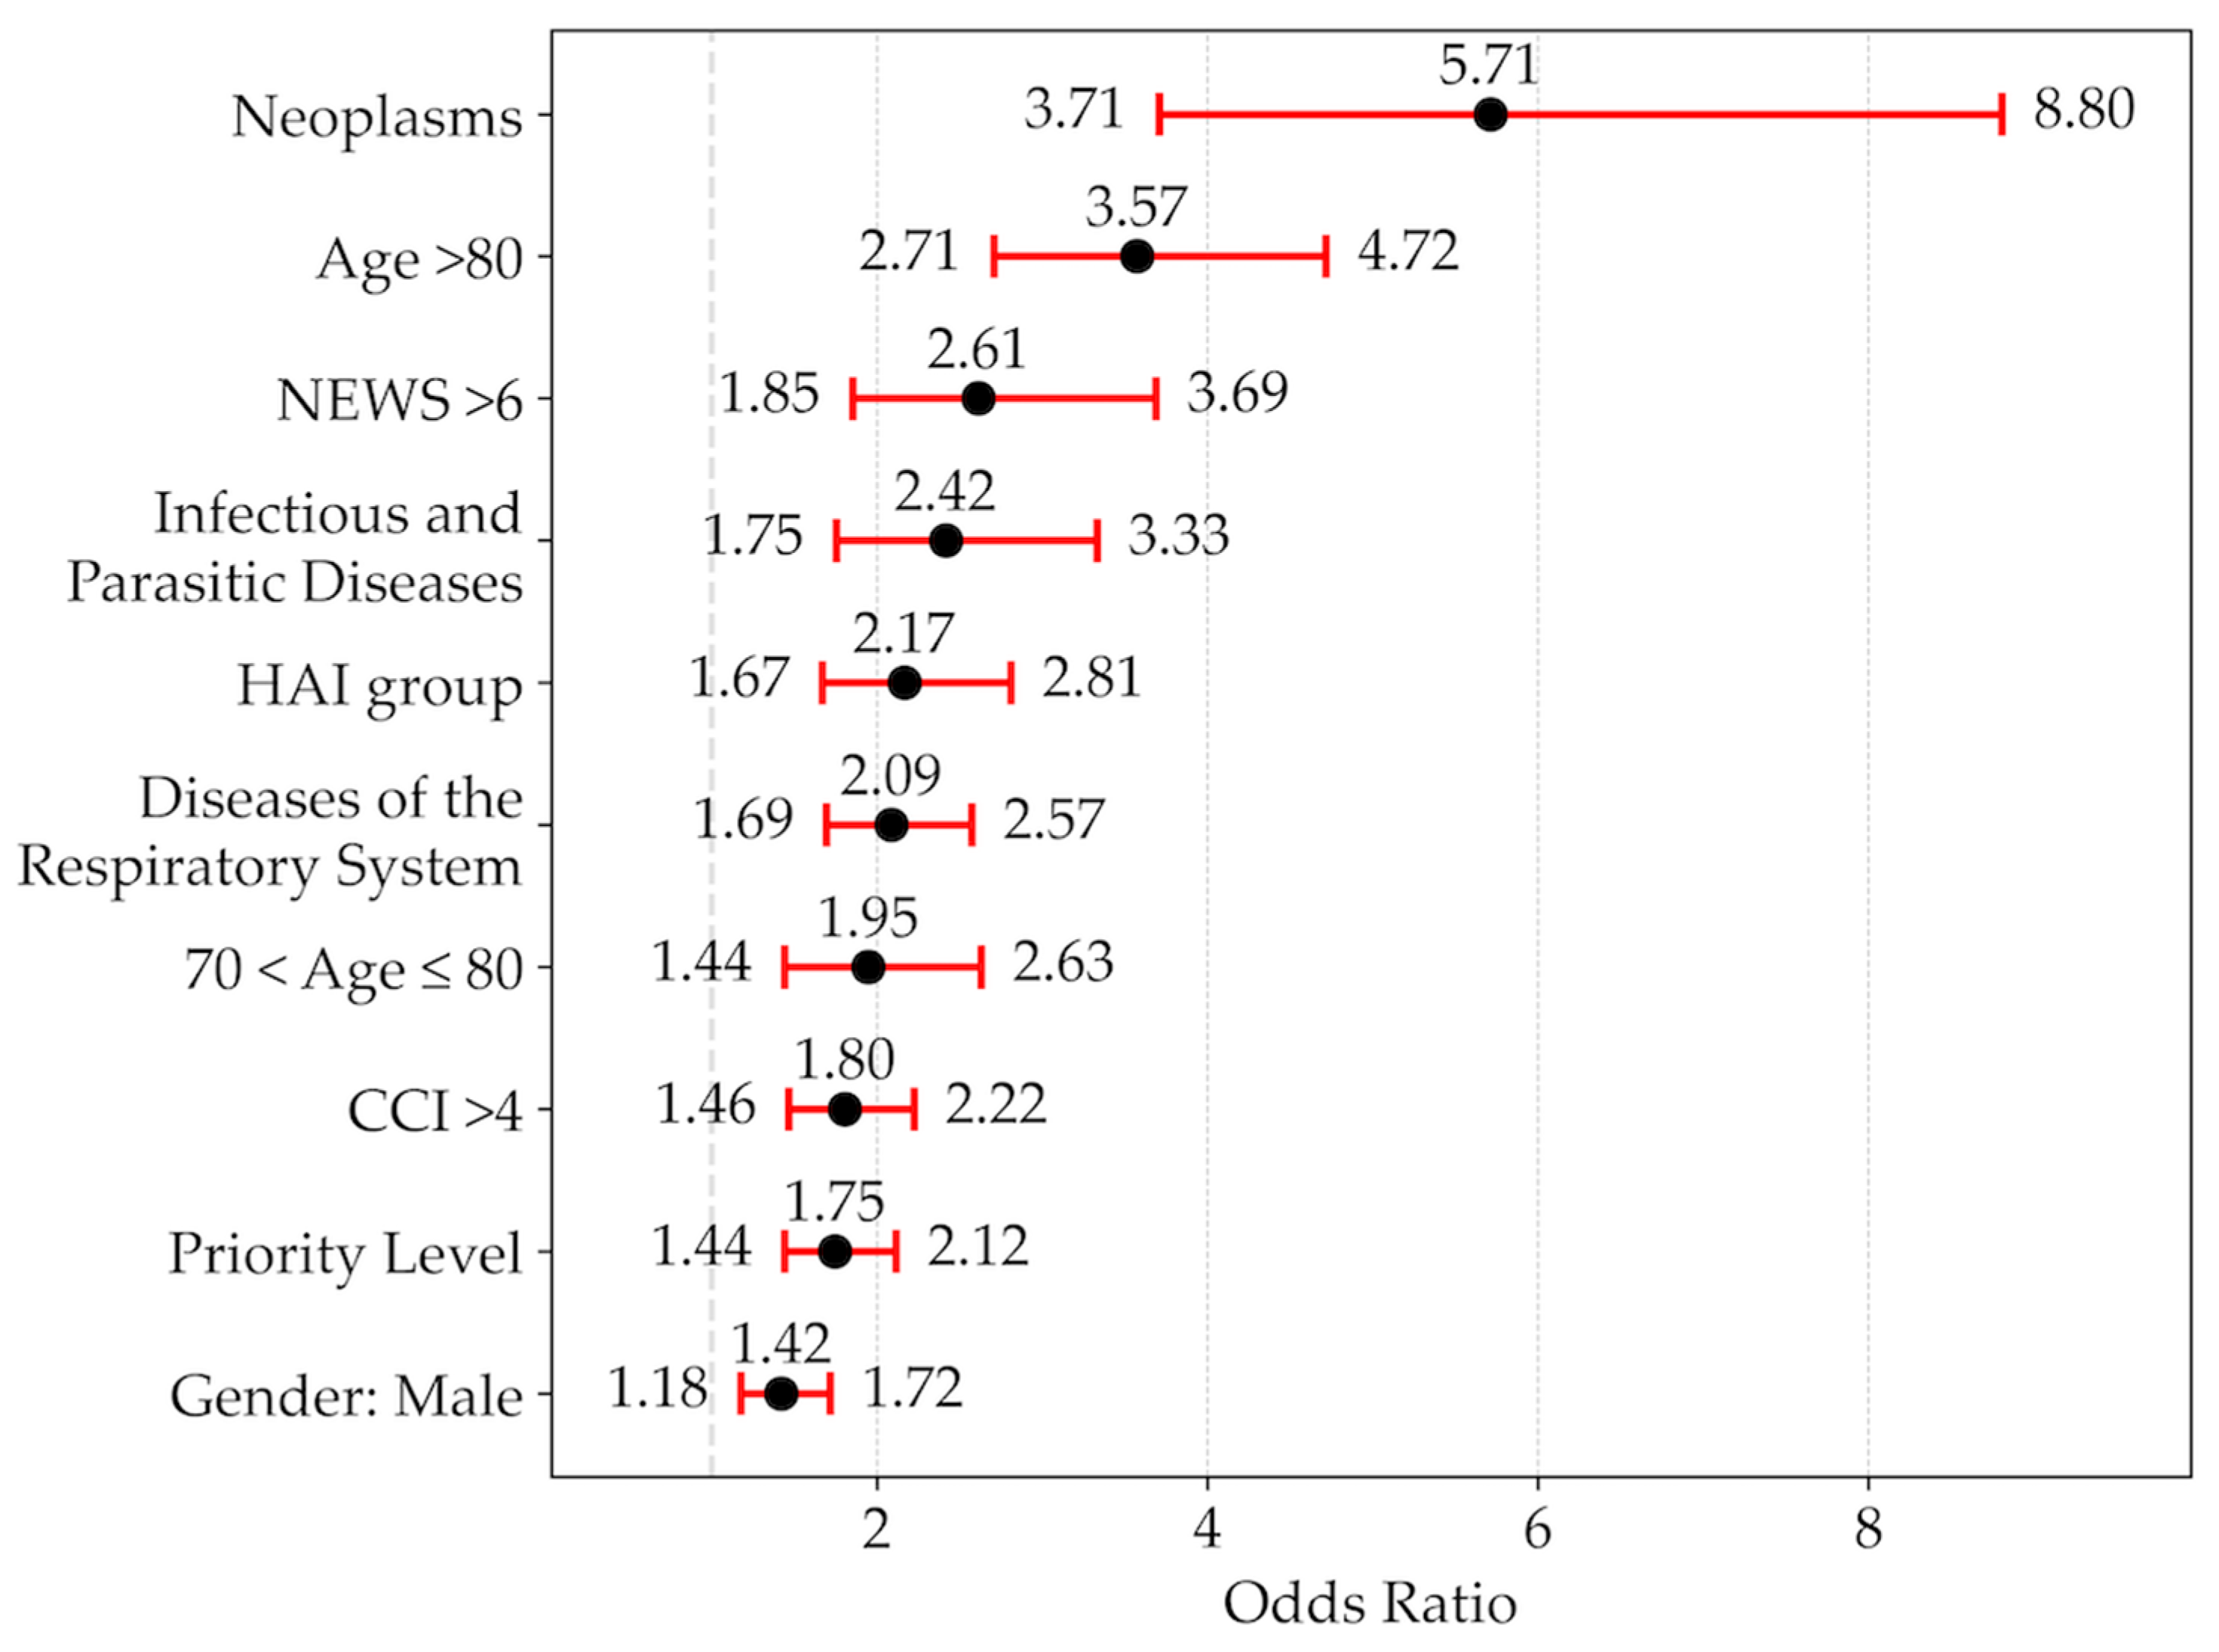
Figure 3.
Cumulative survival rate for the 2 different groups HAI (red line) vs. non-HAI category (green line). The log-rank test (Mantel–Cox test) was used to compare the survival distributions (%) between the different groups.
Figure 3.
Cumulative survival rate for the 2 different groups HAI (red line) vs. non-HAI category (green line). The log-rank test (Mantel–Cox test) was used to compare the survival distributions (%) between the different groups.
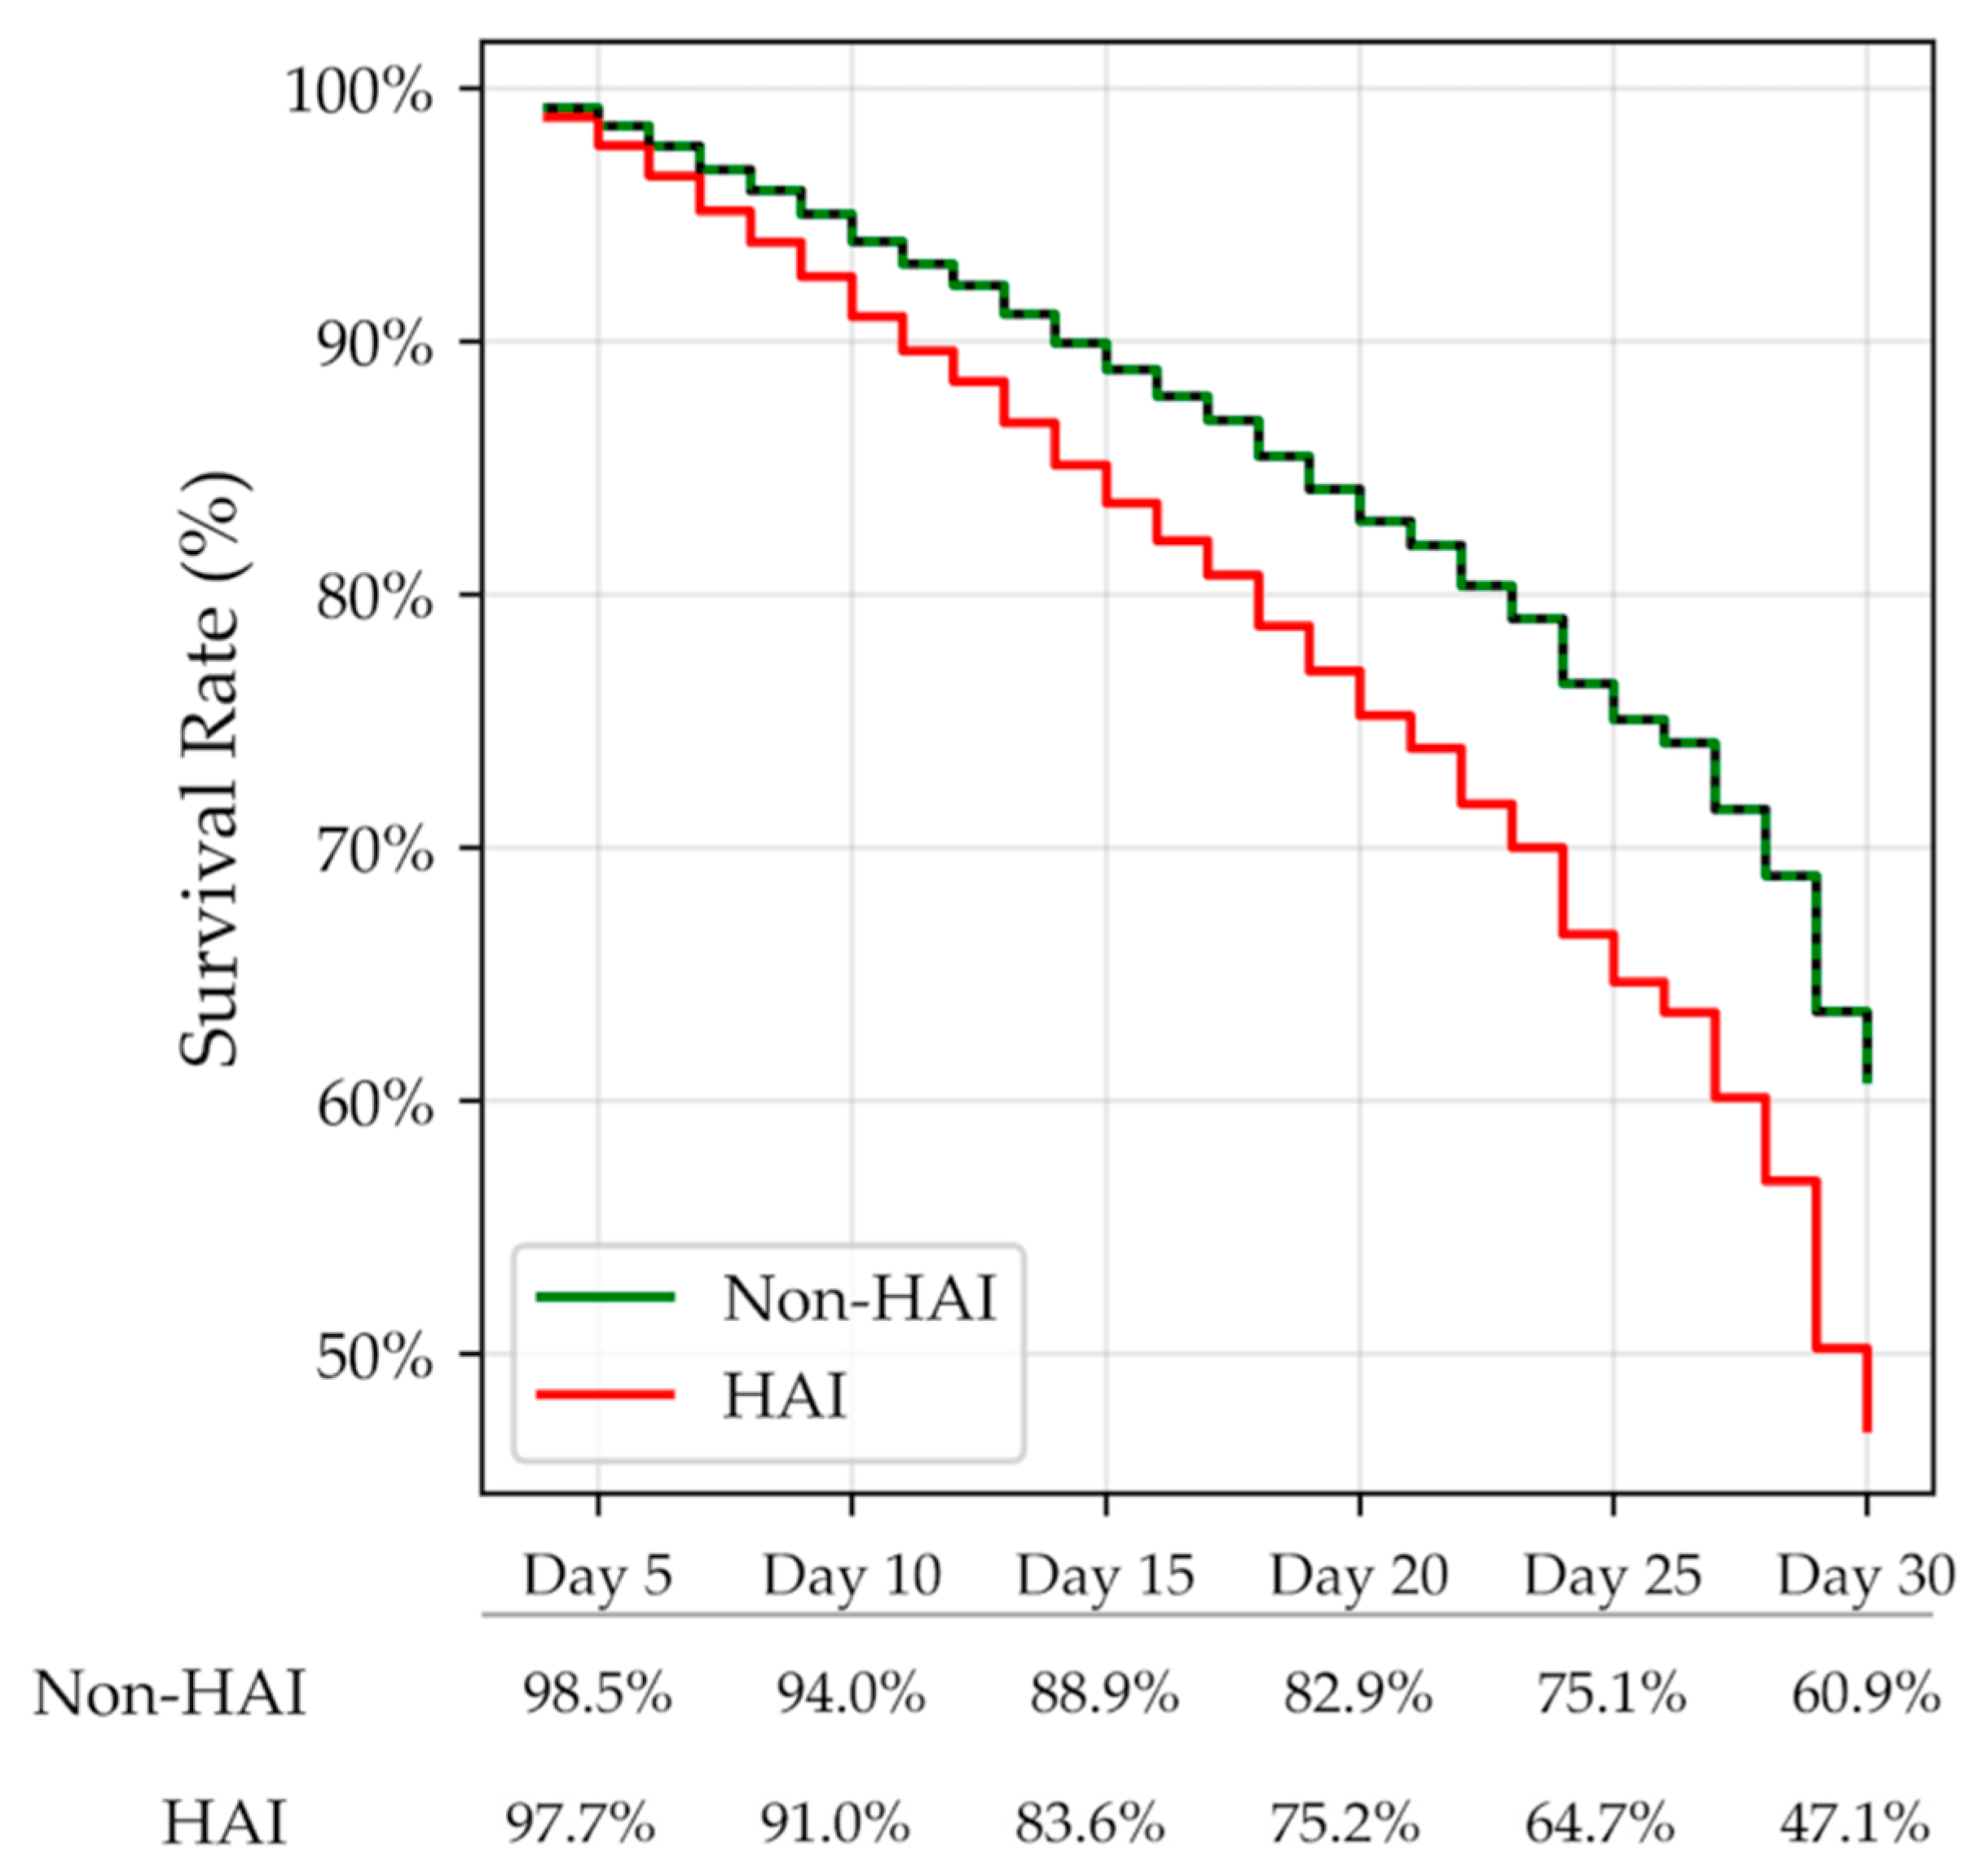
Table 1.
Baseline characteristics at entry in ED in relation to the clinical profile of subjects dead or alive at 30-day follow up. .
Table 1.
Baseline characteristics at entry in ED in relation to the clinical profile of subjects dead or alive at 30-day follow up. .
| Total, No. | Dead, No. (%) | Alive, No. (%) | OR (95% CI) | P-value | |
|---|---|---|---|---|---|
| Patients | 28,803 | 2,359 (9.3) | 22,930 (90.7) | -- | -- |
| Sex (males) | 12,694 (50.2) | 1,177 (50.1) | 11,517 (50.2) | 0.99 (0.91–1.08) | 0.896 |
| Age (years) | 78 [64–86] | 86 [79–91] | 77 [18 – 106] | -- | NS |
| 18 - 30 | 998 (3.9) | 3 (0.1) | 995 (4.3) | 0.03 (0.01–0.09) | <0.001 |
| 31 - 40 | 885 (3.5) | 8 (0.3) | 877 (3.8) | 0.09 (0.04–0.17) | <0.001 |
| 41 - 50 | 1,274 (5.0) | 19 (0.8) | 1,255 (5.5) | 0.14 (0.09–0.22) | <0.001 |
| 51 - 60 | 2,238 (8.8) | 64 (2.7) | 2,174 (9.5) | 0.27 (0.21–0.34) | <0.001 |
| 61 - 70 | 3,256 (12.9) | 175 (7.4) | 3,081 (13.4) | 0.52 (0.44–0.61) | <0.001 |
| 71 - 80 | 5,695 (22.5) | 418 (17.8) | 5,277 (23.0) | 0.72 (0.65–0.81) | <0.001 |
| >80 | 1[18–1060,934 (43.2) | 1,663 (70.8) | 9,271 (40.4) | 3.57 (3.25–3.91) | <0.001 |
| NEWS | |||||
| 0 - 3 | 21,317 (84.3) | 1,488 (63.3) | 19,829 (86.5) | 0.27 (0.25–0.30) | <0.001 |
| 4 - 6 | 2,258 (8.9) | 406 (17.3) | 1,852 (8.1) | 2.38 (2.11–2.67) | <0.001 |
| >6 | 1,705 (6.7) | 456 (19.4) | 1,249 (5.4) | 4.18 (3.72–4.70) | <0.001 |
| CCI | |||||
| 1 - 2 | 5,563 (22.1) | 66 (2.81) | 5,497 (24.0) | 0.09 (0.07–0.12) | <0.001 |
| 3 - 4 | 7,632 (30.2) | 512 (21.8) | 7,120 (31.0) | 0.62 (0.56–0.68) | <0.001 |
| >4 | 12,085 (47.8) | 1,772 (75.4) | 10,313 (45.0) | 3.75 (3.40–4.13) | <0.001 |
Data are reported as number of cases (N), and percentages (%), with difference expressed as odds ratios (OR) with 95% confidence intervals (95% CI). Percentages are calculated relative to the total number of cases. A P-value of <0.001 was considered statistically significant. NEWS: New Early Warning Score, CCI: Charlson Comorbidity Index.
Table 2.
Healthcare-associated infections (HAI) by category in subjects visited in ED. Data are reported in order of frequency as the number of cases and percentage (%). Patients with multiple HAI categories are counted only once in the analysis.
Table 2.
Healthcare-associated infections (HAI) by category in subjects visited in ED. Data are reported in order of frequency as the number of cases and percentage (%). Patients with multiple HAI categories are counted only once in the analysis.
| HAI categories | No. = 2,141 | % | |
|---|---|---|---|
| Pneumonia (PN) | |||
| 485 | Bronchopneumonia, unspecified | 217 | 10.1 |
| 460 – 466 | Acute & lower respiratory tract infections | 115 | 5.4 |
| 486 | Pneumonia, unspecified | 162 | 7.6 |
| 480 | Viral pneumonia | 44 | 0.2 |
| 482-3, 484.0-7-8, 487-8 | Pneumonia due to another organism | 352 | 16.4 |
| 481 | Pneumococcal pneumonia | 29 | 0.1 |
| Total | 890 | 41.6 | |
| Urinary tract (UT) | |||
| 599.0 | Urinary infection (unspecified site) | 697 | 32.5 |
| 590.1 | Acute pyelonephritis | 24 | 0.1 |
| 996.64 | Infection due to urinary catheter | 13 | 0.1 |
| Total | 734 | 34.3 | |
| Blood Stream (BS) | |||
| 995.91, 995.92 | Sepsis | 181 | 8.4 |
| 038, 038.4 | Septicemia (including specific organisms) | 149 | 7.0 |
| 038.8, 038.9, 790.7 | Septicemia unspecified, bacteriemia | 139 | 5.6 |
| 038.0-1 | Septicemia due to Streptococcus | 98 | 4.6 |
| 038.2 | Septicemia due to Gram neg. bacteria | 1 | 0.0 |
| Total | 568 | 26.5 | |
| Gastrointestinal (GI) | |||
| 008.45 | Intestinal infection (Clostridium difficile) | 76 | 3.5 |
| 009.0-3 | Infectious enteritis, unspecified | 33 | 1.5 |
| 008.5x, 009.2, 099.3 | Other intestinal infections due to bacteria | 5 | 0.1 |
| Total | 114 | 5.3 | |
| Surgical Site (SS) | |||
| 996.6x | Infection due to internal prosthetic device | 33 | 1.5 |
| 998.5-9 | Other post-operative infection | 2 | 0.1 |
| 998.50-4, 998.51 | Post operative wound infection, | 12 | 0.1 |
| Total | 47 | 2.1 | |
| Skin & Soft Tissue (SST) | |||
| 680-686 | Other cellulitis and abscess | 40 | 0.2 |
Disclaimer/Publisher’s Note: The statements, opinions and data contained in all publications are solely those of the individual author(s) and contributor(s) and not of MDPI and/or the editor(s). MDPI and/or the editor(s) disclaim responsibility for any injury to people or property resulting from any ideas, methods, instructions or products referred to in the content. |
© 2025 by the authors. Licensee MDPI, Basel, Switzerland. This article is an open access article distributed under the terms and conditions of the Creative Commons Attribution (CC BY) license.
Copyright: This open access article is published under a Creative Commons CC BY 4.0 license, which permit the free download, distribution, and reuse, provided that the author and preprint are cited in any reuse.


