
Submitted:
24 November 2024
Posted:
25 November 2024
You are already at the latest version
Abstract
Healthcare-associated infections (HAI) represent a major challenge in patient safety that affect services disproportionally. This paper aimed to assess how HAI prevalence varies between hospital services, and what contextual characteristics may explain such variance. A cross-sectional study was conducted on adult patients in Portuguese hospitals, using data from the European point prevalence survey (PPS) of HAI prevalence. Study variables included patient, structural and process variables. Variables were tested in a univariate logistic regression as risk factors, with patients clustered in hospitals. Variables with a p-value ≤0.2 were tested in a multivariable model. A total 736 patients from 56 intensive care units (ICU), 3160 from 72 surgical departments and 8081 from 90 medical departments were included. HAI prevalence was 7.9%, 5.9% and 1.7%, respectively. In ICU, only the number of devices was associated with HAI prevalence. In surgical departments, age, comorbidities, being a specialized hospital and a higher ratio of infection prevention and control (IPC) personnel were associated with higher SSI. Safety climate was associated with lower SSI. In Medicine departments, age and devices were positively associated, whereas a larger ratio of IPC nurses was negatively associated. These results may help implement targeted interventions to achieve optimal results in each department.
Keywords:
context
; healthcare-associated infections
; hospital determinants
; multi-level
; prevalence
1. Introduction
Healthcare-associated infections (HAI) represent one of the major challenges in patient safety, and are associated with increased mortality, length of stay, morbidity and health expenditure. In Europe alone, they are estimated to represent almost 2.5 million disability-adjusted life years [1,2]. In the last point prevalence survey (PPS) of HAI and antimicrobial use in European acute care hospitals by the European Centre for Disease Prevention and Control (ECDC), in 2023, Portugal had a HAI prevalence of 9.9%, after validation. The result was above the ECDC projection, when adjusted for patient case-mix and hospital characteristics [3].
Extensive research has demonstrated how compliance with hand hygiene [4] and the implementation of preventive strategies in a bundle approach [5,6,7,8] may help decrease the risk of these infections. However, the role of structural variables – both infrastructure and human resources – and process variables, namely related to surveillance and infection prevention programs, remains to be established, and has seldom been researched. Published systematic reviews suggest that higher nurse staffing and the establishment of surveillance for over 5 years may be associated with decreased incidence of hospital-acquired pneumonia in intensive care units (ICU) and of surgical site infection (SSI) after colorectal surgery, respectively [9,10,11].
Better outcomes require improved processes and adequate resources [12]. Therefore, understanding the relationship between context and HAI is essential to optimize patient safety at the hospital setting. At the same, HAI are heterogeneous and affect services disproportionally, not only in terms of their overall incidence, but also in terms of the relative frequency of specific HAI [3]. Thus, it is relevant to understand how structure and process indicators relate to the different HAI in each major department, to implement maximally effective targeted interventions. One size may not fit all.
As such, this study aimed to assess whether HAI prevalence varies between hospitals, ICU, surgical and medical departments, and whether such variance may be explained by hospital characteristics, resources or implemented multimodal strategies.
2. Methods
2.1. Study Protocol
A cross-sectional study was conducted in Portuguese hospitals participating in the PPS of the ECDC, following their protocol [13], and under the supervision of the Portuguese Program for Infection and Antimicrobial Resistance Prevention of the Directorate-General of Health. Healthcare professionals collected data from patient medical records and nurses’ notes and registered them using the HelicsWin software application. All data collection in each ward was performed on one single day. Data on all hospitals were collected between May 15th and May 19th, 2023, with the exception of one hospital, that collected data on May 30th, 2023. Patients younger than 18 years of age were excluded from this study. One hospital was excluded as it did not provide data on structural and process variables.
2.2. Study Variables
Data were collected at hospital and patient levels. Data at the individual patient level included patient’s age, sex, McCabe score, which assesses the severity of patients’ comorbidities (ultimately fatal, rapidly fatal non-fatal, or unknown), and device use (central vascular catheter, intubation and/or urinary catheter).
Structural variables included the total number of acute beds, categorized in < 250 beds, 250-500 beds, and >500 beds, total number of isolation rooms in the hospital, hospital type (primary, secondary, specialized and tertiary), and location by health administrative region, divided into Norte, Lisboa e Vale do Tejo (LVT), Centro and Other, the latter encompassing the hospitals from Algarve, Alentejo, Madeira and Azores. The ratio of doctors and nurses full time equivalent (FTE) working in infection control per hospital bed, number of professionals working on antimicrobial stewardship per hospital bed and existence or not of an infection prevention and control plan and report approved by the hospital administration were also included.
Process variables included the use of masks, either on routine care or universally, hospital participation in surveillance networks for SSI, HAI in ICU, Clostridioides difficile infection, antimicrobial consumption, antimicrobial resistance, availability of clinical tests on weekends and availability of screening tests on weekends.
Furthermore, data on multimodal strategy use for implementation of infection prevention and control (IPC) interventions were collected, following the World Health Organization’s Core component 5 of infection prevention [14]. Having an IPC multidisciplinary team, regular link to develop multimodal strategies with colleagues, and the use of bundles or checklists were available in binary responses (yes or no). System change, education and training, monitoring and feedback, communication and reminders, and safety climate and culture change were each assessed with three possible answers: element not included in multimodal strategies, element included to a degree, and element fully included. The exact definitions are available on the point prevalent survey protocol [13] and in supplementary Table S1.
2.3. Statistical Analysis
Each observation corresponded to one patient. Descriptive data are reported as absolute and relative frequency and medians with interquartile range, where applicable. Analysis considered patients clustered in hospitals, in a two-level hierarchical data structure. Variance of the outcome was given by τ2. An initial model was built for the entire study population, using a multi-level logistic regression, by fitting fully unconditional random-effects models with random intercepts at the hospital level. This model was used to assess the variance of HAI between hospitals. Only catheter-line associated bloodstream infections (CLABSI), SSI, catheter-associated urinary infections (CAUTI) and intubation-associated pneumonia (IAP) were considered in the outcome, since these represent not only the more prevalent and relevant infections, but also those who are under local and national surveillance, following the HAI-Net protocol [3,15]. The codes from the ECDC’s PPS used to define these infections are available as supplementary Table S2, and the flowchart of inclusion criteria for HAI is available as supplementary Figure 1. The null model was used to estimate the intraclass cluster coefficient (ICC), which provides the proportion of total observed individual variation in the outcome that may be attributable to between hospital variation. It is estimated as τ2/(τ2+(π2/3)), where π refers to the mathematical constant, approximately equal to 3.14159. The same model was used to estimate the median odds ratio (MOR), defined as the median value of the odds ratio (OR) between the hospital at highest risk and the hospital at lowest risk of infection, when randomly selecting two patients with the same covariates from different hospitals.
Study variables were tested in a univariate multi-level logistic regression as risk factors for infection. Variables with a p-value ≤0.2 in univariate analysis were tested in a multivariable model [16]. A two-sided significance level of 0.05 was considered. Collinearity was assessed in the multivariable model using the generalised variance inflation factor (GVIF). To make GVIF comparable across dimensions, GVIF(1/(2*Df)), where Df represent the number of coefficients in the subset, was used [17]. A value of 5 or above was interpreted as presence of collinearity, and any variable meeting the threshold was dropped. The contextual effect of each included variable was given by its β-coefficient and respective p-value.
The analysis was repeated for three different subgroups: ICU, the surgical departments and the medical departments. For the analysis of ICU, stroke and coronary units were not included. The outcome considered the same infections as for the entire population. In surgical department, the outcome considered was SSI alone, as these are the only HAI under surveillance in those wards. Hence, admitted patients without previous surgery were excluded in this sub-analysis. In the medical department, the outcome was CAUTI, which is the most prevalent infection in these wards and the one under surveillance in that context.
The analysis was performed using R, version 4.4.0, using ‘merTools’, ‘lme4’ and ‘car’ packages.
3. Results
A total of 18 261 patients from 119 hospitals were included in the analysis, of which 736 were in 56 ICU, 3 160 in 72 surgical departments and 8 081 in 90 medical departments (Figure 1). The overall prevalence of any HAI under surveillance (SSI, CLABSI, IAP and CAUTI) was 3.5%. Baseline characteristics of the population, both at the individual and hospital levels, are presented in Table 1, for the entire population and per department. Most hospitals had fewer than 250 beds, although patients were almost evenly distributed across differently-sized hospitals. HAI prevalence was 7.9% in ICU, whereas SSI prevalence was 5.9% in surgical departments and CAUTI prevalence was 1.7% in medical departments.
The estimated variance of the random effects in the null model was 0.2579, corresponding to an ICC of 0.07 and a MOR of 1.62. The surgical and medical departments had a variance of 0.1875 and 0.1796 and a MOR of 1.51 and 1.50, respectively, both with an ICC of 0.05. The variance in ICU was markedly lower – 0.0299, corresponding to an ICC of 0.01 and a MOR of 1.18. The simulated random effects are plotted in Figure 2. The effect is presented in odds ratio, between each hospital and the overall average.
Univariate and multivariable analyses are presented in Table 2, overall and per department. A total of 15 variables were included in the multivariable multi-level logistic regression model for the entire hospital. Age and number of devices were identified as individual-level variables associated with higher risk of infection, whereas being in the 4th quartile in number of isolation rooms, being in the 4th quartile in the ratio of infection prevention doctor to number of acute beds, being in the 2nd and 3rd quartile in the ratio of infection prevention nurses to number of acute beds and use of masks, both universally and in care, were significantly associated with higher infection at the hospital-level. Having screening tests on one day at weekends, as well as having additional methods or initiatives to improve team communication across units and disciplines, when compared to use of reminders, posters or advocacy/awareness-raising to tools were significantly associated with lower infection.
In ICU, only the number of devices inserted in each patient was associated with HAI prevalence. No contextual variable included in multivariable analysis met the threshold.
In the surgical department, older age, ultimately fatal comorbidities assessed by the McCabe score, being in a specialized hospital and having more of infection prevention doctors and nurses per acute bed were significantly associated with SSI. A full investment in safety climate in the department, with empowerment of teams and individuals, when compared to no inclusion of this element in a multimodal strategy for infection prevention and control was associated with lower SSI.
In Medicine departments, age and number of devices were significantly associated with CAUTI, and a larger ratio of nurses in infection prevention per hospital acute bed (4th quartile vs 1st quartile) was associated with decreased CAUTI. In all models, no variable had to be removed due to collinearity, as GVIF(1/(2*Df)) was always below 5 for every included variable (supplementary Table S3).
4. Discussion
This study found that structural and process variables association with HAI may be different depending on the services or department considered within hospitals, and on the specific types of HAI. In the ICU, variance is much lower and the number of devices per patient is the only variable associated with HAI prevalence. In surgical and medical departments, however, several context variables appear to influence HAI prevalence.
The apparent immunity of ICU to contextual variables may be due to the fact that ICU are more similar to each other than surgical or medical departments, which encompass a variety of different services whose distribution is affected by the hospital size and type. At the same time, the workflow in ICU relies more heavily on detailed protocols and procedures than their counterparts, which may translate in a more systematic and standardised approach to patient care, hence, with lesser variability between settings. Our data on process and structural variables does not show a difference in variability between departments. However, it may fail to grasp these nuances as most data is aggregated at the hospital level. Finally, it is worth considering that the effect of devices may be so significant, when their prevalence is higher as is the case of ICU, that it may overshadow other smaller potential determinants. These hypotheses require further research, directed to the questions at hand.
In surgical departments, the empowerment of teams and individuals as owners and protagonists of quality improvement interventions and the existence of a safety climate and psychological comfort were found to have a negative association with HAI prevalence. The visible support and commitment of managers and leaders in strengthening a culture of patient safety was not significantly associated. These results emphasize the role of quality improvement interventions in the battle against HAI. Portugal implemented such a program, between 2015 and 2018, named Stop Infeção Hospitalar!, aiming to reduce the incidence rate of the four typologies of HAI here researched – CLABSI, CAUTI, IAP and SSI – in 12 hospitals, following a previous positive experience [18], and is currently developing a similar program, called Stop Infeção Hospitalar-2.0, involving 22 acute care hospitals and aiming at a 50% percent reduction, in three years, in the incidence of the same HAI [19]. This suggests that, at least in surgical departments, the success of the project lies both on the quality of the proposed bundles and the compliance with them, and on the philosophy of local teams and professionals, their empowerment, psychological safety and cooperation and participation in the endeavour. This has been also emphasized in other studies [20]. Safety culture change was marginally insignificant in the entire population and almost similar to chance in medical department, raising the question that the effect of this strategy may be different in different services and departments, depending on the professionals and department cultures.
When considering all services from included hospitals, an investment in active communication beyond the use of common awareness-raising tools was found to be significantly associated with a smaller prevalence of HAI. Even though the implementation of the IPC assessment framework has been recently shown to be associated with a decreased prevalence of HAI [21], to the best of our knowledge, no study has underlined the individual role of communication as a main driver for better health results. However, communication strategies have been found to be associated with improved healthcare delivery results in different contexts [22,23], and our finding supports a renewed investment in this research field.
The number of isolation rooms has also been found to be positively associated with lower HAI prevalence in the entire sample, when adjusted for hospital bed size and type. This result has not been found in the sub-analyses per service and department. However, the variable relates to the number of isolation rooms in the hospital, not per service, and therefore it may have no practical meaning in the sub-analyses performed. Likewise, the availability of screening tests on weekends has been found to have a negative association with HAI prevalence at the entire sample level only. Isolation rooms have been found to reduce the rate of HAI in pediatric ICU and in the COVID-19 context [24,25], but published papers are lacking, suggesting these results should be interpreted with caution, warranting further research.
The positive association between the ratio of IPC nurses and doctors per acute bed and the prevalence of HAI, which was found in the entire sample but also on surgical and medical departments, should not be interpreted as a causative association and it should not lead to the conclusion that an investment in specialized personnel is deleterious to infection prevention efforts, but rather that an artificial increase in HAI rates may occur. These artificiality is well supported in the literature, that consistently found that better registry, active post-discharge case finding and better audits are associated with a report of higher infection rates [26,27]. This effect was not found when the participation in surveillance networks was assessed, even in specific cases, as was the case of participation in surveillance network of HAI in ICU, and participation in surveillance network of SSI in surgical departments. However, the cross-sectional nature of the paper may fail to find the parabolic effect of surveillance on HAI, which tends to artificially increase rates, and then reduce them after the 5-year mark [9]. At the same time, the high ratio of IPC personnel may reflect a prior response to the higher prevalence of infection, and represent a consequence of high HAI rates. Due to the transversal nature of the analysis, one may not clearly define the direction of the association found.
Our research also found that, although univariate analyses suggest that hospital size may have a role, albeit indirect, in HAI rates, such effect was unapparent after adjustment to other variables. Even though the paper by Zingg et al. did find a significant association, they compared larger hospitals to smaller hospitals, with a cut-off at 650 beds, which is hardly meaningful at many national settings [16].
To the best of our knowledge, this is the first paper to consider that different departments may benefit from different IPC strategies and have different determinants of their success. Few papers have used the ECDC’s PPS to assess contextual factors on HAI prevalence in the entire hospitals [6,28,29] Barbadoro et al. and Zingg et al. both used a multilevel logistic regression approach, yet the former performed bivariate analysis only. The latter found that larger, tertiary care hospitals had a positive association with HAI prevalence, as discussed, and that private-for-profit hospitals had a negative association. [16,29] Palaiopanos et al. followed a different approach and used a multivariable linear regression analysis of hospital factors associated with HAI [28]. Bed occupancy was the only variable with a significant – and positive – association. The large sample of our study, obtained by the participation of virtually every hospital in the country, together with the inclusion of multimodal strategies implementation, strengthen the internal validity of our findings. The inclusion of HAI that are currently under surveillance at each local setting makes our findings more relatable to everyday professionals in infection prevention and control, improving the practicality of interventions that address some of the highlighted issues presented.
This study has some limitations. As a cross-sectional study, it disallows researchers from drawing causality from any finding, and absence of significant association does not mean that the variable is not associated with infection. The paper addresses variance between institutions and, hence, every time hospitals share an intervention – having a multidisciplinary team – or fail systematically to do so, the variable will fail to significantly explain any variation, regardless of its real-world potential association with HAI rates. Also, some variables have inherent limitations, as is the case of the implementation of bundles or checklists, which are considered together despite being two diverse things. Besides the limitation of being unable to consider bundles and checklists separately in the analysis, it is also possible that the interpretation of multimodal strategies inclusion may have not been consistent throughout the hospitals, although random variation is not expected to affect the validity of our findings. Finally, the high proportion of unknown values in multimodal strategies implementation may have hindered the potential conclusions regarding their effect, since missing values may have biased the comparison.
5. Conclusion
Different hospital departments seem to have different infection prevention and control needs and potentially benefit from different ICP interventions and strategies. The results of this paper may help implement targeted interventions that may achieve optimal results in each department, considering the specificities of local realities.
Supplementary Materials
The following supporting information can be downloaded at the website of this paper posted on Preprints.org.
Author Contributions
Conceptualization, Rui Malheiro, André Gomes, Carlos Fernandes and Ana Lebre; Data curation, Rui Malheiro and André Gomes; Formal analysis, Rui Malheiro; Investigation, Carlos Fernandes and Dulce Pascoalinho; Methodology, Rui Malheiro; Project administration, Ana Lebre, José-Artur Paiva and Rita Sá-Machado; Resources, Ana Lebre, Dulce Pascoalinho and José-Artur Paiva; Supervision, Ana Lebre, Dulce Pascoalinho, João Gonçalves-Pereira, José-Artur Paiva and Rita Sá-Machado; Validation, Rui Malheiro and André Gomes; Visualization, Dulce Pascoalinho; Writing – original draft, Rui Malheiro; Writing – review & editing, Rui Malheiro, André Gomes, Carlos Fernandes, Ana Fareleira, Ana Lebre, Dulce Pascoalinho, João Gonçalves-Pereira, José-Artur Paiva and Rita Sá-Machado.
Funding
None to declare.
Data Availability Statement
The data presented in this study are available on request from the corresponding author (the data are not publicly available due to privacy or ethical restrictions).
Acknowledgments
The authors would like to thank every healthcare professional that contributed to data collection and validation of the point prevalence survey in all Portuguese hospitals.
Ethics Approval
No institutional review board approval was deemed necessary, given the quality improvement character of the study. Available data for researchers was anonymous, and databases were assessed solely by the included researchers. Data were retained in compliance with current legislation on the processing of personal data, which specifies that using data for scientific research is considered a legitimate purpose of collected data.
Conflict of Interest
The authors have no relevant financial or non-financial interests to disclose.
References
- Umscheid, C.A.; Mitchell, M.D.; Doshi, J.A.; Agarwal, R.; Williams, K.; Brennan, P.J. Estimating the proportion of healthcare-associated infections that are reasonably preventable and the related mortality and costs. Infect Control Hosp Epidemiol. 2011, 32, 101–114. [Google Scholar] [CrossRef] [PubMed]
- Cassini, A.; Plachouras, D.; Eckmanns, T.; Abu Sin, M.; Blank, H.P.; Ducomble, T. , et al. Burden of Six Healthcare-Associated Infections on European Population Health: Estimating Incidence-Based Disability-Adjusted Life Years through a Population Prevalence-Based Modelling Study. PLoS Med. 2016, 13, e1002150. [Google Scholar] [CrossRef] [PubMed]
- European Centre for Disease Prevention and Control. Point prevalence survey of healthcare-associated infections and antimicrobial use in European acute care hospitals; ECDC: Stockholm, 2024. [Google Scholar]
- Mouajou, V.; Adams, K.; DeLisle, G.; Quach, C. Hand hygiene compliance in the prevention of hospital-acquired infections: a systematic review. J Hosp Infect. 2022, 119, 33–48. [Google Scholar] [CrossRef]
- Pop-Vicas, A.E.; Abad, C.; Baubie, K.; Osman, F.; Heise, C.; Safdar, N. Colorectal bundles for surgical site infection prevention: A systematic review and meta-analysis. Infect Control Hosp Epidemiol. 2020, 41, 805–812. [Google Scholar] [CrossRef]
- Martinez-Reviejo, R.; Tejada, S.; Jansson, M.; Ruiz-Spinelli, A.; Ramirez-Estrada, S.; Ege, D. , et al. Prevention of ventilator-associated pneumonia through care bundles: A systematic review and meta-analysis. J Intensive Med. 2023, 3, 352–364. [Google Scholar] [CrossRef]
- Igwe, U.; Okolie, O.J.; Ismail, S.U.; Adukwu, E. Effectiveness of infection prevention and control interventions in health care facilities in Africa: A systematic review. Am J Infect Control. 2024. [CrossRef] [PubMed]
- Peters, A.; Schmid, M.N.; Parneix, P.; Lebowitz, D.; de Kraker, M.; Sauser, J. , et al. Impact of environmental hygiene interventions on healthcare-associated infections and patient colonization: a systematic review. Antimicrob Resist Infect Control. 2022, 11, 38. [Google Scholar] [CrossRef]
- Malheiro, R.; Peleteiro, B.; Correia, S. Beyond the operating room: do hospital characteristics have an impact on surgical site infections after colorectal surgery? A systematic review. Antimicrob Resist Infect Control. 2021, 10, 139. [Google Scholar] [CrossRef]
- Kane, R.; Shamliyan, T.; Mueller, C.; Duval, S.; Wilt, T. The Association of Registered Nurse Staffing Levels and Patient Outcomes. Medical Care. 2007, 45, 1195–1204. [Google Scholar] [CrossRef]
- Park, Y.S.; Yun, I.; Jang, S.Y.; Park, E.C.; Jang, S.I. Association between nurse staffing level in intensive care settings and hospital-acquired pneumonia among surgery patients: result from the Korea National Health Insurance cohort. Epidemiol Infect. 2024, 152, e62. [Google Scholar] [CrossRef]
- Donabedian, A. Evaluating the quality of medical care. 1996. Milbank Q. 2005, 84, 691–729. [Google Scholar] [CrossRef]
- European Centre for Disease Prevention and Control. Point prevalence survey of healthcare-associated infections and antimicrobial use in European acute care hospitals – protocol version 6.1; ECDC: Stockholm, 2022. [Google Scholar]
- Global guidelines for the prevention of surgical site infection, second edition; World Health Organization: Geneva, 2018; Licence: CC BY-NC-SA 3.0 IGO.
- European Centre for Disease Prevention and Control. Surveillance of surgical site infections and prevention indicators in European hospitals - HAI-Net SSI protocol, version 2.2; ECDC: Stockholm, 2017. [Google Scholar]
- Zingg, W.; Metsini, A.; Balmelli, C.; Neofytos, D.; Behnke, M.; Gardiol, C. , et al. National point prevalence survey on healthcare-associated infections in acute care hospitals, Switzerland, 2017. Euro Surveill. 2019, 24. [Google Scholar]
- Fox, J.; Monette, G. Generalized Collinearity Diagnostics. Journal of the American Statistical Association. 1992, 87, 178–183. [Google Scholar] [CrossRef]
- Fundação Calouste Gulbenkian. Um desafio Gulbenkian 2018.
- Direção-Geral da Saúde, Stop Infeção Hospitalar 2.0. 20 September. Available online: https://www.dgs.pt/em-destaque/stop-infecao-hospitalar-20.aspx.
- von Lengerke, T.; Lutze, B.; Graf, K.; Krauth, C.; Lange, K.; Schwadtke, L. ; et al. Psychosocial determinants of self-reported hand hygiene behaviour: a survey comparing physicians and nurses in intensive care units. J Hosp Infect. 2015, 91, 59–67. [Google Scholar] [CrossRef] [PubMed]
- Vicentini, C.; Bussolino, R.; Gastaldo, C.; Castagnotto, M.; D’Ancona, F.P.; Zotti, C.M. , et al. Level of implementation of multimodal strategies for infection prevention and control interventions and prevalence of healthcare-associated infections in Northern Italy. Antimicrob Resist Infect Control. 2024, 13, 39. [Google Scholar] [CrossRef]
- Hou, R.; Traverson, L.; Chabrol, F.; Gautier, L.; de Araujo Oliveira, S.R.; David, P.M. , et al. Communication and Information Strategies Implemented by Four Hospitals in Brazil, Canada, and France to Deal with COVID-19 Healthcare-Associated Infections. Health Syst Reform. 2023, 9, 2223812. [Google Scholar] [CrossRef]
- Mitchell, B.G.; Hall, L.; White, N.; Barnett, A.G.; Halton, K.; Paterson, D.L. , et al. An environmental cleaning bundle and health-care-associated infections in hospitals (REACH): a multicentre, randomised trial. Lancet Infect Dis. 2019, 19, 410–418. [Google Scholar] [CrossRef]
- Lee, S.Y.; Choi, S.H.; Park, J.E.; Hwang, S.; Kwon, K.T. Crucial role of temporary airborne infection isolation rooms in an intensive care unit: containing the COVID-19 outbreak in South Korea. Crit Care. 2020, 24, 238. [Google Scholar] [CrossRef]
- Ben-Abraham, R.; Keller, N.; Szold, O.; Vardi, A.; Weinberg, M.; Barzilay, Z. , et al. Do isolation rooms reduce the rate of nosocomial infections in the pediatric intensive care unit? J Crit Care. 2002, 17, 176–180. [Google Scholar]
- Atkinson, A.; Eisenring, M.C.; Troillet, N.; Kuster, S.P.; Widmer, A.; Zwahlen, M. , et al. Surveillance quality correlates with surgical site infection rates in knee and hip arthroplasty and colorectal surgeries: A call to action to adjust reporting of SSI rates. Infect Control Hosp Epidemiol. 2021, 42, 1451–1457. [Google Scholar] [CrossRef]
- Troillet, N.; Aghayev, E.; Eisenring, M.C.; Widmer, A.F.; Swissnoso, *!!! REPLACE !!!*. First Results of the Swiss National Surgical Site Infection Surveillance Program: Who Seeks Shall Find. Infect Control Hosp Epidemiol. 2017, 38, 697–704. [Google Scholar] [CrossRef]
- Palaiopanos, K.; Krystallaki, D.; Mellou, K.; Kotoulas, P.; Kavakioti, C.A.; Vorre, S. , et al. Healthcare-associated infections and antimicrobial use in acute care hospitals in Greece, 2022, results of the third point prevalence survey. Antimicrob Resist Infect Control. 2024, 13, 11. [Google Scholar] [CrossRef] [PubMed]
- Barbadoro, P.; Dolcini, J.; Fortunato, C.; Mengarelli Detto Rinaldini, D.; Martini, E.; Gioia, M.G. , et al. Point prevalence survey of antibiotic use and healthcare-associated infections in acute care hospitals: a comprehensive report from the Marche Region of Italy. J Hosp Infect. 2023, 141, 80–87. [Google Scholar] [CrossRef] [PubMed]
Figure 1.
Flowchart of patient inclusion, by service or department. Note: ICU, intensive care units.
Figure 1.
Flowchart of patient inclusion, by service or department. Note: ICU, intensive care units.
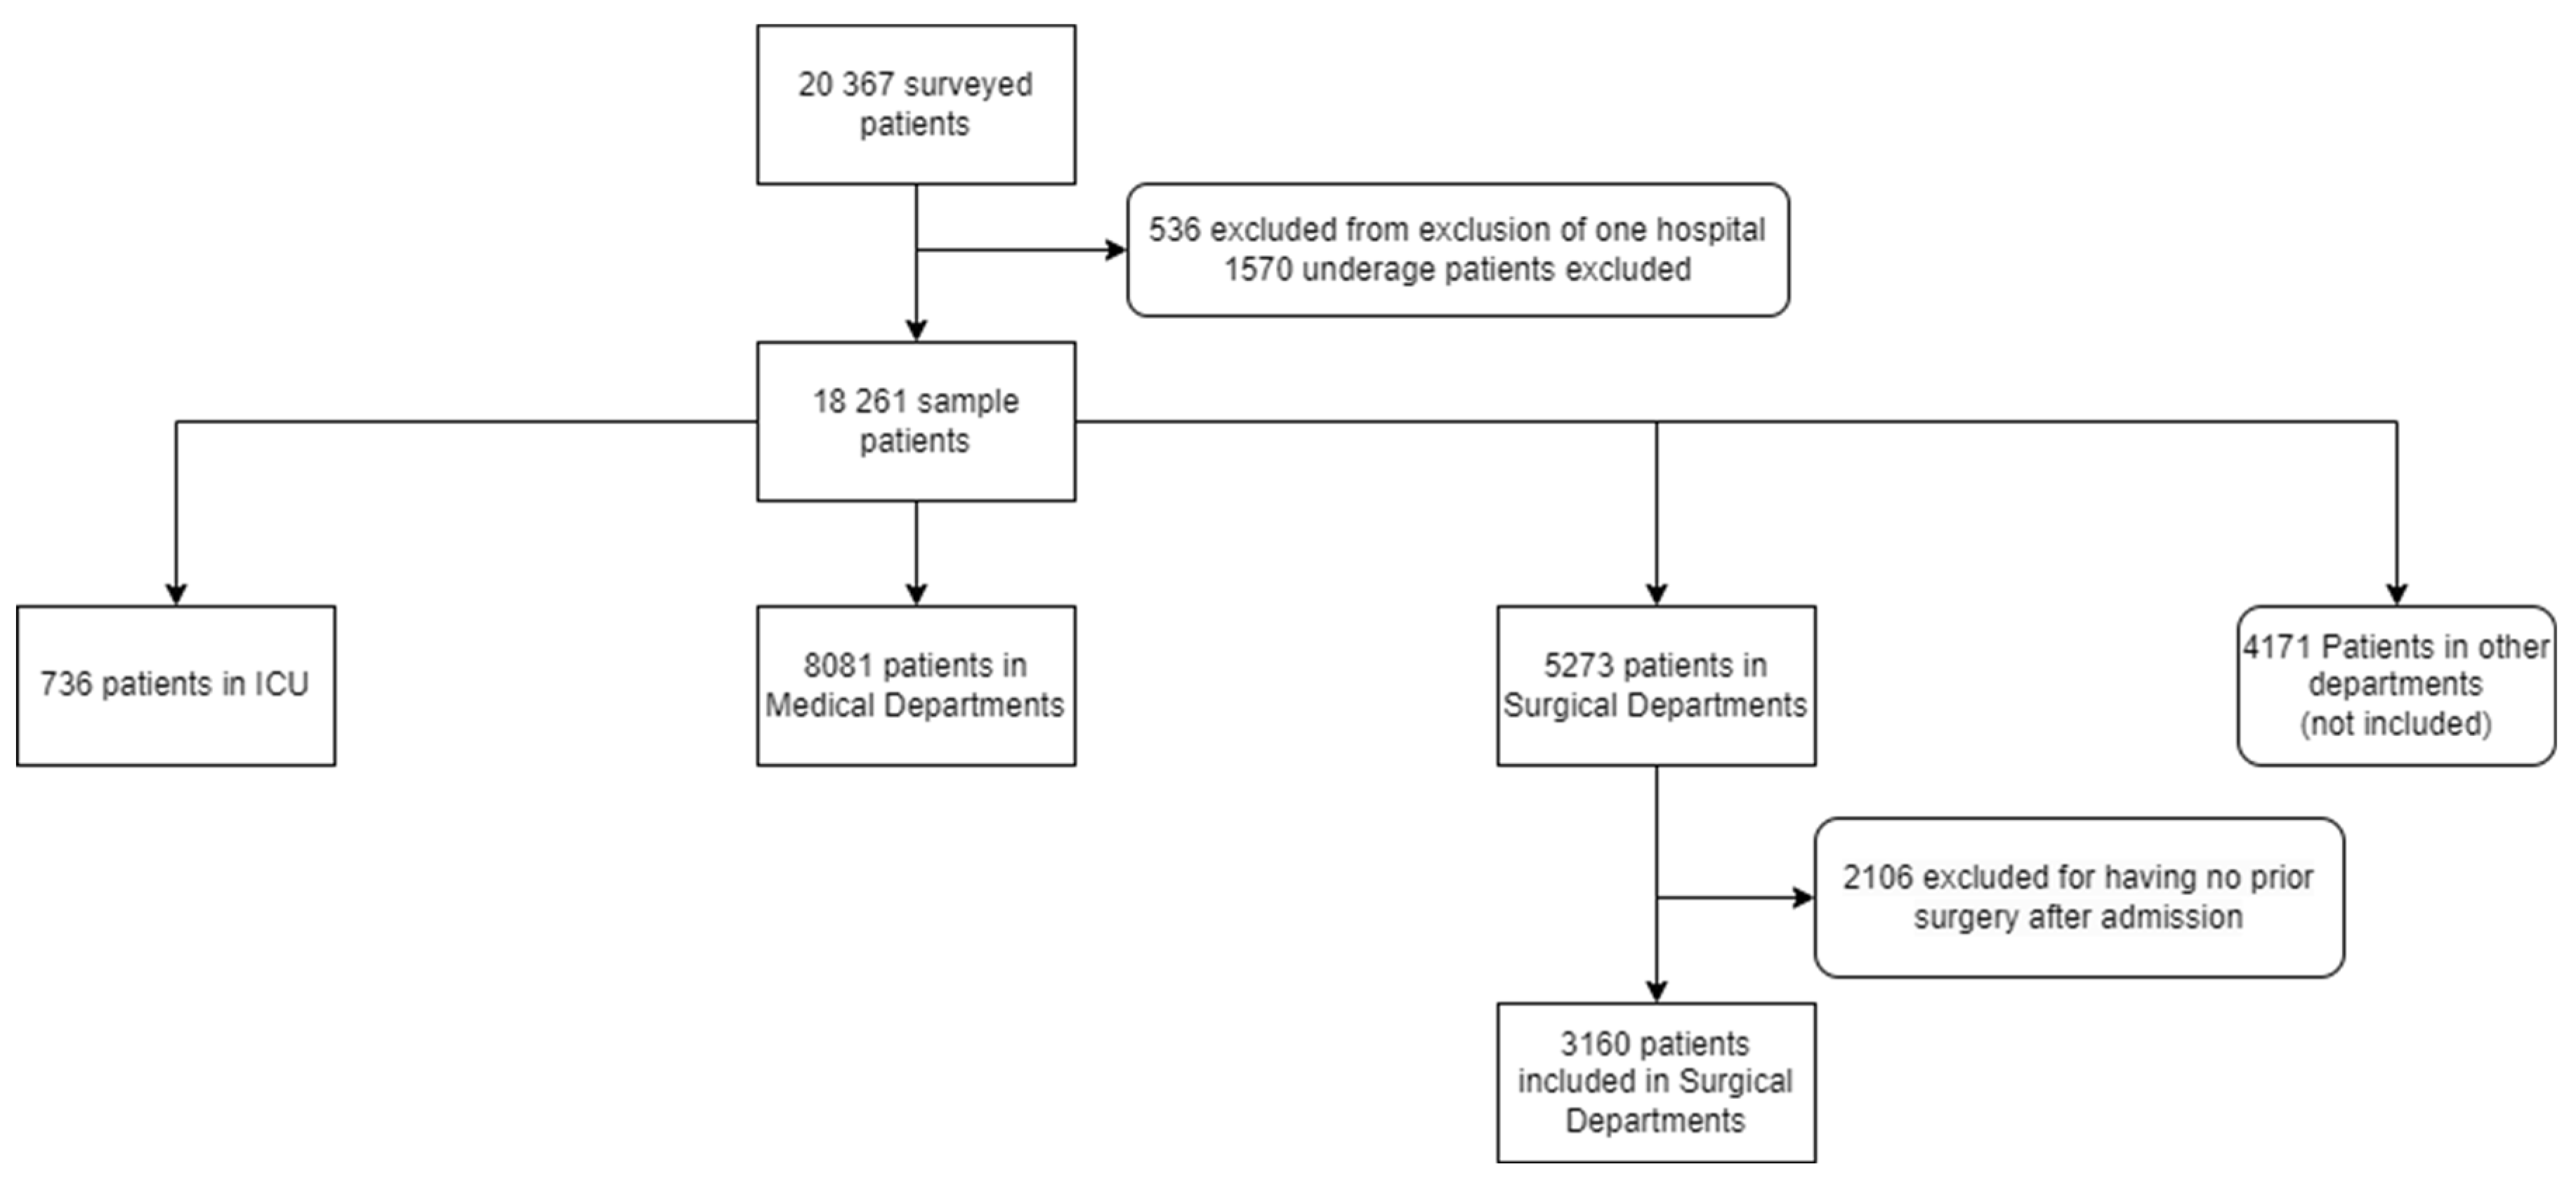
Figure 2.
Simulated random effects of the clustering of hospitals on healthcare-associated infections prevalence. Note: Effect is presented in odds ratio, between each hospital and the overall average. Overall sample use catheter-associated bloodstream infection (CLABSI), intubation-associated pneumonia (PAI), surgical site infection (SSI) and catheter-associated urinary tract infection (CAUTI) as outcome. Intensive care units consider CLABSI, PAI and CAUTI. Surgical deparments consider SSI as outcome, and medical departments consider CAUTI.
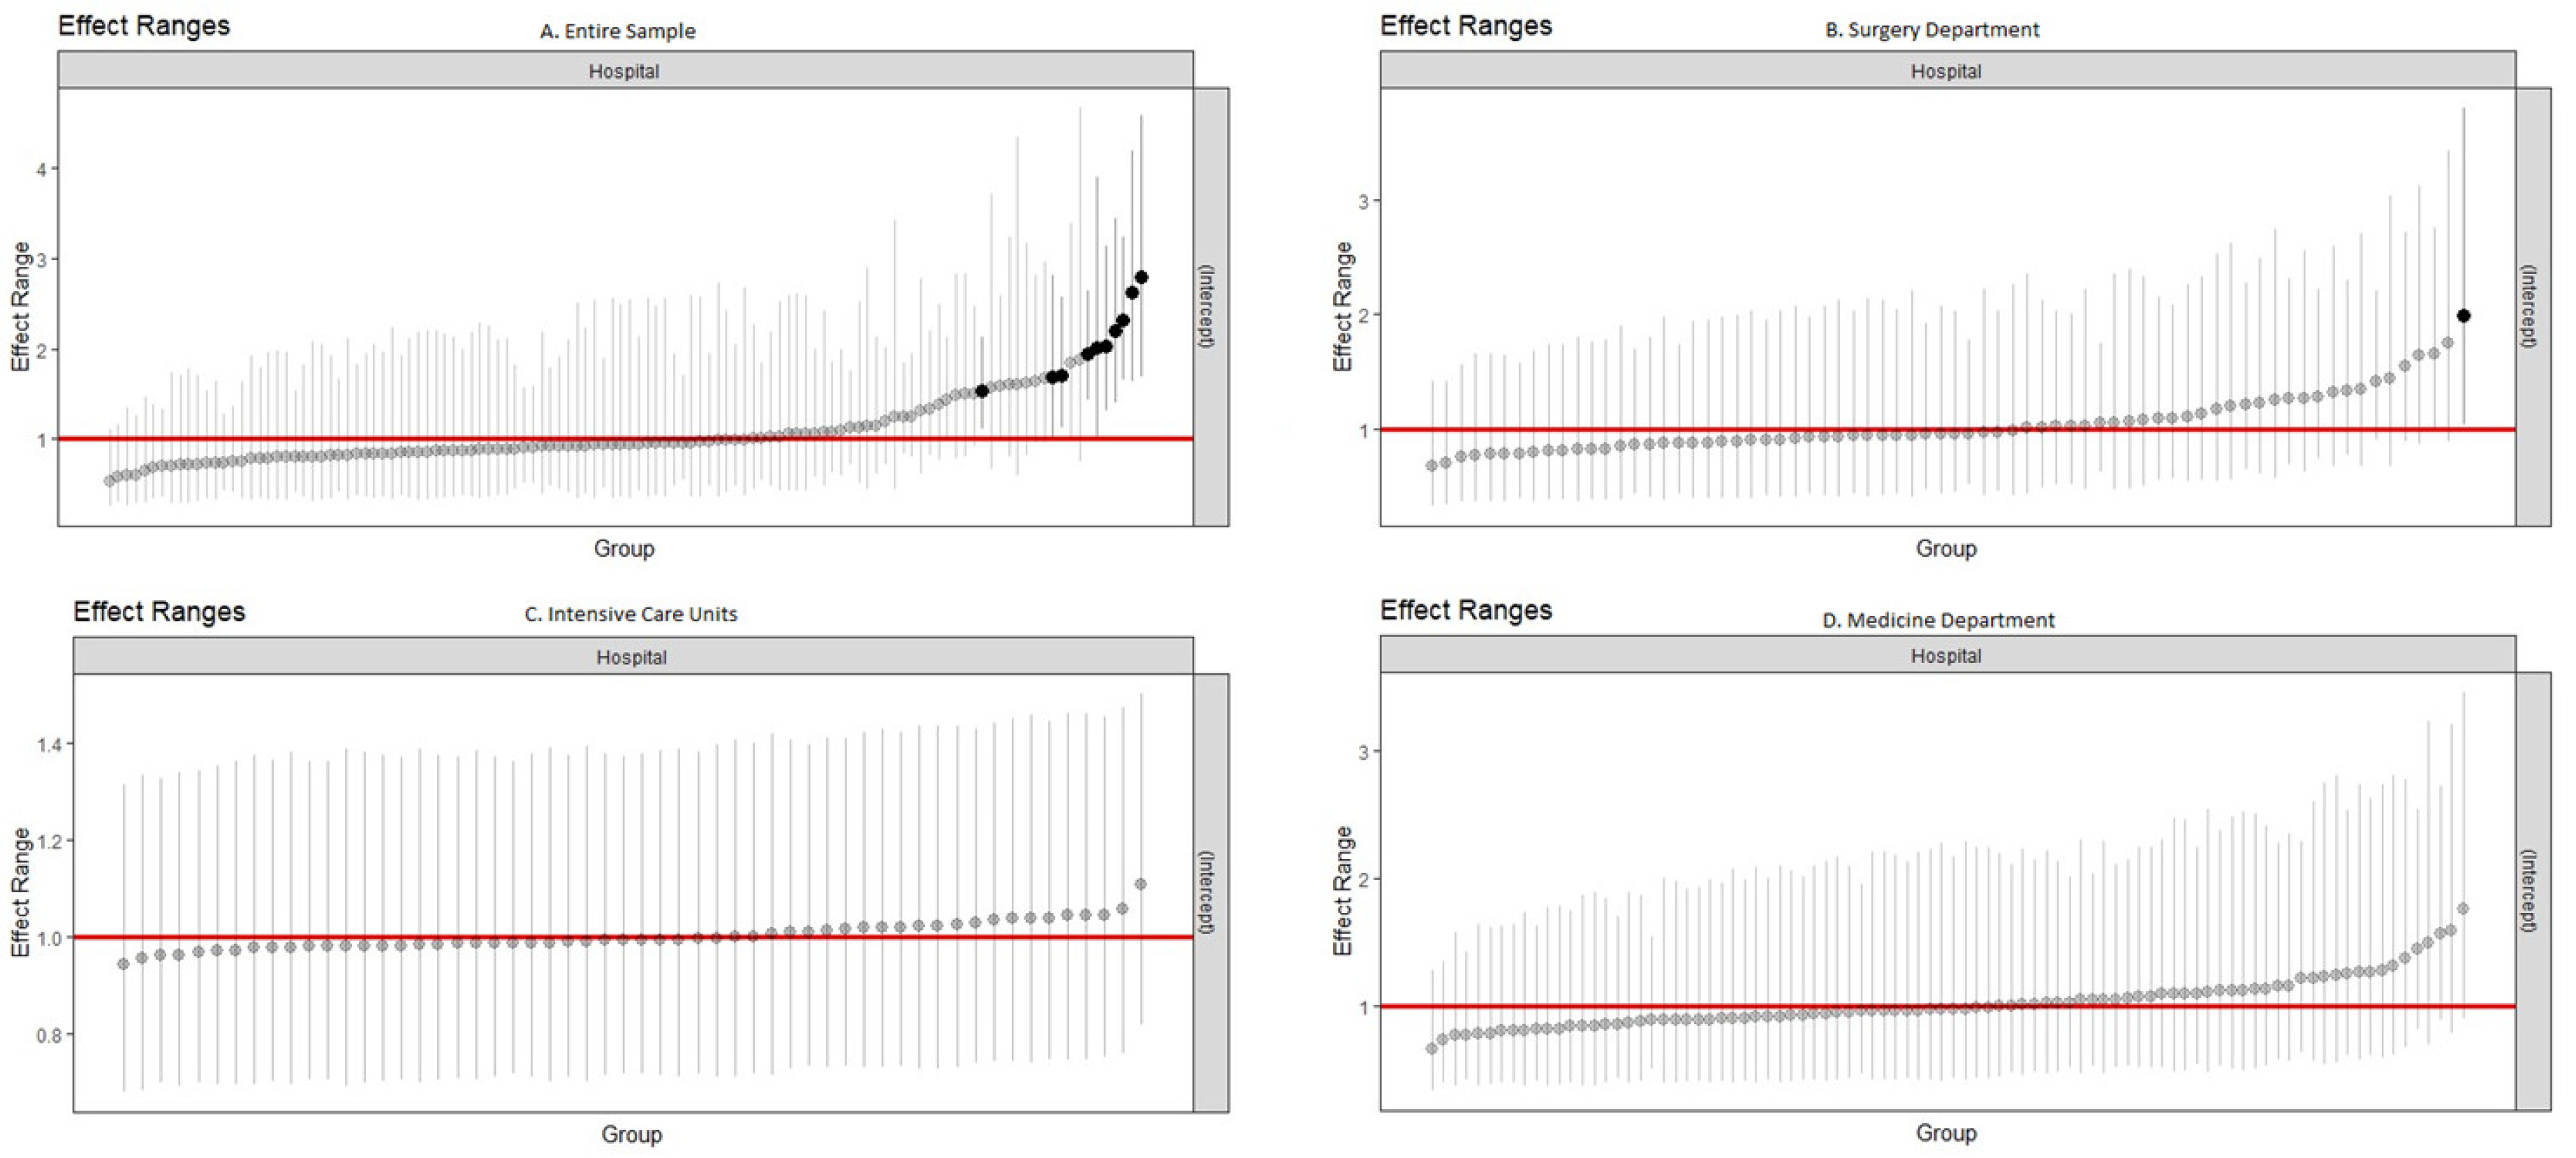

Table 1.
Baseline characteristics of the population.
| Hospital Variables | All hospitals | ICU Department | Surgical Department | Medicine Department | ||||
|---|---|---|---|---|---|---|---|---|
| Hospitals n(%) |
Patients n(%) |
Hospitals n(%) |
Patients n(%) |
Hospitals n(%) |
Patients n(%) |
Hospitals n(%) |
Patients n(%) | |
| No. Hospitals | 119 | - | 56 | - | 72 | - | 90 | - |
| No. Patients | - | 18 261 | - | 736 | 3 160 | - | 8 081 | |
| No. Patients with HAI (Prevalence) | - | |||||||
| SSI | - | 261 (1.4) | - | - | - | 187 (5.9) | - | - |
| CLABSI | - | 38 (0.2) | - | 3 (0.4) | - | - | - | - |
| PAI | - | 72 (0.4) | - | 42 (5.7) | - | - | - | - |
| CAUTI | - | 277 (1.5) | - | 13 (1.8) | - | - | - | 138 (1.7) |
| No. HAI | - | 638 (3.5) | - | 58 (7.9) | - | 187 (5.9) | - | 138 (1.7) |
| No. Patients on antibiotic | - | 7 521 (41.1) | - | 456 (61.3) | 1 544 (48.9) | - | 3 464 (42.9) | |
| Age (median[IQR]) | - | 71 (56–82) | - | 67 (55–76) | - | 68 (56–78) | - | 76 (64–85) |
| Male Sex | - | 9 182 (50.3) | - | 455 (61.2) | - | 1 653 (52.3) | - | 4 184 (51.8) |
| McCabe Score | ||||||||
| Ultimately fatal | - | 4 068 (22.3) | - | 148 (19.9) | - | 524 (16.6) | - | 2 437 (30.1) |
| Rapidly fatal | - | 1 033 (5.7) | - | 72 (9.7) | - | 67 (2.1) | - | 648 (8.0) |
| Nonfatal | - | 12 943 (70.9) | - | 500 (67.2) | - | 2 531 (80.1) | - | 4 931 (61.0) |
| Unknown | - | 204 (1.1) | - | 16 (2.2) | - | 38 (1.2) | - | 65 (0.8) |
| Device Use | ||||||||
| CVC | - | 1 529 (8.4) | - | 461 (62.0) | - | 285 (9.0) | - | 506 (6.3) |
| Urinary catheter | - | 4 250 (23.3) | - | 585 (78.6) | - | 726 (23.0) | - | 1 906 (23.6) |
| Intubation | - | 461 (2.5) | - | 277 (37.2) | - | 50 (1.6) | - | 84 (1.0) |
| Has any device | - | 5 045 (27.6) | - | 608 (81.7) | - | 912 (29.2) | - | 2 309 (28.6) |
| No. Devices (median[IQR]) | - | 0.0 (0.0-1.0) | - | 2.0 (1.0-3.0) | - | 0.0 (0.0-1.0) | - | 0.0 (0.0-1.0) |
| Surgery Since Admission | - | 5 315 (29.1) | - | 370 (49.7) | - | - | - | 518 (6.4) |
| Hospital bed size | ||||||||
| 0-250 | 83 (69.7) | 6 109 (28.0) | 21 (37.5) | 130 (17.5) | 11 (15.3) | 703 (22.2) | 54 (60.0) | 2 273 (28.1) |
| 251-500 | 24 (20.2) | 6 264 (34.3) | 24 (42.9) | 290 (39.0) | 24 (33.3) | 1 116 (35.3) | 24 (26.7) | 2 537 (31.4) |
| >500 | 12 (10.1) | 6 888 (37.7) | 11 (19.6) | 316 (52.5) | 37 (51.4) | 1 341 (42.4) | 12 (13.3) | 3 271 (40.5) |
| Hospital Type | ||||||||
| Primary | 28 (23.5) | 1 366 (7.5) | 5 (8.9) | 34 (4.6) | 7 (9.7) | 127 (4.0) | 18 (20.0) | 727 (9.0) |
| Secondary | 50 (42.0) | 7 248 (39.7) | 25 (44.6) | 233 (31.3) | 36 (50.0) | 930 (29.4) | 44 (48.9) | 3 585 (44.4) |
| Specialized | 11 (9.2) | 840 (4.6) | 2 (3.6) | 19 (2.6) | 4 (5.6) | 208 (6.6) | 3 (3.3) | 195 (2.4) |
| Tertiary | 30 25.2) | 8 807 (48.2) | 24 (42.9) | 450 (60.5) | 25 (34.7) | 1 895 (60.0) | 25 (27.8) | 3 574 (44.2) |
| Hospital Location | ||||||||
| Norte | 31 (26.1) | 6 146 (33.7) | 15 (26.8) | 311 (41.8) | 22 (30.6) | 1 221 (38.6) | 25 (27.8) | 2 319 (828.7) |
| Centro | 28 (23.5) | 3 488 (19.1) | 9 (16.1) | 88 (11.8) | 13 (18.1) | 633 (20.0) | 19 (21.1) | 1 461(18.1) |
| Lisbon | 40 (33.6) | 6 083 (33.3) | 22 (39.3) | 261 (35.1) | 24 (33.3) | 877 (27.8) | 30 (33.3) | 3 056 (37.8) |
| Other | 20 (16.8) | 2 544 (13.9) | 10 (17.9) | 76 (10.2) | 13 (18.1) | 429 (13.6) | 16 (17.8) | 1 245 (15.4) |
| No. Hospital Isolation Rooms | 0 (0–4) | 5 (1–10) | 4 (1–10) | 8 (2–14) | 2 (0–8) | 6 (1–8) | 1 (0–6) | 5 (1–8) |
| Clinical Tests Weekend | ||||||||
| Both days | 69 (58.0) | 10 140 (55.5) | 31 (55.4) | 463 (62.2) | 7 (9.7) | 314 (9.9) | 51 (56.7) | 4 390 (54.3) |
| One day only | 10 (8.4) | 2 329 (12.8) | 6 (10.7) | 48 (6.5) | 40 (55.6) | 1 851 (58.6) | 9 (10.0) | 1 394 (17.2) |
| Screening Tests Weekend | ||||||||
| Both days | 71 (59.7) | 10 567 (57.9) | 32 (57.1) | 470 (63.2) | 9 (12.5) | 492 (15.6) | 53 (58.9) | 4 610 (57.0) |
| One day only | 13 (10.9) | 3 079 (16.9) | 9 (16.1) | 77 (10.3) | 42 (58.3) | 1 927 (61.0) | 12 (13.3) | 1 604 (19.9) |
| IPC Doctors-to-acute-bed ratio (median[IQR]) | 0.1 (0.0-0.2) | - | 0.1 (0.0-0.3) | - | 0.1 (0.0-0.3) | - | 0.1 (0.0-0.2) | - |
| IPC Nurses-to-acute-bed-ratio (median[IQR]) | 0.5 (0.4-0.7) | - | 0.5 (0.4-0.7) | - | 0.5 (0.4-0.8) | - | 0.5 (0.4-0.7) | - |
| AMS Consultants-to-acute-bed-ratio (median[IQR]) | 0.1 (0.0-0.1) | - | 0.1 (0.0-0.1) | - | 0.1 (0.0-0.1) | - | 0.0 (0.0-0.1) | - |
| CEO Approved IPC Plan | 95 (80.5) | 14 890 (81.5) | 47 (83.9) | 630 (84.7) | 57 (79.0) | 2 572 (81.4) | 72 (80.0) | 6 560 (81.2) |
| CEO Approved IPC Report | 97 (82.2) | 15 669 (85.8) | 49 (87.5) | 670 (90.1) | 60 (83) | 2 781 (88.0) | 74 (82.2) | 6 855 (84.8) |
| Universal Masking | ||||||||
| Care | 53 (44.5) | 7 833 (42.9) | 25 (44.6) | 31 (43.1) | 1 471 (46.6) | 35 (38.9) | 3 169 (39.2) | |
| Always | 5 (4.2) | 412 (2.3) | 1 (1.8) | 3 (4.2) | 81 (2.6) | 4 (4.4) | 126 (1.6) | |
| Participation in Surveillance Networks | ||||||||
| Surgical site infection | 45 (37.8) | 8 597 (47.1) | - | - | 33 (45.8) | 1 604 (50.8) | - | - |
| HAI in intensive care units | 35 (29.4) | 9 171 (50.2) | 26 (46.4) | 418 (56.2) | - | - | - | - |
| Clostridium difficile | 19 (16.0) | 3 715 (20.3) | 8 (14.3) | 123 (16.5) | 12 (16.7) | 495 (15.7) | 16 (17.8) | 1 804 (22.3) |
| Antimicrobial Resistance | 56 (47.1) | 10 900 (59.7) | 28 (50.0) | 453 (60.9) | 37 (51.4) | 1 991 (63.0) | 47 (52.2) | 4 839 (59.9) |
| Antimicrobial Consumption | 53 (44.5) | 11 070 (60.6) | 25 (44.6) | 478 (64.2) | 34 (47.2) | 2 070 (65.5) | 45 (50.0) | 4 987 (61.7) |
| Multimodal Strategy Use | ||||||||
| System Change | ||||||||
| Element not included | 4 (3.4) | 104 (0.6) | 1 (1.8) | 4 (0.5) | 0 (0.0) | 0 (0.0) | 3 (3.3) | 41 (0.5) |
| L1 | 20 (16.8) | 3 891 (21.3) | 10 (17.9) | 143 (19.4) | 12 (16.7) | 584 (18.5) | 18 (20.0) | 1 906 (23.6) |
| L2 | 63 (53.8) | 9 786 (53.6) | 29 (51.8) | 445 (60.5) | 40 (55.6) | 1 931 (61.1) | 47 (52.2) | 4 010 (49.6) |
| Unknown | 31 (26.1) | 4 480 (24.5) | 16 (28.6) | 144 (19.6) | 20 (27.8) | 645 (20.4) | 22 (24.4) | 2 124 (26.3) |
| Education and training | ||||||||
| Element not included | 0 (0.0) | 0 (0.0) | 0 (0.0) | 0 (0.0) | 0 (0.0) | 0 (0.0) | 0 (0.0) | 0 (0.0) |
| L1 | 19 (16.0) | 2 185 (12.0) | 9 (16.1) | 57 (7.7) | 9 (12.5) | 310 (9.8) | 41 (15.6) | 867 (10.7) |
| L2 | 69 (57.9) | 11 596 (63.5) | 31 (55.4) | 535 (72.7) | 43 (59.7) | 2 205 (69.8) | 54 (60.0) | 5 090 (63.0) |
| Unknown | 31 (26.1) | 4 480 (24.5) | 16 (28.6) | 144 (19.6) | 20 (27.8) | 645 (20.4) | 22 (24.4) | 2 124 (26.3) |
| Monitoring and feedback | ||||||||
| Element not included | 3 (2.5) | 40 (0.2) | 1 (1.8) | 5 (0.7) | 0 (0.0) | 0 (0.0) | 1 (1.1) | 2 (0.02) |
| L1 | 21 (17.6) | 3 194 (17.5) | 8 (14.3) | 175 (23.8) | 10 (13.9) | 557 (17.6) | 18 (20.0) | 1 426 (17.6) |
| L2 | 64 (53.8) | 10 547 (57.8) | 31 (55.4) | 412 (55.9) | 42 (58.3) | 1 958 (61.9) | 49 (54.4) | 4 529 (56.0) |
| Unknown | 31 (26.1) | 4 480 (24.5) | 16 (28.6) | 144 (19.6) | 20 (27.8) | 645 (20.4) | 22 (24.4) | 2 124 (26.3) |
| Communications and reminders | ||||||||
| Element not included | 0 (0.0) | 0 (0.0) | 0 (0.0) | 0 (0.0) | 0 (0.0) | 0 (0.0) | 0 (0.0) | 0 (0.0) |
| L1 | 53 (44.5) | 8 267 (45.3) | 25 (44.6) | 365 (49.6) | 31 (43.1) | 1 554 (49.2) | 41 (15.6) | 3 504 (43.4) |
| L2 | 35 (29.4) | 5 514 (30.2) | 15 (26.8) | 227 (30.8) | 21 (29.2) | 961 (30.4) | 27 (30.0) | 2 453 (30.4) |
| Unknown | 31 (26.1) | 4 480 (24.5) | 16 (28.6) | 144 (19.6) | 20 (27.8) | 645 (20.4) | 22 (24.4) | 2 124 (26.3) |
| Safety climate and culture change | ||||||||
| Element not included | 16 (13.4) | 2 702 (14.8) | 7 (12.5) | 80 (10.9) | 7 (9.7) | 413 (13.1) | 14 (15.6) | 1 336 (16.5) |
| L1 | 37 (31.1) | 5 322 (29.1) | 18 (32.1) | 222 (30.2) | 22 (30.6) | 899 (28.4) | 27 (30.0) | 2 442 (30.2) |
| L2 | 34 (28.6) | 5 685 (31.1) | 15 (26.8) | 290 (39.4) | 23 (31.9) | 1 203 (38.1) | 26 (28.9) | 2 125 (26.3) |
| Unknown | 32 (26.9) | 4 552 (24.9) | 16 (28.6) | 144 (19.6) | 20 (27.8) | 645 (20.4) | 23 (25.6) | 2 178 (26.6) |
| Is a multidisciplinary team used to implement IPC multimodal strategies | ||||||||
| Yes | 85 (71.4) | 12 620 (69.1) | 37 (66.1) | 535 (72.7) | 49 (68.1) | 2 265 (71.8) | 65 (72.2) | 5 350 (66.2) |
| No | 3 (2.5) | 1 161 (6.4) | 3 (5.4) | 57 (7.7) | 3 (4.2) | 250 (7.9) | 3 (3.3) | 607 (7.5) |
| Unknown | 31 (26.1) | 4 480 (24.5) | 16 (28.6) | 144 (19.6) | 20 (27.8) | 645 (20.4) | 22 (24.4) | 2 124 (26.3) |
| Link to develop multimodal with colleagues | ||||||||
| Yes | 79 (66.4) | 11 210 (61.4) | 32 (57.1) | 496 (67.4) | 44 (61.1) | 1 981 (62.7) | 59 (65.6) | 4 723 (58.4) |
| No | 9 (7.6) | 2 571 (14.1) | 8 (14.3) | 96 (13.0) | 8 (11.1) | 534 (16.9) | 9 (10.0) | 1 234 (15.3) |
| Unknown | 31 (26.1) | 4 480 (24.5) | 16 (28.6) | 144 (19.6) | 20 (27.8) | 645 (20.4) | 22 (24.4) | 2 124 (26.3) |
| Bundles or checklists | ||||||||
| Yes | 83 (69.7) | 11 596 (63.5) | 38 (67.9) | 587 (79.8) | 50 (69.4) | 2 477 (78.4) | 64 (71.1) | 5 762 (71.3) |
| No | 5 (4.2) | 2 185 (12.0) | 2 (3.6) | 5 (0.68) | 2 (2.8) | 38 (1.2) | 4 (4.4) | 195 (2.4) |
| Unknown | 31 (26.1) | 4 480 (24.5) | 16 (28.6) | 144 (19.6) | 20 (27.8) | 645 (20.4) | 22 (24.4) | 2 124 (26.3) |
Note: AMS, antimicrobial stewardship. CAUTI, catheter-associated urinary tract infection. CEO, Chief Executive Officer. CLABSI, catheter-associated bloodstream infection. CVC, central venous catheter. HAI, healthcare-associated infection. ICU, intensive care units. IPC, infection prevention and control. IQR, interquartile range. PAI, pneumonia associated with intubation. SSI, surgical site infection. L1 and L2 in multimodal strategies refer to levels of inclusion of the component. Detailed meaning of each level is available as supplementary Table 1.
Table 2.
Univariate and multivariable regression analysis of patient-level and hospital-level variables associated with healthcare-associated infections prevalence.
Table 2.
Univariate and multivariable regression analysis of patient-level and hospital-level variables associated with healthcare-associated infections prevalence.
| All Hospitals | ICU | Surgery | Medicine | |||||||||||||
|---|---|---|---|---|---|---|---|---|---|---|---|---|---|---|---|---|
| Univariate | Multivariable | Univariate | Multivariable | Univariate | Multivariable | Univariate | Multivariable | |||||||||
| Patient variable | β | p-value | β | p-value | β | p-value | β | p-value | β | p-value | β | p-value | β | p-value | β | p-value |
| Age | 0.01 | <0.001 | 0.01 | <0.001 | -0.01 | 0.573 | - | - | 0.00 | 0.393 | -6.32 | <0.001 | 0.04 | <0.001 | 0.04 | <0.001 |
| Male Sex | 0.20 | 0.013 | 0.12 | 0.204 | 0.45 | 0.146 | 0.39 | 0.225 | 0.45 | 0.004 | 0.31 | 0.07900 | -0.19 | 0.274 | - | - |
| McCabe Score | ||||||||||||||||
| Non-Fatal | ref | ref | ref | ref | ref | ref | ref | ref | ||||||||
| Rapidly Fatal | 0.25 | 0.138 | -0.24 | 0.227 | -0.04 | 0.940 | - | - | 0.94 | 0.0180 | 0.64 | 0.1600 | -0.12 | 0.73 | -0.30 | 0.445 |
| Ultimately Fatal | 0.45 | <0.001 | 0.15 | 0.163 | 0.30 | 0.381 | - | - | 0.91 | <0.001 | 0.76 | <0.001 | 0.31 | 0.09 | -0.12 | 0.618 |
| Device no. | 0.92 | <0.001 | 0.91 | <0.001 | 1.06 | <0.001 | 0.11 | <0.001 | 0.28 | 0.025 | 0.06 | 0.6970 | 1.14 | <0.001 | 1.49 | <0.001 |
| Hospital Variable | β | p-value | β | p-value | β | p-value | β | p-value | β | p-value | β | p-value | β | p-value | β | p-value |
| Hospital Bed Size | ||||||||||||||||
| 0-250 | ref | ref | ref | ref | ref | ref | ref | |||||||||
| 250-500 | 0.52 | 0.001 | 0.02 | 0.936 | -0.46 | 0.259 | - | - | 0.38 | 0.150 | -0.44 | 0.301 | 0.09 | 0.711 | - | - |
| >500 | 0.67 | <0.001 | 0.45 | 0.257 | 0.09 | 0.810 | - | - | 0.68 | 0.013 | -0.73 | 0.342 | -0.09 | 0.704 | - | - |
| Hospital Type | ||||||||||||||||
| Primary | ref | Ref | Ref | ref | Ref | Ref | Ref | |||||||||
| Secondary | 0.20 | 0.416 | -0.12 | 0.666 | 0.29 | 0.706 | - | - | -0.25 | 0.571 | -0.19 | 0.823 | -0.09 | 0.794 | - | - |
| Specialized | 0.49 | 0.156 | -0.89 | 0.076 | -0.11 | 0.928 | - | - | 0.84 | 0.080 | 2.17 | 0.029 | 0.31 | 0.599 | - | - |
| Tertiary | 0.32 | 0.202 | -0.02 | 0.949 | 0.28 | 0.708 | - | - | 0.11 | 0.795 | 0.84 | 0.309 | -0.23 | 0.494 | - | - |
| Hospital Location | ||||||||||||||||
| Lisbon | Ref | - | - | Ref | ref | Ref | Ref | ref | ||||||||
| Centro | 0.02 | 0.918 | - | - | 0.82 | 0.060 | 0.03 | 0.963 | -0.13 | 0.667 | - | - | 0.09 | 0.765 | 0.29 | 0.534 |
| Norte | 0.13 | 0.481 | - | - | 0.39 | 0.263 | -0.42 | 0.517 | 0.07 | 0.763 | - | - | -0.08 | 0.766 | -0.65 | 0.156 |
| Other | 0.044 | 0.846 | - | - | 0.730 | 0.115 | -0.40 | 0.526 | -0.09 | 0.779 | - | - | 0.38 | 0.196 | 0.06 | 0.913 |
| No. Hospital Isolation Rooms | ||||||||||||||||
| 1st quartile | ref | ref | ref | ref | ref | ref | ref | |||||||||
| 2nd quartile | 0.48 | 0.006 | 0.07 | 0.745 | 0.31 | 0.433 | -0.23 | 0.684 | 0.64 | 0.014 | -0.65 | 0.188 | 0.19 | 0.49 | - | - |
| 3rd quartile | 0.43 | 0.044 | -0.30 | 0.244 | 0.50 | 0.193 | 0.04 | 0.936 | 0.65 | 0.029 | -0.36 | 0.531 | -0.27 | 0.393 | - | - |
| 4th quartile | 0.37 | 0.060 | -0.62 | 0.011 | -0.31 | 0.502 | -0.06 | 0.913 | 0.39 | 0.152 | -0.8 | 0.131 | -0.14 | 0.637 | - | - |
| Clinical Tests on Weekends | ||||||||||||||||
| One day only | -0.31 | 0.247 | 0.09 | 0.852 | -0.68 | 0.380 | - | - | -0.45 | 0.246 | - | - | -0.25 | 0.455 | 0.27 | 0.808 |
| Both days | -0.33 | 0.055 | 0.93 | 0.762 | 0.07 | 0.843 | - | - | -0.23 | 0.316 | - | - | -0.32 | 0.172 | 0.87 | 0.530 |
| Screening Tests on Weekends | ||||||||||||||||
| One day only | -0.13 | 0.603 | -0.78 | 0.026 | -0.44 | 0.475 | - | - | -0.29 | 0.410 | - | - | -0.55 | 0.104 | -0.56 | 0.468 |
| Both days | -0.30 | 0.104 | -0.93 | 0.220 | 0.09 | 0.800 | - | - | -0.21 | 0.420 | - | - | 0.42 | 0.089 | -1.55 | 0.243 |
| IPC Doctors-to-acute-bed ratio | ||||||||||||||||
| 1st quartile | Ref | Ref | ref | ref | ref | ref | ref | ref | ||||||||
| 2nd quartile | -0.24 | 0.188 | 0.27 | 0.185 | -0.93 | 0.033 | -0.24 | 0.672 | 0.11 | 0.686 | 1.31 | 0.006 | -0.57 | 0.0531 | 0.12 | 0.797 |
| 3rd quartile | 0.08 | 0.673 | -0.03 | 0.909 | -0.59 | 0.132 | -0.03 | 0.958 | 0.41 | 0.147 | 0.99 | 0.048 | -0.14 | 0.6146 | 1.06 | 0.063 |
| 4th quartile | 0.29 | 0.145 | 0.50 | 0.031 | -0.06 | 0.862 | 0.75 | 0.293 | 0.33 | 0.256 | 0.80 | 0.089 | -0.14 | 0.6206 | 0.99 | 0.121 |
| IPC Nurses-to-acute-bed ratio | ||||||||||||||||
| 1st quartile | Ref | Ref | ref | ref | ref | ref | ref | |||||||||
| 2nd quartile | 0.27 | 0.118 | 0.62 | 0.028 | 0.27 | 0.531 | 0.33 | 0.557 | 0.48 | 0.071 | 2.44 | <0.001 | -0.13 | 0.666 | 0.09 | 0.848 |
| 3rd quartile | 0.69 | <0.001 | 0.70 | 0.007 | 0.53 | 0.189 | 0.68 | 0.255 | 0.52 | 0.052 | 2.20 | 0.004 | 0.42 | 0.104 | 0.55 | 0.167 |
| 4th quartile | 0.42 | 0.044 | 0.25 | 0.936 | 0.15 | 0.743 | 0.00 | 1.000 | 0.66 | 0.025 | 2.09 | 0.005 | -0.32 | 0.298 | -0.95 | 0.037 |
| AMS Consultants-to-acute-bed-ratio | ||||||||||||||||
| 1st quartile | Ref | - | - | ref | ref | ref | ref | ref | ||||||||
| 2nd quartile | -0.04 | 0.841 | - | - | -0.29 | 0.456 | - | - | -0.22 | 0.424 | - | - | 0.02 | 0.941 | 0.28 | 0.451 |
| 3rd quartile | 0.11 | 0.616 | - | - | -0.47 | 0.247 | - | - | 0.31 | 0.234 | - | - | -0.46 | 0.129 | -0.17 | 0.736 |
| 4th quartile | 0.23 | 0.269 | - | - | -0.13 | 0.724 | - | - | 0.28 | 0.302 | - | - | 0.01 | 0.978 | -0.30 | 0.572 |
| CEO Approved IPC Plan | 0.01 | 0.967 | - | - | 0.01 | 0.979 | - | - | 0.26 | 0.324 | - | - | -0.50 | 0.0294 | -0.70 | 0.206 |
| CEO Approved IPC Report | 0.18 | 0.39 | - | - | 0.59 | 0.337 | - | - | 0.22 | 0.472 | - | - | -0.242 | 0.382 | - | - |
| Participation in Surveillance Network | ||||||||||||||||
| SSI | 0.15 | 0.418 | - | - | - | - | - | - | 0.12 | 0.636 | - | - | - | - | - | - |
| ICU | 0.15 | 0.377 | - | - | 0.32 | 0.332 | - | - | - | - | - | - | - | - | - | - |
| CDI | 0.09 | 0.642 | - | - | -0.45 | 0.318 | - | - | 0.30 | 0.221 | - | - | 0.29 | 0.287 | - | - |
| AMR | 0.34 | 0.055 | 0.21 | 0.538 | -0.35 | 0.314 | - | - | 0.87 | 0.003 | 0.84 | 0.237 | 0.48 | 0.102 | -0.04 | 0.957 |
| AMC | 0.34 | 0.039 | 0.49 | 0.242 | -0.46 | 0.185 | -0.89 | 0.126 | 0.62 | 0.011 | 0.29 | 0.701 | 0.59 | 0.0354 | 1.10 | 0.15 |
| Universal Masking | ||||||||||||||||
| Care | 0.39 | 0.010 | 0.44 | 0.007 | 0.25 | 0.430 | - | - | 0.32 | 0.173 | 0.19 | 0.627 | 0.67 | 0.726 | - | - |
| Always | 0.73 | 0.039 | 1.34 | 0.012 | 0.38 | 0.728 | - | - | 0.80 | 0.119 | 1.03 | 0.401 | 0.78 | 0.248 | - | - |
| Multimodal Strategies | β | p-value | β | p-value | β | p-value | β | p-value | β | p-value | β | p-value | β | p-value | β | p-value |
| System Change | ||||||||||||||||
| L2 vs L1 | 0.02 | 0.941 | - | - | 0.09 | 0.813 | - | - | 0.19 | 0.537 | - | - | -0.31 | 0.201 | - | - |
| Education & Training | ||||||||||||||||
| L2 vs L1 | -0.15 | 0.508 | - | - | 0.50 | 0.412 | - | - | -0.10 | 0.769 | - | - | -0.48 | 0.089 | 0.08 | 0.885 |
| Monitoring & Feedback | ||||||||||||||||
| L2 vs L1 | -0.06 | 0.795 | - | - | -0.18 | 0.578 | - | - | -0.31 | 0.295 | - | - | -0.30 | 0.255 | - | - |
| Communication | ||||||||||||||||
| L2 vs L1 | -0.37 | 0.048 | -0.46 | 0.006 | -0.34 | 0.293 | - | - | -0.03 | 0.912 | - | - | -0.24 | 0.33 | - | - |
| Safety Culture Change | ||||||||||||||||
| L1 | -0.35 | 0.154 | 0.52 | 0.065 | -0.43 | 0.375 | - | - | -0.31 | 0.385 | -0.87 | 0.175 | -0.61 | 0.0211 | -0.06 | 0.922 |
| L2 | -0.28 | 0.255 | 0.59 | 0.091 | 0.11 | 0.807 | - | - | -0.60 | 0.096 | -1.59 | 0.019 | -0.64 | 0.0223 | -0.01 | 0.987 |
| Multidisciplinary Team | -0.38 | 0.337 | - | - | -0.10 | 0.847 | - | - | -0.32 | 0.492 | - | - | -0.61 | 0.0879 | -0.43 | 0.561 |
| Link to develop strategies with colleagues | -0.52 | 0.025 | -0.42 | 0.151 | 0.17 | 0.749 | - | - | -0.57 | 0.052 | 0.89 | 0.168 | -0.24 | 0.397 | - | - |
| Bundles or Checklists | 0.33 | 0.530 | - | - | 0.24 | 0.526 | - | - | 0.81 | 0.464 | - | - | 0.24 | 0.731 | - | - |
Note: AMC, antimicrobial consumption. AMR, antimicrobial resistance. AMS, antimicrobial stewardship. CDI, Clostridium difficile infection. CEO, Chief Executive Officer. ICU, Intensive Care Units. IPC, Infection prevention and control. SSI, Surgical site infection.
Disclaimer/Publisher’s Note: The statements, opinions and data contained in all publications are solely those of the individual author(s) and contributor(s) and not of MDPI and/or the editor(s). MDPI and/or the editor(s) disclaim responsibility for any injury to people or property resulting from any ideas, methods, instructions or products referred to in the content. |
© 2024 by the authors. Licensee MDPI, Basel, Switzerland. This article is an open access article distributed under the terms and conditions of the Creative Commons Attribution (CC BY) license (http://creativecommons.org/licenses/by/4.0/).
Copyright: This open access article is published under a Creative Commons CC BY 4.0 license, which permit the free download, distribution, and reuse, provided that the author and preprint are cited in any reuse.


