Submitted:
22 December 2025
Posted:
23 December 2025
You are already at the latest version
Abstract
Climate change is a major global challenge, negatively affecting agriculture, economies, and societies. This research focuses on its impact on crop productivity and farmers' adaptation strategies in Tuli Guled woreda, Ethiopia. Data from 255 household heads reveal that 60% of farmers report significant life impacts, with 67% experiencing income declines due to reduced crop yields. Most farmers (87.5%) are considering relocating. Preferred adaptation strategies include improved seeds (48.4%) and crop diversification (37.2%). Meteorological data from 1993-2022 show decreased precipitation and increased temperatures. The study indicates deadly impacts of climate change on agriculture, necessitating training on sustainable practices and adapt.
Keywords:
climate change
; impacts
; crop production
; adaptation strategies
1. Introduction
Climate change is one of the biggest problems facing our world today. It is expected to have negative effects on agriculture, economies, and societies worldwide, with the severity of these effects differing across nations, regions, and sociodemographic groups because of variations in exposures, sensitivities, and adaptive measures (Amin et al., 2021) .The climate and agriculture are inextricably linked because agriculture depends on consistent weather, seasonal patterns, and predictable rainfall (Lobell et al., 2008). However, human activity, especially the burning of fossil fuels, has caused the global climate to change significantly, leading to global warming, altered precipitation patterns, and an increase in the frequency of extreme weather events like droughts and floods (FAO, 2020 et al Priya, 2025).
Climate change has a greater impact in Africa, where rain-fed agriculture is essential for daily survival and adaptive capacity is low. In rain-fed agriculture, crop productivity is being impacted by decreasing rainfall and rising temperatures, which is exacerbating food insecurity (Abdisa et al. 2022).
agricultural productivity was vulnerable to climate change, that has a direct effect on the rural population, which relies on agriculture for their livelihoods and income. The urban population and other industries that rely on agriculture for their raw materials are also indirectly impacted by the rising cost of agricultural products. This would have an effect on food security, poverty reduction, development, and the accessibility of energy and water (Ketema & Negeso, 2020) . Ethiopia, where agriculture, particularly rain-fed agriculture, is the main source of food supply, is expected to face worsening conditions due to climate change. The most reduced crops was Teff, maize, wheat, and sorghum that climate change declined (Kassaye et al., 2021).
Ethiopia has given developing and putting into practice mitigation and adaptation strategies more importance in recent decades. Among the main projects proposed and carried out are encouraging climate-resilient practices to produce drought-resistant crops, enhancing soil conservation methods, and enhancing water management. Additionally, continuous efforts are being undertaken to raise public understanding of the effects of climate change and build legislation that support sustainable development practices (Sinore & Wang, 2024) .
The Somali region is among Ethiopia's most affected since so many people there depend on food production and live below subsistence levels, leaving them especially vulnerable to any unfavorable conditions or shocks associated with climate change. Food scarcity and animal losses are occurring in several parts of Ethiopia, especially the Somali region, as a result of delayedseasonal rainfall particular the Siti Zone (Girmay, 2020).
In Tuliguled Woreda, climate change has resulted in rising temperatures, unpredictable rainfall patterns, and protracted droughts. Reduced crop yields, degraded soil, and water scarcity are the outcomes of these climate changes. A irregular rainfall and warming temperatures have been the main causes of the discernible drop in crop quality and output during the last ten years (Omer,2018).
2. Methods
2.1. Description of the Study Area
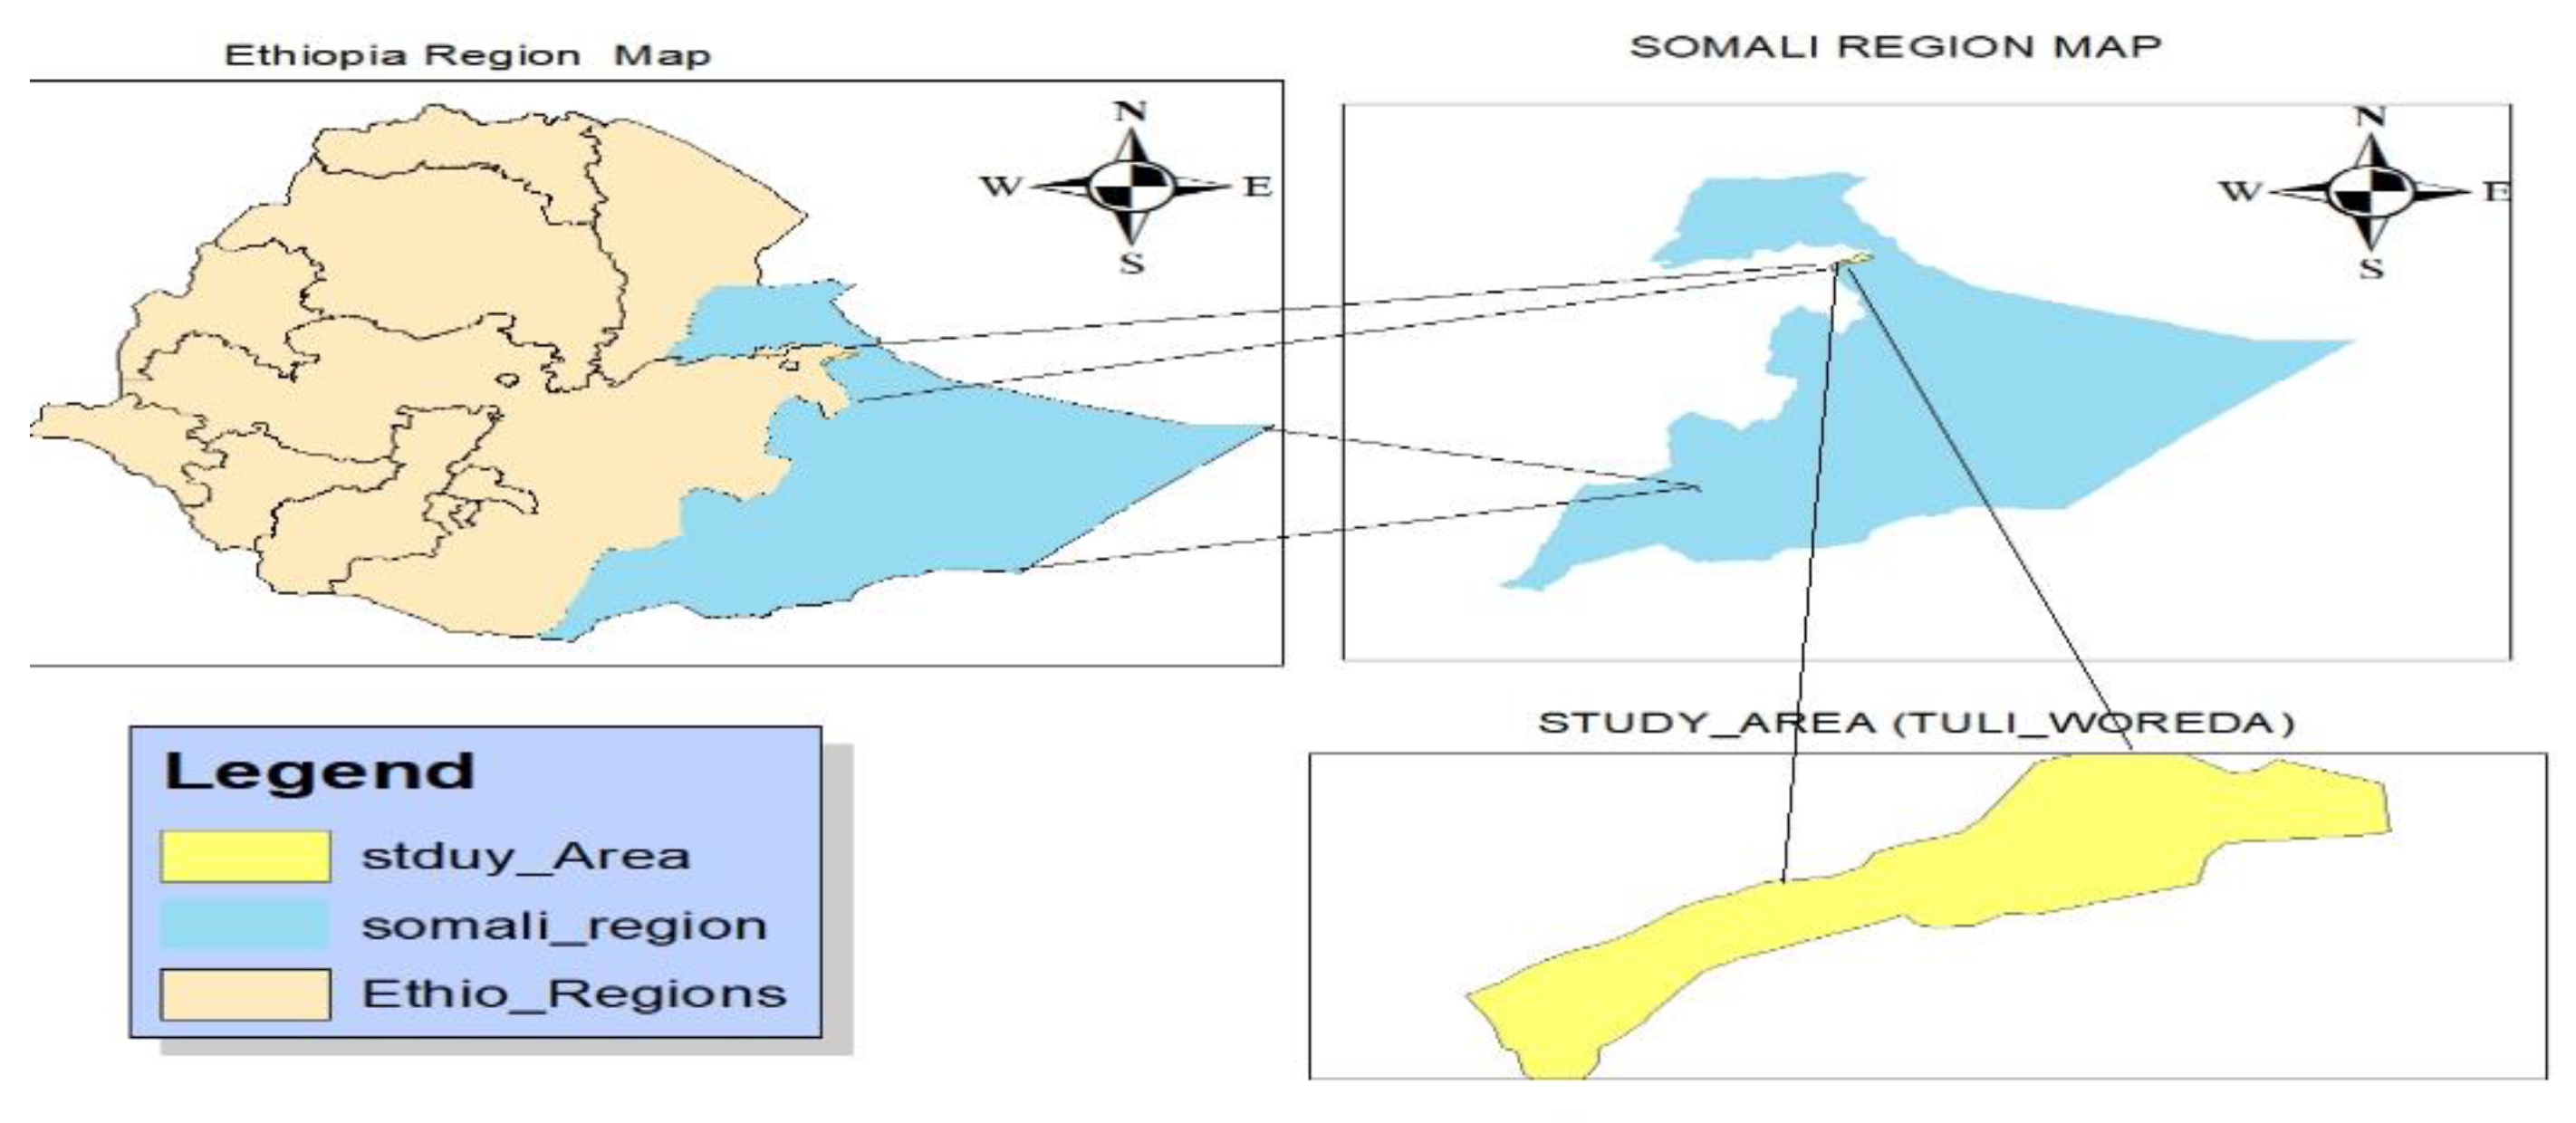
The research was conducted in tuliguled woreda, which is located in the Fafan Zone, 30 KM away from Jigjiga City, and 650 km away from Addis Ababa, the capital of Ethiopia. It’s one of the woreda Somali regional states whose population depends on agro-pastoral for livelihood. Geographically the district is located between 9. 6160 or 90 36‘54‘N0 latitude and 42045‘11 E0 longitude.the woreda share boundaries with Jigjiga North West, Dembel in the north east, and Gursum South West. awbare east. And Chinksen west.
Figure 1.
Map of the Study Area, Tuli-Guled Woreda, Eastern Ethiopia.
2.2. Sampling Procedure and Sample Size
The total household heads of three kebeles is 700, According to Yamane’s (1967) formula, it is important to determine and calculate the sample size at a 95% confidence level and a precision level of ± 5%. The level of precision is the range in which to evaluate the population is estimated to be; it’s expressed in percentage points (±5%), and the sampling size “n” for the study would be derived from a simplified formula.
Where, n = the required sample size, N = total Population e = marginal of error,
Sample Size Proportion

Table 1.
Sample selection kebele.
| Kebele Name | Total Household Heads (HHs) | Sample Proportion | Total Sample | Percent % |
|---|---|---|---|---|
| Sarir | =300 | 109 | 42.75% | |
| Koralay | =200 | 73 | 28.63% | |
| Kulula | =200 | 73 | 28.63% | |
| Totals | 255 | 100.0 |
Source: own constructed.
2.3. Data Collection
Both primary and secondary data were used for this study. Primary data was collected through questionnaires, focus group discussions, and key informant interviews. Secondary data was obtained from the National Meteorological Institute (NMI) of Ethiopia for the Jigjiga station, which includes monthly, seasonal, annual rainfall and temperature data.
Questionnaire: The household questionnaire was designed in line with stated objectives it consists both structured and semi-structured questions. the survey was conducted with 255 sample HHs to generate the required data about climate change impact on crop production and adaptation strategies. The questionnaire was first prepared in English and then translated in Somali so-that the enumerators and respondents can easily understand the questions.
Key informant interview (KII): The key informant interviews were conducted with different individuals at different levels. At the kebele level, individual interviews are conducted with elderly people, thinking that they have sufficient knowledge about the area and be able to memorize well the historical climate trends, including those who has agriculture backgrounds in both kebele and district levels were interviewed.
Focus group discussion (FGD): Focus Group discussions have been held with kebele farmers, local community elders for the purpose of the study, separate Focus Group Discussion (FGD) that was carried out, involved small groups of four males and two females total 6 people from each selected kebeles were selected based on socially status within the society and are known to have better knowledge on the present and past climate change, social and economic status of the study area.
2.4. Data Analysis
Both descriptive and inferential statistics were used in this study’s data analysis.
A Microsoft Excel 2010 spreadsheet was used to reorganize the daily temperature and rainfall data from 1993 to 2022 into monthly, seasonal, and annual time steps. First, an analysis was conducted on the subject area’s average maximum temperature and rainfall variability.
Temperature and rainfall were evaluated on a monthly, seasonal, and annual basis. Additionally, descriptive analysis was used to obtain the first moments of variation (mean, minimum, maximum, and standard deviation) and Frequencies, percentiles, among the other tools used to analyze the data for additional information and detail analysis. SPSS version 26, and STATA software were used to analyze temperature and rainfall.
2.5. Ethical Consideration
Ethical clearance was obtained from the institution of Haramaya University prior to conducting the study, and official permission letters from the School of Graduate Study (SGS) were written to Tuliguled woreda. All necessary measures were taken to guard against any form of harm or discomfort to the study subjects. The study participants were informed about their right to withdraw from the study or decline any question they considered to be inappropriate. Their informed, voluntary, written, and signed consent in the end will be sought, and participants gave thumbprint consent to participate in the study. Confidentiality was also guarded by making sure that study participants would not be represented by their names. Other forms of identities and private discussions will remain anonymous and undisclosed during and after the study.
3. Results and Discussion
3.1. Demographic and Socio-Economic Characteristics of Household Head
3.1.1. Gender and Age of SAMPLE Household Head
Based on Table 2, out of a sample of 255 farmer respondents, 153 (60.0%) were male, while 102 (40%) were female, reflecting their socioeconomic characteristics. The survey results from the selected kebele in Tuliguled Woreda indicate that the majority of households are led by men and that men are more actively involved in rural agricultural farming compared to women.
Adults make up the majority of the sample respondents in the study area. The largest age group is 31-49, which comprises 116 (45.5%). This is followed by the 50+ age group, which accounts for 88 (34.5%). The third age category, which is smaller, includes those aged 20–30, accounting for 26(10.2%), while the smallest group is under 18, comprising only 25 (9.8%). Notably, this indicates that the 31-49 age group is involved in farming to mitigate the impact of local climate challenges, therefore the most farmers age group those involved the in the farm activities in this study was age group between 31 -49.
3.1.2. Marital Status of Sample Respondents
As shown in Table 2, out of the 255 individuals or farmers respondents in the sample, 189 (74.1%) of them were married and this is followed by singles, which account for 42 (16.5%) individuals. Next to that are divorced individuals, who account for 18 (7.1%) of the sample, significantly fewer than the married population. This suggests that a small but notable portion of the population has experienced divorce. Lastly, the number of widow hood is only 6 (2.4%).
3.1.3. Education Status of Respondents
Out of 255 survey respondents, 82.4% were illiterate, meaning they were unable to read and write. Meanwhile, 13.7% of respondents were literate, meaning they could read and write, and 3.9% of farmers were in primary school. These results indicate that more than half of the respondents were illiterate, therefore, they wouldn’t know more information about the climate change since they couldn’t read and write information.
3.1.4. Family Size
Based on Table 2, family sizes are categorized into the following five groups among them. The most common family size was between 6 to 8 children, comprising 92 (36.1%). Families with 3 to 5 children account for 76 (29.8%). Families with more than 8 children make up 18.1% of the sample. Only 8.2% of families have no children, while 7.8% have fewer than 3 children. Crop production practices, adaptation strategies, and the corresponding climate vulnerability were all positively impacted by family size. This implies that households with larger child populations can employ a variety of adaptation strategies to mitigate the effects of climate change and require more labor.
Table 2.
Gender, age and marital status of household head.
| Variables | Categories’ | Frequency | Percentage |
|---|---|---|---|
| Gender | Male | 153 | 60.0% |
| Female | 102 | 40.0% | |
| Total | 255 | 100.0% | |
| Age | under 18 years | 25 | 9.8% |
| 20-30 years | 26 | 10.2% | |
| 31-49 years | 116 | 45.5% | |
| >50% years | 88 | 34.5% | |
| Total | 255 | 100.0% | |
| Marital status | Single | 42 | 16.1% |
| Married | 189 | 74.1% | |
| Divorced | 18 | 7.1% | |
| Widowed | 6 | 2.4% | |
| Total | 255 | 100.0% | |
| Education status | Illiterate | 210 | 82.4% |
| Literate | 35 | 13.7% | |
| Primary | 10 | 3.9% | |
| Total | 255 | 100.0% | |
| Family size | No children | 21 | 8.2% |
| <3childern | 20 | 7.8% | |
| 3-5 | 76 | 29.8% | |
| 6-8 | 92 | 36.1% | |
| >8 | 48 | 18.1% | |
| Total | 255 | 100.0 |
Source: Own field survey, 2024.
3.1.5. The Respondents’ Farming Experience
The results indicated in Table 3 show that 49.0% of respondents were farmed experienced 21 to 30, years, 34.5% of them were farm experience over 31 years, whereas 16.5% of them were farm experience 10 to 20 years. Farmers with more experience are likely better able to predict the weather, have a greater understanding of climatic conditions, and are more inclined to implement adaptation strategies. Some training, technology adoption, or policy initiatives need to consider the existing experience level of these farmers. Strategies may need to balance between respecting traditional expertise and introducing innovation. The study in line with Gezie, (2019) Farmers with more experience are more likely to notice changes in the climate. It is also hypothesized that awareness of climate change is positively correlated with the head of household’s educational attainment. The study also in line with Teshome The more knowledge an individual has, the better equipped they are to apply different climate change adaptation tactics. Supporting this recommendation. Claimed that life experiences gained throughout the years play a major role in determining local farmers’ capacity to make well-informed judgments. Similarly the study in line with Tambol1 et al., (2024) Farmers with many years of agricultural expertise can synthesize farm settings and track advancements over time to determine which CSAT is most appropriate for their farming operations.
3.1.6. Farm Size of the Sample Respondents
In terms of farmland size, 57.6% of respondents held 1 to 5 hectares, 21.2% held less than 1 hectare, 20% held 6 to 10 hectares, and 1.2% held more than 10 hectares.
The size of the farm is the most crucial factor in deciding the adaptation plan; that is, compared to farmers with smaller land holdings, those with larger farms have adopted one or more options for adapting to climate change. It is also noted that one of the key elements impacting farmers’ preferences for climate change adaptation strategies is the size of their households’ farms.
This finding suggests that larger farms are likely to benefit from economies of scale, potentially leading to improved agricultural practices. The study is in line with Abdullahi, (2023)The primary determinant of adaptation strategy is farm size; therefore, farmers with larger farms have implemented one or more climate change adaptation strategies in comparison to those with smaller land holdings. It also is in line with Teshome et al.,( 2021)Farm size is negatively correlated with planting date adjustment, supplementary irrigation, and soil and water conservation. This indicates that farmers with large-sized farms have better opportunities to plant more varieties of the crop whereas those with small-sized ones have lower opportunities as they are limited by the sheer size of the land. Similarly the study in line with Teshome et al., (2021)Adjusting the planting date, adding irrigation, and conserving soil and water are all negatively connected with farm size. This suggests that farmers with larger farms are better able to plant a wider variety of crops than those with smaller farms.
3.1.7. Respondents of Climate Change Affected the Way of Life
According Table 3The majority of respondents (60%) said that their way of life had gotten much worse due to climate change. Only 12.2% of respondents claimed that climate change had no impact on their way of life, while 27.8% reported that their living conditions had slightly worsened.
This category consists of farmers who have either successfully adjusted to the changing environment or are less impacted by climate fluctuations. A crucial problem is highlighted by the majority of farmers reporting a notable worsening. Changes in precipitation patterns, an increase in the frequency of extreme weather events, or adjustments to growing seasons could indicate that severe disruptions in agricultural productivity are being brought on by climate change. Less crop yields, more pest and disease pressure, and general financial difficulties for farmers can result from these disruptions. The finding shows that the average crop yield and the way in which farmers live are negatively correlated with climate change. In particular, this implies that, if all other independent factors remain constant, the average crop production is predicted to drop or decreases it has a negative influence on a farmer’s lifestyle. The study is in line with Sinore & Wang, 2024 Ethiopia is a rain-based agricultural nation that is vulnerable to risk and the effects of climate change. A major and detrimental impact on agricultural production is caused by floods and droughts, which occur more frequently and with greater intensity and shift the way of farmers life. Similarly, the study in line with Zeratsion et al., 2024Climate change has been a major threat to livelihoods, cultures, and infrastructures of the community.
3.1.8. Perceived Impact of Climate Change on Households’ Income
According to Table 3, the majority of respondents (67.0%) reported that the effects of climate change on crop production have significantly reduced household income. This suggests that their income is severely suffering as a result of climate change. The percentage of farmers who indicated that their household income has somewhat dropped is lower at 5.5%. Despite the impact of climate change on income, the changes for this group appear to be less severe than those experienced by farmers facing significant decreases, as evidenced by the fact that 27.5% of farmers surveyed reported no change in household income. This group may have alternative sources of income or may be less affected by the impacts of climate change. The study in line with Okoronkwo et al., (2024) One of the main causes of farmers’ decreased income is the decline in agricultural output brought on by the effects of climate change. According to the findings, farmers make comparatively little money, which suggests that they depend on the money from their produce. The study also is in line with (Tambol1 et al., 2024) The effects of climate change include drought, flooding, high temperatures, erratic rainfall, and a danger to agricultural output, productivity, and incomes. Similarly the study also in line with minwuye, 2017 Farm income was found to be statistically significant and positively related to using adjusting planting date, agro-forestry, drought tolerant variety, SWC practices, and irrigation. This implied that farmers who have higher farm income are more likely to adapt to the change in climate using these strategies.
3.1.9. Respondents of Farmers Household Migrating Due to Climate Related Impact on Farming
Referring to Table 3, A majority of respondents (87.1%) stated that at least one household member had thought about migrating due to difficulties in farming caused on by climate change. Around 12.9% of households did not think about migration, which suggests that the majority do not have other adaption options diversified livelihoods, irrigation. emphasize how seriously climate change has affected their ability to make a living. This suggests elements related to the climate, such as changing patterns of rainfall and temperature. The study Is in line with Abdullahi Musa, (2021)asserted that migration is one type of adaptation among a larger range of possible adaptive measures that people and households take to reduce their susceptibilities to the stresses of climate variability.
Focus groups discussing local indicators of climate change based on farmer discussions. According to the study’s survey, the color of the sky, the direction of the wind, and the color of the sun are all signs of climate change. There are also color and brightness variations between the rainy and dry seasons’ sunshine, according to farmers. They added that another measure of climate change, more especially indented seasonal variability, is wind direction. In addition, the color of the sky is one symbol of climate change.
Table 3.
Farmers respondent experience, Farm size and household income.
| Variables | Indicator | Frequency | Present |
|---|---|---|---|
| How many years of experience do you have in crop production? | 10-20 years | 42 | 16.5% |
| 21-30 years | 124 | 49.0% | |
| more than 31 years | 88 | 34.5% | |
| Total | 255 | 100.0% | |
| Farm size | less than 1 hectare | 54 | 21.2% |
| 1-5 hectare | 147 | 57.6% | |
| 6-10 hectare | 51 | 20.0% | |
| More than 10 hectares | 3 | 1.2% | |
| Total | 255 | 100.0% | |
| Total | 255 | 100.0% | |
| How has climate change affected your way of life? | No change | 31 | 12.2% |
| slightly worsened | 71 | 27.8% | |
| Significance worsened | 153 | 60.0% | |
| Total | 255 | 100.0% | |
| is there any one in your household considered migrating due to climate related impact on farming? |
Yes | 222 | 87.1% |
| No | 33 | 12.9% | |
| Total | 255 | 100.0 | |
| Have there been changes in your household income due to climate impact on crop production? |
No change | 70 | 27.5% |
| Slightly decreased | 14 | 5.5% | |
| Significantly decreased | 171 | 67.0% | |
| Total | 255 | 100.0% |
Source: Own field survey, 2024.
3.1.10. Cultivated Crops by Respondent
Identifying a variable or elements of the related agricultural production system, like the type of crop and farming method was essential for the research at the Tuli Guled woreda. Based on the provided data, it is evident in Table 4 that wheat is the most dominant crop type among the studied population. It accounts for 130 (51.0%) of the total crop frequency, indicating a significant preference or suitability for wheat cultivation in the study area, and the second crop type is Sorghum, which follows as the second most popular crop, comprising 76 (29.8%) of the total. This suggests that sorghum is also a widely cultivated crop, possibly due to its adaptability to local conditions or its importance in the regional diet. Maize, while the least frequent of the three, still constitutes a significant portion of the crop mix at 49 (19.2%). This suggests that maize cultivation is also practiced, potentially for subsistence or commercial purposes. Out of the total 255 farmers, 216 (84.7%) of farms used rain-fed agricultural techniques, according to the kind of farming done by the farmers in the study kebele. For their farming activities, these farmers rely on the seasonal rains, while the remaining 39 (15.3%) of respondents, on the other hand, were involved in irrigated agriculture. Consequently, it is clear that the vast majority of farmers in Tuliguled woreda engage in rain-fed agriculture, growing their crops only during the rainy season. This emphasizes how crucial it is to comprehend the common farming techniques used in the area as well as the major variables affecting farmers’ decisions to use various farming techniques. The study is in line with Singh, (2019) households of study area engaged in rained agricultural production and thus they could able to harvest only once a year. Thus, heavily depend on rain fed and traditional practice is state which renders households of the study area highly vulnerable to climate change then affected by its adverse impact.
Table 4.
Types of crop cultivation.
| Variables | Indicators | Frequency | Present |
|---|---|---|---|
| Crop type | Maize | 49 | 19.2% |
| Sorghum | 76 | 29.8% | |
| Wheat | 130 | 51.0% | |
| Total | 255 | 100% | |
| what type agriculture activities you depend on | Irrigation | 39 | 15.3% |
| Rain fed | 216 | 84.7% | |
| Total | 255 | 100% |
Source: Own field survey, 2024.
3.1.11. Frames Perception of Impact Climate Change on Crop Production
According to Table 5, the survey study assessed farmers’ perceptions of the impact of climate change on crop production in the study area. The district is well-known for its agricultural production systems, particularly among local communities that greatly depend on economic activities involving the cultivation of various crops such as maize, wheat, and sorghum. However, farmers in the Tuli Guled Woreda now believe that crop production is seriously threatened by climate change. This belief is supported by observable consequences, including decreased crop yields, an increase in pest and disease outbreaks, and shorter growing seasons caused by erratic weather patterns. After focus group discussion and key informative interview was held, the farmers were mention that they were perceived the climate impact by observed that rain season had changed and year by year warm temperature (increasing temperature)
3.1.12. The Causes of Climate Change
Table 5 bellow shows that the beliefs, religious practices, cultural norms, and educational attainment of farmers surveyed about the cause of climate change diverged. The majority of farmers surveyed believed that supernatural causes were to blame for climate change, accounting for 105 (41.2%) of the total. However, 80 (31.4%) of farmers believed that human actions were the cause of climate change; other farmers believe climate change has caused natural processes. 54 (21.1%) and 16 (6.3%) believed that a combination of human actions and natural processes was to blame. So, the majority of farmers in Tuliguled district believe the causes of climate change are super natural based on their belief.
People’s understanding of climate change is greatly influenced by their cultural and religious convictions. Climate action, education, and policy impacted by a significant number of persons who believe that super natural is responsible for climate change. More awareness campaigns are necessary to help people comprehend the scientific underpinnings of climate change and the role of human activity. Communication and policy strategies should take these differing viewpoints into account, addressing scientific facts while honoring cultural and religious viewpoints.
3.1.13. Respondent Awareness of Climate Change and Its Impact on Crop Production
The data presented in Table 5 below shows that data collected from 255 respondents regarding their awareness of climate change and its potential impact on agriculture shows that a significant majority206 (84.8%) respondents consider themselves very aware. This suggests a high level of understanding about the issue, which may be attributed to increased exposure to climate-related news, education, or direct experience with its effects. Meanwhile, 26(10.2%) respondents reported being somewhat aware, indicating a moderate level of understanding. These individuals have some knowledge but not fully grasp the depth of climate change’s effects on agriculture. On the other hand, 23 (9%) respondents admitted to being not very aware, meaning they have limited or minimal knowledge about the topic. This could suggest a gap in education or access to information about climate change and its agricultural consequences. The overwhelming majority (84.8%) being very aware suggests that climate change and its impact on agriculture are well-recognized among the respondents. This could indicate that the survey was conducted among a group that is directly affected by or engaged with agricultural and environmental issues, such as farmers, agricultural researchers, or policy makers. Given the high level of awareness, efforts can now shift from just spreading awareness to implementing actionable climate-resilient agricultural practices. Policymakers and organizations should focus on supporting informed decision-making by providing resources on climate adaptation, sustainable farming, and financial support for affected agricultural sectors.
3.1.14. Respondents’ Perception of Local Climate Trends over the Past 30 Years
According to Table5 most farmers who replied (78.8%) said they had seen significant changes in local climatic patterns during the past 30 years. According to this, most farmers’ households think that the climate has changed noticeably, with temperatures rising and precipitation falling. Given that 11.8% of farmers who responded that there had been small changes in the local climate change pattern, 9.4% responded that there had been moderate changes. This suggests that people who think there is no climate change are quite rare. In the three kebele included in the study, most farmers who participated in the survey responded that they had noticed changes in the local climatic pattern. They pointed out that rising temperatures and decreasing precipitation.
3.1.15. Respondents’ Perception About the Frequency of Extreme Weather Events
The majority of farmers surveyed (75.5%) believe that extreme weather events have become more common, as shown in Table 5 bellow. This suggests that there is a notable perception of an increase in the intensity or frequency of these types of events in the region. This could point to rising worries about climate change or weather patterns getting worse. Just 10.0% of farmers surveyed claimed that extreme weather events had decreased in frequency.
This comparatively small proportion indicates that a small portion of the public believes that the frequency of extreme weather events has decreased or improved. Situations that are recent or local and do not fit the larger pattern may have an impact on this opinion. According to 14.5% of respondents, the frequency of extreme weather events has remained constant.
During the key interview and focus group discussion, the majority of farmers from the three study kebele reported that the most frequent extreme weather events in those areas is Drought. Droughts happen every two years, according to the saying that if there is rainfall one year, there would be a drought the following year. As a result, farmers in the Tuli Guled Woreda Crop Production System are severely impacted by climate change.
3.1.16. The Effect of Climate Change Crop Production
The impact of different climate factors on crop production is shown in Table 5 of the survey study of the three kebeles tuliguled woreda. Alterations to the precipitation pattern (50.0%): This factor has the highest frequency and percentage of any climate factor, indicating that it is the most significant one affecting crop productivity. Drought and excessive rainfall, both associated with altered precipitation patterns, can have a detrimental effect on crop yields. In order to account for these changes, it may be necessary to modify crop varieties or irrigation methods. Changes in Growing Seasons are the second most often reported factor (35.3%) influencing crop production. Changes in the length or timing of growing seasons can throw off planting and harvesting schedules, resulting in lower crop yields or a restricted range of crops that can be grown. Increases in Temperature (14.7%): Despite having a lower percentage than the other two, this factor still has a big impact. High temperatures can stress crops, reduce yields, and hasten evaporation. Two potential strategies to adjust to rising temperatures are to select more heat-resistant crop varieties or to change crop management methods. Increased Frequency of Extreme Weather Events (6.3%): the lowest frequency in the table, this factor possesses the ability to impact crop productivity. Severe weather conditions, like heat waves, floods, or storms, can harm crops directly. Changes in growing seasons and precipitation patterns are considered by a significant portion of respondents to be the most significant climate factors affecting the activities of tuliguled farmers that affect crop production.
During the focus group discussion, the majority of farmers discussed how crop production is negatively impacted by climate change because of variations in rainfall and temperature. According to farmers’ indigenous knowledge, rainfall variability has reduced crop productivity. The farmers were informed that the survey of study rainfall variability would look at how the beginning and ending of the rain has changed, causing farming disturbances like when to plant and harvest crops.
Table 5.
Farmers perception respondent climate change impact on crop production.
| Variable | Indicator | Frequency | Present |
|---|---|---|---|
| What are the causes of climate change? | Human action | 80 | 31.4% |
| Natural process | 54 | 21.2% | |
| the act of God | 105 | 41.2% | |
| Both God and natural | 16 | 6.3% | |
| Total | 255 | 100.0% | |
| How aware are you of climate change and its potential impacts on agriculture? |
very aware | 206 | 84.8% |
| some aware | 26 | 10.2% | |
| Not very aware | 23 | 9% | |
| Total | 255 | 100.0% | |
| Total | 255 | 100.0% | |
| How frequently have extreme weather events drought occurred in your area |
more frequent | 195 | 76.5% |
| less frequent | 23 | 9.0% | |
| No changes | 37 | 14.5% | |
| Total | 255 | 100.0% | |
| Which climate factors have effected crop production? |
temperature increases | 38 | 14.9% |
| Changin precipitation Pattern |
111 | 43.5% | |
| increases frequency of extreme weather events |
16 | 6.3% | |
| changes in growing seasons |
90 | 35.3% | |
| Total | 255 | 100.0% |
Source: Own field survey, 2024.
3.1.17. Likert Scale Result of Climate Change Impact of Crop Production Farmers
A five-point Likert scale for a few selected climate change variables was also used to gauge the sample respondents’ level of concern about how climate change is affecting agricultural production. A significant majority of responders said that changed weather patterns have resulted in lower crop yields. Specifically, 81.5% of respondents agree (63.1% strongly agree + 18.4% agree).
The largest group is made up of people who “strongly agree” (63.1%). This suggests broad consensus regarding the detrimental impact of weather variations on crop yields. The vast majority of respondents (81.1%) also thought that crop growth would be impacted by today’s lower rainfall. Additionally, 55.6% of farmers who responded said that crop growth would be impacted by less rainfall. Likewise, the vast majority of participants (63.5%) strongly concur that crop diseases and insect infections have grown increasingly prevalent. This suggests that the majority is quite concerned about the deteriorating crop health condition brought on by these variables (Table 6).
Similarly, most respondents (85.9%) agreed (21.6%) or “strongly agreed (64.3%) that agricultural growth cycles have been impacted by changes in temperature and precipitation patterns. This suggests that there is broad agreement that crop growth is significantly impacted by climate change. According to 62.0% of respondents, the community’s migration to cities is a result of agriculture’s incapacity to sustain them. According to the responder, many are working as daily laborers in the cities, and some of the community’s sources of income are shifting as a result of the changing climate.
Table 6.
About the Likert scale measurement of farmers respondent.
| No | Statement | 1 | 2 | 3 | 4 | 5 |
|---|---|---|---|---|---|---|
| 1 | the changes in weather pattern have negatively affected crop yields |
1.2% | 1.2% | 16.1% | 18.4% | 63.1% |
| 2 | Decrease of Rainfall would impact the crop growth. | 4% | 18.4% | 18.0% | 4% | 55.6% |
| 3 | Crop diseases and pest infection increases and become problem than earlier |
1.2% | 1.3 | 15.0% | 19.0% | 63.5% |
| 4 | change in temperature and precipitation pattern have affected the growth cycles of crops |
1.6% | 0% | 12.5% | 21.6% | 64.3% |
| 5 | the community is migrating to cities due to inability of agriculture | 1% | 8% | 12% | 17% | 62.0% |
Source: Own field survey, 2024.
3.2. Climate Change Adaptation Strategies Adopted by Farmers
Various adaptation strategies were employed by farmers’ households in the study area to reduce the impact of climate change on crop production systems. In this sense, the rural community that felt the effects of climate change employed strategies such as crop diversification, improved seed, changing crop varieties, planting trees, irrigation farming, and changing planting dates. Farmers employ a variety of adaptation techniques to reduce the impact of climate variability on crop productivity, according to findings from focus groups and key informants.
Improved seed (48.4%) The usage of enhanced seed kinds is the most popular tactic, as noted by almost half (48.4%) of the respondents. This implies that there is a significant preference for technical solutions that provide improved yields, resilience to disease, and flexibility in response to temperature changes. It suggests that in order to preserve or increase productivity, farmers are actively changing their input selections.
Diversification of Crops (37.2%) Crop diversification was the second most common choice, with 37.2% of participants choosing this option. This is a well-known method for distributing risk, enhancing soil health, and boosting climate variability resilience. Farmers can lessen their reliance on a single crop and its susceptibility to diseases, pests, and droughts by cultivating a variety of crops.
Diversification of Income Sources (4.4%) A smaller portion of farmers (4.4%) are coping by diversifying income sources beyond agriculture. This might include engaging in non-farm businesses, labor, or other activities to supplement their livelihoods. Although less prevalent, this strategy is crucial for financial resilience in the face of crop failure.
Techniques for Conserving Soil (2.0%) Soil conservation techniques like terracing, mulching, and contour plowing are used by just 2.0% of responders. It seems to be underutilized even though it is a vital long-term solution to land degradation and sustainable productivity; this could be because of a lack of knowledge, labor intensity, or initial expenditure.
Irrigation (8%) It is noteworthy that only respondents (8%), who regarded irrigation as a direct and frequently successful reaction to rainfall variability, mentioned it. Limited access to infrastructure, water supplies, or the money needed to install irrigation systems could be the cause of this low uptake.
Improved seed is widely used by farmers (48.4%), indicating that it is a preferred and successful method of climate change adaptation. Better seeds may be more resilient to shifting climatic conditions, which could be essential for preserving agricultural output stability and productivity.
3.2.1. Respondent of Farmers Support Received to Adapt the Climate Change
Types of assistance farmers in Tuliguled have received to help them adapt to climate change. The majority of farmers who responded (74%) said they were receiving government assistance, the main resource of support for climate adaptation. In order to help farmers, deal with the challenges posed by climate change, the government provide subsidies, grants, training opportunities, or infrastructure upgrades. Additionally, 16% of farmers report having received assistance from non-governmental organizations (NGOs). NGO involvement makes up a sizeable portion of the support network, even though it is less prevalent than government support. NGOs may provide focused interventions, like specialized training, funding, or creative ways to deal with the effects of climate change.
Agricultural Extension Services’ Limited Function Agricultural extension programs helped 26 (10%). Despite the fact that agricultural extension services can be quite helpful in advising farmers on climate-resilient techniques, this shows a comparatively little amount of support.
The significant role that government programs play in climate adaptation is highlighted by the fact that 83.1% of farmers depend on government assistance. This assistance was given to seed farmers to help them adjust to the lack of rain.
3.2.2. Farmers Respondent for Challenges Implementing Adaptation Strategies
One of the biggest obstacles to putting adaptation plans into practice, according to a sizable majority of farmers (71.0%), is lack awareness. It appears that a significant number of farmers believe they lack sufficient knowledge or insight to modify their farming methods in an efficient manner in response to climate change, with 29.0% citing resource scarcity as a challenge. For the purpose of putting adaptation plans into practice, this category includes material resources such as funding, equipment, infrastructure, and tools. The significant proportion of farmers (71.0%) who report having difficulties as a result of ignorance suggests that information and educational gaps represent a significant obstacle. This shows that in order to give farmers the knowledge they need to put effective adaptation strategies into practice, there is a need for increased training, workshops, and information sharing. The study in line with Abdullahi, (2023)The main obstacles to adaptation for the majority of farmers in the study area were a lack of knowledge, a lack of funds, a lack of access to irrigation water, and a lack of farmland. The study also is contradicted with Prakash It has been observed that farmers’ adaptation behavior is altered by interaction and education. Consequently, concentrating on farmer-to-farmer communication instead of a top-down extension strategy can aid in enhancing agricultural adaptation.
Table 2.
Farmer’s strategies to adopt climate change.
| Variable | Indicator | Frequency | Present |
|---|---|---|---|
| what strategies have you adopted to cope with the impact of climate change on your framing |
crop production diversified | 105 | 37.2% |
| using improved seed | 131 | 48.4% | |
| Irrigation | 2 | 8% | |
| soil conservation techniques | 5 | 2.0% | |
| Diversifying in come Source |
12 | 4.4% | |
| Total | 255 | 100.0% | |
| what support do you received to adapt the climate change? |
government support | 185 | 74% |
| NGO support | 43 | 16.% | |
| Agriculture extension | 26 | 10.% | |
| Total | 255 | 100.0% | |
| what challenges have you faced while implementing adaptation strategies? |
lack of knowledge | 180 | 71.0% |
| limited access to resource | 74 | 29.0% | |
| Total | 255 | 100.0% |
Source: Own field survey, 2024.
3.3. Rainfall and Temperature Trends of Tuliguled Woreda (1993-2022)
This section presents the results of the analysis of secondary data from NMI, including mean, maximum, and minimum annual and seasonal temperatures, total annual rainfall, and trend analysis and interpretation of seasonal rainfall. Therefore, it is necessary to compare them with farmers’ perceptions of the temperature and rainfall patterns in the study area to determine their relationship to crop productivity.
3.3.1. Mann-Kendall Monotomic Trend Analysis
This research used data from the Ethiopian Meteorological Station at Jigjiga and the Mann-Kendall (MK) test to analyze trends in climate data, with an emphasis on rainfall, maximum temperature (Tmax), and minimum temperature (Tmin) across a 30-year period from 1993 to 2022.
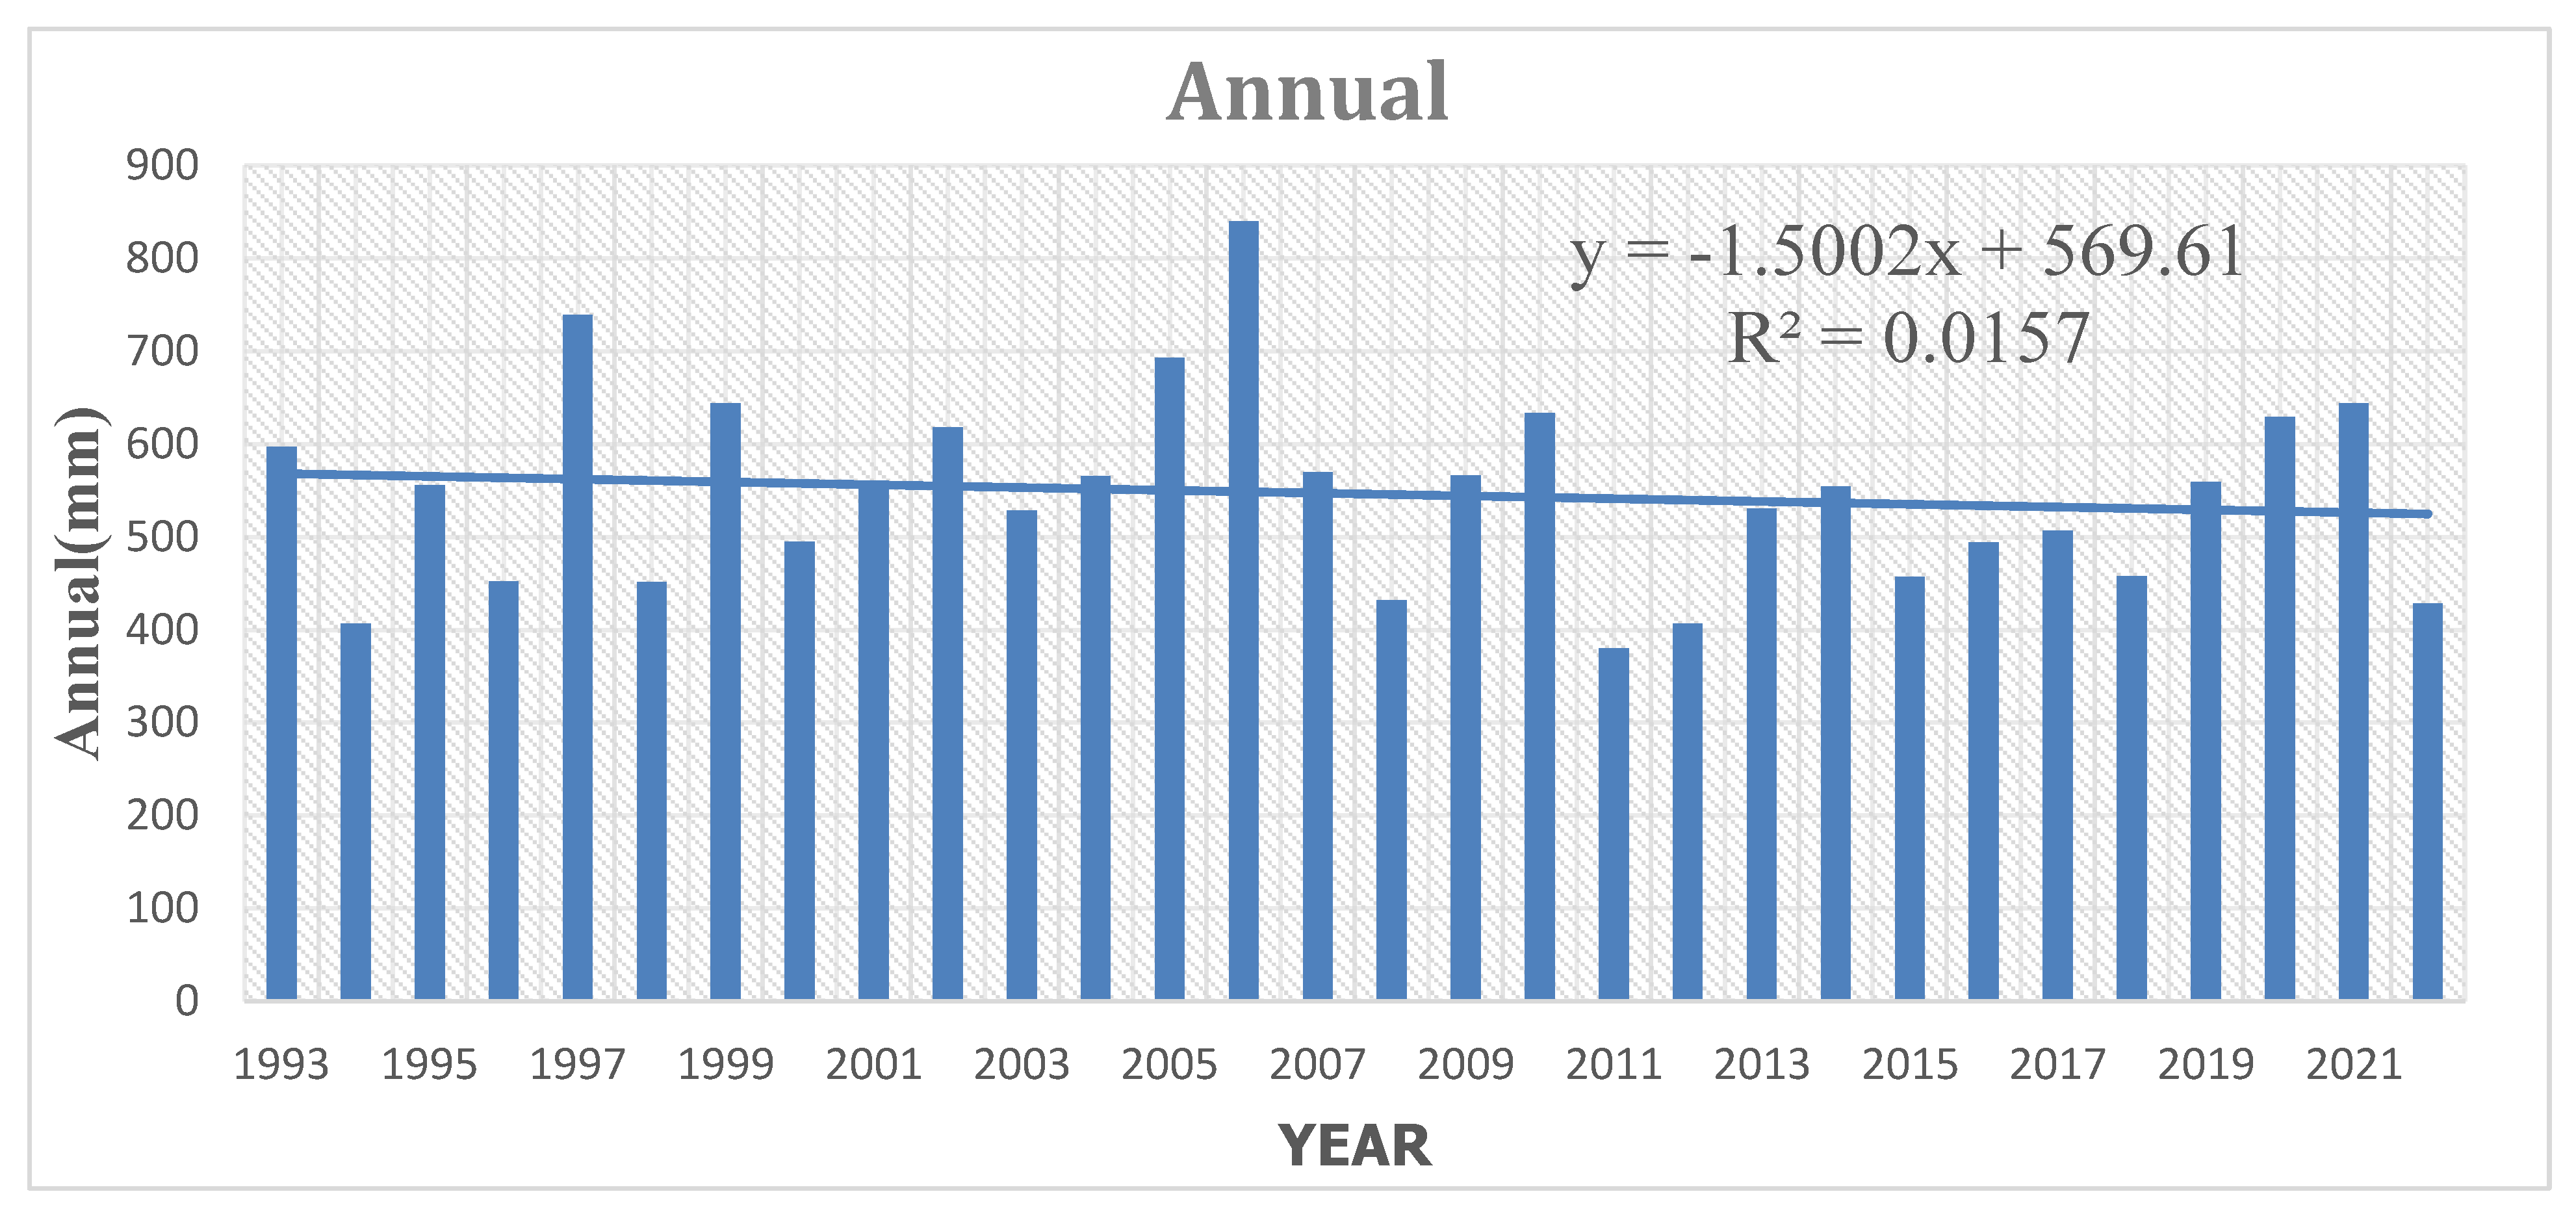
3.3.2. Annual Rainfall Trend Analysis
Figure 3 shows the pattern of the 30-year data on total yearly rainfall. which showed that over the entire reference period, the year 2006 saw the highest total annual rainfall of 839.8 mm, while the year 2011 show the lowest total annual rainfall of 380.1 mm. According to 30 years of data, the average annual rainfall is 546.4 mm. Rainfall on a yearly basis is trending downward, as indicated by the negative values of Z and Q statistics.
Figure 3.
Annual Rainfall Trend Analysis.
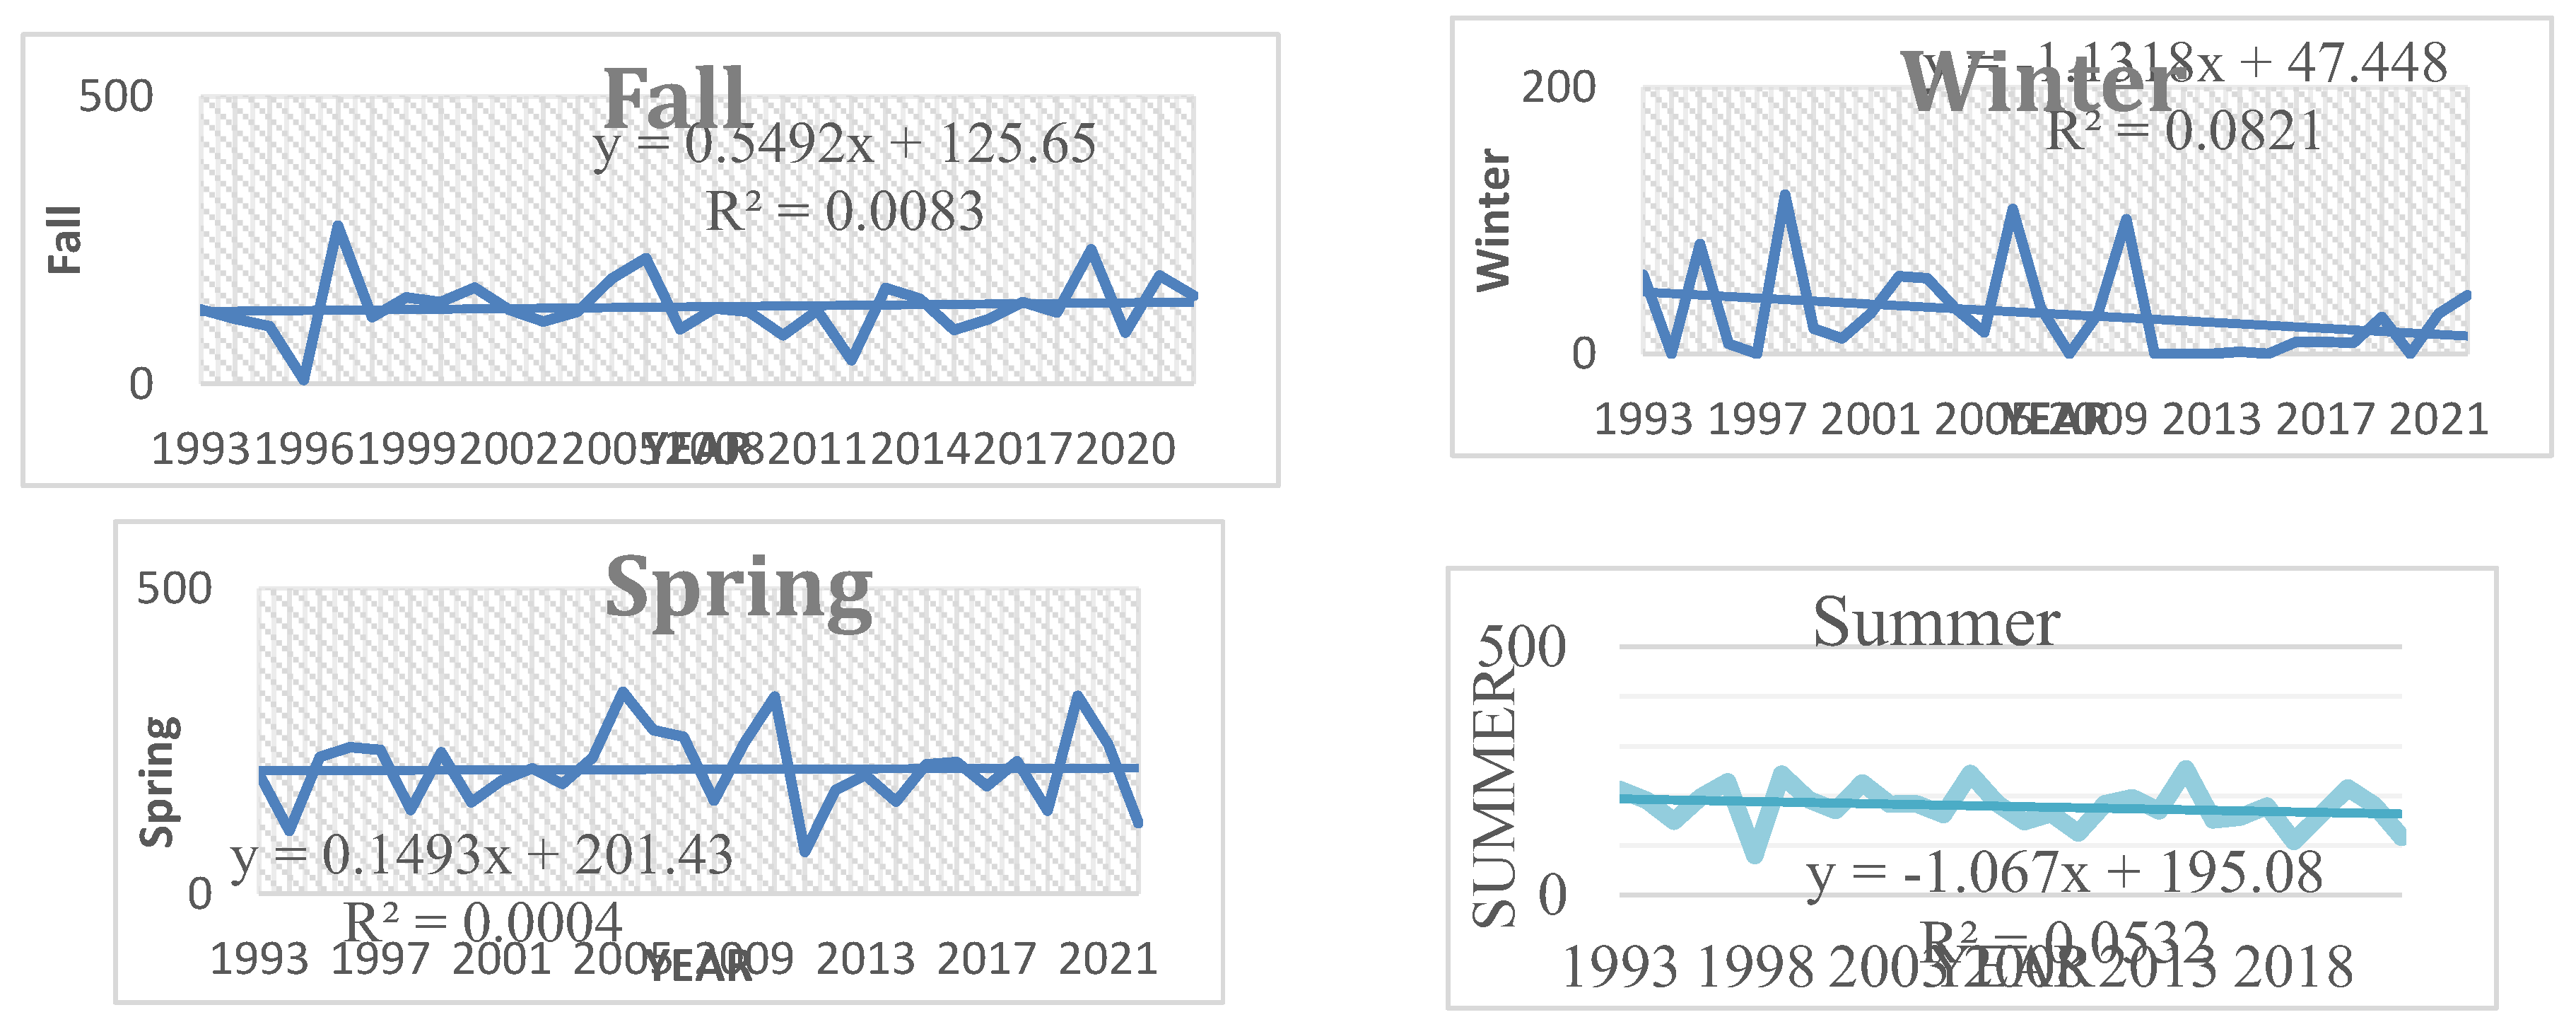
3.3.3. Seasonal Rainfall Trend Analysis
The analysis of the 30-year rainfall data shows clear seasonal differences in precipitation amounts. With an average of 331.0 mm, the spring season had the most seasonal rainfall overall, suggesting a time of substantial rainfall that was advantageous to the woreda’s farmers’ lives. The farmers’ villages in Tuliguled Woreda faced a major difficulty when the overall seasonal rainfall was 0.0 mm. This occurred several times over the winter season, suggesting that some years may see dry winter conditions.
Winter (December-February): The winter season showed a somewhat declining trend in rainfall, with a slightly negative Z value of about -1.118. A decreasing slope of -0.407 mm annually was found during the winter months using Sen’s slope estimator.
Spring (March-May): Sen’s slope revealed a somewhat declining trend of -0.038 mm year in spring rainfall over the 30-year period, which shows that there is no discernible trend in spring rainfall over the studied period.
Summer (June-August): The trend line’s negative slope, which is around -1.64, indicates a declining tendency in rainfall over the summer, but Sen’s slope predicted a decrease slope of ½ -1.371 mm annually during this time.
Autumn (Fall) September-November: With a Sen’s slope of 0.50 mm annually and a very modest positive trend of roughly 0.392 throughout the autumn season, the fall rainfall trend for the examined time period was somewhat increasing.
Figure 3.
Seasonal rainfall trend analysis.
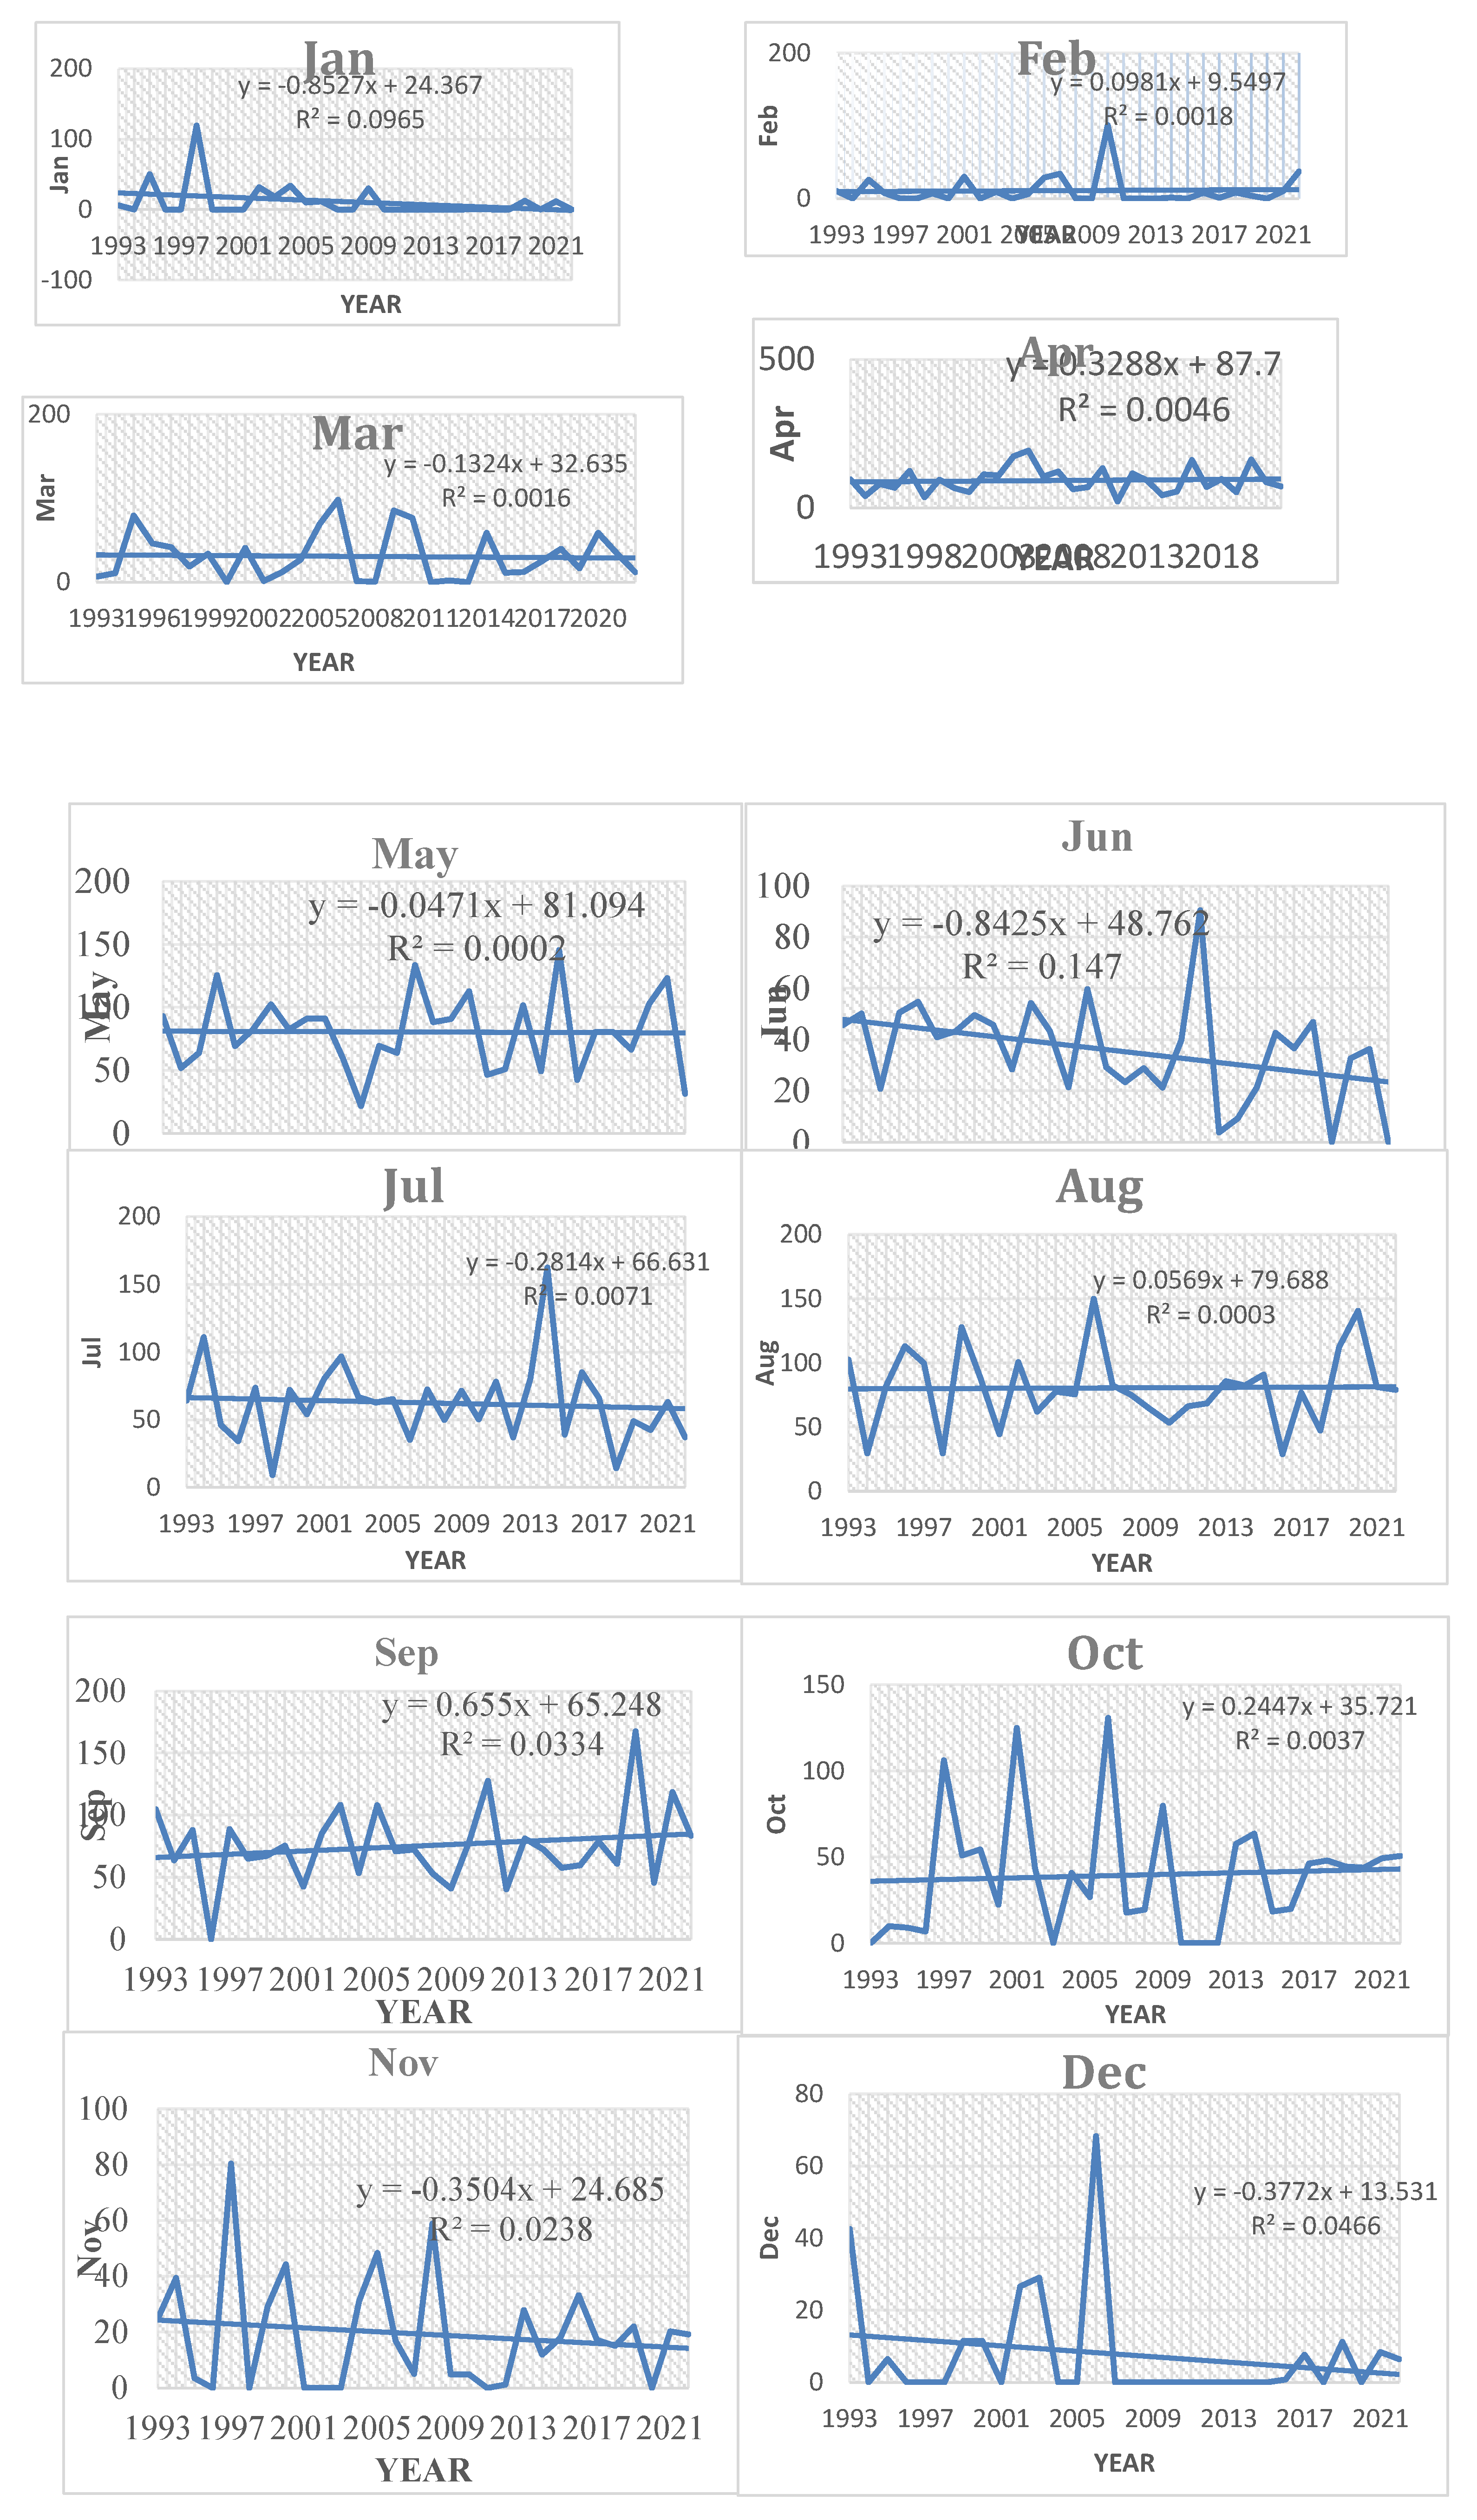
3.3.4. Monthly Rainfall Trend Analysis
Each month’s variation in rainfall data (trend) is determined separately using the Mann-Kendall statistical approach, and the size of the slope is determined using Sen’s slope estimator, as shown in Figure 5. An analysis of the monthly rainfall data revealed notable variations, with some months exhibiting an upward tendency and others a downward. Five months (Feb, Apr, Sept. Oct, And Nov) give positive values of z– statistics which represent rising trend while other months (Jan, Mar, May, Jun. Jul, Aug, And Dec) represent falling trend as shown the estimated Sen’s slope (q) was also calculated for each month separately and the month (Feb, Apr , Sep, Oct And Nov) Give increasing slope magnitude and the month (Jan, Mar, May, Jun, Jul, Aug And Dec) showed a decrease in the slope magnitude, as indicated by their negative Kendall’s tau values.
Figure 5.
Monthly Rainfall Trend Analysis.
3.3.5. Temperature Trend Analysis
Trend Analysis of tuliguled woreda has been done with 30 years temperature data from 1993- 2022. Mann-Kendall and Sen’s Slope Estimator has been used to determine the trend. Figure 5. Show the Maximum, Minimum, average temperatures and comparison of the temperatures of the study area for the study period respectively.
The Woreda experiences significant temperature fluctuations, with record highs of 29.81 °C in 1997 and 28.48 °C in 2019, as well as lows of 8.9 °C, posing risks to crop productivity. This data reveals that maximum and minimum temperatures do not exhibit a direct relationship within the Woreda. Adopting improved seed varieties affects this temperature variation challenges for climate-smart, Sustainable agriculture and food security.
Figure 4.
Maximum, Minimum and Average Temperatures for the Study Period.
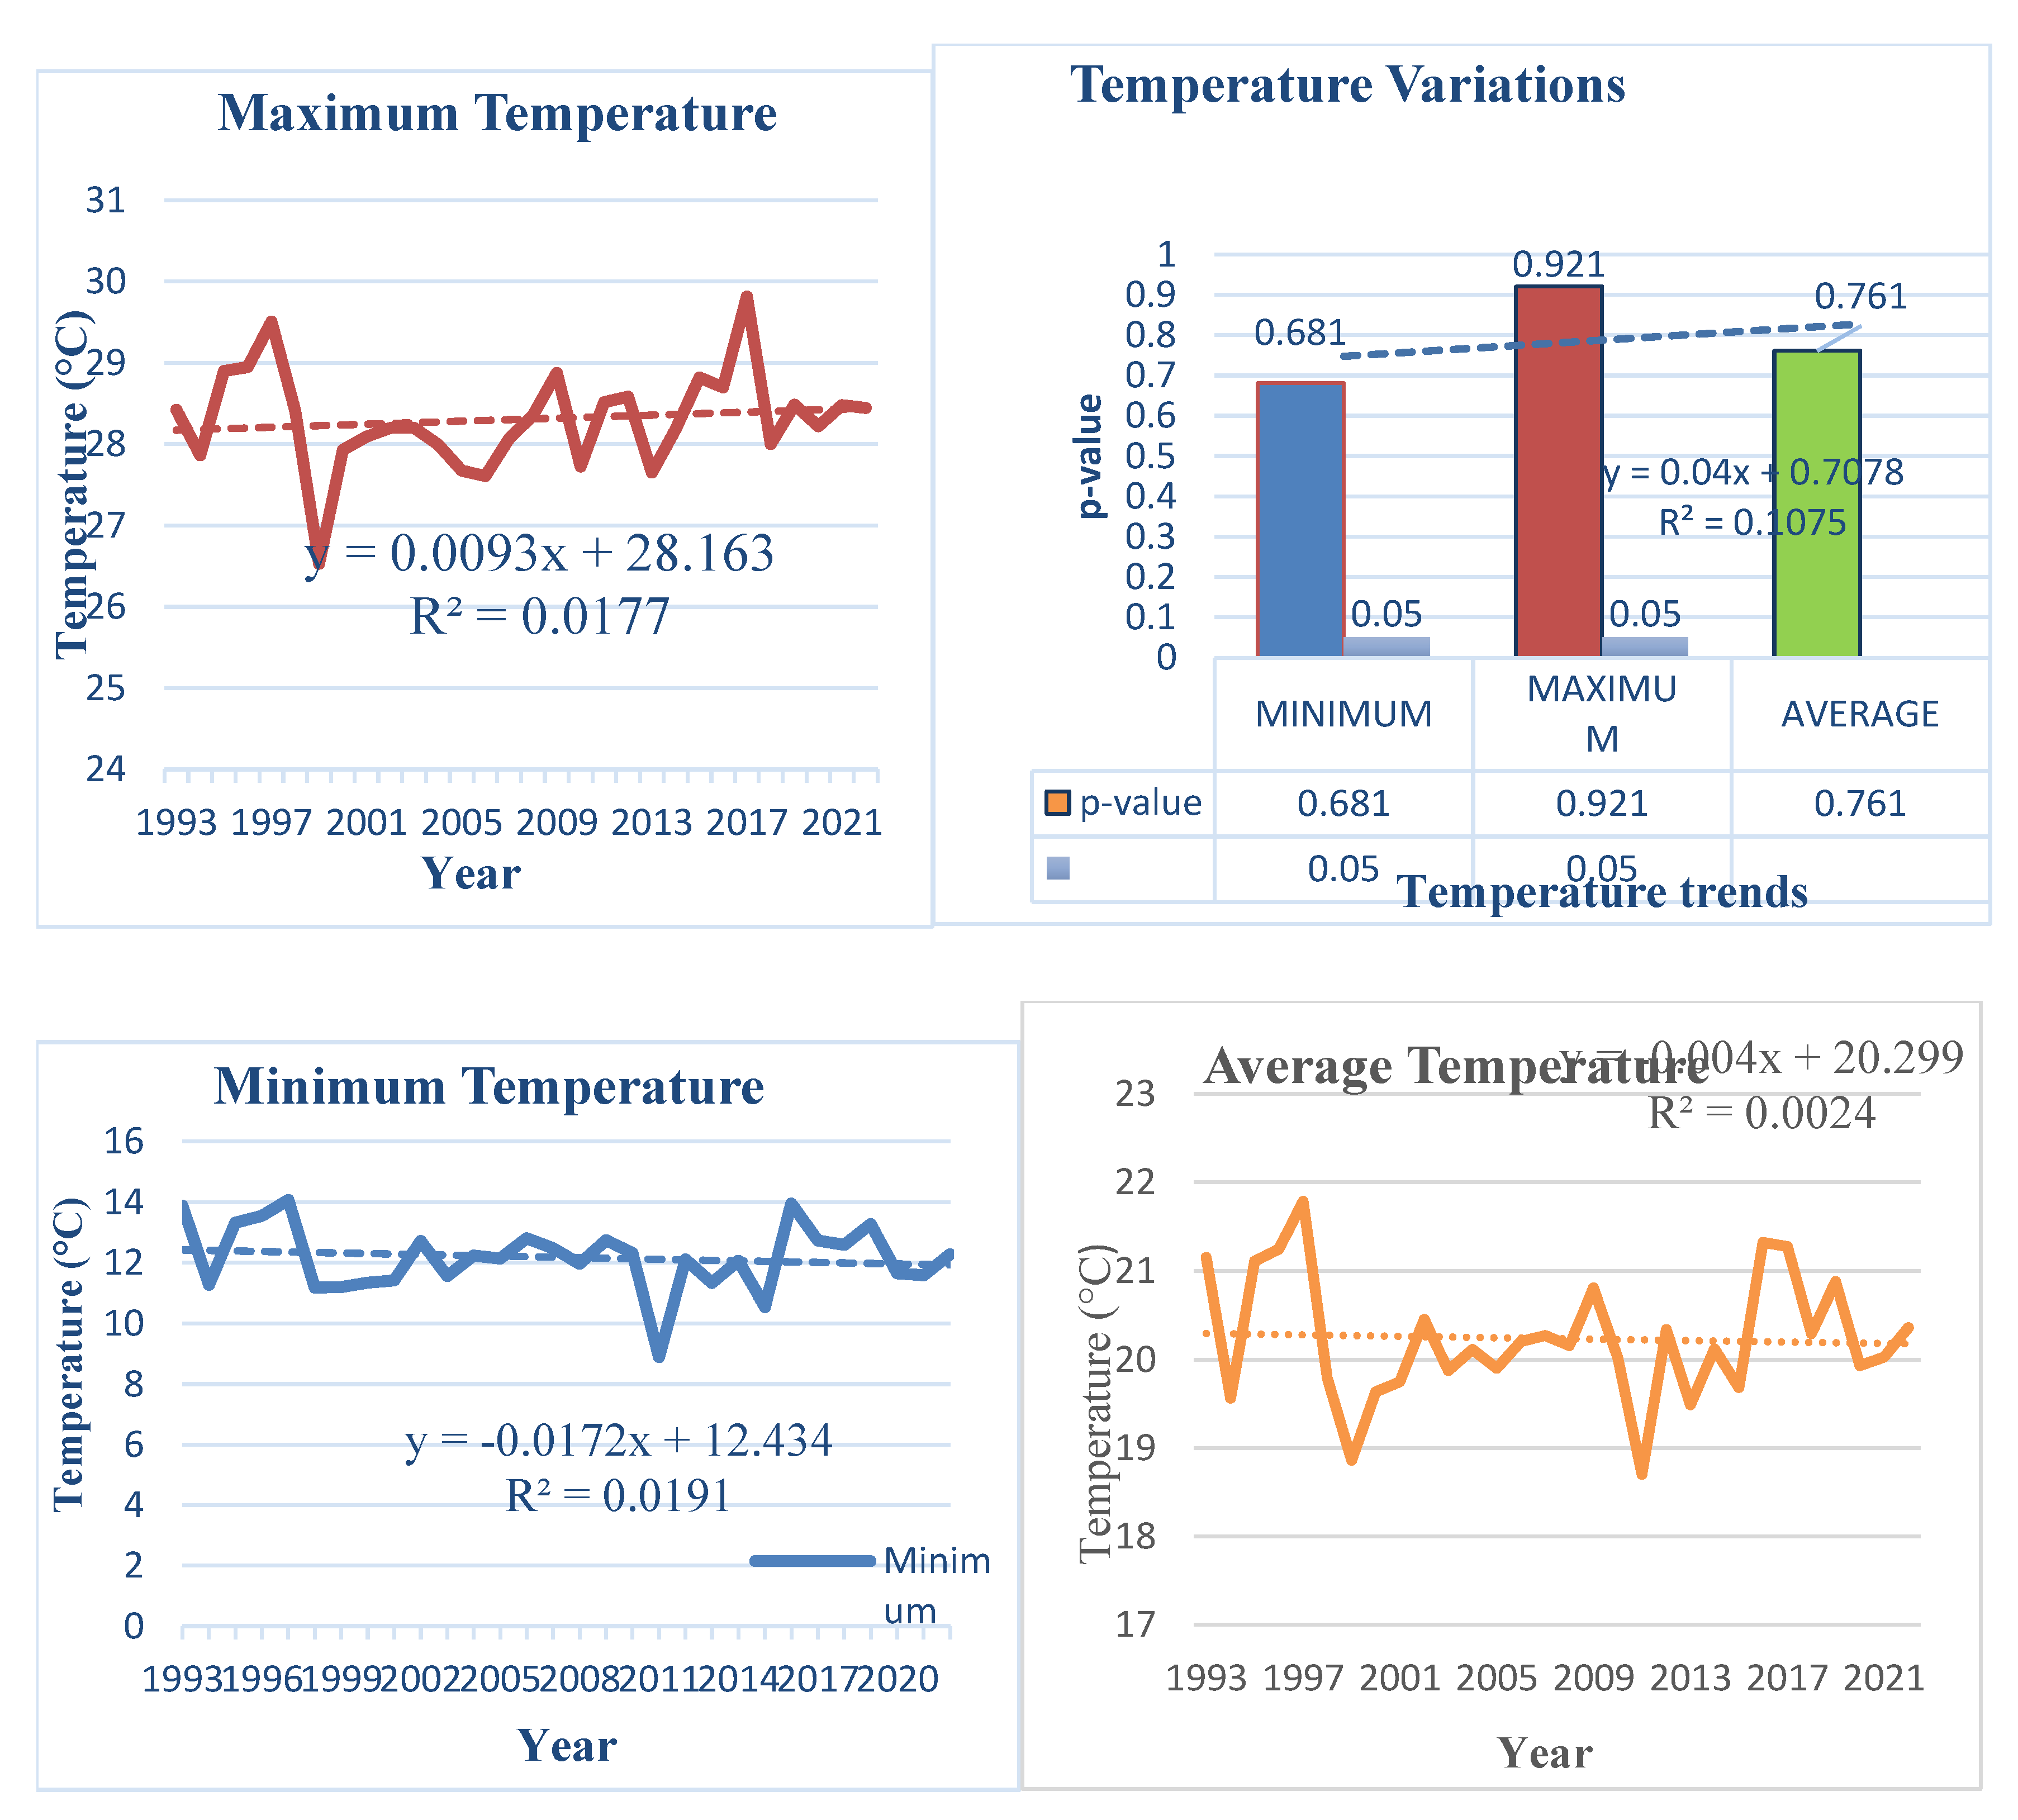
Over the past three decades, there has been a notable increase in temperatures and a decrease in rainfall in Tuliguled Woreda, according to an examination of temperature and rainfall patterns. These patterns support the findings of Abraham & Mekuyie (2022), which show that crop production communities in Tuliguled Woreda face major challenges due to the notable increase in temperatures and decrease in rainfall. In order to create adaptation plans that work and guarantee sustainability over the long run, these problems must be addressed.
Table 8.
Summary of Climate Patterns and Trends with Z Statistics and Sen’s Slope.
| Observation | Trend Direction and Magnitude | ||
|---|---|---|---|
| Z-Statistic | Sen’s Slope | ||
| Monthly Rainfall Trend | Decreasing in Jan, Mar, May, Jun, Jul, Aug, Dec; Increasing in Feb, Apr, Sept, Oct, Nov | Varies | Varies increasing slope magnitude (Feb, Apr, Sep, Oct and Nov) decrease slope magnitude (Jan, Mar, May, Jun, Jul, Aug and Dec) |
| Seasonal Rainfall Trend | Winter (Dec-Feb): moderate decrease; Spring (Mar-May): low Decline; Summer (Jun-Aug): Steep decline; Fall (Sep-Nov): Slight increase | Negative/ Positive | Winter: -0.407 mm/year Spring: -0.038 mm/year Summer: -1.371mm/year Fall: +0.50 mm/year |
| Annual Rainfall Trend | Decreasing significantly | -1.371 | -0.407 mm/year |
| Temperature Trend | increasing sharply | Positive | +0.5 °C per decade |
Source: Analysis from Mann- Kendell Test on Climate Date 2024.
In the key interview concern about the climate change impact on crop production, especially temperature and rainfall, most of the respondents pointed out that increases in temperature and decreases in rainfall are the most challenging, resulting in a decrease in crop yield. The farmers responded that increases in temperature have given opportunity to pests that damage the growth and development of crops.
3.3.5. Descriptive Summery of Average Crop Yield of Last Two Years
Table 3.
Descriptive summary of crop yield.
| N | Range | Minimum | Maximum | Mean | Std. Deviation | Variance | |
|---|---|---|---|---|---|---|---|
| Average crop yield of last two years |
255 | 101.0 | 19.0 | 120.0 | 52.209 | 20.3813 | 415.396 |
| Valid N (listwise) | 255 |
From Table 9: the minimum average crop yield earned by the Tuliguled woreda in the Fafan zone of the Somali regional state of Ethiopia was 19 quintals, while the maximum average of crop yield was 120 quintals, while the overall average and standard deviation were 52.209 and 20.3813, respectively, which indicated that there was a big variation in the earned average crop yield among the households in Tuliguled woreda during those last two years.
3.3.6. Multiple Regression Model Output
In multiple linear regression analysis, the goal is to predict the value of a dependent variable, in this case, average crop yield in the last two years in Tuliguled woreda, based on multiple independent variables like climate factors, socio-economic factors, demographic factors, and adaptation strategies. The model aims to determine the relationship between the average crop yield and the various factors which included in the analysis.
3.3.7. Model Summery
Interpretation This model summery shows thatR^2= 21.3%, Adjust R^2=9.5% which means 21.3% only
the average crop yield for the last two years in in Tuliguled woreda was explained by different predictors or
Table 4.
Model summery.
| Model | R –Square | Adjust R- Square | Std. Error | Df1 | Df2 | F -Value | Sig |
|---|---|---|---|---|---|---|---|
| 1 | 0.213 | 0.095 | 19.3867 | 33 | 221 | 1.810 | 0.007* |
explanatory variables
Dependent Variable: Average crop yield of last two years
Table 5.
ANOVA.
| Model | Sum of Squares | Df | Mean Square | F | Sig |
|---|---|---|---|---|---|
| Regression Residual Total |
22443.922 83066.679 105510.601 |
33 221 254 |
680.119 375.867 |
1.809 | 0.007* |
Interpretation
Model test
= there is no relationship between average crop yield and independents variables like climate change factors, socioeconomics factors and other factors or
3.3.8. Multiple Linear Regression Model Output
When using multiple linear regressions Predicting the value of a dependent variable in this example, the average crop production over the previous two years in Tuliguled woreda based on a number of independent variables, such as climate, socioeconomic, demographic, and adaptive techniques, is the aim of the analysis. The model seeks to ascertain how the different elements included in the analysis relate to the average crop production.
Every independent variable, including demographic, socioeconomic, climate, and adaptation strategies, has a coefficient that indicates the strength and direction of its influence on the dependent variable, average crop production. The average crop production in the specified woreda would have been estimated by the model in response to changes in the independent variables. This study aids in determining which factors significantly affect crop yield and can be utilized to inform decisions or interventions aimed at enhancing crop production in the area. The model output
In equation form the least square linear model can be written as
= +++……………………………. + is called multiple regression formula
From the table above 11 the model output can be written as follows
According to the p-value of each independent variables as comparing the level of significant (α =5%=0.05) the following are intercept and independent variable were having significant p-values.
Intercept Value (=43.276): This coefficient represents the expected average crop yield when all independent variables in the model are equal to zero. In practical terms, it can be thought of as the baseline yield under the conditions specified by the model, assuming that the other factors do not contribute (i.e., they are constant) which means the average mean of the crop yield is 43,276 while other factors held as constant.
Statistical Significance: p-value (0.001): The p-value indicates that the intercept is statistically significant at the 0.001 level. This suggests strong evidence against the null hypothesis, which posits that the intercept is equal to zero. Thus, we can conclude that the average crop yield is significantly different from zero when all other variables are held constant.
Confidence Interval95% Confidence Interval (17.020, 69.531): This interval provides a range of values for the true average crop yield when the independent variables are zero. Since the entire interval is above zero, it further supports the conclusion that the average crop yield is significantly positive. This implies that even in the absence of the independent in conclusion, the intercept of 43.276 indicates that when all independent variables are held at zero, the average crop yield is expected to be 43.276 units. The significant p-value and confidence interval, which does not include zero, reinforce the notion that this baseline yield is meaningful and statistically significant.
There are a number of factors (independents variables those are significantly related to the dependent variable (Average crop yield in crop production) and these are Types of Agro-activity() and this indicated that there is positive and significantly relationship between type of agro-activity and average crop yield and when one unit of average crop yield increase the type of agro-activity would have increased by factor of 12.969 times by accounting another independents factors constant and its statistically highly significant with p-value = 0.000.
risk of crop damage by drought (() and this indicated that there is highly significant negative relationship between average crop production (yield) and risk of crop damage by the drought which means unit increase of average crop yield factor of risk of crop damage by the drought there is decreased by factor of -1.871 times hold constant another factors.
years of experience for crop cultivates ()
This suggests that the average crop production (yield) and the number of years of experience cultivating crops have a highly significant negative relationship. When accounting constant for additional independent factors, the average crop yield at one unit of average crop yield increase there is decreasing by the factors -4.335 times for every of experience, with a statistically significant p-value of 0.028*.
farm size:()
Coefficient Value (4.427): This indicates that for each unit increase for average crop yield in farm size, is increase by approximately factors of 4.427 times, assuming all other independent variables in the model are held constant.
Statistical Significance
p-value (0.038): The p-value indicates the probability of observing the data (or something more extreme) given that the null hypothesis (which usually states that there is no effect) is true. A p-value of 0.038 suggests that the relationship between farm size and average crop yield is statistically significant at the 0.05 level. This implies there is sufficient evidence to reject the null hypothesis and conclude that farm size does have a meaningful impact on crop yield.
Confidence Interval
95% Confidence Interval (0.253, 8.601): This interval provides a range of values within which we can be 95% confident that the true population parameter (the actual effect of farm size on average crop yield) lies. Since the interval does not include zero, it further supports the conclusion that farm size is a significant predictor of crop yield.
In conclusion, the data points to a statistically significant correlation between larger farms and greater average crop yields. The substantial p-value, the confidence interval that excludes zero, and the positive coefficient all support the idea that farm size is a crucial factor in determining agricultural production.
Coefficient Value (=−4.088): This coefficient indicates that if a farmer’s way of life is affected by climate change, the average crop yield is expected to decrease by approximately 4.088 units. This interpretation assumes that all other independent variables in the model are held constant.
Statistical Significance
p-value (0.045) The p-value suggests that there is a statistically significant relationship between the way of life affected by climate change and average crop yield at the 0.05 significance level. This means that there is enough evidence to reject the null hypothesis, which typically posits no effect or no relationship.
Confidence Interval
95% Confidence Interval (-8.086, -0.091): This interval indicates a range of values for the true effect of climate change on crop yield. Since the entire interval is below zero, it reinforces the conclusion that climate change-affected ways of life have a statistically significant negative impact on average crop yield.
In conclusion, the analysis indicates that farmers whose ways of life are impacted by climate change tend to experience lower average crop yields. The negative coefficient, significant p-value, and confidence interval not encompassing zero collectively support the assertion that climate change has detrimental effects on agricultural productivity.
The findings of this research highlight the significant impacts of climate change on crop yield (production) in Tuli Guled Woreda. The increasing frequency with changes in temperature and rainfall patterns, have posed serious challenges to farmers’ livelihoods.
Adaptation strategies employed by local communities have shown promise in mitigating the adverse effects of climate change that changing climate conditions can exacerbate pest populations, leading to reduced agricultural output.
According to the findings of this study, by utilizing metrological data from a National metrological agency of Ethiopia specifically the study area using a non-paramedic statistical test, Mann-Kendall analysis of the annual maximum temperature in the study area reveals a significant increasing trend of 0.463 °C per year for the last 30 years (p = 0.005), indicating a robust statistical significance. The positive value of Sen’s slope suggests that the observed increase in maximum temperatures is not only real but is also likely linked to broader climatic changes, particularly those driven by anthropogenic factors, and these findings are in line with another research study conducted by Mandel & Lipovetsky, (2021). in this study The Intergovernmental Panel on Climate Change reports a global increase in average temperatures, with many regions experiencing annual maximum temperatures rising at rates similar to or exceeding those observed in this study. They highlight that global mean surface temperature has increased by approximately 1.1 °C since the late 19th century, with regional variations in temperature increases, and also another study supported the current study. In a study focusing on East Asia, Zhou et al. found an annual increase of 0.4 °C per decade in maximum temperatures, which aligns closely with the findings of this analysis. Their study also attributed the increase to greenhouse gas emissions and emphasized the need for mitigation strategies (Klein & Anderegg, 2021)
While many studies including the above cited ones were confirm a trend of rising temperatures and in line with the present study , some research presents contrasting findings such as study conducted by (Klein & Anderegg, 2021b) . In a study on temperature trends in certain parts of North America, Klein et al. reported a plateau in maximum temperatures over the past few decades, suggesting localized effects such as urban heat islands or natural climate variability.
In this study, the finding that types of agro-activity significantly influence average crop yield, as indicated by the coefficient (β_7) ̂=12.969 with a p-value of 0.000, highlights a robust positive relationship. This suggests that for every one-unit increase in average crop yield, the type of agro-activity is likely to increase by a factor of approximately 12.969, while controlling for other independent factors. The statistical significance of this result (p < 0.001) underscores the reliability of the relationship. And this is in line with another study findings, for instance, the study that was conducted by Young et al (2021) (Brown et al., 2018) in this study A comprehensive meta-analysis reviewed numerous studies on agricultural productivity and concluded that diversified farming systems tend to yield better results than monocultures. They reported that diversification could enhance yields by approximately 20% on average, again with varying degrees of statistical significance. This reinforces the argument that different types of agricultural activities significantly contribute to crop yields, although the exact metrics differ.
In this study the average crop production and years of agricultural cultivation experience have a statistically significant negative connection, as seen by the coefficient (β_ {24}) =-4.335 and a p-value of 0.028. This indicates that, after accounting for all independent variables, the for each unit of average crop production in the Tuliguled district farm experience decline by factors -4. for every extra year of agricultural farming experience. The importance of this association is further supported by the confidence interval (CI) between -8.199 and -0.471, which shows a high probability that, in the setting under study, greater experience may correlate with lower in this The study in line with Gezie, (2019) Farmers with more experience are more likely to notice changes in the climate. It is also hypothesized that awareness of climate change is positively correlated with the head of household’s educational attainment. This suggests a potential turning point where expertise no longer correlates to greater yields, which is partly in line with the findings of the current study. Regardless of their years of experience, farmers must constantly alter their procedures, as this study’s negative coefficient highlights
Farm size: The coefficient value (β^25=4.427) (β^25=4.427) indicated a positive relationship between farm size and average crop yield. Specifically, for each unit increase average crop yield there is factor 4.427 times increases farm size units, assuming that all other independent variables remain constant. This finding suggests that larger farms are likely to benefit from economies of scale, potentially leading to improved agricultural practices, better resource allocation, and enhanced productivity and statistical significance supported with coefficient by the associated p-value of 0.038 provides strong evidence against the null hypothesis, which posits that there is no effect of farm size on crop yield. Since this p-value is less than the conventional threshold of 0.05, we can conclude that the relationship is statistically significant. This finding suggests that policymakers and agricultural stakeholders should consider farm size when developing strategies aimed at increasing crop productivity and this study were supported the existed literatures for instance study that was conducted by (Hussein et al., 2021) and this study discovered that, with a p-value of 0.045, indicating statistical significance, growing farm size increased yield by around 3.5 units for every unit increase in farm size which coincide in the current study , therefore the coefficient value, p-value, and confidence interval of the present study demonstrate a strong and statistically significant correlation between farm size and average crop output. While comparable trends have been found by other research, the complexity of agricultural production parameters is highlighted by the differences in the impact and statistical significance and another several studies related to this study, one of the biggest obstacles to climate change adaptation is the lack of available land. The study in line with Abdullahi, (2023) the most crucial element in deciding an adaptation strategy is farm size; farmers with larger farms have implemented one or more climate change adaptation strategies, in contrast to those with smaller land holdings. A household with more land is also more willing to take the chance of trying a new variety and diversifying its agricultural production. Furthermore, Mulatu (2013) said that one of the key elements that greatly influence farmers’ preferences for climate change adaptation techniques is the size of a household’s farm.
Farmer’s way of life: The coefficient value (=−4.088) shows that the average crop yield and the way in which farmers live are negatively correlated with climate change. In particular, this implies that, if all other independent factors remain constant, for each unit of average crop yield the farmers lifestyle had decreases by factor of - 4.088 times if climate change has a negative influence on a farmer’s lifestyle. This research emphasizes the serious threats to agricultural output posed by climate change and the necessity of developing adaptive solutions to lessen their detrimental consequences and this also highly supported the statistically significant for the association between average agricultural crop yield and farmers lifestyles influenced by climate change is statistically significant at the 0.05 level, as indicated by the p-value of 0.045. The null hypothesis, which states that agricultural output is unaffected by climate change, is sufficiently refuted by this value. Because the social and economic aspects of climate change have a direct influence on agricultural outcomes, the relevance of this link emphasizes how important it is to address these aspects and consistence to the another study for instance the study that has been conducted by (Knox et al., 2016) for this study multiple compiled data from several research and concluded that crop yields are often negatively impacted by climate change, especially in poor nations. They pointed out that socioeconomic considerations frequently have an impact on how severe these affects are, which is consistent with the study’s findings that emphasize the significance of the farmer’s way of life also another study had been founded significant and negatively impact by the study conducted by (Emran, 2021) found that in sensitive locations, climate change may result in yield decreases of around 3.5 to 5.0 units, which is in line with the results of the current study. Their study highlighted the necessity for farmers to adopt adaptive farming techniques in order to lessen these effects. The study also in line with Gezie, (2019). The most significant industry in sub-Saharan Africa is agriculture, but climate change is expected to have a negative effect on it.
4. Conclusions and Recommendations
4.1. Conclusions
The primary objective of this study was to assess the impacts of climate change on crop production and to evaluate adaptation strategies in Tuliguled Woreda, Fafan Zone, Somali Regional State. The research employed both qualitative and quantitative methodologies, utilizing a cross-sectional survey to efficiently collect primary data in alignment with the study’s timeline.
The study’s findings showed that among Tuliguled farmers, improved seed varieties are the most widely used climate change adaptation method, followed by crop diversification and income source diversification. This suggests that technical solutions that improve crop productivity, disease resistance, and climate resilience are highly preferred.
Analysis of meteorological data revealed a concerning trend of rising temperatures and erratic rainfall patterns, underscoring the urgent need for proactive adaptation measures to safeguard future crop production. Statistical methods, including ANOVA (Table 11) and regression analysis, were applied to examine the relationship between crop yields in Tuliguled Woreda and various independent variables, such as socioeconomic factors and climate change adaptation strategies.
At a significance level of α = 0.05, several factors were found to have a statistically significant influence on average crop yield such as Climatic variables Increased maximum temperature and decreased precipitation and Socioeconomic factors Limited farmer knowledge of adaptation strategies, farm size, years of farming experience, and livelihood practices.
The findings highlight the critical challenges posed by climate change to agricultural productivity in the area. Addressing these issues requires targeted interventions, such as enhancing farmers’ awareness of adaptive techniques, promoting climate-resilient farming practices, and implementing policies that support sustainable agricultural development in Tuliguled Woreda.
4.2. Recommendations
Based on the study findings, the following recommendations are forward:
- ⮚
- Since there is a significant impact of maximum temperature on crop yield, farmers should have explored heat-tolerant crop varieties or considered adjusting planting schedules to mitigate the adverse effects of high temperatures on crop production.
- ⮚
- Since rainfall precipitation directly affects crop growth and yield, farmers should implement water conservation techniques such as rainwater harvesting and irrigation systems to ensure adequate water supply for crops, especially during periods of erratic rainfall.
- ⮚
- Small-scale farmers should be supported with access to resources, training, and technology to optimize their land use efficiency and productivity, ensuring that farm size does not limit their ability to adapt to changing climatic conditions.
- ⮚
- Empowering farmers with the knowledge, resources, and support systems needed to adapt to changing climatic conditions is essential for ensuring sustainable crop production and food security in the face of evolving environmental pressures.
- ⮚
- Farmers of Tuliguled woreda should diversify agricultural activities by incorporating resilient crops or adopting mixed cropping systems, which can help buffer against the effects of climate change on specific crops, thereby enhancing overall crop yield stability.
- ⮚
- Further research and monitoring are essential to assess the long-term impacts of climate change on crop production in the woreda at large in the region and to evaluate the effectiveness of adaptation measures implemented.
Author Contributions
Kafi Hassen, Kassaye Hussein, Ashenafi Yimam, and Abas Mahammed contributed equally to the manuscript. Kafi Hassen wrote the manuscript, while Kassaye Hussein assisted with supervision and data collection and analysis. Ashenafi Yimam supervised the project contributed to the literature review, and Abas Mahammed was responsible for performed the final editing and the perspectives and concluding remarks and designing the title, the figures and tables. All authors have read and approved the final manuscript.
Funding
No funding.
Data Availability Statement
Data can be get from Mr Kafi upon request when needed.
Acknowledgments
The authors declare no conflict of interest.
Conflicts of Interest
The authors declare no conflict of interest.
References
- Abawa, M.; Aynalem, M.; Fentahun, G.; Scholar, G. Impacts of climate change on crop yield in Ethiopia1653. 2023, v1. [Google Scholar]
- Abbas, S. Climate change and major crop production: evidence from Pakistan. In Fao 2020; 2021. [Google Scholar]
- Abdisa, T.B.; Diga, G.M.; Tolessa, A.R. Impact of climate variability on rain-fed maize and sorghum yield among smallholder farmers Impact of climate variability on rain-fed maize and sorghum yield among smallholder farmers. Cogent Food and Agriculture 2022, 8(1). [Google Scholar]
- Abdullahi Musa, S. impacts of climate variability on maize (zea mays l.) yield and farmers’adaptation strategies in kurfa chele district of east hararghe zone, oromia, ethiopia; Haramaya university, 2021. [Google Scholar]
- Abegaz, W.B. Temperature and Rainfall Trends in North Eastern Ethiopia. International Journal of Environmental Sciences and Natural Resources 2020, 25(3). [Google Scholar] [CrossRef]
- Omer, A.A. Climate Change Effects on Subsistence Agriculture: Constraints and Opportunities for Adaptation in Tuli-Guled Woreda, Faafen Zone of Somali Region Ethiopia 2018, 1–104.
- Alotaibi, M. Climate change, its impact on crop production, challenges, and possible solutions. Notulae Botanicae Horti Agrobotanici Cluj-Napoca 2023, 51(1), 13020. [Google Scholar] [CrossRef]
- Amin, A.; Salamon, T.; Bogale, A. climate variability and adaptation strategies by small holder agropastoralists in boke district, west hararghe zone, oromia regional state, eastern ethiopia. 2021. [Google Scholar]
- Debela, C.M.; Aweke, C.S.; Tefera, T.L. Farmers resilience to climate variability and perceptions towards adoption of climate smart agricultural practices: evidence from Kersa district, East Hararghe of Ethiopia. In Environment, Development and Sustainability; 2024; pp. 1–19. [Google Scholar]
- District, A.; Lalego, B.; Ayalew, T.; Kaske, D. Impact of climate variability and change on crop production and farmers ’ adaptation strategies in Lokka. 2019. [Google Scholar]
- Dhugomsa, J.A. impacts of climate variability on maize (Zea mays L.) yield and household adaptation strategies; the case of kersa district of east hararge zone, oromia regional state, ethiopia; Haramaya University, 2023. [Google Scholar]
- Emran, S.A. Achieving food security and sustainability in a changing climate: assessing the performance of smallholder rice-based cropping systems in southern Bangladesh; University of Illinois at Urbana-Champaign, 2021. [Google Scholar]
- Flaig, H. Effects of climate change on agriculture in Baden-Wurttemberg. WasserWirtschaft 2021, 111(6), 29–32. [Google Scholar] [CrossRef]
- Fuertes, M.Á.; Andrés, S.; Corrochano, D.; Delgado, L.; Herrero-Teijón, P.; Ballegeer, A.M.; Ferrari-Lagos, E.; Fernández, R.; Ruiz, C. Educación sobre el Cambio Climático: una propuesta de una herramienta basada en categorías para analizar la idoneidad de un currículum para alcanzar la competencia climática. Education in the Knowledge Society (EKS) 2020, 21(0), 13. [Google Scholar] [CrossRef]
- Mohamed, G. Assessment of changes in climate extremes of temperature over Ethiopia Assessment of changes in climate extremes of temperature over Ethiopia. Cogent Engineering 2023, 10(1). [Google Scholar]
- Gemeda, D.O.; Korecha, D.; Garedew, W. Climate Change Perception and Vulnerability Assessment of the Farming Communities in the Wettest Parts of Ethiopia. 2023. [Google Scholar] [CrossRef]
- Males, G. Farmer ’ s response to climate change and variability in Ethiopia: A review Farmer ’ s response to climate change and variability in Ethiopia: A review. Cogent Food and Agriculture 2019, 5(1). [Google Scholar]
- Fano, D.G. Climate Change Risk Management and Coping Strategies for Sustainable Camel Production in the Case of Somali Region, Ethiopia. 2020, 4, 66–75. [Google Scholar]
- Haokip, S.W.; Shankar, K.; Lalrinngheta, J. Climate change and its impact on fruit crops. 2020, 9(1), 435–438. [Google Scholar]
- Hussein, M.A.; Antille, D.L.; Kodur, S.; Chen, G.; Tullberg, J.N. Controlled traffic farming effects on productivity of grain sorghum, rainfall and fertiliser nitrogen use efficiency. Journal of Agriculture and Food Research 2021, 3, 100111. [Google Scholar] [CrossRef]
- Kassaye, A.Y.; Shao, G.; Wang, X.; Shifaw, E.; Wu, S. Impact of climate change on the staple food crops yield in Ethiopia: implications for food security. Theoretical and Applied Climatology 2021, 145(1–2), 327–343. [Google Scholar] [CrossRef]
- Ketema, A.M.; Negeso, K.D. Effect of climate change on agricultural output in Ethiopia. 2020, 8(3), 195–208. [Google Scholar]
- Klein, T.; Anderegg, W.R. Global warming and urban population growth in already warm regions drive a vast increase in heat exposure in the 21st century. Sustain. Cities Soc 2021a, 73, 103098. [Google Scholar] [CrossRef]
- Klein, T.; Anderegg, W.R.L. A vast increase in heat exposure in the 21st century is driven by global warming and urban population growth. Sustainable Cities and Society 2021b, 73, 103098. [Google Scholar] [CrossRef]
- Knox, J.; Daccache, A.; Hess, T.; Haro, D. Meta-analysis of climate impacts and uncertainty on crop yields in Europe. Environmental Research Letters 2016, 11(11), 113004. [Google Scholar] [CrossRef]
- Makuvaro, V.; Walker, S.; Phillip, T.; Dimes, J. Smallholder farmer perceived e ff ects of climate change on agricultural productivity and adaptation strategies. Journal of Arid Environments 2018. [Google Scholar] [CrossRef]
- Malhi, G.S.; Kaur, M.; Kaushik, P. Impact of Climate Change on Agriculture and Its Mitigation Strategies: A Review 2021, 1–21.
- Mandel, I.; Lipovetsky, S. Available at SSRN 3913788; Climate Change Report IPCC 2021–A Chimera of Science and Politics. 2021.
- Bewuketu minwuye, B. farmers’ perception and adaptation strategies to climate change: the case of woreillu district of amhara region, northeastern ethiopia. Thesis, 2017. [Google Scholar]
- Ochieng, J.; Kirimi, L.; Mathenge, M.; Ochieng, J.; Kirimi, L.; Mathenge, M. Effects of climate variability and change on agricultural production: The case of small scale farmers in Kenya The case of small scale farmers in Kenya. NJAS - Wageningen Journal of Life Sciences 2021, 77, 71–78. [Google Scholar] [CrossRef]
- Okoronkwo, D.J.; Ozioko, R.I.; Ugwoke, R.U.; Nwagbo, U.V.; Nwobodo, C.; Ugwu, C.H.; Okoro, G.G.; Mbah, E.C. Climate smart agriculture? Adaptation strategies of traditional agriculture to climate change in sub-Saharan Africa. Frontiers in Climate 2024, 6, 1272320. [Google Scholar] [CrossRef]
- Prakash, J.; Tek, A.; Ritika, B.S. Climate change and agriculture in South Asia: adaptation options in smallholder production systems. In Environment, Development and Sustainability; Springer Netherlands, 2020; Vol. 22, Issue 6. [Google Scholar]
- Praveen, B. A review of literature on climate change and its impacts on agriculture productivity; 2019; pp. 1–15. [Google Scholar]
- Priya, P.D. The Impact of Climate Change on Global Agriculture: Challenges and Adaptation Strategies. Siddhanta’s International Journal of Current Issues 2025, 1(1), 1–13. [Google Scholar]
- Singh, S.N. Climate Change and Agriculture in Ethiopia: A Case Study of Mettu Woreda. 2019, 3(3), 61–79. [Google Scholar] [CrossRef]
- Sinore, T.; Wang, F. Heliyon Impact of climate change on agriculture and adaptation strategies in Ethiopia: A meta-analysis. Heliyon 2024a, 10(4), e26103. [Google Scholar] [CrossRef]
- Sinore, T.; Wang, F. Impact of climate change on agriculture and adaptation strategies in Ethiopia: A meta-analysis. Heliyon 2024b, 10(4). [Google Scholar] [CrossRef]
- Tambol1, T.; Derbile, E.K.; Soulé, M. Use of Climate Smart Agricultural Technologies in dry-season peri-urban agriculture in West Africa Sahel: A case study from Saga, Niger 2024, 1–24.
- Teshome, H.; Tesfaye, K.; Dechassa, N.; Tana, T.; Huber, M. Smallholder farmers’ perceptions of climate change and adaptation practices for maize production in eastern Ethiopia. Sustainability (Switzerland) 2021, 13(17), 1–21. [Google Scholar] [CrossRef]
- Halen tessema, I. Smallholder Farmers ’ perception and adaptation to climate variability and change in Fincha sub-basin of the Upper Blue Nile River Basin of Ethiopia. GeoJournal 2021, 86(4), 1767–1783. [Google Scholar] [CrossRef]
- Zeratsion, B.T.; Manaye, A.; Gufi, Y.; Tesfaye, M.; Werku, A.; Anjulo, A. Agroforestry practices for climate change adaptation and livelihood resilience in drylands of Ethiopia. Forest Science and Technology 2024, 20(1), 47–57. [Google Scholar] [CrossRef]
- Zigale, T.T. climate change, pastoral livelihood vulnerability and adaptation strategies: a case study of sitti zone, somali regional state in eastern ethiopia university of south africa supervisor: dr. busani mpofu December 2021; December, 2021; pp. 1–290. [Google Scholar]
Disclaimer/Publisher’s Note: The statements, opinions and data contained in all publications are solely those of the individual author(s) and contributor(s) and not of MDPI and/or the editor(s). MDPI and/or the editor(s) disclaim responsibility for any injury to people or property resulting from any ideas, methods, instructions or products referred to in the content. |
© 2025 by the authors. Licensee MDPI, Basel, Switzerland. This article is an open access article distributed under the terms and conditions of the Creative Commons Attribution (CC BY) license.
Copyright: This open access article is published under a Creative Commons CC BY 4.0 license, which permit the free download, distribution, and reuse, provided that the author and preprint are cited in any reuse.


