Submitted:
22 December 2025
Posted:
24 December 2025
You are already at the latest version
Abstract
Nine activated carbons (ACs) with hierarchical micro- and mesoporous textural structures and varied chemical compositions were evaluated as metal-free electrocatalysts for the Oxygen Reduction Reaction (ORR) under alkaline conditions. The base material was a commercial biomass-based carbon chemically activated with H3PO4, which possesses a hierarchical micro- and mesoporous structure. This material was modified by: oxidative treatment with HNO3 to increase the content of acidic oxygenated functional groups (OFGs); and by heat treatment in an inert atmosphere up to 800 °C to remove most of the acidic OFGs. Furthermore, the original and modified ACs were subjected to ammonization up to 400 or 800 °C to incorporate nitrogen. The results showed that there exists a synergistic effect among at least three critical factors that enhance the ORR performance of the materials: a high specific surface area (SSA); a high electrical conductivity (achieved by means of a well-developed carbon basal plane structure); and the presence of functional groups containing heteroatoms, mainly aromatic nitrogens. Notably, the ACs exhibited high tolerance to methanol crossover. Finally, as a proof-of-concept, a selected AC was tested in a single-cell Direct Methanol Fuel Cell (DMFC), yielding excellent performance. The results demonstrate the high potential of N-doped ACs as electrocatalysts, inexpensive and versatile materials that can replace costly Pt-based electrodes.
Keywords:
ORR
; DMFC
; fuel cells
; electrocatalysts
; activated carbon
; surface chemistry
; N-doped carbons
; capacitance
1. Introduction
The oxygen reduction reaction (ORR) is a pivotal process in various electrochemical energy conversion and storage technologies, such as fuel cells and metal-air batteries [1,2,3]. However, the inherently slow kinetics and high overpotential of the reaction necessitate the use of electrocatalysts, with Pt-decorated carbons being the most efficient for this purpose. However, the scarcity and high cost of Pt limit its widespread application. Furthermore, low durability, susceptibility to poisoning (mainly by CO), and the fuel crossover effect are drawbacks of using Pt-based cathodes in ORR [4,5,6].
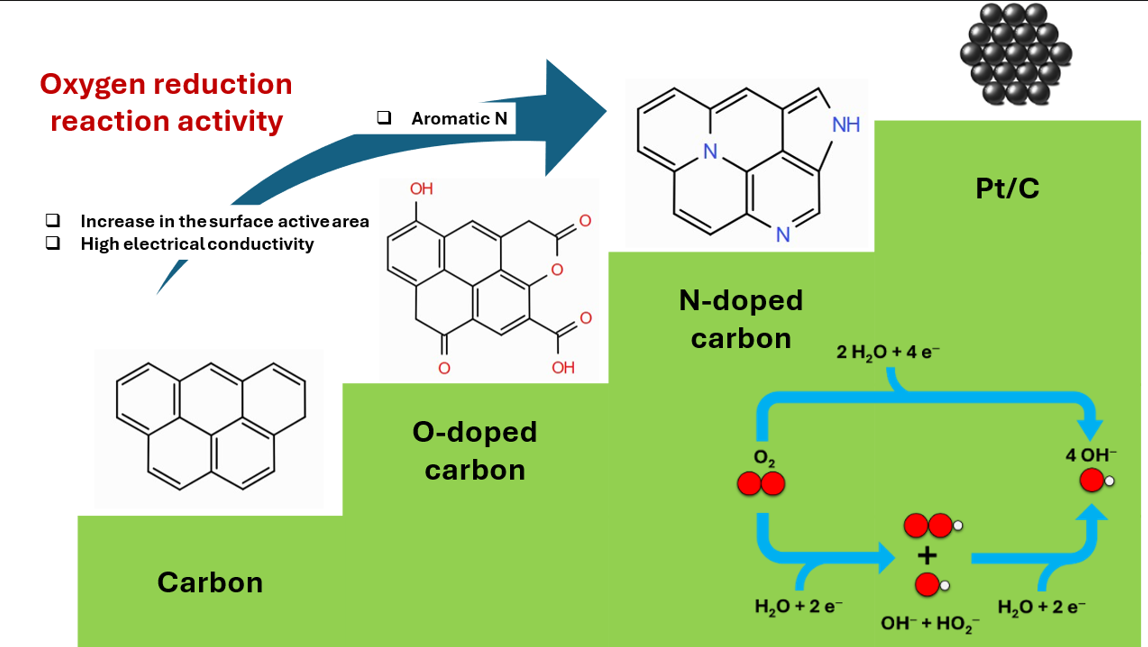
In this context, significant efforts have been devoted to the development of alternative ORR electrocatalysts, with particular attention to metal-free carbon-based materials [4,5,6,7]. Although pure carbon materials possess relatively low electrocatalytic activity due to their homogeneous charge distribution, the presence of surface functional groups and structural defects disturbs the charge density, creating active sites where O2 molecules can be adsorbed and subsequently reduced. Therefore, research has focused on the design and synthesis of functionalized carbon-based materials, with emphasis on O- [8,9] and N-containing [10,11] groups.
In this work, we evaluated the ORR performance of nine activated carbons (ACs). The base material was a granular AC obtained from dried coconut shell endocarp by chemical activation with H3PO4 [WV-A1050, supplied by MeadWestvaco (Richmond, Virginia, USA)]. This AC, labeled here as WV, was subjected to several treatments to produce the other eight samples, as outlined in the scheme presented in Figure 1. WV was selected as the starting material because it possesses a hierarchical micro- and mesoporous structure [12]; while micropores provide a high specific surface area (SSA), mesopores are essential in liquid-phase catalytic systems for mitigating diffusional restrictions of the solution toward the catalytic active sites [6,13,14,15]. Although a detailed chemical and textural characterization of WV and modified ACs has been previously reported [12], a summary is presented in Section 3.1 to support the electrochemical results better.
The ACs were subjected to a series of electrochemical tests to determine their geometric double-layer capacitance (Cdl), ORR electrochemical performance, and methanol tolerance as potential cathodic electrocatalysts. Efforts focused on establishing a direct link between electrocatalytic performance, material properties, and synthesis parameters, aiming to lay the foundation for the development of optimized materials. Ultimately, a selected material was implemented in a single-cell Direct Methanol Fuel Cell (DMFC) as a proof-of-concept to test its performance. The application of ACs, which can be easily synthesized from cheap and inexpensive biomass residues, could mark an important milestone in the development and application of DMFCs [16,17,18,19,20].
2. Materials and Methods
The treatments to which WV was subjected (complementary carbonization, nitrification, and ammonization) were previously described [12]. Cyclic voltammetry (CV) and linear sweep voltammetry (LSV) experiments were performed at room temperature using a Metrohm Autolab PGSTAT302N potentiostat/galvanostat (Metrohm Autolab B.V., Utrecht, The Netherlands). A typical three-electrode glass cell was used, comprising a reference electrode, Hg/HgO/KOH (1 mol L−1), a counter electrode of platinized platinum, and a working electrode prepared according to the following procedure. First, a catalytic ink was formulated by dispersing 4.0 mg of a finely divided AC powder in a solution containing 1.0 mL of isopropyl alcohol and 10 μL of Nafion emulsion (5 wt% in a mixture of aliphatic alcohols; IonPower, Tyrone, PA, USA). This ink was subsequently deposited on the polished surface of a glassy carbon disc (ϕ = 5 mm) embedded in a Teflon (PTFE) support. The set, fixed in a glass base, was then immersed in 20 mL of a 1 mol L−1 KOH solution (electrolyte).
CV curves were recorded from 0 to 1.2 V vs. the reversible hydrogen electrode (RHE) using the electrolyte saturated with N2 or O2, at different potential scan rates (20, 50, 75, 100, and 150 mV s−1 for N2; 50 mV s−1 for O2). Differential CV curves were obtained by subtracting the curves obtained using the N2-saturated electrolyte from those obtained using the O2-saturated electrolyte. Cdl was calculated from the slope of the curve obtained by plotting the anodic geometric current density at 1.0 V (for the CV curves recorded using the N2-saturated electrolyte) against the scan rate. The 1.0 V potential was chosen because the faradic processes associated with redox reactions are minimal around this potential [21,22]. Quasi-steady-state LSVs were performed by sweeping the WE from 1.1 to 0 V at 1 mV s−1. Methanol tolerance was assessed by injecting 81 μL of methanol (final concentration of 0.1 mol L−1) during the CV under an O2 atmosphere. The ORR onset potential (Eonset) was determined from the intersection of the two tangents drawn at the rising current and the background current for the first wave in the differential CV curve. The limiting geometric current density (JL) was determined as the peak value in the ORR hump.
Single-cell DMFC tests were carried out in a fuel cell test rig whose components and operating protocol are described elsewhere [23]. The prepared electrodes possessed an active area of 4 cm2. A standard anode was prepared using a commercial Pt1Ru1/C catalyst (metallic loading of 60 wt% on Vulcan XC-72R carbon black; Alfa Aesar, Lancashire, UK), with an amount corresponding to a total metal loading of 2 mg cm−2, to which the aforementioned Nafion emulsion (10 wt% of the catalyst weight) was incorporated to act as the adhesive of the catalytic layer. Subsequently, 0.5 mL of a mixture of isopropanol and water (2 vol.% alcohol) was added, and the mixture was homogenized using ultrasound. The obtained catalytic ink was applied by brush coating onto a Zoltek PX30 carbon cloth (Zoltek Toray Group, Bridgeton, MO, USA). For the cathode, a similar procedure was followed, using WVCN800 as electrocatalyst with an overall loading of 6 mg cm-2. Additionally, for comparison purposes, a conventional cathode, containing 1 mg cm−2 of commercial 20 wt% Pt on carbon Vulcan XC-72R (Premetek, Cherry Hill, NJ, USA), was prepared following the same preparation procedure described for the anode. Once the deposition was completed, the electrodes were cured in an oven for 12 h at 70 °C. The electrodes were sandwiched between KOH-doped polybenzimidazole membranes (former Danish Power Systems, current Blue World Technologies, Denmark) and impregnated for one week.
The polarization curves were recorded in the quasi-steady-state LSV mode, at a potential scan rate of 1 mV s−1 from the open circuit voltage (OCV) to a cell voltage of 0.2 V. The applied temperature was 70 °C, with the anode fed with a 1 mol L−1 methanol solution, and the cathode with neat O2, to compare the performance of WVCN800 and Pt/C as cathode catalysts, using the aforementioned potentiostat/galvanostat.
3. Results and Discussion
3.1. Activated Carbons
To assist in discussing the electrochemical results, the most relevant chemical and textural characteristics of the ACs used, reported in a previous work [12], are summarized in Table 1 and Table 2.
As shown in Table 1, the WV contained a considerable amount of oxygenated functional groups (OFGs), primarily carboxylic acids, carboxylic anhydrides, lactones, and phenols, and a moderately acidic PZC (4.7). The treatment of the WV with HNO3 (nitrification) enhanced the acidic OFGs content, besides inserting nitro groups (‒NO2). Consequently, the resulting material, WVAc, exhibited a much lower PZC, 1.8 [12].
In contrast, the complementary carbonization of the WV (heat treatment up to 800 °C under an inert atmosphere) led to the thermal decomposition of most of the existing acidic OFGs. Thus, the resulting material (WVC) presented a PZC close to neutral (6.2). It is worth noting that the treatment up to 800 °C promoted the development of the carbon basal-plane structure, leading to the enhanced material aromaticity, as evidenced by the sharp decrease in the H/C ratio from 0.41 (for WV) to 0.16 [12].
Ammonization treatments promoted nitrogen incorporation into the materials’ surface. The amount and type of nitrogen incorporated depended on the treatment temperature and the surface composition of the material used. Ammonization up to 400 °C led to the insertion of both aliphatic (amine, amide, and lactams) and aromatic (pyridinic, pyrrolic, and graphitic) nitrogen. A high content of OFGs in the original AC favored N insertion at relatively low temperatures; therefore, the highest N content, 7.8 wt% (XPS), was verified for the sample WVAcN400, obtained from the ammonization of the nitrified AC (WVAc) up to 400 °C. Conversely, when the ammonization temperature reached 800 °C, only aromatic nitrogen remained in the structure [12].
3.2. Capacitive Properties
Figure S1 collects the CV curves recorded at different potential scan rates using the N2-saturated electrolyte. Figure S2 displays corresponding curves of the cathodic geometric current density (J), measured at 1.0 V, as a function of the potential scan rate. The slopes of these curves were used to estimate Cdl, which is plotted in Figure 2.
The results show that the nitrified material (WVAc) presented a higher Cdl (8.1 mF cm−2) than the unmodified AC WV (5.7 mF cm−2). This behavior is supposedly related to the higher content of acidic OFGs on the surface of WVAc; more specifically, to the electron-withdrawing effect of these groups, which would stabilize the negative charge accumulated on the cathode surface.
Considering the results above and, as discussed in Subsection 3.1, the complementary carbonization of WV removed most of the existing acidic OFGs, one might expect WVC to exhibit a lower Cdl than WV. However, WVC presented a higher Cdl (12.8 mF cm−2) than WV and even WVAc. This behavior is attributed to the higher electrical conductivity of WVC, which is afforded by its greater aromaticity.
The highest Cdl values were observed for materials subjected to 800 °C (either during complementary carbonization or ammonization) and an ammonization step (whether at 400 or 800 °C). These were the cases for samples WVCN400, WVN800, WVAcN800, and WVCN800. Conversely, WVAcN400, the material that exhibited the highest surface N content (7.8%; Table 1) but was not subjected to a high-temperature treatment, presented a relatively low Cdl (similar to that of its non-ammonized counterpart material WVAc). In turn, WVC, which underwent complementary carbonization up to 800 °C but not an ammonization step, exhibited only an intermediate Cdl. All these results emphasize that, in terms of capacitance, there is a synergistic effect between a well-developed carbon basal plane structure (which provides high electrical conductivity) and a high content of nitrogen-containing functional groups.
3.3. ORR Activity
To analyze the activity of the ACs towards ORR, CV curves were also recorded with the electrolyte saturated with O2. They are compared with those obtained using the N2-saturated solution in Figure S3. Unlike the experiments with N2, in the presence of O2 a clear oxygen reduction hump was observed for all ACs at ~0.6–0.9 V vs RHE during the negative-going potential sweep. The differential curves (Figure 3) allowed the ORR response to be isolated from capacitive effects. To summarize the tendencies, Figure 4 displays the Eonset and JL values. Finally, LSV ORR curves were recorded using an O2-saturated electrolyte, allowing us to assess the actual performance of the ACs (Figure S4). The results related to the ORR studies are presented and discussed sequentially.
3.3.1. Unmodified AC WV
The differential CV curve of the unmodified AC WV (and most other AC samples) exhibited a two-wave profile (Figure 3a), consistent with reports by other authors for different materials [24,25,26]. According to Gabe et al. [26], this behavior is related to the fact that O2 reduction can proceed through two distinct mechanisms: the so-called four-electron (4e−) and two-electron (2e−) pathways [Equations (1) and (2), respectively].
O2 + 2H2O + 4e− → 4OH−
O2 + H2O + 2e− → HO2− + OH−
According to the authors, the high adsorption potential within the narrow micropores (resulting from the overlap of the adsorption potentials of neighboring walls) enables these reactions involving the reduction of O2 molecules to occur at relatively high potentials, giving rise to the first wave in the CV curve. Indeed, other authors [6,13,27,28,29,30,31,32] have also suggested that narrow micropores act as nanoreactors to promote ORR. According to them, in addition to the high adsorption potential, the hydrophobic character of the narrow micropores (which are too narrow to accommodate OFGs) also contributes to this phenomenon by favoring the withdrawal of O2 molecules from the electrolyte solution.
At this point, it is worth noting that, as discussed in Subsection 3.3.2, we have found evidence that O2 reduction reactions also occur on the surfaces of wider pores (not exclusively in narrow micropores), provided that appropriate active sites are present.
Concerning the second wave in the differential CV curves, which is much more irregular and observed only in some materials, the team of Gabe proposed that it is due to the reduction of the peroxide ions (HO2−) [Equation (3)] formed through the 2e− pathway presented in Equation (2).
HO2− + H2O + 2e− → 3OH−
Defining the molecular-level mechanisms involved or even identifying the most efficient active sites for ORR remains a challenging task. We believe that the most likely mechanism to explain the formation of *OOH and *OH intermediates, which has been extensively proposed by several authors [7,10,33,34,35], involves electron-rich active sites acting as Lewis bases to promote O2 adsorption, as depicted in Step 1 of Figure 5. Subsequently, the adsorbed oxygen would be protonated to yield the *OOH intermediate (Step 2). The reaction could then proceed via two different pathways: heterolytic cleavage of either the O—O bond or the nc—O bond in the *OOH intermediate, followed by the addition of two electrons. In the first case, the cleavage of the O—O bond would release a hydroxide ion, while the protonation of the remaining adsorbed oxygen would generate the intermediate *OH (Step 3a). In the sequence, the cleavage of the nc—O bond in the *OH intermediate, followed by the uptake of two additional electrons, would release another hydroxide ion and regenerate the catalyst (Step 4a). This set of steps would correspond to the 4e− pathway in Equation (1). In the second case, the direct cleavage of the nc—O bond in the *OOH intermediate would release a peroxide ion and simultaneously regenerate the catalyst (Step 3b). This route would correspond to the 2e− pathway in Equation (2). The pathway through which the reaction takes place would depend on the strength of the O—O bond in the *OOH intermediate, which, in turn, would depend on the catalytically active sites.
The low Eonset and JL for WV (0.788 V and 0.227 mA cm−2, respectively; Figure 4) show that this material has a relatively poor ORR activity.
3.3.2. Effects of Nitrification
The material obtained from the treatment of WV with HNO3 (WVAc) resulted in a higher JL (0.388 mA cm−2) than the unmodified AC WV (0.227 mA cm−2) (Figure 4b), despite the verified reductions of porosity and SSA (Table 2). We postulate that this behavior is explained by the fact that the OFGs inserted during nitrification can directly act as active sites for ORR, even though they are located within pores with dimensions larger than those of narrow micropores. This ability of the OFGs presumably results from the disturbance that they cause in the charge distribution, generating nucleophilic sites that, as illustrated in Figure 5, adsorb and reduce O2. This charge disturbance would be caused mainly by the resonant structures generated by OFGs, as illustrated in Figure S5.
Another change observed in the differential CV curve of WVAc, compared to WV, is that the cathodic current below around 0.40 V, attributed to the reduction of HO2− ions, increased more sharply. We believe that, as postulated by other authors [8,9,13,35,36], OFGs favor the formation of HO2− ions through the 2e− pathway [Equation (2)]. Furthermore, these same groups would also be able to promote the subsequent reduction of the produced HO2− ions [Equation (3)]. However, since the HO2− ion is not a Lewis acid, a reduction mechanism different from that presented in Figure 5 must be involved. Supposedly, at this time, the positive centers generated by the electron-withdrawing nature of the OFGs would serve as active sites, acting as electrophilic centers to adsorb and reduce HO2−.
3.3.3. Effects of Complementary Carbonization
The data in Figure 4 show that complementary carbonization produced a material (WVC) with a considerably higher onset potential (0.836 V) than the unmodified (WV; 0.788 V) and nitrified (WVAc; 0.790 V) ACs. In turn, JL was modestly higher for WVC (0.252 mA cm−2) than for WV (0.227 mA cm−2), but much lower than that of WVAc (0.388 mA cm−2). Finally, the increase in cathodic current below ~0.40 V was weaker for WVC than for WV or WVAc. These findings suggest that WVC has a limited number of catalytic sites, but the existing ones are more active for ORR. The limited number of active sites is likely related to the removal of OFGs that occurs during complementary carbonization (Subsection 3.1). As proposed in Subsection 3.3.2, OFGs would be one of the main responsible for the occurrence of a cathodic current at low potentials (below around 0.40 V, due to the HO2− reduction), besides contributing to the O2 reduction at higher potentials. On the other hand, the higher ORR activity of the remaining active sites is related to the higher aromaticity (Subsection 3.1) and, consequently, higher electrical conductivity of WVC.
3.3.4. Effects of Ammonization
The best way to analyze the effects of N-doping is to examine the series formed by the material after complementary carbonization (WVC) and by those obtained after WVC ammonization at 400 °C (WVCN400) or 800 °C (WVCN800). This is because WVC had already been heat-treated to 800 °C, so its subsequent ammonization did not cause significant changes in the carbon skeleton structure, textural properties, or OFGs content. Conversely, because WV and WVAc were not preheated to high temperatures, their ammonization (mainly up to 800 °C) causes pronounced changes in these properties due solely to thermal effects, thereby making it difficult to isolate the impact of N-doping.
After ammonization of WVC at 400 and 800 °C, the surface N content increased from 0.8 to 3.1 and 3.9 wt%, respectively (Table 1). Nevertheless, only the material ammonized up to 800 °C (WVCN800) exhibited improved ORR performance, with an increase in Eonset/JL from 0.836 V/0.252 mA cm−2 to 0.856 V/0.624 mA cm−2 compared to WVC (Figure 4). These results show that aromatic nitrogens are much more effective at acting as and/or creating active sites for ORR than aliphatic nitrogens (as reported in Subsection 3.1, ammonization up to 400 °C introduced considerable contents of both aliphatic and aromatic nitrogens, whereas primarily only aromatic nitrogens remained when ammonization reached 800 °C).
In the case of the ammonization of the unmodified AC WV up to 800 °C, the obtained material (WVN800) presented a substantially superior ORR performance than that verified for WVCN800, with Eonset and JL values of 0.862 V and 0.947 mA cm−2 (Figure 4), respectively. In principle, this result seems to be due to the higher surface N content of WVN800 (5.1 wt%) compared to WVCN800 (3.9 wt%) (Table 1).
However, it must be noted that WVAcN800, despite its relatively low surface N content (1.9 wt%), exhibited noticeable ORR performance, with Onset and JL values of 0.853 V and 1.14 mA cm−2, respectively (Figure 4). We believe that this remarkably high ORR activity, unexpected based solely on the content of aromatic surface nitrogen of WVAcN800, is related to the intense weight loss that occurred during the ammonization of WVAc up to 800 °C, 32.4% (Table 1). By comparison, the weight loss observed during the synthesis of WVN800 was only 10.8 wt%. This intense weight loss, attributed to the elevated surface content of acidic OFGs, enhanced the formation of structural defects that, as proposed by Jiang et al. [37] and Yan et al. [38], act as active sites for ORR. Given that structural defects act as small pores, WVAcN800 presented greater microporosity and SSA compared to their counterpart materials ammonized up to 800 °C using different initial materials: Vmic and SSA for WVAcN800/WVN800/WVCN800 were 0.50/0.42/0.46 cm3 g−1 and 1504/1247/1313 m2 g−1, respectively (Table 2).
The noticeable effect of aromatic Ns on ORR performance remains poorly understood. Wang et al. [34] reported that the current predominant view is that graphitic and pyridinic Ns are the most active in promoting electrocatalytic ORR. In the same work, the authors concluded that graphitic N is the most efficient form. Deng et al. [39] also attributed ORR activity mainly to pyridinic and graphitic Ns; but, in contrast, they concluded that pyridinic N possesses the highest activity. In turn, Dai et al. [5] proposed that pyridinic N increases the ORR onset potential, while graphitic N determines the limiting current density. Regarding pyrrolic N, some authors have highlighted its ability to promote H2O2 production [40,41,42,43].
The fact is that nitrogen, when inserted into an aromatic ring, pronouncedly alters the charge distribution. This effect is especially true for graphitic and pyrrolic Ns, because, in contrast to carbon, they contribute a pair of electrons to the π-system, causing the carbon atoms to acquire a negative charge, whereas the nitrogen atom becomes positive. In turn, pyridinic N contributes only one electron to the π-system. However, pyridinic N has a pair of dangling electrons, which could act as a basic Lewis site to promote O2 reduction.
3.3.5. Final Considerations about ORR Performance
The reported results reveal a synergistic effect among at least three critical factors that boost the ORR performance of metal-free carbon-based electrocatalysts: high SSA, high electrical conductivity, and the presence of functional groups containing heteroatoms. The positive effect of high SSA is obvious, as electrocatalysis is a surface phenomenon. In this sense, we have shown that the presence of defects increases SSA, as they act as small pores that adsorb and reduce O2. High electrical conductivity is required to provide sufficient electron flux to the active sites where ORR occurs. High electrical conductivity is associated with a well-developed structure of aromatic carbon basal planes, achieved by thermal treatment at relatively high temperatures (on the order of 800 °C). However, a high SSA and high electrical conductivity alone are not enough to provide a high rate of electron transfer to oxygen. For that, the presence of functional groups with heteroatoms on the electrode surface is highly beneficial, as they alter the charge density within the carbon-based material, creating active sites where O2 molecules can be adsorbed and reduced. OFGs can act as these active sites; however, N-containing aromatic rings are by far more efficient for this purpose. These rings are formed by ammonization, primarily when conducted up to relatively high temperatures, such as 800 °C.
In this context, the best electrocatalysts for ORR were obtained after ammonizing up to 800 °C, with the resulting materials yielding Eonset and JL values in the ranges 0.853–0.862 V and 0.624–1.14 mA cm−2, respectively. It is challenging to compare these results with those reported in the literature due to differences in equipment and testing procedures, as well as in the methodologies used to determine Eonset and JL (particularly JL). Nevertheless, Table 3 presents some values of Eonset collected from the literature for various N-doped metal-free carbon-based materials. Overall, the results obtained in our work (Entry 1) are nearly identical to those reported to ACs by other authors (Entries 2–4). However, it is crucial to stress that the latter correspond to original materials attained through chemical activation of fossil precursors with KOH. While this methodology is acknowledged to yield materials with very high SSA, it is not suitable at all from an environmental and industrial perspective [44]. Conversely, our results concern the use of a commercial AC prepared from a biomass residue via a cheaper, softer, and environmentally friendlier activation methodology (chemical activation with H3PO4). It is worth noting that the results obtained in our work were similar to, or even superior to, those reported for highly specialized and expensive materials such as graphene (Entries 7 and 8) and carbon nanotubes (Entries 9 and 10).
Despite the high performance verified for the metal-free N-doped ACs in the present work, Eonset and JL were still lower than those verified using the Pt/C reference material, for which values of 0.964 V and 1.525 mA cm−2 were determined (the differential CV curve for the Pt/C is presented in Figure S6). However, unlike Pt-based electrocatalysts, the metal-free carbon-based materials prepared in the present work exhibited a high methanol tolerance, which is very important for application in DMFC. These issues will be addressed in Section 3.4 and Section 3.5, where a selected AC prepared in the present work (WVAcN800) is compared with the Pt/C electrocatalyst with respect to methanol tolerance and DMFC testing, respectively.
3.4. Methanol Tolerance
One challenge that any potential ORR electrocatalyst may face is methanol crossover, which leads to a mixed cell voltage due to cathodic depolarization [51]. To compare the effect of methanol addition on electrochemical performance, Figure 6 shows the corresponding CV in the absence and presence of 0.1 mol L−1 methanol for WVAcN800 and the Pt/C material. The results show that the current response for WVAcN800 was similar regardless of whether methanol was introduced into the testing cell or not, demonstrating the high catalytic selectivity of these electrocatalysts for ORR over methanol oxidation. In contrast, an intense anodic current below ~0.85V was observed when methanol was added to the testing cell with the Pt/C electrode, reflecting its sensitivity to methanol crossover. These results suggest this material as an excellent candidate for use as a cathode in a DMFC, with the intention of developing an active, methanol-tolerant electrocatalyst.
3.5. Single-Cell DMFC Test
To complete this study, Figure 7 shows the fuel cell polarization and power density curves for the AC WVAcN800 compared with those of the Pt/C reference material in a DMFC proof-of-concept. The presented results are the average of five polarization curves, recorded at 70 °C. Notably, the open-circuit voltage, directly affected by methanol crossover [52], is higher with WVAcN800 (0.922 V) at the cathode than with Pt/C (0.695 V). This result confirms the excellent electrocatalytic properties of this material for use as a cathode electrocatalyst. In terms of cell performance, Pt/C outperforms WVAcN800 due to its higher intrinsic electrocatalytic activity as an ORR catalyst, which is considered the benchmark for this reaction [53]. These differences are reflected in the rapid current-onset of the Pt/C compared to WVAcN800, as the latter requires a higher overpotential (a steep drop in cell voltage at low current densities) to significantly increase the geometric current density (at a cell voltage of 0.5 V, the geometric current density was 0.137 mA cm−2 for Pt/C, and 0.069 mA cm−2 for WVAcN800), resulting in maximum power densities of 0.094 W cm−2 for Pt/C, and 0.083 W cm−2 for WVAcN800.
4. Conclusions
This work studied nine activated carbons (ACs) with hierarchical micro- and mesoporous structures and different surface chemical compositions as electrocatalysts for the oxygen reduction reaction (ORR) under alkaline conditions. The results showed a synergistic effect among at least three critical factors that enhance ORR performance: a high specific surface area (SSA); a high electrical conductivity (achieved by a well-developed carbon basal plane structure); and the presence of functional groups containing heteroatoms, mainly aromatic nitrogens.
In this sense, the best electrocatalysts for ORR were obtained by ammonizing up to 800 °C. The resulting materials exhibited relatively high onset potentials (Eonset) and limiting geometric current densities (jL), but remained lower than those observed with a Pt/C reference electrocatalyst. However, unlike Pt-based electrocatalysts, the metal-free ACs prepared in the present work exhibited high methanol tolerance, which is very important for applications in Direct Methanol Fuel Cells (DMFCs). Indeed, a selected material prepared in the present work (WVAcN800) was tested as a proof-of-concept in a DMFC. Despite yielding a lower power density, WVAcN800 showed a higher open-circuit voltage (OCV) at the cathode (0.922 V) than the reference Pt/C electrocatalyst (0.695 V), which is directly attributed to the lower methanol crossover in our material.
The results obtained are promising and indicate that there is room for improvement in the performance of N-doped metal-free ACs to match that of Pt/C, which remains the current state-of-the-art benchmark. It is worth noting that our alternative materials are prepared from inexpensive, abundant raw materials (biomass residues) using simple, easily reproducible methods. Indeed, the most likely limitation of using Pt/C and similar Pt-group metals is their scarcity and high market prices, limitations that could be overcome by using materials such as those proposed in this study.
Supplementary Materials
The following supporting information can be downloaded at the website of this paper posted on Preprints.org. Figures S1–S6 and pertinent discussion. Further inquiries can be directed to the corresponding authors.
Author Contributions
Conceptualization and methodology, M.J.P., J.J.L., and E.R.-C.; funding acquisition, M.J.P., J.J.L., and E.R.-C.; supervision, M.J.P.; resources, M.J.P., J.J.L., P.A.Z.S., and E.R.-C.,; formal analysis, S.d.C.O., M.J.P., J.J.L., P.A.Z.S., D.B.-P., and E.R.-C.; investigation, S.d.C.O., C.M.C.d.C., E.C.G.A., M.S.T., and D.B.-P.; writing—original draft preparation, M.J.P., J.L.L.; writing—review and editing, S.d.C.O. All authors have read and agreed to the published version of the manuscript.
Funding
D.B.-P and E.R.-C. thank the Spanish Ministry of Science and Innovation, project PID2021-126235OB-C32 funded by MCIN/ AEI/10.13039/501100011033/ and FEDER funds, and the financial support of UNICAJA and Erasmus+ for H2EXCELLENCE. All authors thank CAPES (Brazilian Federal Agency for Support and Evaluation of Graduate Education, Brazil; Finance Code 001) for the financial support for this research.
Conflicts of Interest
The authors declare no conflicts of interest.
Abbreviations
The following abbreviations are used in this manuscript:
| AC | Activated carbon |
| CV | Cyclic voltammetry |
| DMFC | Direct Methanol Fuel Cell |
| EA | Elemental analyses |
| Cdl | Geometric double-layer capacitance |
| LSV | Linear sweep voltammetry |
| OFG | Oxygenated functional group |
| Eonset | Onset potential |
| OCV | open circuit voltage |
| ORR | Oxygen reduction reaction |
| PZC | Point of zero charge |
| RHE | Reversible hydrogen electrode |
| SSA | Specific surface area |
| Vmic | Micropores volume |
| Vmes | Mesopores volume |
| XPS | X-ray photoelectron spectroscopy |
References
- Ge, X.; Sumboja, A.; Wuu, D.; An, T.; Li, B.; Goh, F.W.T.; Hor, T.S.A.; Zong, Y.; Liu, Z. Oxygen Reduction in Alkaline Media: From Mechanisms to Recent Advances of Catalysts. ACS Catal. 2015, 5, 4643–4667. [Google Scholar] [CrossRef]
- Li, S.; Shi, L.; Guo, Y.; Wang, J.; Liu, D.; Zhao, S. Selective Oxygen Reduction Reaction: Mechanism Understanding, Catalyst Design and Practical Application. Chem. Sci. 2024, 15, 11188–11228. [Google Scholar] [CrossRef] [PubMed]
- Kulkarni, A.; Siahrostami, S.; Patel, A.; Nørskov, J.K. Understanding Catalytic Activity Trends in the Oxygen Reduction Reaction. Chem. Rev. 2018, 118, 2302–2312. [Google Scholar] [CrossRef] [PubMed]
- Liu, S.; Wang, A.; Liu, Y.; Zhou, W.; Wen, H.; Zhang, H.; Sun, K.; Li, S.; Zhou, J.; Wang, Y.; et al. Catalytically Active Carbon for Oxygen Reduction Reaction in Energy Conversion: Recent Advances and Future Perspectives. Advanced Science 2024, 11, 2308040. [Google Scholar] [CrossRef]
- Dai, L.; Xue, Y.; Qu, L.; Choi, H.-J.; Baek, J.-B. Metal-Free Catalysts for Oxygen Reduction Reaction. Chem. Rev. 2015, 115, 4823–4892. [Google Scholar] [CrossRef]
- Florent, M.; Wallace, R.; Bandosz, T.J. Oxygen Electroreduction on Nanoporous Carbons: Textural Features vs Nitrogen and Boron Catalytic Centers. ChemCatChem 2019, 11, 851–860. [Google Scholar] [CrossRef]
- Ma, R.; Lin, G.; Zhou, Y.; Liu, Q.; Zhang, T.; Shan, G.; Yang, M.; Wang, J. A Review of Oxygen Reduction Mechanisms for Metal-Free Carbon-Based Electrocatalysts. npj Comput Mater 2019, 5, 78. [Google Scholar] [CrossRef]
- Fang, W.; Wang, L.; Shen, D.; Meng, X.; Bai, H.; Li, C. Oxygen-Containing Functional Groups Cooperate to Boost Electrochemical ORR Selectivity to H2O2. Inorg. Chem. Front. 2025, 12, 7695–7705. [Google Scholar] [CrossRef]
- Zhao, G.; Chen, T.; Tang, A.; Yang, H. Roles of Oxygen-Containing Functional Groups in Carbon for Electrocatalytic Two-Electron Oxygen Reduction Reaction. Chemistry A European J 2024, 30, e202304065. [Google Scholar] [CrossRef]
- Wu, B.; Meng, H.; Morales, D.M.; Zeng, F.; Zhu, J.; Wang, B.; Risch, M.; Xu, Z.J.; Petit, T. Nitrogen-Rich Carbonaceous Materials for Advanced Oxygen Electrocatalysis: Synthesis, Characterization, and Activity of Nitrogen Sites. Adv Funct Materials 2022, 32, 2204137. [Google Scholar] [CrossRef]
- Al-Hajri, W.; De Luna, Y.; Bensalah, N. Review on Recent Applications of Nitrogen-Doped Carbon Materials in CO2 Capture and Energy Conversion and Storage. Energy Tech 2022, 10, 2200498. [Google Scholar] [CrossRef]
- Oliveira, S.D.C.; Dutra, R.C.; León, J.J.L.; Martins, G.A.V.; Silva, A.M.A.; Azevedo, D.C.S.D.; Santiago, R.G.; Ballesteros-Plata, D.; Rodríguez-Castellón, E.; Prauchner, M.J. Activated Carbon Ammonization: Effects of the Chemical Composition of the Starting Material and the Treatment Temperature. C 2025, 11, 15–40. [Google Scholar] [CrossRef]
- De Falco, G.; Florent, M.; Jagiello, J.; Cheng, Y.; Daemen, L.L.; Ramirez-Cuesta, A.J.; Bandosz, T.J. Alternative View of Oxygen Reduction on Porous Carbon Electrocatalysts: The Substance of Complex Oxygen-Surface Interactions. iScience 2021, 24, 102216. [Google Scholar] [CrossRef] [PubMed]
- Brandão, R.D.; De Freitas Júnior, A.M.; Linares, J.J.; Suarez, P.A.Z.; Dutra, R.C.; Garnier, J.; Tonhá, M.S.; Ballesteros-Plata, D.; Rodríguez-Castellón, E.; Prauchner, M.J. Activated Carbon-Supported Pt Catalysts Intended for the Hydroprocessing of Lipid Feedstocks: Effects of Support Surface Composition and Impregnation Protocol. Molecules 2025, 30, 2862. [Google Scholar] [CrossRef] [PubMed]
- De Freitas Júnior, A.M.; Brandão, R.D.; Garnier, J.; Tonhá, M.S.; Mussel, W.D.N.; Ballesteros-Plata, D.; Rodríguez-Castellón, E.; Prauchner, M.J. Activated Carbons as Supports for Sulfided Mo-Based Catalysts Intended for the Hydroprocessing of Lipidic Feedstocks. Catalysts 2025, 15, 359. [Google Scholar] [CrossRef]
- Hou, C.; Zhang, X.; Yuan, W.; Zhang, Y.; Deng, H.; Liu, X. A Facile Synthesis for Nitrogen-doped Carbon Catalyst with High Activity of Oxygen Reduction Reaction in Acidic Media. Int J Energy Res 2021, 45, 19574–19585. [Google Scholar] [CrossRef]
- Farzaneh, A.; Goharshadi, E.K.; Gharibi, H.; Saghatoleslami, N.; Ahmadzadeh, H. Insights on the Superior Performance of Nanostructured Nitrogen-Doped Reduced Graphene Oxide in Comparison with Commercial Pt/C as Cathode Electrocatalyst Layer of Passive Direct Methanol Fuel Cell. Electrochimica Acta 2019, 306, 220–228. [Google Scholar] [CrossRef]
- Wan, K.; Long, G.-F.; Liu, M.-Y.; Du, L.; Liang, Z.-X.; Tsiakaras, P. Nitrogen-Doped Ordered Mesoporous Carbon: Synthesis and Active Sites for Electrocatalysis of Oxygen Reduction Reaction. Applied Catalysis B: Environmental 2015, 165, 566–571. [Google Scholar] [CrossRef]
- Kanninen, P.; Borghei, M.; Sorsa, O.; Pohjalainen, E.; Kauppinen, E.I.; Ruiz, V.; Kallio, T. Highly Efficient Cathode Catalyst Layer Based on Nitrogen-Doped Carbon Nanotubes for the Alkaline Direct Methanol Fuel Cell. Applied Catalysis B: Environmental 2014, 156–157, 341–349. [Google Scholar] [CrossRef]
- Kruusenberg, I.; Ratso, S.; Vikkisk, M.; Kanninen, P.; Kallio, T.; Kannan, A.M.; Tammeveski, K. Highly Active Nitrogen-Doped Nanocarbon Electrocatalysts for Alkaline Direct Methanol Fuel Cell. Journal of Power Sources 2015, 281, 94–102. [Google Scholar] [CrossRef]
- Mirzaeian, M.; Abbas, Q.; Hunt, Michael.R.C.; Hall, P. Pseudocapacitive Effect of Carbons Doped with Different Functional Groups as Electrode Materials for Electrochemical Capacitors. Energies 2020, 13, 5577. [Google Scholar] [CrossRef]
- Morales, D.M.; Risch, M. Seven Steps to Reliable Cyclic Voltammetry Measurements for the Determination of Double Layer Capacitance. J. Phys. Energy 2021, 3, 034013. [Google Scholar] [CrossRef]
- Nascimento, A.P.; Linares, J.J. Performance of a Direct Glycerol Fuel Cell Using KOH Doped Polybenzimidazole as Electrolyte. Journal of the Brazilian Chemical Society 2014. [Google Scholar] [CrossRef]
- Lenne, Q.; Mattiuzzi, A.; Jabin, I.; Le Poul, N.; Leroux, Y.R.; Lagrost, C. Functionalizing Gold Nanoparticles with Calix [4]Arenes Monolayers for Enhancing Selectivity and Stability in ORR Electrocatalysis. Adv Materials Inter 2020, 7, 2001557. [Google Scholar] [CrossRef]
- Vaik, K. Electrochemical Reduction of Oxygen on Anodically Pre-Treated and Chemically Grafted Glassy Carbon Electrodes in Alkaline Solutions. Electrochemistry Communications 2004, 6, 1–5. [Google Scholar] [CrossRef]
- Gabe, A.; Ruiz-Rosas, R.; González-Gaitán, C.; Morallón, E.; Cazorla-Amorós, D. Modeling of Oxygen Reduction Reaction in Porous Carbon Materials in Alkaline Medium. Effect of Microporosity. Journal of Power Sources 2019, 412, 451–464. [Google Scholar] [CrossRef]
- Florent, M.; Hashmi, R.; Bandosz, T.J. The Extent of Carbon Surface Oxygen Affinity and Its Effects on the Activity of Metal-Free Carbon Catalysts in the Oxygen Reduction Reaction: The Interplay of Porosity and N-, O- and S-Enriched Surface Chemistry. Mater. Adv. 2022, 3, 8567–8578. [Google Scholar] [CrossRef]
- Liu, Y.; Li, K.; Ge, B.; Pu, L.; Liu, Z. Influence of Micropore and Mesoporous in Activated Carbon Air-Cathode Catalysts on Oxygen Reduction Reaction in Microbial Fuel Cells. Electrochimica Acta 2016, 214, 110–118. [Google Scholar] [CrossRef]
- Seredych, M.; Szczurek, A.; Fierro, V.; Celzard, A.; Bandosz, T.J. Electrochemical Reduction of Oxygen on Hydrophobic Ultramicroporous PolyHIPE Carbon. ACS Catal. 2016, 6, 5618–5628. [Google Scholar] [CrossRef]
- Encalada, J.; Savaram, K.; Travlou, N.A.; Li, W.; Li, Q.; Delgado-Sánchez, C.; Fierro, V.; Celzard, A.; He, H.; Bandosz, T.J. Combined Effect of Porosity and Surface Chemistry on the Electrochemical Reduction of Oxygen on Cellular Vitreous Carbon Foam Catalyst. ACS Catal. 2017, 7, 7466–7478. [Google Scholar] [CrossRef]
- Barrera, D.; Florent, M.; Kulko, M.; Bandosz, T.J. Ultramicropore-Influenced Mechanism of Oxygen Electroreduction on Metal-Free Carbon Catalysts. J. Mater. Chem. A 2019, 7, 27110–27123. [Google Scholar] [CrossRef]
- Barrera, D.; Florent, M.; Sapag, K.; Bandosz, T.J. Insight into the Mechanism of Oxygen Reduction Reaction on Micro/Mesoporous Carbons: Ultramicropores versus Nitrogen-Containing Catalytic Centers in Ordered Pore Structure. ACS Appl. Energy Mater. 2019, 2, 7412–7424. [Google Scholar] [CrossRef]
- Guo, D.; Shibuya, R.; Akiba, C.; Saji, S.; Kondo, T.; Nakamura, J. Active Sites of Nitrogen-Doped Carbon Materials for Oxygen Reduction Reaction Clarified Using Model Catalysts. Science 2016, 351, 361–365. [Google Scholar] [CrossRef] [PubMed]
- Wang, D.; Hu, J.; Wei, J.; Liu, X.; Hou, H. Insights into Nitrogen-doped Carbon for Oxygen Reduction: The Role of Graphitic and Pyridinic Nitrogen Species. ChemPhysChem 2023, 24, e202200734. [Google Scholar] [CrossRef]
- Mazzucato, M.; Durante, C. Insights on Oxygen Reduction Reaction to H2O2: The Role of Functional Groups and Textural Properties on the Activity and Selectivity of Doped Carbon Electrocatalysts. Current Opinion in Electrochemistry 2022, 35, 101051. [Google Scholar] [CrossRef]
- Fortunato, G.V.; Kronka, M.S.; Cardoso, E.S.F.; Dos Santos, A.J.; Roveda, A.C.; Lima, F.H.B.; Ledendecker, M.; Maia, G.; Lanza, M.R.V. A Comprehensive Comparison of Oxygen and Nitrogen Functionalities in Carbon and Their Implications for the Oxygen Reduction Reaction. Journal of Catalysis 2022, 413, 1034–1047. [Google Scholar] [CrossRef]
- Jiang, Y.; Yang, L.; Sun, T.; Zhao, J.; Lyu, Z.; Zhuo, O.; Wang, X.; Wu, Q.; Ma, J.; Hu, Z. Significant Contribution of Intrinsic Carbon Defects to Oxygen Reduction Activity. ACS Catal. 2015, 5, 6707–6712. [Google Scholar] [CrossRef]
- Yan, X.; Jia, Y.; Yao, X. Defects on Carbons for Electrocatalytic Oxygen Reduction. Chem. Soc. Rev. 2018, 47, 7628–7658. [Google Scholar] [CrossRef]
- Deng, H.; Li, Q.; Liu, J.; Wang, F. Active Sites for Oxygen Reduction Reaction on Nitrogen-Doped Carbon Nanotubes Derived from Polyaniline. Carbon 2017, 112, 219–229. [Google Scholar] [CrossRef]
- Peng, W.; Liu, J.; Liu, X.; Wang, L.; Yin, L.; Tan, H.; Hou, F.; Liang, J. Facilitating Two-Electron Oxygen Reduction with Pyrrolic Nitrogen Sites for Electrochemical Hydrogen Peroxide Production. Nat Commun 2023, 14, 4430. [Google Scholar] [CrossRef]
- Li, L.; Tang, C.; Zheng, Y.; Xia, B.; Zhou, X.; Xu, H.; Qiao, S. Tailoring Selectivity of Electrochemical Hydrogen Peroxide Generation by Tunable Pyrrolic-Nitrogen-Carbon. Advanced Energy Materials 2020, 10, 2000789. [Google Scholar] [CrossRef]
- Shi, Y.; Jiao, M.; Wang, C.; Zhang, L.-L.; Sun, S. Ultrahigh Pyrrolic Nitrogen Triggers High-Activity Sites in Carbon Catalysts for Selective Oxygen Reduction to Efficient H2O2 Production. Carbon 2025, 242, 120450. [Google Scholar] [CrossRef]
- Zhang, Y.; Pang, Y.; Xia, D.; Chai, G. Regulable Pyrrolic-N-Doped Carbon Materials as an Efficient Electrocatalyst for Selective O2 Reduction to H2 O2. New J. Chem. 2022, 46, 14510–14516. [Google Scholar] [CrossRef]
- Prauchner, M.J.; Oliveira, S.D.C.; Rodríguez-Reinoso, F. Tailoring Low-Cost Granular Activated Carbons Intended for CO2 Adsorption. Front. Chem. 2020, 8, 581133. [Google Scholar] [CrossRef]
- Mostazo-López, M.J.; Salinas-Torres, D.; Ruiz-Rosas, R.; Morallón, E.; Cazorla-Amorós, D. Nitrogen-Doped Superporous Activated Carbons as Electrocatalysts for the Oxygen Reduction Reaction. Materials 2019, 12, 1346. [Google Scholar] [CrossRef]
- Quílez-Bermejo, J.; Pérez-Rodríguez, S.; Torres, D.; Canevesi, R.; Morallón, E.; Cazorla-Amorós, D.; Celzard, A.; Fierro, V. Nitrogen Sites Prevail over Textural Properties in N-Doped Carbons for the Oxygen Reduction Reaction. Journal of Colloid and Interface Science 2024, 654, 446–453. [Google Scholar] [CrossRef]
- Lima, R.A.C.; Pinto Júnior, A.J.C.; Pocrifka, L.A.; Passos, R.R. Investigation of Nitrogen-Doping Influence on the Electrocatalytic Activity of Graphene in Alkaline Oxygen Reduction Reaction. Mat. Res. 2021, 24, e20200375. [Google Scholar] [CrossRef]
- Ruiz-Marizcal, J.M.; Paez-Ornelas, J.I.; Fernández-Escamilla, H.N.; Murillo-Bracamontes, E.A.; Alonso-Núñez, G.; Perez-Tijerina, E.G.; Takeuchi, N.; Romo-Herrera, J.M. From Graphene Oxide to N-Doped Graphene: Understanding the Doping Process. Adv Energy and Sustain Res 2025, 6, 2400310. [Google Scholar] [CrossRef]
- Béjar, J.; Espinosa‒Magaña, F.; Avelar, J.; Aguilar‒Elguezabal, A.; Guerra‒Balcázar, M.; Arjona, N.; Álvarez‒Contreras, L. Rational Design of Nitrogen‒doped Carbon Nanotubes by Defect Engineering for Zn‒air Batteries with High Performance. Carbon 2023, 204, 411–426. [Google Scholar] [CrossRef]
- Nabais, J.M.V.; Mouquinho, A.; Galacho, C.; Carrott, P.J.M.; Ribeiro Carrott, M.M.L. In Vitro Adsorption Study of Fluoxetine in Activated Carbons and Activated Carbon Fibres. Fuel Processing Technology 2008, 89, 549–555. [Google Scholar] [CrossRef]
- Tamaki, T.; Yamauchi, A.; Ito, T.; Ohashi, H.; Yamaguchi, T. The Effect of Methanol Crossover on the Cathode Overpotential of DMFCs. Fuel Cells 2011, 11, 394–403. [Google Scholar] [CrossRef]
- Li, X.; Miao, Z.; Marten, L.; Blankenau, I. Experimental Measurements of Fuel and Water Crossover in an Active DMFC. International Journal of Hydrogen Energy 2021, 46, 4437–4446. [Google Scholar] [CrossRef]
- Hu, Y.; Jensen, J.O.; Bretzler, P.; Cleemann, L.N.; Yu, J.; Li, Q. Revealing the Genuine Stability of the Reference Pt/C Electrocatalyst toward the ORR. Electrochimica Acta 2021, 391, 138963. [Google Scholar] [CrossRef]
Figure 1.
Scheme illustrating the treatments applied to WV and the corresponding labels assigned to the resulting materials [12].
Figure 1.
Scheme illustrating the treatments applied to WV and the corresponding labels assigned to the resulting materials [12].
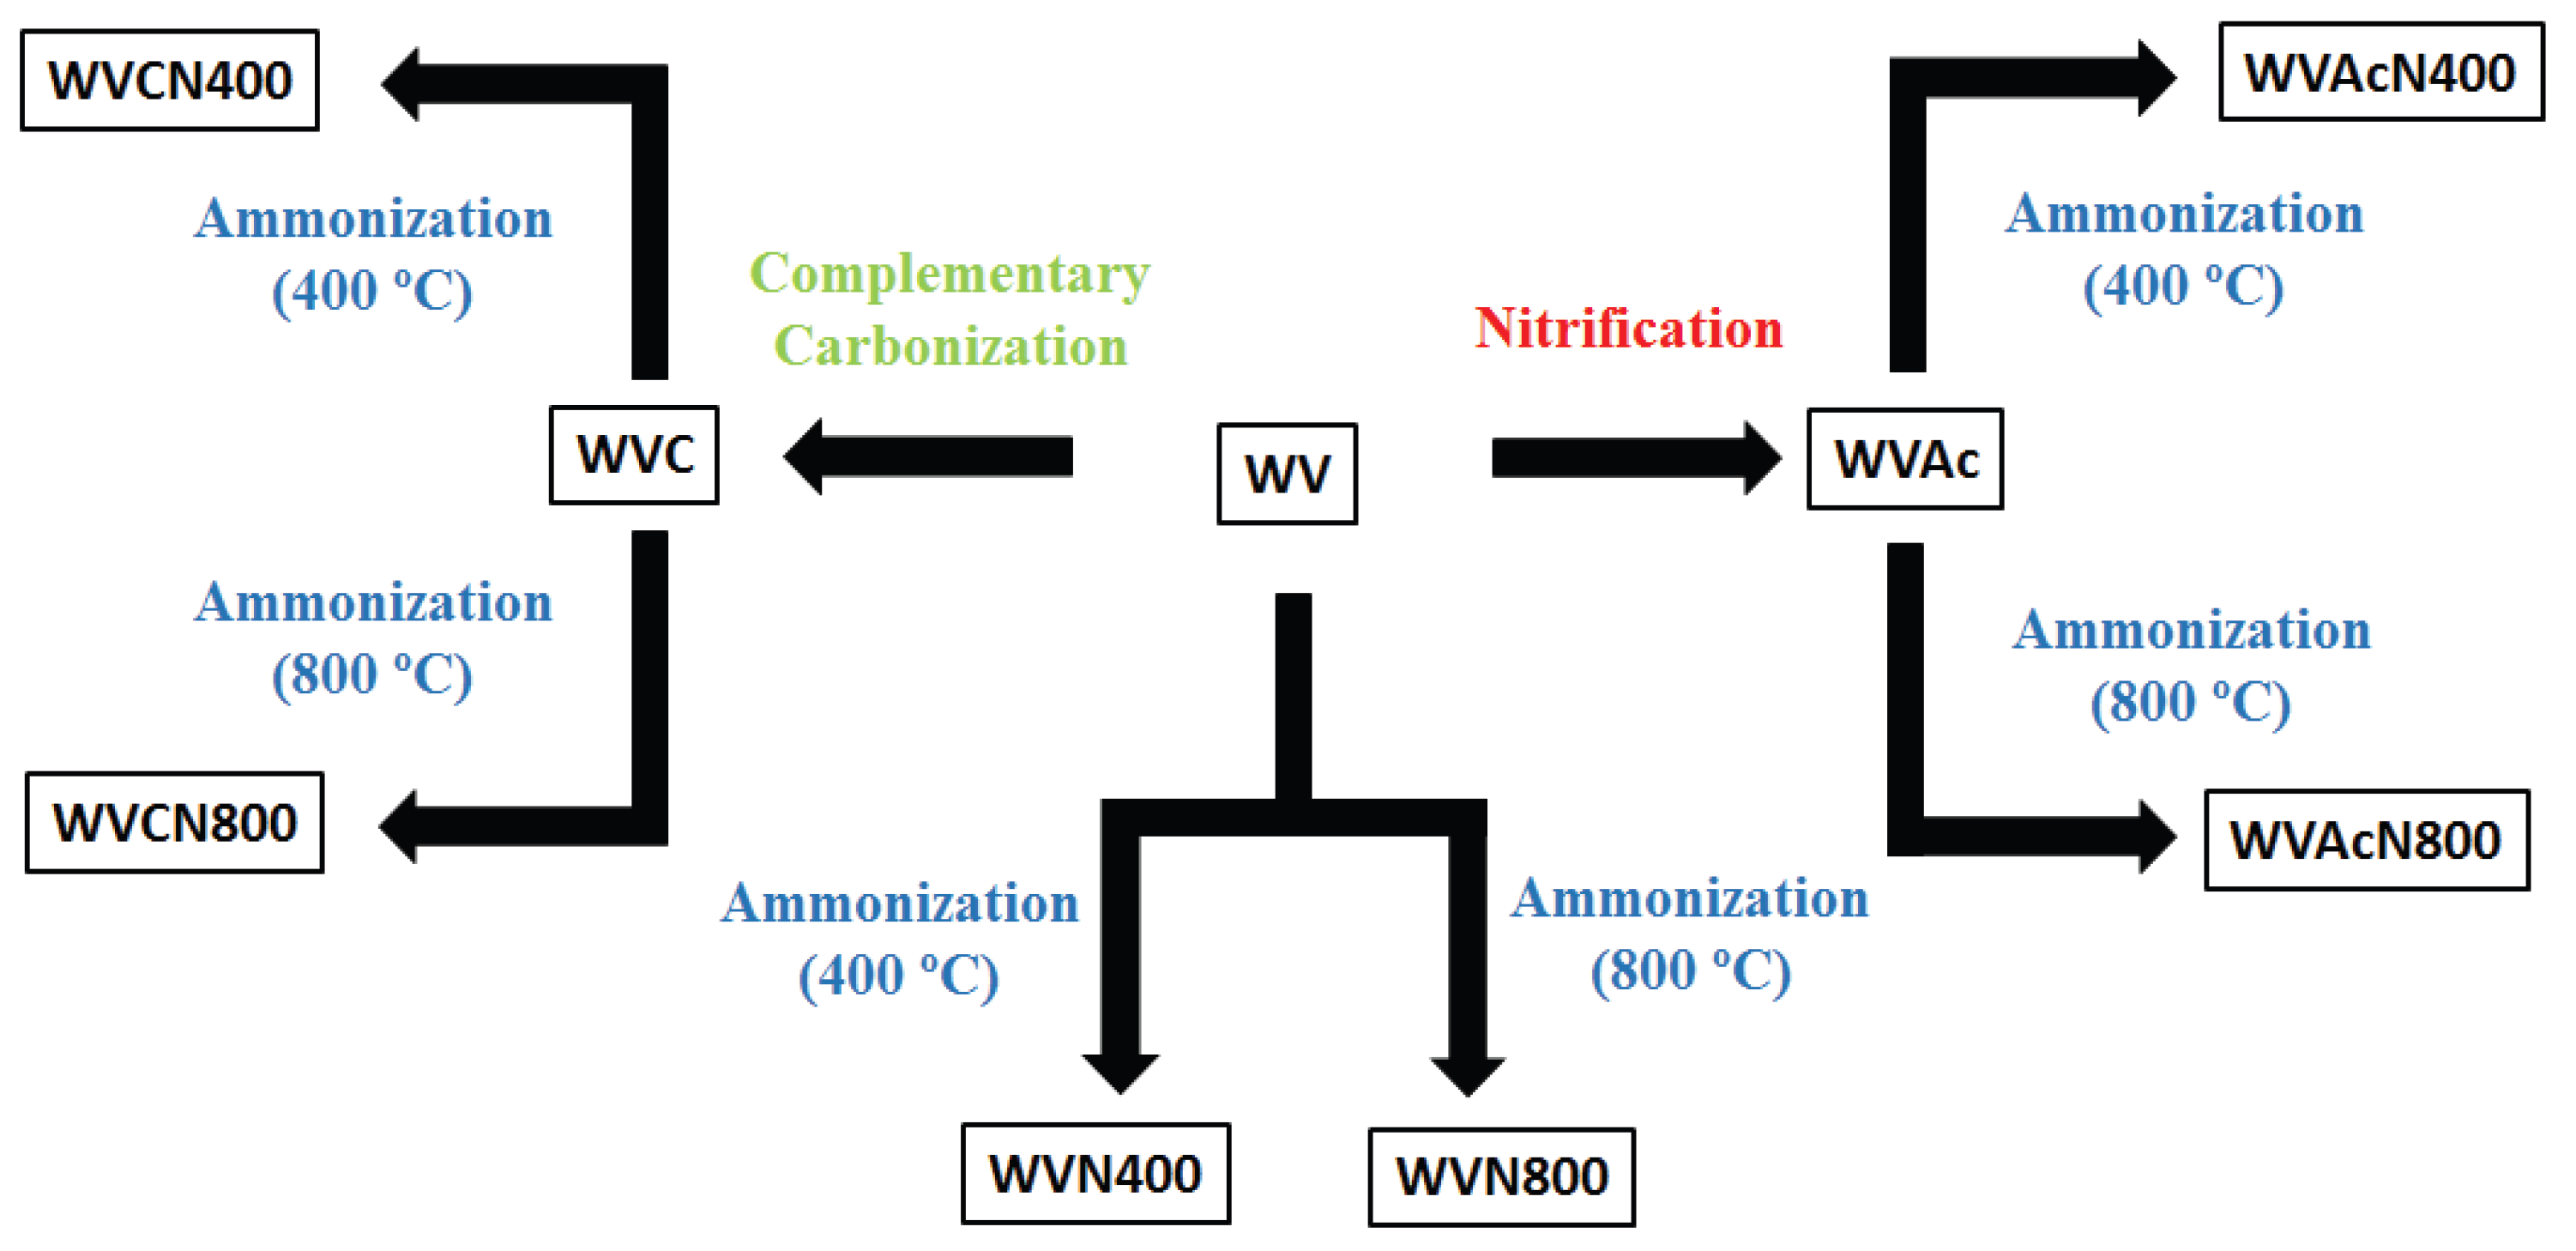
Figure 2.
Influence of the WV pretreatment and subsequent ammonization temperature on Cdl. (No: no previous treatment; Ac: nitrification; C: complementary carbonization).
Figure 2.
Influence of the WV pretreatment and subsequent ammonization temperature on Cdl. (No: no previous treatment; Ac: nitrification; C: complementary carbonization).
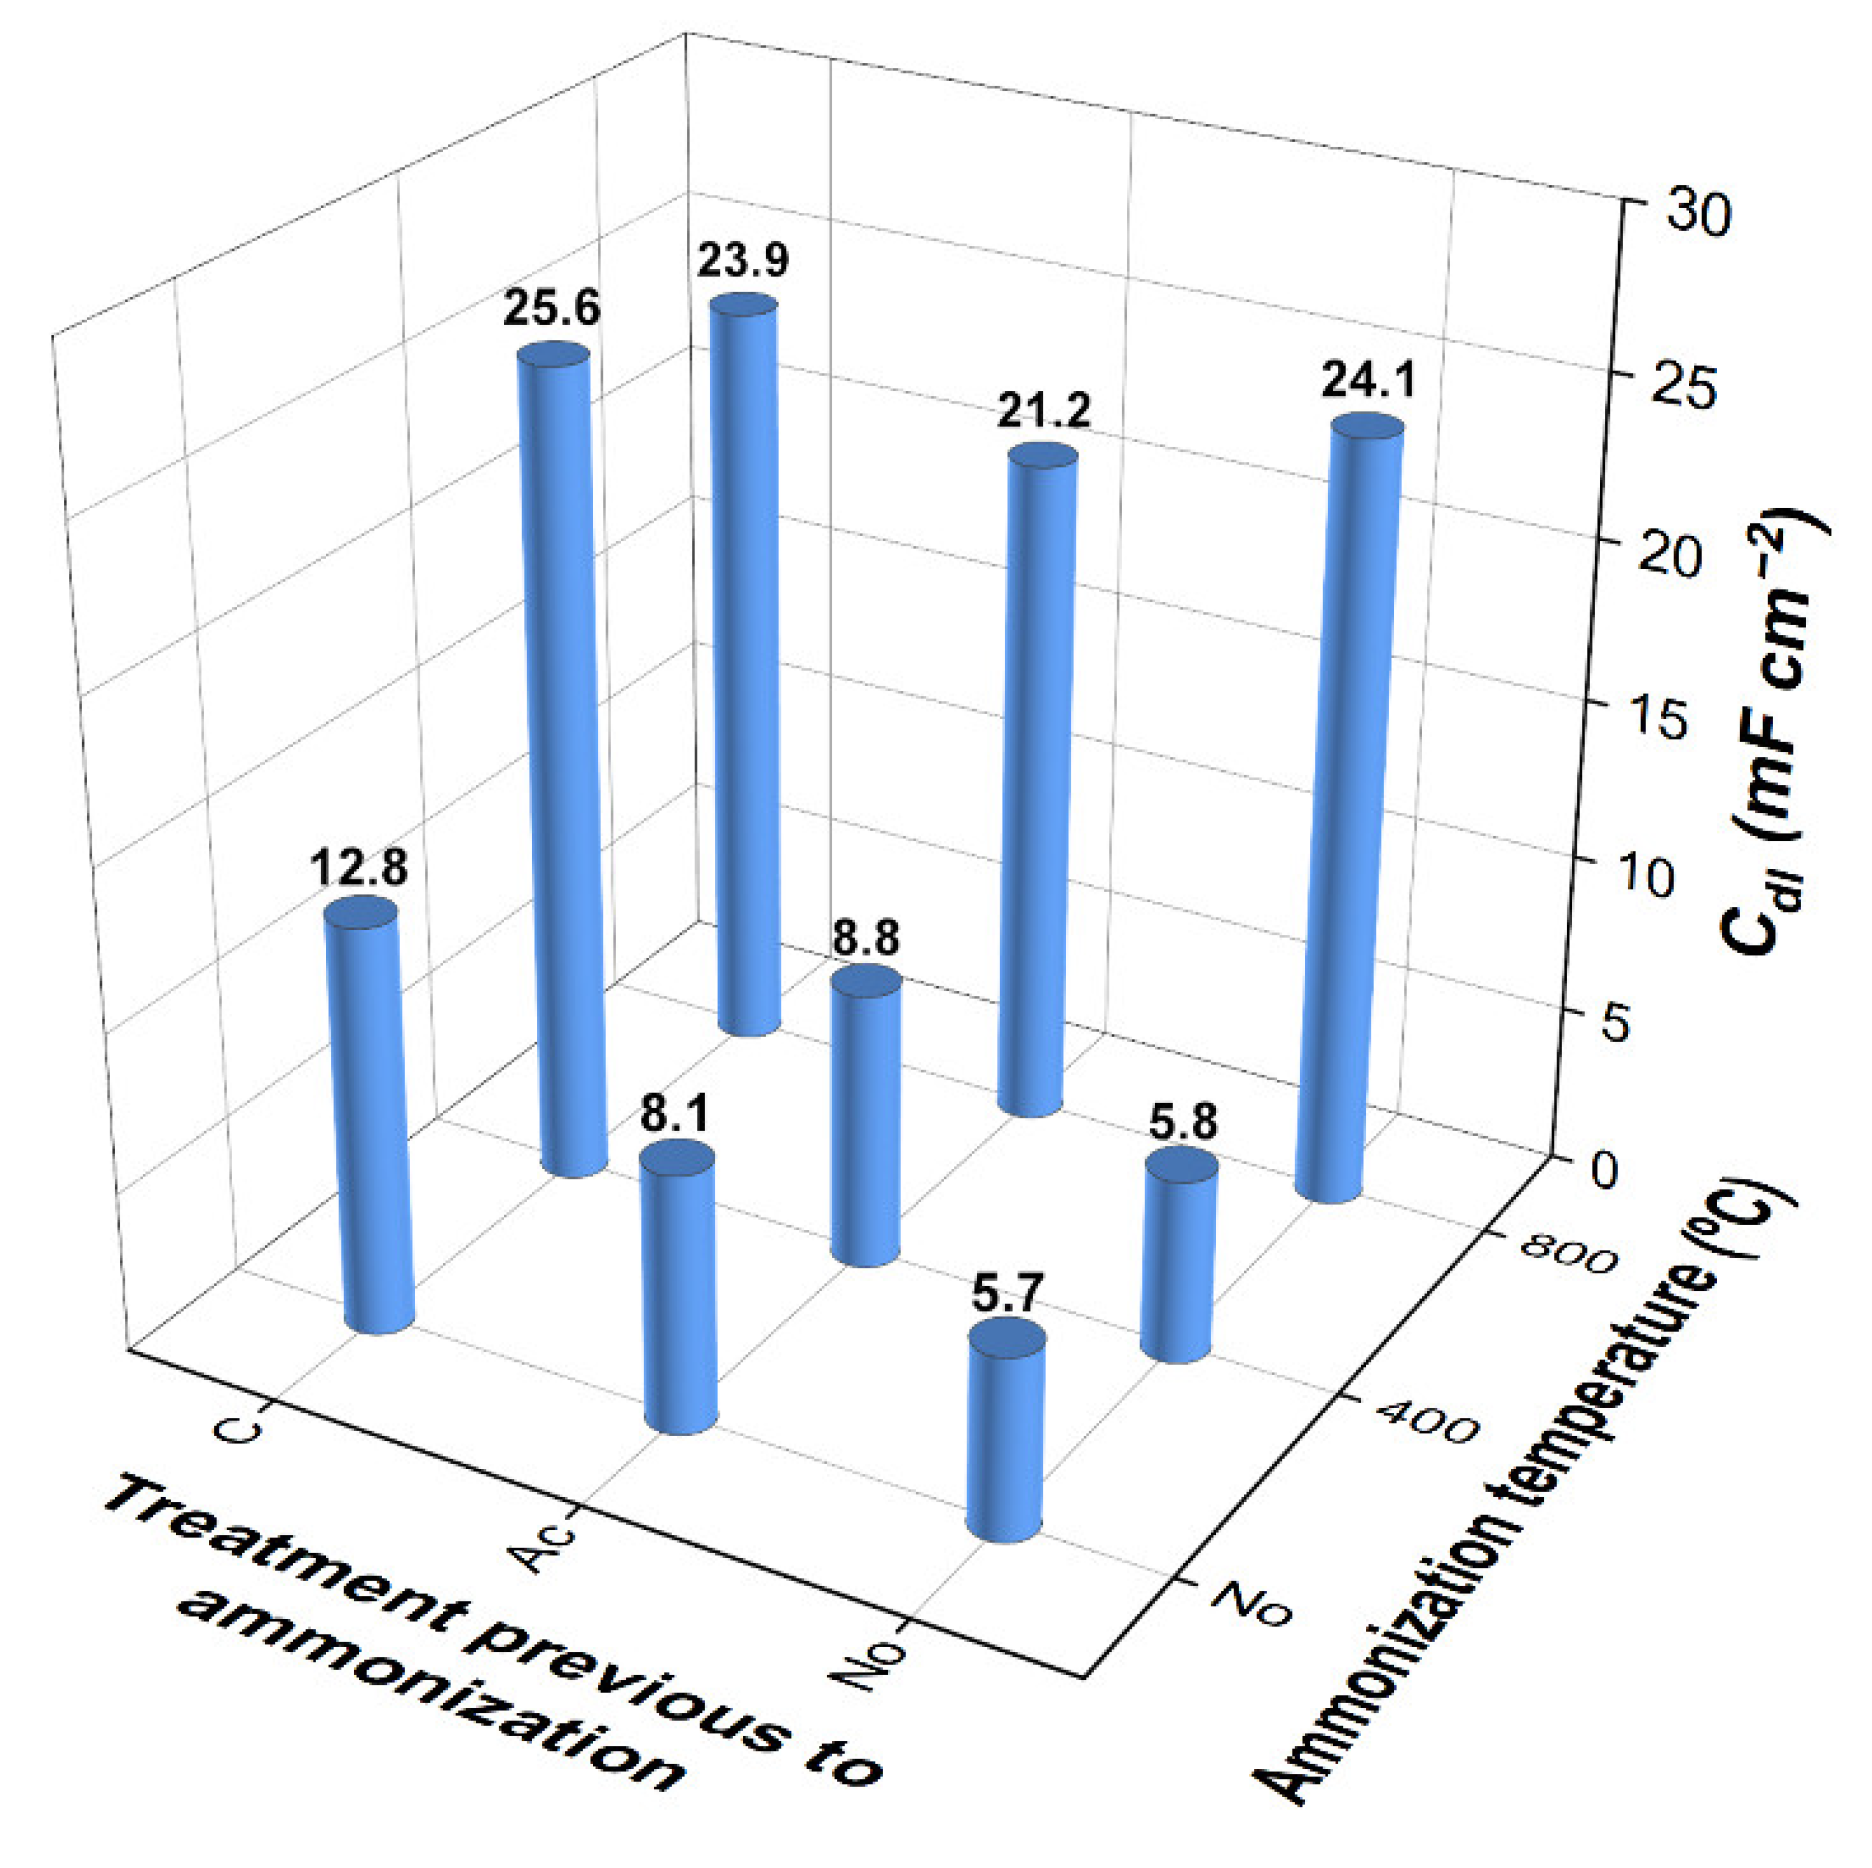
Figure 3.
Differential CV curves, with the curves were grouped in a way that emphasizes the effects of: (a) the treatments of complementary carbonization and nitrification on the base AC WV; ammonization of (b) the unmodified AC WV and the materials obtained after its (c) nitrification (WVAc) and (d) complementary carbonization (WVC).
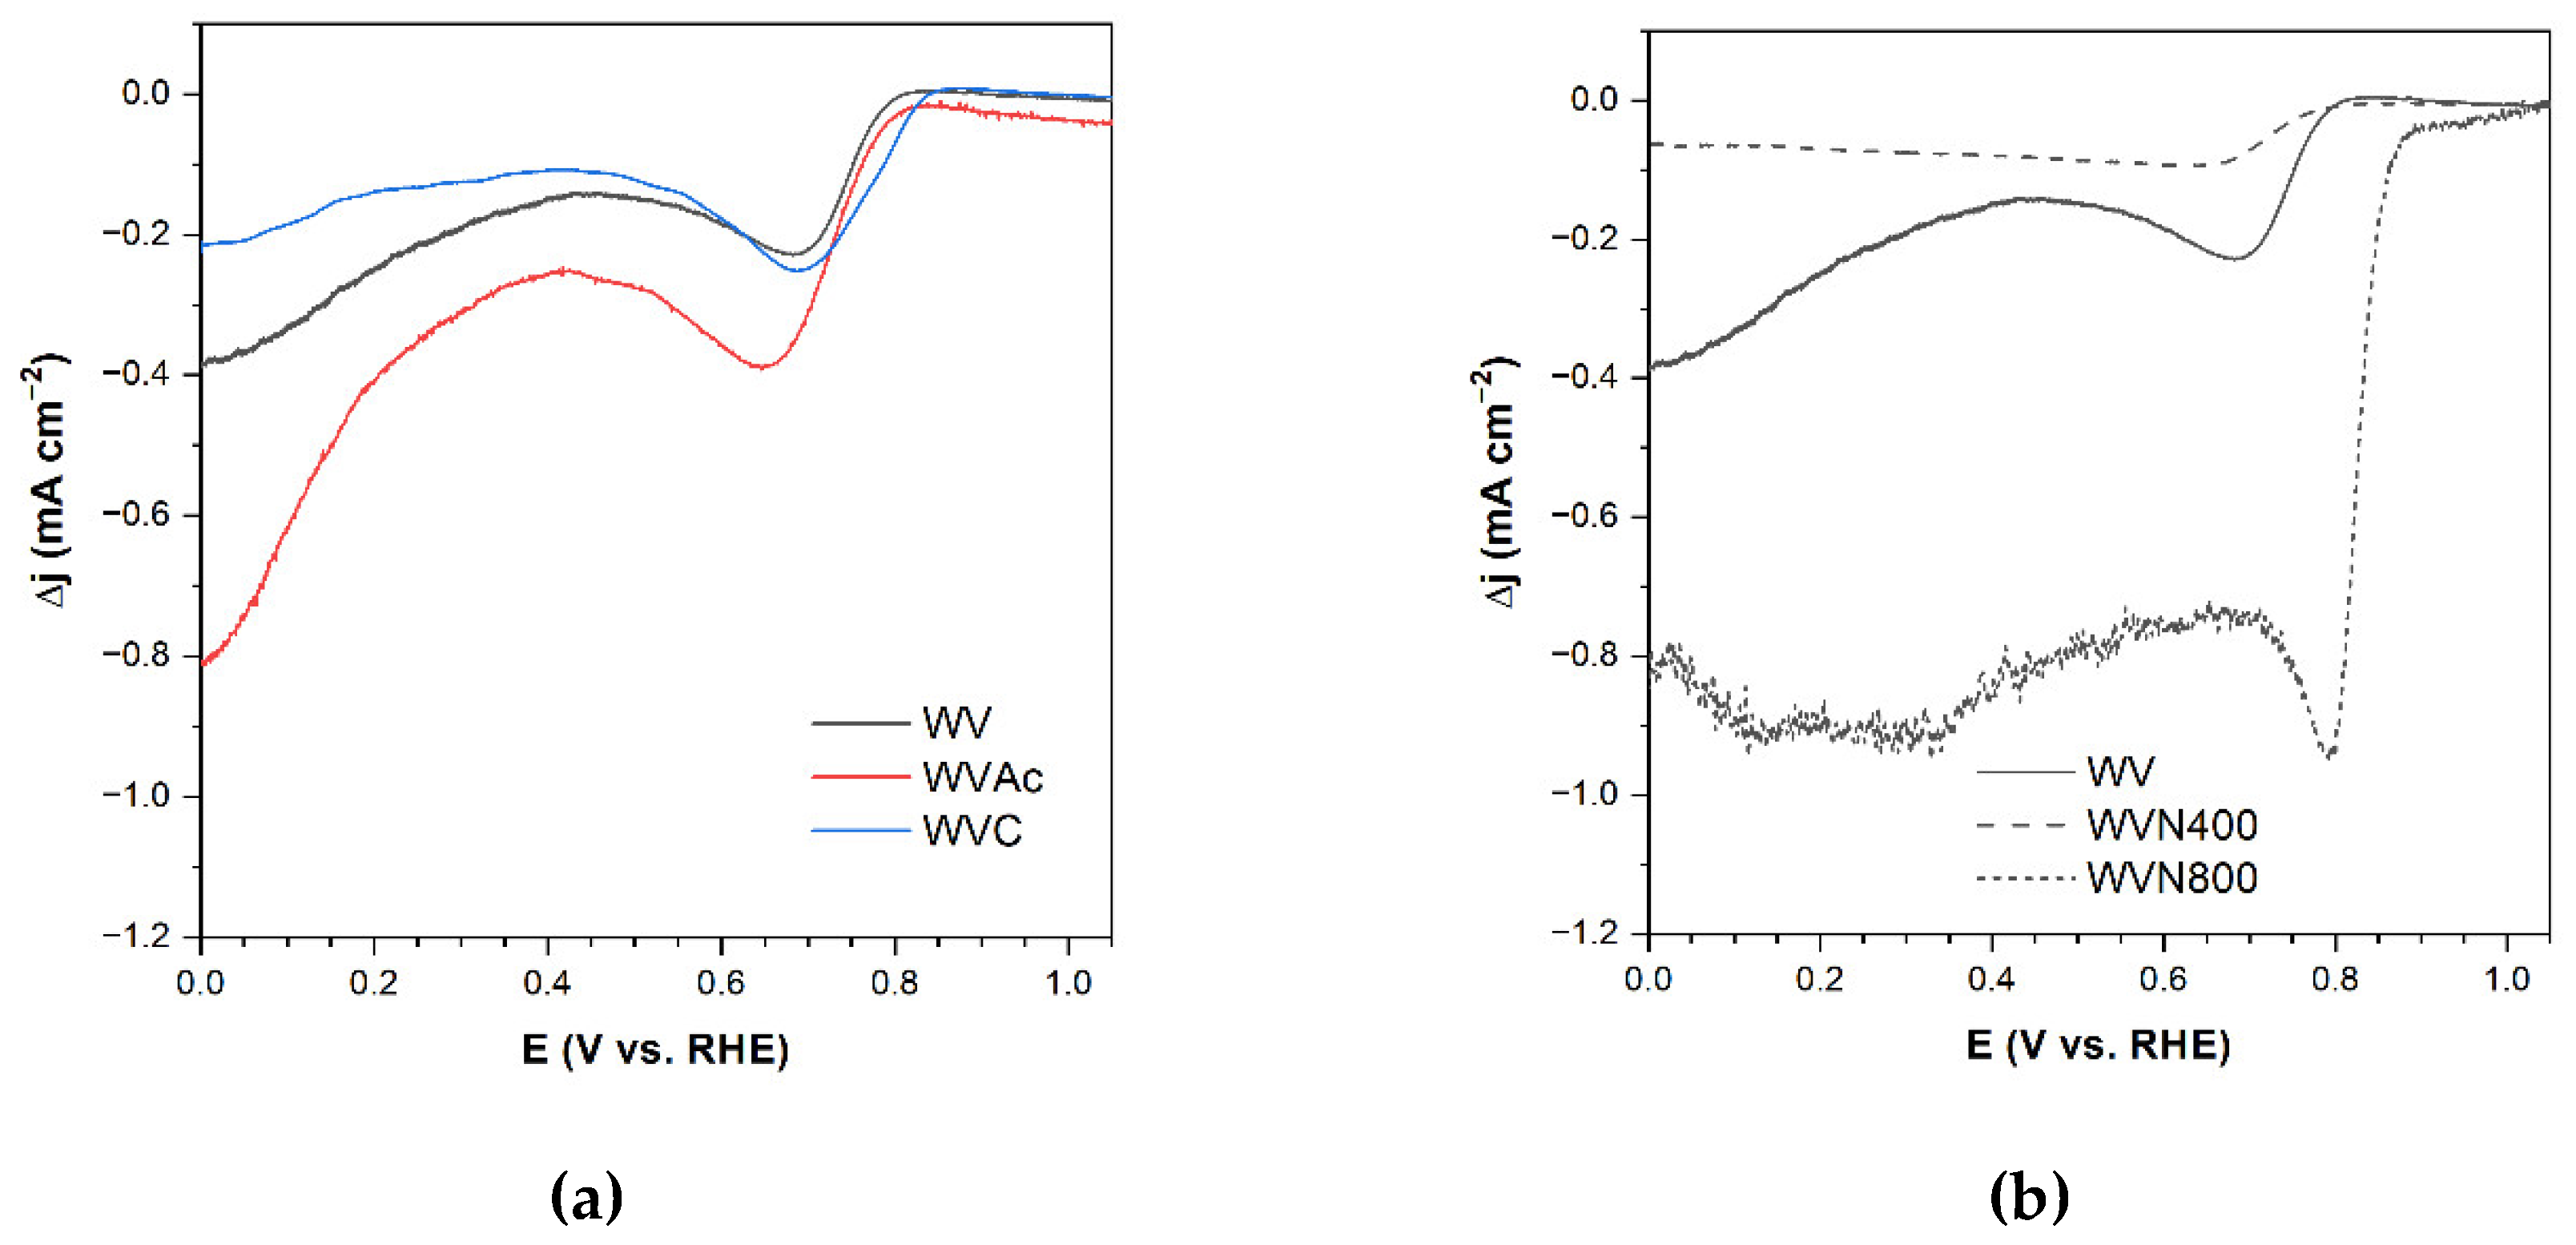
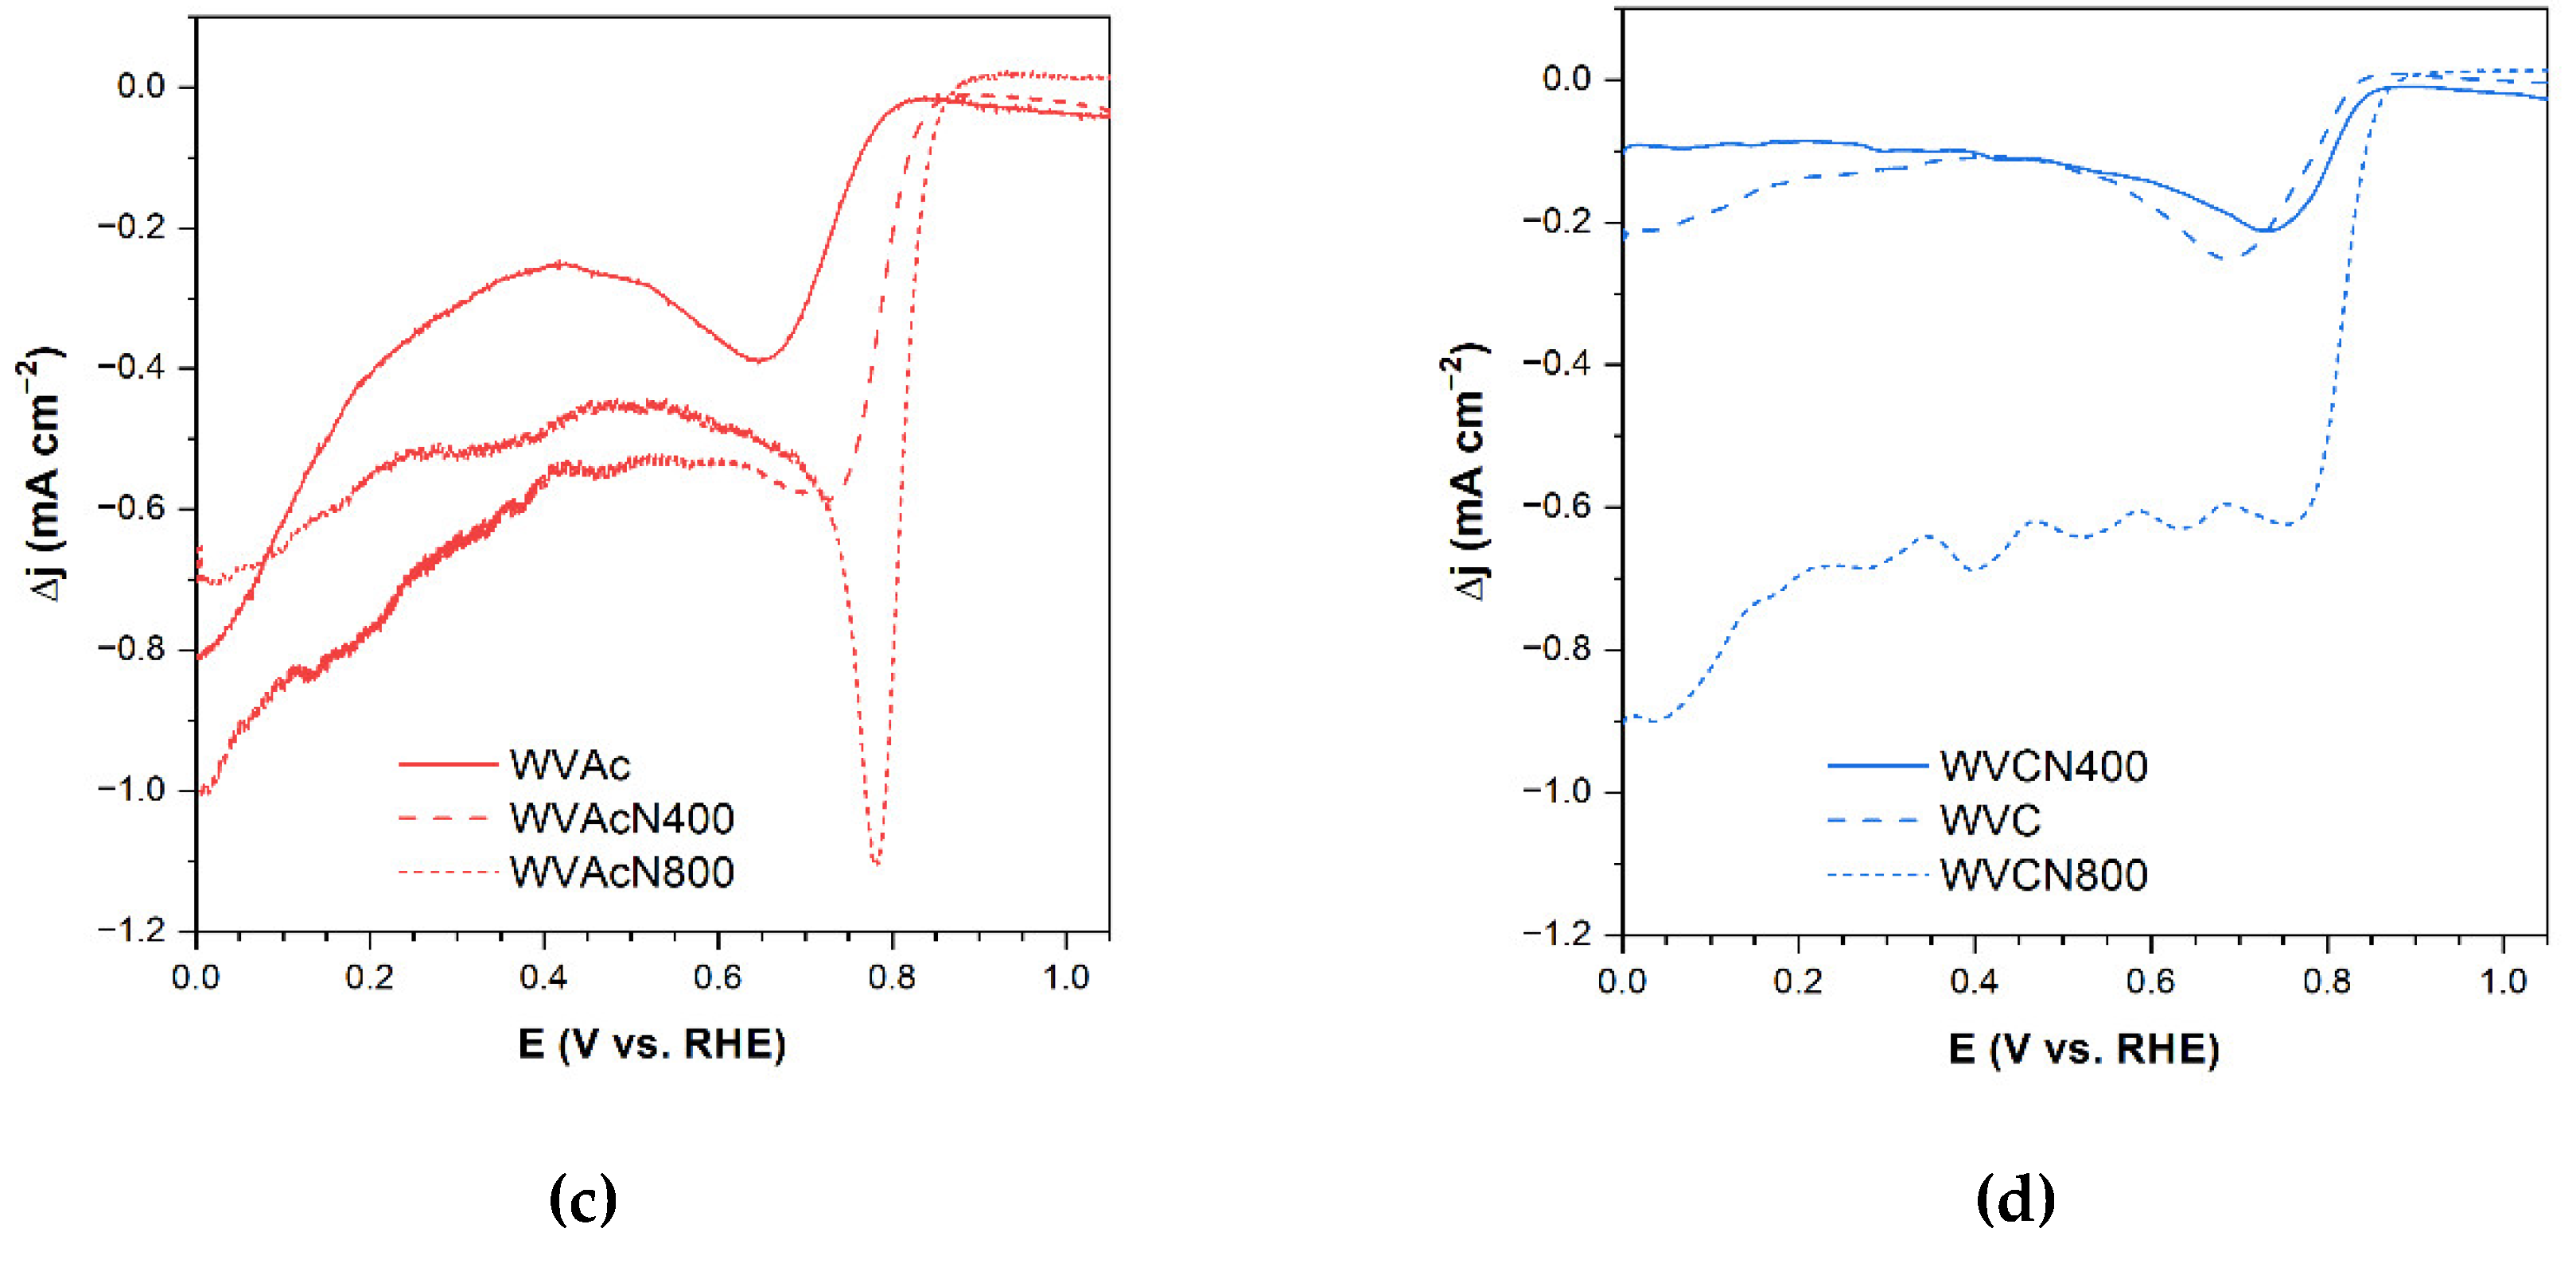
Figure 4.
Influence of the WV pretreatment and temperature of subsequent ammonization on: (a) Eonset, and (b) JL. The blue surface and the grey marked values correspond to those determined for the reference Pt/C electrocatalyst. (No: no previous treatment; Ac: nitrification; C: complementary carbonization).
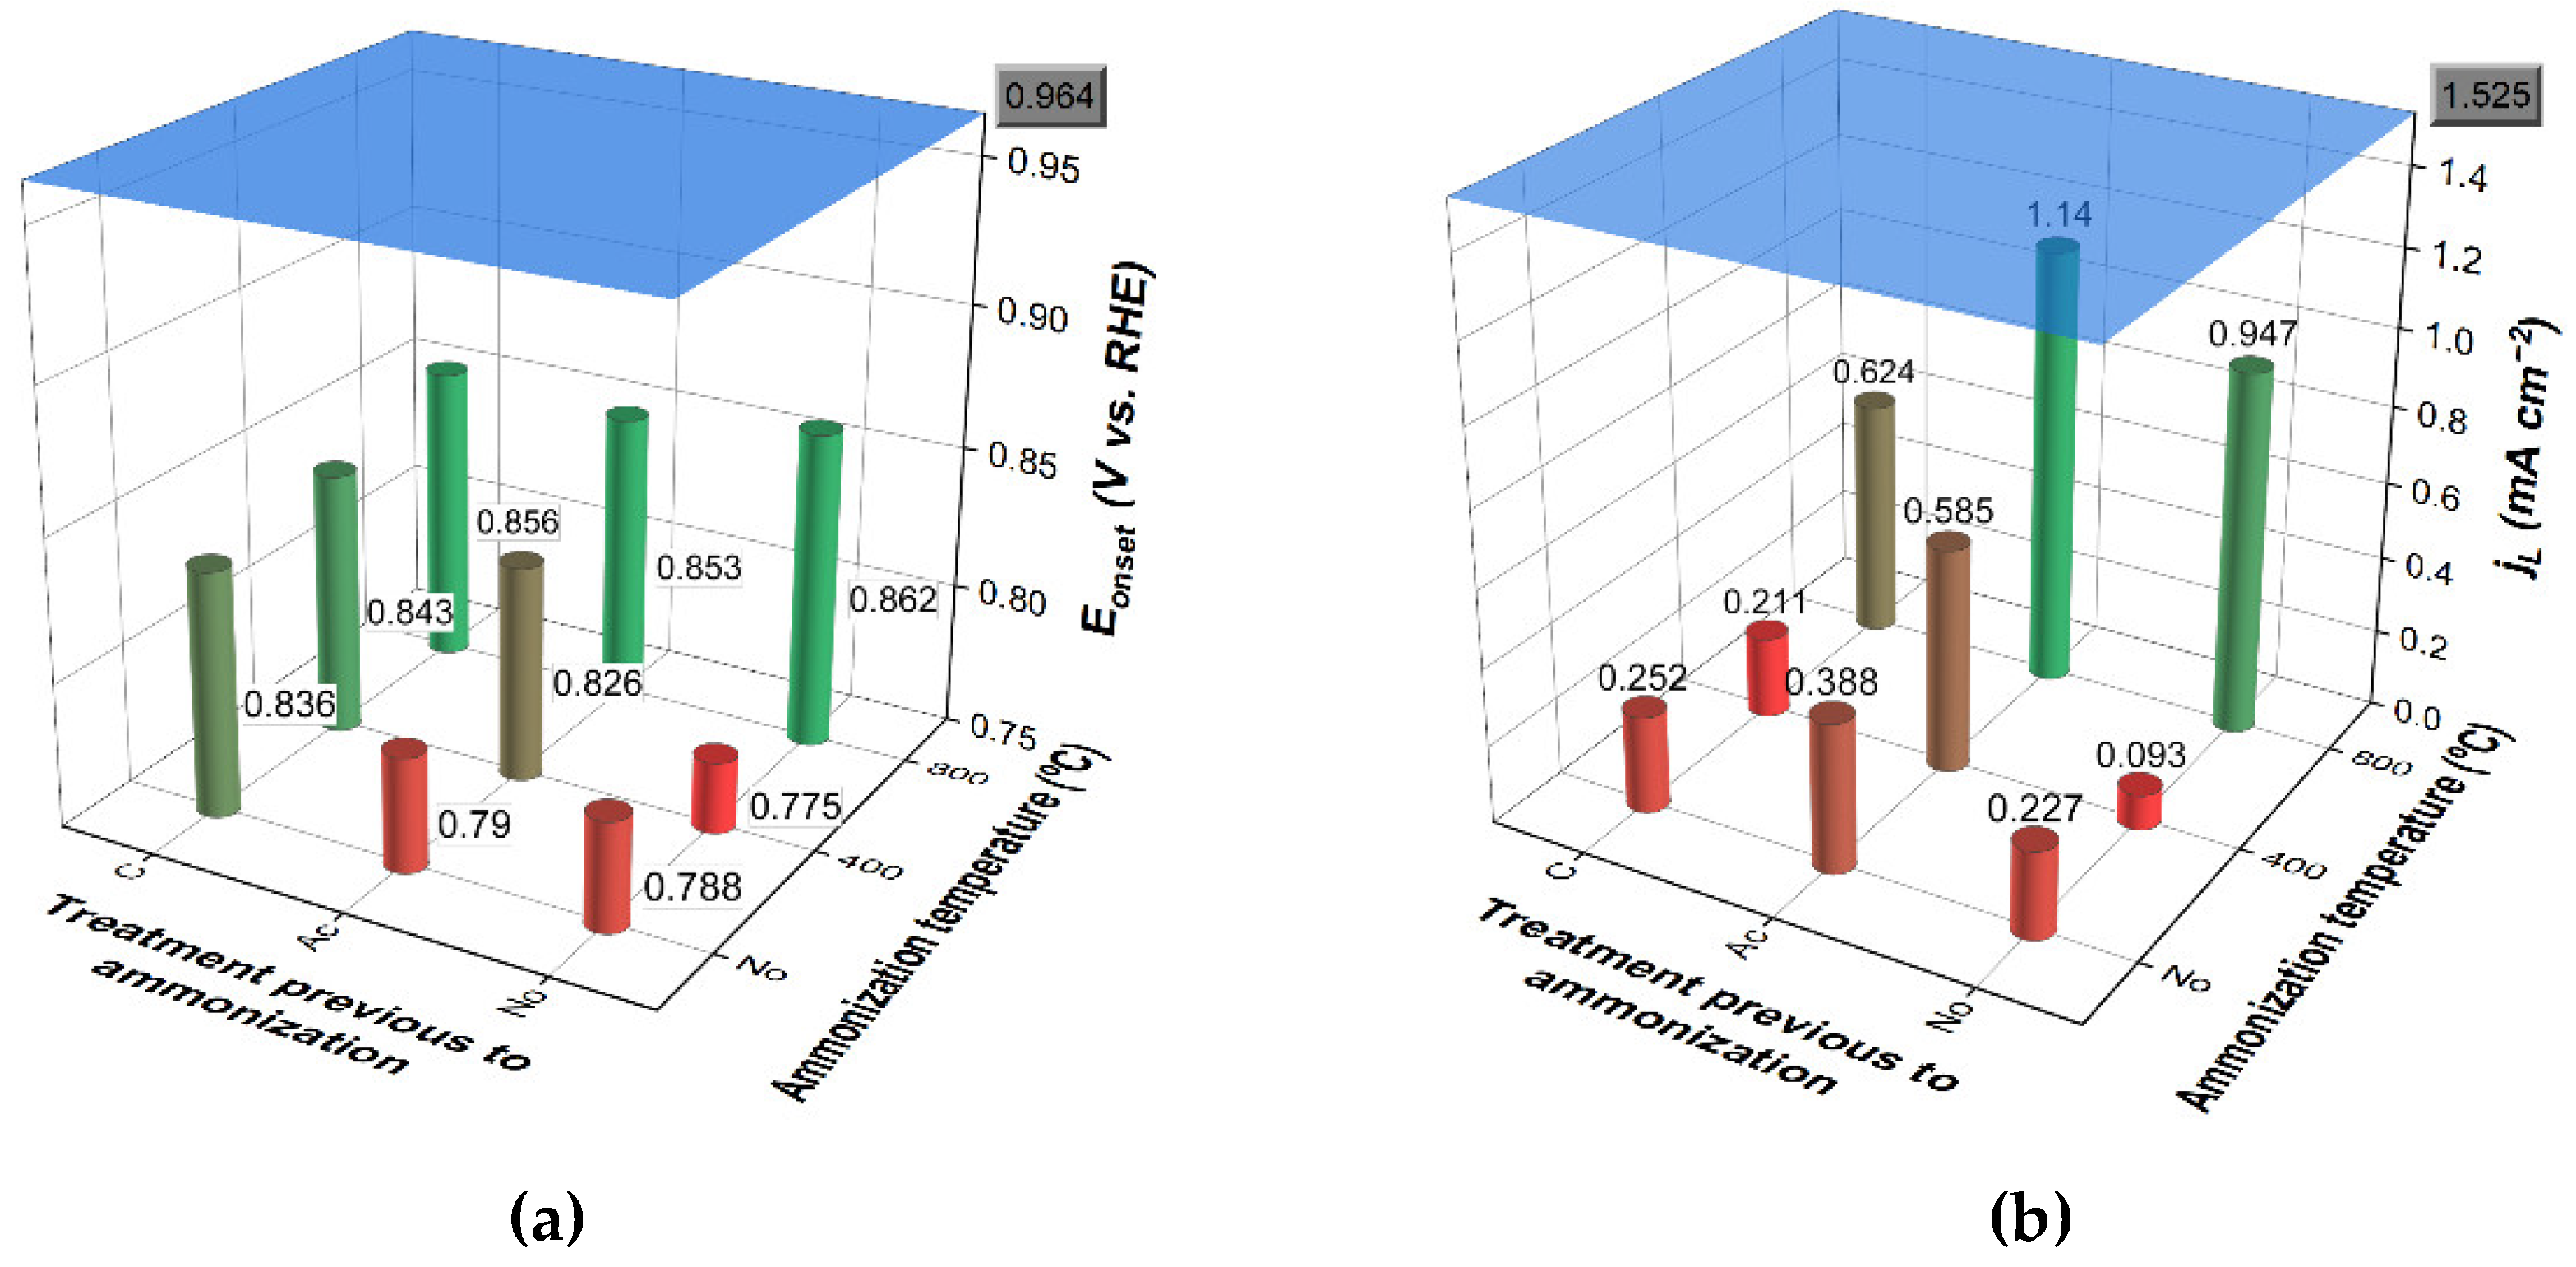
Figure 5.
Mechanisms proposed for the electrocatalytic reduction of O2 in alkaline medium. (nc represents a nucleophilic center).
Figure 5.
Mechanisms proposed for the electrocatalytic reduction of O2 in alkaline medium. (nc represents a nucleophilic center).
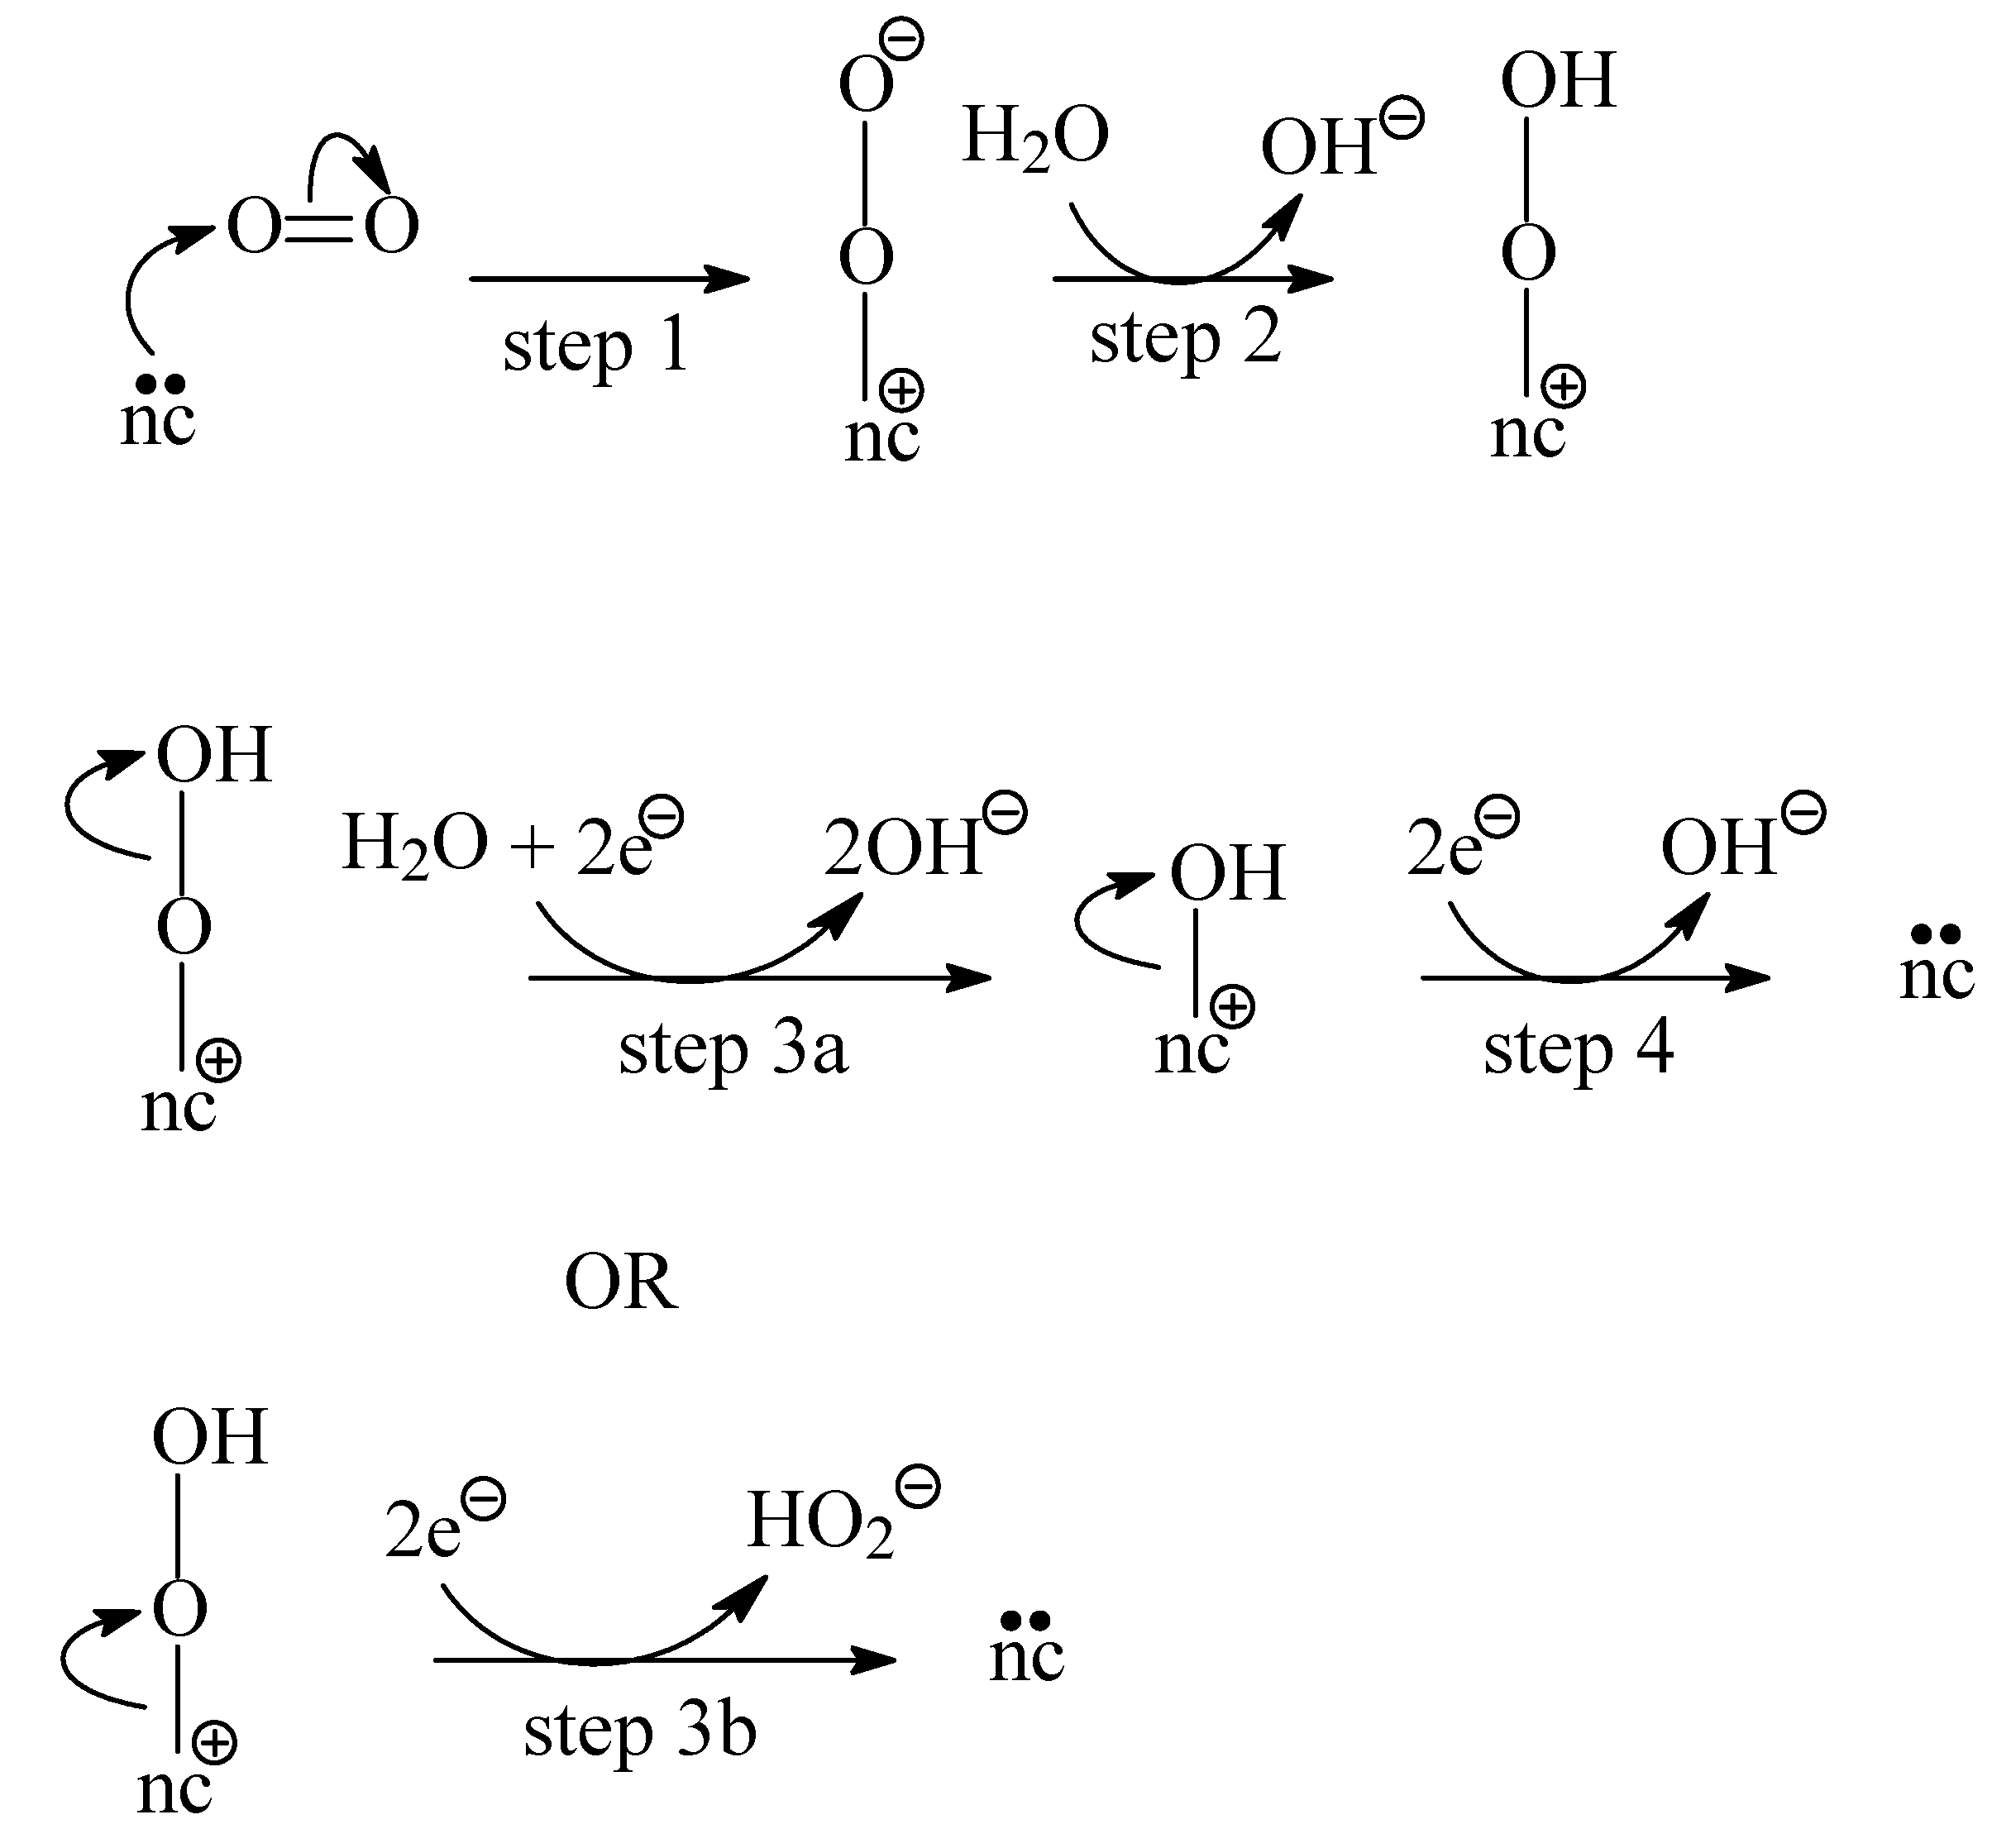
Figure 6.
CV curves measured (at 50 mV s−1) in 1 mol L−1 KOH solution saturated with O2, in the absence (red line; —) or presence (blue line; —) of methanol (0.1 mol L−1), using as cathode (a) WVAcN800, or (b) the Pt/C reference material.
Figure 6.
CV curves measured (at 50 mV s−1) in 1 mol L−1 KOH solution saturated with O2, in the absence (red line; —) or presence (blue line; —) of methanol (0.1 mol L−1), using as cathode (a) WVAcN800, or (b) the Pt/C reference material.
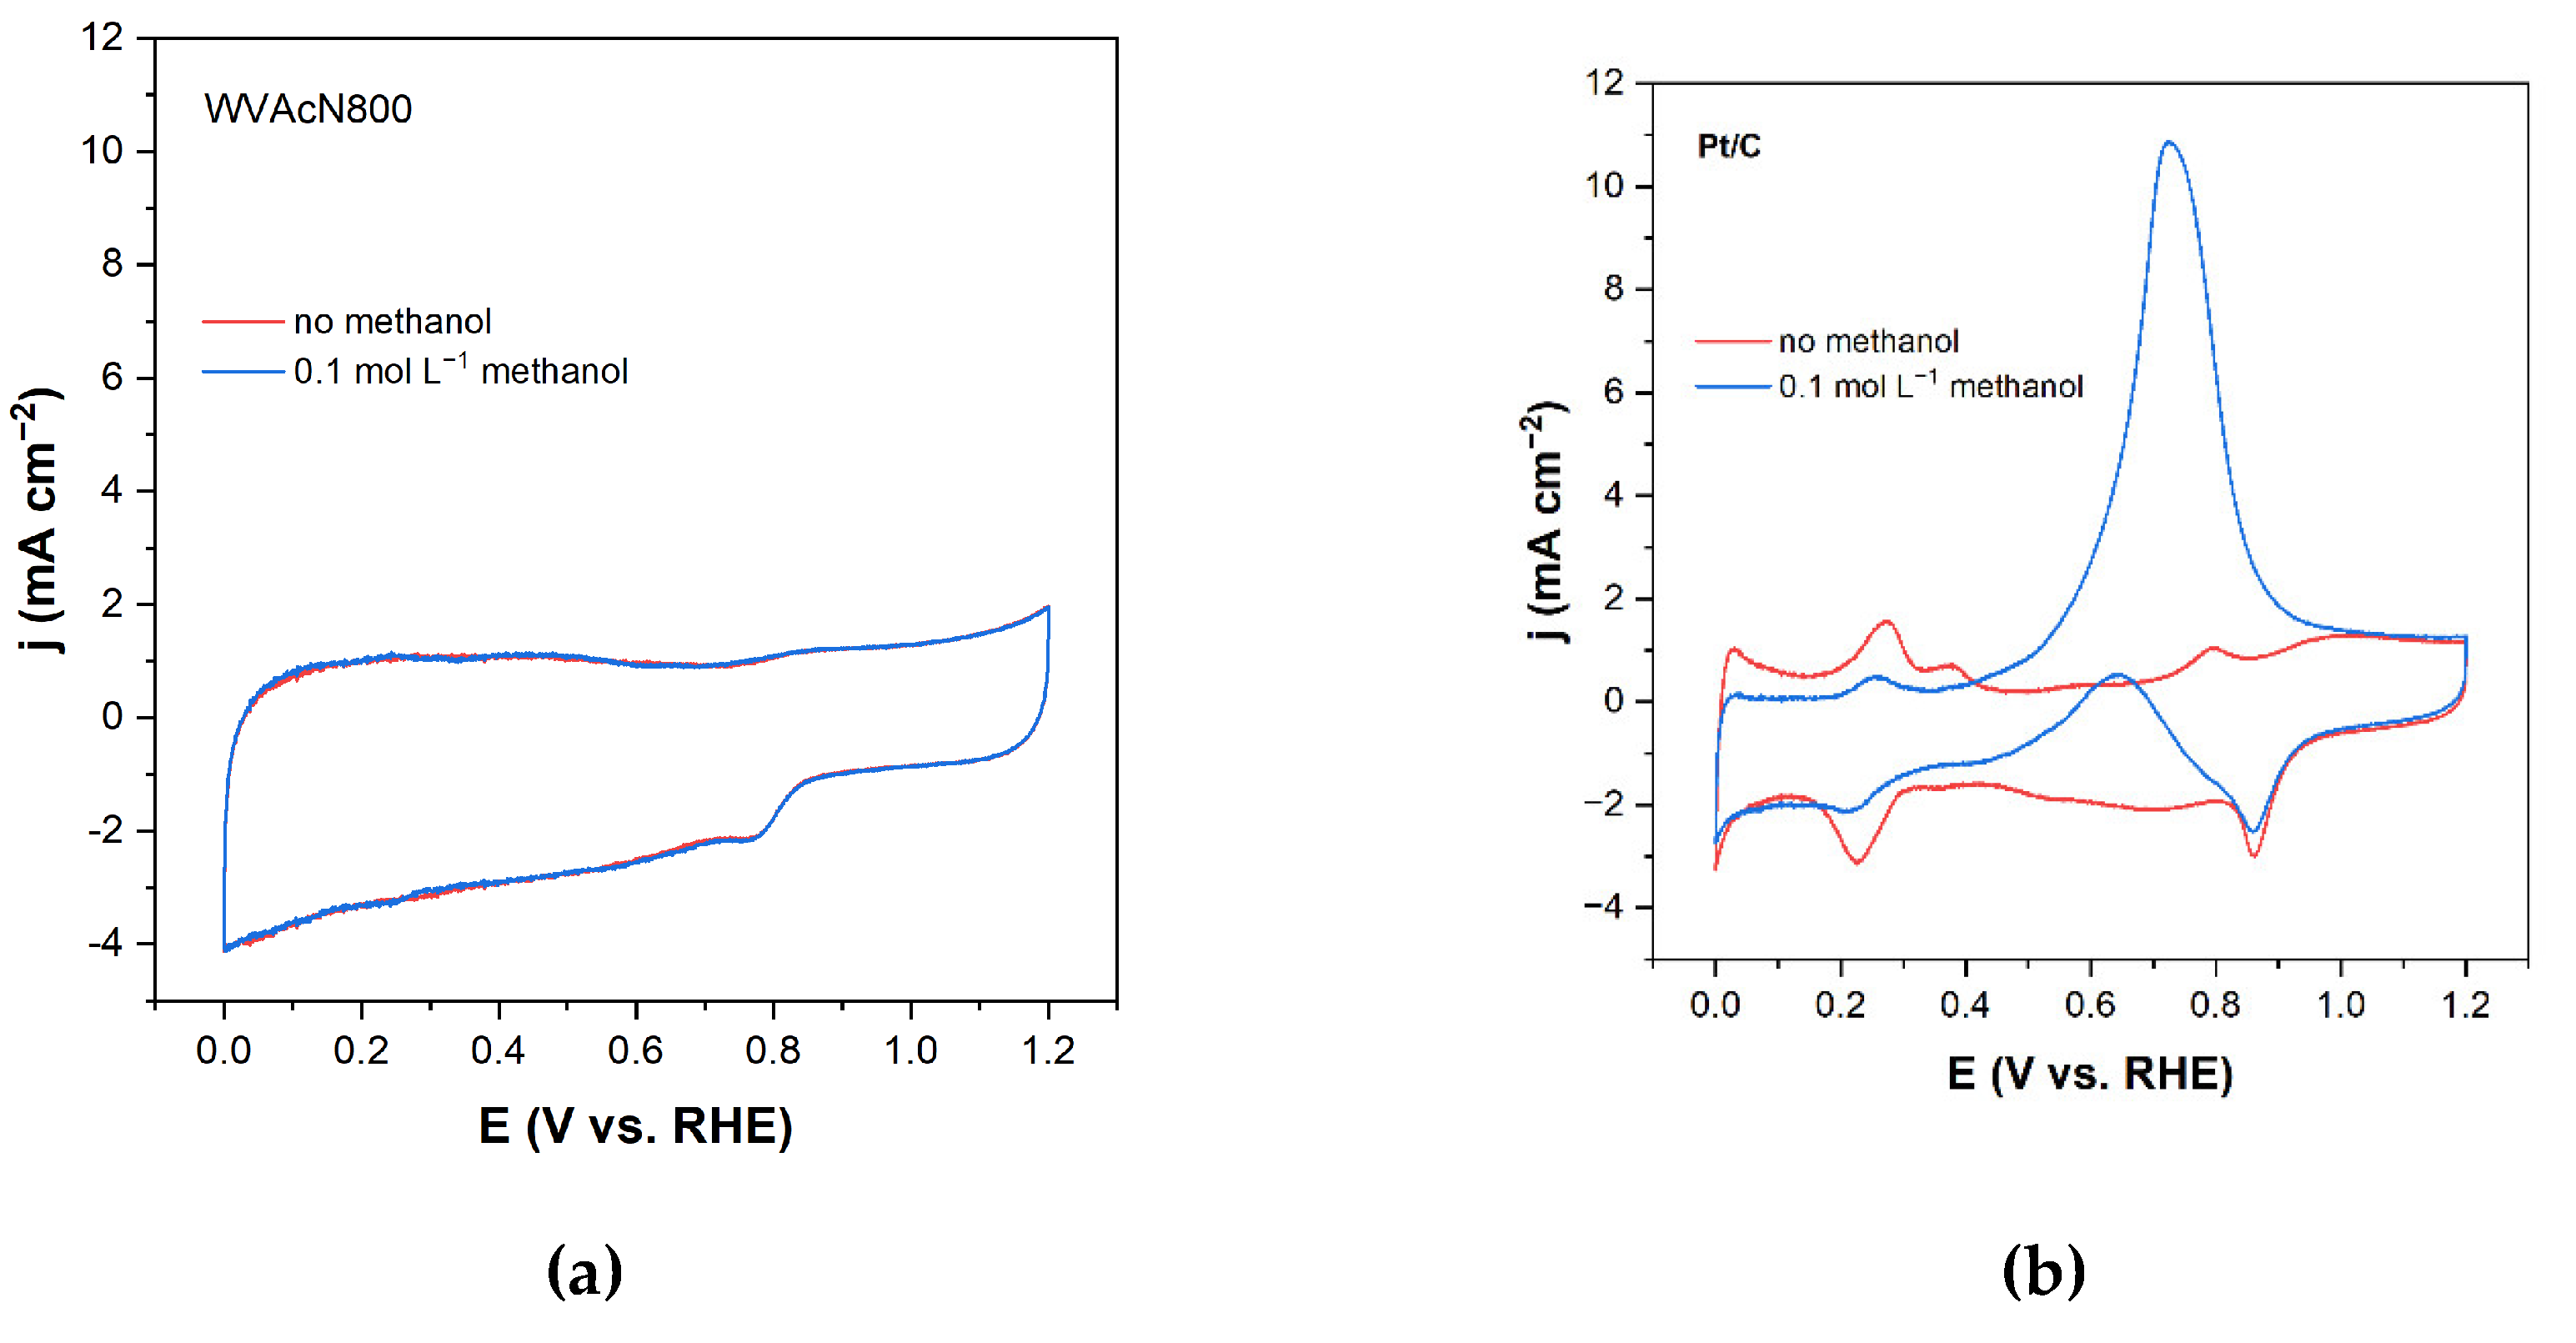
Figure 7.
(a) Polarization curves using WVAcN800 and Pt/C as the cathodic materials in a single-cell DMFC, and (b) their corresponding power density curves.
Figure 7.
(a) Polarization curves using WVAcN800 and Pt/C as the cathodic materials in a single-cell DMFC, and (b) their corresponding power density curves.
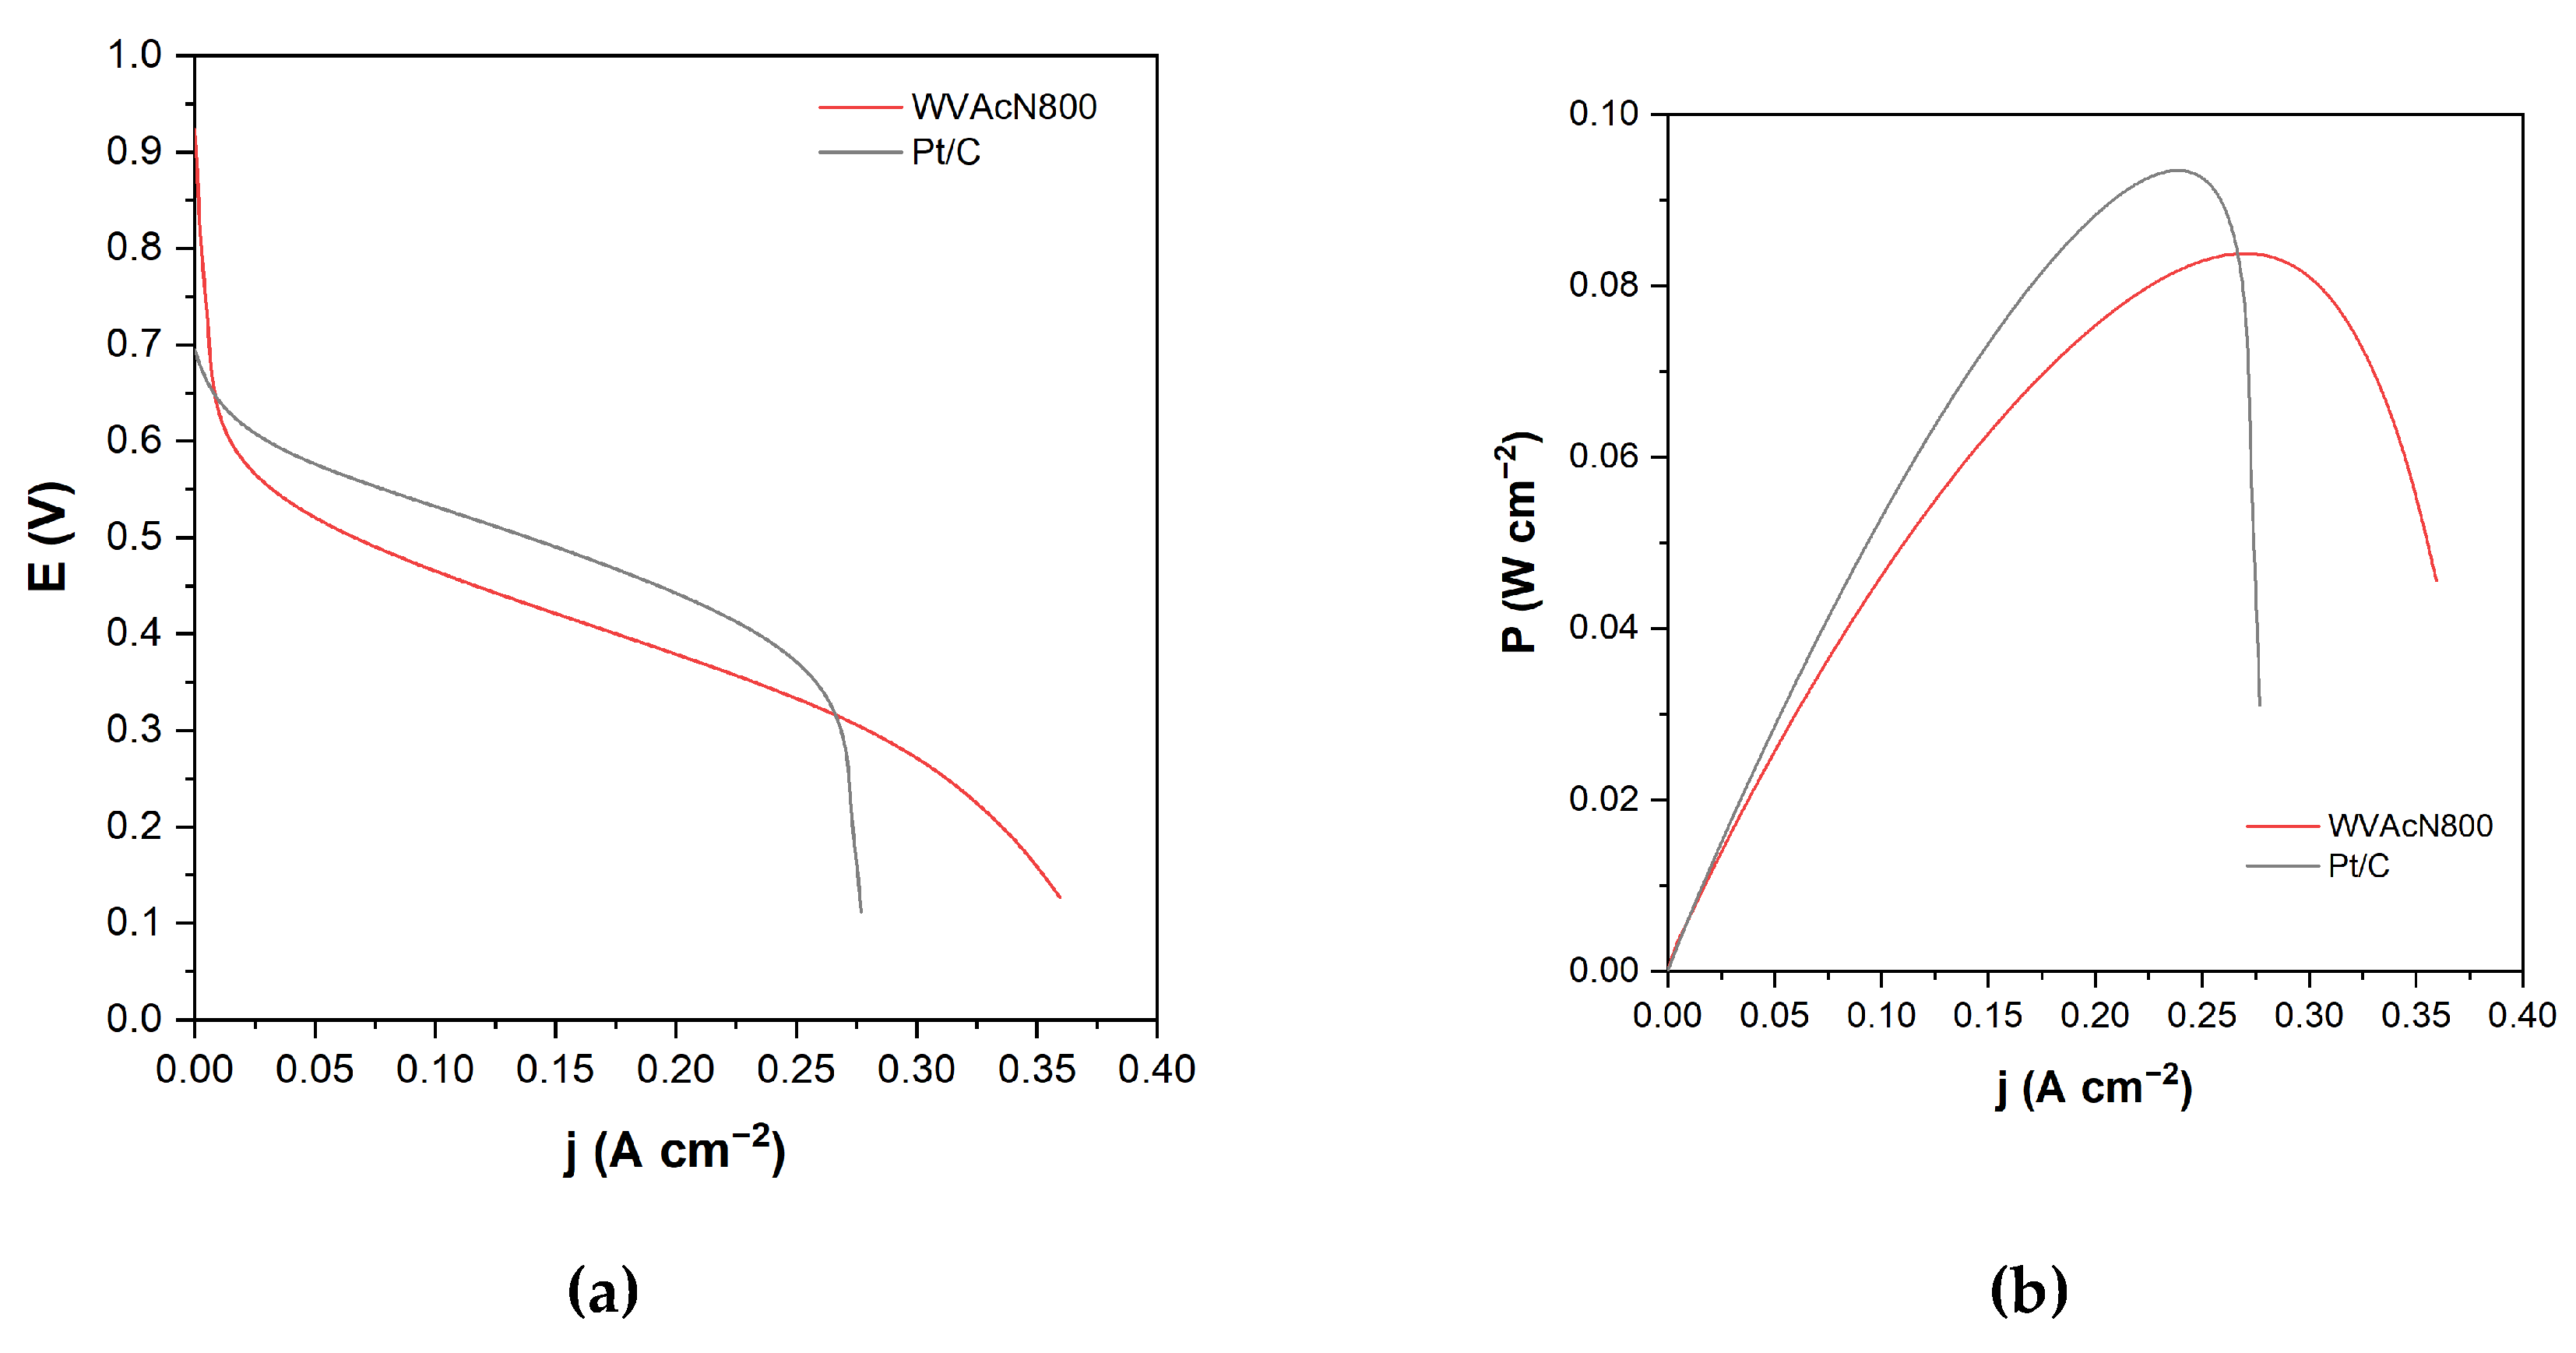

Table 1.
Selected data of mass variation during ammonization (Δmam), point of zero charge (PZC), elemental analyses (EA), and X-ray photoelectron spectroscopy (XPS) [12].
Table 1.
Selected data of mass variation during ammonization (Δmam), point of zero charge (PZC), elemental analyses (EA), and X-ray photoelectron spectroscopy (XPS) [12].
| Sample | Δmam (%)1 | PZC | H/C2 | XPS (wt%) | |||
|---|---|---|---|---|---|---|---|
| C | O | N | Inorganics3 | ||||
| WV | - | 4.7 | 0.41 | 83.1 | 13.7 | 0.3 | 2.9 |
| WVN400 | −4.2 | 6.8 | 0.39 | 83.2 | 10.7 | 3.1 | 3.0 |
| WVN800 | −10.8 | 6.2 | 0.29 | 84.9 | 7.2 | 5.1 | 2.8 |
| WVC | - | 6.2 | 0.16 | 86.2 | 8.4 | 0.8 | 4.6 |
| WVCN400 | +3.2 | 6.1 | 0.15 | 85.3 | 8.1 | 3.1 | 3.5 |
| WVCN800 | −1.5 | 6.3 | 0.19 | 85.3 | 7.6 | 3.9 | 3.3 |
| WVAc | - | 1.8 | 0.48 | 80.1 | 17.0 | 1.7 | 1.2 |
| WVAcN400 | −1.8 | 3.4 | 0.50 | 81.4 | 9.5 | 7.8 | 1.3 |
| WVAcN800 | −32.4 | 6.9 | 0.19 | 89.1 | 8.3 | 1.9 | 0.7 |
1Mass variation during ammonization; 2atomic ratio from EA data; 3P, Na, and Si.
Table 2.
Data of textural characterization [12].
Table 2.
Data of textural characterization [12].
| Sample | SSA (m2 g−1)1 | Vmic (cm3 g−1)2 | V0.95 (cm3 g−1)3 | Vmes (cm3 g−1)4 |
|---|---|---|---|---|
| WV | 1506 | 0.51 | 0.92 | 0.41 |
| WVN400 | 1238 | 0.39 | 0.72 | 0.33 |
| WVN800 | 1247 | 0.42 | 0.74 | 0.32 |
| WVC | 1296 | 0.44 | 0.75 | 0.31 |
| WVCN400 | 1289 | 0.43 | 0.74 | 0.31 |
| WVCN800 | 1313 | 0.46 | 0.76 | 0.30 |
| WVAc | 1392 | 0.47 | 0.82 | 0.35 |
| WVAcN400 | 1226 | 0.41 | 0.72 | 0.31 |
| WVAcN800 | 1504 | 0.50 | 0.83 | 0.33 |
1Determined using BET equation; 2micropores volume, determined using DR equation; 3considered as the volume of micropores plus mesopores; and 4mesopores volume, determined by subtracting Vmic from V0.95.
Table 3.
Representative Eonset values for different metal-free N-doped carbon-based materials and their respective original precursors (collected from the literature).
Table 3.
Representative Eonset values for different metal-free N-doped carbon-based materials and their respective original precursors (collected from the literature).
| Entry | Original material | N-doping methodology | Eonset (V) | Reference | |
|
Original material |
N-doped material |
||||
| 1 | 1 AC WVA-1050 | Ammonization | 0.788 | 0.853–0.862 | Present work |
| 2 | 2,3 AC | 4 Amidation | 0.82 | 0.84 | [45] |
| 3 | 2,3 AC | 5 Composite with polyaniline | 0.82 | 0.88 | [45] |
| 4 | 1,6 AC MSC30 | 7 Urea (800 °C) | 0.83 | 0.86 | [46] |
| 5 | 1 Carbon Black Pearls 2000 | 7 Urea (850 °C) | 0.737 | 0.777 | [27] |
| 6 | 1 Carbon Black Pearls 2000 | 8 HNO3 + urea (850 °C) | 0.737 | 0.817 | [27] |
| 7 | 2 graphene | 7 Urea (800 °C) | 0.73 | 0.78 | [47] |
| 8 | 2 graphene oxide | 7 Melamine (900 °C) | - | 0.82 | [48] |
| 9 | 2 carbon nanotubes | 7 Urea (800 °C) | 0.78 | 0.89 | [49] |
| 10 | 2 carbon nanotubes | 7 Melamine (800 °C) | 0.78 | 0.90 | [49] |
1 commercial. 2 home-made. 3 chemical activation of anthracite with KOH (KOH:anthracite ratio of 4:1). 4 NH4NO3/DMF and pyridine, followed by heat treatment up to 800 °C under an inert atmosphere. 5 polymerization of aniline adsorbed on the AC surface, followed by heat treatment up to 800 °C. 6 chemical activation of petroleum coke with KOH (as indicated in reference [50]). 7 heat treatment under an inert atmosphere. 8 oxidative pretreatment with HNO3 followed by the thermal treatment with urea.
Disclaimer/Publisher’s Note: The statements, opinions and data contained in all publications are solely those of the individual author(s) and contributor(s) and not of MDPI and/or the editor(s). MDPI and/or the editor(s) disclaim responsibility for any injury to people or property resulting from any ideas, methods, instructions or products referred to in the content. |
© 2025 by the authors. Licensee MDPI, Basel, Switzerland. This article is an open access article distributed under the terms and conditions of the Creative Commons Attribution (CC BY) license (http://creativecommons.org/licenses/by/4.0/).
Copyright: This open access article is published under a Creative Commons CC BY 4.0 license, which permit the free download, distribution, and reuse, provided that the author and preprint are cited in any reuse.


