1. Introduction
Peatlands, covering approximately 3% of the global land area and hosting about 10% of the freshwater [
1], are vital carbon sinks, sequestering nearly half of the atmospheric carbon dioxide [
2]. Beyond carbon sequestration, they provide numerous ecosystem services, including water regulation, biodiversity habitats, and resources such as fruits and timber [
3,
4]. In Southeast Asia (SEA), peatlands span over 26 Mha, accounting for 69% of the world’s tropical peatland area [
5]. This extensive coverage is primarily located in Sundaland, a tectonically stable region that emerged during the Pleistocene. Following the Last Glacial Period (LGP) and the subsequent rapid sea-level rise from the Early Holocene onwards, peatlands in SEA predominantly formed in marine-influenced to deltaic or fluviolacustrine systems associated with flooded coastlines [
6,
7]. These developments underscore the dynamic interplay between geological processes and climatic conditions in shaping peatland environments.
Given their capacity to store vast amounts of carbon and their role in regulating local climates, understanding peatland dynamics is essential for addressing global climate challenges. Protecting these ecosystems not only contributes to carbon sequestration but also supports biodiversity and sustainable resource management. Beyond their ecological significance, peatlands serve as crucial palaeoenvironmental archives, including palaeobotanic and palaeoclimatic records, that enhance our understanding of past climates and environments, thereby assisting in predicting future environmental trends [
8].
Brunei Darussalam represents a critical area with underexplored peatlands (including Labu) that hold significant potential for advancing our understanding of tropical peatland dynamics in this vital region [
9]. While studies have explored the ecological aspects and carbon storage capacity of Brunei’s peatlands (e.g., [
10,
11,
12,
13,
14]), their geological characteristics remain understudied, creating a knowledge gap regarding their unique dynamics, as only a few stratigraphic details and geological information exist from Ulu Mendaram [
9,
15]. The Labu Peatland represents a critical piece of the puzzle in understanding peatland evolution within SEA, contributing to a broader regional understanding of these vital ecosystems.
Peatlands face threats from global climate change, which worsens droughts and leads to declining water tables. Additionally, wildfires and human activities, such as construction, agricultural conversion, livestock grazing, and illegal wood logging, further compound these challenges [
2,
16,
17]. Despite global pressures, Brunei Darussalam actively preserves significant pristine peatlands covering a total area of 576.5 kha, which constitutes approximately 19% of the country’s land area [
12,
18], predominantly located in the western region and along coastal lowlands, extending inland alongside rivers in the Tutong, Belait, and Temburong Districts [
8]. Therefore, an inventory of the geological context of these ecosystems, including the lithological successions and the peat attributes, can serve as a baseline study for monitoring environmental and climatic impact on peatlands in the region, as well as for planning restoration activities of disturbed peatlands, thereby underscoring the need for their preservation [
8].
To our knowledge, this is the first study of the Labu peatland, as no previous research has ever been conducted on its ecological, hydrological, or geological aspects. This study specifically aims to interpret the evolution of peat-forming environments in Temburong District. By integrating existing research on Brunei’s peatlands with current studies on SEA’s palaeoenvironmental evolution, this research seeks to provide insights into the palaeoclimatic and palaeoenvironmental conditions of northern Borneo during the Middle to Late Holocene. The studied peatland is relatively pristine, located on the coastal lowlands, and acts as a valuable archive of the regional environmental changes. The findings aim to contribute to filling existing research gaps and to provide valuable information for conservation strategies and the enhancement of our understanding of tropical peatland ecosystems within SEA, one of the most significant regions for biodiversity and carbon storage globally.
2. Study Area
Brunei Darussalam, located on the northwest coast of Borneo (
Figure 1), experiences two distinct climatic seasons: dry and wet. Temperatures range from 23.2 to 31.0 °C, with annual rainfall averaging approximately 3,000 mm [
19]. Its geological setting is dominated by three deltaic systems: the Meligan Delta, which includes the Meligan Formation (Middle Oligocene to Early Miocene), the Champion Delta, comprising the Setap Shale, as well as the Belait, Lambir, Miri, and Seria Formations (spanning from Middle to Late Miocene or Pliocene), and the Baram Delta, active since the Late Miocene and possibly as early as the Middle Miocene [
20,
21]. In the region of Temburong, the oldest Meligan Formation is unconformably overlain by the Setap Shale (Oligocene to Middle Miocene) and Belait Formations (Early to Late Miocene). The Belait Formation exhibits lateral transitions to the Setap Shale. The Lambir, Miri and Seria Formations do not outcrop in the study area. The sedimentary sequences produced by these deltaic systems frequently exhibit facies variations characterised by alternations of sandstone and claystone [
22,
23,
24]. Quaternary alluvial sediments unconformably overlie the older formations.
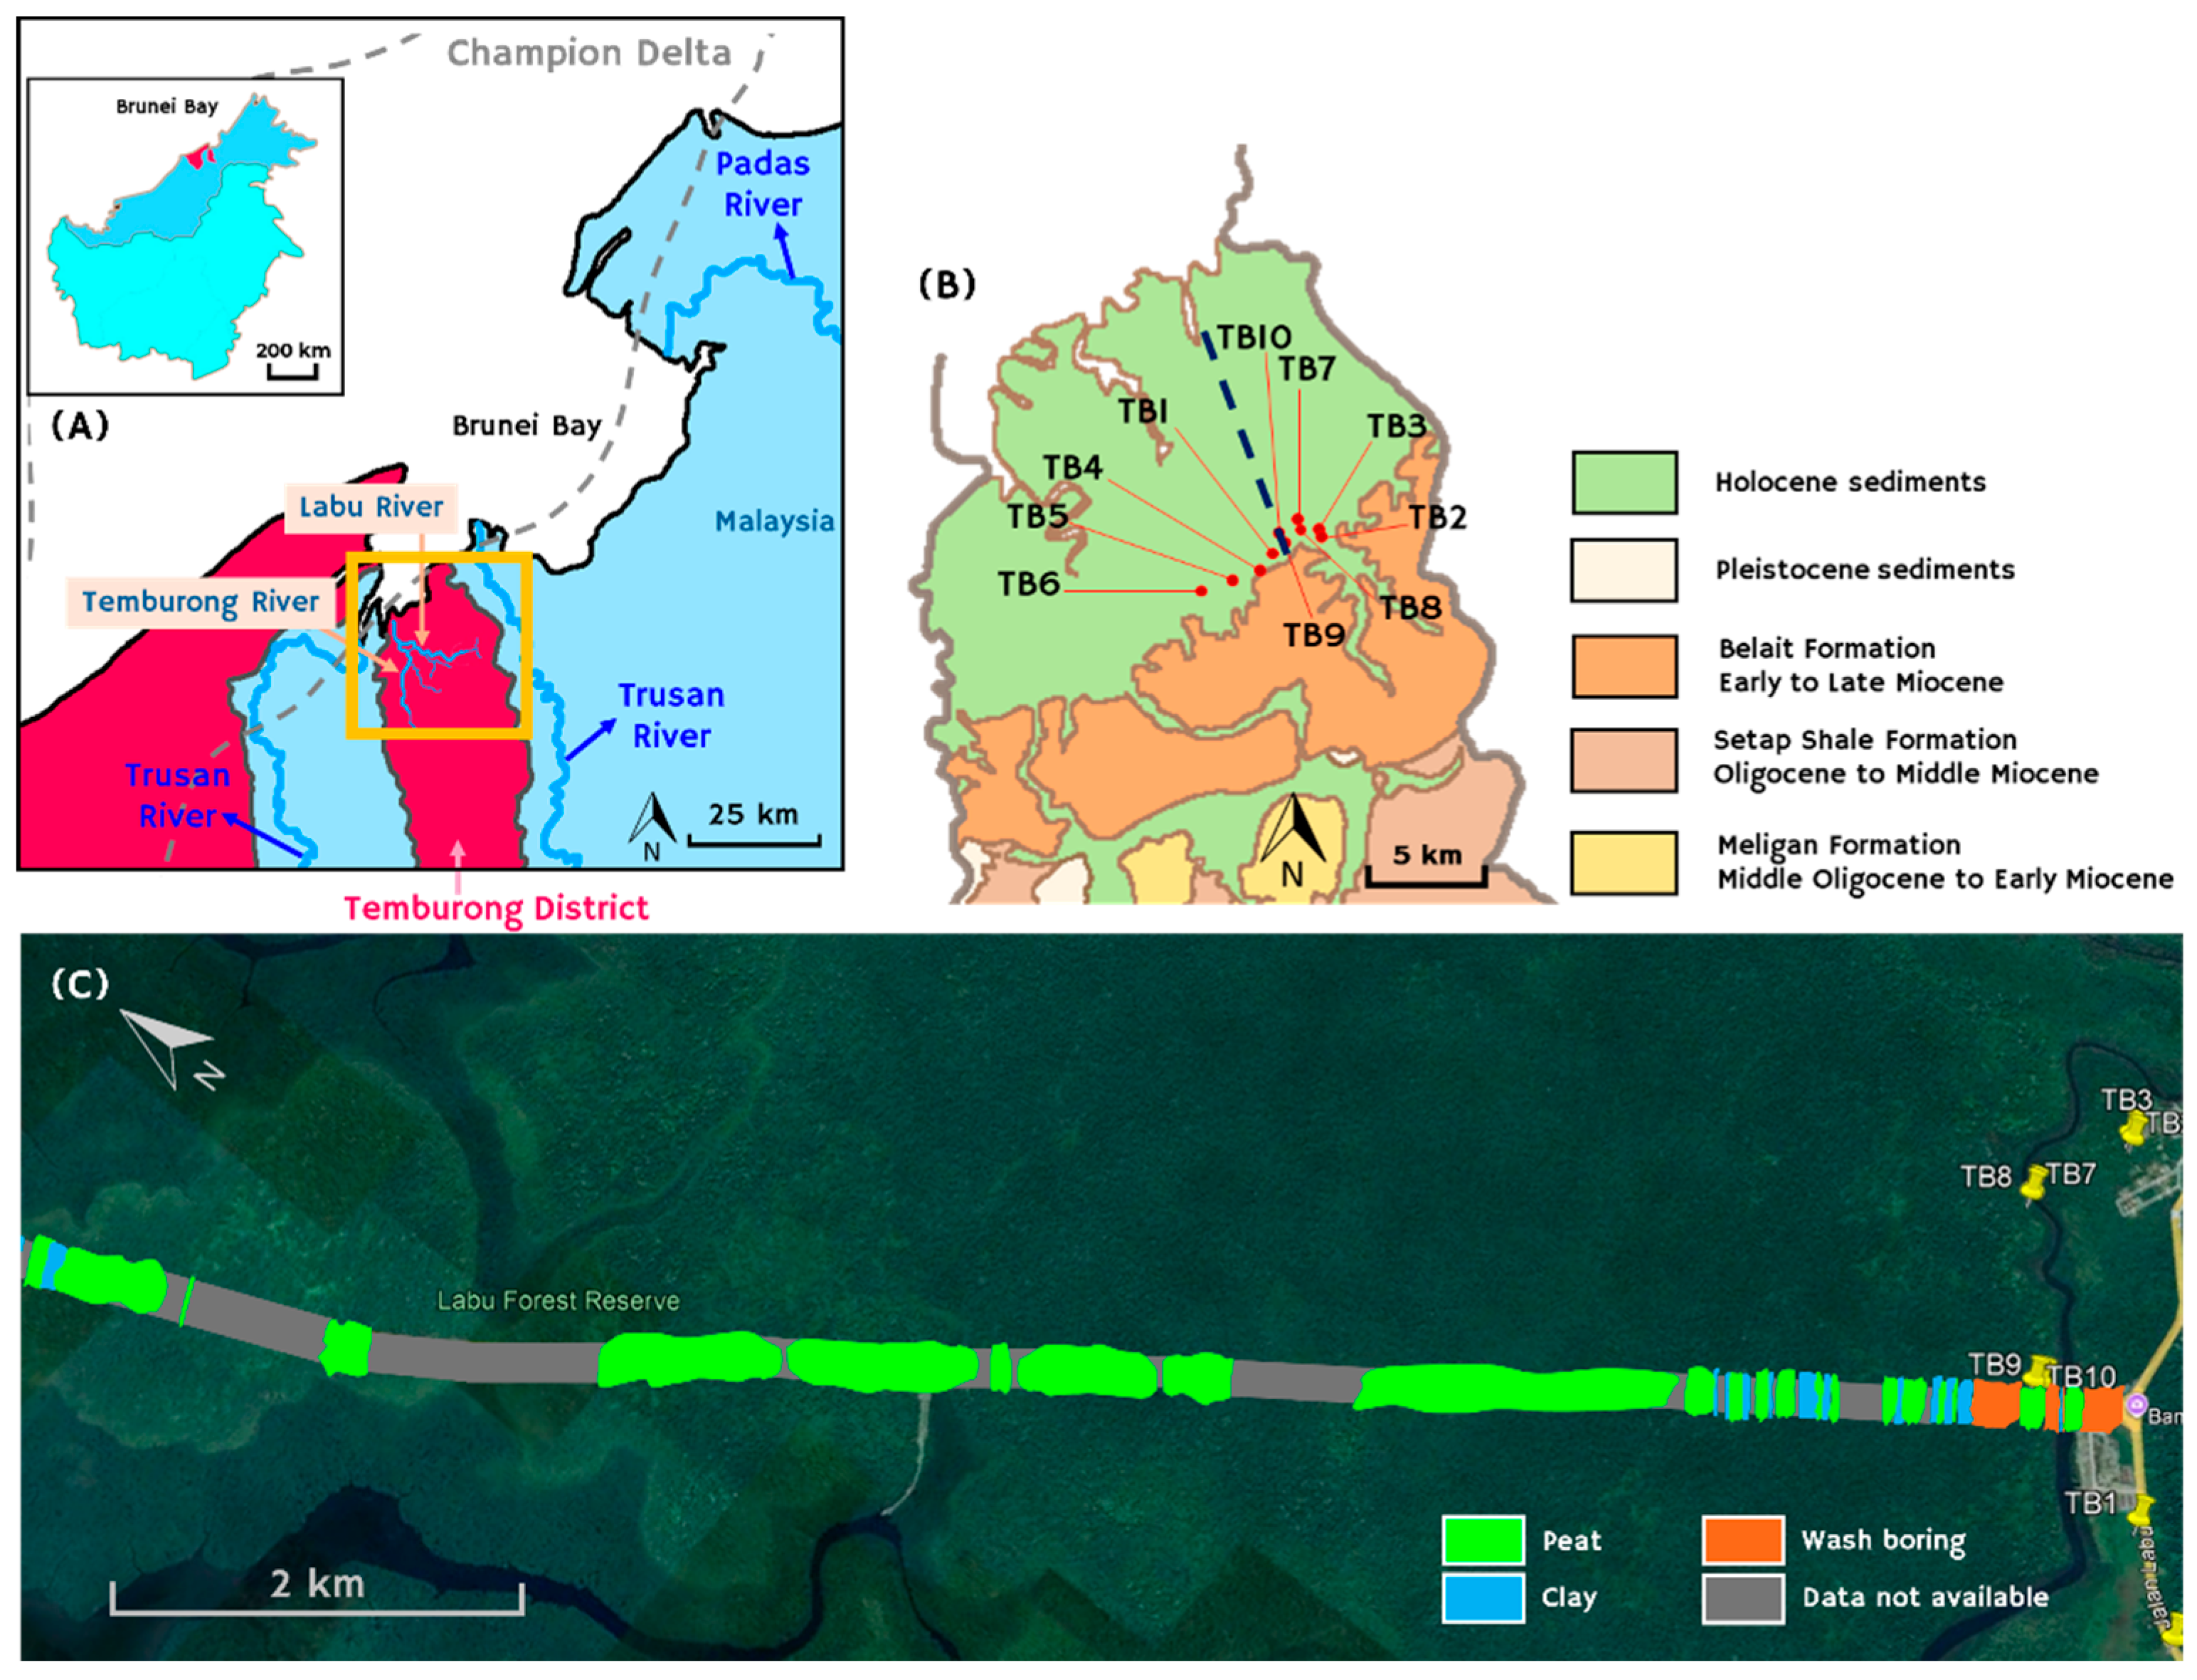
The Labu Peatland is situated in the coastal lowlands of Temburong District, in the vicinity of the Sultan Haji Omar ‘Ali Saifuddien (SOAS) Bridge and is underlain by Holocene sediments (
Figure 1). It is bounded and presumably influenced by the modern Limbang, Temburong and Trusan Rivers, which together with the Padas River supply the Brunei Bay with sediments (
Figure 1A). The Brunei Bay has been tectonically shaped by the eponymous strike slip fault [
25].
3. Material and Methods
3.1. Sample Collection
Ten boreholes were drilled in the Temburong lowland area using an Eijkelkamp hand-driven (Russian-type) peat sampler, reaching a maximum depth of 550 cm under the surface in order to obtain an initial lithological logging (
Figure 1B,
Table 1; see also Supplementary Appendix). The cores were logged at the site based on their macroscopic features, and the peat humification degree (hg) following the Von Post squeeze technique [
27]. A total of 37 samples (11 peat, 17 organic-rich, and 9 inorganic) from five cores, were collected; the selection of sampling cores was based to cover the overall identified lithological successions (
Table 1). Two samples were also collected (TB5 123-133 cm and TB10 69-78 cm) for dating purposes. These samples (10 and 9 cm thick, respectively) were sliced directly from the core and subsequently stored at the Mineralogy, Petrology, and Geochemistry (MPG) Laboratory at the Faculty of Science, Universiti Brunei Darussalam (UBD).
3.2. Proximate and Ultimate Analyses
All the collected peat samples were air-dried, and the initial moisture was determined by weighing until a constant weight was achieved. The hygroscopic moisture was determined by weighing 1 g of the air-dried sample before and after oven-drying at 105 °C for 24 hours until a stable weight was reached (ASTM D3173/D3173M-17a [
28]).
Ash yield was determined on the dry samples using a Carbolite AAF 12/18 ashing furnace at 550 ± 3 °C for four hours (ASTM D2974-20E1 [
29]). Ash yield is primarily used to define and classify lithologies, although no global consensus exists on the precise limits (e.g., [
30]). In this paper, peat is defined as having less than 50 wt.% ash yield on a dry basis (db), following the ECE-UN (Economic Commission for Europe – United Nations) international classification of in-seam coals (Energy/1998/19, Geneva). However, ash yields up to 55 wt.% can also be considered peat, according to the comprehensive study of Wüst et al. [
31], who investigated tropical peatlands. Ash yield values between 55 and 65 wt.% (db) indicate peaty mud, whereas sediments with ash yield between 65% and 80% (db) are classified as clayey mud. Sediments with ash yield values above 80% (db) are considered inorganic.
The carbon (C), hydrogen (H), nitrogen (N), and sulphur (S) contents of 12 organic-matter-rich samples from boreholes TB5, TB6 and TB10, containing the thickest organic sediment layers, were analysed at the Chemistry Laboratory, Faculty of Science, UBD. A mass of 10 ± 0.5 mg of vanadium pentoxide was added to 3 ± 0.5 mg of dry samples and analysed using the FLASH 2000 CHNS-O Analyzer (ASTM D5373-21 [
32]). Results are reported on a dry ash-free basis (wt.%, daf), with oxygen (O) calculated by subtracting the sum of C, H, N, and S from 100%.
3.3. Physical-Chemical Properties
The determination of pH and redox potential (Eh) values was conducted at the MPG Laboratory using a Mettler Toledo multimeter (SevenExcellence S470) in accordance with ISO 10390:2021 [
33] and ISO 11271:2022 [
34]. Following this, the solutions were filtered using G2 filter paper, and their electrical conductivity (EC) was measured.
3.4. Geochemical Analysis
Geochemical analysis was performed on selected oven-dried samples at Activation Laboratories (Actlabs) in Ontario, Canada. The samples underwent Aqua Regia digestion and were analysed using a Perkin Elmer Sciex ELAN 6000 inductively coupled plasma-mass spectrometer (ICP-MS). Calibration was conducted using natural and synthetic international standards, with an error margin of less than 10-20%.
3.5. Mineralogical Determination
The mineralogical composition of the inorganic samples was determined using X-ray diffraction with a Shimadzu MAXima-X XRD-7000 diffractometer, employing Ni-filtered CuKα radiation at 40 kV and 30 mA, at the Centre for Advanced Material and Energy Studies (CAMES), UBD. The samples were scanned over a 2-70 ° 2θ interval, with a scanning rate of 5 °/min and an angle step size of 0.02 °. Interpretation of the diffractograms and identification of minerals were performed using Match! V. 4× software.
3.6. Radiocarbon Dating
Humic acids and plant remains in the samples were separated at the Laboratory of Archaeometry, Institute of Nanoscience and Nanotechnology, NSR ‘Demokritos’, Greece, for
14C radiocarbon dating analysis, using the radiometric Gas Proportional Counting technique. This method involves converting the sample into CO
2 and measuring the radioactivity in cylindrical gas proportional counters, which detect beta particles emitted during the decay of
14C atoms. Calibrated dates were determined with the program OxCal v.4.4.4 [
35], and the IntCal2020 calibration curve [
36].
3.7. Micropalaeontological and Palynological Examinations
Micropalaeontological analysis specifically on foraminifera examination was carried out on inorganic substrates from the TB6 core (490-520 cm depth) in the Palaeontology Laboratory at Geosciences, UBD. At the laboratory, samples were wet sieved through a 425 μm mesh size and residues were transferred onto a metal tray for examination under a Raxvision microscope at 2× to 4× magnifications [
37].
In addition, a preliminary palynological assessment was performed on one profile to confirm the general palaeoenvironment of the Labu Basin. For this analysis, 10 g of sample from the inorganic substrate of TB4 core (40-70 cm depth) was processed for palynomorph extraction. The sample was initially treated with 40% diluted hydrofluoric acid and soaked for three days to dissolve silicate minerals. The sample was then boiled in 37% diluted hydrochloric acid for five minutes to remove carbonates and other soluble components, followed by chlorination to eliminate residual organic matter. Acetolysis was subsequently applied to further clean the sample by breaking down residual cellulosic material, thereby facilitating the identification work [
38]. After these treatments, the sample was mounted and examined under a ZEISS Axiolab 5 light microscope at 40× magnification.
4. Results
4.1. Lithological Features
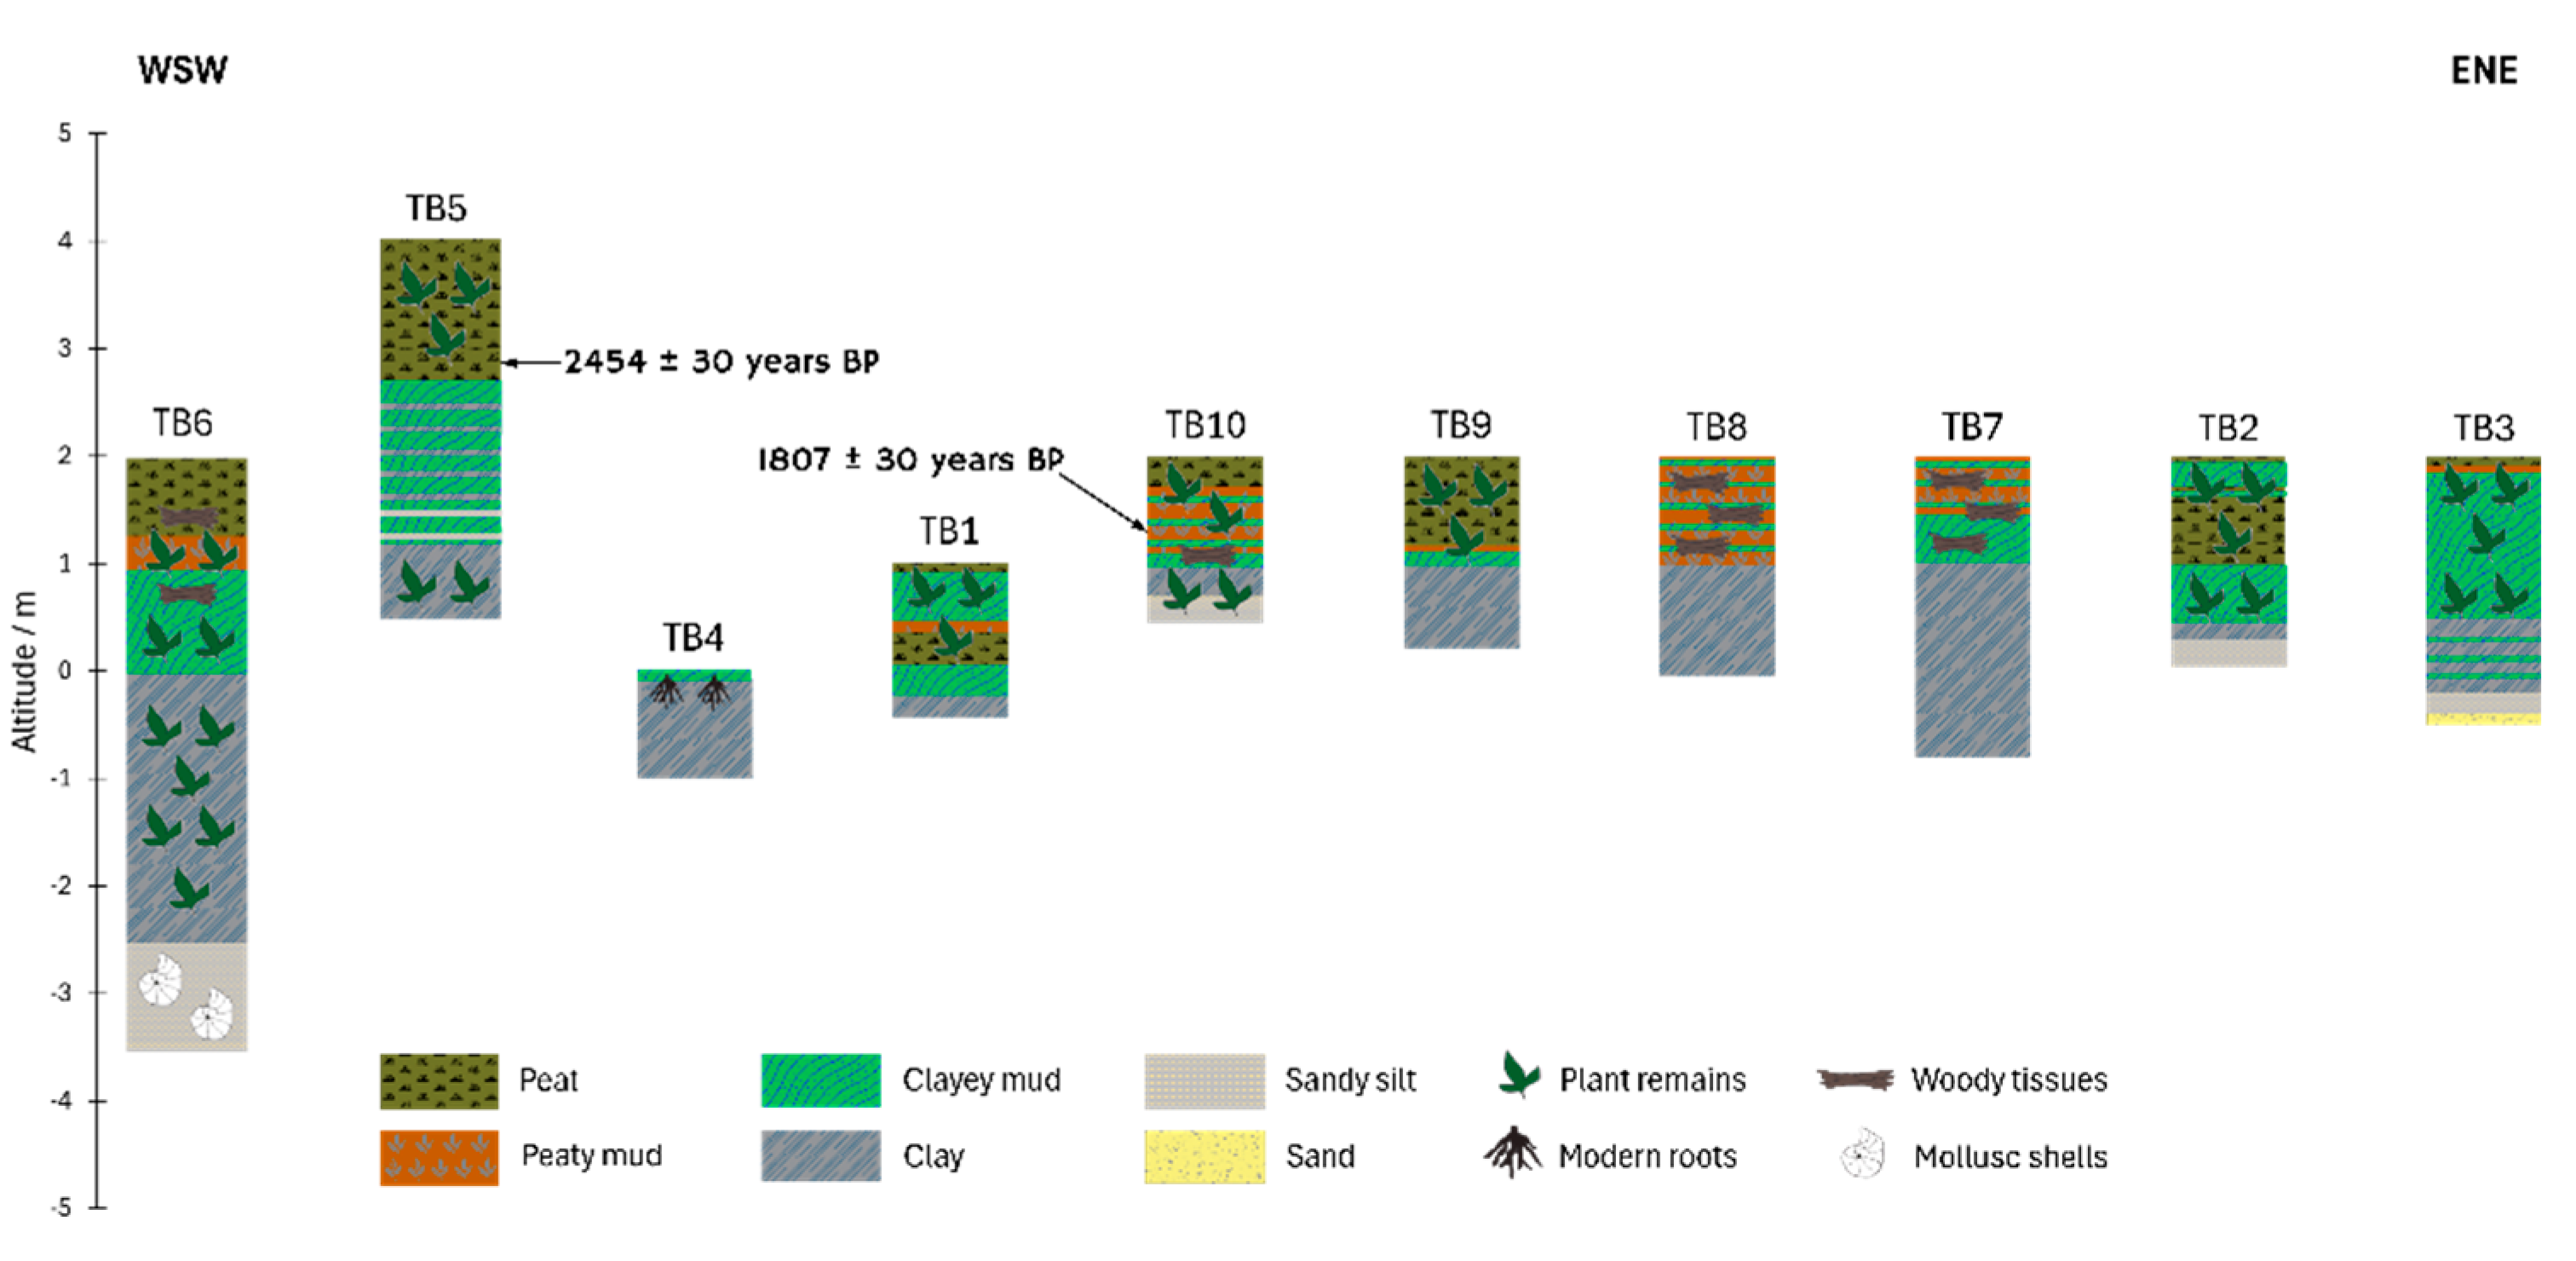
Ten boreholes were drilled along a roughly west-east trending transect near the coastal area of Temburong of low altitudes up to +4 m (
Figure 2). TB6 and TB5, located on the western end of the transect, are the two deepest boreholes, reaching depths of 550 and 350 cm, respectively. Our boreholes along with an extensive network of over 1,000 predrills and more than 100 additional boreholes conducted in the Temburong District during the construction of the SOAS Bridge (
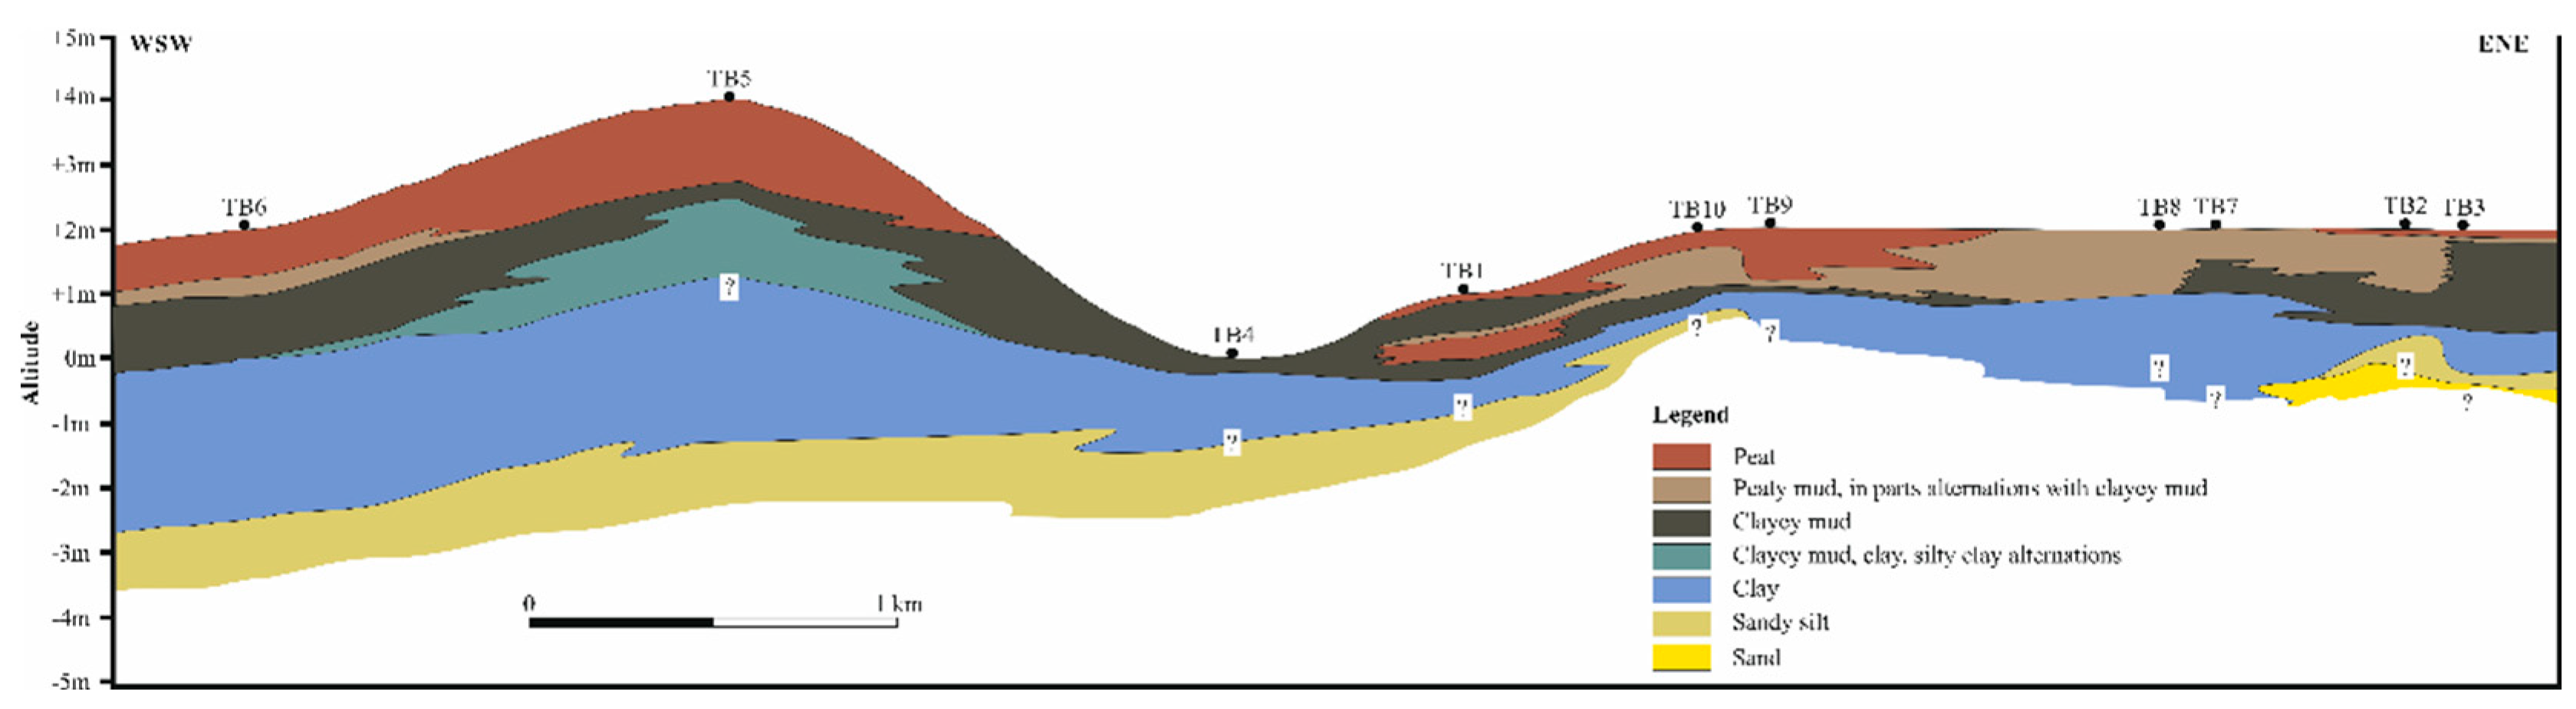
Figure 1C) suggest sporadic occurrences of peat and other carbonaceous sediments (peaty mud, clayey mud) interbedded with inorganic sediment deposits and intercepted by clays (
Table 1 and
Figure 3). Logging data from these boreholes reveal that the Labu Peatland exhibits variable peat thickness, typically ranging from a few centimeters to 2-4 m, with some localities reaching up to 8 m.
The analysed samples revealed peat deposits of varying thicknesses, with a maximum drilled thickness of 133 cm and an overall maximum thickness of organic sediments (including peaty mud, clayey mud) reaching 280 cm in core TB5. The peat shows moderate to high humification degrees ranging from 6 to 7 (
Table 1; for detailed loggings see Supplementary Appendix). Peat thickness generally attenuates towards the east, measuring only 7-10 cm in cores TB2 and TB3. Extensive light to dark grey inorganic sedimentary substrates including alternations of clay, sandy silt and local sand with lateral transitions, dominated by white quartz, underlie the drilled organic sediments. Plant remains, mollusc shells, modern roots, and woody tissues are frequently included throughout all beds of the Labu Basin (
Figure 2). The occurrence of
Shorea albida predominates in the central and eastern parts of the transect, while the areas to the north of it are also largely dominated by Shorea albida but remain mostly inaccessible. In contrast, the western region (TB5, TB6) is characterised by the presence of Cyperaceae, primarily
Cyperus platystylis and other
Cyperus species.
4.2. Physical-Chemical Properties and Proximate Analyses
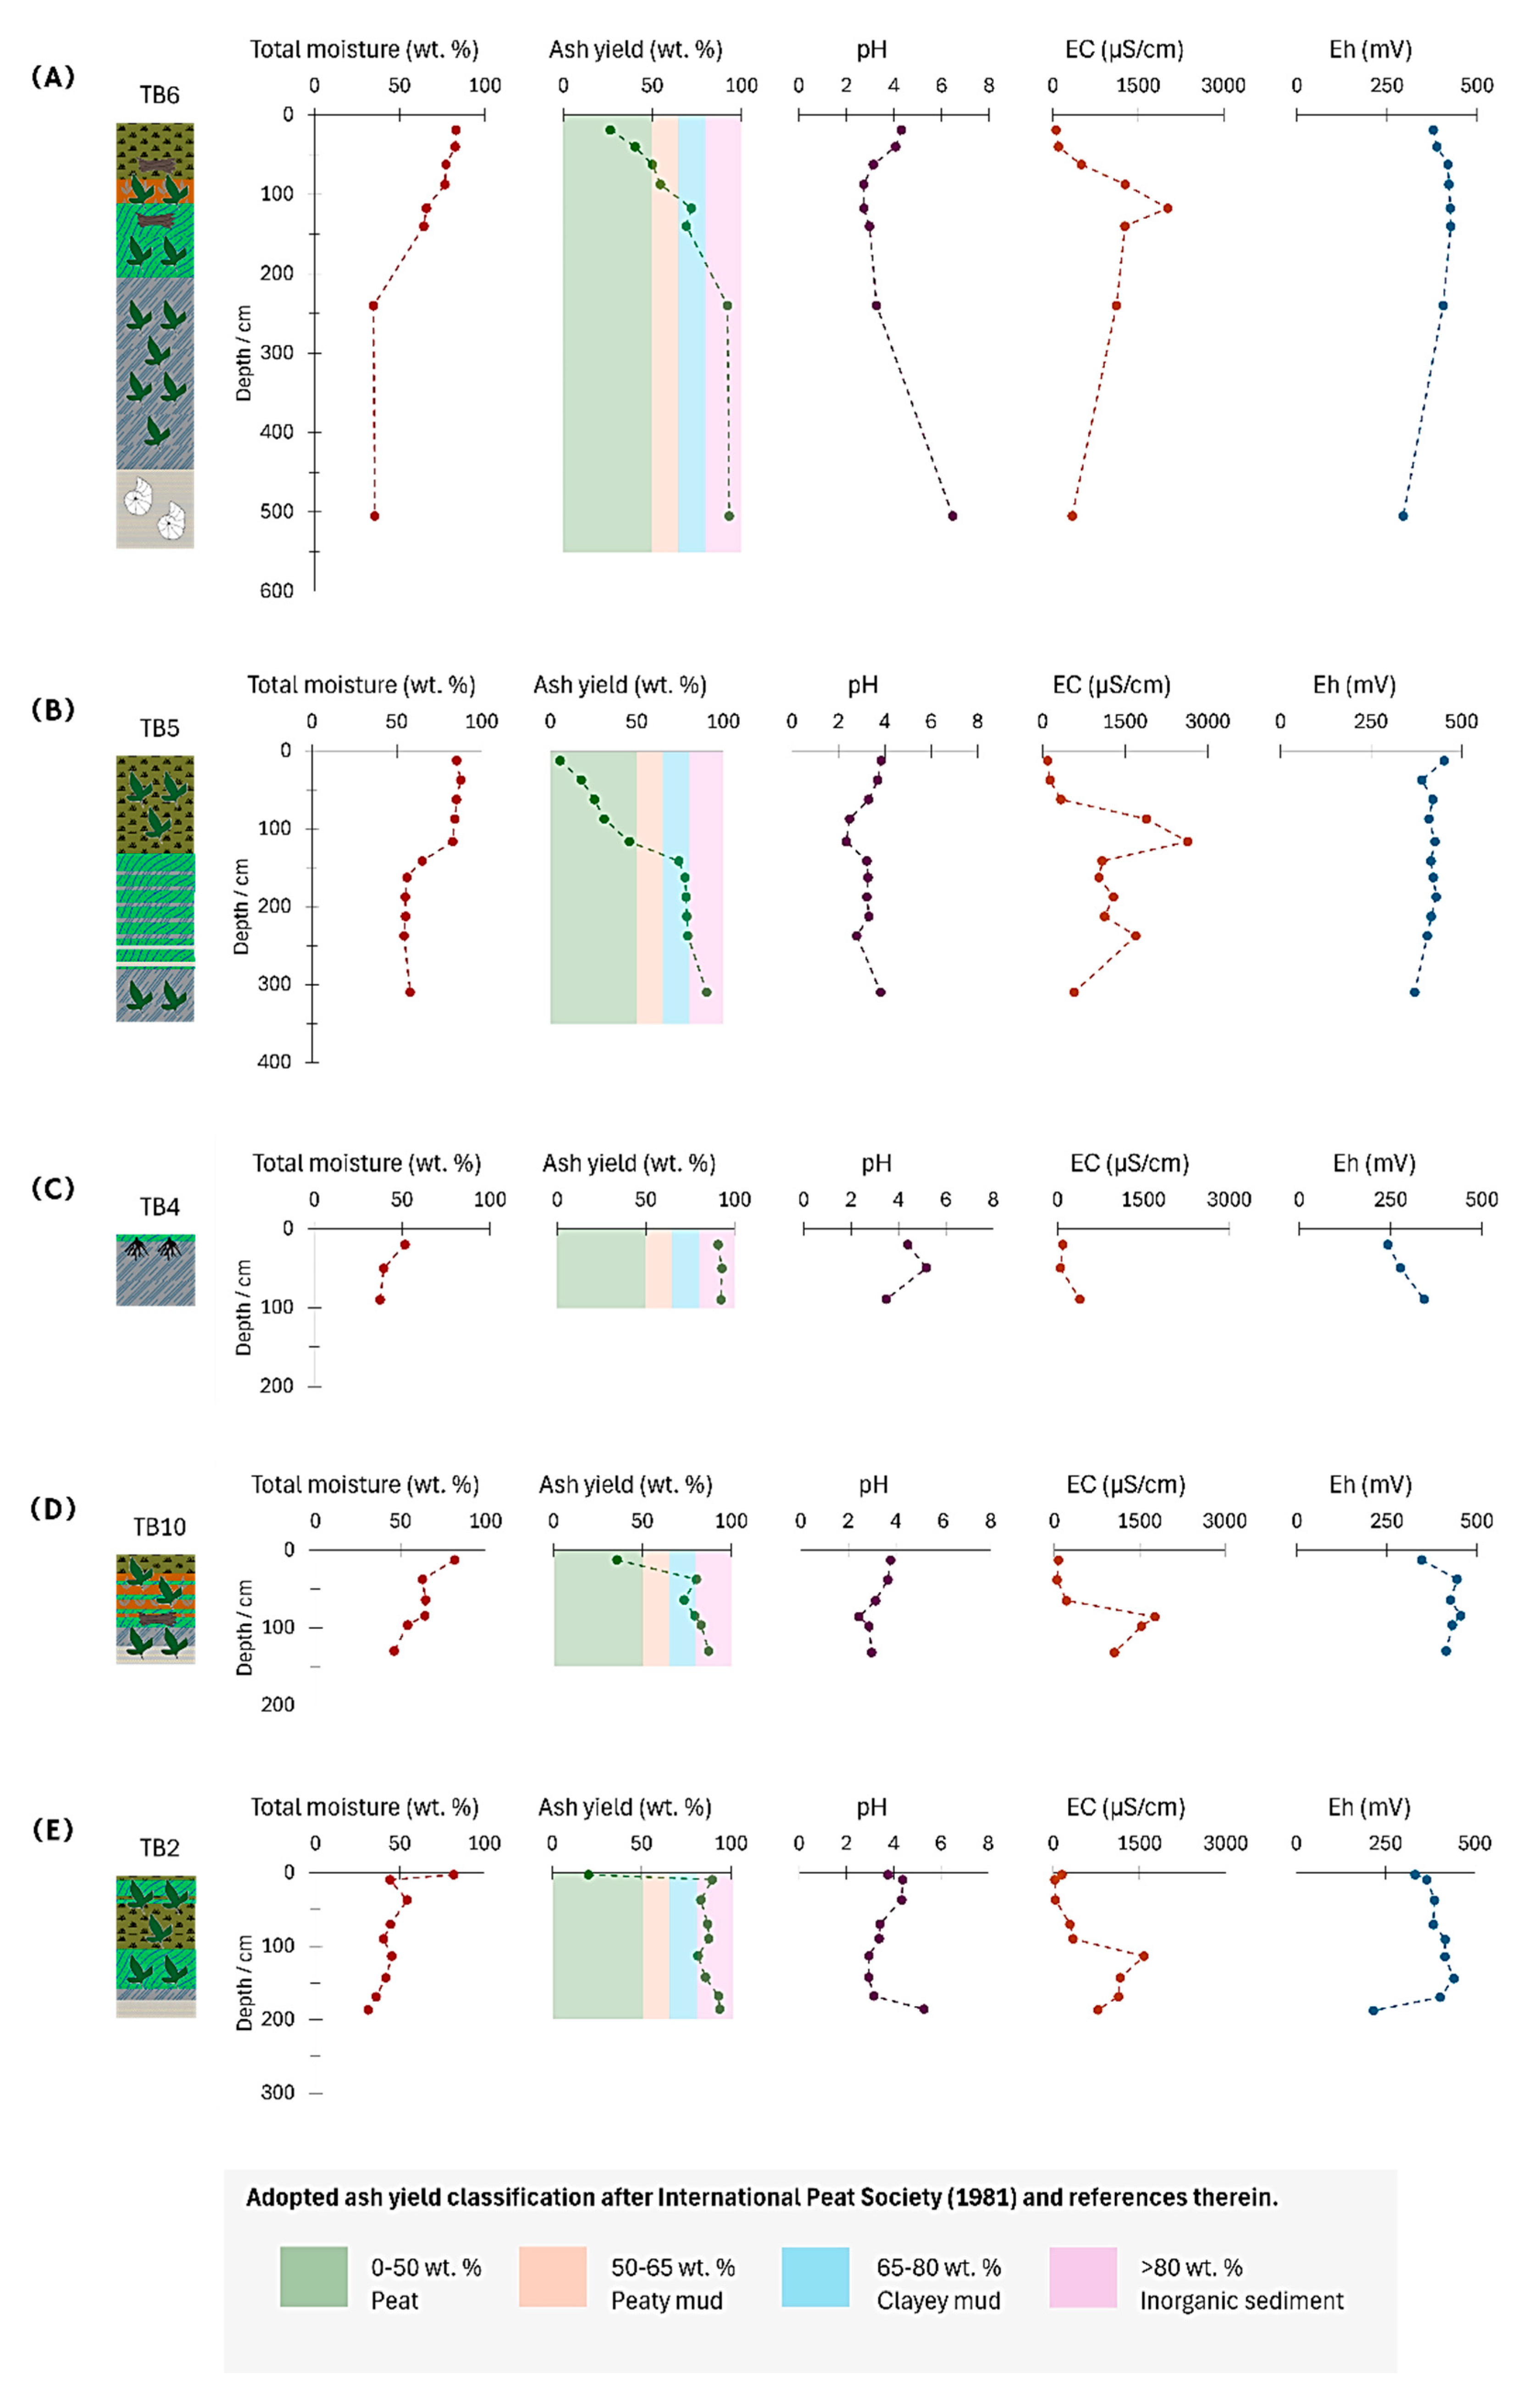
Moisture and ash yield are clear indicators of organic sediment characteristics and the relevant properties of the analysed samples are listed in
Table 1. The peat moisture ranges from 76.6 to 87. 7 wt.%, decreasing in the carbonaceous sediments (40.7-65.6 wt.%) and reaching minimum values in the inorganic substrates (31.3-57.8 wt.%;
Figure 4). Ash yield of the peat (< 50 wt.%, db) generally decreases upwards, with its lowest values recorded at the top of cores TB6, TB5 and TB2 cores (26.3, 5.7 and 20.3 wt.%, respectively) indicating an upward increase of organic matter within the Labu peat deposits (
Figure 4). The pH values are acidic with slight variations (TB6: 2.7-6.5; TB5: 2.3-3.8; TB4: 3.5-5.3; TB10: 2.5-3.8; TB2: 3.0-5.3), consistent with typical tropical peatland pH values in SEA (3-4; [
39]). All cores show their most acidic values roughly between 50 and 150 cm depth, with slightly higher values towards the surface of the cores (
Figure 4).
Electrical conductivity varies notably across boreholes. In TB6, EC values rise from 342 μS/cm at the substrate to 1267 μS/cm at a depth of 140 cm, peaking at 2019 μS/cm at a depth of 118 cm. It then decreases significantly in the overlying peat layer, from 499 μS/cm at 63 cm to 58 μS/cm at the surface (
Figure 4A,
Table 1). A similar trend is observed in TB5, where EC rises from 575 μS/cm at the inorganic substrate to 1693 μS/cm at 238 cm, peaking at 2630 μS/cm at 117 cm depth, followed by a gradual decline toward the surface (
Figure 4B). In TB10, EC increases to 1530.2 μS/cm at 97 cm, peaks at 1766.0 μS/cm at 85 cm, and then drops to 72.3 μS/cm in the uppermost peat layer (
Figure 4D). Similarly, TB2 shows a peak EC of 1577.6 μS/cm at 114 cm, decreasing to 149.9 μS/cm in the overlying peat layer (
Figure 4E). These EC peaks coincide with the lowest pH values in all cores. Redox potential varies minimally (216.3-454.8 mV), indicating mildly reducing to mildly oxidising conditions throughout the profiles.
4.3. Geochemical Results
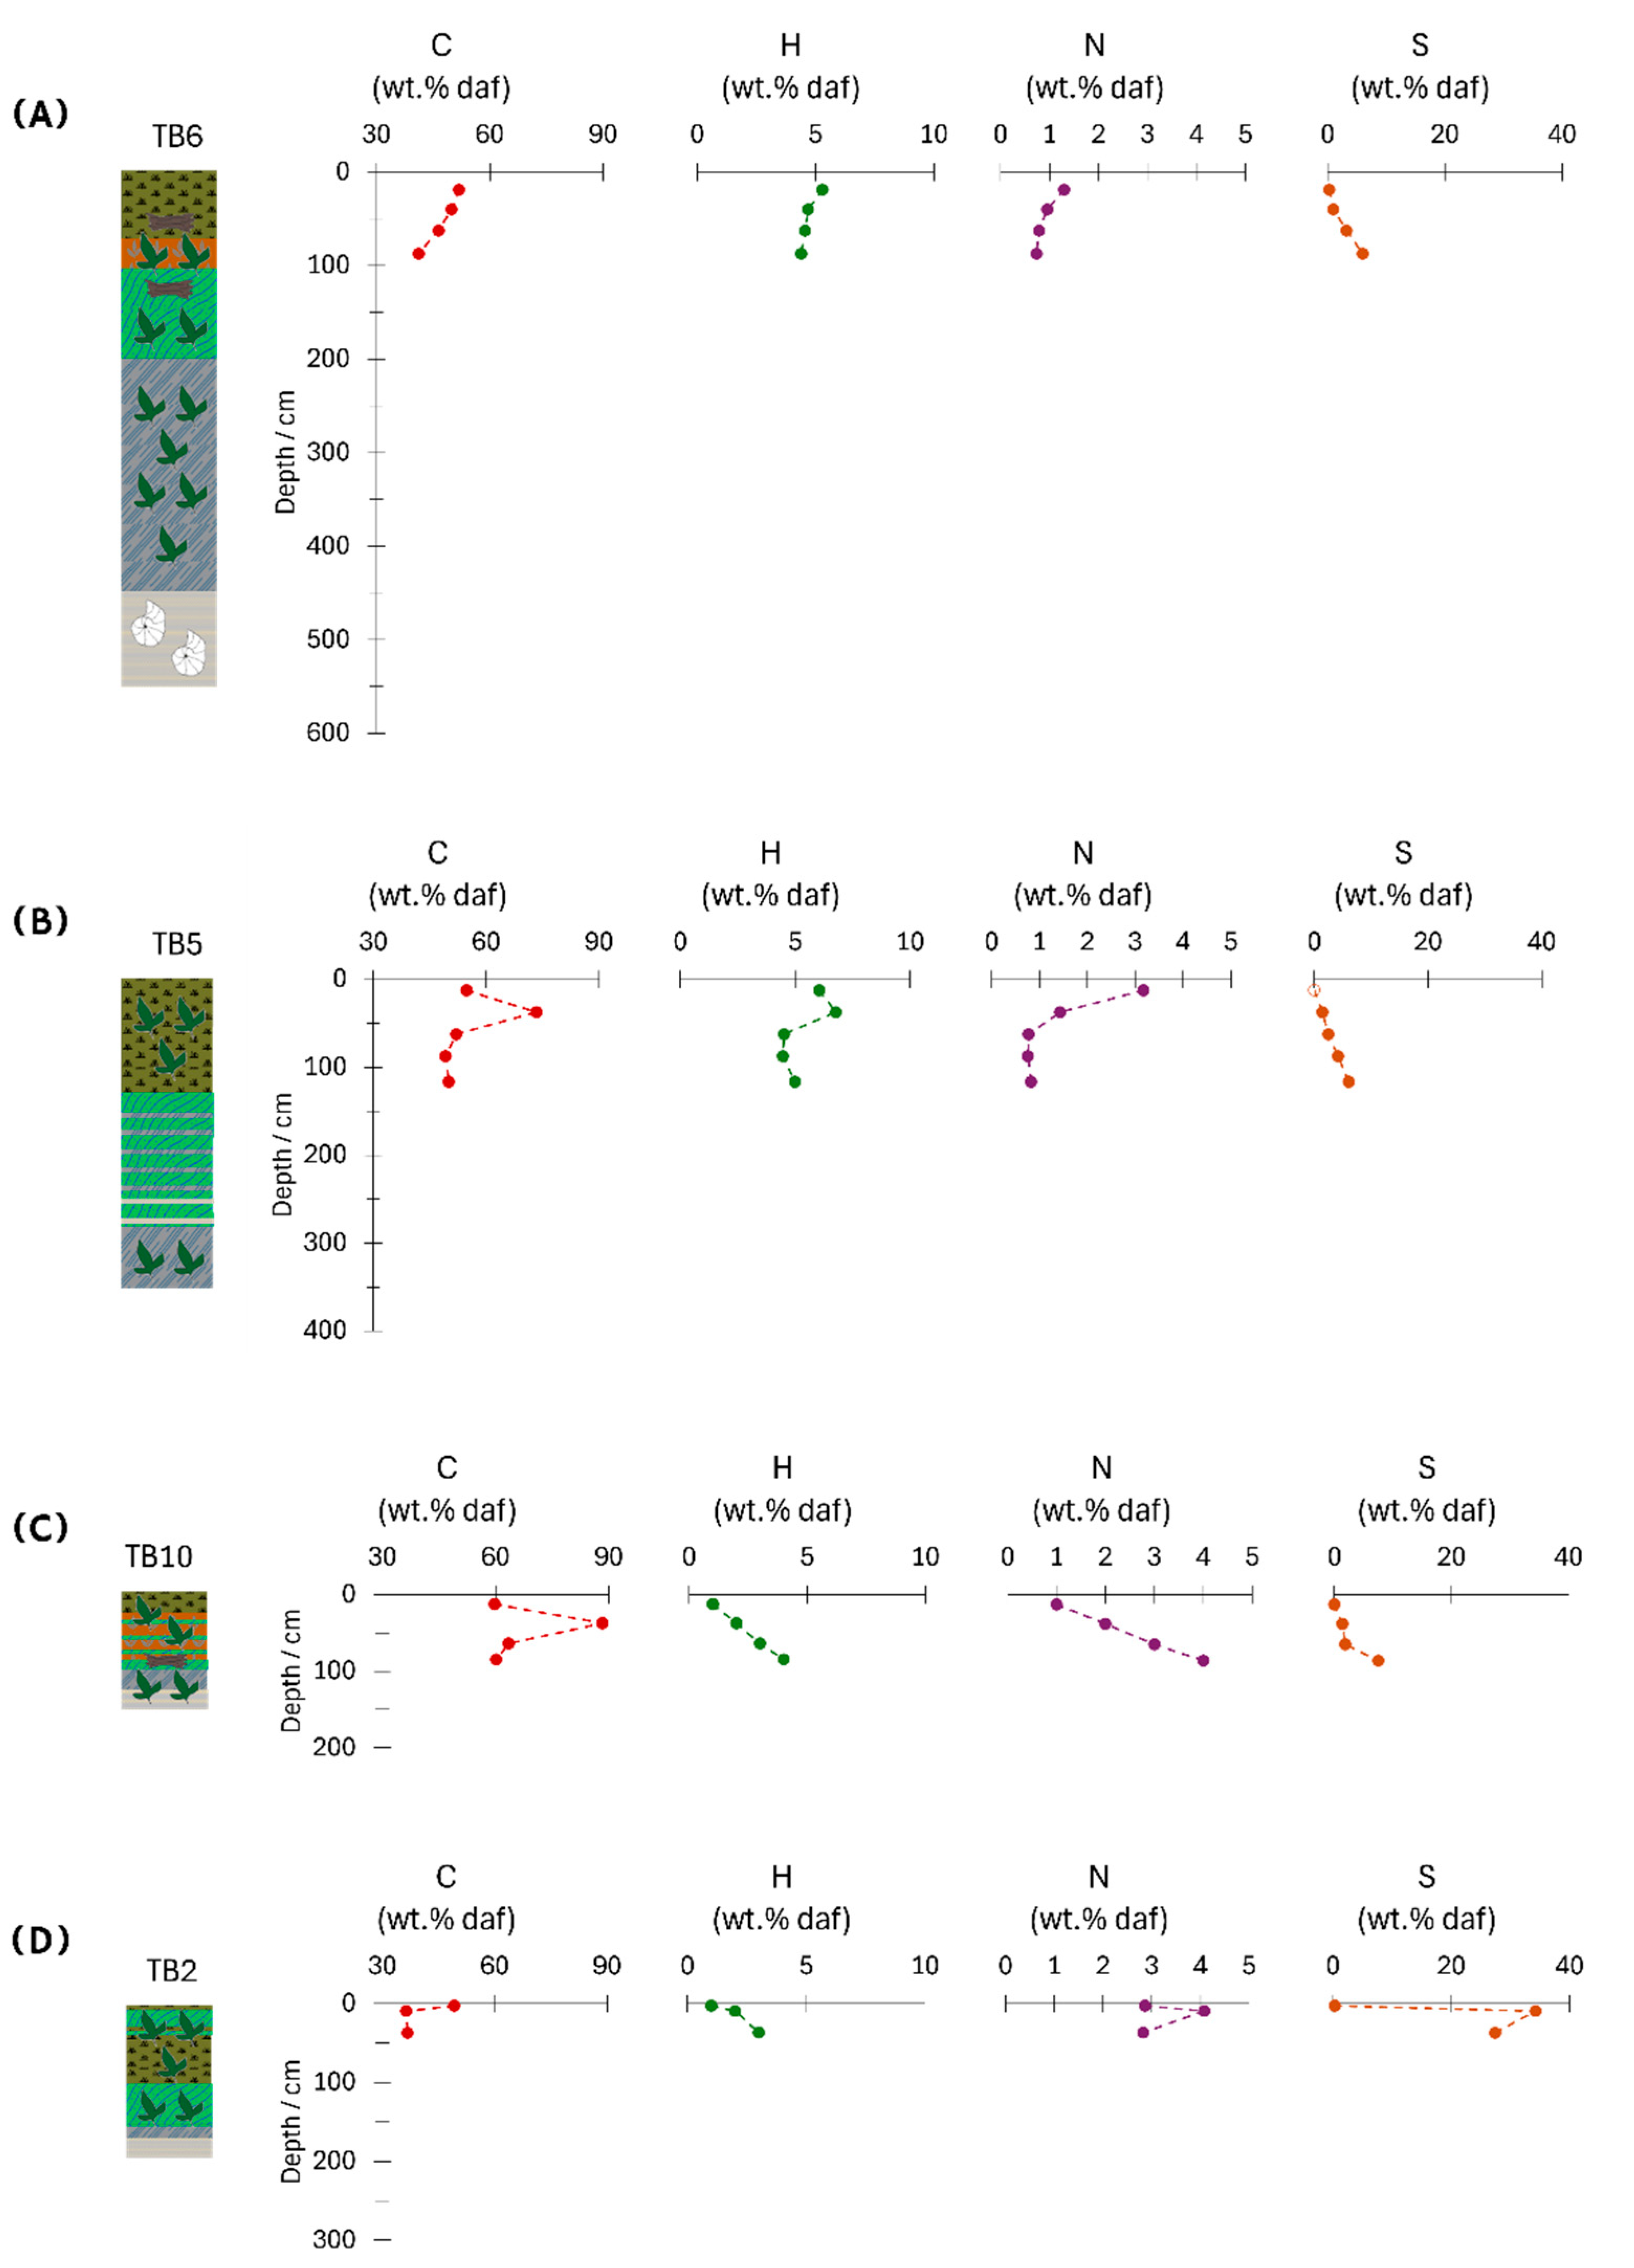
Determination of C, H, N, S contents was conducted on the thickest peat layers of cores TB5 and TB6 (
Figure 5,
Table 2). In TB6, carbon and hydrogen range from 41.2 to 51.8 wt.% and from 4.4 to 5.3 wt.%, respectively (dry, ash-free basis). Core TB5 shows similar ranges: 51.0-61.2 wt.% C and 4.5-6.7 wt.% H (dry, ash-free basis). Nitrogen and sulphur contents show comparable trends in both cores: N increases from 0.7 to 1.3 wt.% in TB6 and from 0.5 to 2.5 wt.% in TB5, while S decreases towards the surface (from 6.0 wt.% to 0.3 wt.% in TB6 and from 6.4 wt.% to 0.4 wt.% in TB5). Higher S concentrations are associated with elevated EC values (compare
Figure 4 and
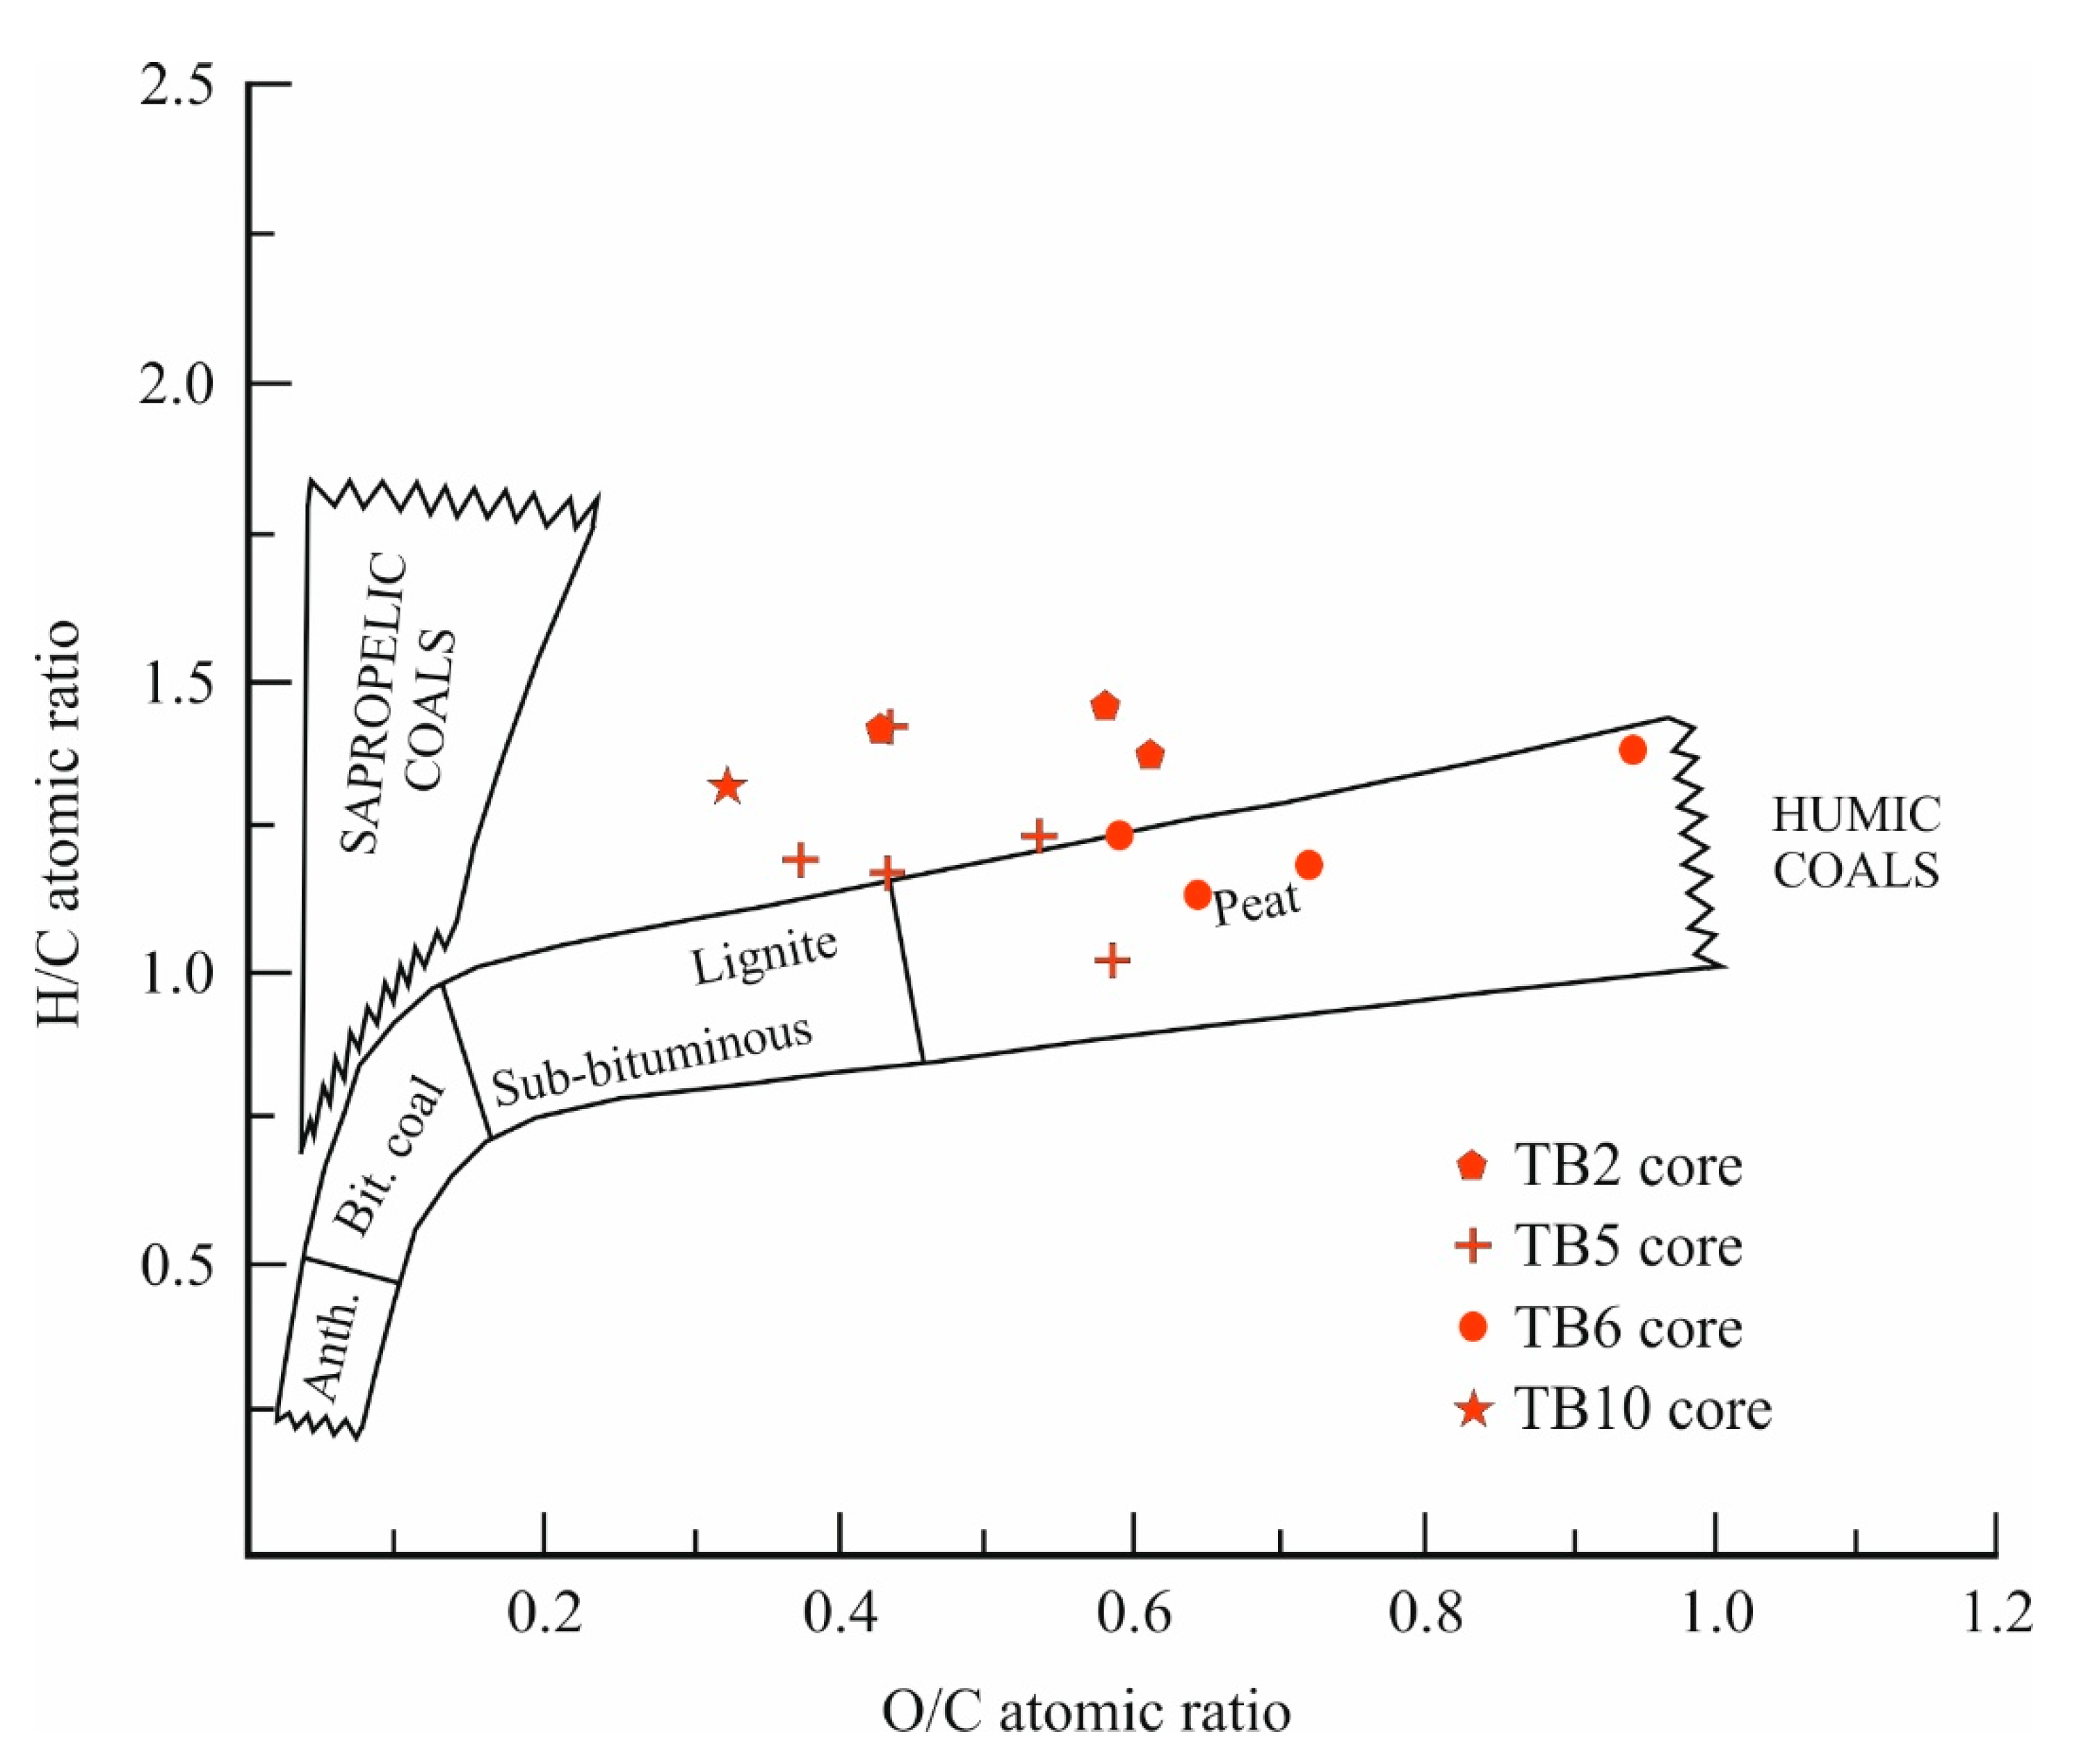
Figure 5), suggesting a link to pyrite formation. The H/C and O/C ratios of the peat samples from four cores, plotted on a Van Krevelen diagram [
40], indicate consistency with peat characteristics and suggest a transition towards more recalcitrant organic matter (
Figure 6).
Trace element bulk geochemical analyses were conducted on peat samples from the 100-133 cm interval of core TB5 (highest EC = 2630.0 μS/cm) and the surface sample (0-25 cm; EC = 92.9 μS/cm) for comparison. The surface sample contains lower amounts of As, B, Cd, Co, Cr, Cu, Mg, Mo, Na, Ni, Pb, Sb, U, V, Y, and Zn than the deeper sample (
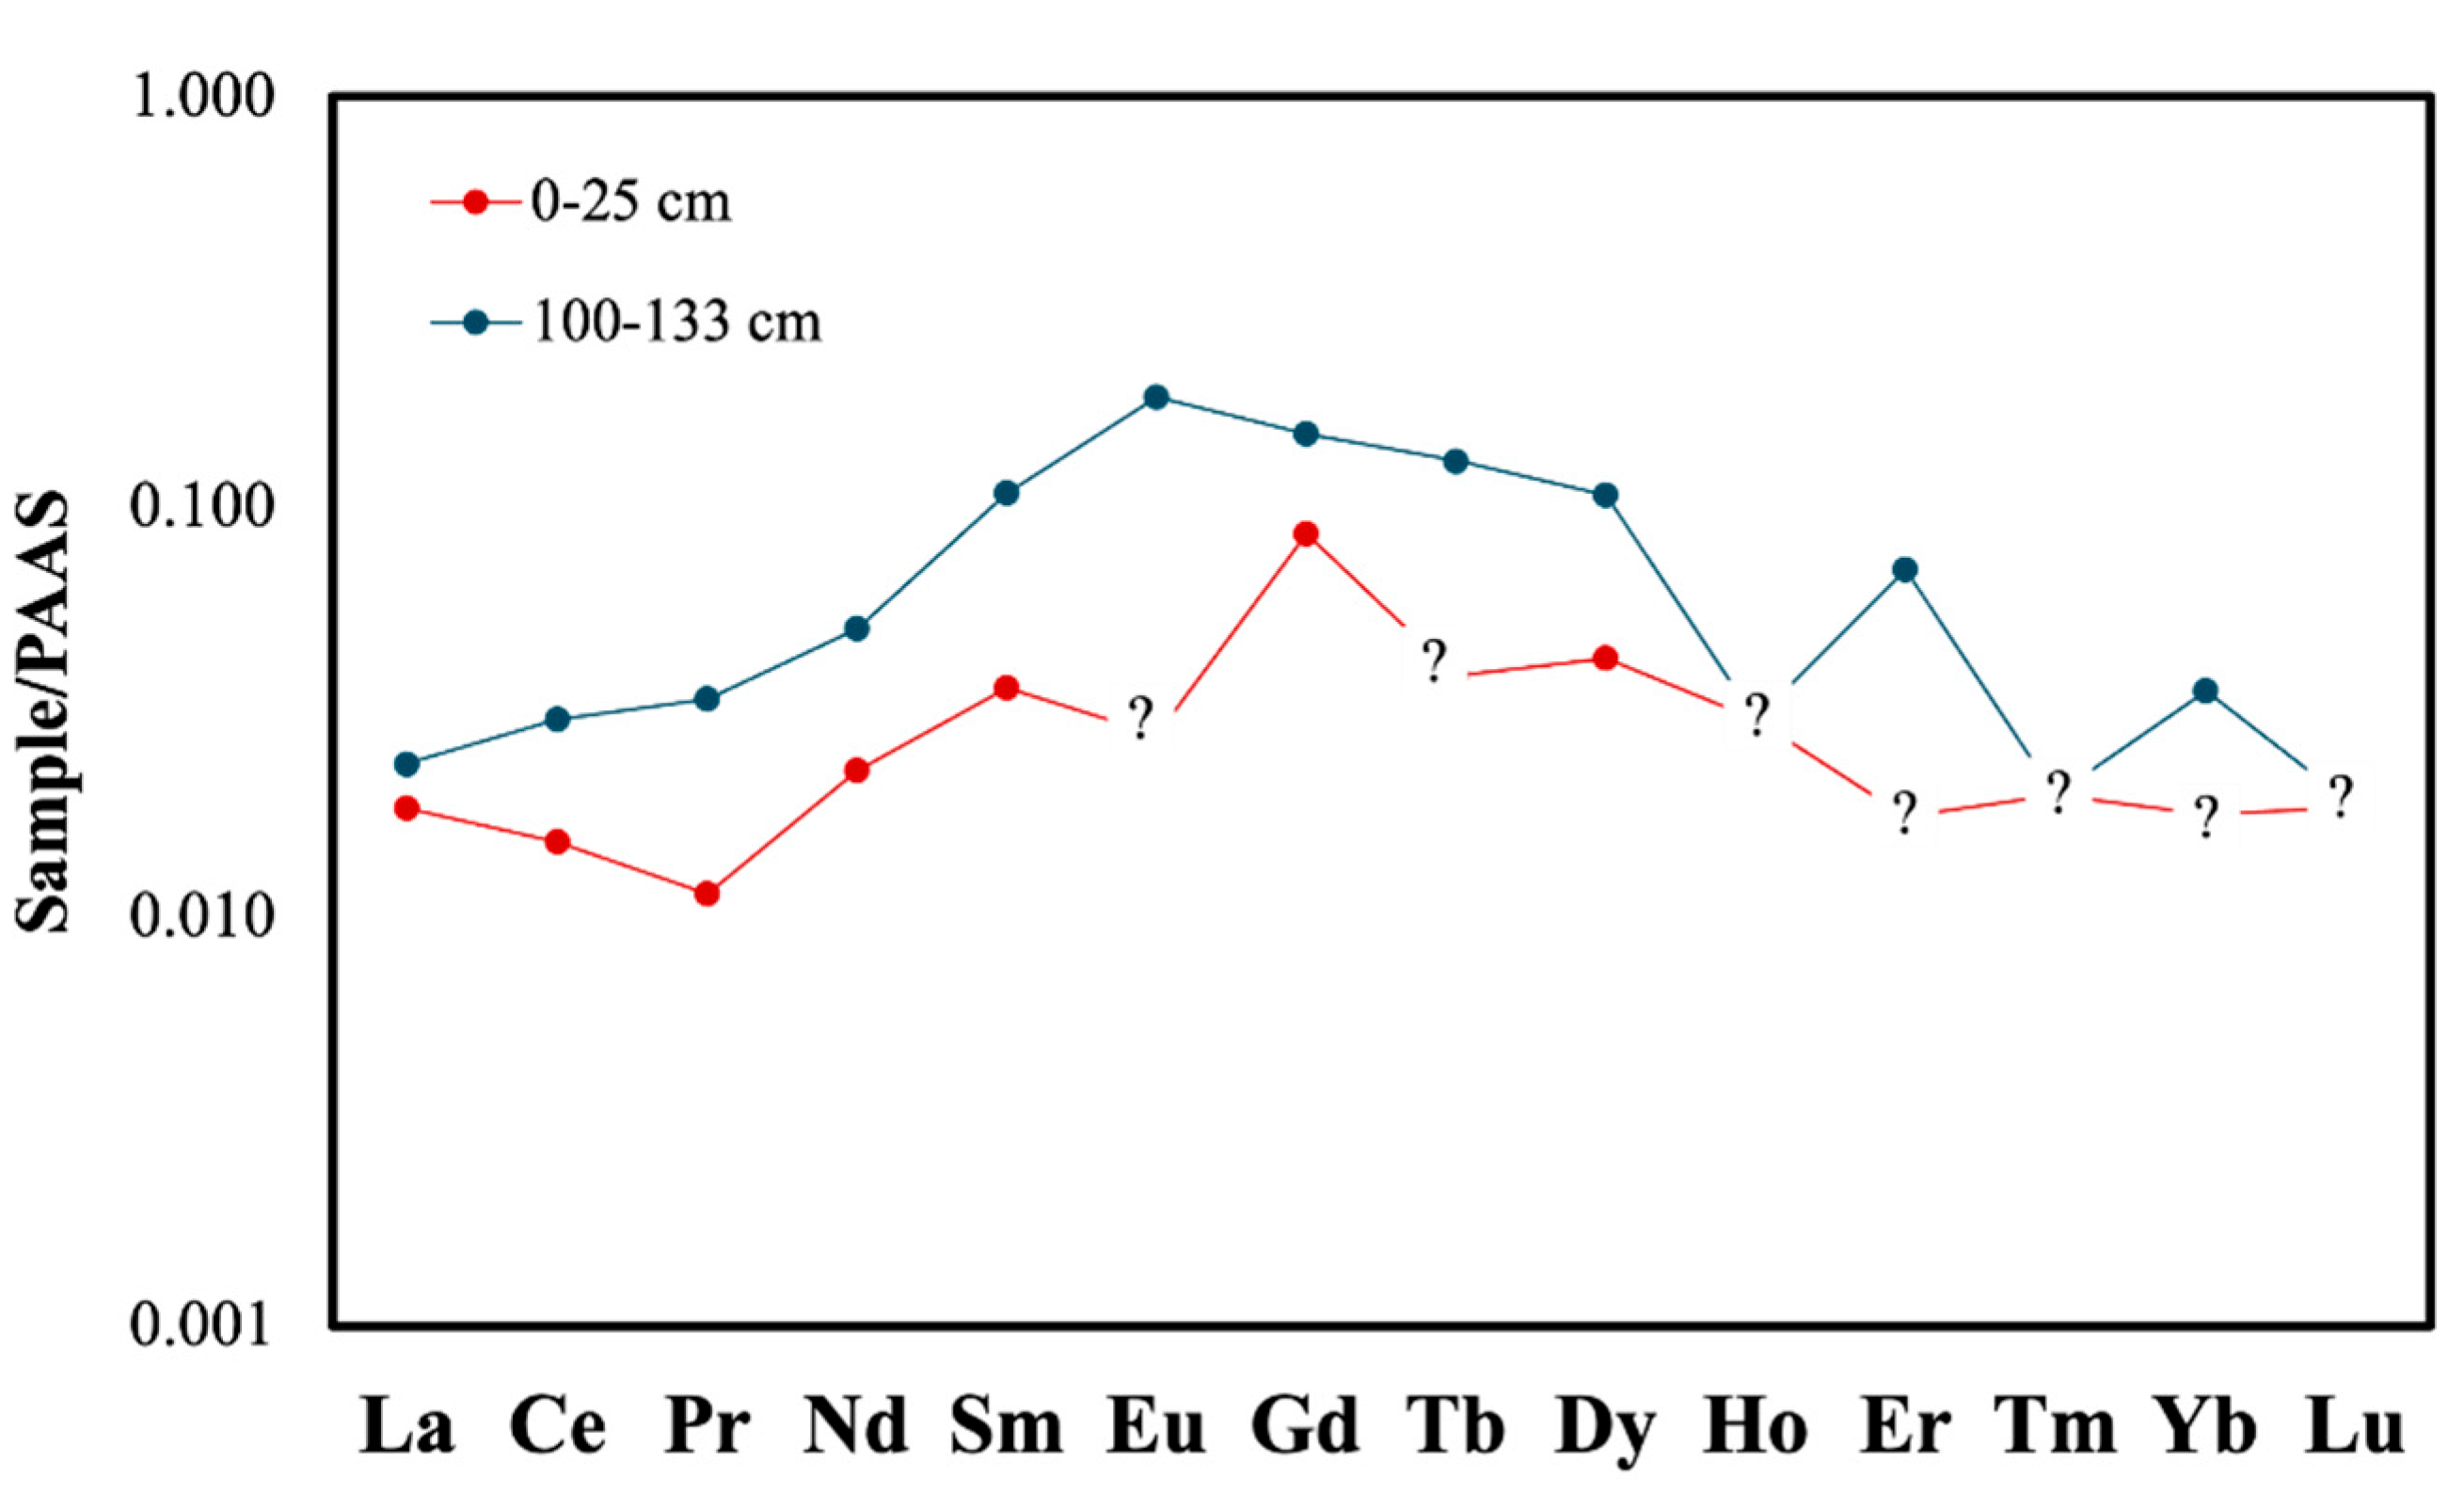
Table 3). The Post-Archean Australian Shale (PAAS)-normalised rare earth element (REE) pattern of the 100-133 cm sample is richer in total REE compared to the 0-25 cm sample. Both specimens demonstrate bell-shaped normalised patterns with middle REE (MREE) enrichments (
Figure 7). Such patterns are typically observed in peaty or organic-rich sediments [
41,
42,
43] or phosphate-rich deposits [
44,
45]. X-ray diffractograms reveal no evidence of phosphatic minerals, indicating that the REE signatures in both the 0-25 cm and 100-133 cm specimens are primarily governed by their organic matter, which stronger complexes MREE and forms highly stable organic complexes [
41,
42,
43].
4.4. Mineralogical Composition
Mineralogical determinations were performed on six substrate samples from various depths in cores TB5, TB4, and TB2 (
Table 4). Quartz is the dominant mineral phase, with subordinate muscovite and illite present in all carbonaceous and substrate sediments of the Labu Basin. Pyrite was identified in the clayey mud from TB5 and TB2, particularly in samples with elevated EC values. Mineral phases are consistent across cores and ages, indicating stability from past to present.
4.5. Radiocarbon Dating
Radiometric results from two samples, one from TB5 (123-133 cm) and one from TB10 (69-78 cm), are detailed in
Table 5. The TB5 sample, from the lowest peat layer, yielded an age of 2,534 ± 170 years cal BP (2σ), whereas the TB10 peaty mud sample yielded 1,715 ± 103 years cal BP (2σ). These results suggest that organic clayey mud and clay sediments at TB5 began accumulating well before 2,500–2,600 years BP, consistent with Middle Holocene deposition. In contrast, the thinner organic layer beneath the dated layer at TB10 indicates later sediment accumulation, likely well into the Late Holocene.
4.6. Palaeontological and Palynological Observations
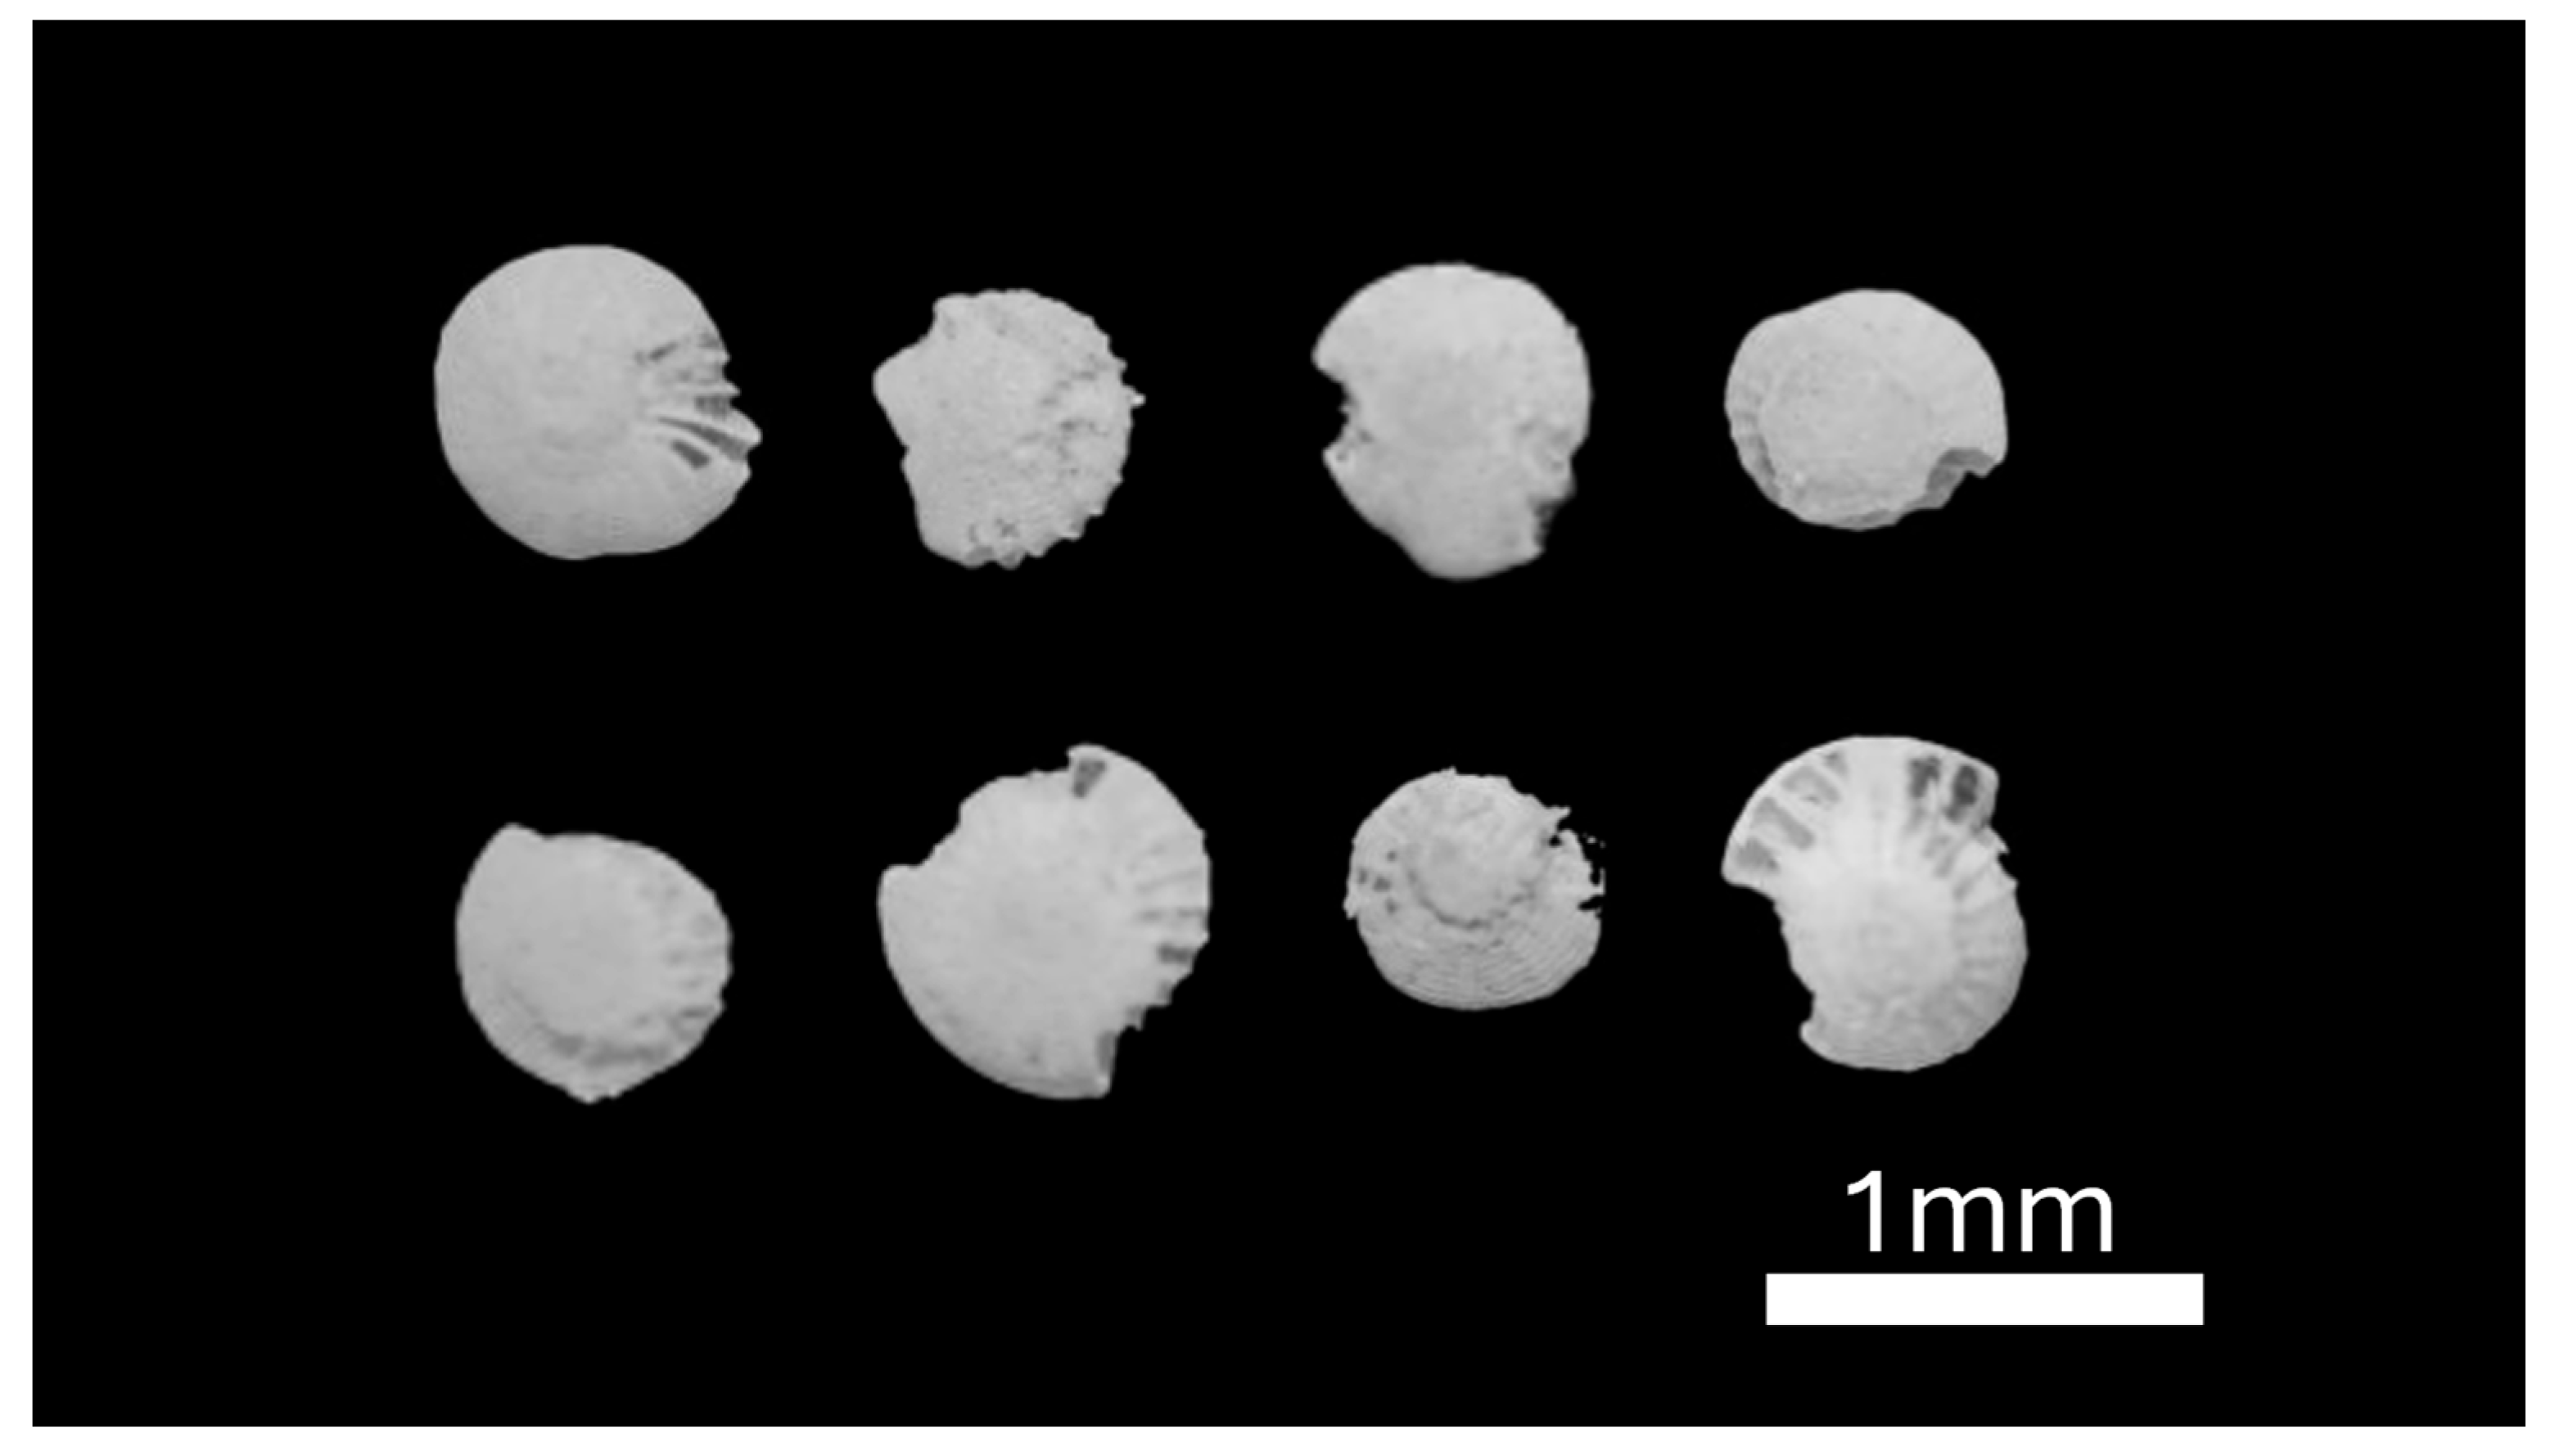
A few tens of foraminiferal taxon
Elphidium craticulatum were recovered from core TB6, including several well-preserved individuals and others with poorly preserved, abraded shell surfaces (
Figure 8).
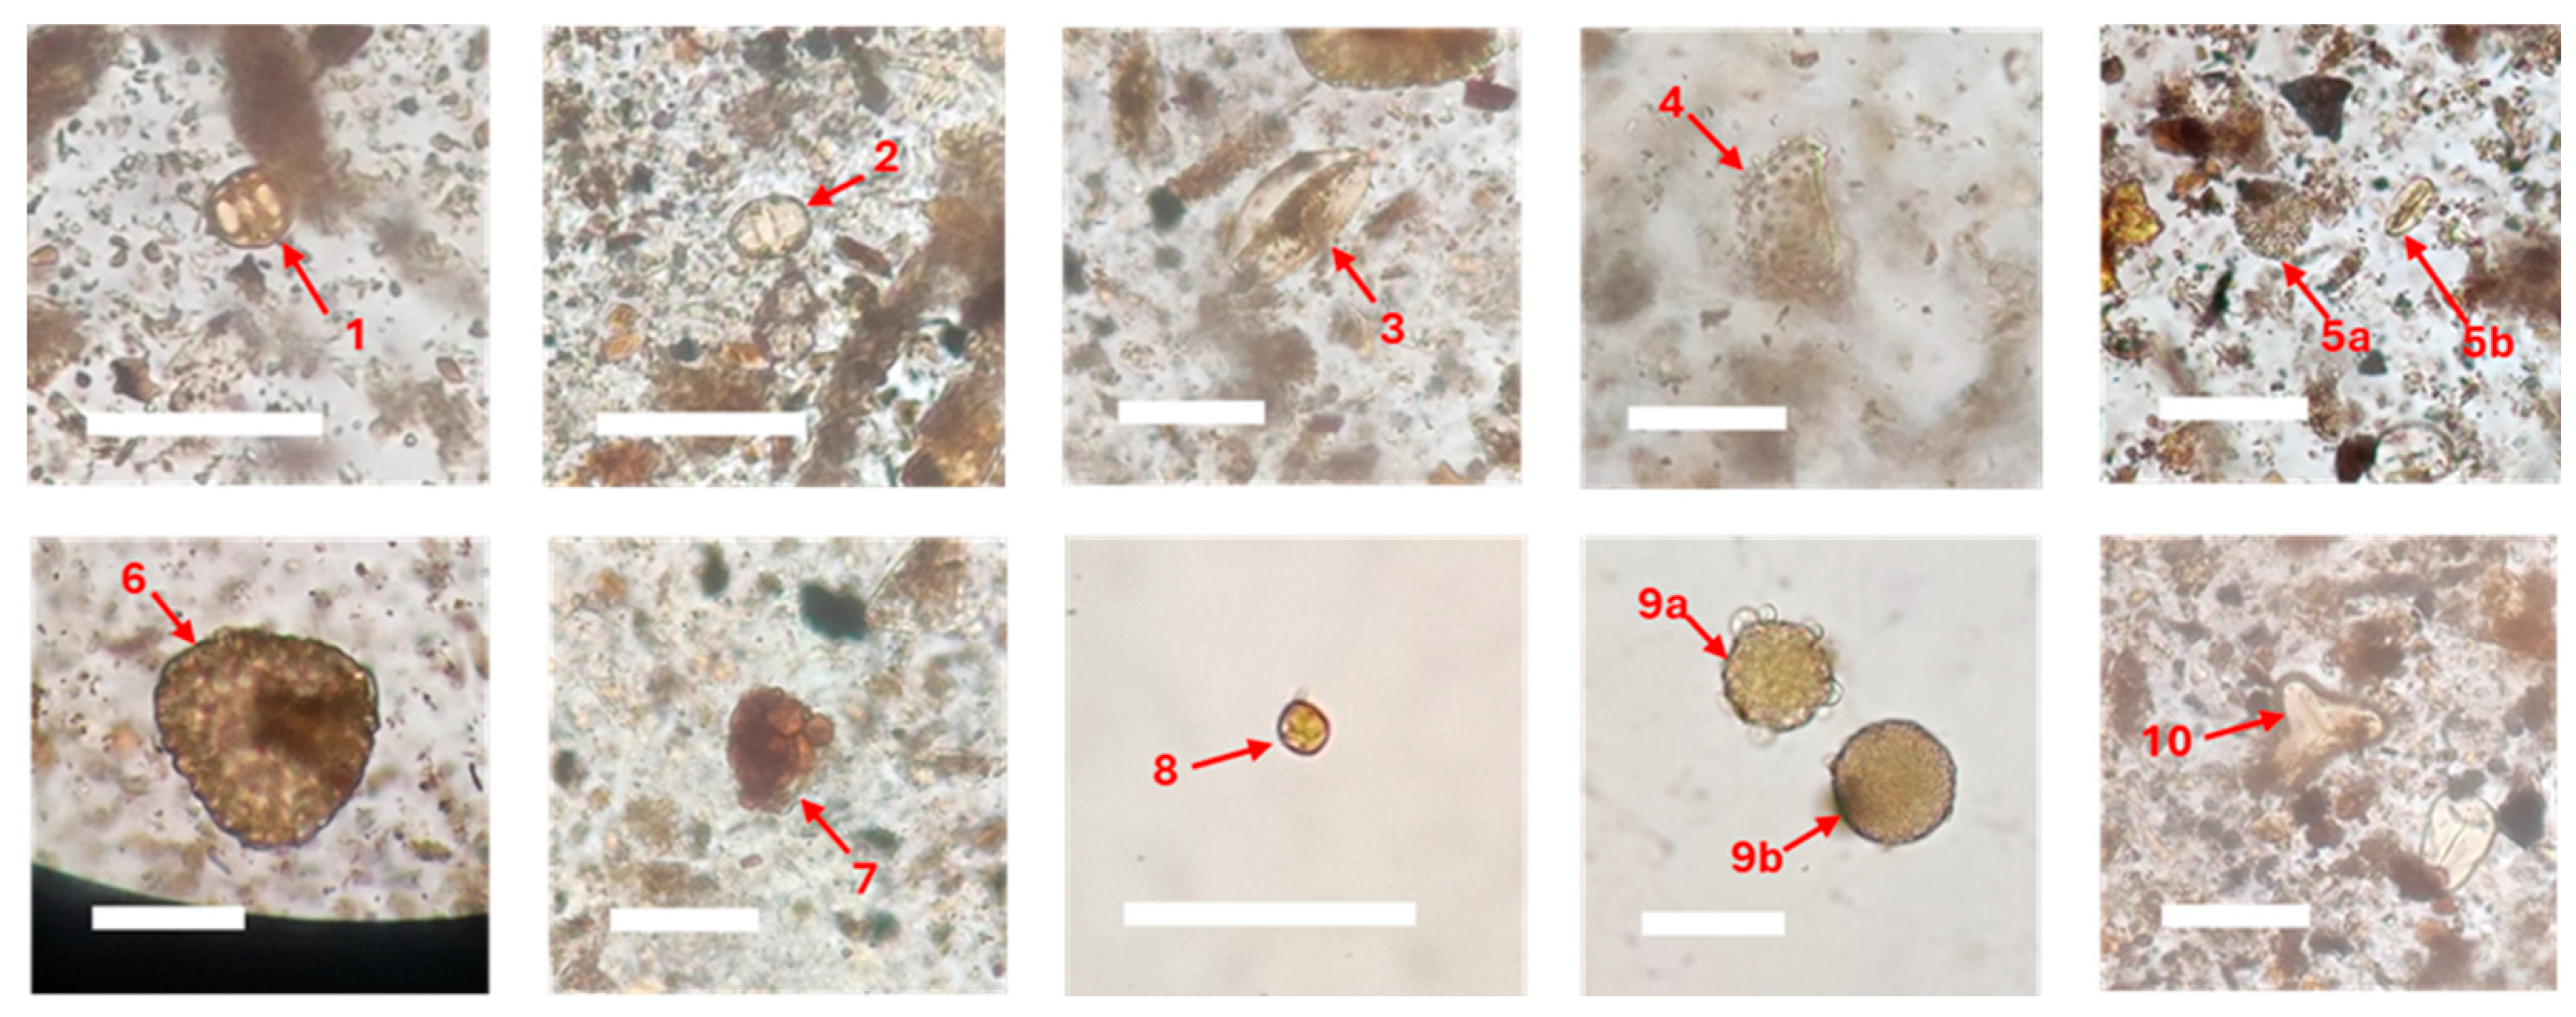
A preliminary palynological study was conducted to support palaeonvironmental interpretations. Pollen analysis from TB4 core yielded a total 12 identifiable taxa. The assemblage comprised both pollen and spores with preservation ranging from well-preserved specimens to poorly-preserved forms containing pyrite infills (
Figure 9). Among the well-preserved taxa,
Rhizophora-type pollen was the most common (6 specimens), followed by
Palaquium (4 specimens),
Durio (2 specimens), and
Pandanus (2 specimens). Rare occurrences (fewer than one specimen each) included pollen from
Chenopodiaceae,
Leguminosae,
Elaeocarpus,
Phyllanthus and
Salix. Spores were consistently present throughout the samples, represented by Spore indet. 1, Spore indet. 2, and
Lygodium spores.
5. Discussion
5.1. Peatland Type in Labu
Peat often begins accumulating in a topogenous mire (fen), thus being characterised by relatively higher ash yield compared to ombrogenous (bog) peat [
8,
48]. In humid climates, an ombrogenous mire (bog) may subsequently develop over the fen peatland. As the bog is supplied solely by meteoric precipitation, its ash yield is lower and thus, the organic matter content (and in turn, its carbon content), and moisture are higher compared to those in the fen peat. Globally, the transition from fen to bog peat is gradual, i.e., intermediate depositional conditions prevail between the topogenous and the ombrogenous stages, resulting in the accumulation of peat with transitional features (transitional mire).
Peat and other carbonaceous sediments in the coastal Labu Basin are sporadic, forming discontinuous isolated pockets within the surrounding Holocene inorganic sediments (
Figure 1C and 3). This interpretation aligns with our field observations and drilling data from the SOAS Bridge construction, which, despite some data gaps due to core losses, reveal peat layers intercalated with inorganic sediments, particularly along the bridge’s southern edge (
Figure 1C). In all drilled peat pockets, organic matter deposition begins with clayey mud, occasionally followed by peaty mud, and ultimately overlain by peat layers. The lower peat layers of TB6 and TB5, the thickest drilled sites, exhibit relatively high ash yields (31.2-50.0 wt.%), indicating substantial inorganic material influx; only the top 30 cm (in TB6) and 25 cm (in TB5) of the cores show a drastic decrease in ash yield (
Figure 3). Higher sulphur contents in the lower levels of the peat are associated with the presence of pyrite (
Table 4). The combination of high ash yield and elevated electrical conductivity (
Table 1) supports the minerotrophic character of the mires, which developed on the clayey substrate dominated by fine-grained quartz, suggesting that the Labu peat pockets accumulated in several small, isolated topogenous mires. Organic sediment accumulation began at different times across the peat pockets, as evidenced by the varying initiation dates in TB5 and TB10, which are thought to represent distinct depositional sites. The general upward increase in carbon content, accompanied by a rapid decrease in ash yield and the sulphur depletion are consistent with limited nutrient supply from minerals in TB5 and TB6 cores, the two thickest peat sections of the studied transect (
Figure 5). This, along with a slight increase of pH in the topmost layers (
Figure 4), support the interpretation that a local transition to ombrogenous peatlands occurred only within the last 250-300 years BP. The observed upward increase in nitrogen is likely linked to biological fixation and atmospheric accumulation near the surface (
Figure 4).
5.2. Holocene Dynamics
The Brunei Bay area receives substantial sediment input from the combined discharge of the modern Limbang, Temburong (including its tributary Labu) and Trusan Rivers, which along with the Padas River, transport sediments into the Champion Delta in the bay [
20]. The interplay of these river systems contributes to the dynamic sedimentary environment of Brunei Bay, shaping both coastal geomorphology and sediment distribution patterns. Organic sediment deposition was largely facilitated by the region’s gentle relief and minimal elevation variations in the Temburong area. The aquifer of the broader region is exposed in ephemeral ponds and rivers and the region is frequently flooded by rainwater leading to groundwater upwelling. Telmatic conditions and peat formation were apparently favoured in depressions where stagnant water persisted, forming the observed peat pockets.
Peatland formation in Labu began in various pockets between the Middle Holocene (TB5 at a depth of 280 cm) and the Late Holocene (TB10 at a depth of 100 cm). This timing aligns with the onset of most SEA peatlands between 3,500 and 6,000 years BP, following sea level stabilisation [
6,
45,
49]. Assuming nearly constant accumulation rates up to the surface, radiocarbon data (
Table 5) allowed us to calculate consistent average accumulation rates of 0.51 mm/a for TB5, and 0.43 mm/a for TB10. These slow accumulation rates in the Labu Peatland are comparable to those reported from nearby synchronous topogenous peatlands in SEA, including Ulu Mendaram (2,776 years BP; average accumulation rate 0.67 mm/a) in western Brunei Darussalam [
9], Bacho Swamp (2,400 years BP; average accumulation rate 0.83 mm/a) in Thailand [
50], and Barambai Peatland (2,350 years BP; average accumulation rate 0.43 mm/year) in South Kalimantan [
51]. Several studies report a declining trend in peat accumulation rates across SEA from the Mid- to Late Holocene, attributed to increased El Niño-Southern Oscillation activity and a relatively drier climate [
7,
52].
Electrical conductivity values vary along the core depths in Labu, reflecting environmental shifts. EC values up to 400 μS/cm typically indicate freshwater sediments, while ranges between 400 to 1,200 μS/cm and 1,300 to 3,000 μS/cm indicate brackish-water and marine sediments, respectively [
53]. Core profiles show consistent trends, starting with low values at the base and increasing upward. The occurrence of foraminifera
Elphidium craticulatum further supports the interpretation of a brackish palaeoenvironment, specifically within estuarine settings. Bottom environments of estuaries, lagoons and bays are typically organic-rich and oxygen-depleted, conditions that are often reflected in the composition of their foraminiferal assemblages. In many estuaries, high primary productivity coupled with stratification between freshwater and saline waters enhances organic enrichment of sediments and contains oxygen depletion in bottom waters, creating habitats favourable to tolerant benthic taxa [
54]. The genus
Elphidium (family Elphidiidae) is particularly characteristic of such environments and is associated with brackish to hypersaline conditions where organic accumulation and low-oxygen conditions prevail [
55]. In the TB6 core, the occurrence of abraded specimens of
Elphidium craticulatum suggests transport or reworking in a high-energy environment, in particular associated with interconnected tidal channels or estuarine margins. Their presence beneath the peat horizon therefore marks an earlier phase when the Labu Basin was still subject to marine influence, preceding the progressive infilling and hydrological shift that facilitated the transition to freshwater peatland development during the Middle Holocene.
However, the low EC values likely suggest that this environment was dominated by terrestrial sediment infill and hydrological isolation due to erosion. The onset of carbonaceous sedimentation in TB5 at 280 cm depth during the Middle Holocene coincides with a marked EC increase to 1,693 μS/cm, indicating the emergence of a brackish environment. This is consistent with documented Middle Holocene Sea level rise [
56,
57,
58,
59]. Maximum EC values (up to 2,630 μS/cm) occur consistently at 80-130 cm depth in the cores (
Figure 4), suggesting the persistence of this regime and the probable development of coastal peatland. These depths correspond to a calculated age of approximately 2,400-2,600 years BP, based on radiocarbon dates and calculated accumulation rates (
Table 5). Subsequently, EC declines again upwards, reaching low levels in the top 50-60 cm, which corresponds to an age of approximately 1000-1300 years BP, consistent with the present-day river-dominated environment.
The diverse pollen assemblage supports a coastal or estuarine mangrove palaeoenvironment, adjacent to lowland tropical rainforest and possibly wetlands.
Rhizophora sp. pollen in sandy silt sediments indicates a coastal mangrove setting [
60,
61,
62], while
Durio sp. and
Palaquium sp. are associated with mire forests [
60,
62], suggesting proximity to a coastal mangrove region [
60]. Additionally,
Pandanus sp. indicates freshwater influence, further supporting this interpretation. Minor contributions from Dipterocarp pollen such as
Salix sp.,
Phyllanthus sp., and
Elaeocarpus sp., imply influence from distant Dipterocarp forests, consistent with fossil records from Miocene deposits in the area [
38]. The low pollen frequency and widespread abrasion marks, further support this interpretation, as river transport causes pollen abrasion.
5.3. Geochemical Signatures and Indices
Geochemical analyses were conducted on peat specimens from two depth intervals of core TB5: 0-25 cm (EC = 92.9 μS/cm) and 100-133 cm (EC = 2630.0 μS/cm). Both samples exhibit trace element values significantly lower than the average upper continental crust (
Table 3). This is attributed to the low mineral matter in these organic sediments, which typically accommodate trace element abundances. In addition, the predominance of quartz in the ash yield significantly dilutes trace element concentrations. Trace elements are commonly used as indicators of environmental conditions in organic sediments. Elements such as As, B, Cd, Co, Cr, Cu, Mg, Mo, Na, Ni, Pb, Sb, U, V, Y, and Zn are particularly indicative of marine-influenced environments [
63,
64,
65,
66]. It has been proposed that Rb, Cs, Ga, Cr, Sc, Th, and possibly Nb are primarily controlled by detrital minerals. In contrast, V, Cu, U, Sn, Y, and Li generally exhibit concentrations above detrital levels and are thus influenced more by organic matter, making them more reliable indicators of the depositional conditions [
65]. In our study, the 100-133 cm sample displays 2-30 times higher concentrations of all aforementioned index elements than the 0-25 cm sample (
Table 3). However, interpretations based solely on individual trace element variations can be ambiguous due to their differential behaviour in brackish-water settings, and the effects of sediment reworking and post-depositional processes, such as leaching and enrichment [
67]. Moreover, the higher mineral matter in the 100-133 cm interval likely contributes to its elevated trace element concentrations. Therefore, we propose that element ratios may offer more reliable insights into the palaeoenvironment of Labu peatland.
Several immobile elements under low temperatures, such as Th and Ga, are typically associated with terrestrial sediments and are easily enriched in clay minerals and/or organic matter. In contrast, U is highly mobile under near surface conditions and can be readily oxidised and leached. All these elements are depleted in the near-surface peat sample (Th below detection limit, Ga = 0.33 ppm, U = 0.8 ppm) compared to the 100-133 cm peat sample (Th = 1.3 ppm, Ga = 2.36 ppm, U = 4.9 ppm). Under low pH conditions, Th becomes highly mobile, either as adsorbed species on organic ligands or as free Th
4+ ions (predominant at pH < 3) or as hydroxo-complexes (predominant at pH between 3 and 4.5), which explains its depletion in both samples, which have pH values of 3.8 and 2.3, respectively [
68]. At surface conditions, uranium typically exists in its soluble, oxidised U
6+ form, accounting for its depletion in the 0-25 cm sample. In contrast, the higher U concentration in the 100-133 cm sample suggests the presence of tetravalent U
4+, which is relatively insoluble, indicating that reducing conditions prevailed during deposition.
The “authigenic uranium” (= total U – Th/3) content [
69] has been proposed as an index of bottom-water anoxia in sedimentary sequences. The higher “authigenic uranium” value in the 100-133 cm sample further supports the establishment of anoxic conditions at that depth, around 2,400-2,600 years BP. Similarly, the (Cu + Mo)/Zn ratio is used to assess bottom-water oxygenation, with increasing values reflecting reducing conditions [
70,
71]. Under anoxic conditions and in the presence of H
2S, Cu precipitates more readily than Zn due to differences in their solubility products of their sulphides. Molybdenum is included in the numerator due to its abundance in sediments deposited under H
2S-bearing waters. The higher (Cu + Mo)/Zn ratio in the 100-133 cm sample (1.41) compared to the surface sample (0.28) aligns with the interpretation of anoxic conditions in the deeper level.
Because REEs are largely controlled by organic matter in the two specimens, they serve as reliable indicators in Labu peat. Fractionation of Ce relative to the rest REE has been documented as a proxy for environmental conditions and redox states in sedimentary regimes. Negative Ce anomalies are typically observed in marine and oxidising environments where Ce
3+ is converted to the less soluble Ce
4+ [
72,
73]. The calculated Ce anomaly value (Ce
anom = log [3Ce
N/(2La
N + Nd
N)] PAAS-normalised [
72] is more negative in the 0-25 cm sample (-0.11) than in the 100-133 cm sample (-0.03), reflecting oxidising conditions near the surface and anoxic-reducing conditions at depth (
Table 3). Yu et al. [
74] recommended that Ce
anom > −0.1 indicates anoxic-reducing environment, whereas Ce
anom < −0.1 reflects Ce loss under oxidised conditions.
The Sr/Ba and Th/U ratios are effective tools for assessing palaeosalinity (e.g., [
66,
74]). Sr/Ba ratios < 0.6 indicate terrestrial freshwater deposition, whereas ratios >1 suggest marine brackish water deposition. The modern Labu Peatland lies essentially on the deltaic plain of the Temburong River and its tributary, the Labu River (
Figure 1), therefore it is subject to regular tidal episodes and seawater intrusion. This explains the high Sr/Ba ratio (2.64) of the 0-25 cm sample. Likewise, the deeper 100-133 cm sample shows Sr/Ba = 1.56 also suggesting its brackish water influence. Studies of detrital shale environments suggest that Th/U ratios >7 indicate terrestrial freshwater deposition, values between 2 and 7 suggest brackish transitional facies, and Th/U < 2 reflect marine brackish water depositions [
75,
76]. The very low Th/U ratios in both samples support the interpretation of a brackish water influenced environment in Labu. In the 0–25 cm sample, Th is below the detection limit, however, a maximum Th/U ratio of 0.13 can be inferred by assuming the Th concentration equals its detection limit (0.1). This inferred ratio is even lower than the Th/U ratio observed in the 100–133 cm sample (
Table 3).
5.4. Palaeoenvironmental Considerations
The high EC observed at the anoxic and reducing site of the 100-133 cm sample likely reflects elevated porewater salinity. The relative enrichments of Th and U in the 100-133 cm sample (
Table 3) are consistent with these higher EC values and increased porewater salinity [
77,
78,
79,
80], as both elements are typically enriched in seawater due to their higher ionic strength [
81,
82,
83]. The more anoxic and relatively more saline conditions at depth compared to the modern 0-25 cm specimen suggest a deeper regional environment during the Middle Holocene. In contrast, the shallow modern specimen reflects present-day conditions, oxidised, well-flushed and characterized by lower dissolved ion concentrations (very low EC), consistent with aerobic conditions. These interpretations indicate that the 100-133 cm sample, dated 2,400-2,600 years BP, corresponds to a restricted estuarine regime, likely stagnant, and enriched in dissolved ions. This may reflect conditions typical of confined lagoonal settings or oxbow lakes within the lower delta of the river system.
However, boron values in this context are generally low and fall below the typical lower threshold of 50 ppm for brackish-water sediments [
84]. Although B is often considered a reliable palaeosalinity indicator, similar deficiencies have been observed in other marine sediments, attributed to dilution by terrigenous materials transported by rivers [
64]. The quartz-dominated composition of the inorganic mineral matter in the peat clearly indicates a terrestrial source, which may have diluted the boron signature. An alternative hypothesis suggests that boron typically adsorbs onto clay minerals. Given the limited presence of such minerals in our samples and the very low pH measured in Labu peat samples it is plausible that boron was leached out [
85].
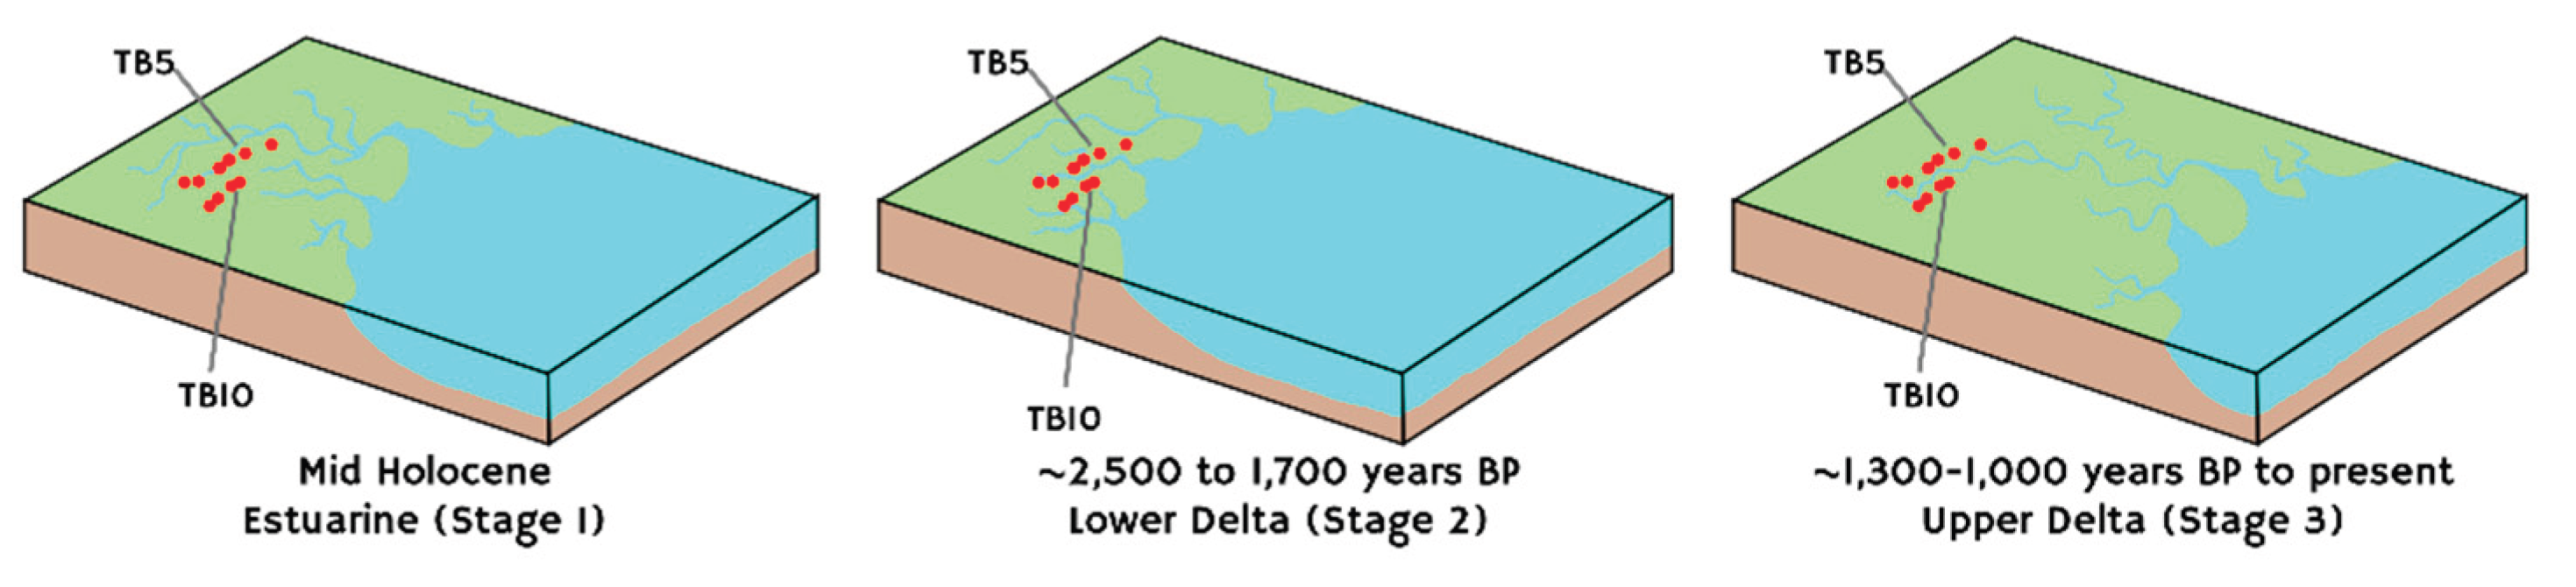
It is therefore postulated that rising sea levels likely triggered a transition from freshwater to brackish conditions in the Labu Basin during Middle Holocene (
Figure 10). This transition is marked by the increase of EC from the bottom upwards in several boreholes (TB2, TB5, TB6 and TB10;
Figure 4). During the Middle to early Late Holocene, Labu Peatland developed within a continuously evolving environment. High EC values support the hypothesis that from Middle Holocene to approximately 1,000 years BP, Labu Peatland was evolving in a brackish-water setting, likely an estuarine. We propose that a lower delta regime became established between ~2,500 and 1,700 years BP, aligning with earlier reports of sea-level rise during this period [
86]. However, this interpretation conflicts with studies suggesting continuous sea regression following a maximum level reached ~ 4,500–6,000 years BP [
56,
57,
58,
59]. This discrepancy underscores the urgent need to enhance the resolution of relative sea level records and palaeoclimatic proxies for the Late Holocene in the region. Subsequent seawater retreat (~1,300–1,000 years BP) enabled the development of a subaerial environment, likely representing an upper delta setting dominated by river floodplain processes around the Labu Peatland (
Figure 10). This transition favoured an ombrogenous phase only within the last 250-320 years BP. The modern anastomosed river system observed today serves as a proxy for past conditions where local disruptions in peatland formation resulted in the formation of isolated peat pockets.
5.5. Global Context and Climatic Influence
Globally, significant climatic fluctuations have influenced coastal environments and peatland development throughout geological time. The Holocene epoch, beginning approximately 11,700 years BP, was marked by elevated temperatures due to high solar radiation and melting ice sheets, resulting in higher sea levels than those observed today [
59,
87]. During the Early to Middle Holocene (
ca. 10,000 to 5,000 years BP), models suggest that maximum sea levels reached 2-5 m above present levels around 5,000-6,000 years ago [
57,
58,
59]. These conditions likely facilitated the landward migration of mangrove mires and the evolution of coastal peatlands in SEA [
17,
52,
60], including Ulu Mendaram in west Brunei Darussalam [
9]. This warm period aligns well with our interpretation of Labu transitioning into an estuarine environment during the Middle Holocene (
Figure 10A). Elevated temperatures and sea levels persisted during the Middle to Late Holocene, remaining approximately 2.5-3 m above current mean levels (see
Figure 4 in [
88] and
Figure 5 in [
8]). This supports our interpretation of Labu Peatland evolving into a lower delta environment between 2,500 and 1,700 years BP (
Figure 10B). As sea levels gradually regressed, the environment transitioned to a freshwater-dominated, upper delta setting, similar to present-day conditions, around 1,300-1,000 years BP (
Figure 10C). A typical ecological transition in SEA involves the replacement of mangrove forests by mire forests, exemplified on Borneo Island by the presence of
Shorea albida [
12,
48,
89].
As global temperatures declined approximately between 1,800 and 1,600 years BP [
90], climatic downturns led to reduced sea levels. During this period, sea levels fell to approximately 1.5-2 m above present levels [
8,
88]. The combination of relatively drier conditions and elevated sea levels contributed to the establishment of a brackish environment within Labu Peatland. To explain the retraction of seawater in Temburong and the shift towards a freshwater environment despite high sea levels, significant delta progradation must be considered. This shift occurred as river influence intensified and sediment input exceeded available accommodation space, a low accommodation-to-sediment supply ratio, resulting in rapid infilling and basinward shoreline migration (
Figure 10C). This phenomenon parallels findings in the Baram Delta west of Brunei Darussalam, where high sediment input rates led to outward delta extension despite relatively high sea levels (1.5 to 2.5 m higher than present) around 3,000 years BP [
91,
92], and in the older Kalang River system in Singapore between 9,500 and 7,200 years BP [
93]. Such dynamics underscore the pivotal role of sedimentary processes in shaping the ecological landscape of Labu.
6. Conclusions
The study of Labu Peatland reveals a complex interplay between sediment dynamics, hydrological and climatic factors, which affected the depositional environment. Characterised by deposition in discontinuous pockets, the Labu Peatland exhibits accumulation rates ranging from 0.43 to 0.50 mm/year, consistent with patterns observed in other synchronous Southeast Asian coastal peatlands. The evolution of Labu Peatland reflects significant environmental shifts from brackish conditions during Middle Holocene, to a lower delta environment approximately 2,500 and 1,700 years BP. A new transition around 1,300 to 1,000 years BP marks a shift to an upper delta environment, likely driven by enhanced delta progradation and changing sedimentary processes. Additionally, evolution indicates a transition from a topogenous to an ombrogenous stage approximately 250-320 years BP.
Overall, these findings suggest that Labu Peatland has undergone dynamic evolution influenced by geological processes and climatic variations. The inferred environmental shifts underscore the critical role of climatic conditions during the Holocene in shaping the peatland’s development. Consequently, Labu Peatland serves as a valuable palaeoclimatic archive, capturing the impacts of historical temperature fluctuations and sea-level changes. The insights gained from this study enhanced the understanding of mire and peatland formation and its responses to environmental changes, highlighting the importance of such ecosystems within global climate dynamics. As a critical piece of the geological puzzle in Borneo and Southeast Asia, Labu Peatland contributes to our understanding of tropical peatland dynamics in the region. This research enriches local knowledge and provides essential data that can inform regional conservation strategies aimed at preserving these irreplaceable ecosystems amidst ongoing environmental challenges.
Supplementary Materials
The following supporting information can be downloaded at:
www.mdpi.com/xxx/s1, Figure S1: title; Table S1: title; Video S1: title.
Author Contributions
Adlina Misli: Data curation, Investigation, Formal analysis, Writing original draft, Writing review and editing. Basilios Tsikouras: Conceptualisation, Methodology, Data curation, Investigation, Formal analysis, Writing original draft, Writing review and editing, Supervision, Project Administration, Funding Acquisition. Stavros Kalaitzidis: Conceptualisation, Methodology, Data curation, Investigation, Formal analysis, Writing review and editing. Amajida Roslim: Investigation, Formal analysis, Writing review and editing. Elena Ifandi: Data curation, Investigation, Formal analysis, Writing original draft, Writing review and editing. Kimon Christanis: Conceptualisation, Methodology, Data curation, Investigation, Formal analysis, Writing review and editing.
Funding
This research was funded by Universiti Brunei Darussalam, grant number UBD/RSCH/URC/RG(b)/2019/014.
Data Availability Statement
All data are available in the text and the Supplementary material provided.
Acknowledgments
The authors would like to express their sincere gratitude to Mr. Konstantinos Perleros, Georgios Droukas, Muhammad Syazwan Omar, and Muhammad Affi Syazwan Mohammad Sofian for their assistance during the field surveys, coring and sampling. We are also grateful to Dr. Yannis Maniatis for his expertise in radiometric dating, as well as to Dr. Natasha Keasberry and Dr. Chan Chin Mei for facilitating our access to the CHNS analyser. Our appreciation goes to Mr. Muhamad Kamarul Najib Kamis for his support in operating the CHNS analyser. Dr. Abdul Hanif Mahadi is gratefully acknowledged for providing access to the XRD facility, with additional thanks to Ms. Norolhizrah Haji Kamat for her operational assistance. Furthermore, we acknowledge Mr. Nur’naqiuddin Osman for his help with the laser particle size analyser. Finally, we would like to thank Inspector Haji Khairul Hazmi Abdul Halim and the rangers of the Royal Brunei Police Force for their in-valuable assistance and ensuring our safety during the fieldwork. During the preparation of this work the authors used Perplexity in order to improve and polish the English language. After using this tool, the authors reviewed and edited the content as needed and take full responsibility for the content of the published article.
Conflicts of Interest
The funders had no role in the design of the study, in sample collection, analyses, or interpretation of data, in the writing of the manuscript and in the decision to publish the results.
References
- Joosten, H.; Clarke, D. Wise use of mires and peatlands: Background and principles including a framework for decision-making; International Mire Conservation Group and International Peat Society, 2002; p. 303 p. [Google Scholar]
- Dise, N.B. Peatland Response to Global Change. Science 2009, 326, 810–811. [Google Scholar] [CrossRef]
- Page, S.E.; Wüst, R.A.J.; Weiss, D.; Rieley, J.O.; Shotyk, W.; Limin, S.H. A record of Late Pleistocene and Holocene carbon accumulation and climate change from an equatorial peat bog (Kalimantan, Indonesia): implications for past, present and future carbon dynamics. J. Quat. Sci. 2004, 19, 625–635. [Google Scholar] [CrossRef]
- Posa, M.R.C.; Wijedasa, L.S.; Corlett, R.T. Biodiversity and conservation of tropical peat swamp forests. BioScience 2011, 61, 49–57. [Google Scholar] [CrossRef]
- Wösten, J.H.M.; Clymans, E.; Page, S.E.; Rieley, J.O.; Limin, S.H. Peat–water interrelationships in a tropical peatland ecosystem in Southeast Asia. Catena 2008, 73, 212–224. [Google Scholar] [CrossRef]
- Dommain, R.; Couwenberg, J.; Joosten, H. Development and carbon sequestration of tropical peat domes in south-east Asia: links to post-glacial sea-level changes and Holocene climate variability. Quat. Sci. Rev. 2011, 30, 999–1010. [Google Scholar] [CrossRef]
- Hapsari, K.A.; Jennerjahn, T.C.; Nugroho, S.H.; Yulianto, E.; Behling, H. Sea level rise and climate change acting as interactive stressors on development and dynamics of tropical peatlands in coastal Sumatra and South Borneo since the Last Glacial Maximum. Glob. Chang. Biol. 2022, 28, 3459–3479. [Google Scholar] [CrossRef] [PubMed]
- Omar, M.S.; Ifandi, E.; Sukri, R.S.; Kalaitzidis, S.; Christanis, K.; Lai, D.T.C.; Bashir, S.; Tsikouras, B. Peatlands in Southeast Asia: A comprehensive geological review. Earth-Sci. Rev. 2022, 232. [Google Scholar] [CrossRef]
- Dommain, R.; Cobb, A.R.; Joosten, H.; Glaser, P.H.; Chua, A.F.L.; Gandois, L.; Kai, F.-M.; Noren, A.; Salim, K.A.; Su’ut, N.S.H.; Harvey, C.F. Forest dynamics and tip-up pools drive pulses of high carbon accumulation rates in a tropical peat dome in Borneo (Southeast Asia). Journal of Geophysical Research: Biogeosciences 2015, 120, 617–640. [Google Scholar] [CrossRef]
- Suhip, M.A.A.B.H.; Gӧdeke, S.H.; Cobb, A.R.; Sukri, R.S. Seismic refraction study, single well test and physical core analysis of anthropogenic degraded peat at the Badas peat dome, Brunei Darussalam. Eng. Geol. 2020, 273. [Google Scholar] [CrossRef]
- Akhtar, H.; Lupascu, M.; Sukri, R.S.; Smith, T.E.L.; Cobb, A.R.; Swarup, S. Significant sedge-mediated methane emissions from degraded tropical peatlands. Env. Res. Let. 2021, 16. [Google Scholar] [CrossRef]
- Becek, K.; Rahayu, S.; Yong, G.; Lai, D.T.C. Shorea albida Sym. does not regenerate in the Badas peat swamp forest, Brunei Darussalam - An assessment using remote sensing technology. For. Ecol. Manag. 2022, 504. [Google Scholar] [CrossRef]
- Cobb, A.R.; Dommain, R.; Sukri, R.S.; Metali, F.; Bookhagen, B.; Harvey, C.F.; Tang, H. Improved terrain estimation from spaceborne lidar in tropical peatlands using spatial filtering. Sci. Rem. Sens. 2023, 7, 100074. [Google Scholar] [CrossRef]
- Zadbagher, E.; Marangoz, A.M.; Becek, K. Estimation of above-ground biomass using machine learning approaches with InSAR and LiDAR data in tropical peat swamp forest of Brunei Darussalam. iForest 2024, 17, 172–179. [Google Scholar] [CrossRef]
- Gandois, L.; Teisserenc, R.; Cobb, A.R.; Chieng, H.I.; Lim, L.B.L.; Kamariah, A.S.; Hoyt, A.; Harvey, C.F. Origin, composition, and transformation of dissolved organic matter in tropical peatlands. Geochim. Cosmochim. Acta 2014, 137, 35–47. [Google Scholar] [CrossRef]
- Page, S.E.; Rieley, J.O.; Banks, C.J. Global and regional importance of the tropical peatland carbon pool. Glob. Chang. Biol. 2011, 17, 798–818. [Google Scholar] [CrossRef]
- Hapsari, K.A.; Biagioni, S.; Jennerjahn, T.C.; Reimer, P.M.; Saad, A.; Achnopha, Y.; Sabiham, S.; Behling, H. Environmental dynamics and carbon accumulation rate of a tropical peatland in Central Sumatra, Indonesia. Quat. Sci. Rev. 2017, 169, 173–187. [Google Scholar] [CrossRef]
- Kobayashi, S. Peatland and peatland forest in Brunei Darussalam. In Tropical Peatland Ecosystems; Osaki, M., Tsuji, N., Eds.; 2016; pp. 75–89. [Google Scholar] [CrossRef]
- Hong, W.Y. Meteorological variability and predictive forecasting of atmospheric particulate pollution. Sci. Rep. 2024, 14. [Google Scholar] [CrossRef]
- Lambiase, J.J.; Cullen, A.B. Sediment supply systems of the Champion “Delta” of NW Borneo: Implications for deepwater reservoir sandstones. J. Asian Earth Sci. 2013, 76, 356–371. [Google Scholar] [CrossRef]
- Breitfeld, H.T.; Burley, S.D.; Galin, T.; Hennig-Breitfeld, J.; Rajali, R. The Kuching Formation: A deep marine equivalent of the Sadong Formation, and its implications for the Early Mesozoic tectonic evolution of western and southern Borneo. Bull. Geol. Soc. Malaysia 2023, 76, 101–129. [Google Scholar] [CrossRef]
- Sandal, S.T. The geology and hydrocarbon resources of Negara Brunei Darussalam; Brunei Shell Petroleum Company/Brunei Museum, Brunei Darussalam, 1996. [Google Scholar]
- Morley, C.K.; Crevello, P.; Haji Ahmad, Z. Shale tectonics and deformation associated with active diapirism: the Jerudong anticline, Brunei Darussalam. J. Geol. Soc. 1998, 155, 475–490. [Google Scholar] [CrossRef]
- Roslim, A.; Briguglio, A.; Kocsis, L.; Rahman, F.A.; Bahrein, I.F.; Goeting, S.; Razak, H. Palaeoenvironmental interpretation of Late Miocene outcrops (Miri and Seria formations) along Jalan Tutong in Brunei Darussalam. Bull. Geol. Soc. Malaysia 2020, 70, 39–56. [Google Scholar] [CrossRef]
- Syafiq, H.; Shah, A.A.; Rachman, M.G. Satellite image and outcrop-based structural mapping of Brunei and the contiguous region reveals a new fault, the Brunei Bay Fault. Quat. Sci. Adv. 2024, 13. [Google Scholar] [CrossRef]
- Wilford, G.E. Geological map of Brunei and adjacent parts of Sarawak: 1: 125000. map, Geological map of Brunei and adjacent parts of Sarawak: 1:125 000, 1960, Geological Survey Department, British Territories in Borneo, MAP G8198.51.C5.
- von Post, L.; Granlund, E. Södra Sveriges Torvtillgångar I (Peat resources in southern Sweden I). Sveriges Geologiska Undersökning (in Swedish). 1926, C 335(19), 1–128. [Google Scholar]
- ASTM International. Standard test method for moisture in the analysis sample of coal and coke (ASTM Standard D3173/D3173M-17a) 2017. Available online: https://www.astm.org/d3173_d3173m-17a.html.
- ASTM International. Standard test methods for determining the water (moisture) content, ash content, and organic material of peat and other organic soils (ASTM Standard D2974-20e1) 2020. Available online: https://img.antpedia.com/standard/files/pdfs_ora/20221211/astm/ASTM%20D2974-20e1.pdf.
- Lourenco, M.; Fitchett, J.M.; Woodborne, S. Peat definitions: A critical review. PPG: Earth and Environment 2022, 47, 506–520. [Google Scholar] [CrossRef]
- Wüst, R.A.J.; Bustin, R.M.; Lavkulich, L.M. New classification systems for tropical organic-rich deposits based on studies of the Tasek Bera Basin, Malaysia. Catena 2003, 53, 133–163. [Google Scholar] [CrossRef]
- ASTM International. Standard test methods for determination of carbon, hydrogen, and nitrogen in analysis samples of coal and carbon in analysis samples of coal and coke. 2021. Available online: https://www.astm.org/d5373-21.html.
- International Organization for Standardization. Soil, treated biowaste and sludge – Determination of pH. 2021. Available online: https://www.iso.org/standard/75243.html.
- International Organization for Standardization. Soil quality — Determination of redox potential — Field method. 2022. Available online: https://www.iso.org/standard/83962.html.
- Bronk Ramsey, C. OxCal v4.4.4 [Computer software; University of Oxford, 2020; Available online: https://c14.arch.ox.ac.uk/oxcal.html.
- Reimer, P.J.; Austin, W.; Bard, E.; Bayliss, A.; Blackwell, P.G.; Ramsey, C.B.; Butzin, M.; Cheng, H.; Edwards, R.L.; Friedrich, M.; Grootes, P.M.; Guilderson, T.P.; Hajdas, I.; Heaton, T.J.; Hogg, A.G.; Hughen, K.A.; Kromer, B.; Manning, S.W.; Muscheler, R.; Palmer, J.G.; Pearson, C.; van der Plicht, J.; Reimer, R.W.; Richards, D.A.; Scott, E.M.; Southon, J.R.; Turney, C.S.M.; Wacker, L.; Adolphi, F.; Büntgen, U.; Capano, M.; Fahrni, S.; Fogtmann-Schulz, A.; Friedrich, R.; Köhler, P.; Kudsk, S.; Miyake, F.; Olsen, J.; Reinig, F.; Sakamoto, M.; Sookdeo, A.; Talamo, S. The IntCal20 Northern Hemisphere radiocarbon age calibration curve (0–55 cal kBP). Radiocarbon 2020, 62, 725–757. [Google Scholar] [CrossRef]
- Boltovskoy, E. Methods for sorting of foramifera from plankton samples. J. Paleont. 1996, 40, 1244–1246. Available online: http://www.jstor.org/stable/1302005.
- Roslim, A.; Briguglio, A.; Kocsis, L.; Goeting, S.; Hofmann, C.C. Palynology of Miocene sediments in Brunei Darussalam: first SEM investigations of pollen and spores, and their taxonomy and palaeoenvironmental interpretation. Palaeontographica Abt. B 2021, 301, 77–139. [Google Scholar] [CrossRef]
- Kurnain, A.; Notohadikusumo, T.; Radjagukguk, B.; Sri Hasuti, S. The state of decomposition of tropical peat soil under cultivated and fire damaged peatland. In Peatlands for People: Natural Resource Functions and Sustainable Management Proceedings Int. Symposium on Tropical Peatland; Jakarta, Indonesia, Rieley, J.O., Page, S.E., Setiadi, B., Eds.; BPPT (Badan Pengkajian dan Penerapan Teknologi) and Indonesian Peat Association: Jakarta, 2002; pp. 168–178. [Google Scholar]
- Van Krevelen, D.W. Coal: Typology, physics, chemistry, constitution, 3rd Ed. ed; Elsevier, 1993; p. 258 p. [Google Scholar]
- Morgan, B.; Rate, A.W.; Burton, E.D.; Smirk, M.N. Enrichment and fractionation of rare earth elements in FeS- and organic-rich estuarine sediments receiving acid sulfate soil drainage. Chem. Geol. 2012, 308-309, 60–73. [Google Scholar] [CrossRef]
- Marsac, R.; Davranche, M.; Gruau, G.; Dia, A.; Pédrot, M.; Le Coz-Bouhnik, M.; Briant, N. Effects of Fe competition on REE binding to humic acid: Origin of REE pattern variability in organic waters. Chem. Geol. 2013, 342, 119–127. [Google Scholar] [CrossRef]
- Cao, Y.W.; Liu, X.M.; Wang, C.; Bai, E.; Wu, N. Rare earth element geochemistry in soils along arid and semiarid grasslands in northern China. Ecol. Proc. 2022, 11. [Google Scholar] [CrossRef]
- Cruse, A.M.; Timothy, W.L.; Kidder, D.L. Rare-Earth element behavior in phosphates and organic-rich host shales: An example from the Upper Carboniferous of Midcontinent North America. In Marine Authigenesis: From Global to Microbial, SEPM Society for Sedimentary Geology; Glenn, C.R., Prévôt-Lucas, L., Lucas, J., Eds.; 2000; Volume 66, pp. 445–453. [Google Scholar] [CrossRef]
- Hannigan, R.E.; Sholkovitz, E.R. The development of middle rare earth element enrichments in freshwaters: weathering of phosphate minerals. Chem. Geol. 2001, 175, 495–508. [Google Scholar] [CrossRef]
- McLennan, S.M. Relationships between the trace element composition of sedimentary rocks and upper continental crust. Geochem. Geophys. Geosyst. 2001, 2, 2000GC000109. [Google Scholar] [CrossRef]
- Wedepohl, K.H. The composition of the continental crust. Geochim. Cosmochim. Acta 1995, 59, 1217–1232. [Google Scholar] [CrossRef]
- Page, S.E.; Rieley, J.O.; Wüst, R. Chapter 7 Lowland tropical peatlands of Southeast Asia. Developments in Earth Surface Processes 2006, 9, 145–172. [Google Scholar] [CrossRef]
- Staub, J.R.; Esterle, J.S. Peat-accumulating depositional systems of Sarawak, East Malaysia. Sed. Geol. 1994, 89, 91–106. [Google Scholar] [CrossRef]
- Vijarnsorn, P.; Liengsakul, M. Formation and characterization of the peat swamps in Narathiwat Province, peninsular Thailand. In Workshop on Economic Geology, Tectonics, Sedimentary Processes and Environment of the Quaternary in Southeast Asia; Narong, Ed.; 1986; pp. 87–100. [Google Scholar]
- Notohadiprawiro, T. Peat deposition, an idle stage in the natural cycling of nitrogen, and its possible activation for agriculture. In Nitrogen Cycling in South-East Asian Wet Monsoonal Ecosystems; Wetselaar, R., Simpson, J.R., Rosswall, T., Eds.; 1981; pp. 139–147. [Google Scholar]
- Hapsari, K.A.; Biagioni, S.; Jennerjahn, T.C.; Saad, A.; Sabiham, S.; Corre, M.D.; Veldkamp, E.; Behling, H. Late Holocene ENSO-related fire impact on vegetation, nutrient status and carbon accumulation of peatlands in Jambi, Sumatra, Indonesia. Rev. Palaeobot. Palyn. 2021, 293. [Google Scholar] [CrossRef]
- Fujimoto, K.; Miura, M.; Kobayashi, S.; Simbolon, H. Habitat evolution of a peat swamp forest and belowground carbon sequestration during the Holocene along the coastal lowland in central Sumatra, Indonesia. Prog. Earth Planet. Sci. 2019, 6, 41. [Google Scholar] [CrossRef]
- Debenay, J.P.; Guillou, J.J.G.F.; Redois, F.; Geslin, E. Chapter 2 Distribution trends of foraminiferal assemblages in paralic environments: a base for using foraminifera as early warning indicators of anthropic stress. In Environmental Micropaleontology; Martin, R.E., Ed.; 2000; Volume 15, pp. 39–67. [Google Scholar]
- Takata, H.; Takayasu, K.; Hasegawa, S. Foraminifera in an organic-rich, brackish-water lagoon, Lake Saroma, Hokkaido, Japan. J. Foram. Res. 2006, 36, 44–60. [Google Scholar] [CrossRef]
- Geyh, M.A.; Streif, H.; Kudrass, H.-R. Sea-level changes during the late Pleistocene and Holocene in the Strait of Malacca. Nature 1979, 278, 441–443. [Google Scholar] [CrossRef]
- Bird, M.I.; Austin, W.E.N.; Wurster, C.M.; Fifield, L.K.; Mojtahid, M.; Sargeant, C. Punctuated eustatic sea-level rise in the early mid-Holocene. Geology 2010, 38, 803–806. [Google Scholar] [CrossRef]
- Bird, M.I.; Fifield, L.K.; Teh, T.S.; Chang, C.H.; Shirlaw, N.; Lambeck, K. An inflection in the rate of early mid-Holocene eustatic sea-level rise: A new sea-level curve from Singapore. Est. Coast. Shelf Sci. 2007, 71, 523–536. [Google Scholar] [CrossRef]
- Bender, M.; Mann, T.; Stocchi, P.; Kneer, D.; Schöne, T.; Illigner, J.; Jompa, J.; Rovere, A. Late Holocene (0–6 ka) sea-level changes in the Makassar Strait, Indonesia. Clim. Past 2020, 16, 1187–1205. [Google Scholar] [CrossRef]
- Anderson, J.A.R.; Muller, J. Palynological study of a Holocene peat and a Miocene coal deposit from NW Borneo. Rev. Palaeobot. Palyn. 1975, 19, 291–351. [Google Scholar] [CrossRef]
- Haseldonckx, P. The palynology of a Holocene marginal peat swamp environment in Johore, Malaysia. Rev. Palaeobot. Palyn. 1977, 24, 227–238. [Google Scholar] [CrossRef]
- Morley, R.J. Cenozoic ecological history of Southeast Asian peat mires based on the comparison of coals with present day and late quaternary peats. J. Limnol. 2013, 72, 36–59. [Google Scholar] [CrossRef]
- Gayer, R.A.; Rose, M.; Dehmer, J.; Shao, L.Y. Impact of sulphur and trace element geochemistry on the utilization of a marine-influenced coal—case study from the South Wales Variscan foreland basin. Int. J. Coal Geol. 1999, 40, 151–174. [Google Scholar] [CrossRef]
- Orem, W.H.; Finkelman, R.B. 7.08 - Coal Formation and Geochemistry. Treatise on Geochemistry 2003, 7, 191–222. [Google Scholar] [CrossRef]
- Spears, D.A. The geochemistry and mineralogy of high-S coals, with examples mainly from the East Pennines Coalfield in Yorkshire and Nottinghamshire, UK: an overview. Proc. of the Yorkshire Geol. Soc. 2015, 60, 204–226. [Google Scholar] [CrossRef]
- Chrysochos, M.P.; Kalaitzidis, S.; Achimo, M.; Vasconcelos, L.; Chrysakopoulou, C.; Christanis, K. The evolution of interdunal peat-forming environments in the Maputaland coastal plain, Mozambique. Int. J. Coal Geol. 2025, 307, 104828. [Google Scholar] [CrossRef]
- Dai, S.; Bechtel, A.; Eble, C.F.; Flores, R.M.; French, D.; Graham, I.T.; Hood, M.M.; Hower, J.C.; Korasidis, V.A.; Moore, T.A.; Püttmann, W.; Wei, Q.; Zhao, L.; O’Keefe, J.M.K. Recognition of peat depositional environments in coal: A review. Int. J. Coal Geol. 2020, 219. [Google Scholar] [CrossRef]
- Langmuir, D.; Herman, J.S. The mobility of thorium in natural waters at low temperatures. Geochim. Cosmochim. Acta 1980, 44, 1753–1766. [Google Scholar] [CrossRef]
- Wignall, P.B.; Myers, K.J. Interpreting benthic oxygen levels in mudrocks: A new approach. Geology 1988, 16, 452–455. [Google Scholar] [CrossRef]
- Hallberg, R.O. A geochemical method for investigation of paleoredox conditions in sediments. Ambio Sp. Rep. 1976, 4, 139–147. Available online: http://www.jstor.org/stable/25099586.
- Hallberg, R.O. Diagenetic and environmental effects on heavy-metal distribution in sediments: A hypothesis with an illustration from the Baltic Sea. In The Dynamic Environment of the Ocean Floor; Fanning, K.A., Manheim, F.T., Eds.; Lexington Books: Lexington, Mass, 1982; pp. 305–316. [Google Scholar]
- Elderfield, H.; Greaves, M.J. The rare earth elements in seawater. Nature 1982, 296, 214–219. [Google Scholar] [CrossRef]
- Wright, J.; Schrader, H.; Holser, W.T. Paleoredox variations in ancient oceans recorded by rare earth elements in fossil apatite. Geochim. Cosmoch. Acta 1987, 51, 631–644. [Google Scholar] [CrossRef]
- Yu, C.; Huang, W.; Jiu, B.; Hao, R. Geochemistry characteristics and paleoenvironmental significance of trace elements in coal and coal gangue in the Yangcheng mining area, Qinshui Basin. ACS Omega 2022, 7, 13557–13576. [Google Scholar] [CrossRef]
- Adams, J.A.S.; Weaver, C.E. Thorium-to-uranium ratios as indicators of sedimentary processes: Example of concept of Geochemical facies. Bull. Am. Assoc. Petrol. Geol. 1958, 42, 387–430. [Google Scholar] [CrossRef]
- Chen, W.; Lv, D.; Ejembi, J.I.; Yang, B.; Song, C.; Ning, Z.; Tang, L.; Zhang, Z.; Jia, H. Sedimentary characteristics and depositional model of the Paleogene Dawenkou Formation in Eastern China: Insights from the Huanggang Depression. Minerals 2024, 14, 131. [Google Scholar] [CrossRef]
- Cowart, J.B. The relationship of uranium isotopes to oxidation/reduction in the Edwards carbonate aquifer of Texas. Earth Planet. Sci. Lett. 1980, 48, 277–283. [Google Scholar] [CrossRef]
- Charette, M.A.; Sholkovitz, E.R. Trace element cycling in a subterranean estuary: Part 2. Geochemistry of pore water. Geochim. Cosmochim. Acta 2006, 70, 811–826. [Google Scholar] [CrossRef]
- Strady, E.; Blanc, G.; Schäfer, J.; Coynel, A.; Dabrin, A. Dissolved uranium, vanadium and molybdenum behaviours during contrasting freshwater discharges in the Gironde Estuary (SW France). Est. Coast. Shelf Sci. 2009, 83, 550–560. [Google Scholar] [CrossRef]
- Prakash, B.; Kumar, A.; Singh, P.P.; Songachan, L.S. 1 - Antimicrobial and antioxidant properties of phytochemicals: Current status and future perspective. Functional and Preservative Properties of Phytochemicals 2020, 1–45. [Google Scholar] [CrossRef]
- Klinkhammer, G.P.; Palmer, M.R. Uranium in the oceans: Where it goes and why. Geochim. Cosmochim. Acta 1991, 55, 1799–1806. [Google Scholar] [CrossRef]
- Duncan, T.; Shaw, T.J. The mobility of rare earth elements and redox sensitive elements in the groundwater/seawater mixing zone of a shallow coastal aquifer. Aquat. Geochem. 2003, 9, 233–255. [Google Scholar] [CrossRef]
- Windom, H.L.; Niencheski, L.F.H. Biogeochemical processes in a freshwater–seawater mixing zone in permeable sediments along the coast of Southern Brazil. Mar. Chem. 2003, 83, 121–130. [Google Scholar] [CrossRef]
- Goodarzi, F.; Swaine, D.J. The influence of geological factors on the concentration of boron in Australian and Canadian coals. Chem. Geol. 1994, 118, 301–318. [Google Scholar] [CrossRef]
- Tabelin, C.B.; Hashimoto, A.; Igarashi, T.; Yoneda, T. Leaching of boron, arsenic and selenium from sedimentary rocks: II. pH dependence, speciation and mechanisms of release. Sci. Tot. Env. 2014, 473–474, 244–253. [Google Scholar] [CrossRef]
- Tjia, H.D.; Fuji, S. Late Quaternary shorelines in peninsular Malaysia. In The Coastal Zone of Peninsula Malaysia; Tjia, H.D., Mastura, Sharifah, Eds.; Penerbit Univeristi Kebangsaan Malaysia, 1992; pp. 28–41. [Google Scholar]
- Marcott, S.A.; Shakun, J.D.; Clark, P.U.; Mix, A.C. A reconstruction of regional and global temperature for the past 11,300 years. Science 2013, 339, 1198–1201. [Google Scholar] [CrossRef]
- Mann, T.; Bender, M.; Lorscheid, T.; Stocchi, P.; Vacchi, M.; Switzer, A.D.; Rovere, A. Holocene sea levels in Southeast Asia, Maldives, India and Sri Lanka: The SEAMIS database. Quat. Sci. Rev. 2019, 219, 112–125. [Google Scholar] [CrossRef]
- Anderson, J.A.R.; Marsden, D. Brunei forest resources and strategic planning study. In The forest resources of Negara Brunei Darussalam; 1984; Volume 1. [Google Scholar]
- Zhao, H.; Zhou, W.; Cheng, P.; Yu, X.; Wu, Y.; Shu, P.; Xian, F.; Du, H.; Zhou, J.; Zhao, G.; Fan, Y.; Fu, Y.; Dong, G.; Lu, X. Holocene temperature and cold events recorded in arid Central Asian peatlands. Quat. Sci. Rev. 2024, 328. [Google Scholar] [CrossRef]
- Caline, B.; Huong, J. New insight into the recent evolution of the Baram Delta from satellite imagery. Bull. Geol. Soc. Malaysia 1992, 32, 1–13. [Google Scholar] [CrossRef]
- King, R.C.; Hillis, R.R.; Tingay, M.R.P.; Damit, A.R. Present-day stresses in Brunei, NW Borneo: Superposition of deltaic and active margin tectonics. Basin Res. 2010, 22, 236–247. [Google Scholar] [CrossRef]
- Chua, S.; Switzer, A.D.; Gouramanis, C.; Dixit, Y.; Bird, M.I.; Horton, B.P. Coastal response to Holocene sea-level change: A case study from Singapore. Mar. Geol. 2023, 465. [Google Scholar] [CrossRef]
Figure 1.
(A) Map of the coastal areas of Brunei Bay, which are shaped by the modern Limbang, Temburong, Trusan, and Padas Rivers; the frame indicates the area depicted in panel B; (B) Simplified geological map of north Temburong District, the eastern exclave of Brunei Darussalam (modified after [
26]), indicating the positions of drilled sites TB1 to TB10; the dashed line indicates the position of SOAS Bridge shown on panel C; (C) surface lithology of the area at the SOAS Bridge from borehole data kindly provided by China State Construction Engineering Corporation Ltd. The surface peat domains, interpreted as peat pockets are locally interrupted by clay sediments. The inset shows the location of Brunei Darussalam on Borneo Island. Borehole data are not available from the grey areas.
Figure 2.
Stratigraphic profiles of the boreholes in Labu Peatland (refer to
Figure 1B for their positions). Arrows indicate the sampling depths for radiometric
14C dating, along with the corresponding ages. Note that the horizontal distance is not to scale.
Figure 2.
Stratigraphic profiles of the boreholes in Labu Peatland (refer to
Figure 1B for their positions). Arrows indicate the sampling depths for radiometric
14C dating, along with the corresponding ages. Note that the horizontal distance is not to scale.
Figure 3.
Schematic section of the Labu basin as it is interpreted by the boreholes TB1 to TB10.
Figure 3.
Schematic section of the Labu basin as it is interpreted by the boreholes TB1 to TB10.
Figure 4.
Stratigraphic profiles of the Labu cores with their respective total moisture, ash yield, pH, electrical conductivity, and redox potential. Lithologies are the same as in
Figure 2.
Figure 4.
Stratigraphic profiles of the Labu cores with their respective total moisture, ash yield, pH, electrical conductivity, and redox potential. Lithologies are the same as in
Figure 2.
Figure 5.
The C, H, N, S contents along the TB6 and TB5 peat cores (
○:value below detection limit). Lithologies are the same as in
Figure 2.
Figure 5.
The C, H, N, S contents along the TB6 and TB5 peat cores (
○:value below detection limit). Lithologies are the same as in
Figure 2.
Figure 6.
Van Krevelen [
40] diagram plotting atomic H/C ratio against atomic O/C ratio for the Labu peat samples.
Figure 6.
Van Krevelen [
40] diagram plotting atomic H/C ratio against atomic O/C ratio for the Labu peat samples.
Figure 7.
PAAS-normalised REE profiles for two sediment samples from core TB5, collected at depths of 0–25 cm and 100–133 cm (? are values below detection limits). The deeper sample (100–133 cm) exhibits higher total REE contents. Both profiles display concave-down patterns, indicative of REE influence by organic matter.
Figure 8.
Foraminifera species Elphidium craticulatum from the peat substrate of TB6; scale bar is 1 mm.
Figure 8.
Foraminifera species Elphidium craticulatum from the peat substrate of TB6; scale bar is 1 mm.
Figure 9.
Documentation of pollen under light microscope extracted from the sandy silt layer of TB4 core: 1- Rhizophora sp., 2- Palaquium sp., 3- Durio sp., 4 - Pandanus sp., 5a- Leguminosae, 5b- Salix sp., 6- Phyllanthus sp., 7- Elaeocarpus sp., 8- gen. indet. within Chenopodiaceae, 9a- Spore indet. 1, 9b- Spore indet. 2, and 10- Lygodium spore. The scale bars are 10 μm.
Figure 10.
A proposed model for the palaeoenvironmental evolution of Labu Peatland: (A) An estuarine environment established in the Labu Basin during Middle Holocene related to sea-level rise; (B) continuous sea-level rise established a lower delta setting in the Labu Basin between approximately 2,500 and 1,700 years BP; (C) despite sustained elevated sea levels, significant delta propagation occurred, resulting in the retraction of seawater from the region and the establishment of an upper delta system, analogous to present-day regime.
Table 1.
Details and data from the boreholes in the Labu peatland.
Table 1.
Details and data from the boreholes in the Labu peatland.
| Site/ Core |
Depth
(cm)
|
Lithology |
hg |
Total moisture
(wt. %)
|
Ash yield
(wt. %)
|
pH |
EC
(μS/cm)
|
Eh
(mV)
|
| TB2 |
0-5 |
Peat |
6 |
81.88 |
20.33 |
3.76 |
149.9 |
332.9 |
| 5-14 |
Peaty mud/ Clayey mud |
7 |
44.16 |
89.49 |
4.38 |
29.5 |
365.5 |
| 14-60 |
Peaty mud/ Clayey mud |
7 |
54.32 |
83.09 |
4.34 |
35.4 |
387.1 |
| 60-80 |
Peaty mud/ Clayey mud |
7 |
44.50 |
86.94 |
3.42 |
288.6 |
383.3 |
| 80-100 |
Peaty mud/ Clayey mud |
7 |
40.29 |
87.59 |
3.39 |
343.4 |
416.6 |
| 100-127 |
Peaty mud/ Clayey mud |
7 |
45.22 |
81.53 |
2.96 |
1577.6 |
416 |
| 127-159 |
Peaty mud/ Clayey mud |
|
41.68 |
85.64 |
2.95 |
1163.7 |
441.1 |
| 159-178 |
Clay |
|
35.99 |
93.07 |
3.16 |
1134 |
402.3 |
| 178-195 |
Clay |
|
31.28 |
93.67 |
5.28 |
777.2 |
216.3 |
| TB4 |
10-30 |
Clay |
|
51.70 |
90.69 |
4.39 |
94.8 |
241.8 |
| 30-70 |
Clay |
|
39.56 |
92.93 |
5.18 |
51.8 |
276.3 |
| 80-100 |
Clay |
|
37.43 |
92.35 |
3.48 |
388.4 |
341.4 |
| TB5 |
0-25 |
Peat |
7 |
85.17 |
5.72 |
3.84 |
92.9 |
451.8 |
| 25-50 |
Peat |
7 |
87.67 |
18.00 |
3.70 |
134.1 |
390.1 |
| 50-75 |
Peat |
7 |
85.07 |
25.59 |
3.30 |
333.0 |
420.2 |
| 75-100 |
Peat |
7 |
84.30 |
31.23 |
2.48 |
1883.0 |
409.5 |
| 100-133 |
Peat |
7 |
82.92 |
45.68 |
2.34 |
2630.0 |
426.3 |
| 133-150 |
clayey mud |
|
64.99 |
74.27 |
3.23 |
1080.9 |
414.9 |
| 150-175 |
Alternations of clayey mud and fine detrital mud |
|
55.93 |
77.96 |
3.28 |
1024.9 |
421.6 |
| 175-200 |
|
55.03 |
78.60 |
3.23 |
1285.0 |
429.9 |
| 200-225 |
|
55.13 |
79.02 |
3.32 |
1124.1 |
416.0 |
| 225-250 |
|
54.20 |
79.51 |
2.79 |
1693.0 |
405.1 |
| 300-320 |
Clay |
|
57.84 |
90.45 |
3.82 |
575.2 |
370.0 |
| TB6 |
8-30 |
Peat |
6 |
83.06 |
26.28 |
4.32 |
57.8 |
378.4 |
| 30-50 |
Peat |
6 |
82.65 |
40.25 |
4.07 |
97.7 |
388.7 |
| 50-75 |
Peat |
6 |
77.24 |
50.00 |
3.13 |
498.9 |
418.8 |
| 75-100 |
Peat |
6 |
76.58 |
54.46 |
2.73 |
1270.6 |
421.4 |
| 105-130 |
Clayey mud |
|
65.61 |
71.91 |
2.74 |
2019.2 |
425.4 |
| 130-150 |
Clayey mud |
|
64.29 |
69.05 |
2.97 |
1267 |
427 |
| 230-250 |
Clay |
|
34.64 |
92.13 |
3.27 |
1116.6 |
405.7 |
| 490-520 |
Clay |
|
35.42 |
93.03 |
6.48 |
341.5 |
294.7 |
| TB10 |
0-25 |
Peat |
6 |
81.82 |
35.71 |
3.78 |
72.3 |
346.3 |
| 25-50 |
Mud |
7 |
62.98 |
80.40 |
3.67 |
45.3 |
444.8 |
| 50-78 |
Mud |
7 |
64.71 |
73.48 |
3.15 |
212.0 |
426.2 |
| 78-91 |
Mud |
|
64.38 |
79.41 |
2.45 |
1766.0 |
454.8 |
| 91-102 |
clayey mud |
|
54.17 |
82.98 |
2.88 |
1530.2 |
431.2 |
| 120-140 |
Clay |
|
46.22 |
87.17 |
2.99 |
1054.3 |
414.3 |
Table 2.
CHNSO data from the samples of the Labu peatland (daf: dry-ash free basis; -: below detection limit).
Table 2.
CHNSO data from the samples of the Labu peatland (daf: dry-ash free basis; -: below detection limit).
Site/
Core
|
Depth
(cm)
|
Lithology |
C
(wt.% daf)
|
H
(wt.% daf)
|
N
(wt.% daf)
|
S
(wt.% daf)
|
O
(wt.% daf)
|
H/C
atomic ratio
|
O/C
atomic ratio
|
C/N
atomic ratio
|
| TB2 |
0-5 |
Peat |
49.86 |
5.68 |
3.13 |
0.31 |
41.02 |
1.37 |
0.62 |
18.57 |
| 5-14 |
Peaty mud/ Clayey mud |
36.30 |
4.28 |
4.08 |
34.24 |
21.10 |
1.42 |
0.44 |
10.38 |
| 14-60 |
Peaty mud/ Clayey mud |
36.68 |
4.43 |
2.83 |
27.37 |
28.69 |
1.45 |
0.59 |
15.14 |
| 60-80 |
Peaty mud/ Clayey mud |
|
|
|
|
|
|
|
|
| 80-100 |
Peaty mud/ Clayey mud |
|
|
|
|
|
|
|
|
| 100-127 |
Peaty mud/ Clayey mud |
|
|
|
|
|
|
|
|
| 127-159 |
Peaty mud/ Clayey mud |
|
|
|
|
|
|
|
|
| 159-178 |
Clay |
|
|
|
|
|
|
|
|
| 178-195 |
Clay |
|
|
|
|
|
|
|
|
| TB5 |
0-25 |
Peat |
56.98 |
6.72 |
2.48 |
0.39 |
33.43 |
1.42 |
0.44 |
26.81 |
| 25-50 |
Peat |
61.24 |
6.08 |
0.95 |
1.40 |
30.33 |
1.19 |
0.37 |
75.21 |
| 50-75 |
Peat |
51.99 |
4.51 |
0.77 |
2.44 |
40.29 |
1.04 |
0.58 |
78.61 |
| 75-100 |
Peat |
56.46 |
5.50 |
0.47 |
4.60 |
32.97 |
1.17 |
0.44 |
140.15 |
| 100-133 |
Peat |
51.00 |
5.23 |
0.58 |
6.37 |
36.82 |
1.23 |
0.54 |
102.59 |
| 133-150 |
clayey mud |
|
|
|
|
|
|
|
|
| 150-175 |
Alternations of clayey mud and fine detrital mud |
|
|
|
|
|
|
|
|
| 175-200 |
|
|
|
|
|
|
|
|
| 200-225 |
|
|
|
|
|
|
|
|
| 225-250 |
|
|
|
|
|
|
|
|
| 300-320 |
Clay |
|
|
|
|
|
|
|
|
| TB6 |
8-30 |
Peat |
51.77 |
5.29 |
1.30 |
0.26 |
41.38 |
1.23 |
0.60 |
46.54 |
| 30-50 |
Peat |
49.81 |
4.69 |
0.95 |
0.99 |
43.56 |
1.13 |
0.66 |
60.96 |
| 50-75 |
Peat |
46.40 |
4.56 |
0.78 |
3.23 |
45.03 |
1.18 |
0.73 |
69.41 |
| 75-100 |
Peaty mud |
41.17 |
4.39 |
0.72 |
5.96 |
47.76 |
1.28 |
0.87 |
66.70 |
| 105-130 |
Clayey mud |
|
|
|
|
|
|
|
|
| 130-150 |
Clayey mud |
|
|
|
|
|
|
|
|
| 230-250 |
Clay |
|
|
|
|
|
|
|
|
| 490-520 |
Clay |
|
|
|
|
|
|
|
|
| TB10 |
0-25 |
Peat |
59.69 |
5.92 |
2.20 |
1.76 |
30.42 |
1.19 |
0.38 |
31.61 |
| 25-50 |
Mud |
88.28 |
- |
1.45 |
1.38 |
8.88 |
- |
0.08 |
70.81 |
| 50-78 |
Mud |
63.47 |
- |
0.95 |
1.86 |
33.72 |
- |
0.40 |
78.02 |
| 78-91 |
Mud |
60.13 |
- |
- |
7.48 |
32.39 |
- |
0.40 |
- |
| 91-102 |
clayey mud |
|
|
|
|
|
|
|
|
| 120-140 |
Clay |
|
|
|
|
|
|
|
|
Table 3.
Trace element contents (on dry basis) of peat samples obtained from 0-25 cm and 100-133 cm depths from core TB5 (-: below detection limit). The average composition of the upper continental crust is provided after McLennan [
46] and Wedepohl [
47]. Ce
anom: PAAS-normalised log
10[3Ce
N/(2La
N + Nd
N)].
| Element |
Unit |
Detection limit |
0-25
cm
|
100-123 cm |
McLennan (2001) |
Wedepohl (1995) |
Element |
Unit |
Detection limit |
0-25
cm
|
100-123 cm |
McLennan (2001) |
Wedepohl (1995) |
| Ti |
wt. % |
0.001 |
- |
- |
0.41 |
0.3117 |
Mo |
ppm |
0.01 |
0.17 |
5.7 |
1.5 |
1.4 |
| Al |
wt. % |
0.01 |
0.31 |
0.81 |
8.04 |
7.7440 |
Nb |
ppm |
0.1 |
- |
- |
12 |
26 |
| Fe |
wt. % |
0.01 |
0.32 |
1.46 |
3.50 |
3.0890 |
Nd |
ppm |
0.02 |
0.77 |
1.71 |
26 |
25.9 |
| Mg |
wt. % |
0.01 |
0.05 |
0.11 |
1.33 |
1.3510 |
Ni |
ppm |
0.1 |
3.2 |
12.8 |
44 |
18.6 |
| Ca |
wt. % |
0.01 |
0.2 |
0.07 |
3.00 |
2.9450 |
Pb |
ppm |
0.1 |
2.2 |
8.5 |
17 |
17 |
| Na |
wt. % |
0.001 |
0.016 |
0.03 |
2.89 |
2.5670 |
Pr |
ppm |
0.1 |
0.1 |
0.3 |
7.1 |
6.3 |
| K |
wt. % |
0.01 |
0.01 |
0.09 |
2.80 |
2.8650 |
Rb |
ppm |
0.1 |
0.6 |
7.9 |
112 |
110 |
| P |
wt. % |
0.001 |
0.047 |
0.007 |
0.07 |
0.0665 |
Re |
ppm |
0.001 |
- |
0.004 |
0.0004 |
|
| S |
wt. % |
1 |
- |
3 |
|
0.0953 |
Sb |
ppm |
0.02 |
- |
0.15 |
0.2 |
0.31 |
| Ag |
ppm |
0.002 |
0.021 |
0.028 |
0.05 |
0.055 |
Sc |
ppm |
0.1 |
- |
1.8 |
13.6 |
7 |
| As |
ppm |
0.1 |
0.7 |
3.1 |
1.5 |
2 |
Se |
ppm |
0.1 |
0.2 |
0.2 |
50 |
0.083 |
| B |
ppm |
1 |
2 |
5 |
15 |
17 |
Sm |
ppm |
0.1 |
0.2 |
0.6 |
4.5 |
4.7 |
| Ba |
ppm |
0.5 |
8.3 |
8.5 |
550 |
668 |
Sn |
ppm |
0.05 |
0.07 |
0.29 |
5.5 |
2.5 |
| Be |
ppm |
0.1 |
0.1 |
0.2 |
3 |
3.1 |
Sr |
ppm |
0.5 |
21.9 |
13.3 |
350 |
316 |
| Bi |
ppm |
0.02 |
- |
0.15 |
0.127 |
0.123 |
Ta |
ppm |
0.05 |
- |
- |
1 |
1.5 |
| Cd |
ppm |
0.01 |
0.02 |
0.05 |
0.098 |
0.102 |
Tb |
ppm |
0.1 |
- |
0.1 |
0.64 |
0.5 |
| Ce |
ppm |
0.01 |
1.21 |
2.41 |
64 |
65.7 |
Te |
ppm |
0.02 |
- |
0.04 |
|
|
| Co |
ppm |
0.1 |
0.8 |
5.6 |
17 |
11.6 |
Th |
ppm |
0.1 |
- |
1.3 |
10.7 |
10.3 |
| Cr |
ppm |
1 |
3 |
9 |
83 |
35 |
Tl |
ppm |
0.02 |
- |
0.08 |
0.75 |
0.75 |
| Cs |
ppm |
0.02 |
0.09 |
1.15 |
4.6 |
5.8 |
Tm |
ppm |
0.1 |
- |
- |
0.33 |
|
| Cu |
ppm |
0.2 |
3.9 |
24.6 |
25 |
14.3 |
U |
ppm |
0.1 |
0.8 |
4.9 |
2.8 |
2.5 |
| Dy |
ppm |
0.1 |
0.2 |
0.5 |
3.5 |
2.9 |
V |
ppm |
1 |
4 |
14 |
107 |
53 |
| Er |
ppm |
0.1 |
- |
0.2 |
2.3 |
|
W |
ppm |
0.1 |
- |
- |
2 |
1.4 |
| Eu |
ppm |
0.1 |
- |
0.2 |
0.88 |
0.95 |
Y |
ppm |
0.01 |
0.64 |
1.91 |
22 |
20.7 |
| Ga |
ppm |
0.02 |
0.33 |
2.36 |
17 |
14 |
Yb |
ppm |
0.1 |
- |
0.1 |
2.2 |
1.5 |
| Gd |
ppm |
0.1 |
0.4 |
0.7 |
3.8 |
2.8 |
Zn |
ppm |
0.1 |
14.7 |
21.5 |
71 |
52 |
| Ge |
ppm |
0.1 |
- |
- |
1.6 |
1.4 |
Zr |
ppm |
0.1 |
0.2 |
0.4 |
190 |
237 |
| Hf |
ppm |
0.1 |
- |
- |
5.8 |
5.8 |
Au |
ppb |
0.5 |
3.3 |
6.2 |
1.8 |
|
| Ho |
ppm |
0.1 |
- |
- |
0.8 |
0.62 |
Hg |
ppb |
10 |
330 |
50 |
|
|
| In |
ppm |
0.02 |
- |
- |
0.05 |
0.061 |
Th/U |
|
|
- |
0.27 |
|
|
| La |
ppm |
0.5 |
0.7 |
0.9 |
30 |
32.3 |
Sr/Ba |
|
|
2.64 |
1.56 |
|
|
| Li |
ppm |
0.1 |
0.3 |
7.5 |
20 |
22 |
Ceanom
|
|
|
-0.11 |
-0.03 |
|
|
| Lu |
ppm |
0.1 |
- |
- |
0.32 |
0.27 |
(Cu+Mo)/Zn |
|
|
0.28 |
1.41 |
|
|
| Mn |
ppm |
1 |
17 |
22 |
600 |
527 |
Authigenic U |
|
|
0.78 |
4.47 |
|
|
Table 4.
Summary of the mineral phases obtained from XRD analysis from the samples of the Labu cores.
Table 4.
Summary of the mineral phases obtained from XRD analysis from the samples of the Labu cores.
| Core |
Depth (cm) |
Lithology |
Minerals |
| TB5 |
225-250 |
Clayey mud/Clay |
quartz, muscovite/illite, pyrite |
| 300-320 |
Clay |
quartz, muscovite/illite, pyrite |
| TB4 |
10-30 |
Clay |
quartz, muscovite/illite |
| 30-70 |
Clay |
quartz, muscovite/illite |
| TB2 |
100-127 |
Clayey mud |
quartz, muscovite/illite, pyrite |
| 127-159 |
Clayey mud |
quartz, muscovite/illite, pyrite |
Table 5.
Trace element contents (on dry basis) of peat samples obtained from 0-25 cm and 100-133 cm depths from core TB5.
Table 5.
Trace element contents (on dry basis) of peat samples obtained from 0-25 cm and 100-133 cm depths from core TB5.
| Core |
Sample type |
Dated material |
Depth interval
(cm)
|
δ13C
(‰)
|
Radiocarbon date
(years BP)
|
Model date
(1σ cal BP)
|
Model date
(2σ cal BP)
|
| TB5 |
Peat |
Plant remains |
123 – 133 |
-29.16 |
2,454 ± 30 |
2,698 – 2,373 |
2,704 – 2,363 |
| TB10 |
Peaty mud |
Plant remains |
69 – 78 |
-29.69 |
1,807 ± 30 |
1,736 – 1,631 |
1,818 – 1,612 |
|
Disclaimer/Publisher’s Note: The statements, opinions and data contained in all publications are solely those of the individual author(s) and contributor(s) and not of MDPI and/or the editor(s). MDPI and/or the editor(s) disclaim responsibility for any injury to people or property resulting from any ideas, methods, instructions or products referred to in the content. |