
Submitted:
10 October 2025
Posted:
11 October 2025
You are already at the latest version
Abstract
Doggerland was a large, prehistoric land bridge connecting Britain to the continent across the southern North Sea, which was submerged as a result of climate change and sea level rise following the last glaciation. This study presents an analysis of a core (ELF019) extracted from the submerged landscape. It was recovered as part of the ERC-funded Advanced Grant, Europe’s Lost Frontiers (ELF). Study was undertaken of the core’s thermal properties, mineralogy, organic and inorganic chemistry in order to reconstruct its environmental history. Exact shifts in the paleoenvironments were detected during this process. Emergent aquatic vegetation deposits dominated the lower parts of the core, terrestrial vegetation dominated the central section, followed by a marine deposit covering the top meter of the core. Samples from the middle of the core were radiocarbon dated to the Greenlandian stage of the Lower Holocene. The results presented here will contribute within a larger geomorphological, topographical, and archaeological study as a part of ELF project. Establishing the paleoenvironmental depositional settings of core ELF019 and other cores will so greatly aid palaeolandscape reconstruction at a local and regional scale.
Keywords:
Doggerland
; Holocene
; submerged
; palaeolandscape
; reconstruction
; chemostratigraphy
; core sediment
1. Introduction
During the Late Pleistocene and Early Holocene, the island of Britain and the continent Europe were connected by a land-bridge known as Doggerland, which now lies beneath the southern North Sea (Gaffney et al., 2009; Ward et al., 2006). Submergence of this area occurred within a relatively short period of time, with the sea level rising and the devastating events such as the Storegga tsunami, being linked with the eventual loss of these lands (Bateman et al., 2021; Walker et al., 2020). The final submergence occurred approximately 8150 ± 30 Cal BP, with exception of a littoral extension off the eastern coast of England and, perhaps, a remnant of the Dogger Island (Gaffney et al., 2020; Weninger et al., 2008). The whole of Doggerland was fully submerged by 7000 BP (Gaffney et al., 2020; Weninger et al., 2008). Awareness of the archaeological significance of Doggerland increased sharply during the first decades of the twentieth century; largely as a result to the large quantities of prehistoric material recovered through trawling or dredging (Ballin, 2017; Van der Plicht et al., 2016). The potential of the area to retain well preserved Pleistocene/early Holocene landscapes, and that these might contain critical information on human response to climate change was also of considerable interest (Fitch et al., 2005). Today, Doggerland is seen as a key area to understand the development of North-western Europe in the late Paleolithic and early Mesolithic (Gaffney et al., 2009; Ward et al., 2006). Cores from this inundated landscape are now understood to provide an outstanding natural archive and hold significant geochemical information, from which past ecological conditions can be reconstructed (Blumenberg et al., 2022; Mulder & Alexander, 2001; Yamoah et al., 2016). Multiple proxy geochemical techniques have previously been used to reconstruct palaeolandscapes for archaeological and geological purposes (Gaffney et al., 2020; Missiaen et al., 2021; Van Geel et al., 2024). In this paper, four analytical methods were applied:
Thermal analysis using a Thermogravimetric Analyzer (TGA), this is a common classification and characterization method, which differentiates sediment samples based on their organic matter and carbonate content (Bensharada et al., 2021; Gaffney et al., 2020). Lipid analysis using Gas Chromatography-Mass Spectrometry (GC-MS), used to identify the natural sources of extractable lipid from their distinctive biomarker, which is then used to distinguish between aquatic and terrestrial vegetations (Bensharada et al., 2022; Ficken et al., 2000; Hu & Chivas, 2009; Rielley et al., 1991; Sikes et al., 2009). In this paper, three biomarkers: n-alkanes, fatty acids, and sterols are used to identify different environmental depositions (Ficken et al., 2000; Hu & Chivas, 2009; Sikes et al., 2009; Vaezzadeh et al., 2015; Xia et al., 2008). Core scanning X-ray fluorescence (XRF), this delivers a continuous elemental profile of the core to understand both the mineralogy, and the conditions of the core deposition (Davies et al., 2015; Huang et al., 2016). Although XRF scanning of core ELF019 has already been carried out and published as a separate case study in Finlay et al. (2022). In this paper the XRF results were widely explored, integrated and compared to the thermal and lipid analysis as an aid in understanding the depositional history of the core. Radiocarbon analysis, used to provide a chorological context for the core sediments, and carried out using any organic remains of wood, shells, humic acid etc, that could be recovered from within the core (Dunbar et al., 2016).
The integration of the different analytical approaches outlined above can provide a complete geochemical assessment of the conditions and materials deposited throughout the core, enabling an understanding of both the detrital and organic components of the analyzed material. In addition, this complete record of the core means that XRF data can be used to identify exact positions that sudden paleogeographic/paleoenvironmental changes (e.g. flooding surfaces) occurred. Furthermore, the continuous nature of the XRF data provides a framework within which to place the individual sampled lipid and thermal data, thereby enabling interpolation between data points. The radiocarbon dates provide a chorological context for the core. Here we demonstrate how the integration of these disparate techniques can be utilized to assist in the reconstruction of marine palaeolandscapes.
2. Materials and Methods
2.1. Material and Samples’ Description
Core ELF019 was 4.43 m in length, it was collected as a part of ELF project, an ERC-funded research program that aimed to understand the palaeolandscape and inundation processes associated with the loss of Doggerland (Gaffney et al., 2017). A total of 78 cores from 60 different locations from the Southern River (Figure 1) were collected using the Vibracoring technique. After collection, all 78 cores were stored in a cold (2.0 ± 0.5 °C) and dry store at the University of Wales (Trinity St David). Core ELF019’s location, length, place of store, sample number, a full lithological description of the sampled area, along with a photograph of the core are presented in Table 1. This core was sampled with several factors taken into consideration; the modern sediments at the top were ignored as they were outside of the overall research goals. In addition, when the research program started, core ELF019 had already been sampled by other project team specialists. Sampling the same areas was essential for comparability during the analysis. During sampling, any area that appeared to be distinct on the basis of its physical properties, such as colour or the sediment type (mud, soil, silt, etc.), was sampled. Fifteen individual samples were taken for lipid and thermal analysis (Table 1), whilst only the top three meters were scanned to focus. On the basis of studies across the project cores, this area was most likely to be associated with the Holocene transition around two meters from the seabed surface.
2.2. Thermal Analysis
A TGA Q5000IR (TA Instruments, USA) was used for the analysis. The TGA method used in this paper was developed by Bensharada et al. (2021). Briefly, prior to analysis, each sample was dried, ground, and homogenized. 40 ± 10 mg from each sample was individually placed into the instrument onto a high-temperature platinum pan. The sample chamber was purged with air at a flow rate of 25 mL/min, while a nitrogen atmosphere was utilized for the balance housing at 40 °C. A heating rate of 10 °C/min was used to heat the samples from room temperature to 150 °C, followed by an isothermal period of 30 min to remove all moisture. A second heating stage (10 °C/min) took the samples to 550 °C, where the temperature was again held for 30 min ensuring complete combustion of all organic matter. A final heating stage (10 °C/min) took the samples to 950 °C with an isothermal period of 30 min to ensure that all carbonates in the sample were thermally degraded. The mass lost during these three heating stages corresponds to the quantity of moisture, organic matter and carbonate content respectively (Bensharada et al., 2021; Heiri et al., 2001; Konare et al., 2010). The percentage of organic matter and carbonate content were utilized to identify, characterize and classify the sedimentary deposits of the core, distinguishing between various horizon and layers (Duplisea, 2000; Radomirović et al., 2021). The moisture content was ignored as it does not provide significant information to this study, and was problematic to accurately measure (Bensharada et al., 2021).

Table 1.
The core location, sampling date, samples’ depths, lithological description and the core photo.
Table 1.
The core location, sampling date, samples’ depths, lithological description and the core photo.
| Core name | ELF019 | Location of samples | Cold Store, Lampeter |
|---|---|---|---|
| Easting | 389810.11 | Northing | 5888140.79 |
| Sample number | Depth(m) | Lithological description | Core photo |
| 1 | 0.38 | Pale grey silt with fine laminations of sand at the top, organic material in the middle. Laminations are discontinuous and wavy, 1-3 mm thick. | 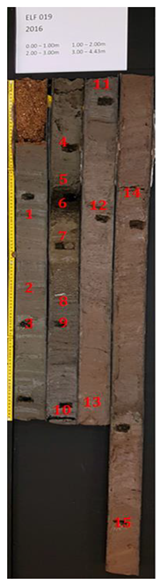 |
| 2 | 0.59 | Pale grey silt with thin grey sand laminated up to 3 mm thick with organic laminations 1-2 mm thick. | |
| 3 | 0.71 | Pale grey silt with discontinuous and thick laminations. | |
| 4 | 1.17 | Pale grey silt with black organic flecks. Sand filled void at top of unit with shell fragments. Discrete patches of shell. Broken inset molluscs. | |
| 5 | 1.28 | Mid grey/brownish grey silt with common shell fragments. Bottom 1 cm thin discontinuous organic laminations. | |
| 6 | 1.33 | Dark brownish grey organic silt, coarsening downwards to medium fine sand with common shell fragments and discrete lumps of plant material. | |
| 7 | 1.44 | Pale, brownish, grey slightly sandy silt with occasional shell fragments, Occasional pale grey discontinuous laminations 1-3 mm. | |
| 8 | 1.64 | Mid grey medium sand with occasional sandy silt laminations discontinuous 2-3 mm thick. Some thicker sandy silt laminations discontinuous 2-3 mm thick. Some thicker sandy silt laminations up to 1 cm, towards base. Occasional shell fragments. | |
| 9 | 1.69 | Pale brownish grey silt to fine sandy silt, laminated 0.5 cm thick laminations at top becoming finer at depth. Below 1.9 m laminations commonly contain dark organic material. | |
| 10 | 1.98 | Dark brown organic silt. | |
| 11 | 2.03 | Grey slightly sandy silt bedded with fine grain sands, some discontinuous black organic laminations towards base. | |
| 12 | 2.32 | Greyish brown fine sand becoming sandy silt with depth. Occasional black stained patches. Occasional black sandy laminations towards base. | |
| 13 | 2.93 | Greyish brown fine sand becoming sandy silt with depth. Occasional black stained patches. Occasional black sandy laminations towards base. | |
| 14 | 3.31 | Greyish brown fine sand becoming sandy silt with depth. Occasional black stained patches. Occasional black sandy laminations towards base | |
| 15 | 4.30 | Orange brown medium sand with grey brown clay silt laminations, dipping steeply; discontinuous. |
2.3. Lipid Analysis
For the total lipid extraction, the samples were dried at room temperature for 48 hours and then ground down using a mortar and a pestle. Three portions of 12 mL of the extraction solvent (dichloromethane: methanol 2:1 v/v) were used on ~3 g of each sample, with three ultrasonication and centrifugation cycles. The extracted lipids were then transferred into clean glass vials, and dried under a stream of nitrogen at 40 °C. The extracted dried lipids were then silylated with ~5 drops of BSTFA at 70 °C for an hour. The excess BSTFA was removed under a stream of nitrogen. Finally, the samples were reconstituted in 1 mL of dichloromethane for analysis. The lipid analysis was undertaken using an Agilent 7890A gas chromatograph coupled with a 5975C Inert XL mass selective detector. The carrier gas used was helium and was kept at a constant flow of 1.2 mL/min. The splitless injector was maintained at 300 °C, and the interface was maintained at 340 °C. The injected volume was 1 µL per injection, per sample. The GC was fitted with a 30 m x 0.25 mm, 0.25 µm film thickness 5% Phenyl Methyl Siloxane phase fused silica Rxi-5Sil MS column. The oven temperature was programmed from 50 °C (2 min) to 350 °C (10 min) at 10 °C/min. The column was directly inserted into the ion source where electron impact (EI) spectra were obtained at 70 eV, and the samples were analyzed using a scan method from m/z 50 to 800.
For this study only the three biomarker groups; n-alkanes, fatty acids and sterols, were used as indicators of environmental conditions and sources (Martínez et al., 2019; Meyers & Ishiwatari, 1993; Sikes et al., 2009). For biomarker identification, the Exacted Ion Chromatogram (EIC) was used to identify the n-alkanes and fatty acids. The EIC for the n-alkanes was m/z 57, for the fatty acids this was m/z 73, and for the sterols were m/z 255 and m/z 273, with a range of m/z -0.30 to +0.70. The peak areas of the identified biomarkers were used for semiquantitative analysis. Whilst only these three biomarkers were used in this study, other organic compounds such as n-alkanols and monounsaturated fatty acids were detected in some of the samples. That data was not considered, as they were only detected in a few samples and not at any significant abundance to justify any further discussion.
The Carbon Preference Index (CPI) of the n-alkanes is a ratio used to distinguish terrestrial and marine inputs. Terrestrial plants produce a CPI higher than four, while for marine inputs it is lower than four. The CPI was calculated as in equation 1 (Collister et al., 1994; Sikes et al., 2009).
CPI = (∑odd n-alkanes C15 to C33)/(∑even n-alkanes C14 to C34)
The marine n-alkanes proxy ratio (Pmar-aq) is designed to separate between terrestrial inputs, emergent aquatic plants, aquatic plants and marine macrophytes (Sikes et al., 2009). The n-alkanes proxy ratio (Paq) was initially defined by (Ficken et al., 2000) with no marine input included as it was developed on lakes sediments. The authors concluded that Paq <0.1 corresponds to terrestrial plants, 0.1-0.4 corresponds to emergent macrophytes and 0.4-1 corresponds to submerged/floating macrophytes. This Paq was tested and confirmed to be a valid proxy in marine sediment through comparison with SedaDNA, environmental, pollen, diatoms and lithostratigraphic analyses by Gaffney et al. (2020). However, Pmar-aq has been developed by (Sikes et al., 2009) to include coastal marine sediment, establishing a new parameter renamed as Pmar-aq and this was used in the present study. The Pmar-aq low value of 0.01-0.25 corresponds to terrestrial inputs, ~0.4-0.6 corresponds to emergent aquatic plants, while high values >0.6 corresponds to aquatic plants and marine macrophytes (Sikes et al., 2009). The Pmar-aq ratio was calculated using equation 2.
Pmar-aq = (C23 + C25)/(C23 + C25 + C29 + C31)
2.4. X-Ray Fluorescence
The XRF analysis was undertaken using an Itrax core scanner at Aberystwyth University, applying the method that were described in detail in Finlay et al. (2022). Principal Component Analysis (PCA), a statistical method, was used to identify patterns in the data in multiple dimensions and to help understand the compositional controls on elemental variations within the core. An in-depth description in how PCA was used, and the obtained PCA of elemental data for core ELF019 can be found in Finlay et al. (2022). conclusions that can be drawn.
2.5. Radiocarbon Analysis
The 14C dating was carried out at the Accelerator Mass Spectrometry (AMS) laboratory, in the Scottish Universities Environmental Research Centre (SUERC). A detailed description of the applied methodology can be found in Dunbar et al. (2016). The obtained 14C ages were quoted in conventional years BP, while they were calibrated using IntCal13 atmospheric calibration curve (Dunbar et al., 2016).
3. Results
3.1. TGA Results
The fifteen samples were thermally analyzed, using TGA, to measure the percentage of organic matter and carbonate content, which are listed in Table 2. Based on the TGA results, there are two major alterations in the sediment, which divides the core into three depositional areas, labelled as A, B and C in Figure 2. Area C, covering the bottom of the core, is 2.32 m in length and includes six samples from sample 15 (4.30 m) to sample 10 (1.98 m) (Table 2 and Figure 2). Area B is 0.52 m in length and includes six samples from sample 9 (1.69 m) to sample 4 (1.17 m). This area contains the sample with the highest percentage of organic matter (11.60%; Table 2 and Figure 2). Additionally, this area contains the sample with the highest percentage of carbonates (13.90%). Area A, at the top of the core, is 0.33 m in length, and includes three samples, from sample 3 (0.71 m) to sample 1 (0.38 m). The determination of these three major lithological areas was significant for understanding of the core’s history.
3.2. Lipid Results
After applying the EIC for the n-alkanes (m/z 57), the fatty acids (m/z 73), and for the sterols (m/z 255 and m/z 273) with a range of m/z -0.30 to +0.70, the ratios CPI, Pmar-aq and the percentages of C16 fatty acids were calculated and these are presented in Table 2.
The five samples from fifteen (4.30 m) to eleven (2.03 m) produced similar n-alkane profiles, the CPI ratios are within the limit of aquatic input (Table 2) (Collister et al., 1994; Sikes et al., 2009). The Pmar-aq ratio of the sample thirteen (0.25) suggested terrestrial sources, while the Pmar-aq ratios of the other four samples in the area suggested emergent aquatic plants (Table 2) (Eglinton & Hamilton, 1967; Ficken et al., 2000; Sikes et al., 2009). Fatty acids were restricted to C14 and C16, which could be produced by land or aquatic vegetation, and these results may indicate a lake, river or estuarine environment (He et al., 2016; Meyers & Ishiwatari, 1993).
Table 2.
The samples depths and numbers, the percentages of carbonate content, the percentages of organic matter, thermal area, CPI, Pmar-aq and the percentage of C16:00 fatty acids. ND = Not Detected.
Table 2.
The samples depths and numbers, the percentages of carbonate content, the percentages of organic matter, thermal area, CPI, Pmar-aq and the percentage of C16:00 fatty acids. ND = Not Detected.
| Sample number | Depth (m) | Organic % | Carbonate % | Thermal area | CPI | Pmar-aq | C16 fatty acid % |
|---|---|---|---|---|---|---|---|
| 1 | 0.38 | 6.26 | 3.69 |
A |
3.07 | 0.64 | 65.86 |
| 2 | 0.59 | 3.19 | 4.20 | 3.35 | 0.79 | 54.09 | |
| 3 | 0.71 | 5.23 | 4.83 | 3.25 | 0.72 | ND | |
| 4 | 1.17 | 8.19 | 5.36 |
B |
3.22 | 0.41 | ND |
| 5 | 1.28 | 9.53 | 7.16 | 4.86 | ND | 38.50 | |
| 6 | 1.33 | 9.81 | 7.35 | 5.14 | ND | 32.60 | |
| 7 | 1.44 | 11.53 | 13.89 | 3.60 | 0.69 | 17.25 | |
| 8 | 1.64 | 11.58 | 1.51 | 2.25 | 0.55 | ND | |
| 9 | 1.69 | 9.16 | 2.80 | 2.50 | 0.58 | ND | |
| 10 | 1.98 | 1.08 | 0.62 |
C |
8.86 | ND | 13.38 |
| 11 | 2.03 | 4.17 | 4.08 | 3.40 | 0.43 | ND | |
| 12 | 2.32 | 3.50 | 2.90 | 2.26 | 0.57 | ND | |
| 13 | 2.93 | 3.96 | 3.90 | 2.57 | 0.25 | ND | |
| 14 | 3.31 | 3.94 | 4.09 | 2.17 | 0.37 | ND | |
| 15 | 4.30 | 3.99 | 4.07 | 2.08 | 0.35 | ND |
The first major change in the lipid data was observed at sample ten (1.98 m), where the n-alkanes were dominated by C27 and C29 (D in Figure 3). This change was accompanied with a major increase in the CPI value, reaching its highest value (8.86) among all fifteen samples (Table 2). These changes were not only observed in the n-alkanes pattern, but also in the fatty acids and sterol profiles, indeed, this sample is the richest in fatty acids. Even numbered fatty acids from C8 to C26 were detected, in addition to the odd numbered C9, C17 and C27. The C16 percentage was 13.38%, this percentage indicating terrestrial sources (Ali et al., 2004). These land-derived compounds were accompanied with a determination of one main terrestrial sterol (β-sitosterol) (Xiao et al., 2013). This sample presented substantial indicators of terrestrial input.
Samples nine (at 1.69 m) and eight (at 1.64 m) indicated a return to aquatic inputs as the n-alkane distribution pattern was dominated by the mid-chain C21 and C23 (e.g. C in Figure 3). The CPI ratios dropped to the limit of aquatic sources (< 4) and the Pmar-aq of these samples indicated emergent aquatic plants (Sikes et al., 2009). The two ubiquitous compounds, C16 fatty acid and ergostanol, were detected in both samples, however, they did not provide information that could assist the interpretation (Mackenzie et al., 1982).
The next significant change in the lipid data started at sample seven (1.44 m) and continued to sample five (1.28 m). The n-alkane distribution patterns were dominated by C27 and C29 (e.g. B in Figure 3), with a considerable increase in CPI ratios to the value expected from terrestrial sources (CPI > 4) (Table 2) (Rielley et al., 1991; Sikes et al., 2009). That was accompanied with the detection of three sterols, the ubiquitous ergostanol and two typical terrestrial sterols (campesterol and β-sitosterol) (Xiao et al., 2013). Even though sample seven (1.44 m) produced CPI slightly lower than four (3.60), which is just within the limit of aquatic vegetation, the n-alkanes, sterols and fatty acids combined results strongly indicated that terrestrial vegetations were the principal sources of lipids in this area.
The samples from four (1.17 m) to one (0.38 m), which cover the top sampled part of the core, produced similar n-alkane profiles, with odd-over-even carbon numbers, and dominated by the mid-chain compounds with the most prevalent being C21 and C23 (e.g. A in Figure 3). The CPI decreased to the limit of aquatic inputs, while Pmar-aq ratios suggested that the aquatic inputs were marine macrophytes (Table 2) (Collister et al., 1994; Sikes et al., 2009). In addition, the fatty acids C14, C16, C18 and C20 were identified only in samples two (0.59 m) and one (0.38 m) (Table 2). It was notable that the percentages of C16 increase sharply, to above 40%, the limit of aquatic vegetation (Table 2) (Ali et al., 2004). Notably, sterols were not detected in these samples.
3.3. XRF and Chemostratigraphy
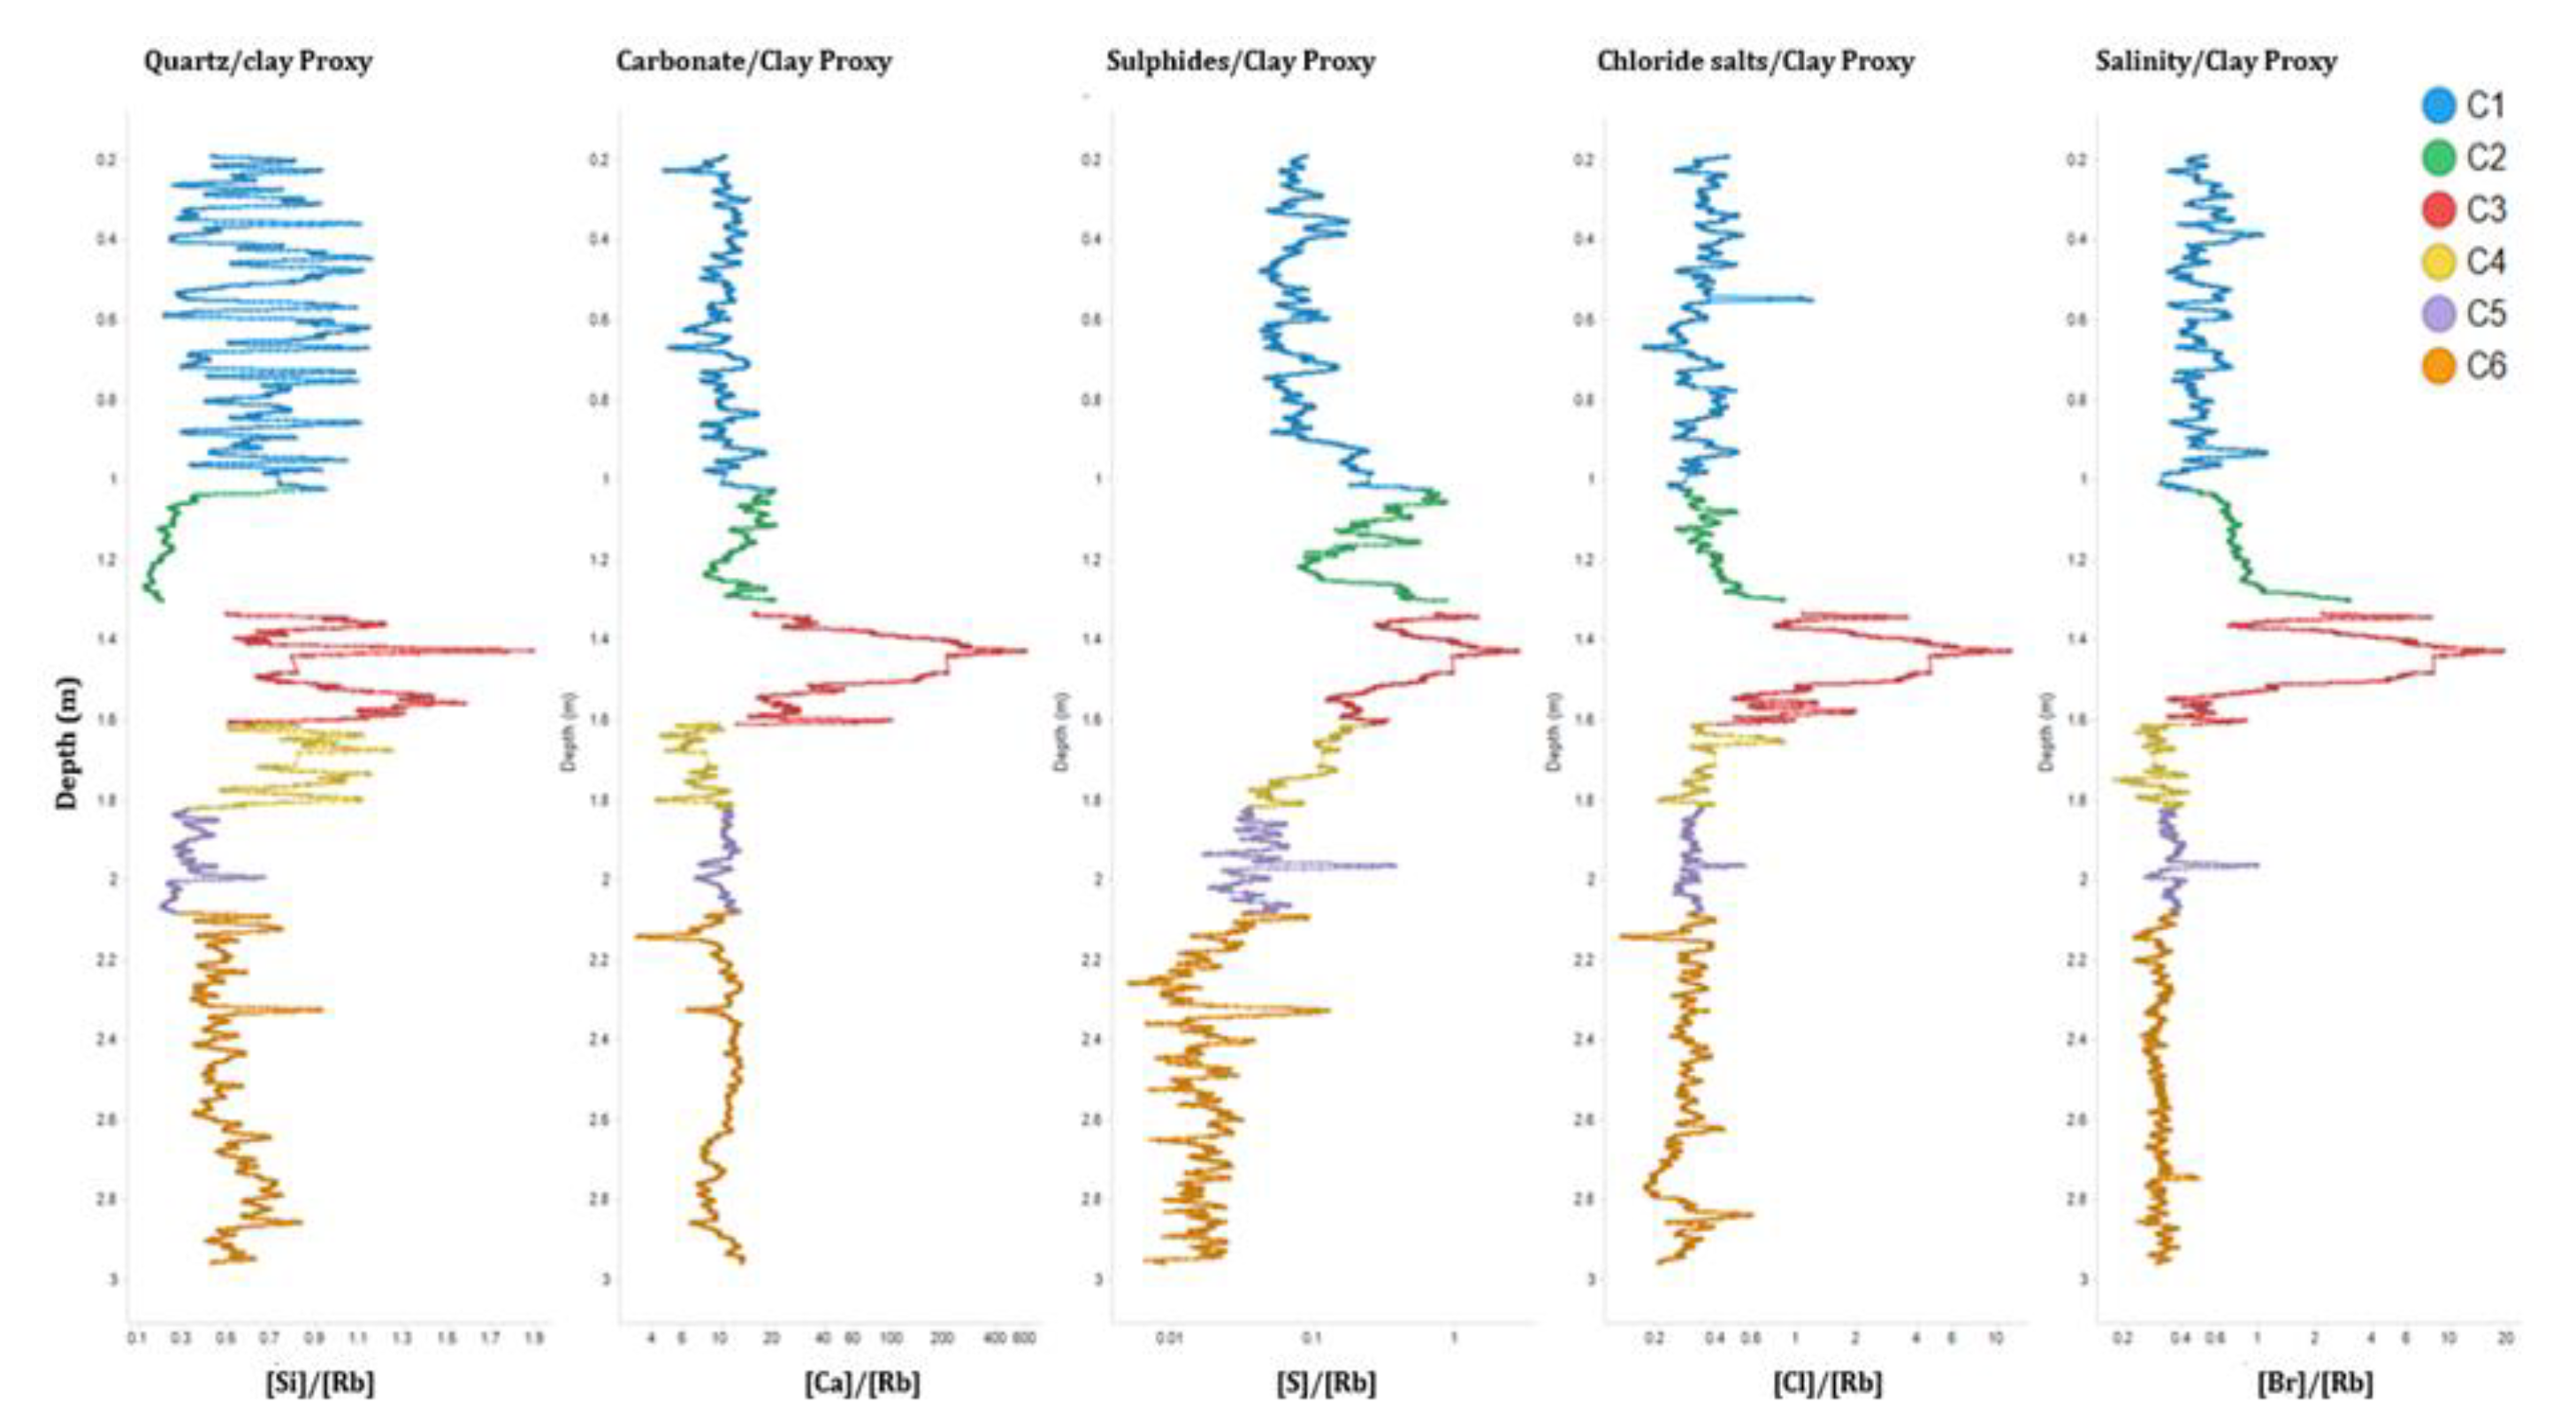
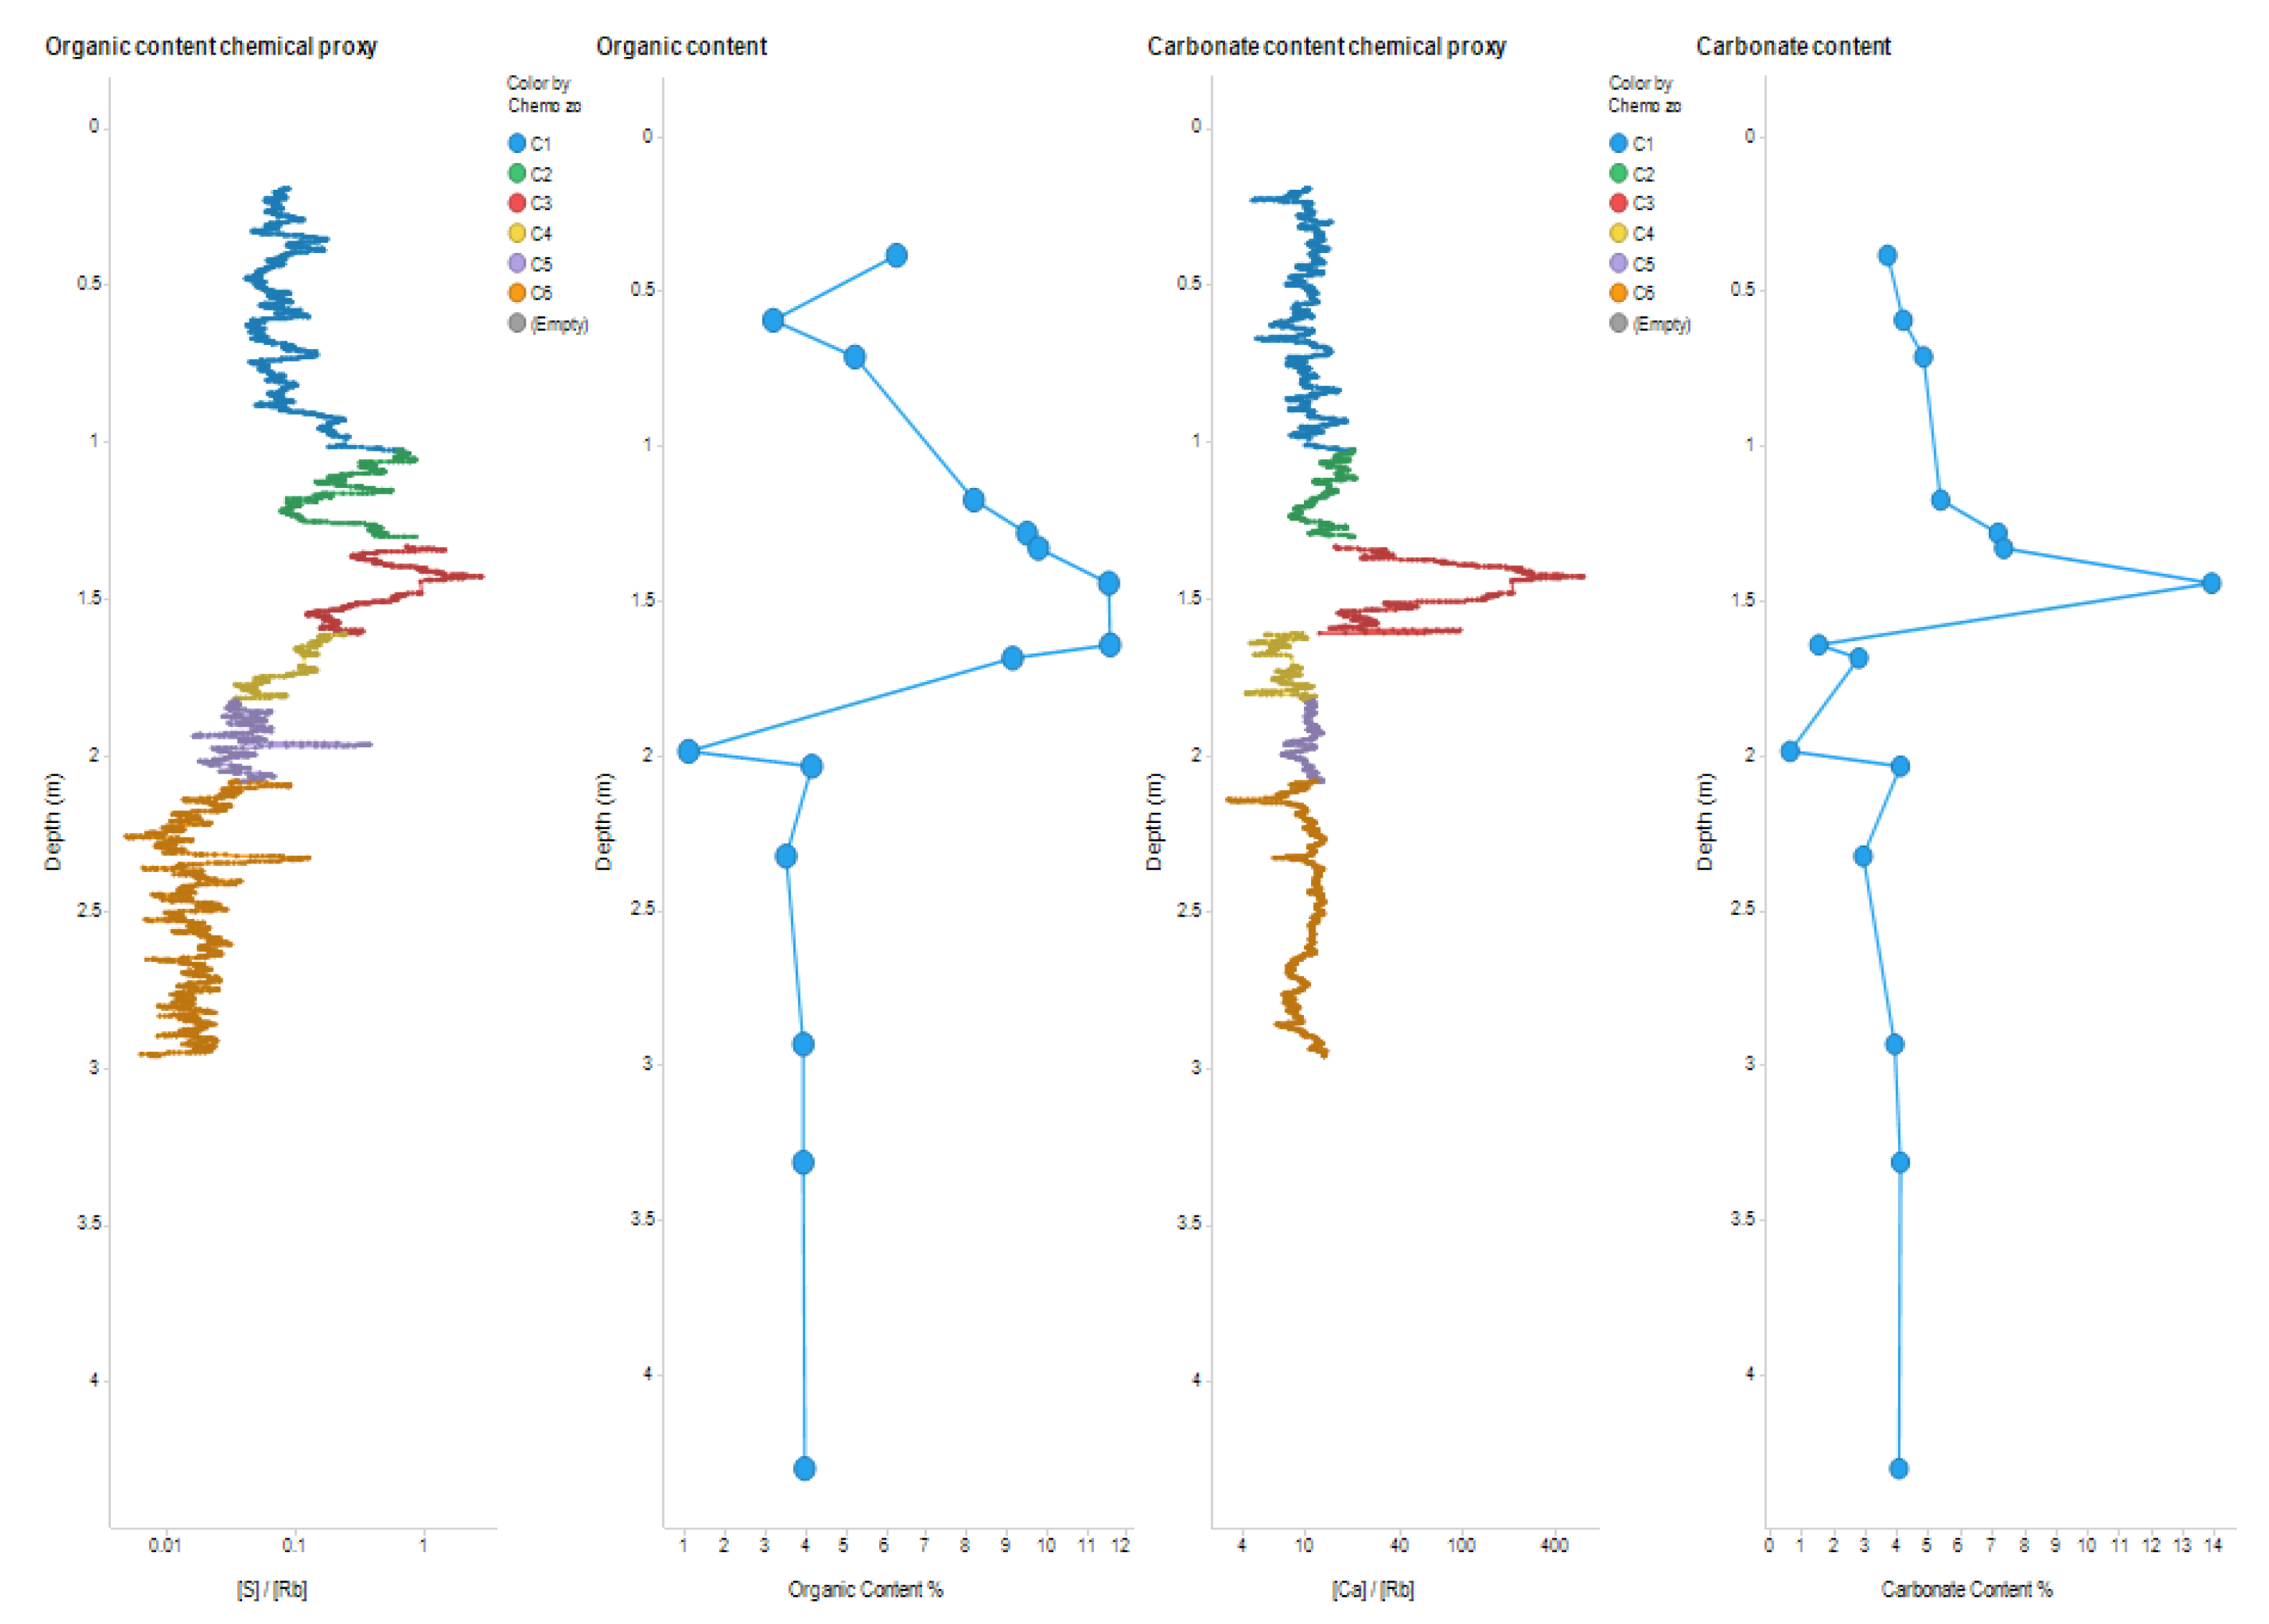
As previously mentioned, the XRF results were previously presented in Finlay et al. (2022). To summarize, the Chemostratigraphy utilized variations in the elemental geochemical composition to identify chemical zonation, reflecting the changes in its depositional environment. The obtained PCA suggested that the key chemostratigraphic variations within the core were based on changes in; detrital minerals (Si – quartz and Ti –heavy minerals), clay minerals (Rb), organic matter or salts (S), carbonate materials (Ca) and salinity (Br and Cl) (Finlay et al., 2022). Therefore, ratios of these elements were used to produce chemical zonation. Si/Rb (Quartz/Clay - changes in detrital grain size), Ca/Rb (Carbonate/Clay -marine/fine terrestrial sediment), S/Rb (Organic material or Sulfides e.g. Gypsum/Clay), Cl/Rb (chlorides e.g. Halite/Clay) and Br/Rb (Salts/Clay). When these ratios were plotted by depth, they split the core into six chemostratigraphic zones (Figure 4). Previous comparison of this data with other available ecological and biostratigraphic data (Finlay et al., 2022) enabled confirmation of the compositional controls on the chemostratigraphic zonation. Chronologically, they were determined as; C6 considered as freshwater silts, C5 suggested to be freshwater clays with some organic content, C4 indicated freshwater sands, C3 was a coarse sediment of an uncertain marine/fluvial system, C2 was interpreted as estuarine clay, and C1 represented interbedded estuarine sandy silts and silty clays.
3.4. Radiocarbon analysis
The chronology of the core was established through the 14C dating of only three samples, from three different depths using humic acid fragments from peat. Depth 1.38 m: dated 10720-11080 Cal BP. Depth 1.35 m: dated 10243-10199 Cal BP. Depth 1.32 m: dated 9933-10225 Cal BP. The lack of datable fractions such as peat, soil, or organic sediments in the remaining parts of the core led to the inability to obtain 14C dating. The most reliable and consistent date that was collected from the sample 1.35 m.
Figure 4.
The six chemostratigraphic zonation, (C1 to C6), of core ELF019 (Finlay et al., 2022).
4. Discussion
4.1. Integrated geochemical interpretation of core ELF019
An advantage of the Itrax XRF core scanner is that it can collect continuous data over an entire core section (rather than relying on individual sampling as necessary for lipid and TGA analysis). This enabled significant geochemical and chemostratigraphic boundaries to be identified with precision. However, the XRF data are relative values and although trends can be established, absolute values (e.g. of carbonate from Ca and organic matter from S) cannot be quantified. The comparison of elemental data with the TGA results for ELF019 addresses this issue (Figure 5).
Both S/Rb (a proxy for organic content) and the percent of organic content from TGA; and the Ca/Rb (a proxy for carbonate content) and the percent of carbonate from TGA follow the same trends (Figure 5). This not only confirms the elemental proxies, but also confirmed that the S/Rb and Ca/Rb were substantially valid proxies for both the organic matter and carbonate contents in sediment. Overall, the TGA data revealed variations in the percentage of organic matter and carbonate content, leading to the identification of three depositional areas (Figure 2). Area C: contains the bottom two meters of the core, displays the lowest organic and carbonate percentages. Despite the considerable length of this zone, it showed high stability in percentages of organic matter and carbonate content (Table 2 and Figure 2). This may indicate the relative consistency in sedimentary composition and depositional environment over time. This observed high stability may suggest a steady sedimentation process with minimal environmental disturbance (Brett et al., 2007). Area B: in the central section of the core is the richest area in both organic matter and carbonate content, which may imply an inconsistent depositional silting or complex sedimentary dynamics (Bonomo et al., 2013; Brett et al., 2007; Gaffney et al., 2020). The increase in the percentage of organic matter suggests an increase in biological input compared to area C. The increase in the carbonate content may indicate an enhanced presence of marine organisms, especially with the notable presence of very small shell fragments in samples from this area (Bonomo et al., 2013). Area A: at the top, contains lowers percentages of organic matter and carbonate content in comparison to area B (Table 2 and Figure 2). That suggests an environmental shift and a decrease in the biological input of organic material (Rocci et al., 2021).
A summary of the Chemostratigraphic zonation and facies for ELF019 are presented in Table 3. This illustrates the changes in depositional environments from freshwater silt, clay, sand and low carbonate at the bottom of the core (C6, C5 and C4), fine grained saline deposition (C2 and C1) at the top of the core, and through to what Finlay et al. (2022) described as a higher energy unit containing carbonate salts and with a high organic content (C3). A revaluation of chemo zone C3 from Finlay et al. (2022) was undertaken in this paper. Previously, the high S, Cl and Br content had not been fully considered, whereas Figure 4 clearly demonstrated that chemo zone C3 was highly enriched in all those elements which were likely to be salts. Therefore, Chemo zone C3 was reinterpreted in this study as comprising high levels of carbonate salt and some organic material, possibly a calcrete. This highlighted the difficulty in interpreting paleoenvironment data using elemental data alone.
The chemostratigraphic zones and facies produced by Finlay et al., (2022) -(Figure 4)- were based on qualitative XRF data from trends in elemental variations, which have been used as proxies for depositional settings. The new Pmar-aq and CPI data in this study enabled further confirmation of these proxies. When this was undertaken, a substantial correlation in the data was observed (Table 3). The freshwater zones (C6, C5 and C4) at the bottom part of the core contained terrestrial vegetation and emergent aquatic vegetation lipids and a mix of marine and terrestrial vegetation (Table 2). The possible calcrete (Chemo zone C3) contained organic material likely to represent terrestrial vegetation, supporting the interpretation of this being dried fluvial/freshwater facies. The fact that this chemozone was overlain by a clay rich unit, with low porosity and permeability, likely explains how the salts were protected from dissolution during flooding. Finally, the chemo facies that were identified as being saline at the top of the core (C2 and C1), according to the lipid analysis, contained organic marine vegetation material.
The final integration of all geochemical interpretations for core ELF019 suggested six detailed geochemical zones (Table 3); C6 -from 2.96 cm to 2.08 cm- was considered to be freshwater silts with ~3-4% carbonate content, and ~4% organic matter (emergent aquatic vegetation/terrestrial vegetation). C5 -from 2.08 cm to 1.82 cm- was interpreted as comprising freshwater clays with ~1-4% carbonate content, ~1-4% organic matter (terrestrial vegetation).
Table 3.
This is a table. Tables should be placed in the main text near to the first time they are cited.
Table 3.
This is a table. Tables should be placed in the main text near to the first time they are cited.
| Chemo Zone | Depth (m) | Chemo Facies | Carbonate content % | Organic content % | CPI | Pmar-aq | Integrated geochemical facies |
|---|---|---|---|---|---|---|---|
| C1 | 0.19 | Saline interbedded silts/clays with some carbonate and organic content | ~4-5 (Medium) |
~3-6 (Medium) |
Marine Vegetation | Marine Vegetation | Marine low energy depositional environment with ~4-5% carbonate content and ~3-6% marine vegetation organic matter |
| C2 | 1.03 | Saline clay with some organic material and decreasing downhole carbonate content | ~5-7 (Medium) |
~8-10 (High) |
Marine Vegetation | Marine Vegetation | Marine very low energy depositional environment with ~5-7% carbonate content and ~8-10% marine vegetation organic matter |
| C3 | 1.33 | Carbonate salt, with some organic content | ~14 (Medium) |
~12 (High) |
Terrestrial Vegetation | Terrestrial Vegetation | Calcrete with a ~14% carbonate content and ~12% terrestrial vegetation organic matter |
| C4 | 1.52 | Freshwater sand, low carbonate and decreasing downhole organic content | ~2-3 (Low) |
~9-12 (High) |
Marine Vegetation | Terrestrial Vegetation | Freshwater sands with ~2-3 carbonate content and ~9-12% terrestrial vegetation organic matter |
| C5 | 1.82 | Freshwater clay with low carbonate and organic content | ~1-4 (Low) |
~1-4 (Low) |
Terrestrial Vegetation | Terrestrial Vegetation | Freshwater clays with ~1-4% carbonate content and terrestrial vegetation organic matter |
| C6 | 2.08 | Freshwater silt with low carbonate and very low organic content | ~3-4 (Medium) |
~4 (Medium) |
Marine Vegetation | Emergent aquatic Vegetation | Freshwater silts with ~3-4% carbonate content and ~4% emergent aquatic vegetation organic matter |
C4 -from 1.82 cm to 1.52 cm- was interpreted as comprising freshwater sands with ~2-3% carbonate content, and ~9-12% organic matter (terrestrial vegetation). C3 -from 1.52 cm to 1.33 cm- was interpreted as comprising coarse sediment of a non-marine (fluvial?) system, with ~14% carbonate content and ~12% organic matter (terrestrial vegetation). This area contains the only three dated samples: 10720-11080 Cal BP at 1.38 m, 10243-10199 Cal BP at 1.35 m and 9933-10225 Cal BP at 1.32 m, this is late-mid Greenlandian (Roberts., 2023). This period spans a period when the coastlines of Doggerland appear to have begun diminishing quite rapidly, ultimately leaving the British Isles separated from continental Europe, probably by no later than 9000 BP (Walker et al., 2020). By the end of the period covered by these dates, northwest Europe was entering the Holocene Climate Optimum, and Doggerland would have been rapidly transforming into a littoral fringe around the modern-day continent. C2 -from 1.30 cm to 1.03 cm- was interpreted as comprising a marine, very low-energy depositional environment, with ~5-7% carbonate content (likely shell remains) and ~8-10% organic matter (marine vegetation). Finally, C1 -from 1.03 cm to 0.19 cm- was interpreted as representing a marine low-energy depositional environment, with ~4-5% carbonate content (likely shell remains) and ~3-6% organic matter (marine vegetation).
It is important to note that the variations in the environmental deposition were detected by all analytical techniques at approximately the same depths. The integration of all the data allowed the authors to establish a paleoenvironmental/depositional history of the core. Significantly, this enabled the exact point at which two key paleoenvironmental variations occurred: at 1.52 meters (core depth) where a freshwater low-energy deposition environment succeeded a freshwater high energy depositional environment. A second boundary occurred at 1.33 meters (core depth) where there was a division between freshwater and saline deposition. These data provided a significant insight into past environmental conditions and demonstrate that comprehensive geochemical studies can assist in the investigation and simulation of the inundation processes that characterize the history of drowned landscapes including Doggerland.
3.1. The geoarchaeology setting of core ELF019
Core 19 sits within the Southern River flood plain, and its geomorphological and environmental history, combined with the analyses presented here, suggests a landscape that would have been attractive to Holocene hunter gatherers. This reflects the emergence of fluvial systems and organic rich silts overlying basal sands, and the development of wetlands and perhaps lagoonal conditions prior to inundation after 10k BP. The Southern River Valley would have also been surrounded by mixed woodlands typical of Holocene environments. These, and the fresh water and emerging estuarine environments, would have provided complex environmental niches that were highly attractive to hunter-fisher communities of the time.
Archaeologically, the valley itself is of considerable significance. Aside from the resource value of river systems to hunter-gather populations in general, the southern river incorporates, or passes through, topographic features that may have been significant to early communities. Coring suggests that a saddle at the head of the river could have been associated with a freshwater spring, whilst the lower river cuts through a chalk outcrop with the potential to hold, as yet unproven, lithic resources. However, it is extremely significant that the area of the Southern River estuary provided the only lithic artefact recovered by the ELF project, recovered by a dredge of the estuary during in 2019, and during a joint ELF/VLIZ expedition to the area.
Overall, the importance of studies, as presented here, is not simply to provide a coherent environmental sequence for an individual core, but to place this within a larger geomorphological, topographical and archaeological context. The detailed landscape mapping, and integration of interdisciplinary analyses of the many cores provided by Europe’s Lost Frontiers, is gradually generating a detailed picture of the landscape at a local and regional scale (Gaffney & Fitch., 2021). The grand challenge, following the provision of such a rich and detailed backdrop, will be the capacity of archaeologists to explore this landscape and refine their understanding of the human communities who lived there.
5. Conclusions
The integration of TGA, lipid and XRF analysis enabled a palaeodepositional history of the 4.43 m sediment from core ELF019 to be established. It revealed insights into the depositional history of the core, including specific boundaries in the paleoenvironmental sequence. The study revealed a sedimentary transition from a consistent and steady freshwater deposit with strong signs of emergent aquatic vegetation, to an unstable and inconsistent deposit with complex sedimentary dynamics. This deposit was dated to Greenlandian period. Another shift provided evidence that the sediment was transformed into a more stable environment with sediments rich in clay and marine vegetation lipids. During the study it was confirmed, through comparison with the TGA results, that the S/Rb and Ca/Rb ratios were valid proxies to estimate the percentage of organic matter and carbonate content in sediment. This research evidenced an integrated and efficient multi-proxy geochemical methodology that, applied to other ELF cores, will most certainly provide a comprehe3nsive understanding of the Southern River Valley and its surrounding landscape. section is not mandatory but can be added to the manuscript if the discussion is unusually long or complex.
Author Contributions
Study conceptualisation by M.B., B.S., R.T., AF and VG. Manuscript production led by M.B. with support and editing by A.F., B.S., R.T & V.G.. Figure production by M.B. and A.F. Thermal, lipid, mineralogical and organic analysis undertaken by M.B., supervised by B.S. & R.T. XRF interpretation undertaken by A.F. All authors have read and agreed to the published version of the manuscript. .
Funding
This research was funded by the European Research Council funding through the European Union's Horizon 2020 research and innovation program (project 670518 LOST FRONTIERS).
Institutional Review Board Statement
Not applicable.
Informed Consent Statement
Not applicable.
Data Availability Statement
The generated original data are presented in this article; further requests can be addressed to the corresponding author.
Acknowledgments
We thank Professor Sarah Davies for the provision of XRF data and her comments on this MS. Sediments used in this study were provided through the European Union’s Horizon 2020 Research and Innovation Program (Project no. 670518). We thank Dr. Simon Fitch and Dr. Rachel Harding for assisting with the maps. We thank Professor Martin Bates and Dr. Simon Fitch for their comments on this MS. We thank Dr. Philip Murgatroyd for his comments on the paper. We thank Dr. James Walker for his assistance and his comments on this MS. Mohammed Bensharada thanks the Libyan Ministry of Higher Education for funding his Masters and PhD.
Conflicts of Interest
The authors declare no conflicts of interest.
References
- Ali, H. A. M., Mayes, R. W., Lamb, C. S., Hector, B. L., Verma, A. K., & Ørskov, E. R. (2004). The potential of long-chain fatty alcohols and long-chain fatty acids as diet composition markers: Development of methods for quantitative analysis and faecal. The Journal of Agricultural Science, 142(1), 71. [CrossRef]
- Ballin, T. B. (2017). Rising waters and processes of diversification and unification in material culture: the flooding of Doggerland and its effect on north-west European prehistoric populations between ca. 13 000 and 1500 cal BC. Journal of Quaternary Science, 32(2), 329-339. [CrossRef]
- Bateman, M. D., Kinnaird, T. C., Hill, J., Ashurst, R. A., Mohan, J., Bateman, R. B. I., & Robinson, R. (2021). Detailing the impact of the Storegga Tsunami at Montrose, Scotland. Boreas. [CrossRef]
- Bensharada, M., Stern, B., & Telford, R. (2022). Introduction to geochemical studies within Europe’s Lost Frontiers. Europe’s Lost Frontiers, 154.
- Bensharada, M., Telford, R., Stern, B., & Gaffney, V. (2021). Loss on ignition vs. thermogravimetric analysis: a comparative study to determine organic matter and carbonate content in sediments. Journal of paleolimnology, 1-7. [CrossRef]
- Blumenberg, M., Schlömer, S., Reinhardt, L., Scheeder, G., Pape, T., & Römer, M. (2022). Biomarker insights into a methane-enriched Holocene peat-setting from “Doggerland”(central North Sea). The Holocene, 32(10), 1015-1025. [CrossRef]
- Bonomo, M., Leon, D. C., Osterrieth, M., Steffan, P., & Borrelli, N. (2013). Paleoenvironmental studies of Alfar archaeological site (mid-Holocene; Southeastern Pampas of Argentina): Silicophytoliths, gastropods and archaeofauna. Quaternary international, 287, 34-46. [CrossRef]
- Brett, C. E., Hendy, A. J. W., Bartholomew, A. J., Bonelli Jr, J. R., & McLaughlin, P. I. (2007). Response of shallow marine biotas to sea-level fluctuations: a review of faunal replacement and the process of habitat tracking. Palaios, 22(3), 228-244.
- Collister, J. W., Rieley, G., Stern, B., Eglinton, G., & Fry, B. (1994). Compound-specific δ 13C analyses of leaf lipids from plants with differing carbon dioxide metabolisms. Organic geochemistry, 21(6-7), 619-627. [CrossRef]
- Davies, S. J., Lamb, H. F., & Roberts, S. J. (2015). Micro-XRF core scanning in palaeolimnology: recent developments. Micro-XRF studies of sediment cores, 189-226.
- Dunbar, E., Cook, G. T., Naysmith, P., Tripney, B. G., & Xu, S. (2016). AMS 14C dating at the Scottish Universities Environmental Research Centre (SUERC) radiocarbon dating laboratory. Radiocarbon, 58(1), 9-23. [CrossRef]
- Duplisea, D. E. (2000). Benthic organism biomass size-spectra in the Baltic Sea in relation to the sediment environment. Limnology and Oceanography, 45(3), 558-568. [CrossRef]
- Eglinton, G., & Hamilton, R. J. (1967). Leaf epicuticular waxes. Science, 156(3780), 1322-1335. [CrossRef]
- Ficken, K. J., Li, B., Swain, D. L., & Eglinton, G. (2000). An n-alkane proxy for the sedimentary input of submerged/floating freshwater aquatic macrophytes. Organic geochemistry, 31(7-8), 745-749. [CrossRef]
- Finlay, A., Bates, R., Bensharada, M., & Davies, S. (2022). Applying chemostratigraphic techniques to shallow bore holes: Lessons and case studies from Europe’s lost Frontiers. In Europe's Lost Frontiers: Volume 1 Context and Methodology (pp. 137-153). Archaeopress.
- Fitch, S., Thomson, K., & Gaffney, V. (2005). Late Pleistocene and Holocene depositional systems and the palaeogeography of the Dogger Bank, North Sea. Quaternary Research, 64(2), 185-196. [CrossRef]
- Gaffney, V., Allaby, R., Bates, R., Bates, M., Ch’ng, E., Fitch, S., Garwood, P., Momber, G., Murgatroyd, P., & Pallen, M. (2017). Doggerland and the lost Frontiers project (2015–2020). In Under the Sea: Archaeology and Palaeolandscapes of the Continental Shelf (pp. 305-319). Springer.
- Gaffney, V., Fitch, S., Bates, M., Ware, R. L., Kinnaird, T., Gearey, B., Hill, T., Telford, R., Batt, C., & Stern, B. (2020). Multi-proxy characterisation of the Storegga tsunami and its impact on the early Holocene landscapes of the southern North Sea. Geosciences, 10(7), 270. [CrossRef]
- Gaffney, V. L., Fitch, S., & Smith, D. N. (2009). Europe's lost world: the rediscovery of Doggerland (Vol. 160). Council for British Archaeology.
- He, J., Zhang, S., Zhang, X., Qian, Y., He, H., & Wu, H. (2016). Composition and Distribution Characteristics and Geochemical Significance of n-Alkanes in Core Sediments in the Northern Part of the South Yellow Sea. Journal of Chemistry, 2016. [CrossRef]
- Heiri, O., Lotter, A. F., & Lemcke, G. (2001). Loss on ignition as a method for estimating organic and carbonate content in sediments: reproducibility and comparability of results. Journal of paleolimnology, 25(1), 101-110. [CrossRef]
- Hu, J., & Chivas, A. R. (2009). Molecular biomarker evidence of origins and transport of organic matter in sediments of the Pearl River estuary and adjacent South China Sea. Applied Geochemistry, 24(9), 1666-1676. [CrossRef]
- Huang, J. J., Löwemark, L., Chang, Q., Lin, T. Y., Chen, H. F., Song, S. R., & Wei, K. Y. (2016). Choosing optimal exposure times for XRF core-scanning: Suggestions based on the analysis of geological reference materials. Geochemistry, Geophysics, Geosystems, 17(4), 1558-1566. [CrossRef]
- Konare, H., Yost, R. S., Doumbia, M., McCarty, G. W., Jarju, A., & Kablan, R. (2010). Loss on ignition: measuring soil organic carbon in soils of the Sahel, West Africa.
- Mackenzie, A. S., Brassell, S. C., Eglinton, G., & Maxwell, J. R. (1982). Chemical fossils: the geological fate of steroids. Science, 217(4559), 491-504. [CrossRef]
- Martínez, A. E. J., Schleder, A., Sanez, J., Bahniuk, A., & Froehner, S. (2019). Use of fatty acids as tracer of organic matter input associated with level of land urbanization. Environmental Science and Pollution Research, 26(31), 31685-31698. [CrossRef]
- Meyers, P. A., & Ishiwatari, R. (1993). Lacustrine organic geochemistry—an overview of indicators of organic matter sources and diagenesis in lake sediments. Organic geochemistry, 20(7), 867-900. [CrossRef]
- Missiaen, T., Fitch, S., Muru, M., Harding, R., Fraser, A., De Clercq, M., Garcia Moreno, D., Versteeg, W., & Gaffney, V. L. (2021). Targeting the mesolithic: Interdisciplinary approaches to archaeological prospection inthe Brown Bank area, southern North Sea. [CrossRef]
- Mulder, T., & Alexander, J. (2001). The physical character of subaqueous sedimentary density flows and their deposits. Sedimentology, 48(2), 269-299.
- Radomirović, M., Mijatović, N., Vasić, M., Tanaskovski, B., Mandić, M., Pezo, L., & Onjia, A. (2021). The characterization and pollution status of the surface sediment in the Boka Kotorska Bay, Montenegro. Environmental Science and Pollution Research, 1-24. [CrossRef]
- Rielley, G., Collier, R. J., Jones, D. M., & Eglinton, G. (1991). The biogeochemistry of Ellesmere Lake, UK—I: source correlation of leaf wax inputs to the sedimentary lipid record. Organic geochemistry, 17(6), 901-912. [CrossRef]
- Roberts, N. (2023). Holocene climate changes and human consequences. Handbook of archaeological sciences, 1, 321-337.
- Rocci, K. S., Lavallee, J. M., Stewart, C. E., & Cotrufo, M. F. (2021). Soil organic carbon response to global environmental change depends on its distribution between mineral-associated and particulate organic matter: A meta-analysis. Science of the Total Environment, 793, 148569. [CrossRef]
- Sikes, E. L., Uhle, M. E., Nodder, S. D., & Howard, M. E. (2009). Sources of organic matter in a coastal marine environment: evidence from n-alkanes and their δ13C distributions in the Hauraki Gulf, New Zealand. Marine Chemistry, 113(3-4), 149-163. [CrossRef]
- Vaezzadeh, V., Zakaria, M. P., Shau-Hwai, A. T., Ibrahim, Z. Z., Mustafa, S., Abootalebi-Jahromi, F., Masood, N., Magam, S. M., & Alkhadher, S. A. A. (2015). Forensic investigation of aliphatic hydrocarbons in the sediments from selected mangrove ecosystems in the west coast of Peninsular Malaysia. Marine pollution bulletin, 100(1), 311-320. [CrossRef]
- Van der Plicht, J., Amkreutz, L., Niekus, M. J. L. T., Peeters, J. H. M., & Smit, B. I. (2016). Surf'n Turf in Doggerland: Dating, stable isotopes and diet of Mesolithic human remains from the southern North Sea. Journal of Archaeological Science: Reports, 10, 110-118. [CrossRef]
- Van Geel, B., Van Der Plicht, J., Kasse, C., & Mol, D. (2024). Radiocarbon dates from the Netherlands and Doggerland as a proxy for vegetation and faunal biomass between 55 and 5 ka cal bp. Journal of Quaternary Science. [CrossRef]
- Walker, J., Gaffney, V., Fitch, S., Muru, M., Fraser, A., Bates, M., & Bates, R. (2020). A great wave: the Storegga tsunami and the end of Doggerland? Antiquity, 94(378), 1409-1425. [CrossRef]
- Ward, I., Larcombe, P., & Lillie, M. (2006). The dating of Doggerland–post-glacial geochronology of the southern North Sea. Environmental Archaeology, 11(2), 207-218. [CrossRef]
- Weninger, B., Schulting, R., Bradtmöller, M., Clare, L., Collard, M., Edinborough, K., Hilpert, J., Jöris, O., Niekus, M., & Rohling, E. J. (2008). The catastrophic final flooding of Doggerland by the Storegga Slide tsunami. Documenta Praehistorica, 35, 1-24. [CrossRef]
- Xia, Z.-H., Xu, B.-Q., Mügler, I., Wu, G.-J., Gleixner, G., Sachse, D., & Zhu, L.-P. (2008). Hydrogen isotope ratios of terrigenous n-alkanes in lacustrine surface sediment of the Tibetan Plateau record the precipitation signal. Geochemical Journal, 42(4), 331-338. [CrossRef]
- Xiao, X., Fahl, K., & Stein, R. (2013). Biomarker distributions in surface sediments from the Kara and Laptev seas (Arctic Ocean): indicators for organic-carbon sources and sea-ice coverage. Quaternary Science Reviews, 79, 40-52. [CrossRef]
- Yamoah, K. K. A., Chabangborn, A., Chawchai, S., Väliranta, M., Wohlfarth, B., & Smittenberg, R. H. (2016). Large variability in n-alkane δ13C values in Lake Pa Kho (Thailand) driven by wetland wetness and aquatic productivity. Organic geochemistry, 97, 53-60. [CrossRef]
Figure 1.
The locations of Southern River and core ELFO19.
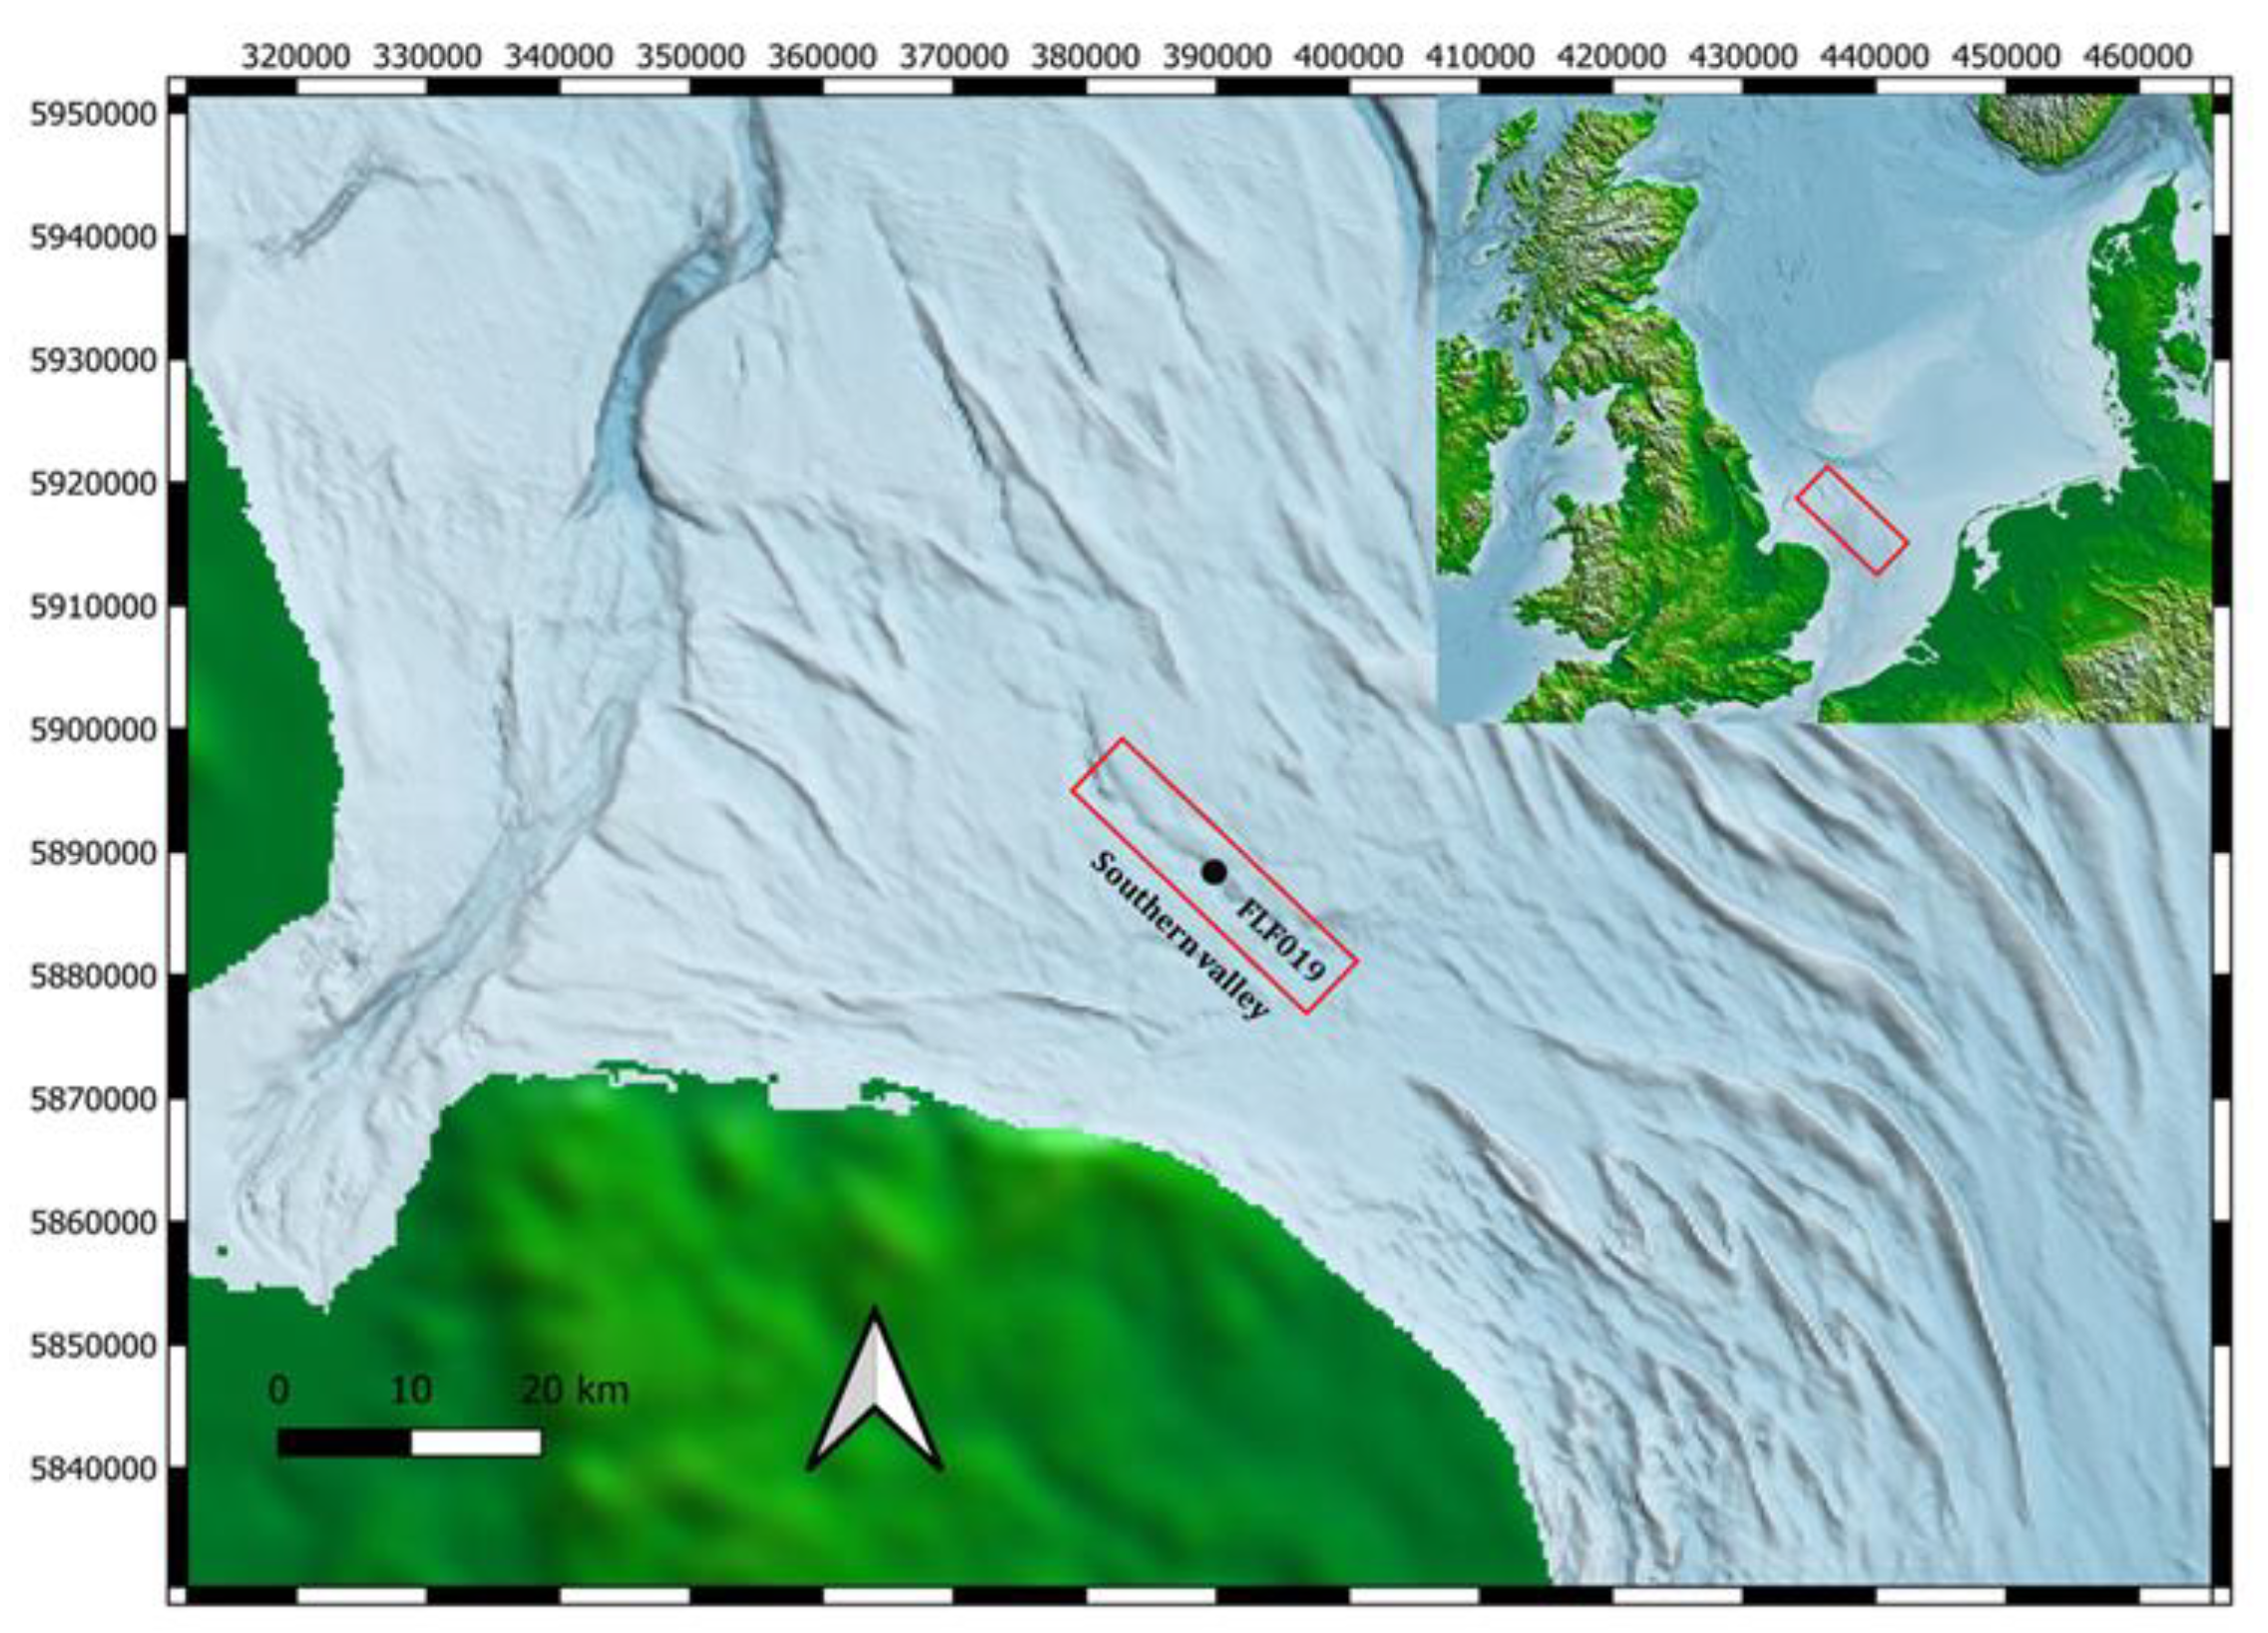
Figure 2.
The samples depths and numbers, the percentages of carbonate content, the percentages of organic matter, thermal area, CPI, Pmar-aq and the percentage of C16:00 fatty acids. ND = Not Detected.
Figure 2.
The samples depths and numbers, the percentages of carbonate content, the percentages of organic matter, thermal area, CPI, Pmar-aq and the percentage of C16:00 fatty acids. ND = Not Detected.
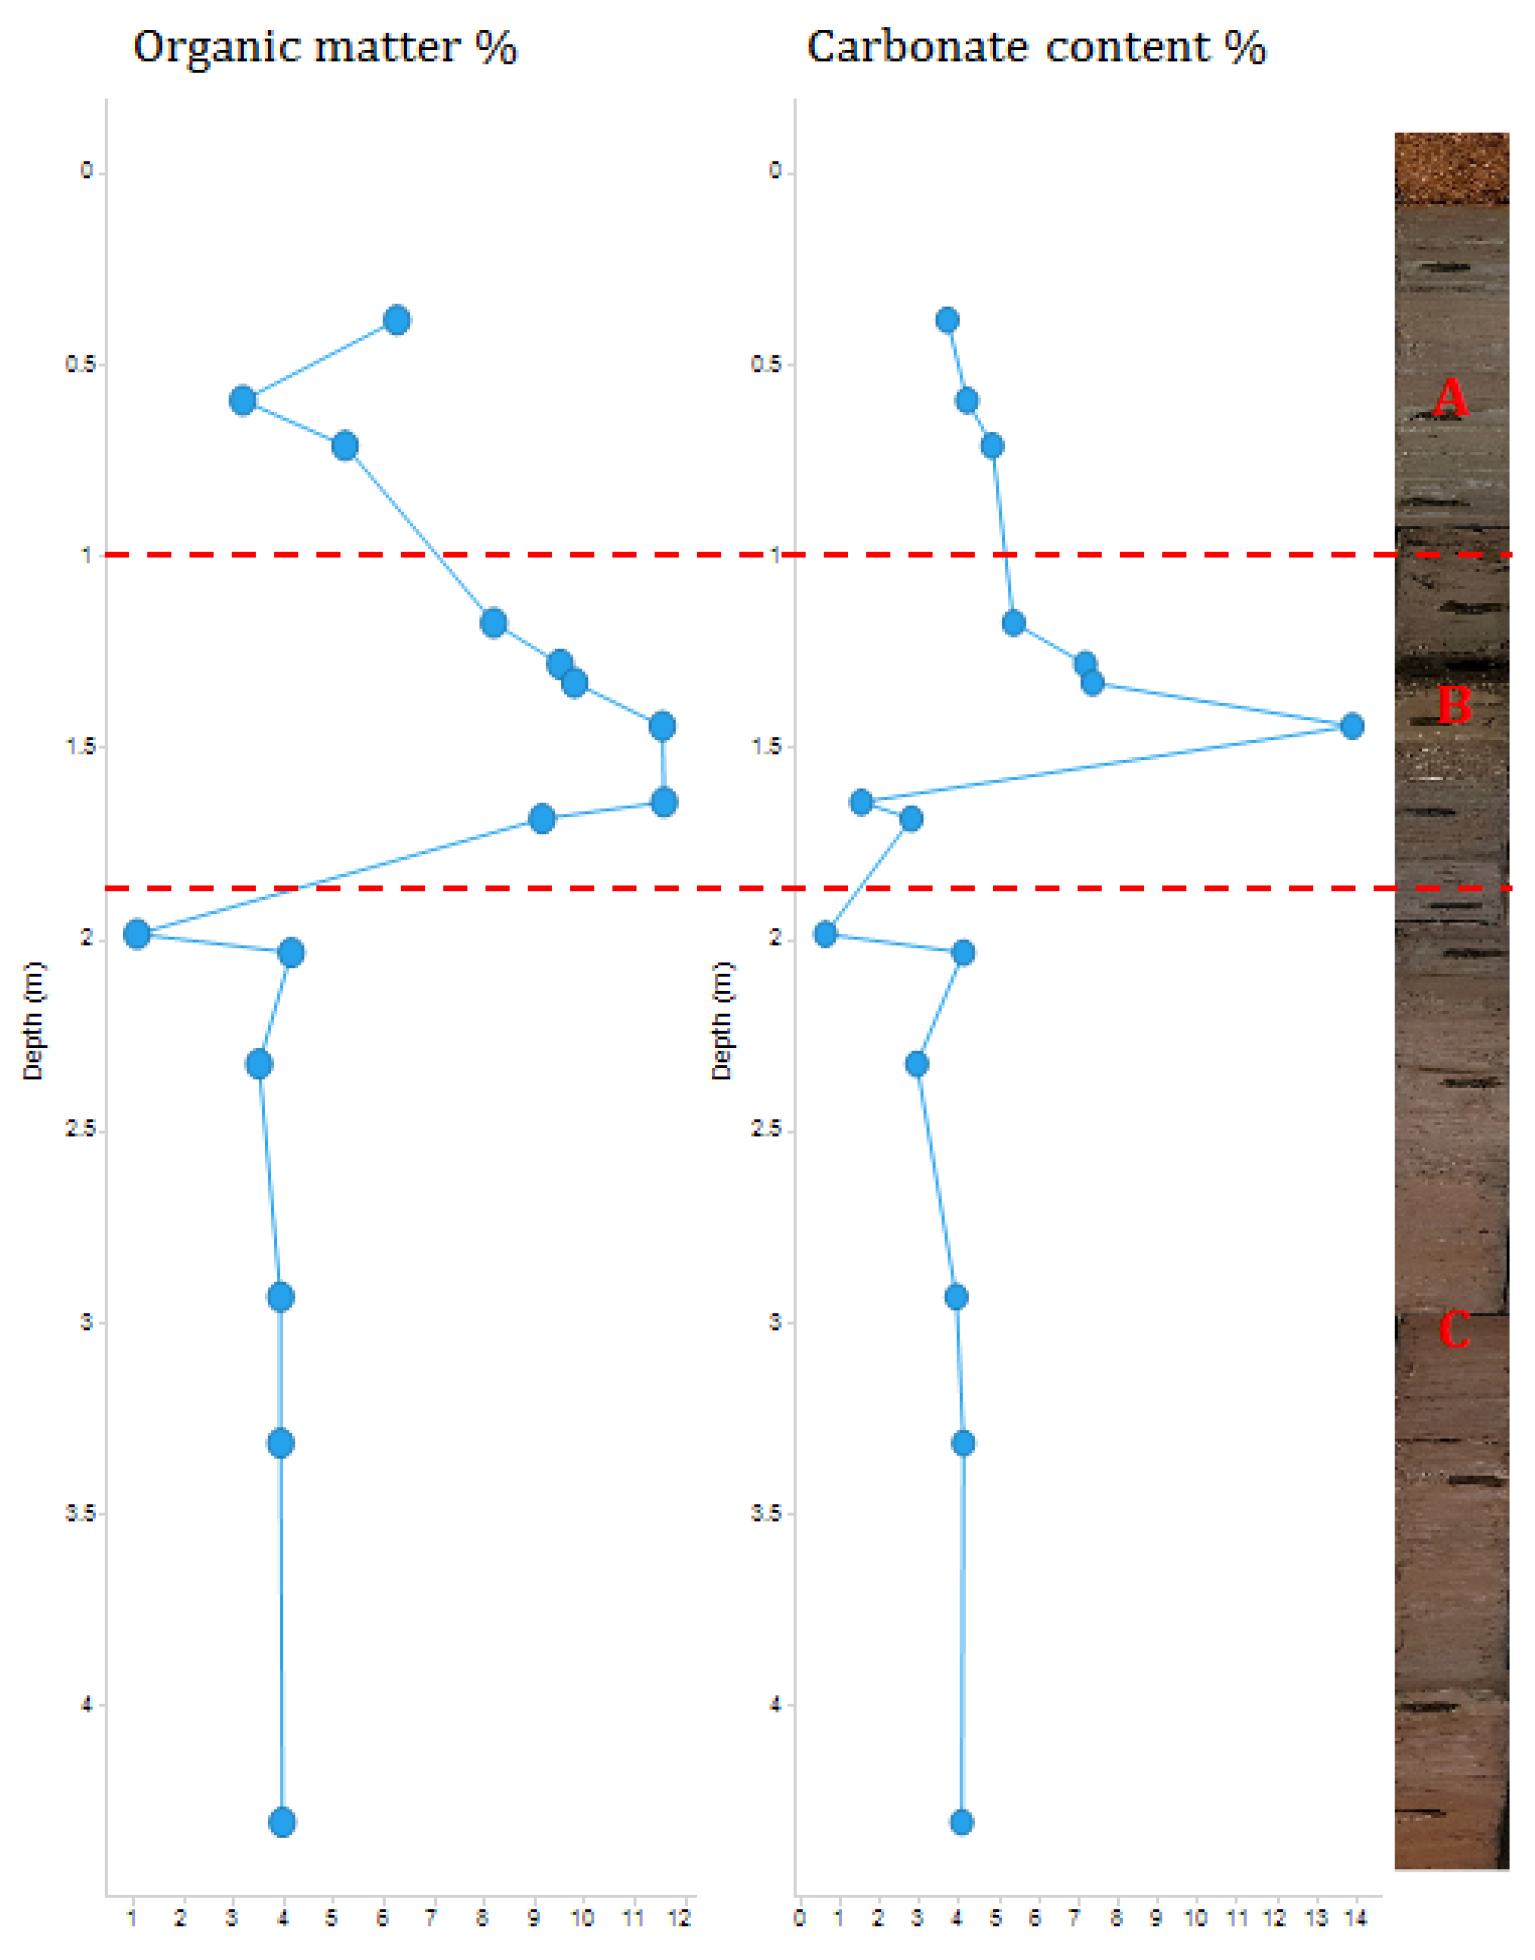
Figure 3.
The n-alkane profiles of samples one (A), sample six (B), sample eight (C) and sample ten (D) shown as extracted ion chromatograms using m/z 57 for n-alkanes.
Figure 3.
The n-alkane profiles of samples one (A), sample six (B), sample eight (C) and sample ten (D) shown as extracted ion chromatograms using m/z 57 for n-alkanes.
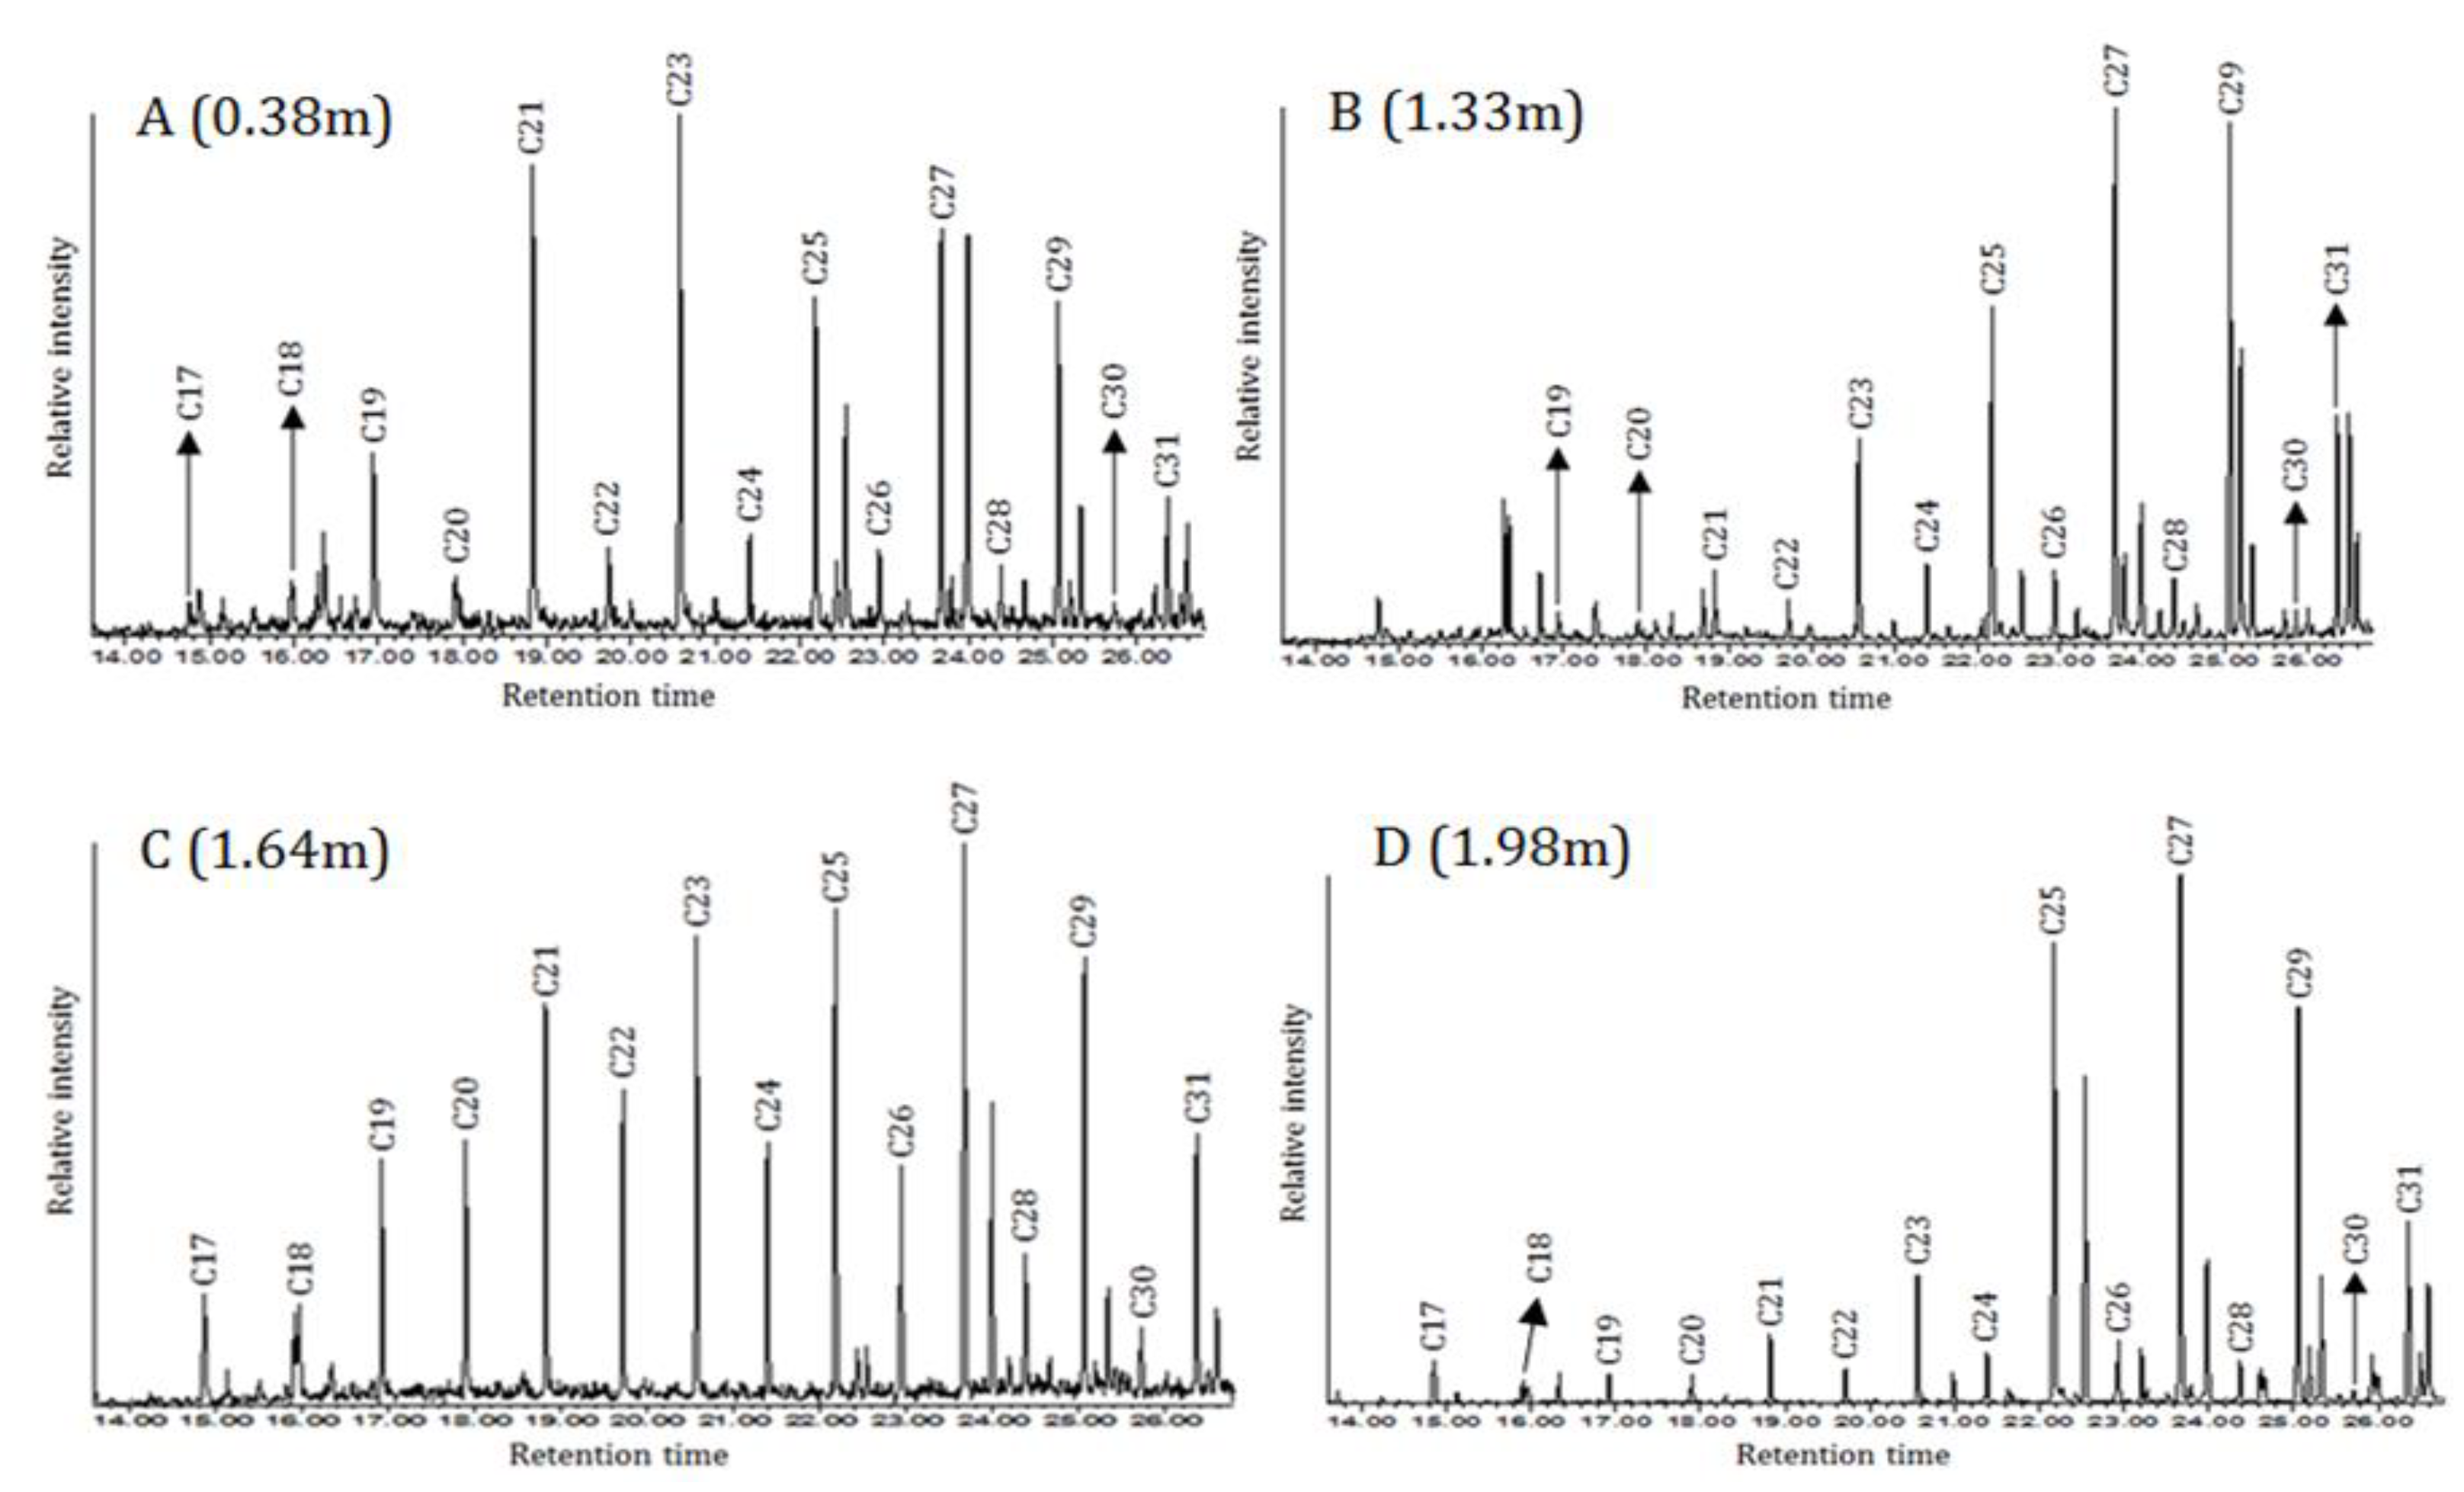
Figure 5.
Showing the same trend in the comparison between the XRF chemo zones (C1 to C6), and the TGA data. Evidence that S/Rb and the Ca/Rb are valid proxies for the organic matter and carbonate content, respectively.
Figure 5.
Showing the same trend in the comparison between the XRF chemo zones (C1 to C6), and the TGA data. Evidence that S/Rb and the Ca/Rb are valid proxies for the organic matter and carbonate content, respectively.
Disclaimer/Publisher’s Note: The statements, opinions and data contained in all publications are solely those of the individual author(s) and contributor(s) and not of MDPI and/or the editor(s). MDPI and/or the editor(s) disclaim responsibility for any injury to people or property resulting from any ideas, methods, instructions or products referred to in the content. |
© 2025 by the authors. Licensee MDPI, Basel, Switzerland. This article is an open access article distributed under the terms and conditions of the Creative Commons Attribution (CC BY) license (https://creativecommons.org/licenses/by/4.0/).
Copyright: This open access article is published under a Creative Commons CC BY 4.0 license, which permit the free download, distribution, and reuse, provided that the author and preprint are cited in any reuse.


