1. Introduction
The most recent global assessment of the status of peatlands reveals that they currently cover approximately 4 % of the Earth's terrestrial surface [
1]. In Africa, the area designated as tropical peatland is estimated to be around 40 million hectares [
2]. The Congo Basin in Central Africa hosts the largest contiguous expanse of peatland within the entire intertropical zone, measuring approximately 167,600 square kilometers, which constitutes 36% of all tropical peatlands globally [
3,
4]. The release of maps detailing the distribution of these peatlands, along with assessments of their carbon content and chemical properties, has underscored their significant environmental value on a global scale [
4]. Nonetheless, various potential threats to the integrity of the Congo Basin peatlands have been identified, which may lead to their degradation or destruction [
5,
6,
7].
Peatland ecosystems are distributed across the Republic of Congo [
8,
9,
10,
11,
12,
13]., with the most extensive area located in the northern region, encompassing approximately 54,000 km² [
4]. In the southern part of the country, although less expansive, peatlands are also present. Notably, this region hosts one of the oldest peatlands in the Congo Basin, which formed around 24,000 years ago [
11]. This particular peatland, referred to as Ngamakala peatland, has been extensively studied for nearly five decades. Foundational research includes a floristic inventory conducted by [
14,
15,
16]
, and a reconstruction of paleoenvironments by [
10,
12]. More recent investigations have concentrated on examining the physical and chemical properties of this peatland [
15], as well as its floristic biodiversity and aerial biomass [
14,
15].
Despite the ecological and environmental importance of peatlands within the Republic of the Congo, peatlands are subject to several anthropogenic pressures, particularly in the south of the country, which threaten the persistence and ecological integrity of peatland within the landscape [
6]. Here we assess changes in land cover in a southern Congolese peatland, known as Ngamakala peatland, and its surrounding area, by using a time series of classifications of satellite imagery. We then identify the drivers of this land cover change and consider management and conservation options for Ngamakala peatland, and other peatlands in the region.
2. Materials and Methods
2.1. Study Area
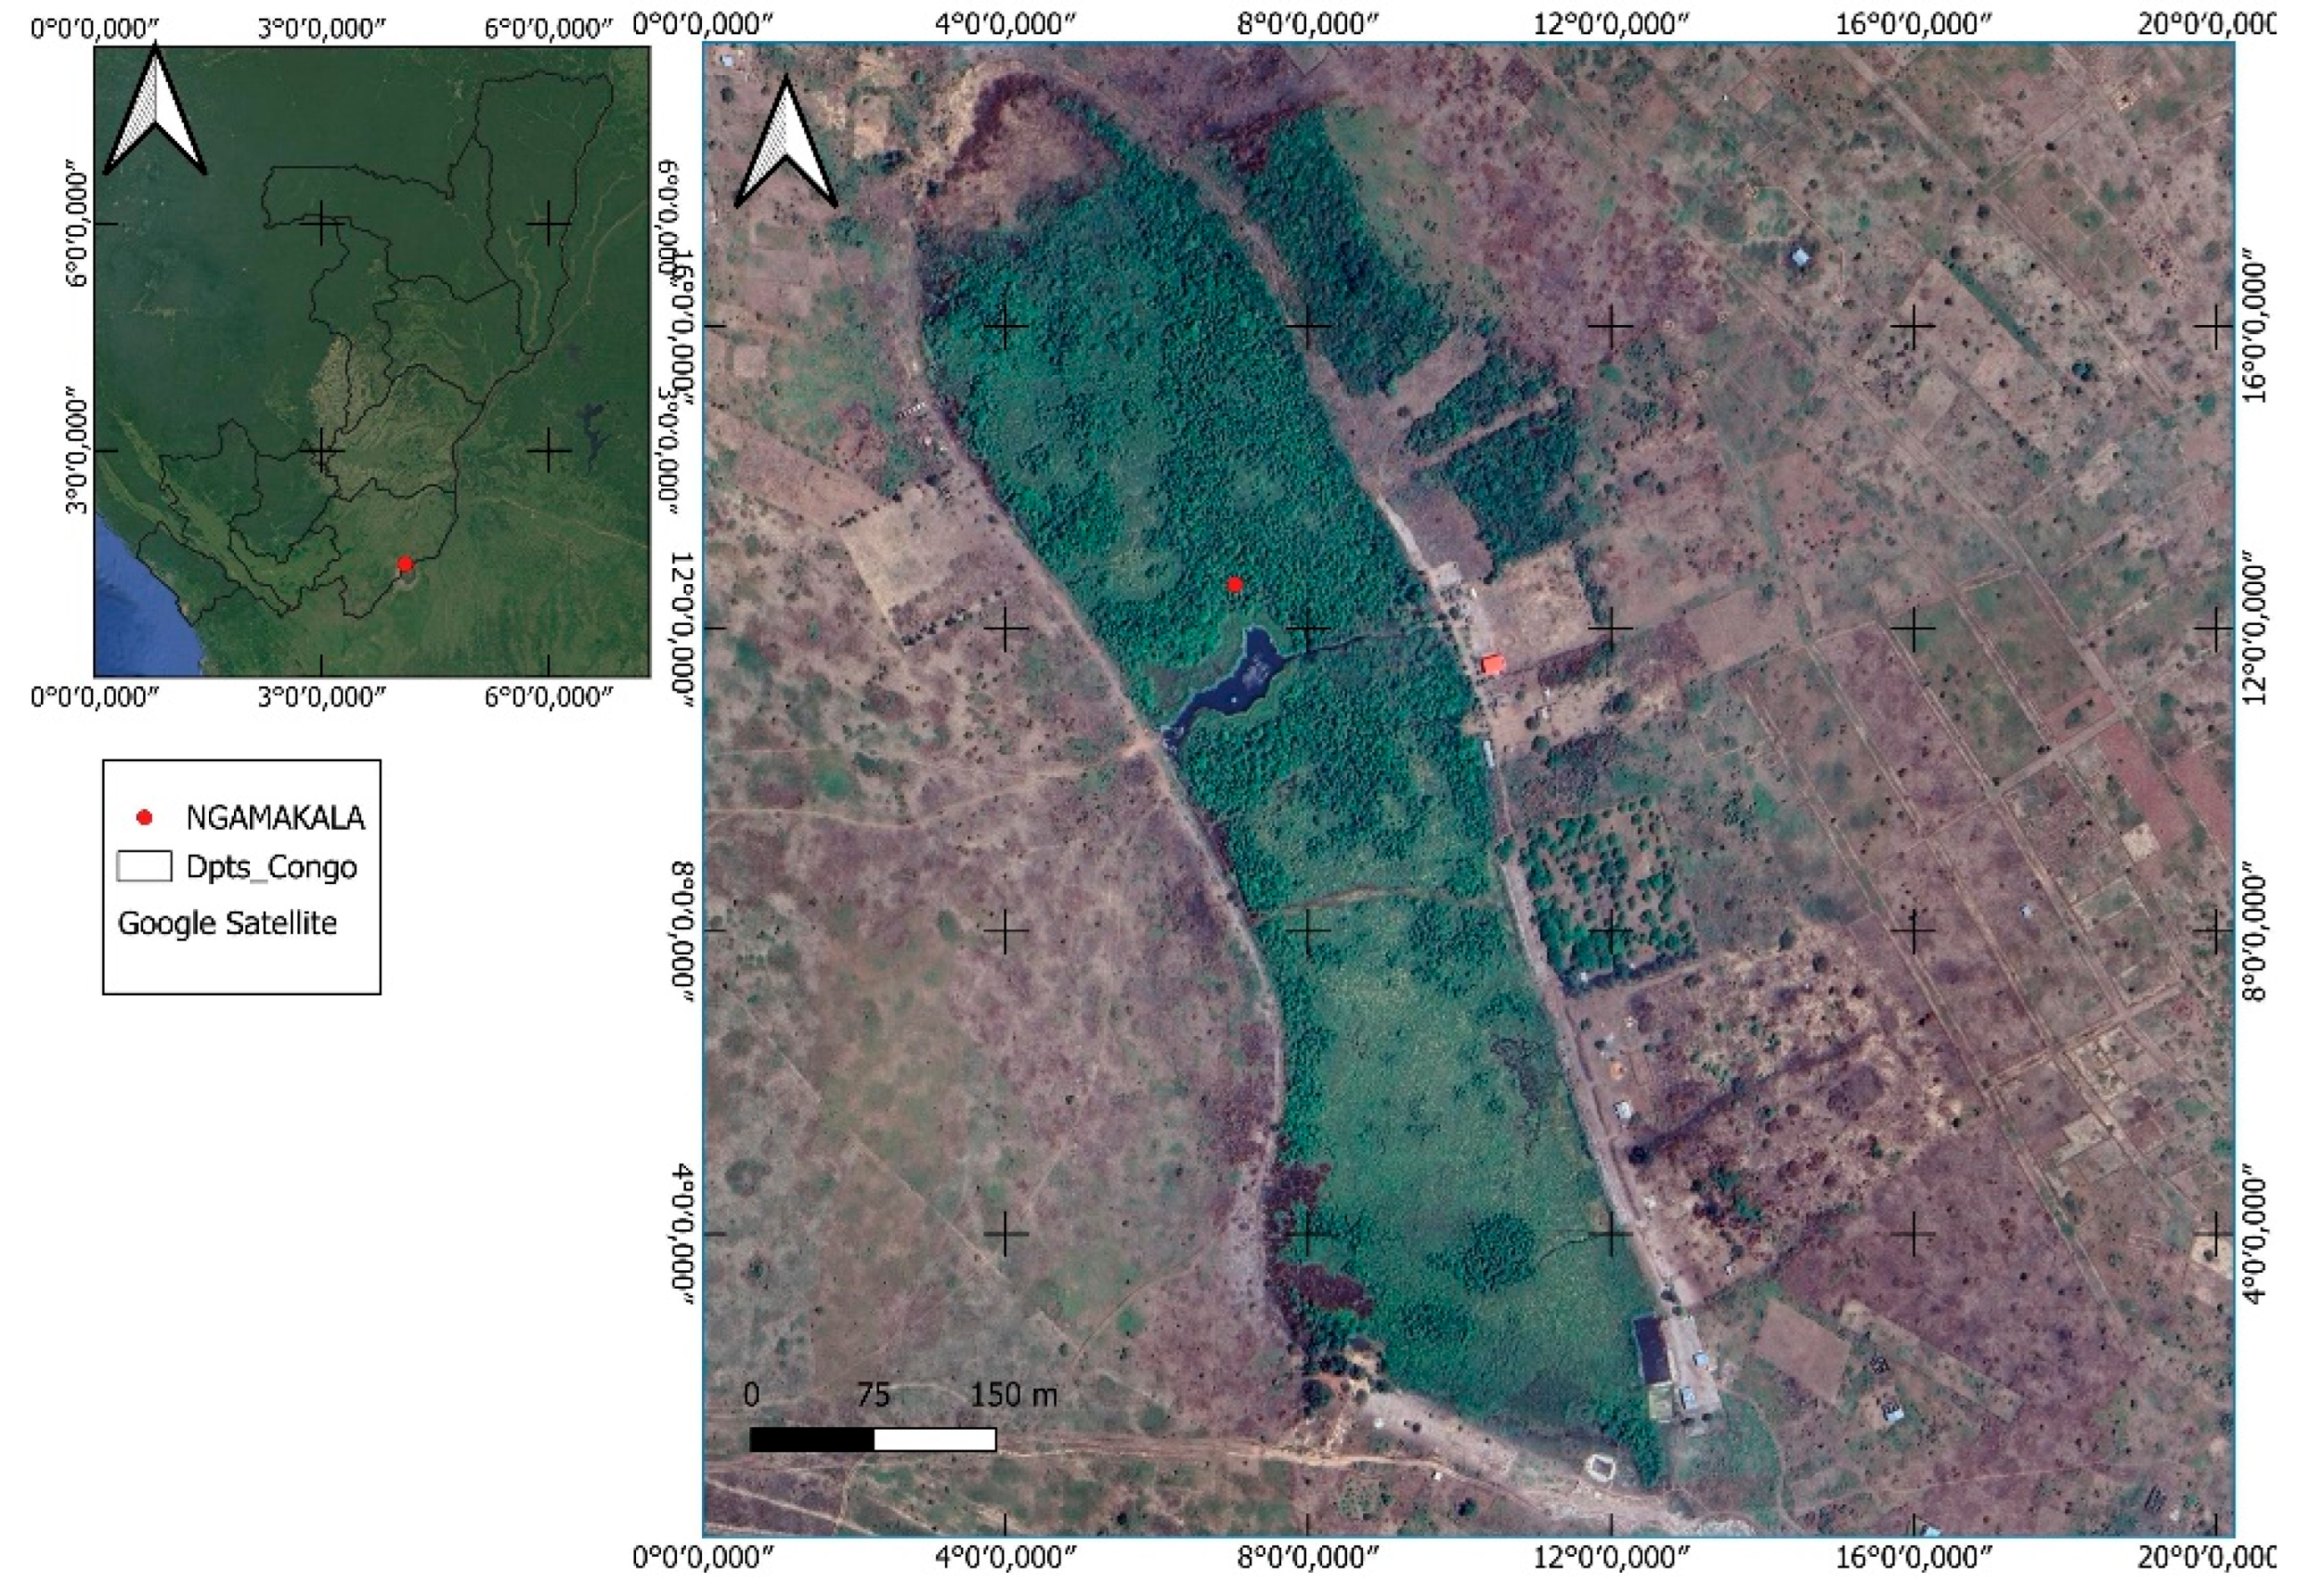
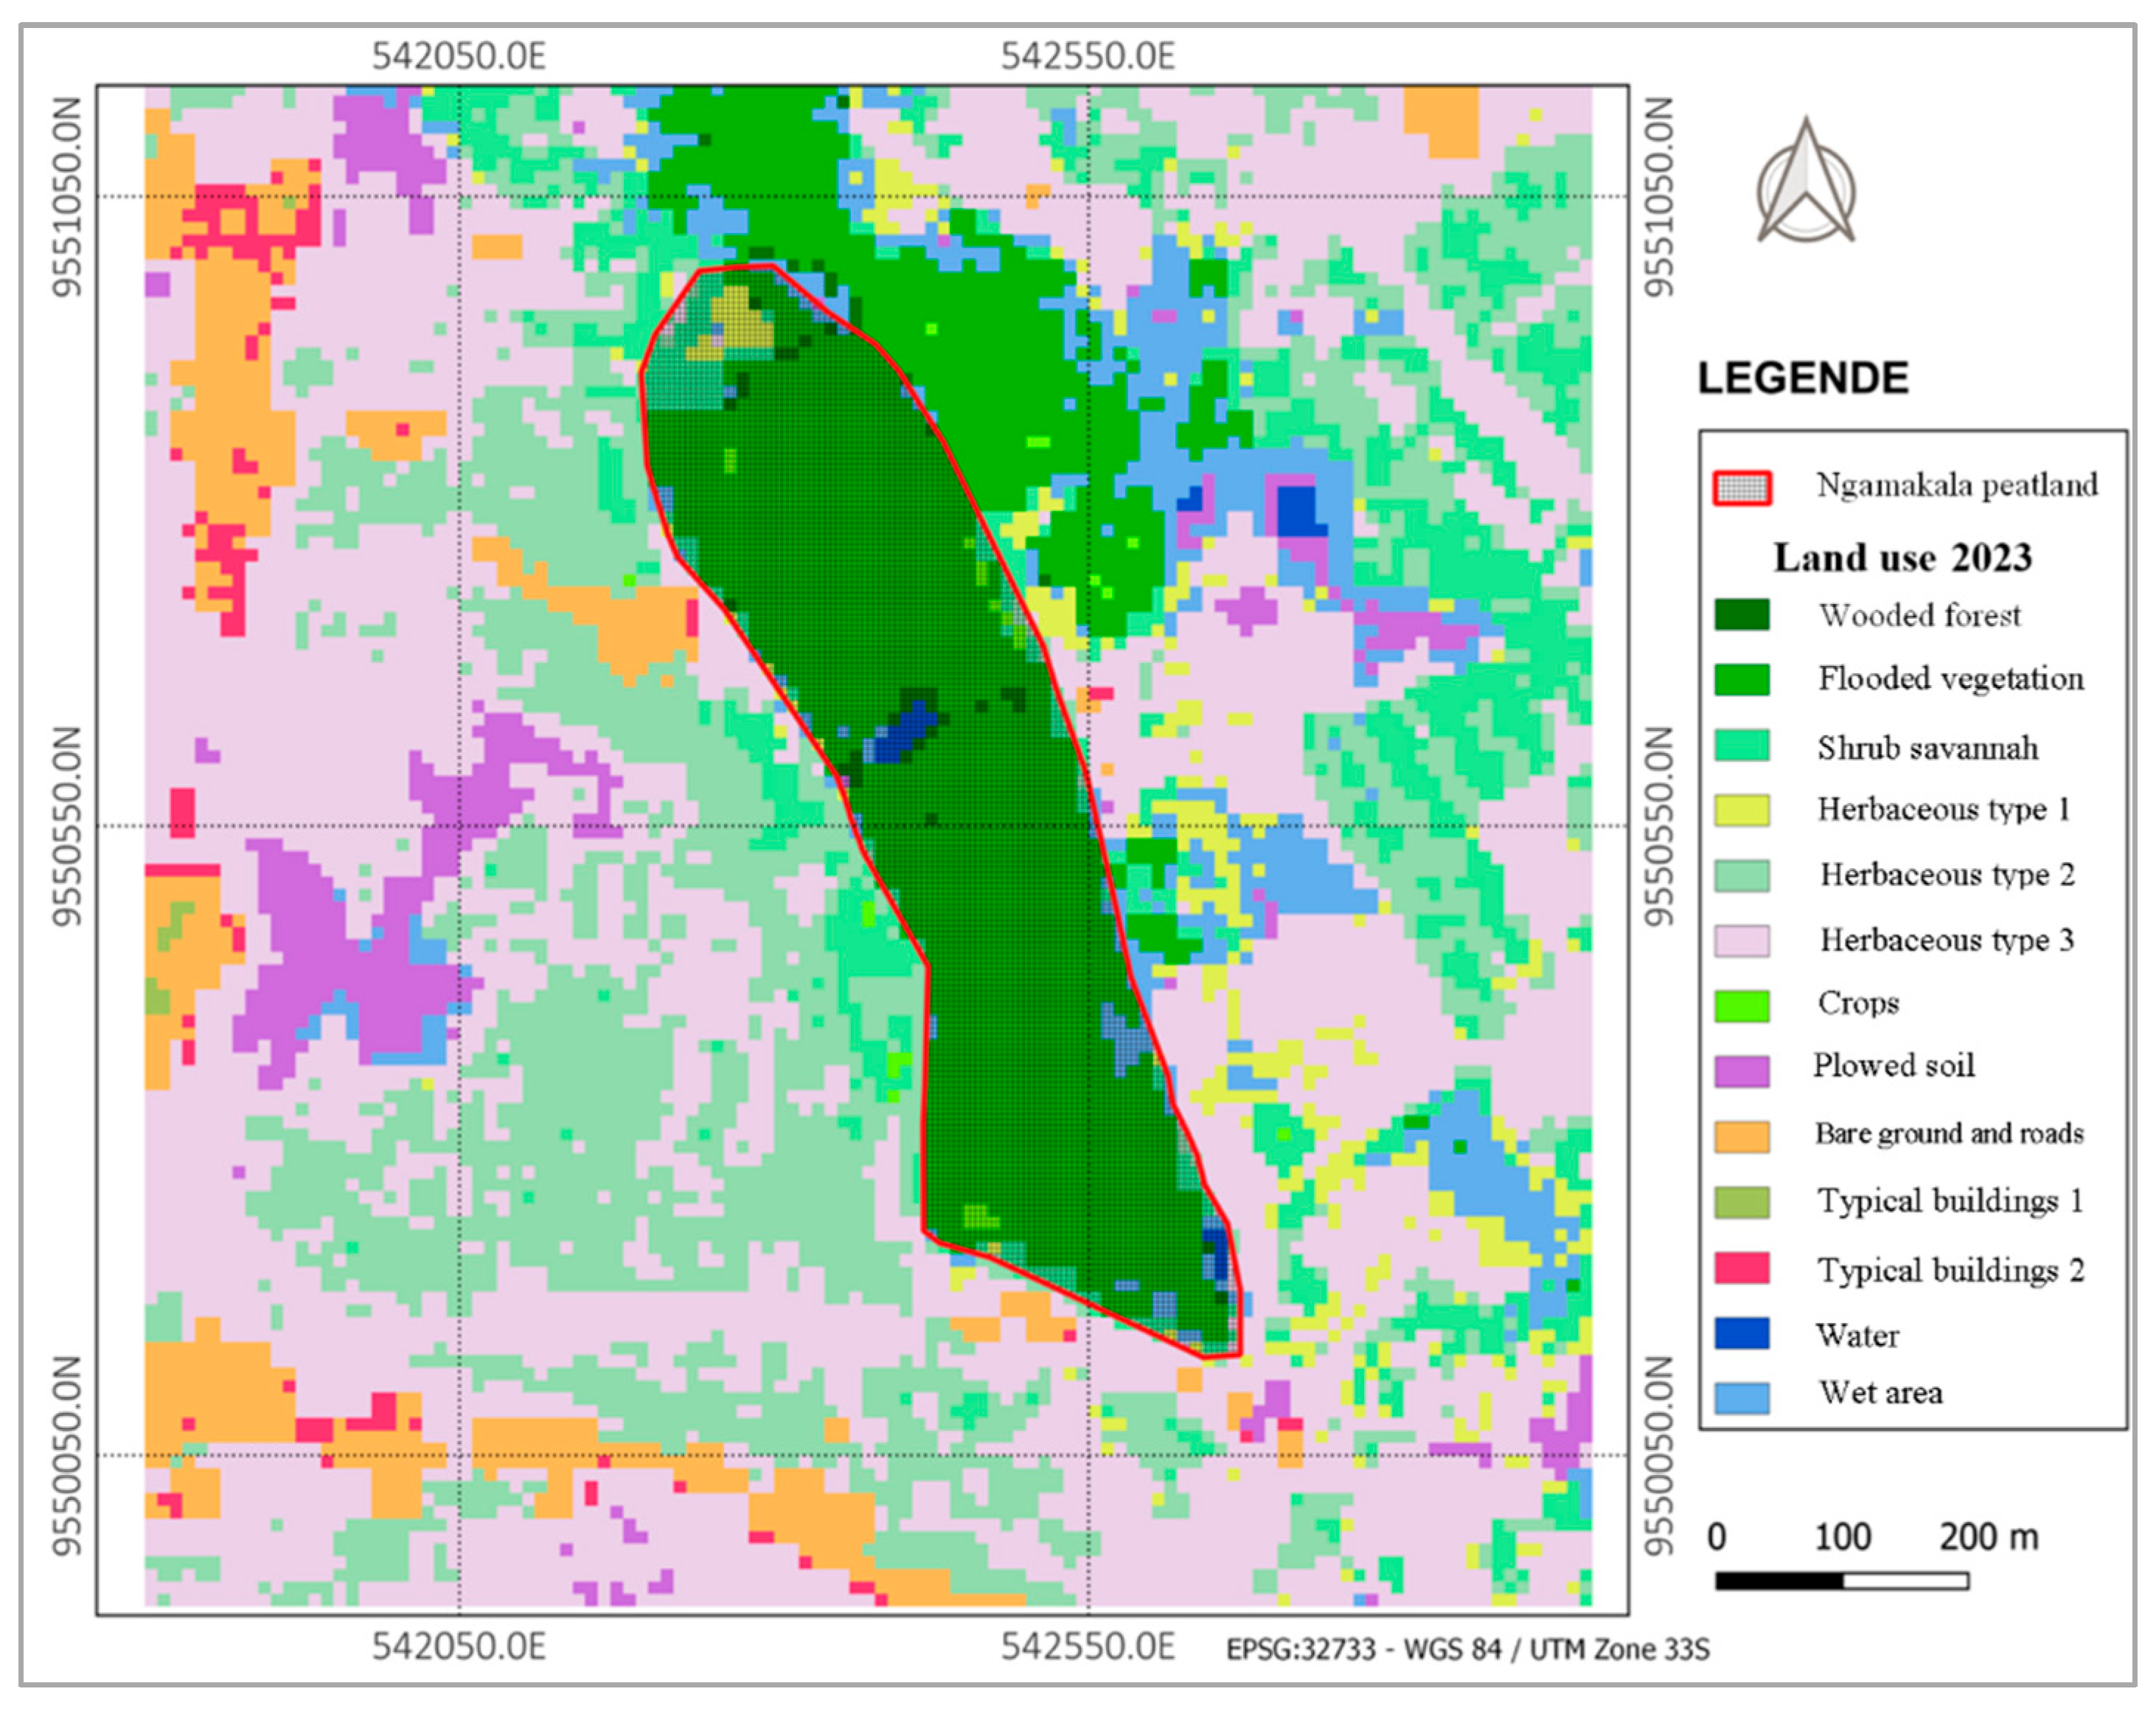
This research examines the Ngamakala peatland, situated in the Pool Department, approximately 30 km north of Brazzaville, the capital city (refer to
Figure 1). The peatland is positioned 37 km north of Brazzaville at coordinates 4º05′South latitude and 15º25′ East longitude, with an elevation of around 508 meters [
13,
14,
16,
17]. It encompasses a diminishing area of roughly 17,503 hectares, reflecting a loss of about 13 hectares over the past fifty years [
14]. Enclosed by hills, this peatland is sustained by runoff water interacting with a sandy rocky substrate. The water biotope exhibits acidic pH levels. From a phytogeographical perspective, Ngamakala lies within the Guinean-Congolese endemism center [
18], within the Congo/Zambezi transition zone and located in the Batéké Plateaux region [
19]. The climate is classified as Bas-Congolese of the Sudano-Guinean type [
20,
21], characterized by minimal precipitation in July at just 1 mm and significantly increased rainfall in November reaching up to 260 mm.
Ngamakala peatland is ca. 22 ha in size and has a relatively flat surface topography. The peatland watertable is fed by natural rainwater runoff and the underlying geology is sedimentary rocks of sandy composition [
23]. Around the Ngamakala depression, see
Figure 1b, vegetation dominated by shrub savannahs has developed. The vegetation is predominantly composed of shrubby and grassy savannah with a few patches of wooded areas in places [
24].
The Ngamakala wetland, once far from urban areas, is trapped between several dwellings in the Lifoula district and Igne district in the Pool Department. This depression houses the oldest peatland in the Republic of Congo. Carbon-14 (14C) dating indicates that it started forming at least 24,000 years BP. This ecological zone shelters sphagnum mosses and other places of wooded islets [
15,
17].
2.2. Earth Observation Data Used
To assess land cover change at Ngamakala peatland over the period from 2017 to 2023, we ran supervised classifications of harmonized Sentinel-2B multispectral (10 m resolution) images (MSI) from July 2017 and July 2023. For the classifications we used Level L1C data (where the effects of the atmosphere on the light reflected by the earth's surface and reaching the sensor are excluded) and the following 6 bands B02, B03, B04, B08, B11 and B12 The data was obtained from the Copernicus platform (
https://dataspace.copernicus.eu/ ).
The selected images underwent radiometric and atmospheric correction operations. This allowed the conversion of raw luminance values into ground reflectance followed by image enhancement by dynamic histogram spreading and extraction of the study area. These operations were carried out using QGIS-3.28 software via the SCP (Semi-Automatic Classification Plugin) module.
The data underwent enhancement techniques using dynamic histogram spreading. In addition, by combining field data insights (from Dec 2023,
Figure 5) with the coloured compositions and the spectral characteristics of map objects (
Table 1), we characterized the cartographic objects for analysis, following [
25,
26]
.
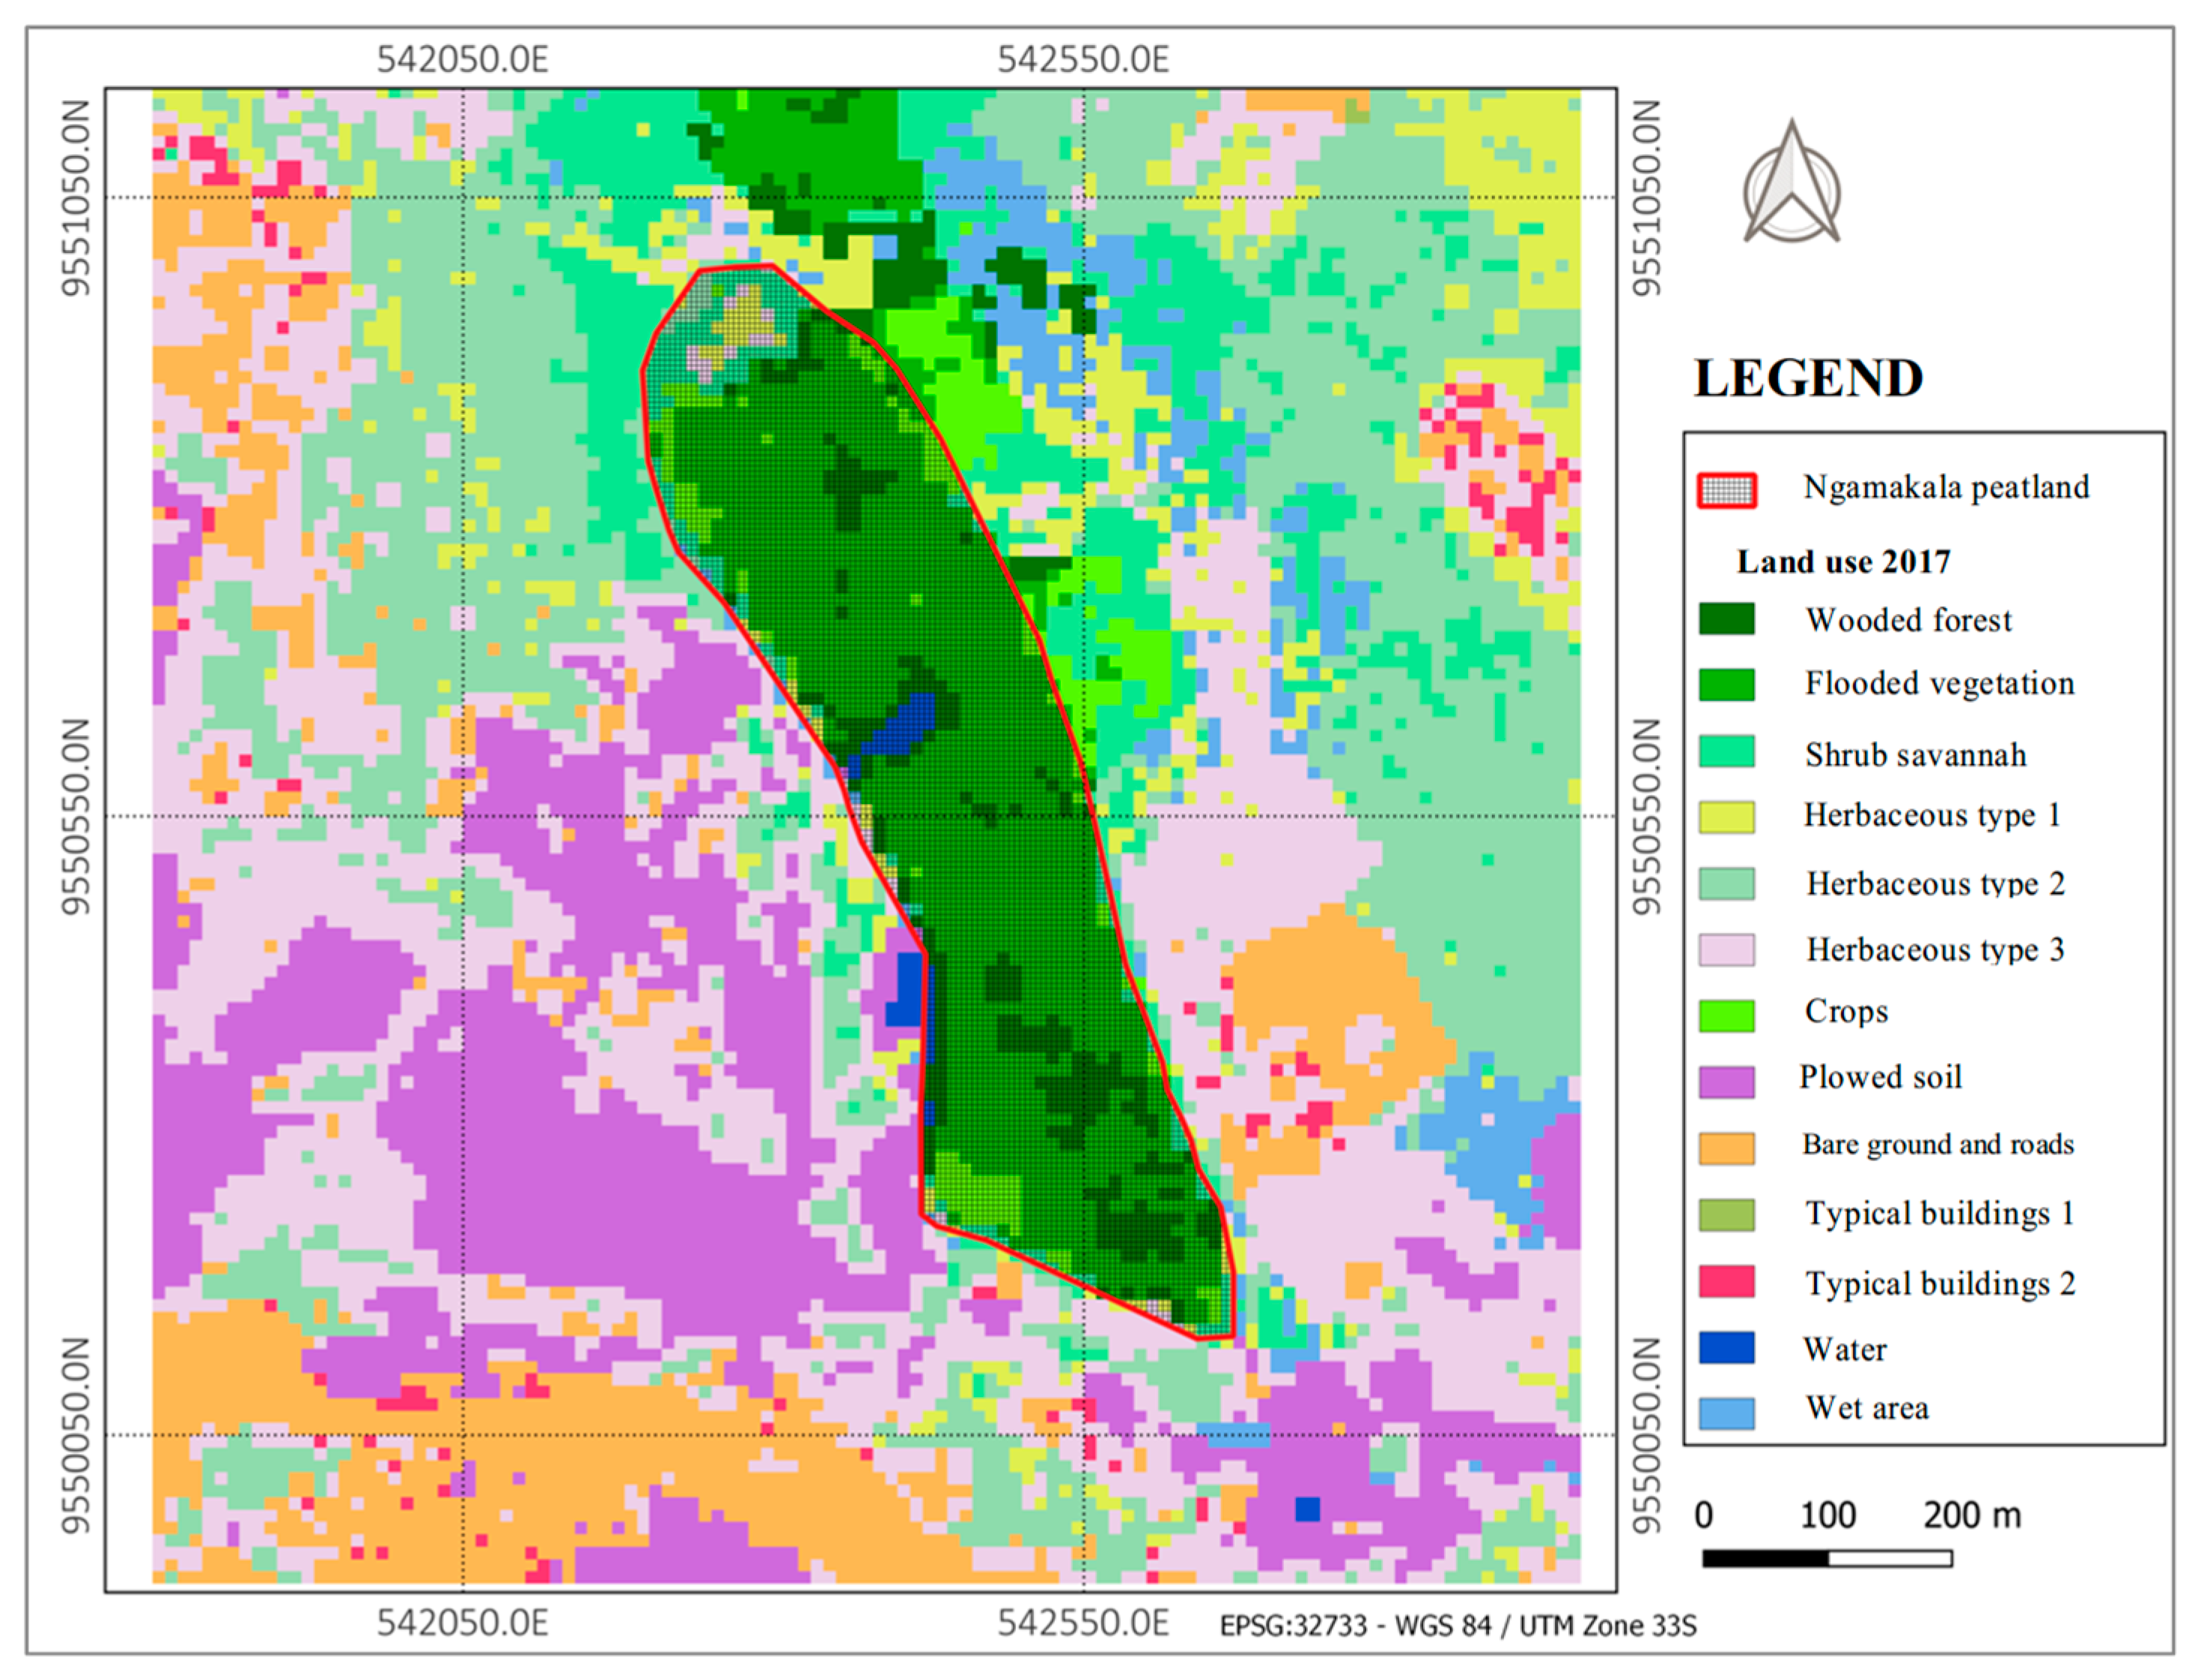
This resulted in the identification and naming of 13 Land cover units (
Table 2). Then, the collection of training and control samples of the 13 Land cover classes was carried out for each of the Sentinel-2B multispectral images for the years 2017 and 2023.
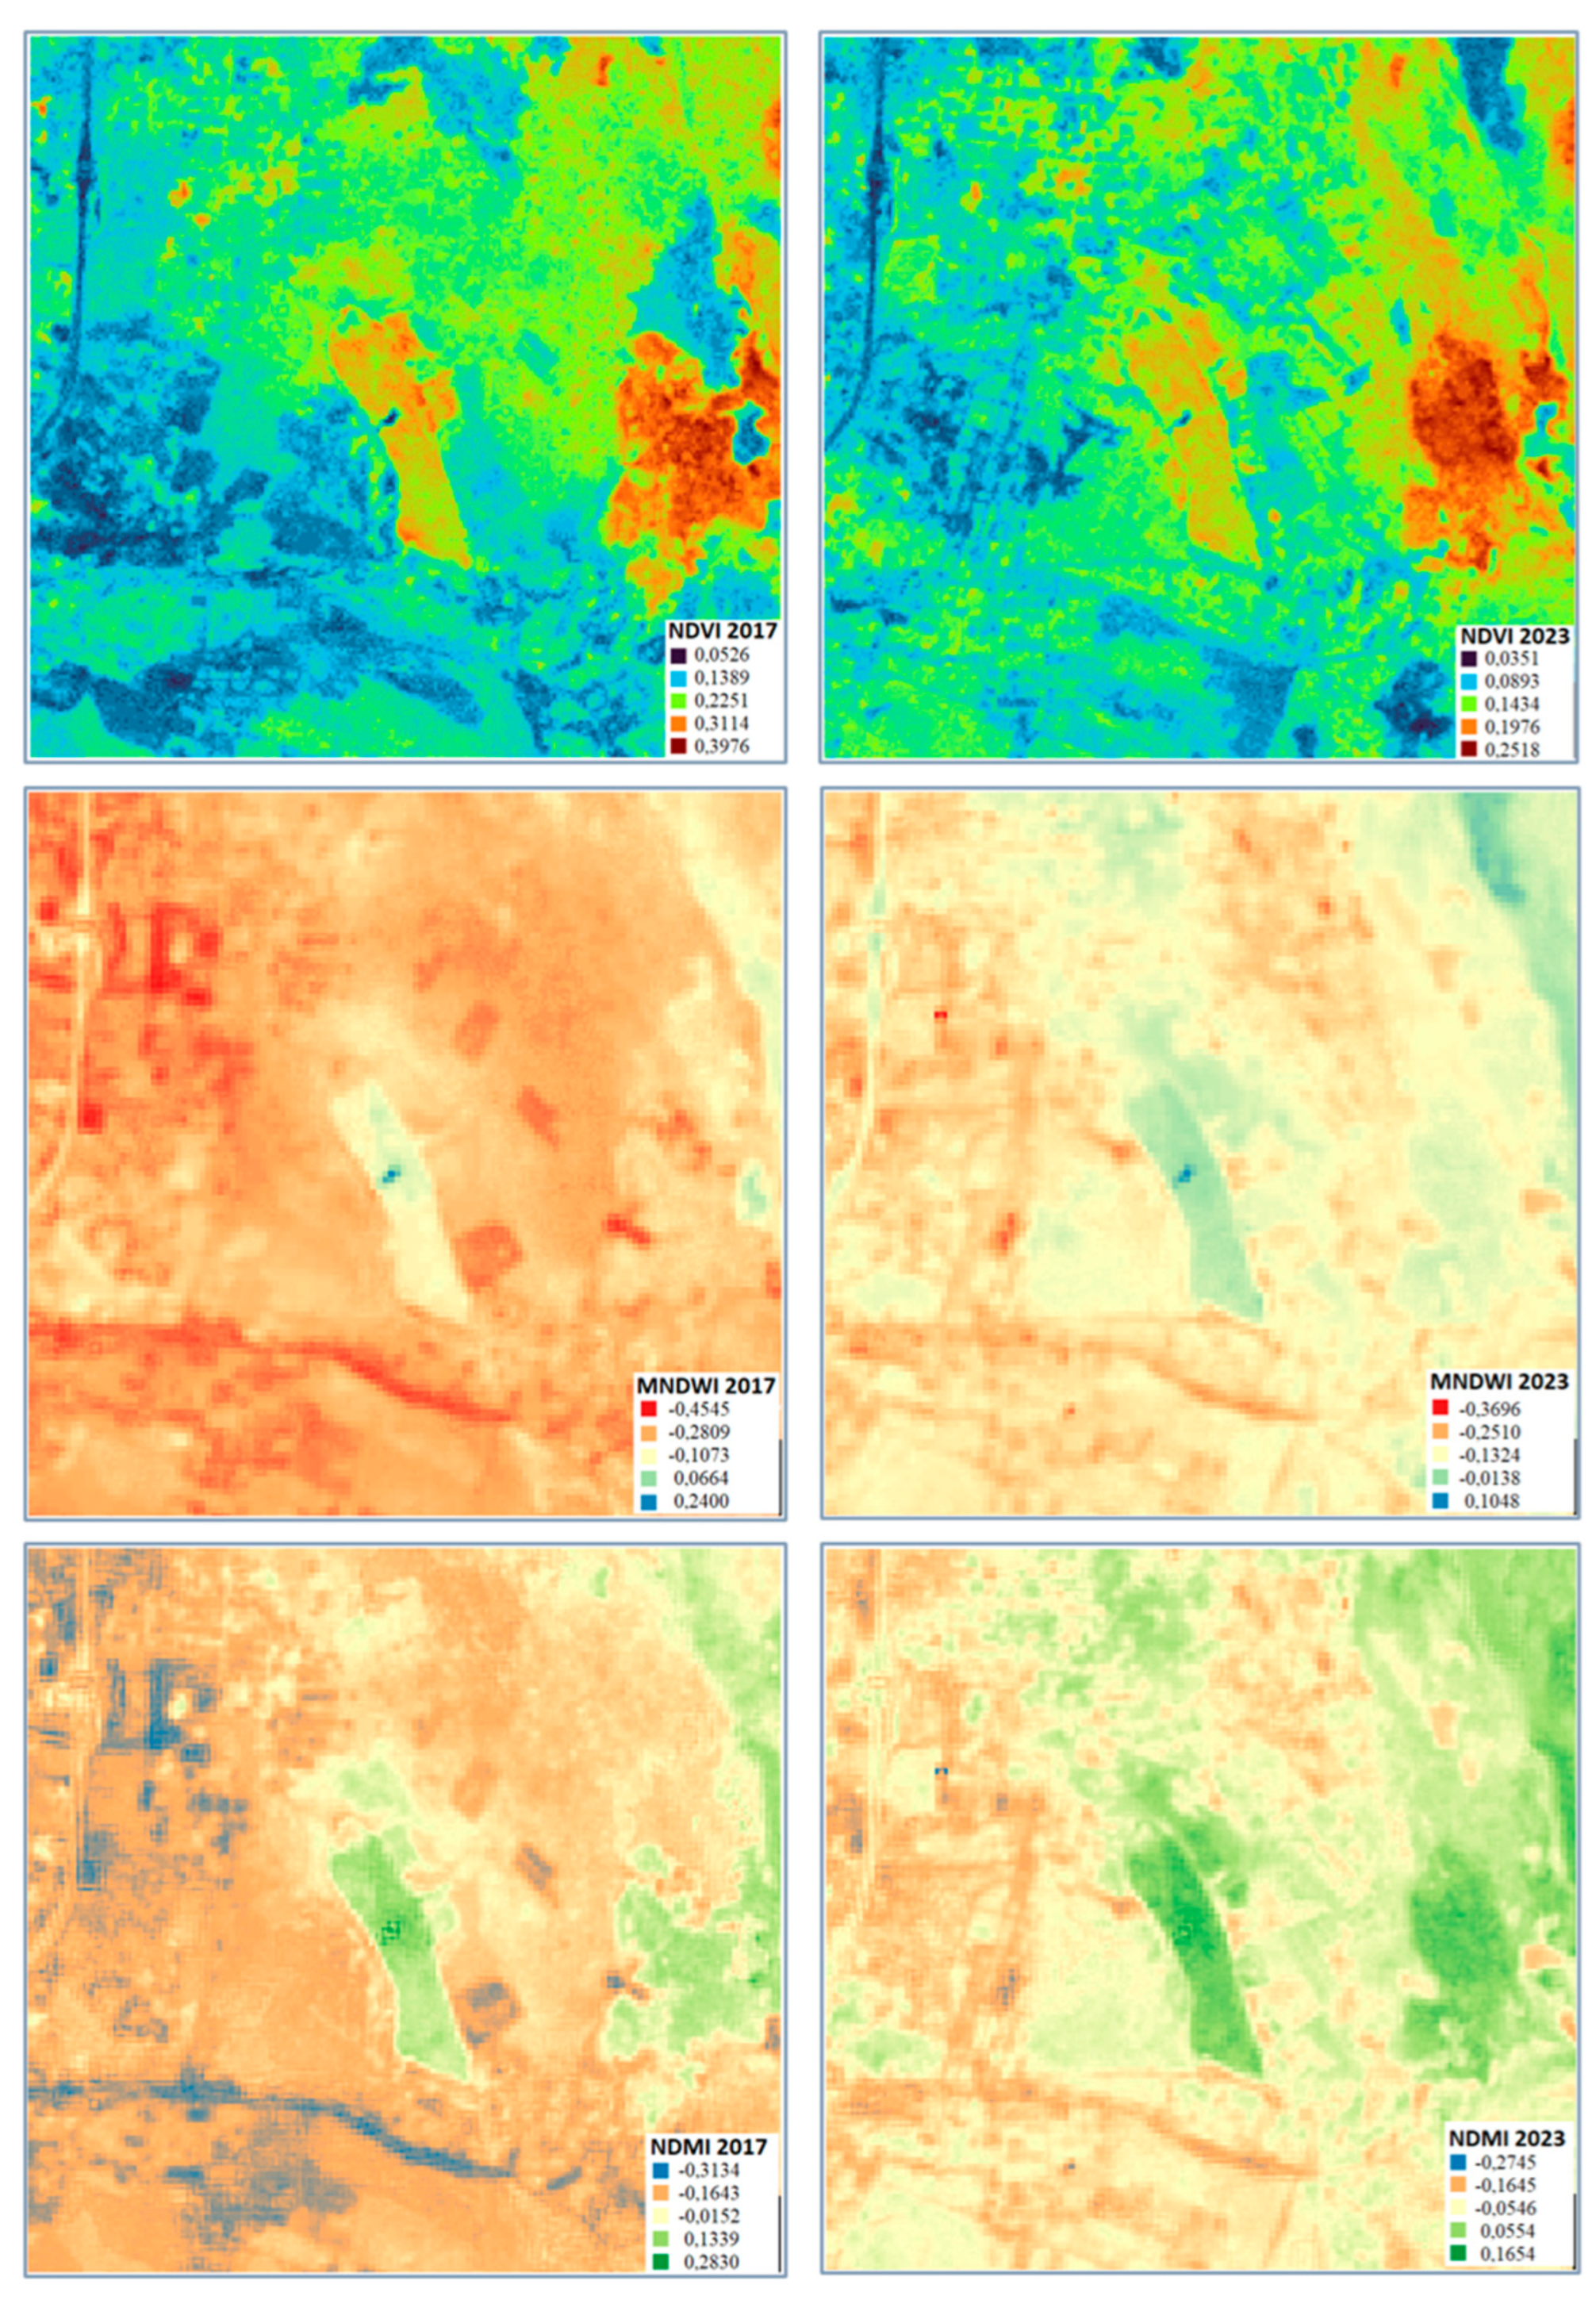
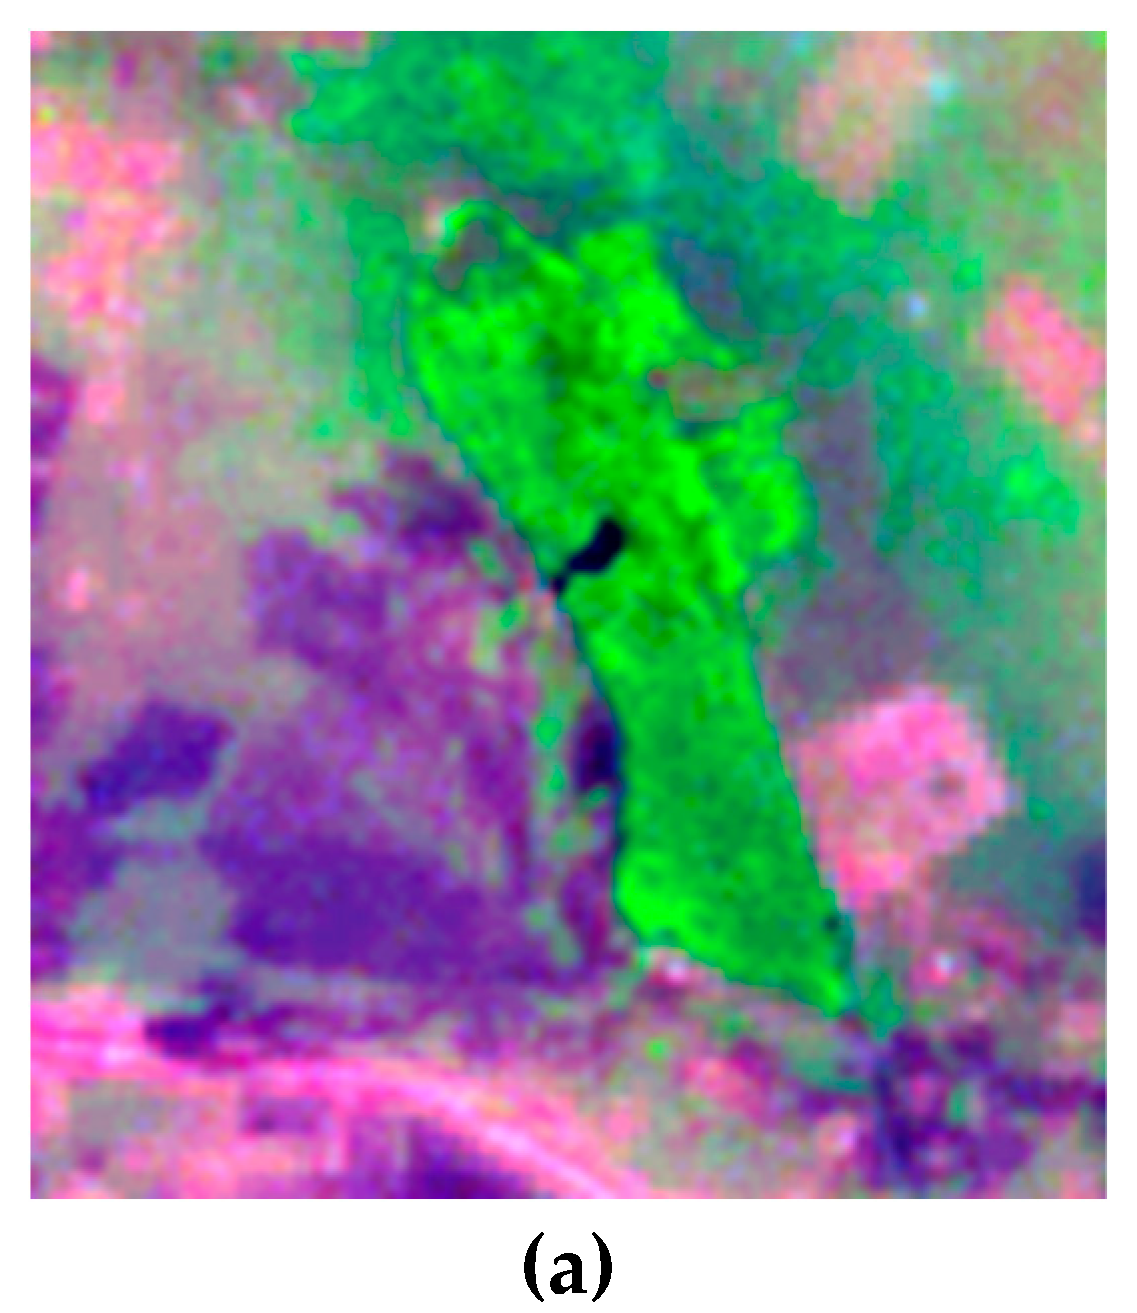
Figure 4.
Spectral index maps from MSI Sentinel-2B images.
Figure 4.
Spectral index maps from MSI Sentinel-2B images.
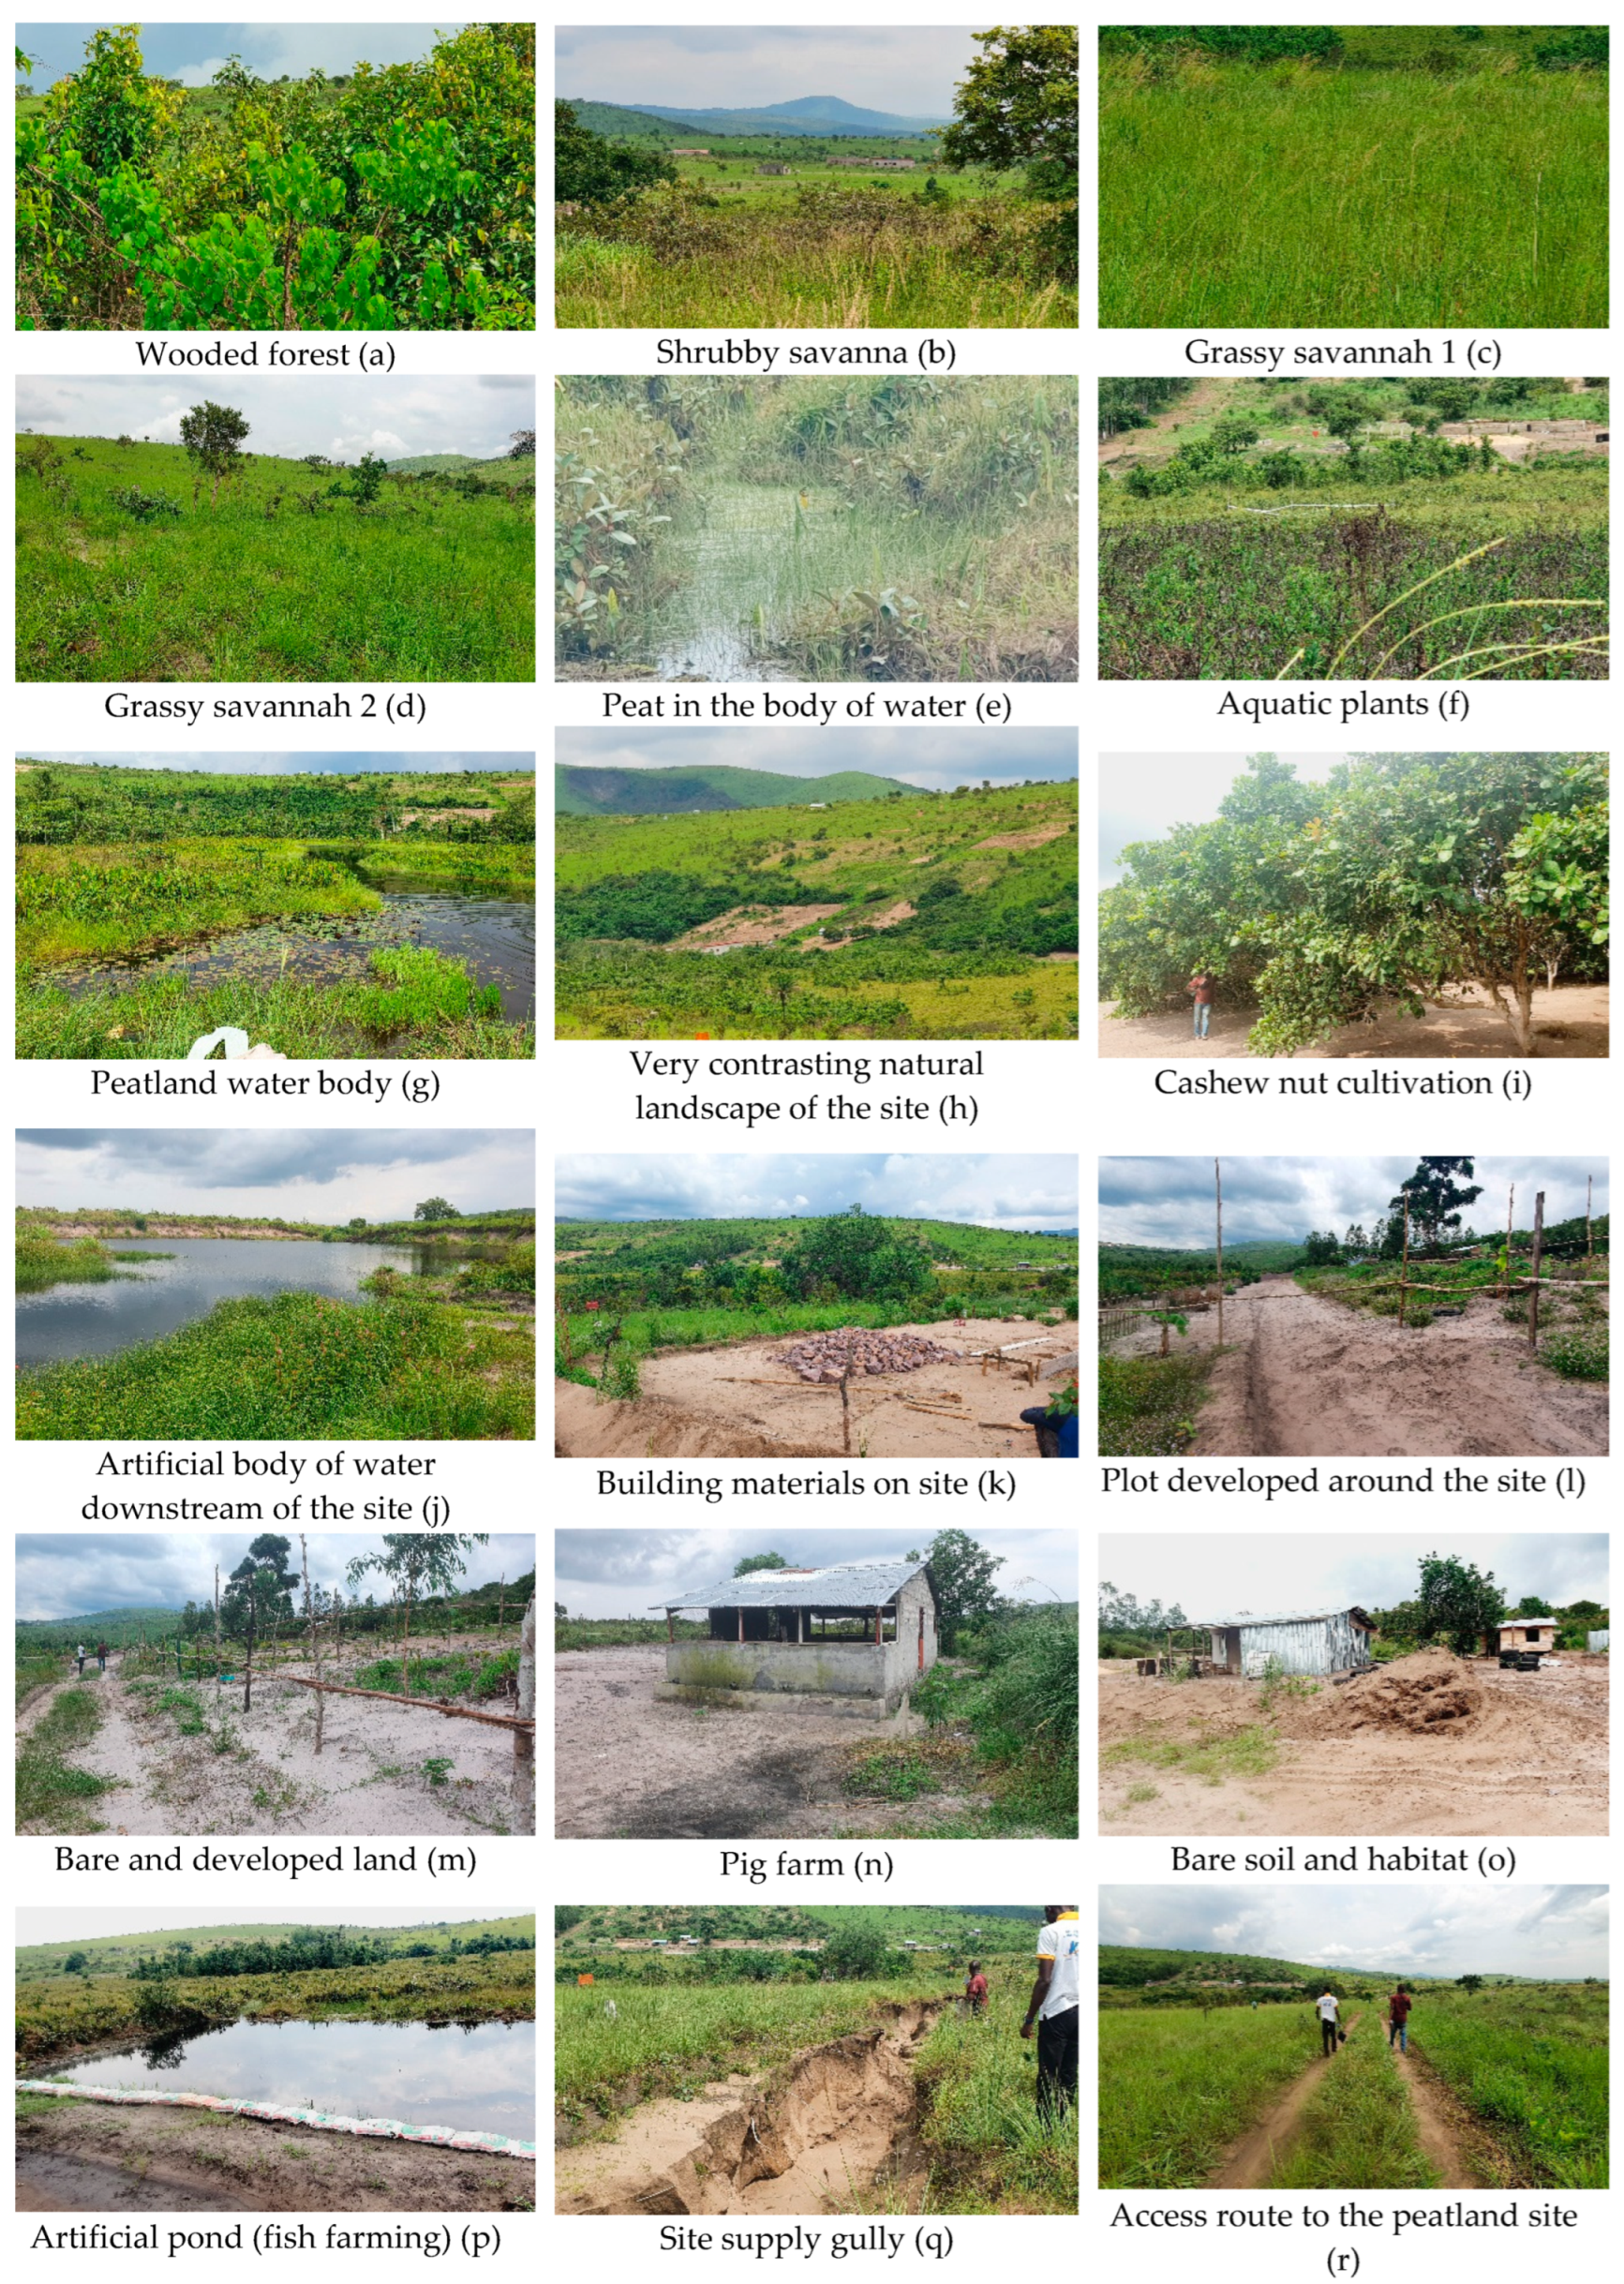
Figure 5.
Typology of surface conditions of the Ngamakala peatland site (Photos: field mission,December 21, 2023).
Figure 5.
Typology of surface conditions of the Ngamakala peatland site (Photos: field mission,December 21, 2023).
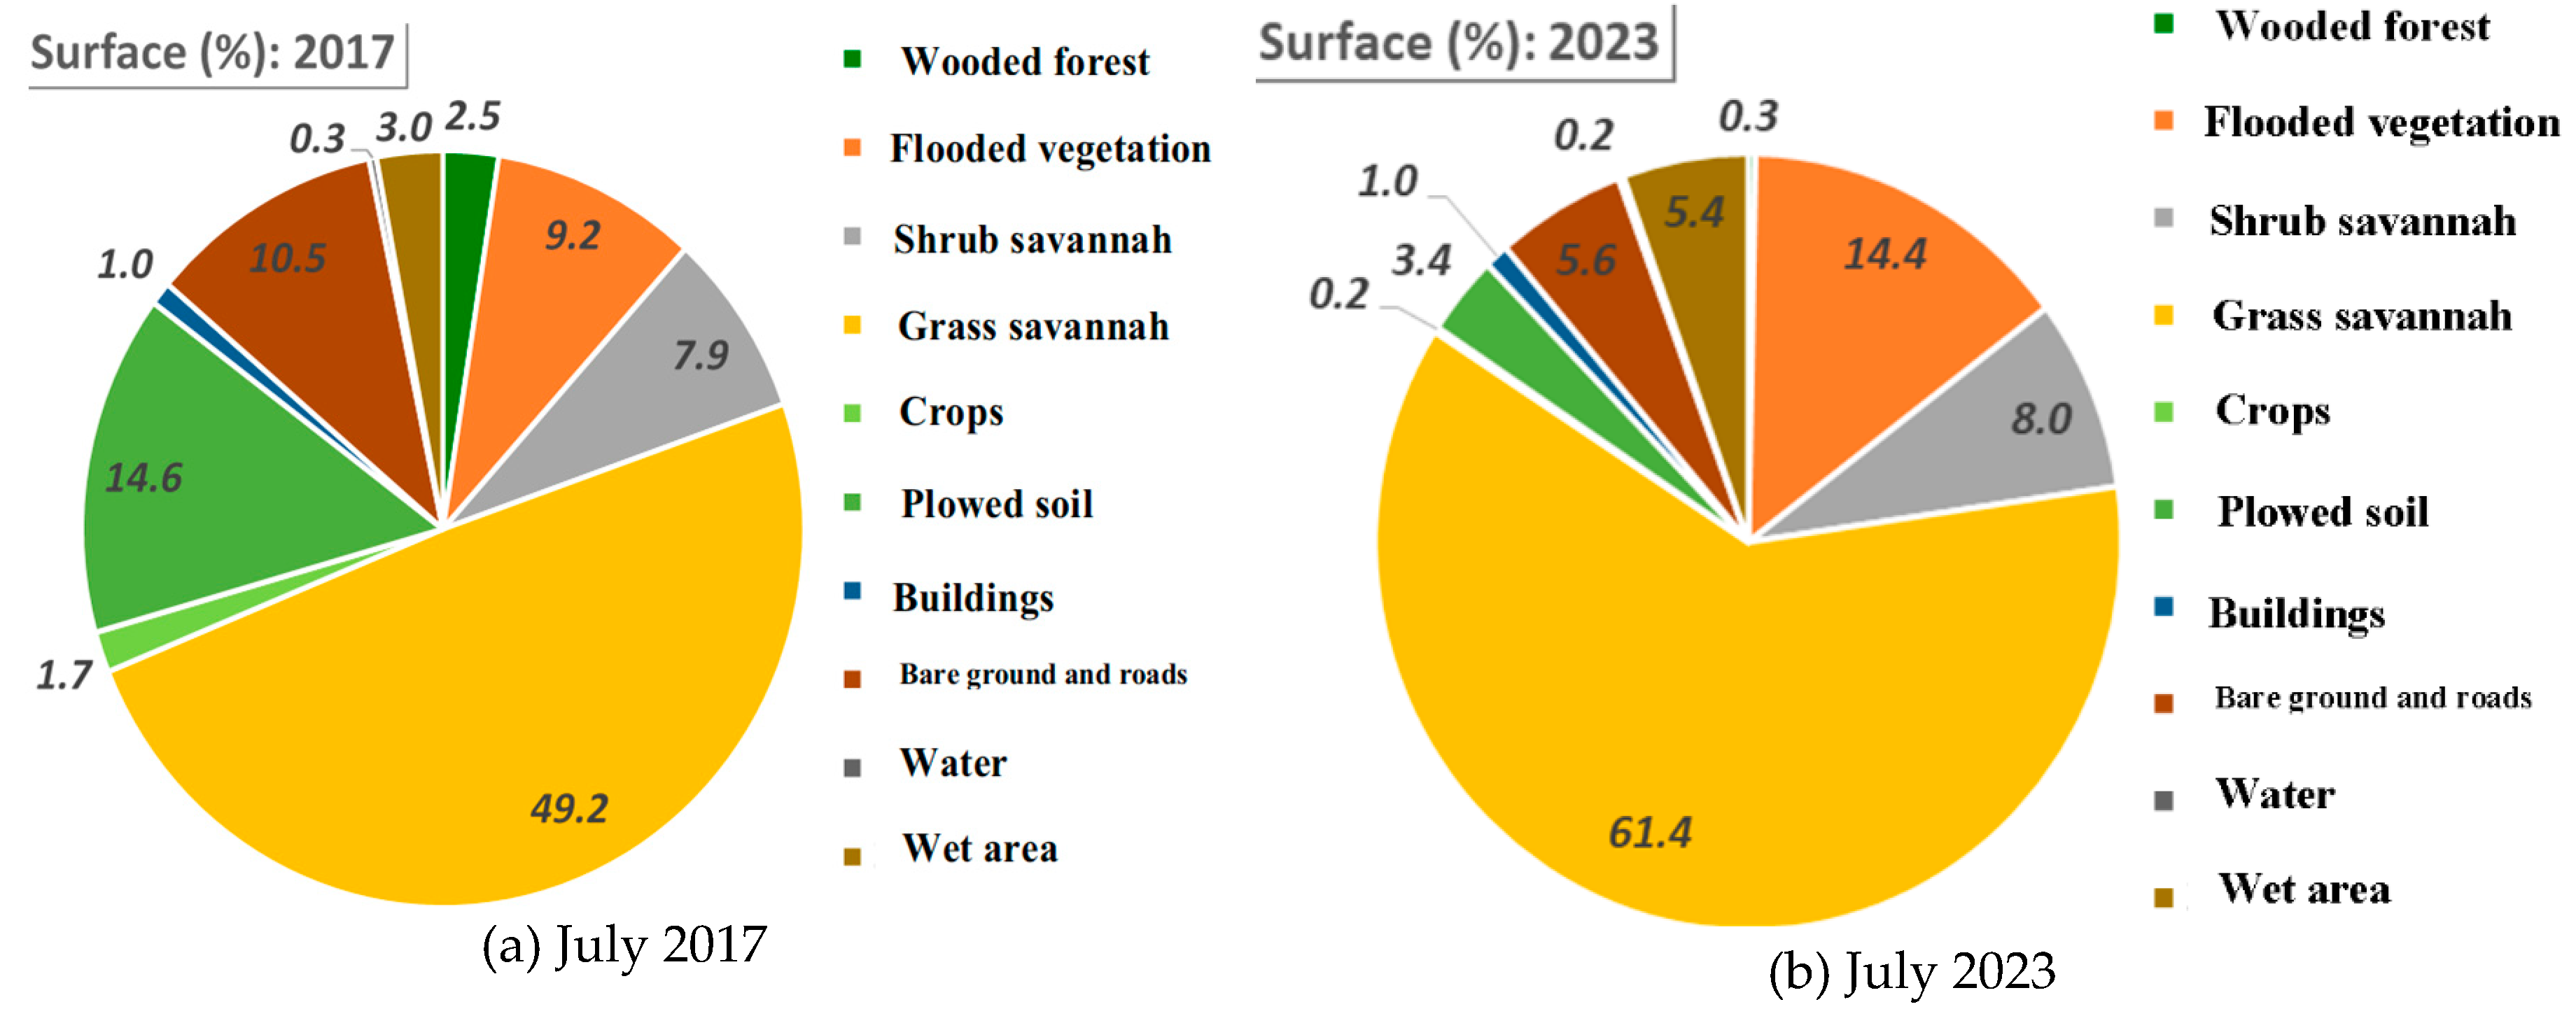
The thirteen Land cover classes were grouped into 10 classes for ease of visualization of the main Land cover changes. In both years the majority of the landscape is covered by grassy savannah (includes grassy types 1, 2 and 3), which accounts for 70.75 ha in 2017 and 88.29 ha in 2023, equivalent to 49.2% and 61.4% respectively of the study site.
2.3. Sampling ML Model Training Data
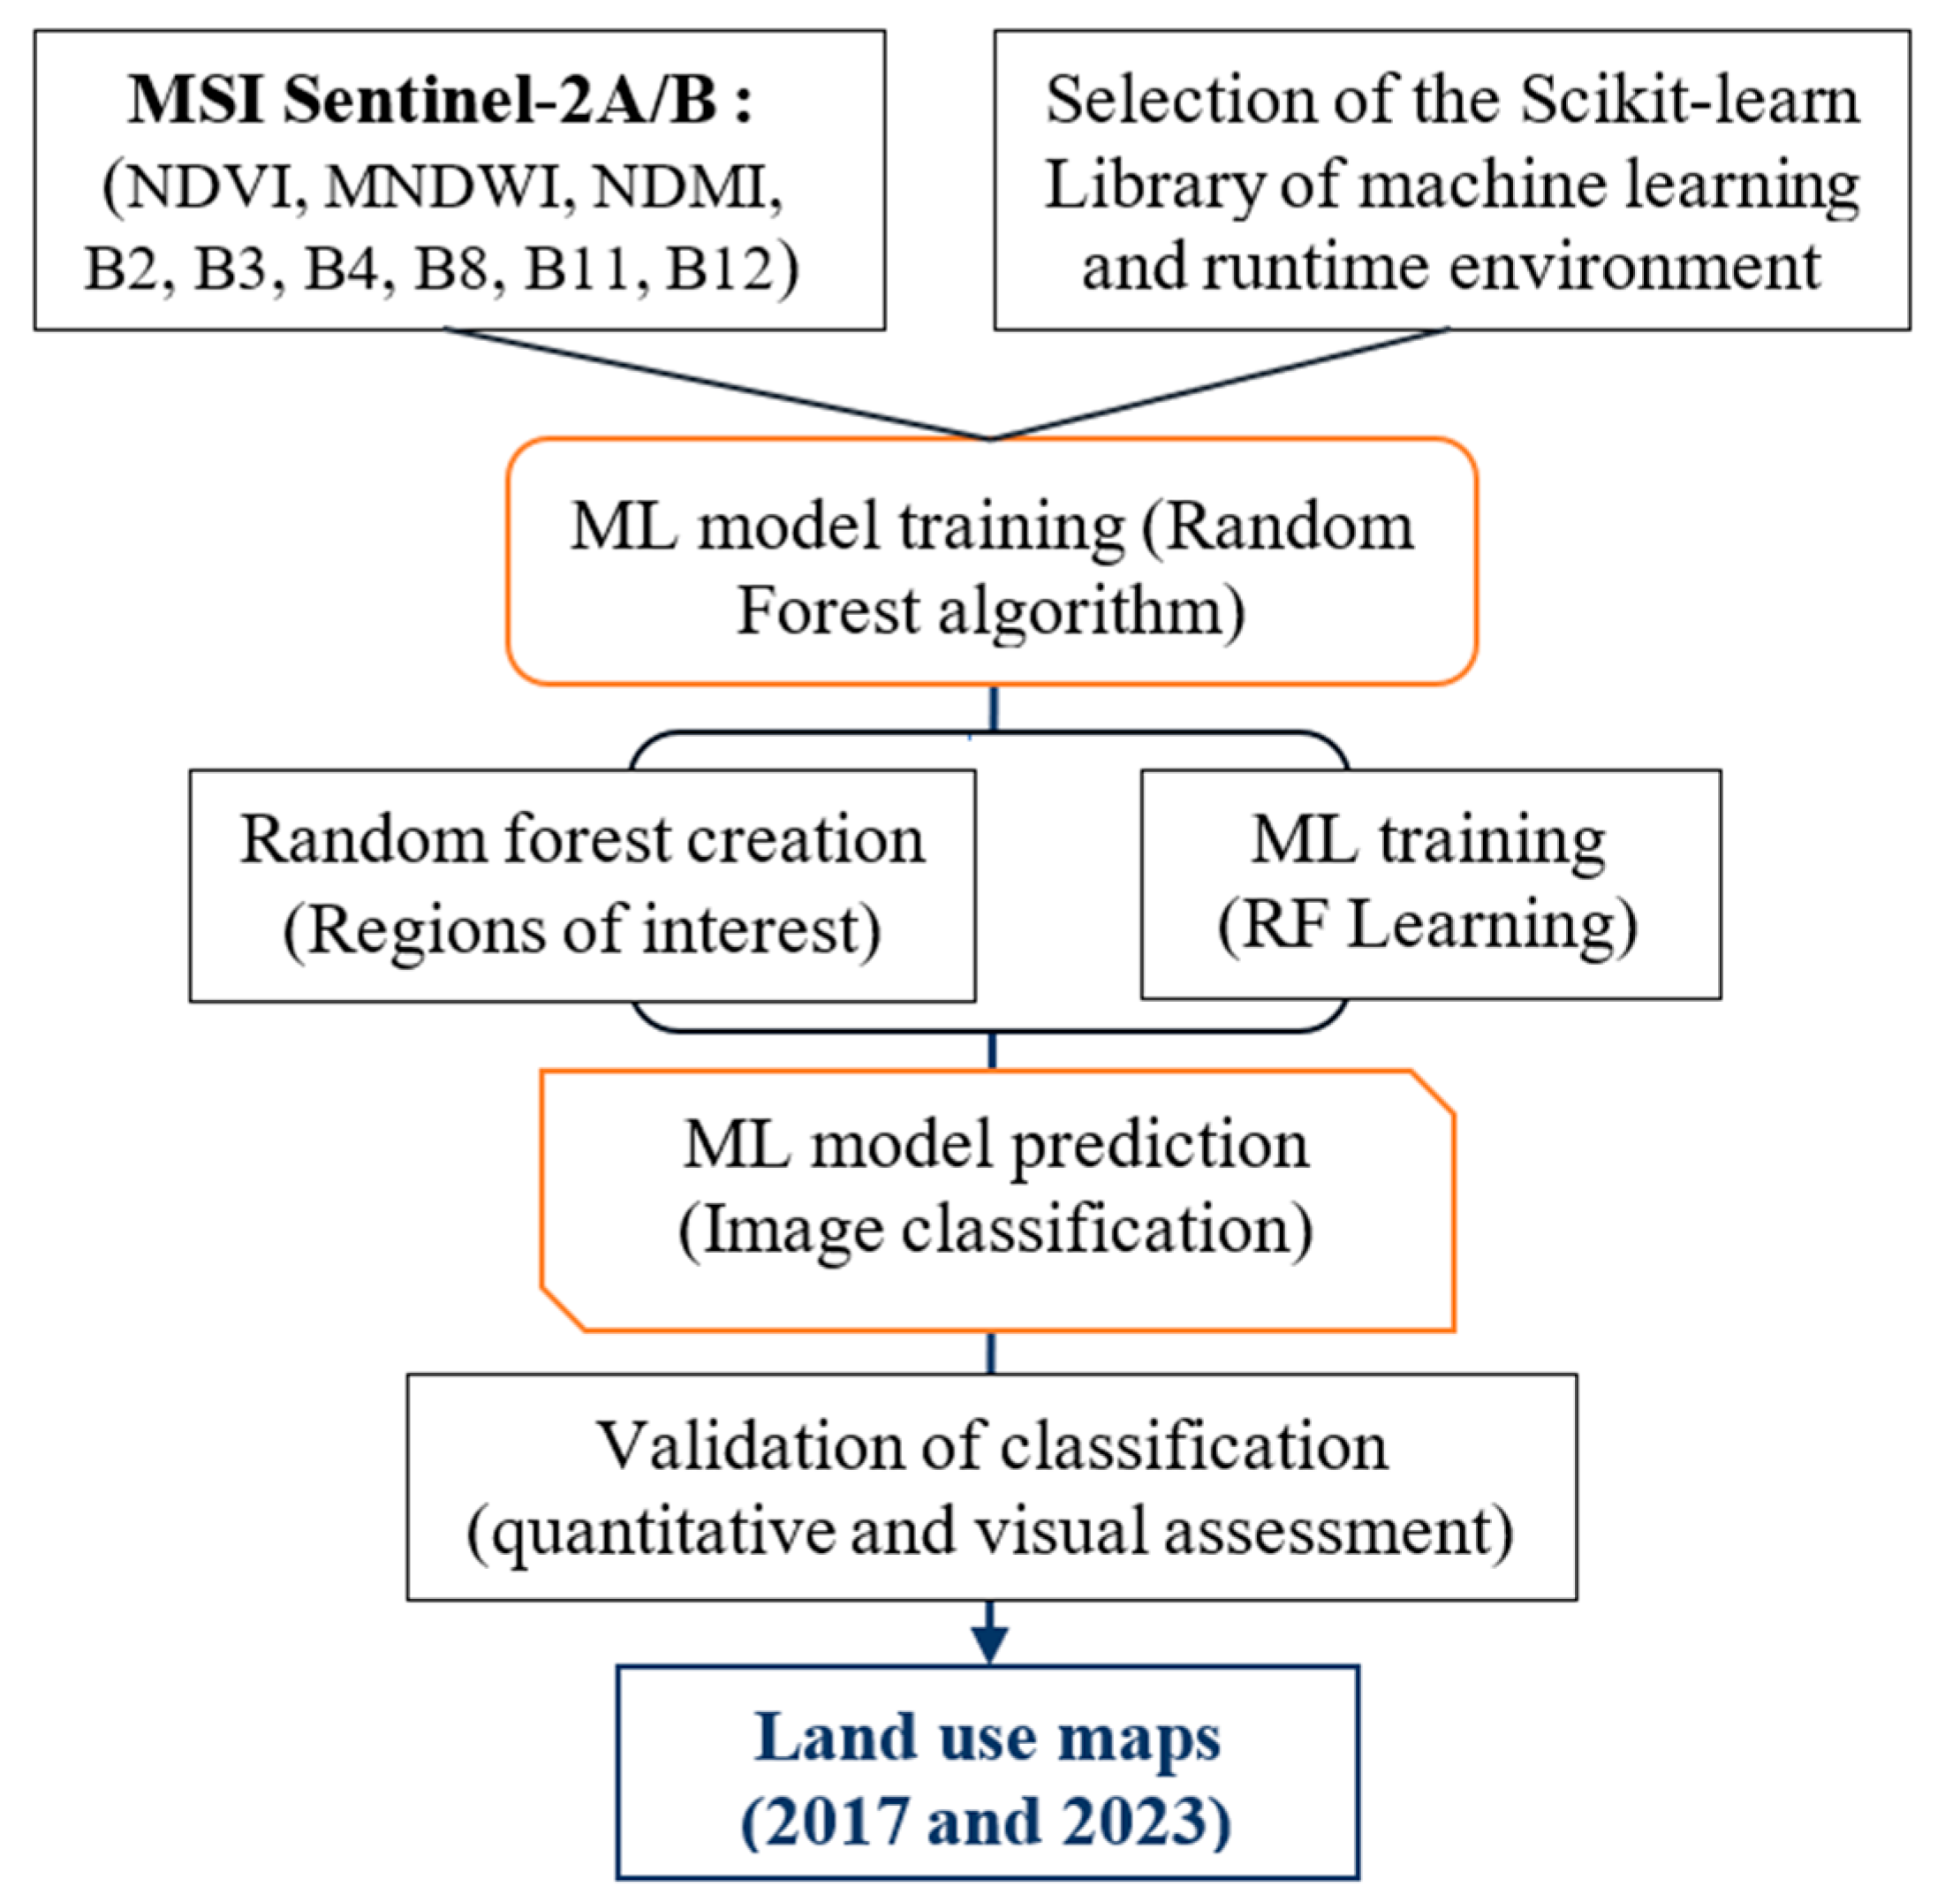
The collected geospatial data (MSI Sentinel-2B images) as well as field visit data were analyzed to identify the Land cover and land cover units. Then, the Random Forest Machine Learning algorithm was modeled to classify these units using the collected and analyzed geospatial data along with the Scikit-learn machine learning library
In order to perform a supervised classification of land cover, units based on the 13 defined classes, a process of selecting a representative subset of the available data is done to train a machine learning model. This involves judiciously choosing examples of observations that represent different classes or characteristics present in the complete dataset. A total of 318 samples for 2017 and 278 for 2023 were collected. These training samples were used to teach the model about patterns and relationships between object features and desired outcomes. Of the set of representative samples created for period (2017 and 2023) based on the collected data, half (50%) served as training data for the ML model and the other half for validation. This step, also called pseudocode design or random forest creation [
27], consists of assigning a numerical code to each class, which is then associated with a textual value. During the training process, the columns containing the numerical codes are indicated to the algorithm as class references for the random trees [
28]. The objective of this step is to guarantee the availability of complete and quality data to obtain reliable results during the application phase of the Machine Learning RF algorithm to these MSI Sentinel-2B images (insert the refs of all these authors).
2.4. Training the Random Forest Algorithm
The Random Forest algorithm was activated using training data from a set of samples selected from soil biophysical indices for the thirteen classes identified in the multispectral images. Each sample was labeled with a corresponding class. These features were used to train the Random Forest algorithm on the two separate dates. This algorithm learns to associate patterns and relationships between features and corresponding classes. To use this algorithm, the scikit-learn library from dzetsaka, a plugin for semi-automatic classification in QGIS, commonly used to assist in machine learning, is previously installed into the QGIS environment [
27].
2.5. Classification of MSI Sentinel-2B Images
The Random Forest algorithm was applied to MSI Sentinel-2B images for land cover mapping. In this step, MSI Sentinel-2 images were segmented into homogeneous units called objects or regions of interest. Similar to the sequence of steps in the Random Forest algorithm training phase, each object was characterized by its spectral values and other attributes of the color composition of the different bands. These features were used as inputs to the Random Forest algorithm, which classified each object into a specific class corresponding to a ground object category. The features of the objects were compared to the models learned by the algorithm during the training phase. Using this information, the algorithm assigned a class to each object, thus allowing the Land covers of the peatland site to be mapped.
2.6. Classification Assessment and Validation of Results
After the classification of MSI Sentinel-2 images using the Random Forest algorithm, the evaluation and validation of the results obtained are made from the measurement of the accuracy of the mapping in order to verify the relevance and reliability of the classifications carried out. Thus, different evaluation indicators, such as overall accuracy, Cohen's kappa and confusion matrices, were used for this purpose to quantify the performance of the algorithm. These measurements made it possible to determine the capacity of the Random Forest algorithm to correctly classify Land cover units.
2.7. Detection of Land Cover Changes
Change detection in this study involves a comparison of the two Land cover maps for a given area over the two study periods (2017 and 2023), to finally determine the type, magnitude and location of the changes.
This study uses radiometric change detection to detect Land cover changes within a given pixel, by comparing the images between the two years of analysis. In the case of this study, the specific method adopted is that of supervised image classification from the capture of regions of interest to define the belonging of pixels to a class. Other techniques such as pixel-by-pixel comparison of images from two periods [
29] and change vector analysis [
30] are used in change detection analyses in remote sensing studies. However, these techniques are very sensitive to registration errors and the presence of mixed pixel radiometries. Supervised image classification establishes a correspondence of radiometries between the old and the new date and a number of changes per class lower than the number of objects that were used to describe it. Thus, it is more broadly a question of comparing the Land cover classifications obtained for each year of analysis (2017 and 2023). This method is commonly used in remote sensing studies monitoring changes in Land cover. The detection of changes is done through the SCP (define acronym) module in QGIS through a post-processing analysis of the two Land cover maps using that of 2017 as a reference. This produces a Land cover change matrix which reflects the relationships over time between the different classes and the change map [
31]. The statistical analysis of Land cover changes is done by calculating the average annual rate of change TC which in order to determine the rates of increase or decrease of Land cover classes between two dates:
where (S2/S1): ratio of the surfaces of a Land cover class of dates T1 and T2.
Figure 3.
Land cover mapping process by Machine Learning.
Figure 3.
Land cover mapping process by Machine Learning.
3. Results
3.1. Spatial Dynamics of Land Cover
Figure 6 and
Figure 7 depict maps of the spatial and temporal dynamics of the LULC at the Ngamakala peatland site created using Sentinel-2B images. The LULC classification was performed using the Random Forest (RF) supervised machine learning algorithm.
Figure 9 illustrates the alterations observed between the two specified dates. The overall accuracies of the Land cover maps for 2017 and 2023 stand at 91% and 96%, respectively, while the Kappa coefficients are recorded at 0.90 and 0.95, respectively.
Figure 8 shows the composition of Land cover classes between 2017 and 2023. The thirteen land cover classes were grouped into 10 classes for ease of visualization of the main land cover changes. These results show a high cover of grassy savannah overall across both years of study (included grassy types 1,2 and 3); which represent 70.75 ha in 2017 and 88.29 ha in 2023, equivalent to 49.2 % and 61.4% of the study site, respectively for each year of study.
Figure 8.
Proportions of Land cover classes at the Ngamakala Peatland site between 2017 and 2023.
Figure 8.
Proportions of Land cover classes at the Ngamakala Peatland site between 2017 and 2023.
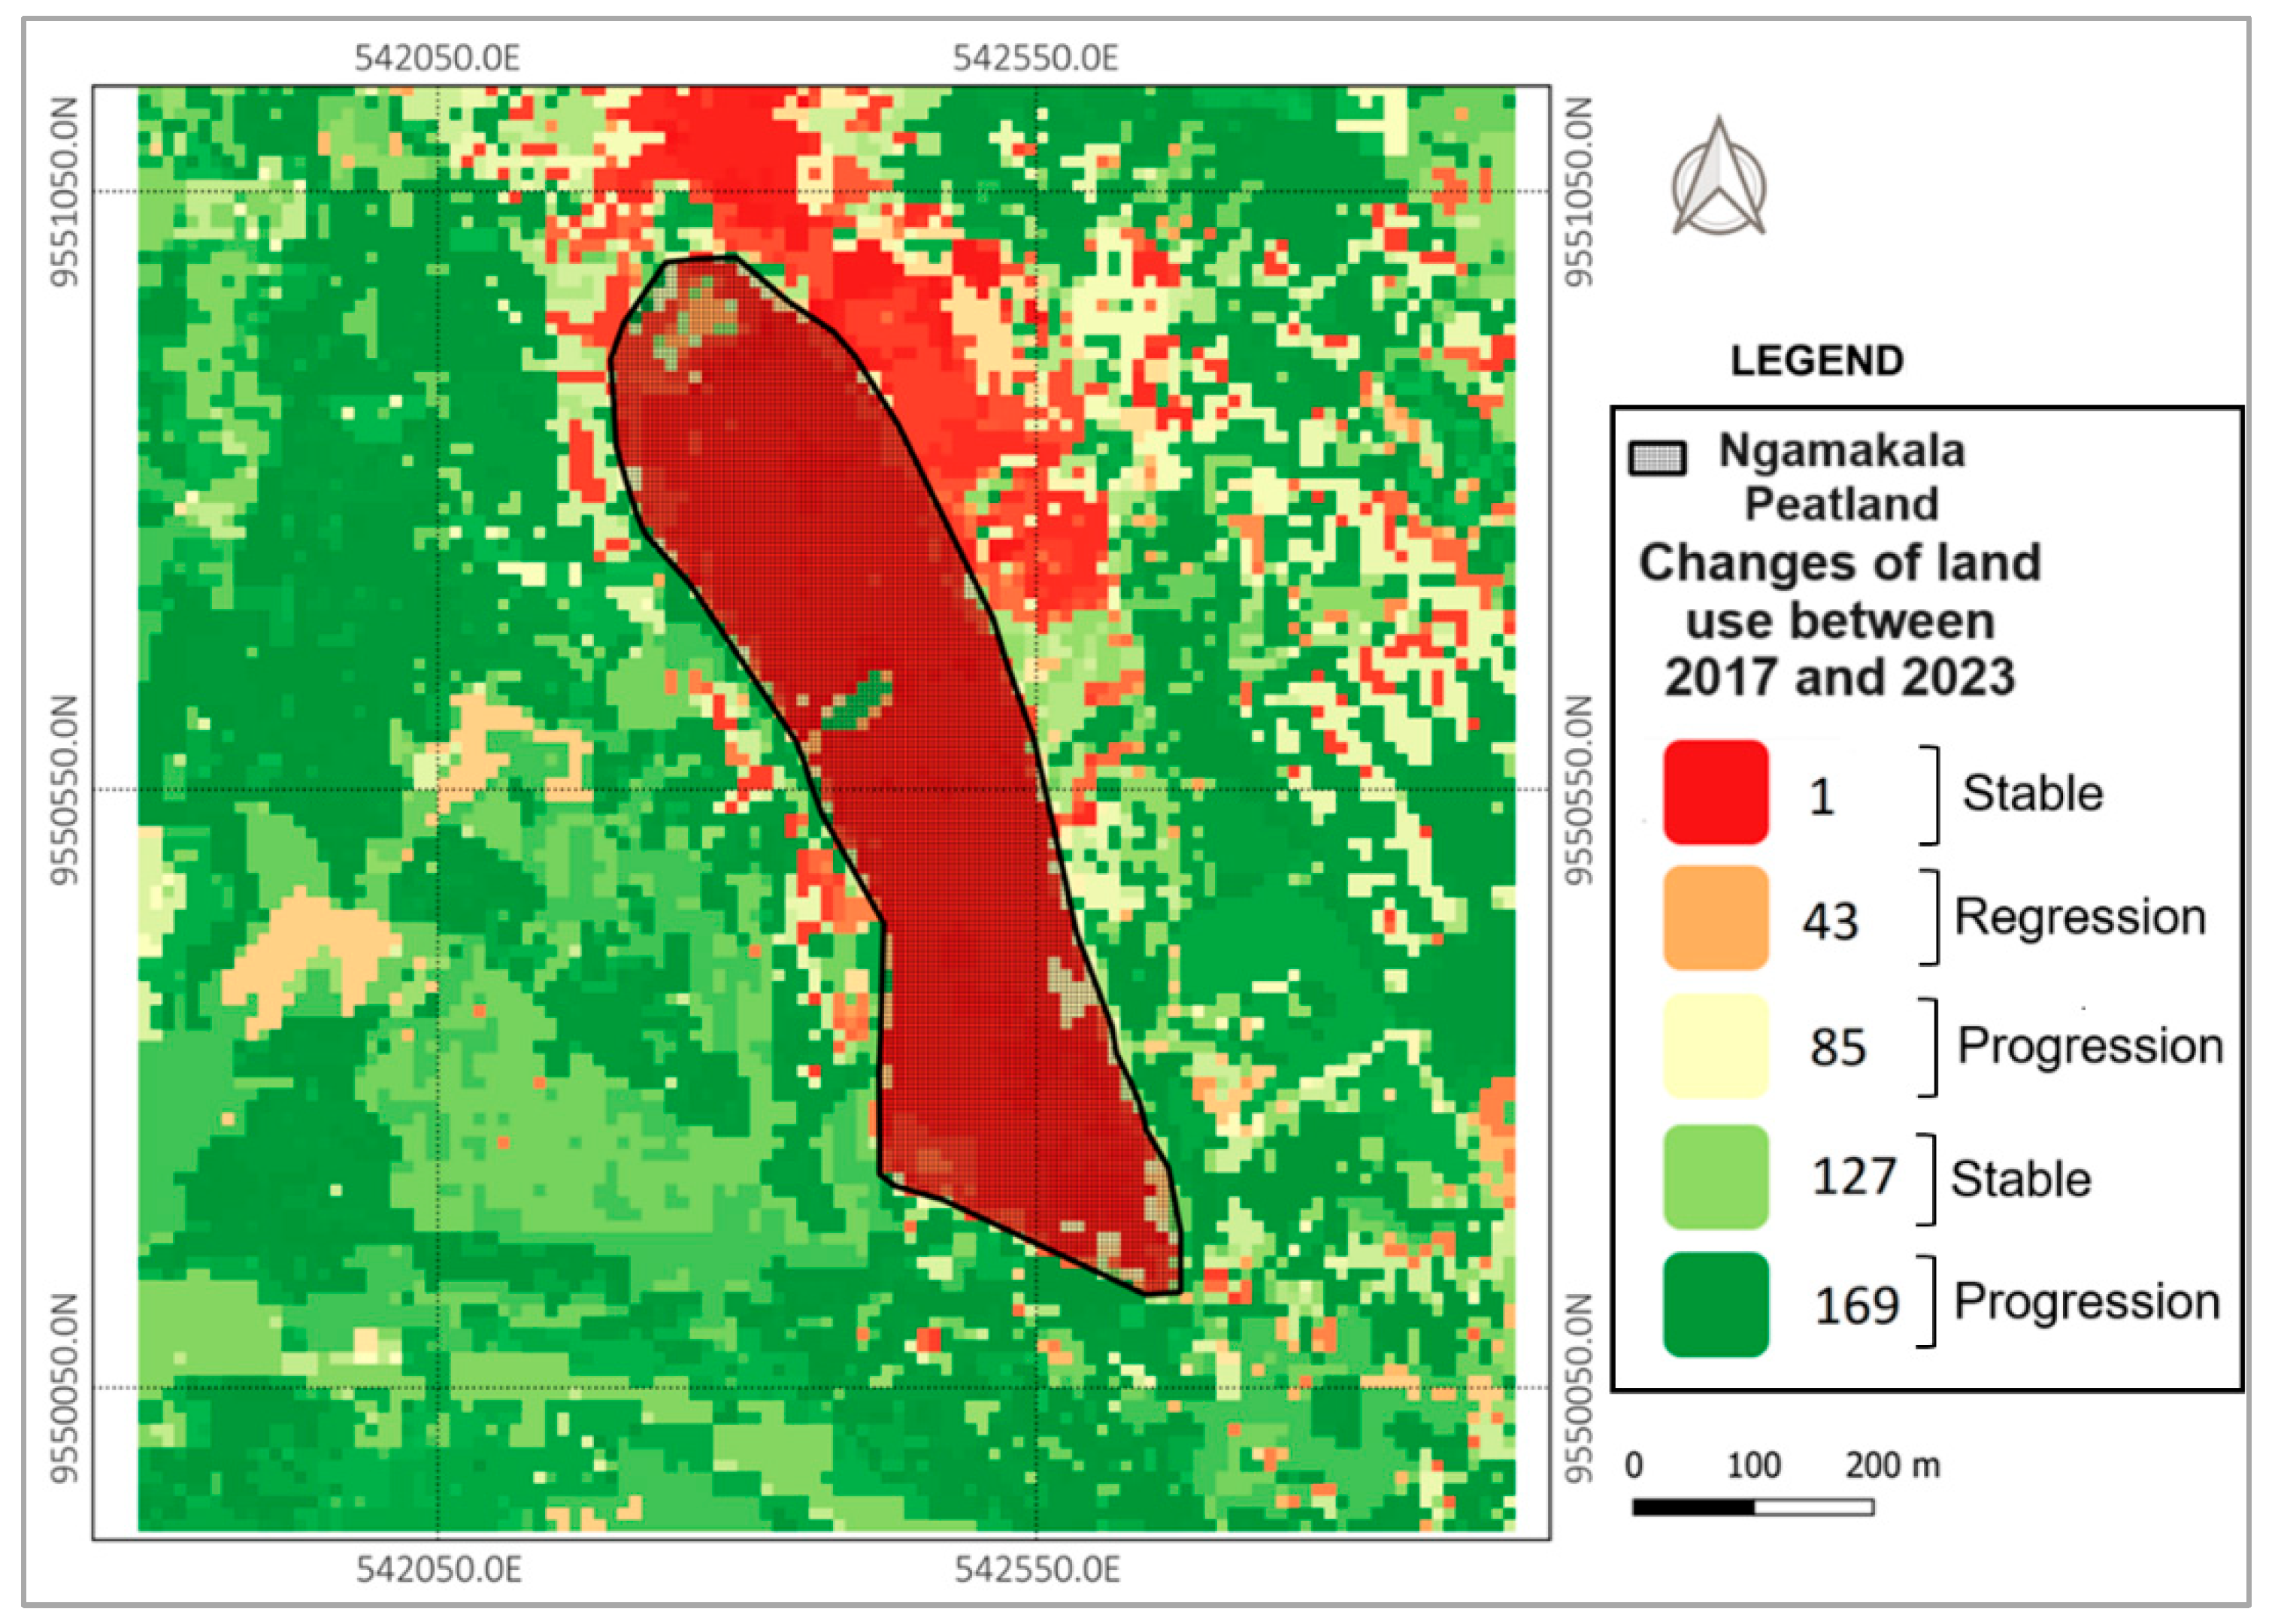
Figure 9.
Map of Land cover changes between 2017 and 2023.
Figure 9.
Map of Land cover changes between 2017 and 2023.
3.2. Analysis of Land Cover Changes
The areas of the various Land cover classes and the average annual change rates of each class between 2017 and 2023 are presented in
Table 3. The positive TC (Rate of change) values translate to an increase and the negative TC values translate to a decrease in a given Land cover at the study site.
We note, a sharp decline in crops (-30.2%), wooded forest (-29.4%) and plowed soils (-21.8%), bare ground and roads (- 9.9%) and water bodies (-5.7%). Conversely, we observe a growth in wetlands (+10.7%), flooded vegetation (+7.7%) and grassy savannah (+3.8).
Figure 9 illustrates the Land cover changes within the Ngamakala peatland area from 2017 to 2023, utilizing supervised classification data derived from Multispectral Images of Sentinel-2B, thereby delineating the codes of various classes. This figure effectively depicts the pixel alterations occurring in both the peatland and its surrounding areas. Notably, there is a marked degradation of vegetation observed in the northern region of the peatland. Furthermore, a decline in vegetation is evident in the southeastern section of Ngamakala peatland. In contrast, an increase in vegetation has been recorded at the center of the peatland.
4. Discussion
This study implies the application of artificial intelligence (AI) methods via the Random Forest algorithm of machine learning applied to MSI Sentinel-2B images for the mapping of occupation units and Land cover of the Ngamakala site. The results obtained demonstrate that this approach constitutes an effective and robust method to identify, classify and therefore more precisely map the Land cover units that colonize the peatland area using high-resolution data. The advantage of using this approach has been proven in various studies predicting Land cover [
32,
33].
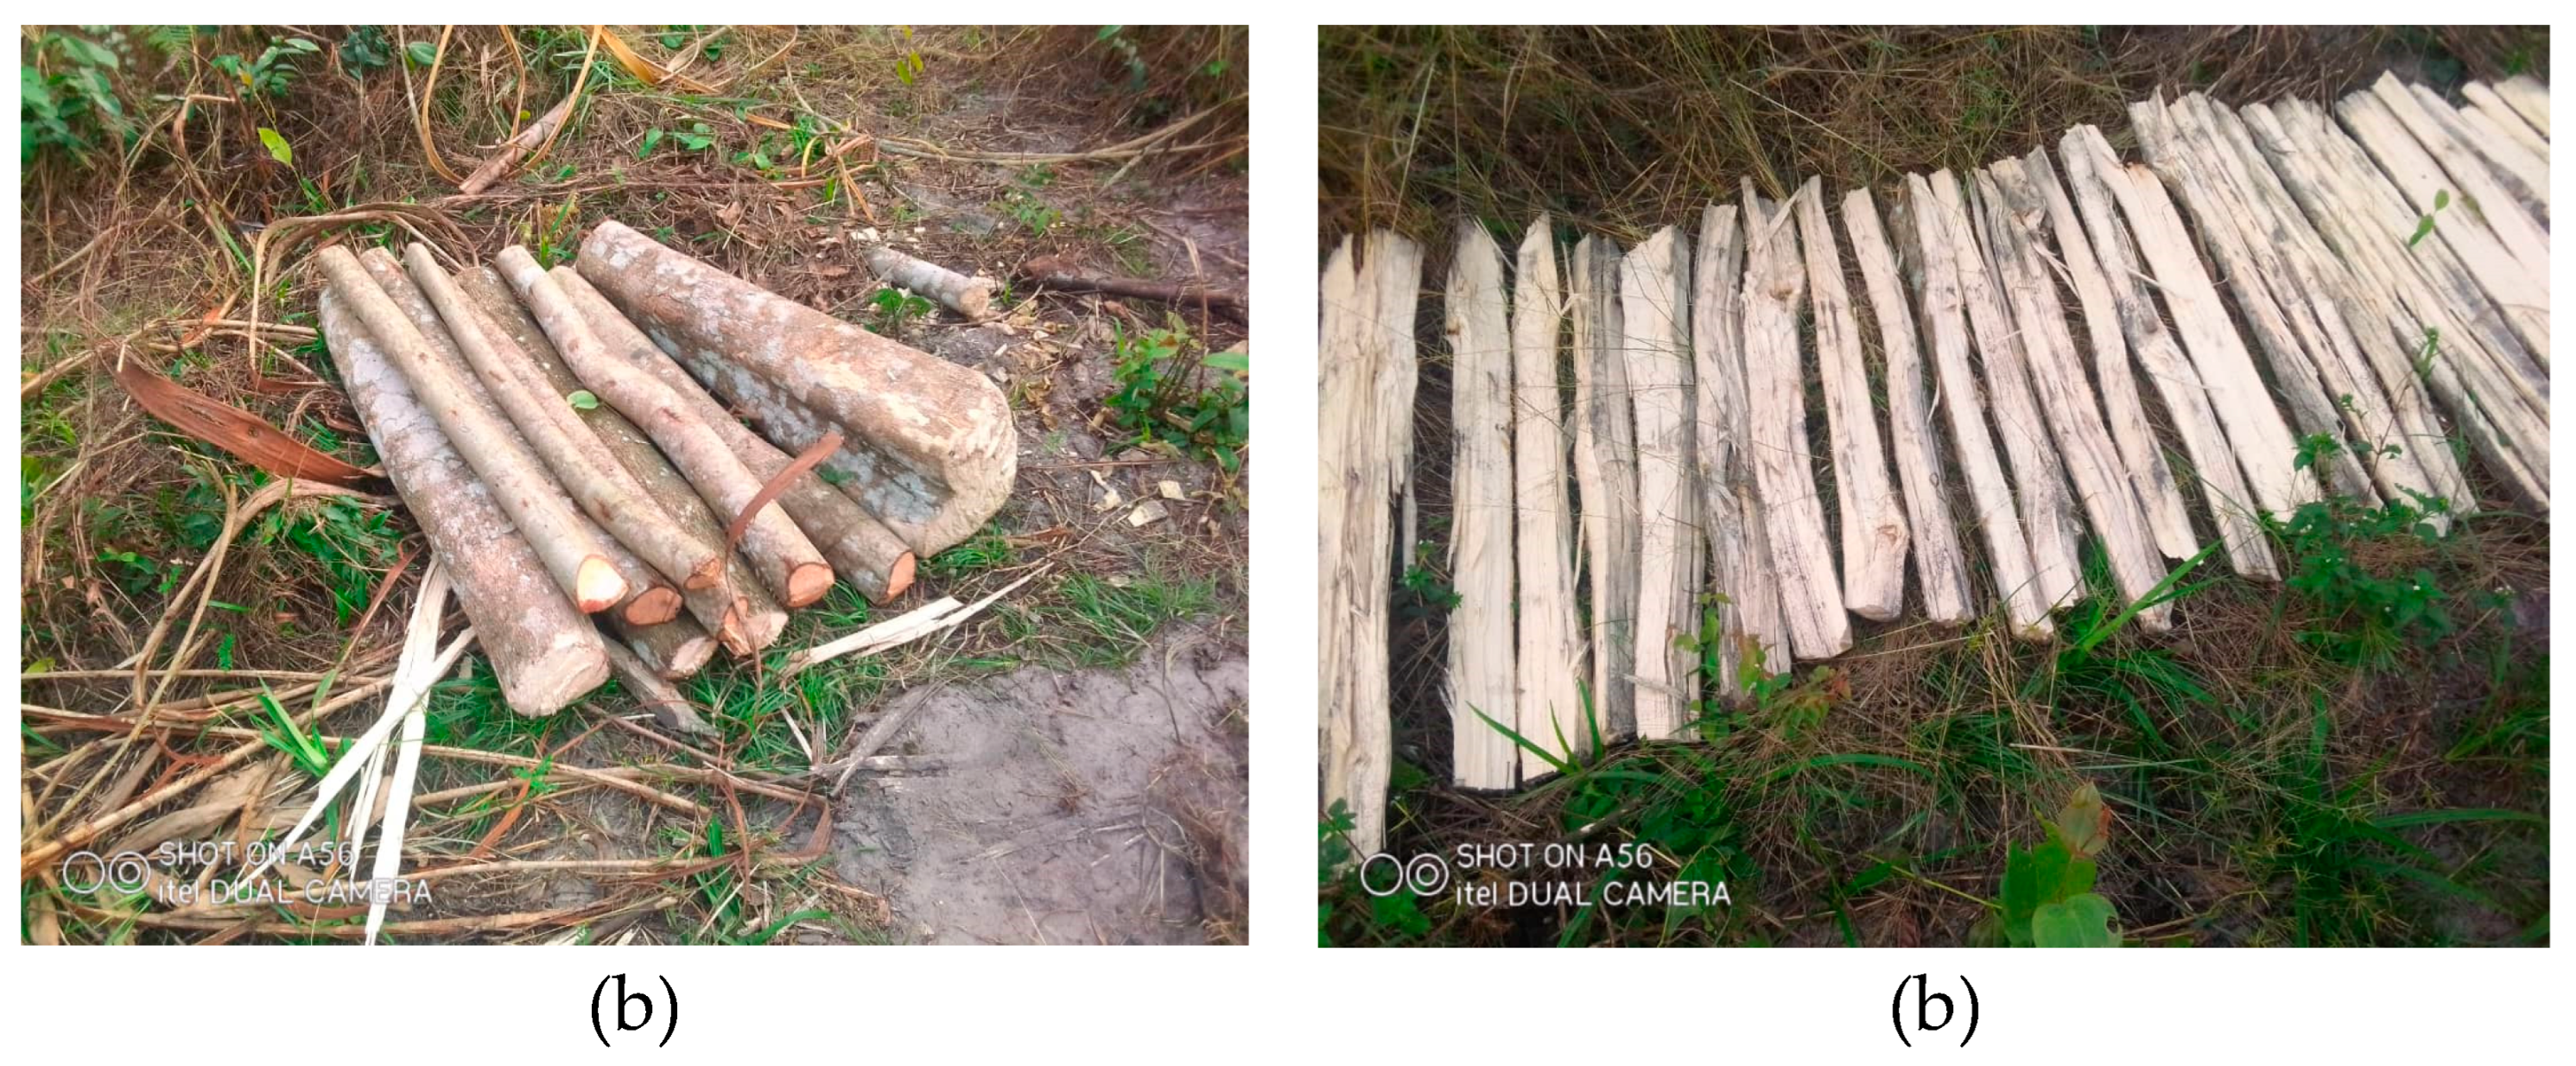
All human activities have an indirect impact on the stability of the peat bog. Photographs taken at the site show a high level of human activity. This activity weakens the structure to such an extent that during heavy rainfall, large quantities of sand are drained into the water basin where the peat bog is located. In addition, the cuts of wood visible on the ground could not be revealed by the satellite images, but there is a strong degradation as shown in
Figure 10.
4.1. Field Observations
Field observations indicate that type 3 herbaceous plants in proximity to peatlands are indicative of regions influenced by human settlements and Land cover alterations driven by local livelihood activities. These developed areas are frequently marked by residents using signs to denote land ownership. Notably, there are locations adjacent to the peatland that have either been constructed upon or are undergoing development with construction materials, signifying a considerable extent of colonization in the surrounding regions. Such developed areas exhibit substantial human activities, including agriculture, aquaculture, cashew nut cultivation, and residential structures. Regarding land degradation, it is evident that commonly utilized access routes have led to the formation of gullies that directly affect the hydrology of the peatland. This results in additional drainage points from the peatland and elevates the risk of destabilizing its water balance towards a drier condition. Furthermore, during periods of rainfall, the peatland experiences significant effects from rainwater runoff accompanied by sedimentary deposits due to its geomorphological characteristics as a catchment basin. In the long term, these sedimentary deposits pose a threat to reducing both permanent and seasonal surface water area within the Ngamakala peatland, thereby contributing to its contraction through encroachment by newly formed dry land.
4.2. Wood Collection
The results obtained show little degradation on the north side of the Ngamakala peat bog. Observation in the field shows that this area of the bog has a few stands of forest species. This result shows us a good correlation between the map results and the observations we made in the field. The difficulty of a population group in the Lifoula district to meet their energy needs leads them to exert strong pressure on the woody resources of the Ngamakala peatland. Several studies in the Congo Basin and around the world show the consequences of anthropogenic activities on the sustainability of natural forest resources [
33,
34] (
Figure 10).
5. Conclusions
The satellite and the ground data were used to feed the Machine Learning model implemented via a machine learning library offering tools for image classification. The Machine Learning model applied to Sentinel-2B images made it possible to perform supervised classifications by the Random Forest algorithm. This resulted in the mapping of land cover in 2017 and 2023. The evaluation of the classifications showed good performance of the model for overall accuracies of the order of 0.96. The Land cover of the study site is dominated by grassy savannah (49% and 61%, in 2017 and 2023, respectively. This study made it possible not only to map the Land covers, but also to identify the various surface changes that occurred between 2017 and 2023 using both remotely-sensed and ground-truthed data. The Ngamakala peatland site presents a variation in the areas of wooded forests, crops and plowed soils in favor of wetlands, grassy savannah and flooded vegetation. These changes in Land cover, particularly the resurgence of type 3 or low herbaceous plants, reflect strong anthropogenic activity in terms of development from housing developments, and associated livelihood activities, wood energy needs and resultant water pollution around the peatland. Human settlement expansion is currently unmanaged in the area and if left unchecked, these developments threaten to affect the hydrology of the peatland, though access routes causing gullies and land clearance activities increasing siltation. The long-term sustainability of the peatland ecosystem and the viability of wetland-based livelihoods in the area depend on keeping the Ngamakala peatland wet. Future research in this area should further explore and integrate social dimensions of local Land cover change dynamics.
Author Contributions
S.A.I., V.A., V.R conceived and planned the experiments. V.A, H.Y.G, B.M, H.G.L.T, G.M.B, E.E, and D.A.O. carried out the experiments and collecting of data J.K., K.L., A.B., B.C., D.E., C.D., F.J., and F.G. contributed to sample preparation. S.A.I., V.A., V.R. and V.R. contributed to the interpretation of the results. S.A.I. took the lead in writing the manuscript. All authors provided critical feedback and helped shape the research, analysis and manuscript.
Acknowledgments
The authors are thankful to French Embassy for funding the project.
Conflicts of Interest
The authors declare that there is no conflict of interests regarding the publication of this paper.
References
- Page, S. E., Rieley, J. O., & Banks, C. J. (2011). Global and regional importance of the tropical peatland carbon pool. Global Change Biology, 17, 798–818.
- Yu, Z. , Loisel, J., Brosseau, D. P., Beilman, D. W., & Hunt, S. J. (2010). Global peatland dynamics since the Last Glacial Maximum. Geophysical Research Letters, 37(13). [CrossRef]
- Environment, U. N. (2023, janvier 30). Annual Report 2022 | UNEP - UN Environment Programme. https://www.unep.org/resources/annual-report-2022.
- Dargie, G.C., Lewis, S.L., Lawson I.T., Mitchard E.T., Page S.E., Bocko, Y.E., & Ifo, S.A. (2017). Age, extent and carbon storage of the central Congo Basin peatland complex. Nature, 542(7639), 86-90. [CrossRef]
- Crezee, B. , Dargie, G. C., Ewango, C. E. N., Mitchard, E. T. A., Emba B., O., Kanyama T., J., Bola, P., Ndjango, J.-B. N., Girkin, N. T., Bocko, Y. E., Ifo, S. A., Hubau, W., Seidensticker, D., Batumike, R., Imani, G., Cuní-Sanchez, A., Kiahtipes, C. A., Lebamba, J., Wotzka, H.-P., … Lewis, S. L. (2022). Mapping peat thickness and carbon stocks of the central Congo Basin using field data. Nature Geoscience, 15(8), Article 8. [CrossRef]
- Biddulph, G. E. , Bocko, Y. E., Bola, P., Crezee, B., Dargie, G., Emba, O., Georgiou, S., Girkin, N., Hawthorne, D., Sancho, J. J., T, J. K., Mampouya, W. E., Mbemba, M., Sciumbata, M., & Tyrrell, G. (2023). Connaissances actuelles et orientations futures des recherches sur le complexe de tourbières de la Cuvette centrale du Congo. BOIS & FORETS DES TROPIQUES, 355, 73-86. [CrossRef]
- Dargie, G. C. , Lawson, I. T., Rayden, T. J., Miles, L., Mitchard, E. T. A., Page, S. E., Bocko, Y. E., Ifo, S. A., & Lewis, S. L. (2018). Congo Basin peatlands : Threats and conservation priorities. Mitigation and Adaptation Strategies for Global Change, 24(4), 669-686. [CrossRef]
- Sonwa, D. , Lewis, S., Suspense, I., Ewango, C., Mitchard, E., Dargie, G., Lawson, I., Gourlet-Fleury, S., Doumenge, C., Gond, V., Betbeder, J., Toham, A., Offelen, J., Kopansky, D., Dannunzio, R., Monsembula, R., Nuutinen, M., Villegas, L., Milliken, K., & Cuesta, R. (2022). Les tourbières de la cuvette centrale du bassin du Congo Réalités et perspectives. [CrossRef]
- Davenport, I. J. , McNicol, I., Mitchard, E. T. A., Dargie, G., Suspense, I., Milongo, B., Bocko, Y. E., Hawthorne, D., Lawson, I., Baird, A. J., Page, S., & Lewis, S. L. (2020). First Evidence of Peat Domes in the Congo Basin using LiDAR from a Fixed-Wing Drone. Remote Sensing, 12(14), 2196. [CrossRef]
- Elenga, H. , Schwartz, D., & Vincens, A. (1992). Changements climatiques et action anthropique sur le littoral congolais au cours de l’Holocène. Bull Soc Géol France, 163.
- Elenga, H. , Schwartz, D., & Vincens, A. (1994). Pollen evidence of late Quaternary vegetation and inferred climate changes in Congo. Palaeogeography, Palaeoclimatology, Palaeoecology, 109(2), 345-356. [CrossRef]
- Elenga, H. , & Vincens, A. (1990). Paléoenvironnements quaternaires récents des plateaux Bateke (Congo) : Étude palynologique des dépôts de la dépression du bois de Bilanko.
- Elenga, H. , Vincens, A., & Schwartz, D. (1991). Présence d’éléments forestiers montagnards sur les Plateaux Batéké (Congo) au Pléistocène supérieur : Nouvelles données palynologiques. Symposium on Africa palynology, 239-252.
- Elenga, H. (1992). Végétation et climat du Congo depuis 24 O00 B.P. Analyse palynologique de séquences sédimentaires du Pays Batéké et du littoral. - Th. Aix-Marseille, 238p.
- Lungela Tchimpa, H., G. (2019). Caractérisation et classification de la tourbière de Lifoula. Mémoire de master, Université Marien NGOUABI, 82 p.
- Eloali, E. , Ifo, S. A., Hugues-Yvan, G., Ndzai, S. F., Milongo, B., Bobangui, G. M., Wando, M., Tchimpa, H. G. L., Atipo, D., & Yoka, J. (2024). Floristic Diversity between 1960 and 2023, Aboveground Biomass of Vegetation in the Ngamakala Peatland in the Republic of Congo, Congo Basin. European Journal of Science, Innovation and Technology, 4(5), Article 5.
- Maley, J. (2003). Synthèse sur l’histoire de la végétation et du climat en Afrique centrale au cours du Quaternaire récent.
- Makany, L. (1976). Végétation des plateaux Teke. Université de Brazzaville, n 1, 301p.
- White, F. (1986). La végétation de l’Afrique : Mémoire accompagnant la carte de végétation de l’Afrique Unesco/AETFAT/UNSO. IRD Editions.
- Kimpouni, V. (1993). Le genre Paepalanthus [ Eriocaulaceae ] en Afrique et a Madagascar. Fragmenta Floristica et Geobotanica. Supplementum, 02(1). http://agro.icm.edu.pl/agro/element/bwmeta1.element. 2998. [Google Scholar]
- Aubréville, A. (s. d.). La F.A.O. et les problèmes forestiers tropicaux.
- Descoings, B. (1960). Rapport botanique préliminaire sur la Cuvette congolaise (République du Congo).
- Lanfranchi, R. , & Schwartz, D. (Éds.). (1990). Paysages quaternaires de l’Afrique centrale atlantique. Editions de l’ORSTOM.
- Baeur, H. , Callec, Y., Prognon, F., Issautier, B., Schroetter, J.-M., Thiéblemont, D., Nganga Lumuamu, F., & Dah Tolingbonon, R., H. (2015). Notice explicative de la feuille Mbé Ngabé à 1/200 000. BRGM.
- Schwartz, D. (1988). Les podzols tropicaux sur sables Batéké en R.P. du Congo : Description, caractérisation, genèse.
- Maimouni, S. , Bannari A., El-Harti A. et El-Ghmari A. (2011). Potentiels et limites des indices spectraux pour caractériser la dégradation des sols en milieu semi-aride. Can. J. Remote Sensing, Vol. 37, No. 3, pp. 1-18.
- Li, K. , Juanle W., Wenjing C., Yi W., Yezhi Z., Ochir A. (2022). Deep learning empowers the Google Earth Engine for automated water extraction in the Lake Baikal Basin. International Journal of Applied Earth Observation and Geoinformation, Volume 112, Article 102928, 12 p. [CrossRef]
- Phorn N, Jianzhong L & Pakorn P (2021). Mangrove forests changes and responses to sea level rise based on remote sensing and GIS in PKWS, Cambodia. 2nd Intercontinental Geoinformation Days (IGD), Mersin, Turkey, pp. 147-150.
- Genserbe, B.M. , Assoma V.T., Kouame K., N’guessan B.V.H. (2023). Machine Learning appliquée aux images MSI Sentinel-2A pour la cartographie des ressources agropastorales dans le Fitri au nord du Tchad. Revue RAMReS – Sci. Appl. & de l’Ing., Vol. 5(1), pp. 57-64.
- Hayes D., J. and Sader S. A. (2001). Change Detection Techniques for Monitoring Forest Clearing and Regrowth in a Tropical Moist Forest 162. Photogrammetric Engineering & Remote Sensing, 67:1067-1088.
- Malila W., A. (1980). Change vector analysis: an approach for detection forest changes with Landsat. Proceedings of the 6th Annual Symposium on Machine Processing of Remotely Sensed Data, Purdue University, West Lafayette, pp. 326-335.
- Assoma, V.T. , Yao N.A., Dio J.S. et Jourda J.-P. (2021). Apport de la télédétection et d'un SIG à la cartographie des changements de l'occupation du sol dans le bassin versant de la Lobo en Côte d'Ivoire », Physio-Géo [En ligne], Vol. 16, pp.107-126. http://journals.openedition. 1265. [Google Scholar]
- Breiman, L. (2001). Random forests. Machine Learning, 45(1): 5-32. [CrossRef]
- Benbahrıa, Z. , Sebari, İ., Hajji, H., & Smiej, M. F. (2021). Intelligent mapping of irrigated areas from Landsat 8 images using transfer learning. International Journal of Engineering and Geosciences, 6(1), Article 1. [CrossRef]
- Binsangou, S. , Suspense, I., Ibocko, L., Lisa, L., Tchindjang, M., & Koubouana, F. (2018). Urban Growth and Deforestation by Remote Sensing in the Humid Tropical Forest of Congo Bassin : Case of Impfondo in Republic of Congo. 46-54.
- Tchatchou, B. , Sonwa, D. J., Ifo, S., & Tiani, A. M. (2015). Déforestation et dégradation des forêts dans le Bassin du Congo : État des lieux, causes actuelles et perspectives. CIFOR.
|
Disclaimer/Publisher’s Note: The statements, opinions and data contained in all publications are solely those of the individual author(s) and contributor(s) and not of MDPI and/or the editor(s). MDPI and/or the editor(s) disclaim responsibility for any injury to people or property resulting from any ideas, methods, instructions or products referred to in the content. |
© 2025 by the authors. Licensee MDPI, Basel, Switzerland. This article is an open access article distributed under the terms and conditions of the Creative Commons Attribution (CC BY) license (http://creativecommons.org/licenses/by/4.0/).